Embed Size (px)
Citation preview
Office of Institutional Effectiveness
Fall 2011 - Fall 2012
RETENTION STUDY
VISION
We seek to become recognized for providing bright and curious students
a holistic learning experience that occurs both in and out of the classroom;
for being relentlessly focused on learning outcomes;
for embracing and solving today’s greatest educational challenges;
and for bringing fresh and pragmatic thinking to the problems
facing communities, businesses, and governments in Indiana and beyond.

OIE
Office of Institutional Effectiveness
February 2013
OIE No. RET-S1-2013
Fall 2011 - Fall 2012
RETENTION STUDY
William Knight
Karen Morgan
Rebecca Costomiris
(Editor)
Office of Institutional Effectiveness
Ball State University
February 2013
OIE No. RET-S1-2013

i
EXECUTIVE SUMMARY
The Office of Institutional
Effectiveness (OIE) conducted a
comprehensive study to examine
factors related to the Fall 2011 to
Fall 2012 retention of new, full-
time, baccalaureate-seeking first-
year students.
The following research questions
guided the study:
o How did 2011-2012 retention
rates vary according to
demographic, pre-college,
and enrollment variables?
o What significant relationships
existed between 2011-2012
retention rates and
demographic, pre-college,
and enrollment variables and
survey results when each
predictor was examined
individually?
o What significant relationships
existed between 2011-2012
retention rates and course
grades?
o What significant relationships
existed and what were the
strongest predictors of the
relationship between 2011-
2012 retention rates and
demographic, pre-college,
and enrollment variables and
survey results when
predictors were examined
simultaneously?
Retention rates were higher for
females, international and Asian
students, non-first generation-
students, in-state students, students
with a dependent financial aid status
and those whose financial aid
dependency status could not be
determined, students with greater
levels of family financial
contribution to the cost of college,
students with higher SAT and ACT
scores, and students with higher high
school grade point averages and
graduation percentiles.
Retention rates were higher for
students in the Teachers College
(TC), College of Fine Arts (CFA),
and those with interdisciplinary
majors. Retention was higher among
larger departments including Modern
Languages and Classics, English,
Interdepartmental College of
Architecture and Planning (CAP),
Interdepartmental TC, Special
Education, Speech Pathology and
Audiology, and Theatre and Dance.
Students were better retained if they
participated in the Honors College;
lived on campus during their first
year; lived in the Dehority Complex;
lived in living-learning communities;
and participated in Summer Bridge
groups. Retention was also higher for
students retained Fall 2011 to Spring
2012 who completed a greater
number of credit hours and achieved
higher grade point averages in the
Fall 2011 and Spring 2012
semesters.
ii
No demographic or pre-college
variables had statistically significant
relationships with retention with
medium or large effect sizes. Only
three enrollment variables had
statistically significant relationships
with retention and medium or large
effect sizes: the student’s college at
the beginning of the Spring 2012
semester (retention was highest in
CFA, TC, and for students with
interdisciplinary majors and lowest
for students in University College),
credit hours completed in the Spring
2012 semester (students with more
credit hours were better retained),
and cumulative grade point average
at the end of the Spring 2012
semester (students with higher GPAs
were better retained). (All effect
sizes were medium.)
All but 8 of the 157 items on the
Summer Orientation Survey were
significantly related to retention, but
none of these had medium or large
effect sizes. All but 10 of the 190
items in the MAP-Works Survey
were significantly related to
retention, but none of these had
medium or large effect sizes. Half
(43) of the 86 National Survey of
Student Engagement (NSSE) items
were significantly related to
retention, but none of them had
medium or large effect sizes.
Only spring semester cumulative
grade point average, spring semester
credit hours, and fall semester credit
hours proved to be significant
predictors of retention when all
predictors were examined at the
same time. Spring semester grade
point average had 1½ times the
predictive power of spring semester
credit hours, and more than double
the predictive power of fall semester
credit hours.
Significant predictors of spring
semester cumulative GPA included
listing the Honors College as an
important reason to attend Ball State
(Summer Orientation Survey), not
coming to class unprepared (from
NSSE), being more likely to
participate in activities to enhance
spirituality (worship, meditation,
prayer, etc.) (NSSE), identifying
student blogs as an important source
of information about Ball State
(Summer Orientation Survey), and
expected family financial
contribution to college costs
(FAFSA). This analysis had only a
small effect size.
Significant predictors of spring
semester credit hours included fewer
hours per week providing care for
dependents living with them
(parents, children, spouse, etc.)
(NSSE), the opportunity for
involvement in a culminating senior
year experience (capstone course,
senior project or thesis,
comprehensive exam, etc.) (NSSE),
and flexible course scheduling as an
important factor in choosing a major
(Summer Orientation Survey). This
analysis had a very small effect size.
The relationship was examined
between retention and grades in
selected courses (where at least 100
freshmen were enrolled in Academic
Year 2011-2012). Seventy-nine of
the analyses had medium or large
effect sizes. Courses with large effect
sizes included ANTH 101, ANTH
111, ARCH 100, ASTR 100, BIO
111, BIO 112, CAP 102, CAP 162,
CHEM 100, CHEM 101, CHEM
111, CJC 102, CS 104, EDHI 200,
FCS 103, FIN 110, GEOG 150,
HONR 201, HONR 202, JOUR 101,
LA 100, MATH 112, NEWS 105,
iii
NEWS 108, NEWS 133, NREM
101, SP 201, THEA 103, THEA 104,
THEA 232, THEA 280. Courses
with medium effect sizes were AHS
100, ANAT 201, BIO 100, BIO 113,
CAP 161, CC 101, CHEM 112, CJC
101, COMM 210, DANC 100,
ECON 201, EDEL 100, EDPS 260,
EDTE 120, ENG 103, ENG 104,
ENG 114, FCS 135, FIN 101, GEOG
101, GEOL 101, HIST 150, HIST
201, HSC 160, ID 101, ISOM 125,
ISOM 135, MATH 108, MATH 111,
MATH 125, MATH 132, MATH
201, MUHI 100, NEWS 130, NEWS
131, NEWS 132, PFW 100, PFW
103, PFW 148, PLAN 100, POLS
130, PSYS 100, RELS 160, SOC
100, SP 102, SPCE 201, TCOM 101,
and THEA 100. The strongest
relationship between retention and
course grade was for THEA 103
(effect size .70). In all cases, students
with higher grades in each course
were more likely to be retained.
Actionable tactics suggested by the
study results include providing a
greater emphasis upon the following
actions, since they were found to
relate to retention: emphasizing the
Honors College, working to ensure
that students come to class prepared,
recruiting students with higher levels
of family financial contribution to
college costs, providing support for
students who need to care for
dependents, emphasizing graduates’
career success and national rankings
of academic programs, providing
students with options that allow them
to remain at Ball State if they are
considering changing majors,
promoting college visits (including
Ball State Preview Day), and
following up on cues from MAP-
Works and other sources where
students may be indicating they are
experiencing attrition-prone
behaviors. Current efforts to
facilitate students’ awareness of their
success in first-year courses early in
the semester are also supported by
this study.

iv
v
TABLE OF CONTENTS
Page
BACKGROUND AND METHODOLOGY ................................................................................................. 1
RESULTS ..................................................................................................................................................... 5
Table 1: Demographics.......................................................................................................................... 6
Table 2: Enrollment Breakouts .............................................................................................................. 9
Table 3: Logistic Regression Results Predicting 2011-2012 First-Year Retention ............................. 15
Table 4: Linear Regression Results Predicting 2011-2012 Spring Semester
Cumulative GPA .................................................................................................................. 15
Table 5: Linear Regression Results Predicting 2011-2012 Spring Semester Credit Hours ................ 16
Table 6: Linear Regression Results Predicting 2011-2012 Fall Semester Credit Hours ..................... 17
SUMMARY AND CONCLUSIONS ......................................................................................................... 19
APPENDIX I: REFERENCES ................................................................................................................. 21
APPENDIX II: RETENTION RATES BY GRADES IN COURSES TAKEN
BY AT LEAST 100 2001-2012 FRESHMEN ................................................................. 23

vi
1
BACKGROUND AND METHODOLOGY
The Office of Institutional
Effectiveness (OIE) conducted a
comprehensive study to examine
factors related to the Fall 2011 to
Fall 2012 retention of new, full-time,
baccalaureate-seeking first-year
students. The one-year retention rate
is critically important since the
University has a goal in its strategic
plan of 80%, yet the retention rate
has declined from 79.6% in 2009-
2010 to 79.4% in 2010-2011 to
78.0% in 2011-2012. While the
traditional OIE contribution to
understanding and improving first-
year retention has been to partner
with several other Ball State offices
on the MAP-Works project, this
study represents an additional
contribution by collecting data from
numerous sources and conducting a
comprehensive study of factors
affecting one-year retention.
The following research questions
guided the study:
o How did 2011-2012 retention
rates vary according to
demographic, pre-college,
and enrollment variables?
o What significant relationships
existed between 2011-2012
retention rates and
demographic, pre-college,
and enrollment variables and
survey results when each
predictor was examined
individually?
o What significant relationships
existed between 2011-2012
retention rates and course
grades?
o What significant relationships
existed (and what were the
strongest predictors) when
the relationship between
2011-2012 retention rates and
demographic, pre-college,
and enrollment variables and
survey results were examined
simultaneously?
Data assembled for the study
included an indication of whether or
not new, full-time, baccalaureate-
seeking first-year students from Fall
2011 re-enrolled at Ball State in Fall
2012 (dependent or outcome
variable) and the following
predictors or independent variables:
o Demographic and pre-college
variables (gender,
race/ethnicity, first-
generation status [computed
based upon financial aid
data], state residency,
domestic/international
student status, dependent/
independent financial aid
status [based upon financial
aid data], expected family
financial contribution to
college costs [from financial
aid data], SAT total score and
sub-scores, ACT composite
score, and high school grade
point average and graduation
percentile)
2
o Enrollment variables for
Fall 2011 and Spring 2012
(college and department of
major/s at the beginning of
the Fall 2011 semester, credit
hours completed in the Fall
2011 semester, grade point
average for the Fall 2011
semester, whether students
re-enrolled for the Spring
2012 semester, college of
major at the beginning of the
Spring 2012 semester, credit
hours completed in the
Spring 2012 semester,
cumulative grade point
average at the end of the
Spring 2012 semester,
courses taken both semesters
and accompanying course
grades, and whether students
lived on- or off-campus for
the Fall 2011 semester)
o Responses to Ball State’s
157-item Summer
Orientation Survey (which
cluster into the categories of
high school background and
involvement; decision to
attend Ball State; major and
career selection; and
technology access, usage, and
competency)
o Responses to Ball State’s
190-item MAP-Works Survey
(which cluster into the
categories of commitment to
Ball State, self-rating of
communication and
analytical skills, self-
discipline, time management,
financial means, basic and
advanced academic
behaviors, academic self-
efficacy, peer connections,
homesickness/separation and
homesickness/distress,
academic and social
integration, satisfaction with
Ball State, on-campus living
[social aspects, environment,
and roommate relationships],
off-campus living
[environment], and test
anxiety)
o Responses of Fall 2011 first-
year students to the 86-item
National Survey of Student
Engagement (NSSE) (which
cluster into the categories of
level of academic challenge,
active and collaborative
learning, student-faculty
interaction, enriching
educational experiences,
supportive campus
environment, and self-
reported educational and
personal gains)
In response to the first research
question, retention rates were
computed across various
demographic groups and enrollment
variables.
For the second research question, a
series of bivariate analyses (Chi
square contingency analyses, t-tests,
and analysis of variance [ANOVA])
were used to investigate the
relationship between each predictor
variable and one-year retention. In
order to add meaning to these
analyses, the tables provided include
notations of statistical significance
(at p < .05) and effect sizes.
Comparisons that were not
statistically significant were noted
with (ns); and those that were
statistically significant have their
effect sizes noted as very small (vs),
small (s), medium (m), or large (l)
using guidelines suggested by Cohen
3
(1988). It is common in the field of
institutional effectiveness to draw
attention to differences with effect
sizes classified as medium or large;
these differences were commented
upon in this report.
In response to the third research
question, a series of Chi square
contingency analyses were used to
investigate the relationship between
grades in courses where at least 100
first-year students enrolled and one-
year retention.
For the fourth research question,
logistic regression was used to
investigate the relationship between
retention and predictors that proved
to be statistically significant in the
bivariate analyses. Linear regression
was used to investigate the
relationship between the strongest
predictors in the logistic regression
and other demographic, pre-college,
and enrollment variables. Cases were
screened for multivariate outliers,
and predictors with unacceptably
high multicolinearity levels were
omitted from the analysis.

4
5
RESULTS
Retention Rates by Demographic,
Pre-College, and Enrollment Variables
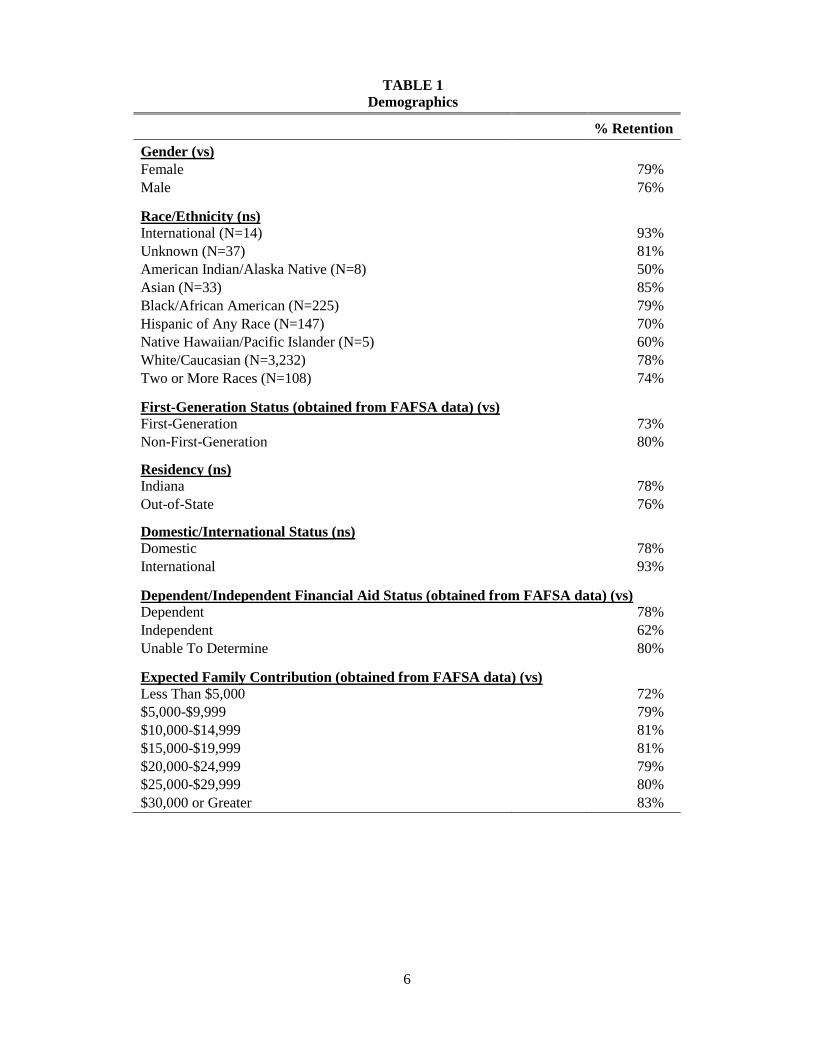
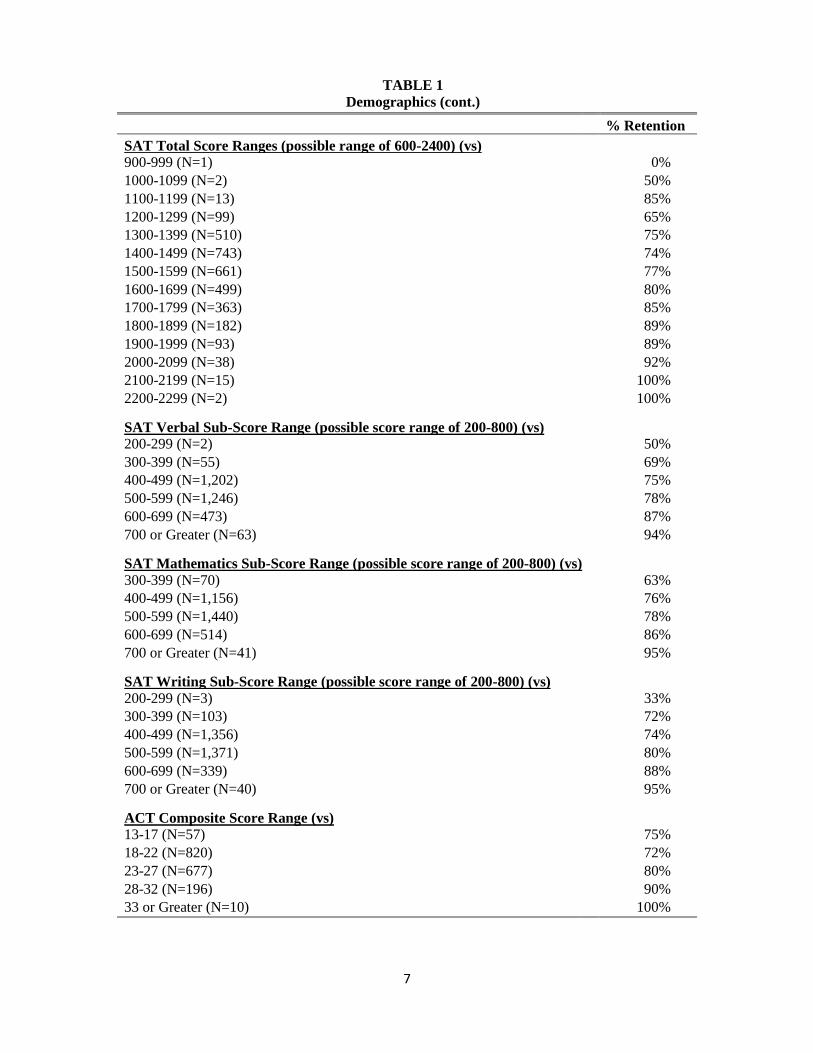
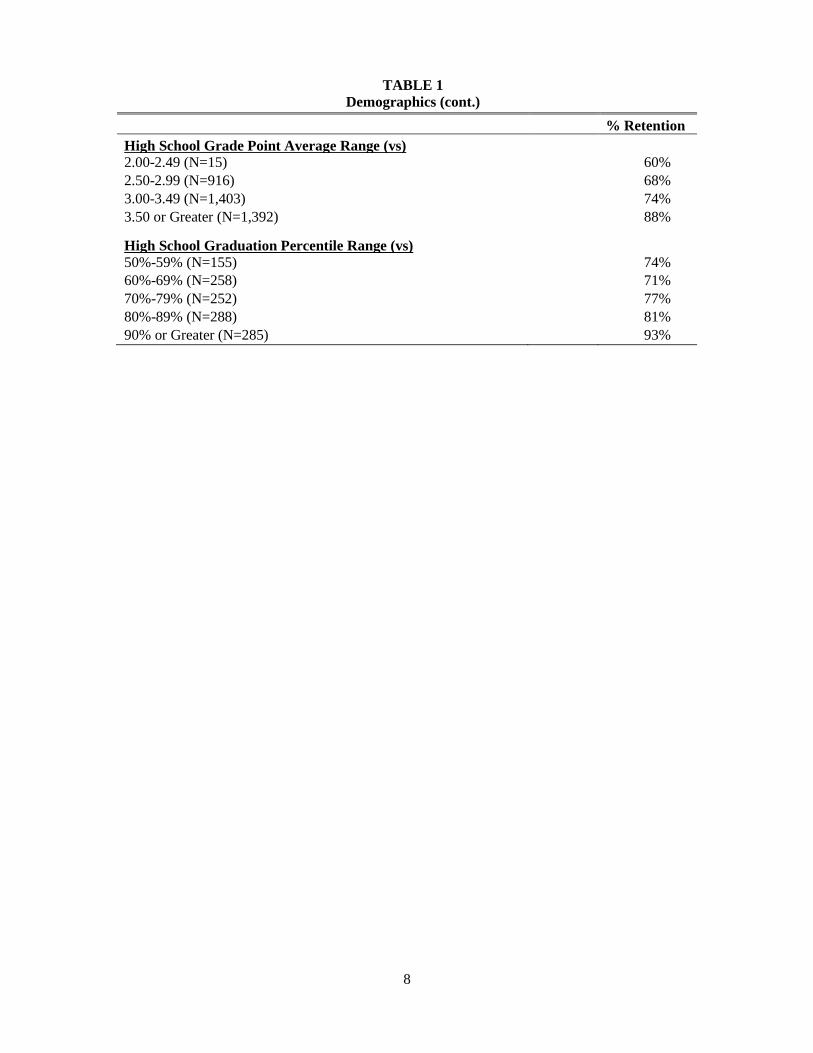
As shown in Table 1, retention rates
were higher for females,
international and Asian students,
non-first generation-students, in-state
students, students with a dependent
financial aid status and those whose
financial aid dependency status could
not be determined, students with
greater levels of family financial
contribution to the cost of college,
students with higher SAT and ACT
scores, and students with higher high
school grade point averages and
graduation percentiles.
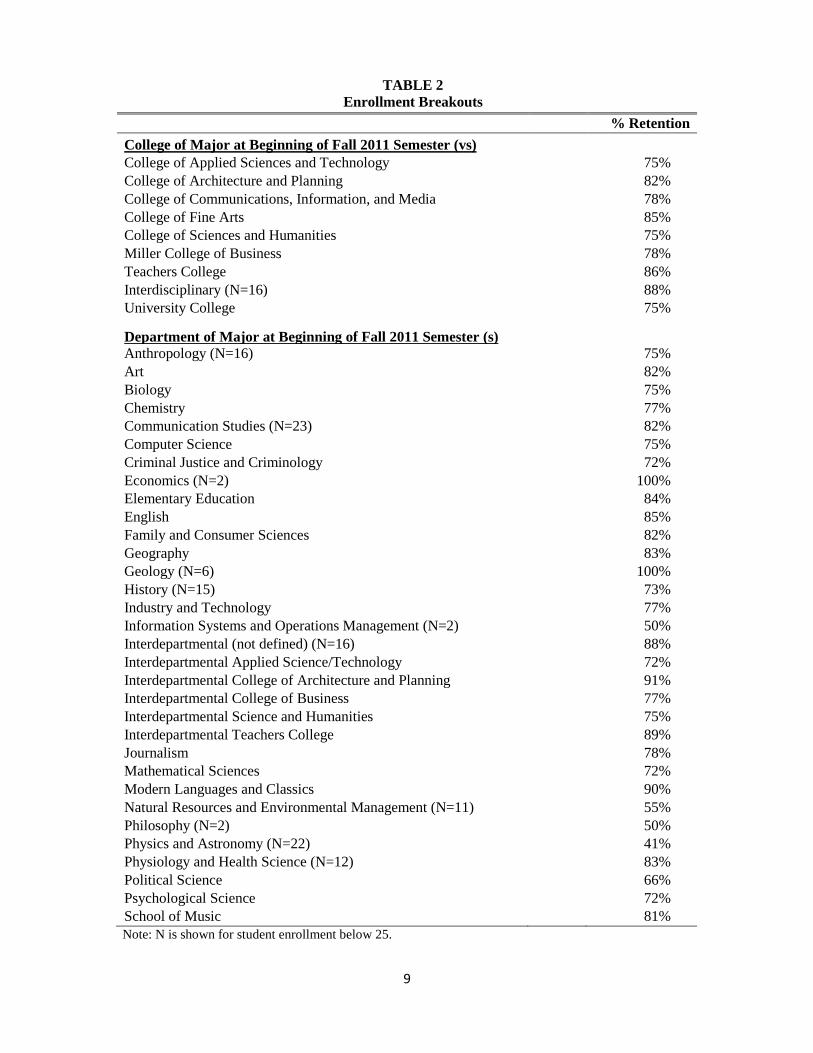
Retention rates were higher for
students in the Teachers College
(TC), College of Fine Arts (CFA),
and those with interdisciplinary
majors. Retention was higher among
larger departments including Modern
Languages and Classics, English,
Interdepartmental CAP,
Interdepartmental TC, Special
Education, Speech Pathology and
Audiology, and Theatre and Dance.
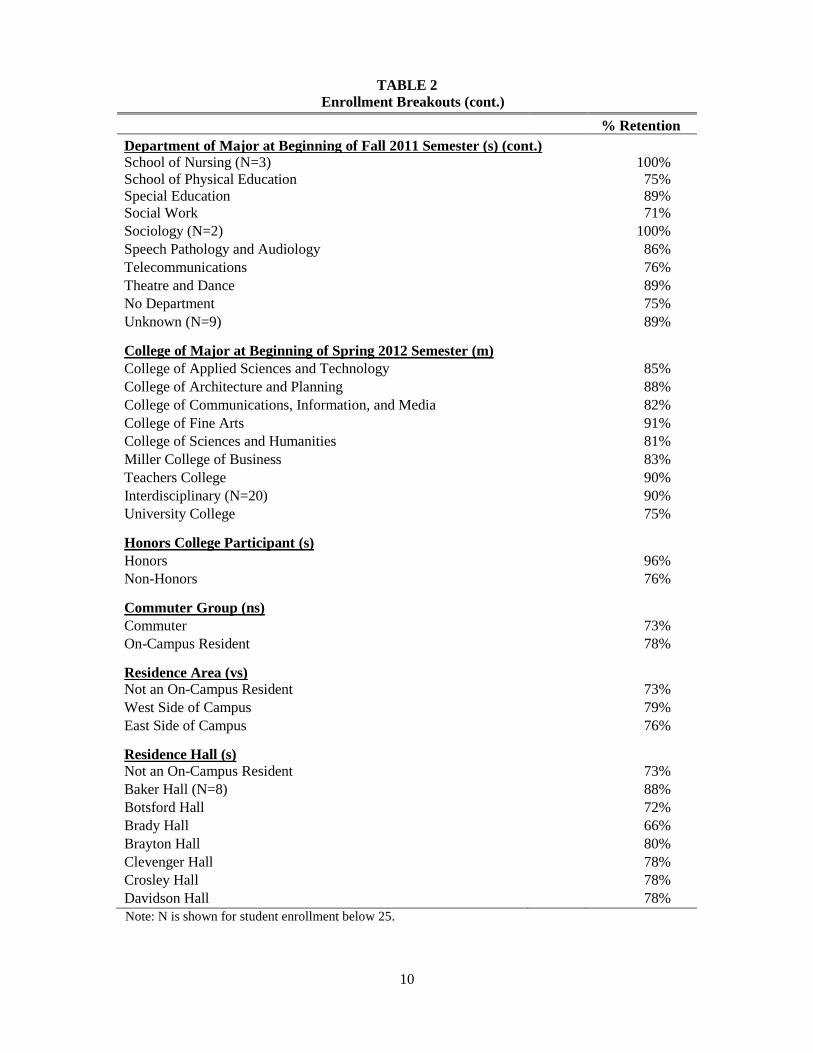
Students were better retained if they
participated in the Honors College;
lived on campus during their first
year; lived in the Dehority Complex;
lived in living-learning communities;
and participated in Summer Bridge
groups. Retention was higher for
students retained Fall 2011 to Spring
2012 who completed a greater
number of credit hours and achieved
higher grade point averages in the
Fall 2011 and Spring 2012
semesters. (Table 2)
Statistically Significant Relationships
Between Retention and Demographic,
Pre-College, and Enrollment Variables
and Survey Results Examined
Individually
No demographic or pre-college
variables had statistically significant
relationships with retention and
medium or large effect sizes. Only
three enrollment variables had
statistically significant relationships
with retention and medium or large
effect sizes: the student’s college at
the beginning of the Spring 2012
semester (highest in CFA, TC, and
for students with interdisciplinary
majors, and lowest for students in
University College), credit hours
completed in the Spring 2012
semester (students with more credit
hours were better retained), and
cumulative grade point average at
the end of the Spring 2012 semester
(students with higher GPAs were
better retained). All effect sizes were
medium. (Tables 1 and 2)
All but 8 of the 157 items on the
Summer Orientation Survey were
significantly related to retention, but
none of these had medium or large
effect sizes. All but 10 of the 190
items on the MAP-Works Survey
were significantly related to
retention, but none of these had
medium or large effect sizes. Half
(43) of the 86 National Survey of
Student Engagement (NSSE) items
were significantly related to
retention, but none of these had
medium or large effect sizes. None
of these survey responses are shown
in the report due to space limitations.
6
TABLE 1
Demographics
% Retention
Gender (vs)
Female 79%
Male 76%
Race/Ethnicity (ns)
International (N=14) 93%
Unknown (N=37) 81%
American Indian/Alaska Native (N=8) 50%
Asian (N=33) 85%
Black/African American (N=225) 79%
Hispanic of Any Race (N=147) 70%
Native Hawaiian/Pacific Islander (N=5) 60%
White/Caucasian (N=3,232) 78%
Two or More Races (N=108) 74%
First-Generation Status (obtained from FAFSA data) (vs)
First-Generation 73%
Non-First-Generation 80%
Residency (ns)
Indiana 78%
Out-of-State 76%
Domestic/International Status (ns)
Domestic 78%
International 93%
Dependent/Independent Financial Aid Status (obtained from FAFSA data) (vs)
Dependent 78%
Independent 62%
Unable To Determine 80%
Expected Family Contribution (obtained from FAFSA data) (vs)
Less Than $5,000 72%
$5,000-$9,999 79%
$10,000-$14,999 81%
$15,000-$19,999 81%
$20,000-$24,999 79%
$25,000-$29,999 80%
$30,000 or Greater 83%
7
TABLE 1
Demographics (cont.)
% Retention
SAT Total Score Ranges (possible range of 600-2400) (vs)
900-999 (N=1) 0%
1000-1099 (N=2) 50%
1100-1199 (N=13) 85%
1200-1299 (N=99) 65%
1300-1399 (N=510) 75%
1400-1499 (N=743) 74%
1500-1599 (N=661) 77%
1600-1699 (N=499) 80%
1700-1799 (N=363) 85%
1800-1899 (N=182) 89%
1900-1999 (N=93) 89%
2000-2099 (N=38) 92%
2100-2199 (N=15) 100%
2200-2299 (N=2) 100%
SAT Verbal Sub-Score Range (possible score range of 200-800) (vs)
200-299 (N=2) 50%
300-399 (N=55) 69%
400-499 (N=1,202) 75%
500-599 (N=1,246) 78%
600-699 (N=473) 87%
700 or Greater (N=63) 94%
SAT Mathematics Sub-Score Range (possible score range of 200-800) (vs)
300-399 (N=70) 63%
400-499 (N=1,156) 76%
500-599 (N=1,440) 78%
600-699 (N=514) 86%
700 or Greater (N=41) 95%
SAT Writing Sub-Score Range (possible score range of 200-800) (vs)
200-299 (N=3) 33%
300-399 (N=103) 72%
400-499 (N=1,356) 74%
500-599 (N=1,371) 80%
600-699 (N=339) 88%
700 or Greater (N=40) 95%
ACT Composite Score Range (vs)
13-17 (N=57) 75%
18-22 (N=820) 72%
23-27 (N=677) 80%
28-32 (N=196) 90%
33 or Greater (N=10) 100%
8
TABLE 1
Demographics (cont.)
% Retention
High School Grade Point Average Range (vs)
2.00-2.49 (N=15) 60%
2.50-2.99 (N=916) 68%
3.00-3.49 (N=1,403) 74%
3.50 or Greater (N=1,392) 88%
High School Graduation Percentile Range (vs)
50%-59% (N=155) 74%
60%-69% (N=258) 71%
70%-79% (N=252) 77%
80%-89% (N=288) 81%
90% or Greater (N=285) 93%
9
TABLE 2
Enrollment Breakouts
% Retention
College of Major at Beginning of Fall 2011 Semester (vs)
College of Applied Sciences and Technology 75%
College of Architecture and Planning 82%
College of Communications, Information, and Media 78%
College of Fine Arts 85%
College of Sciences and Humanities 75%
Miller College of Business 78%
Teachers College 86%
Interdisciplinary (N=16) 88%
University College 75%
Department of Major at Beginning of Fall 2011 Semester (s)
Anthropology (N=16) 75%
Art 82%
Biology 75%
Chemistry 77%
Communication Studies (N=23) 82%
Computer Science 75%
Criminal Justice and Criminology 72%
Economics (N=2) 100%
Elementary Education 84%
English 85%
Family and Consumer Sciences 82%
Geography 83%
Geology (N=6) 100%
History (N=15) 73%
Industry and Technology 77%
Information Systems and Operations Management (N=2) 50%
Interdepartmental (not defined) (N=16) 88%
Interdepartmental Applied Science/Technology 72%
Interdepartmental College of Architecture and Planning 91%
Interdepartmental College of Business 77%
Interdepartmental Science and Humanities 75%
Interdepartmental Teachers College 89%
Journalism 78%
Mathematical Sciences 72%
Modern Languages and Classics 90%
Natural Resources and Environmental Management (N=11) 55%
Philosophy (N=2) 50%
Physics and Astronomy (N=22) 41%
Physiology and Health Science (N=12) 83%
Political Science 66%
Psychological Science 72%
School of Music 81%
Note: N is shown for student enrollment below 25.
10
TABLE 2
Enrollment Breakouts (cont.)
% Retention
Department of Major at Beginning of Fall 2011 Semester (s) (cont.)
School of Nursing (N=3) 100%
School of Physical Education 75%
Special Education 89%
Social Work 71%
Sociology (N=2) 100%
Speech Pathology and Audiology 86%
Telecommunications 76%
Theatre and Dance 89%
No Department 75%
Unknown (N=9) 89%
College of Major at Beginning of Spring 2012 Semester (m)
College of Applied Sciences and Technology 85%
College of Architecture and Planning 88%
College of Communications, Information, and Media 82%
College of Fine Arts 91%
College of Sciences and Humanities 81%
Miller College of Business 83%
Teachers College 90%
Interdisciplinary (N=20) 90%
University College 75%
Honors College Participant (s)
Honors 96%
Non-Honors 76%
Commuter Group (ns)
Commuter 73%
On-Campus Resident 78%
Residence Area (vs)
Not an On-Campus Resident 73%
West Side of Campus 79%
East Side of Campus 76%
Residence Hall (s)
Not an On-Campus Resident 73%
Baker Hall (N=8) 88%
Botsford Hall 72%
Brady Hall 66%
Brayton Hall 80%
Clevenger Hall 78%
Crosley Hall 78%
Davidson Hall 78%
Note: N is shown for student enrollment below 25.
11
TABLE 2
Enrollment Breakouts (cont.)
% Retention
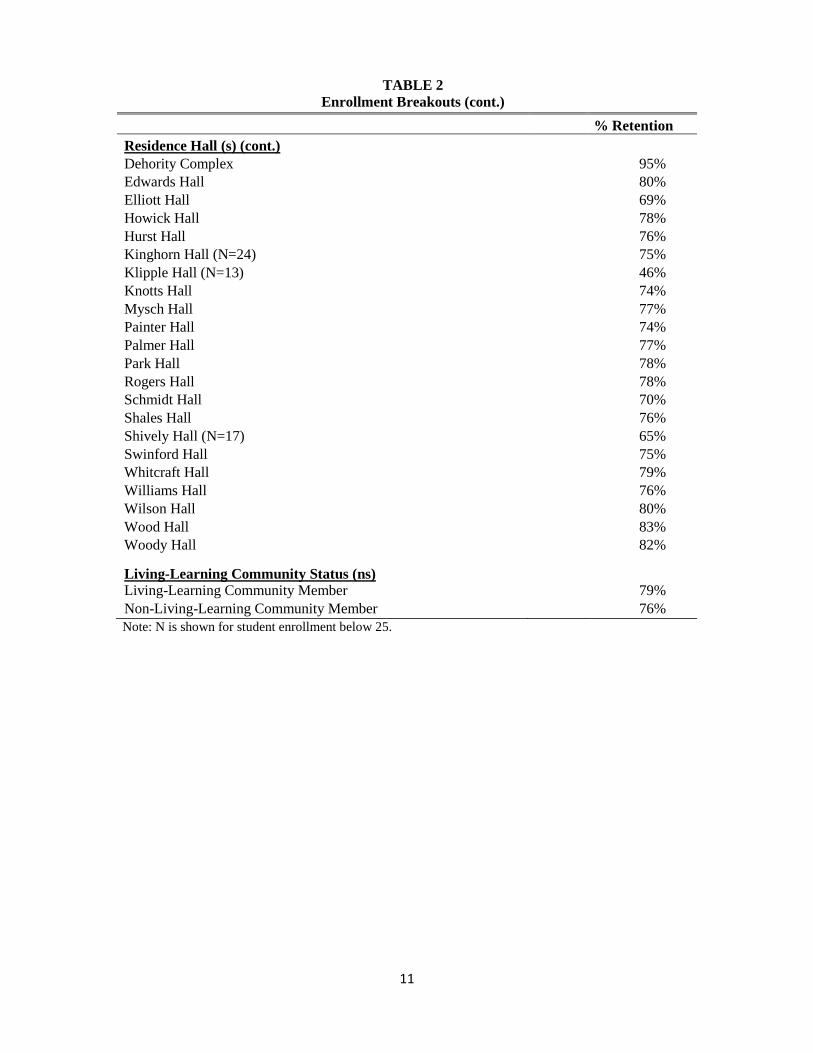
Residence Hall (s) (cont.)
Dehority Complex 95%
Edwards Hall 80%
Elliott Hall 69%
Howick Hall 78%
Hurst Hall 76%
Kinghorn Hall (N=24) 75%
Klipple Hall (N=13) 46%
Knotts Hall 74%
Mysch Hall 77%
Painter Hall 74%
Palmer Hall 77%
Park Hall 78%
Rogers Hall 78%
Schmidt Hall 70%
Shales Hall 76%
Shively Hall (N=17) 65%
Swinford Hall 75%
Whitcraft Hall 79%
Williams Hall 76%
Wilson Hall 80%
Wood Hall 83%
Woody Hall 82%
Living-Learning Community Status (ns)
Living-Learning Community Member 79%
Non-Living-Learning Community Member 76%
Note: N is shown for student enrollment below 25.
12
TABLE 2
Enrollment Breakouts (cont.)
% Retention
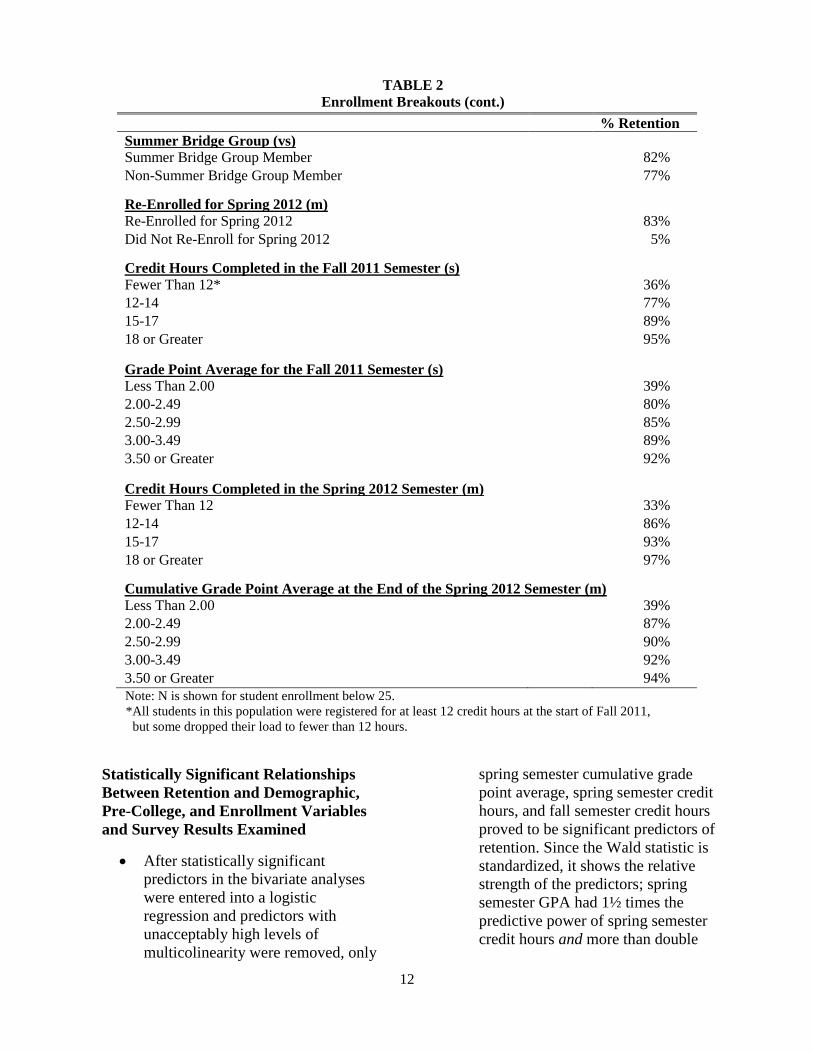
Summer Bridge Group (vs)
Summer Bridge Group Member 82%
Non-Summer Bridge Group Member 77%
Re-Enrolled for Spring 2012 (m)
Re-Enrolled for Spring 2012 83%
Did Not Re-Enroll for Spring 2012 5%
Credit Hours Completed in the Fall 2011 Semester (s)
Fewer Than 12* 36%
12-14 77%
15-17 89%
18 or Greater 95%
Grade Point Average for the Fall 2011 Semester (s)
Less Than 2.00 39%
2.00-2.49 80%
2.50-2.99 85%
3.00-3.49 89%
3.50 or Greater 92%
Credit Hours Completed in the Spring 2012 Semester (m)
Fewer Than 12 33%
12-14 86%
15-17 93%
18 or Greater 97%
Cumulative Grade Point Average at the End of the Spring 2012 Semester (m)
Less Than 2.00 39%
2.00-2.49 87%
2.50-2.99 90%
3.00-3.49 92%
3.50 or Greater 94%
Note: N is shown for student enrollment below 25.
*All students in this population were registered for at least 12 credit hours at the start of Fall 2011,
but some dropped their load to fewer than 12 hours.
Statistically Significant Relationships
Between Retention and Demographic,
Pre-College, and Enrollment Variables
and Survey Results Examined
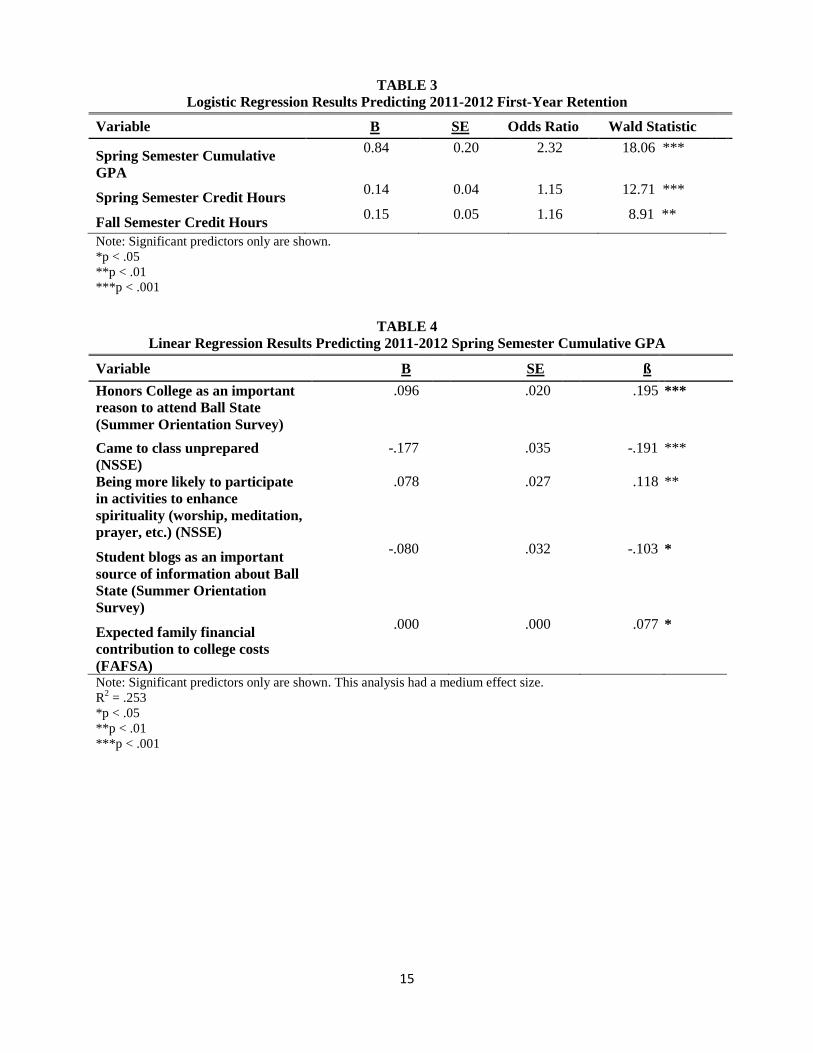
After statistically significant
predictors in the bivariate analyses
were entered into a logistic
regression and predictors with
unacceptably high levels of
multicolinearity were removed, only
spring semester cumulative grade
point average, spring semester credit
hours, and fall semester credit hours
proved to be significant predictors of
retention. Since the Wald statistic is
standardized, it shows the relative
strength of the predictors; spring
semester GPA had 1½ times the
predictive power of spring semester
credit hours and more than double
13
the predictive power of fall semester
credit hours. (Table 3)
Since only three predictors were
significant in the multivariate
analysis and since they do not occur
until the conclusion of the spring
semester, three additional linear
regression analyses were carried out
to investigate what other variables
relate to them.
As shown in Table 4, significant
predictors of spring semester
cumulative GPA (in order of
predictive power) were Honors
College as an important reason to
attend Ball State, not coming to
class unprepared (from NSSE),
being more likely to participate in
activities to enhance spirituality
(worship, meditation, prayer, etc.)
(NSSE), student blogs as an
important source of information
about Ball State (Summer
Orientation Survey), and expected
family financial contribution to
college costs (FAFSA). This
analysis had a medium effect size.
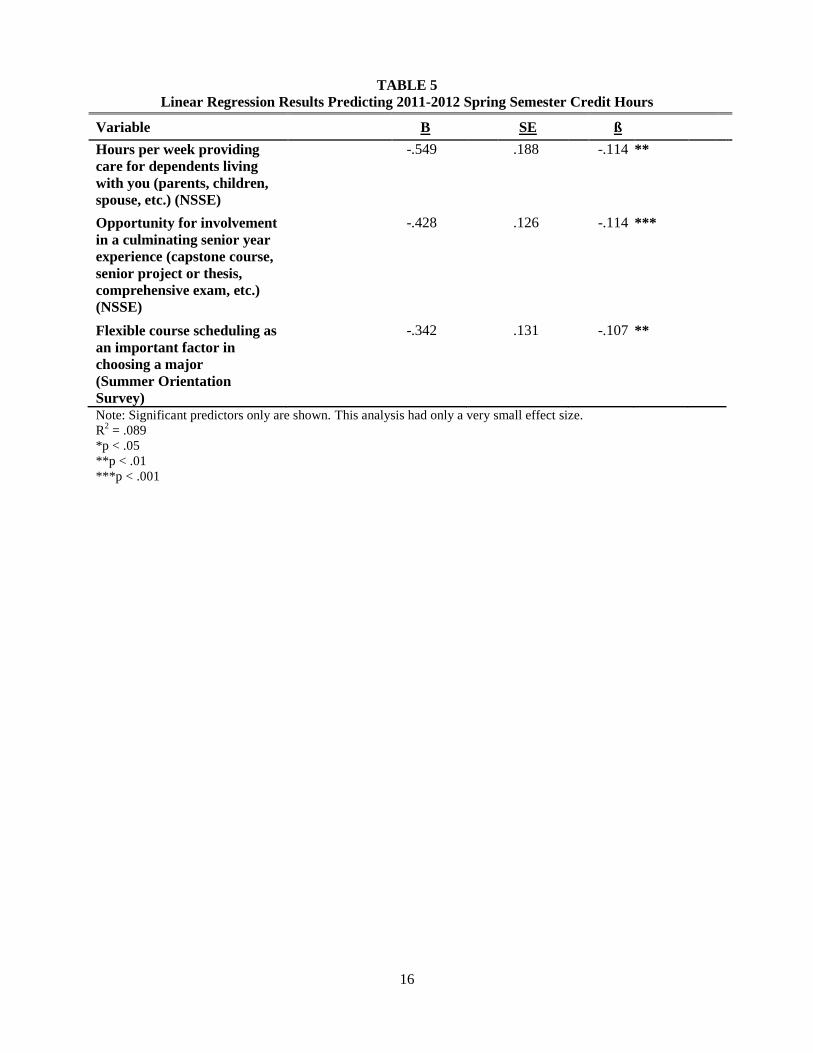
Table 5 shows that significant
predictors of spring semester credit
hours included (in order of predictive
power) fewer hours per week
providing care for dependents living
with them (parents, children, spouse,
etc.) (NSSE), the opportunity for
involvement in a culminating senior
year experience (capstone course,
senior project or thesis,
comprehensive exam, etc.) (NSSE),
and flexible course scheduling as an
important factor in choosing a major
(Summer Orientation Survey). This
analysis had only a very small effect
size.
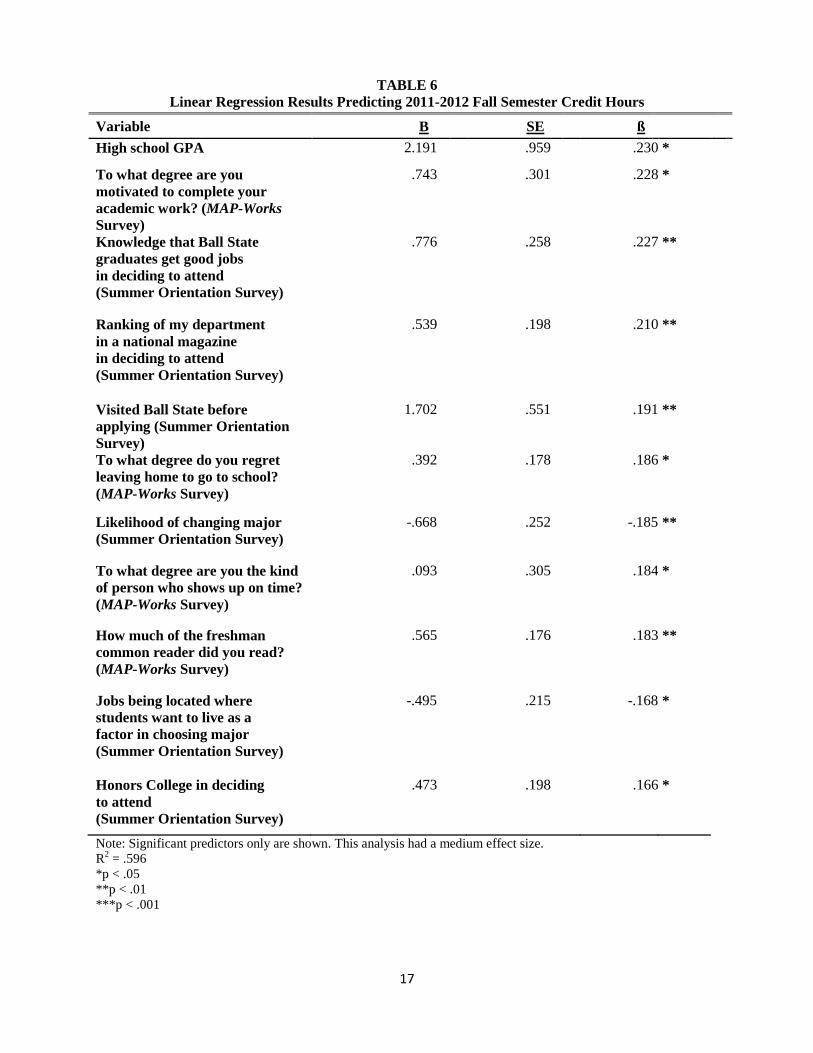
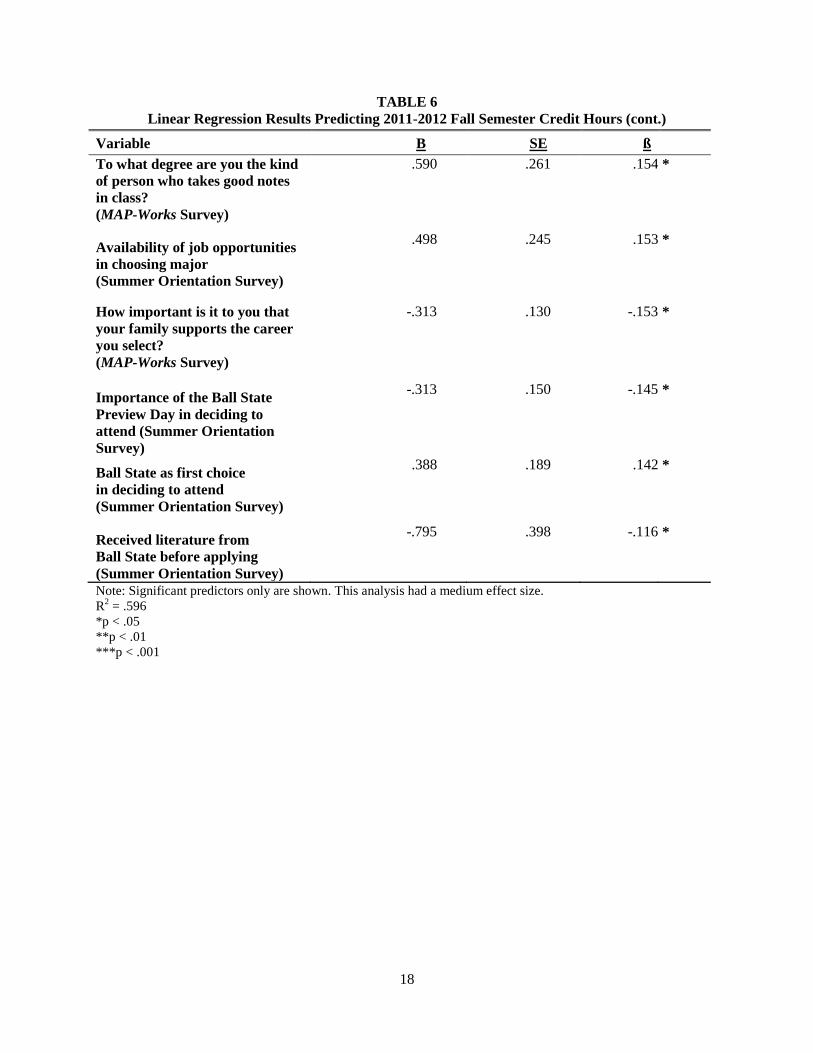
Table 6 highlights the 17 significant
predictors of fall semester credit
hours. These predictors included
high school GPA, the degree to
which students are motivated to
complete their academic work
(MAP-Works Survey), the
knowledge that Ball State graduates
get good jobs in deciding to attend
(Summer Orientation Survey), the
ranking of their department in a
national magazine in deciding to
attend (Summer Orientation Survey),
that they visited Ball State before
applying (Summer Orientation
Survey), the degree to which they
regret leaving home to go to school
(MAP-Works Survey), the likelihood
of changing majors (Summer
Orientation Survey), the degree to
which they are the kind of person
who shows up on time (MAP-Works
Survey), how much of the freshman
common reader they read (MAP-
Works Survey), jobs being located
where students want to live as a
factor in choosing their major
(Summer Orientation Survey), the
Honors College in deciding to attend
(Summer Orientation Survey), the
degree to which they are the kind of
person who takes good notes in class
(MAP-Works Survey), the
availability of job opportunities in
choosing their major (Summer
Orientation Survey), how important
it is to them that their family
supports the career they select
(MAP-Works Survey), the
importance of the Ball State Preview
Day in deciding to attend (Summer
Orientation Survey), Ball State as
their first choice in deciding to attend
(Summer Orientation Survey), and
receiving literature from Ball State
before applying (Summer
Orientation Survey). This analysis
had a medium effect size.
14
Statistically Significant Relationships
Between Retention and Course Grades
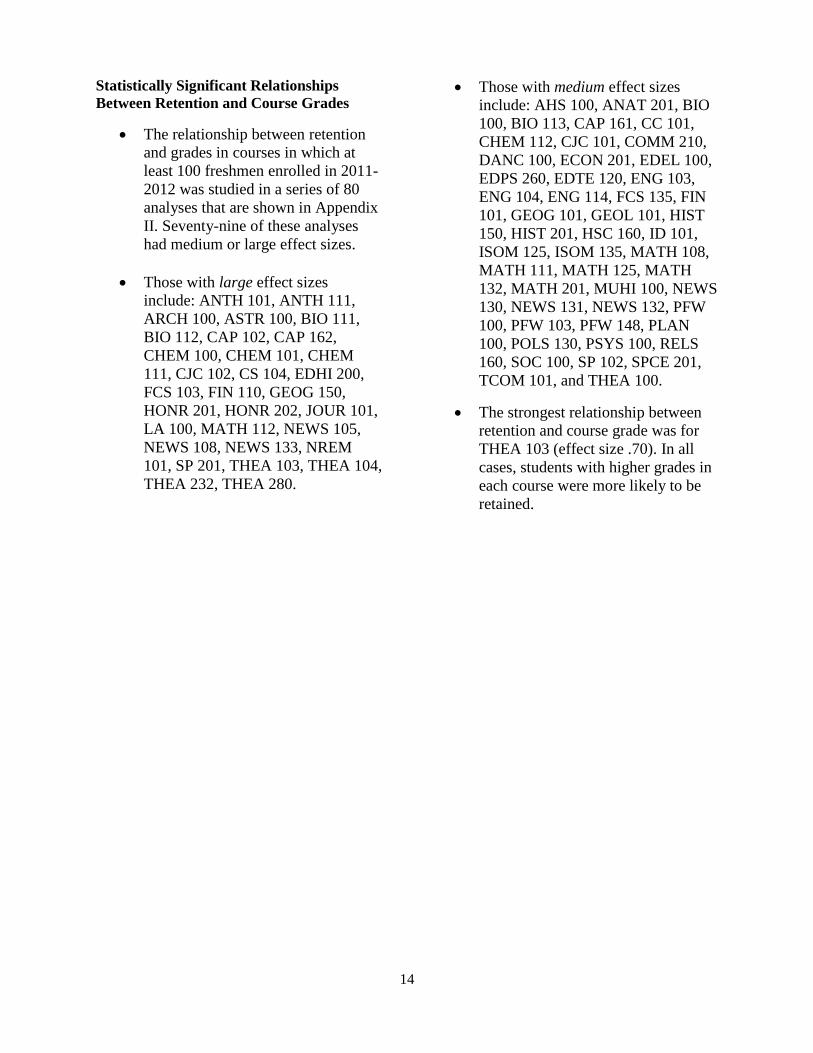
The relationship between retention
and grades in courses in which at
least 100 freshmen enrolled in 2011-
2012 was studied in a series of 80
analyses that are shown in Appendix
II. Seventy-nine of these analyses
had medium or large effect sizes.
Those with large effect sizes
include: ANTH 101, ANTH 111,
ARCH 100, ASTR 100, BIO 111,
BIO 112, CAP 102, CAP 162,
CHEM 100, CHEM 101, CHEM
111, CJC 102, CS 104, EDHI 200,
FCS 103, FIN 110, GEOG 150,
HONR 201, HONR 202, JOUR 101,
LA 100, MATH 112, NEWS 105,
NEWS 108, NEWS 133, NREM
101, SP 201, THEA 103, THEA 104,
THEA 232, THEA 280.
Those with medium effect sizes
include: AHS 100, ANAT 201, BIO
100, BIO 113, CAP 161, CC 101,
CHEM 112, CJC 101, COMM 210,
DANC 100, ECON 201, EDEL 100,
EDPS 260, EDTE 120, ENG 103,
ENG 104, ENG 114, FCS 135, FIN
101, GEOG 101, GEOL 101, HIST
150, HIST 201, HSC 160, ID 101,
ISOM 125, ISOM 135, MATH 108,
MATH 111, MATH 125, MATH
132, MATH 201, MUHI 100, NEWS
130, NEWS 131, NEWS 132, PFW
100, PFW 103, PFW 148, PLAN
100, POLS 130, PSYS 100, RELS
160, SOC 100, SP 102, SPCE 201,
TCOM 101, and THEA 100.
The strongest relationship between
retention and course grade was for
THEA 103 (effect size .70). In all
cases, students with higher grades in
each course were more likely to be
retained.
15
TABLE 3
Logistic Regression Results Predicting 2011-2012 First-Year Retention
Variable B SE Odds Ratio Wald Statistic
Spring Semester Cumulative
GPA
0.84 0.20 2.32 18.06 ***
Spring Semester Credit Hours 0.14 0.04 1.15 12.71 ***
Fall Semester Credit Hours 0.15 0.05 1.16 8.91 **
Note: Significant predictors only are shown.
*p < .05
**p < .01
***p < .001
TABLE 4
Linear Regression Results Predicting 2011-2012 Spring Semester Cumulative GPA
Variable B SE ß
Honors College as an important
reason to attend Ball State
(Summer Orientation Survey)
.096 .020 .195 ***
Came to class unprepared
(NSSE)
-.177 .035 -.191 ***
Being more likely to participate
in activities to enhance
spirituality (worship, meditation,
prayer, etc.) (NSSE)
.078 .027 .118 **
Student blogs as an important
source of information about Ball
State (Summer Orientation
Survey)
-.080 .032 -.103 *
Expected family financial
contribution to college costs
(FAFSA)
.000 .000 .077 *
Note: Significant predictors only are shown. This analysis had a medium effect size.
R2 = .253
*p < .05
**p < .01
***p < .001
16
TABLE 5
Linear Regression Results Predicting 2011-2012 Spring Semester Credit Hours
Variable B SE ß
Hours per week providing
care for dependents living
with you (parents, children,
spouse, etc.) (NSSE)
-.549 .188 -.114 **
Opportunity for involvement
in a culminating senior year
experience (capstone course,
senior project or thesis,
comprehensive exam, etc.)
(NSSE)
-.428 .126 -.114 ***
Flexible course scheduling as
an important factor in
choosing a major
(Summer Orientation
Survey)
-.342 .131 -.107 **
Note: Significant predictors only are shown. This analysis had only a very small effect size.
R2 = .089
*p < .05
**p < .01
***p < .001
17
TABLE 6
Linear Regression Results Predicting 2011-2012 Fall Semester Credit Hours
Variable B SE ß
High school GPA 2.191 .959 .230 *
To what degree are you
motivated to complete your
academic work? (MAP-Works
Survey)
.743 .301 .228 *
Knowledge that Ball State
graduates get good jobs
in deciding to attend
(Summer Orientation Survey)
.776 .258 .227 **
Ranking of my department
in a national magazine
in deciding to attend
(Summer Orientation Survey)
.539 .198 .210 **
Visited Ball State before
applying (Summer Orientation
Survey)
1.702 .551 .191 **
To what degree do you regret
leaving home to go to school?
(MAP-Works Survey)
.392 .178 .186 *
Likelihood of changing major
(Summer Orientation Survey)
-.668 .252 -.185 **
To what degree are you the kind
of person who shows up on time?
(MAP-Works Survey)
.093 .305 .184 *
How much of the freshman
common reader did you read?
(MAP-Works Survey)
.565 .176 .183 **
Jobs being located where
students want to live as a
factor in choosing major
(Summer Orientation Survey)
-.495 .215 -.168 *
Honors College in deciding
to attend
(Summer Orientation Survey)
.473 .198 .166 *
Note: Significant predictors only are shown. This analysis had a medium effect size.
R2 = .596
*p < .05
**p < .01
***p < .001
18
TABLE 6
Linear Regression Results Predicting 2011-2012 Fall Semester Credit Hours (cont.)
Variable B SE ß
To what degree are you the kind
of person who takes good notes
in class?
(MAP-Works Survey)
.590 .261 .154 *
Availability of job opportunities
in choosing major
(Summer Orientation Survey)
.498 .245 .153 *
How important is it to you that
your family supports the career
you select?
(MAP-Works Survey)
-.313 .130 -.153 *
Importance of the Ball State
Preview Day in deciding to
attend (Summer Orientation
Survey)
-.313 .150 -.145 *
Ball State as first choice
in deciding to attend
(Summer Orientation Survey)
.388 .189 .142 *
Received literature from
Ball State before applying
(Summer Orientation Survey)
-.795 .398 -.116 *
Note: Significant predictors only are shown. This analysis had a medium effect size.
R2 = .596
*p < .05
**p < .01
***p < .001
19
SUMMARY AND CONCLUSIONS
Braxton (2000) and Tinto (1987),
perhaps the most often-cited
sourcebooks on college student
retention, note that understanding factors
affecting college student retention and
how it can be improved is a difficult
proposition. A complex array of factors
affects retention, many of which are not
easily amenable to institutional action.
This study has answered some questions,
but raised more. While retention rates
differed across numerous demographic,
pre-college, and enrollment variables,
only a handful of these relationships
with retention were statistically
significant; and only three were
significant when examined concurrently:
number of fall and spring semester credit
hours and spring semester cumulative
grade point average. When predictors of
these three variables were examined in
turn, results were only moderately
successful. The strongest predictors of
fall semester credit hours were some of
the results of the Summer Orientation
Survey and the MAP-Works Survey. The
strongest predictors of spring semester
credit hours were some of the results of
the Summer Orientation Survey and
NSSE. Strong relationships exist
between retention and many of the
courses freshmen took.
While it is logical that the grade point
average and credit hours earned during
the freshman year are the most salient
predictors of retention, this finding does
not of itself lead to institutional action.
This study hints at some actionable
results. Emphasizing the Honors
College, working to ensure that students
come to class prepared, recruiting
students with higher levels of family
financial contribution to college costs,
providing support for students who need
to care for dependents, emphasizing
graduates’ career success and national
rankings of academic programs,
providing students with options that
allow them to remain at Ball State if they
are considering changing majors,
promoting college visits (including Ball
State Preview Day), and following up on
cues from MAP-Works and other sources
where students may be indicating they
are experiencing attrition-prone
behaviors are all actionable tactics
suggested by the study results. Current
efforts to facilitate students’ awareness
of their success in first-year courses
early in the semester are also supported
by this study.
The Office of Institutional Effectiveness
will continue to provide increasingly
comprehensive decision support for
student success efforts.

20
21
APPENDIX I
References
Braxton, J. M. (2000). Reworking the college student departure puzzle. Nashville, TN:
Vanderbilt University Press.
Cohen, J. (1988). Statistical Power Analysis for the Behavioral Sciences (2nd ed).
US: Lawrence Erlbaum Associates.
Tinto, V. (1987). Leaving college: Rethinking the causes and cures of student attrition.
Chicago, IL: The University of Chicago Press.

22
23
APPENDIX II
Retention Rates by Grades in Courses Taken
by at Least 100 2011-2012 Freshmen

24
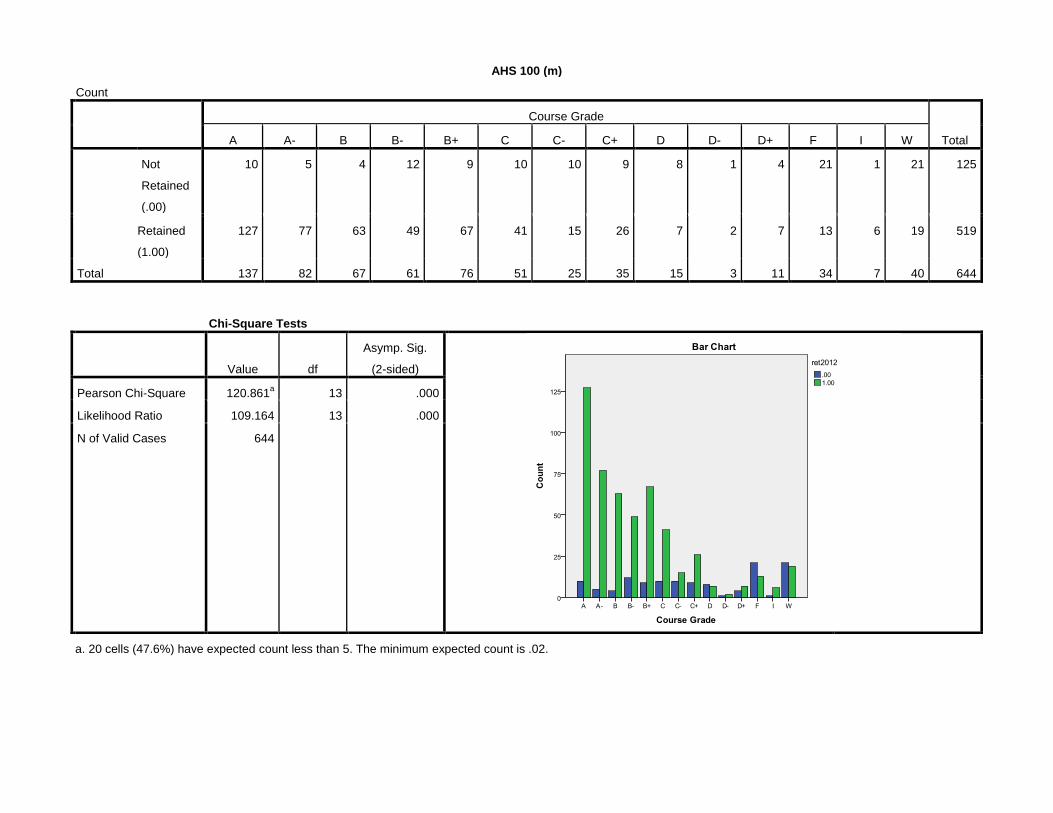
AHS 100 (m)
Count
Course Grade
Total A A- B B- B+ C C- C+ D D- D+ F I W
Not
Retained
(.00)
10 5 4 12 9 10 10 9 8 1 4 21 1 21 125
Retained
(1.00)
127 77 63 49 67 41 15 26 7 2 7 13 6 19 519
Total 137 82 67 61 76 51 25 35 15 3 11 34 7 40 644
Chi-Square Tests
Value df
Asymp. Sig.
(2-sided)
Pearson Chi-Square 120.861a 13 .000
Likelihood Ratio 109.164 13 .000
N of Valid Cases 644
a. 20 cells (47.6%) have expected count less than 5. The minimum expected count is .02.
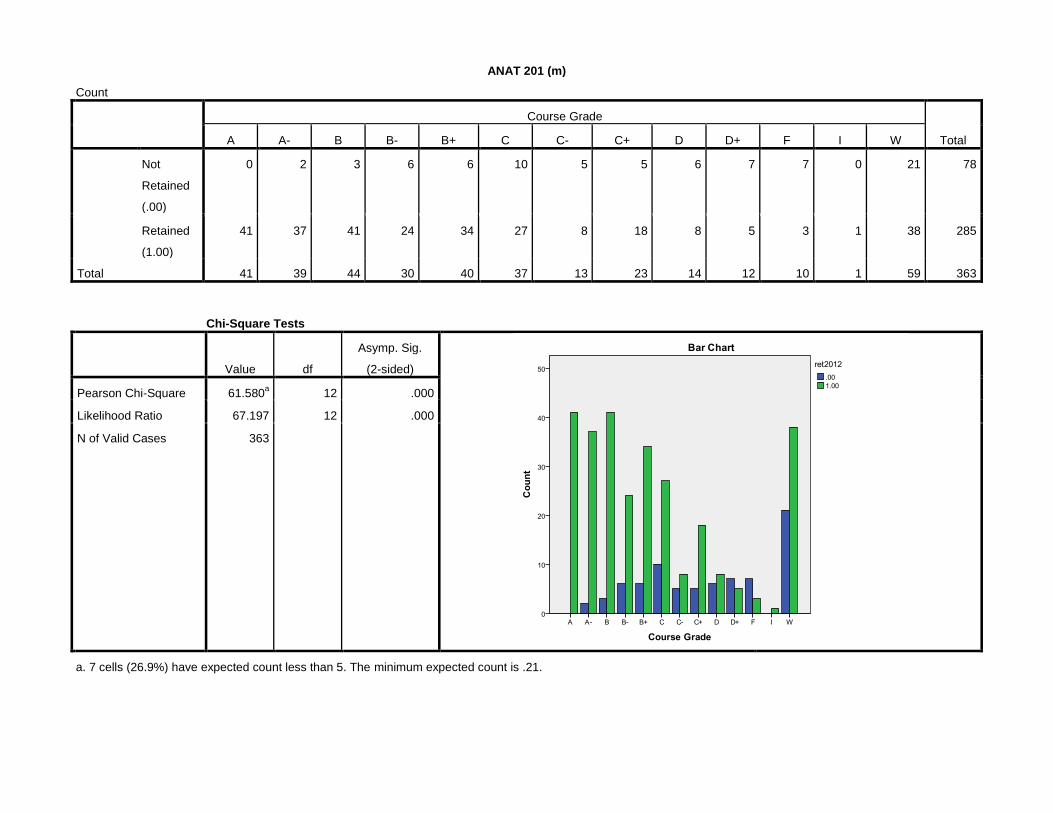
ANAT 201 (m)
Count
Course Grade
Total A A- B B- B+ C C- C+ D D+ F I W
Not
Retained
(.00)
0 2 3 6 6 10 5 5 6 7 7 0 21 78
Retained
(1.00)
41 37 41 24 34 27 8 18 8 5 3 1 38 285
Total 41 39 44 30 40 37 13 23 14 12 10 1 59 363
Chi-Square Tests
Value df
Asymp. Sig.
(2-sided)
Pearson Chi-Square 61.580a 12 .000
Likelihood Ratio 67.197 12 .000
N of Valid Cases 363
a. 7 cells (26.9%) have expected count less than 5. The minimum expected count is .21.
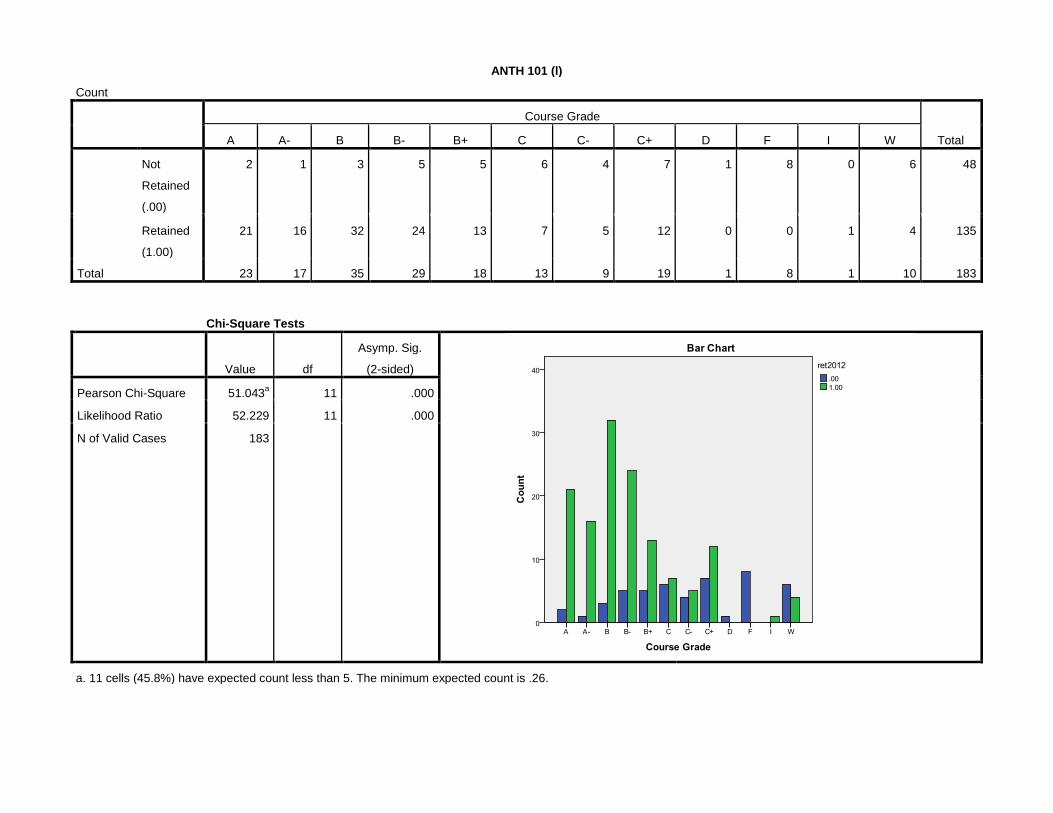
ANTH 101 (l)
Count
Course Grade
Total A A- B B- B+ C C- C+ D F I W
Not
Retained
(.00)
2 1 3 5 5 6 4 7 1 8 0 6 48
Retained
(1.00)
21 16 32 24 13 7 5 12 0 0 1 4 135
Total 23 17 35 29 18 13 9 19 1 8 1 10 183
Chi-Square Tests
Value df
Asymp. Sig.
(2-sided)
Pearson Chi-Square 51.043a 11 .000
Likelihood Ratio 52.229 11 .000
N of Valid Cases 183
a. 11 cells (45.8%) have expected count less than 5. The minimum expected count is .26.
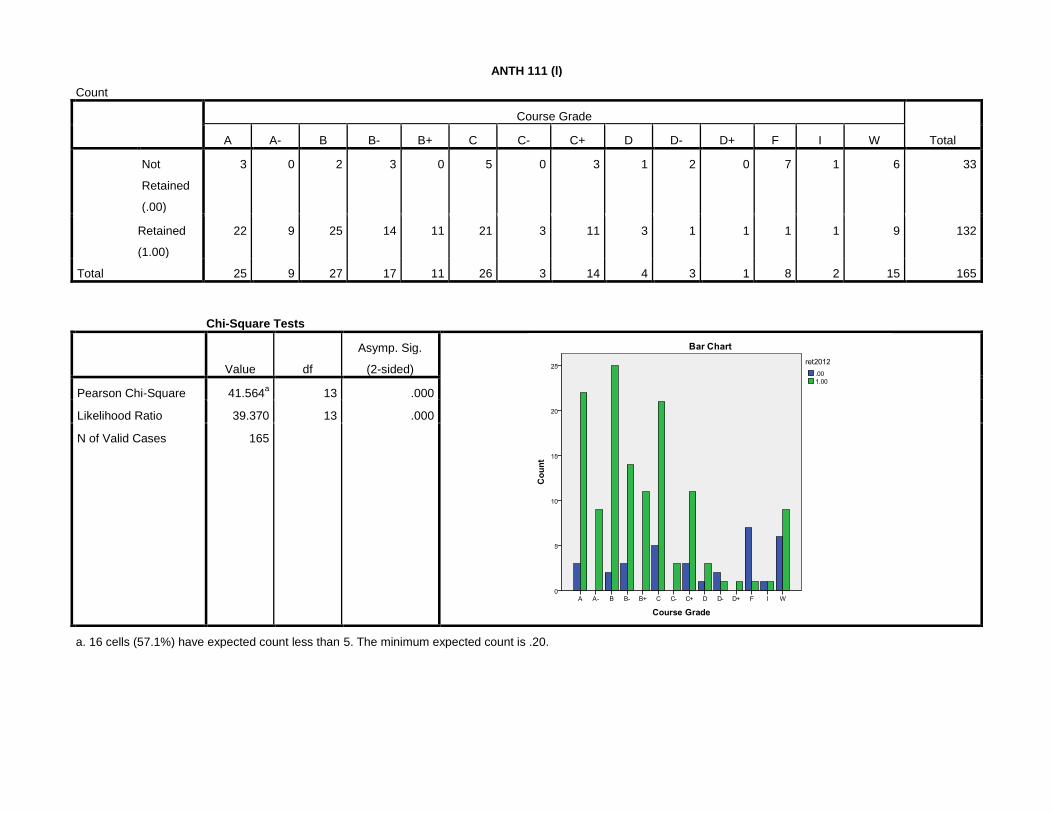
ANTH 111 (l)
Count
Course Grade
Total A A- B B- B+ C C- C+ D D- D+ F I W
Not
Retained
(.00)
3 0 2 3 0 5 0 3 1 2 0 7 1 6 33
Retained
(1.00)
22 9 25 14 11 21 3 11 3 1 1 1 1 9 132
Total 25 9 27 17 11 26 3 14 4 3 1 8 2 15 165
Chi-Square Tests
Value df
Asymp. Sig.
(2-sided)
Pearson Chi-Square 41.564a 13 .000
Likelihood Ratio 39.370 13 .000
N of Valid Cases 165
a. 16 cells (57.1%) have expected count less than 5. The minimum expected count is .20.
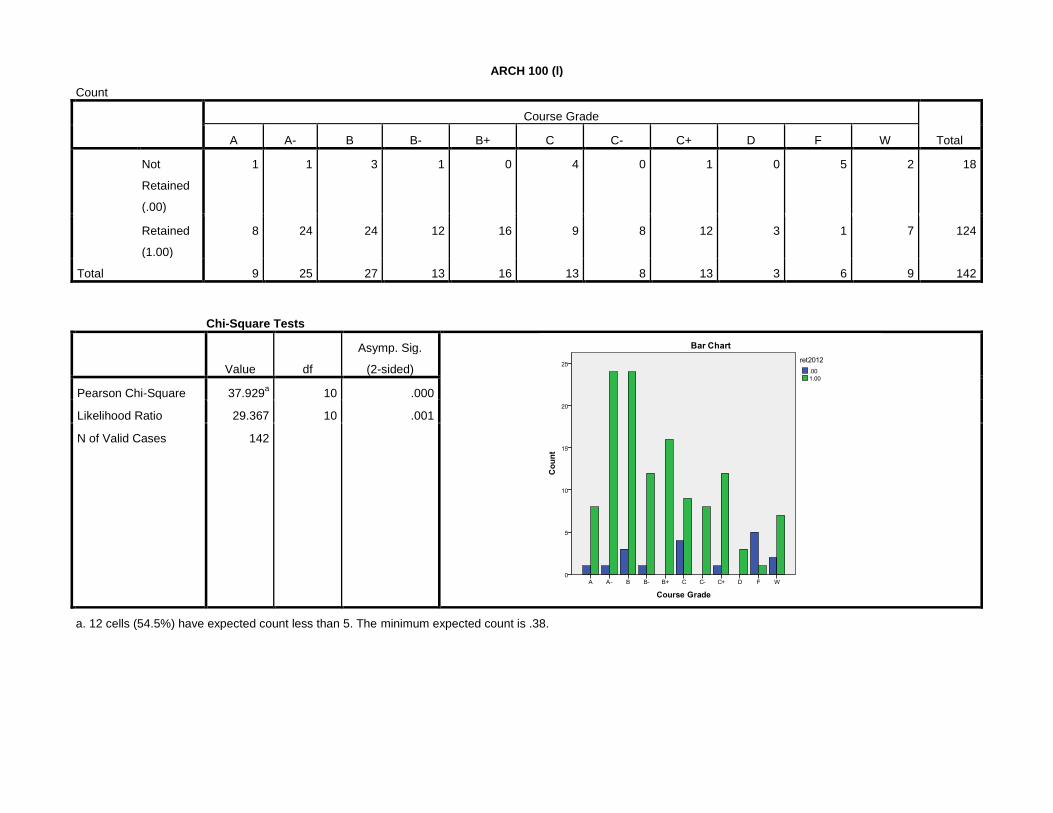
ARCH 100 (l)
Count
Course Grade
Total A A- B B- B+ C C- C+ D F W
Not
Retained
(.00)
1 1 3 1 0 4 0 1 0 5 2 18
Retained
(1.00)
8 24 24 12 16 9 8 12 3 1 7 124
Total 9 25 27 13 16 13 8 13 3 6 9 142
Chi-Square Tests
Value df
Asymp. Sig.
(2-sided)
Pearson Chi-Square 37.929a 10 .000
Likelihood Ratio 29.367 10 .001
N of Valid Cases 142
a. 12 cells (54.5%) have expected count less than 5. The minimum expected count is .38.
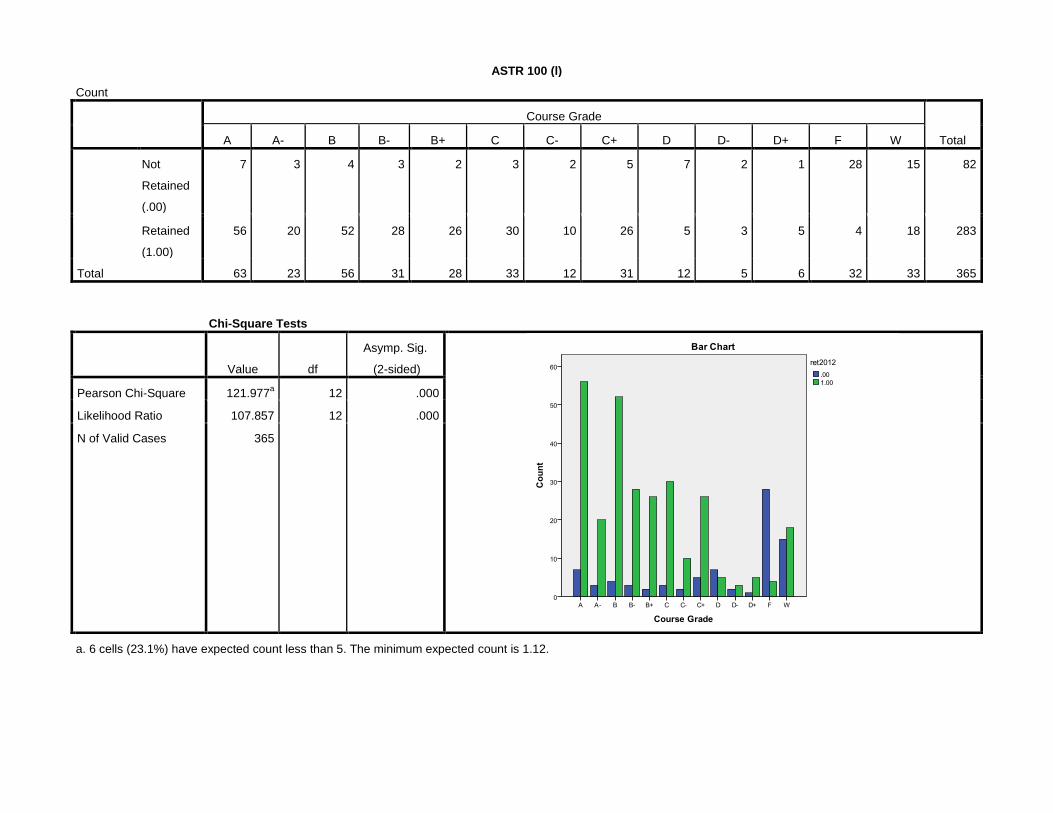
ASTR 100 (l)
Count
Course Grade
Total A A- B B- B+ C C- C+ D D- D+ F W
Not
Retained
(.00)
7 3 4 3 2 3 2 5 7 2 1 28 15 82
Retained
(1.00)
56 20 52 28 26 30 10 26 5 3 5 4 18 283
Total 63 23 56 31 28 33 12 31 12 5 6 32 33 365
Chi-Square Tests
Value df
Asymp. Sig.
(2-sided)
Pearson Chi-Square 121.977a 12 .000
Likelihood Ratio 107.857 12 .000
N of Valid Cases 365
a. 6 cells (23.1%) have expected count less than 5. The minimum expected count is 1.12.

BIO 100 (m)
Count
Course Grade
Total A A- B B- B+ C C- C+ D D- D+ F W
Not
Retained
(.00)
4 1 8 1 0 5 2 2 5 1 1 6 4 40
Retained
(1.00)
37 16 32 13 15 24 10 13 8 1 2 3 1 175
Total 41 17 40 14 15 29 12 15 13 2 3 9 5 215
Chi-Square Tests
Value df
Asymp. Sig.
(2-sided)
Pearson Chi-Square 40.263a 12 .000
Likelihood Ratio 35.899 12 .000
N of Valid Cases 215
a. 13 cells (50.0%) have expected count less than 5. The minimum expected count is .37.
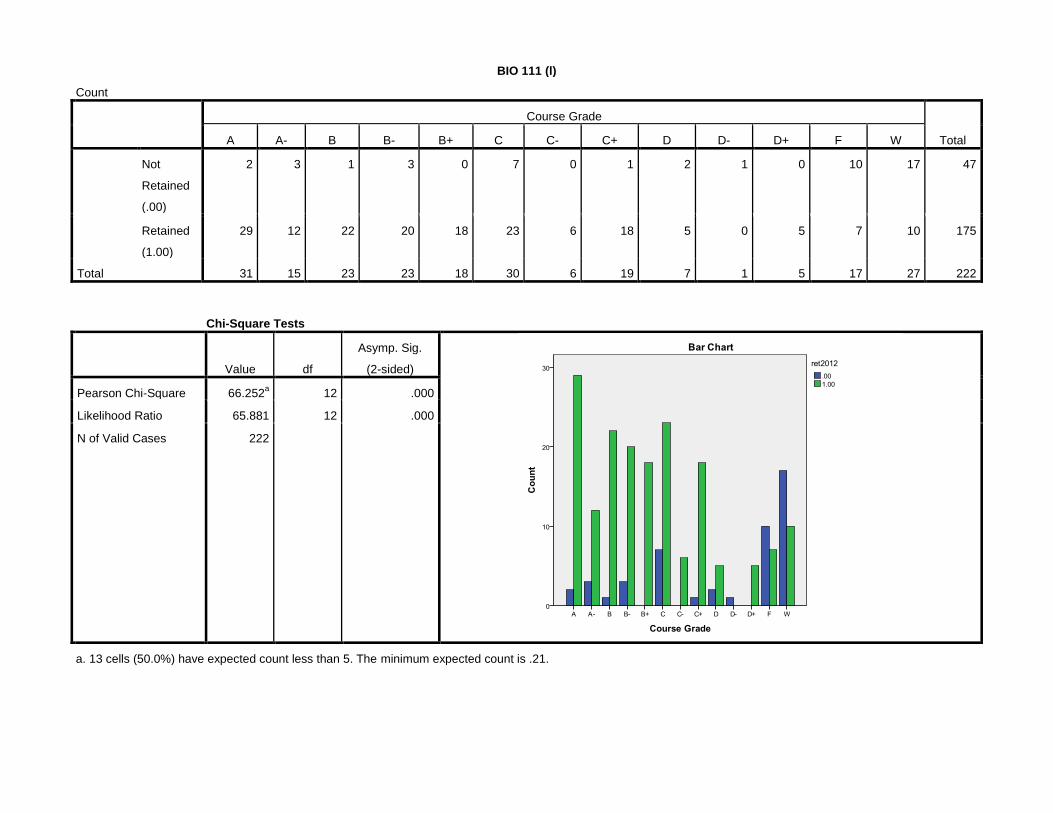
BIO 111 (l)
Count
Course Grade
Total A A- B B- B+ C C- C+ D D- D+ F W
Not
Retained
(.00)
2 3 1 3 0 7 0 1 2 1 0 10 17 47
Retained
(1.00)
29 12 22 20 18 23 6 18 5 0 5 7 10 175
Total 31 15 23 23 18 30 6 19 7 1 5 17 27 222
Chi-Square Tests
Value df
Asymp. Sig.
(2-sided)
Pearson Chi-Square 66.252a 12 .000
Likelihood Ratio 65.881 12 .000
N of Valid Cases 222
a. 13 cells (50.0%) have expected count less than 5. The minimum expected count is .21.
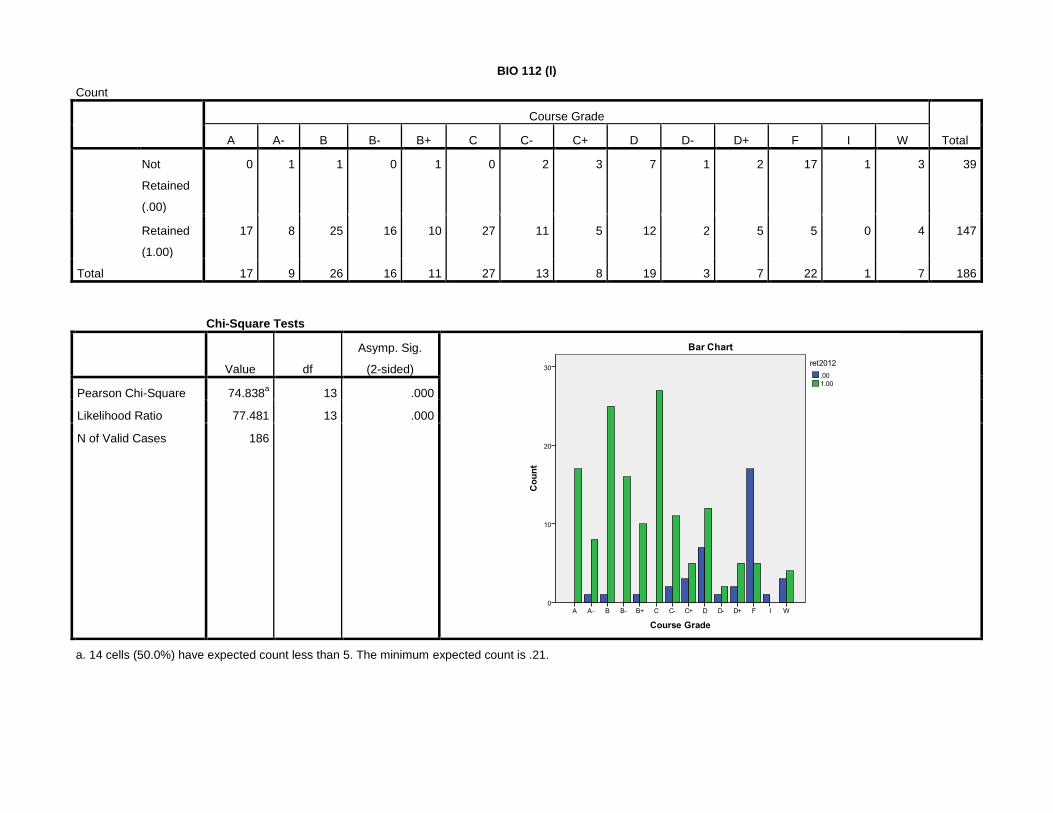
BIO 112 (l)
Count
Course Grade
Total A A- B B- B+ C C- C+ D D- D+ F I W
Not
Retained
(.00)
0 1 1 0 1 0 2 3 7 1 2 17 1 3 39
Retained
(1.00)
17 8 25 16 10 27 11 5 12 2 5 5 0 4 147
Total 17 9 26 16 11 27 13 8 19 3 7 22 1 7 186
Chi-Square Tests
Value df
Asymp. Sig.
(2-sided)
Pearson Chi-Square 74.838a 13 .000
Likelihood Ratio 77.481 13 .000
N of Valid Cases 186
a. 14 cells (50.0%) have expected count less than 5. The minimum expected count is .21.
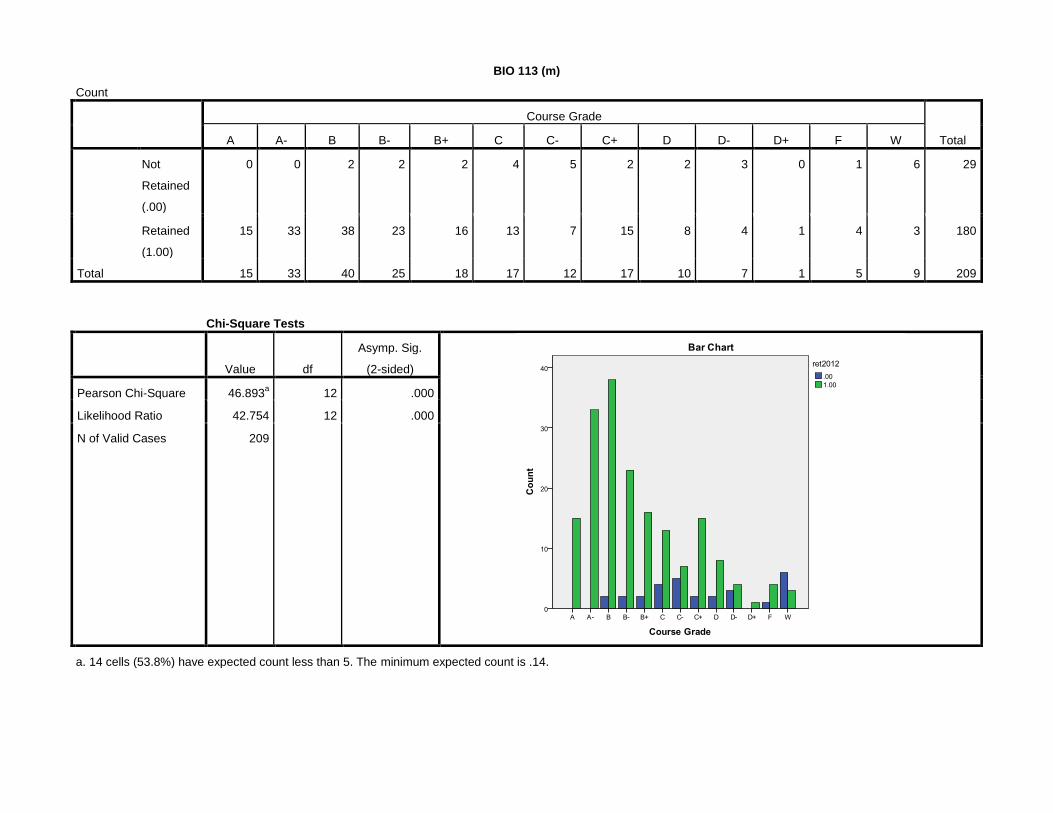
BIO 113 (m)
Count
Course Grade
Total A A- B B- B+ C C- C+ D D- D+ F W
Not
Retained
(.00)
0 0 2 2 2 4 5 2 2 3 0 1 6 29
Retained
(1.00)
15 33 38 23 16 13 7 15 8 4 1 4 3 180
Total 15 33 40 25 18 17 12 17 10 7 1 5 9 209
Chi-Square Tests
Value df
Asymp. Sig.
(2-sided)
Pearson Chi-Square 46.893a 12 .000
Likelihood Ratio 42.754 12 .000
N of Valid Cases 209
a. 14 cells (53.8%) have expected count less than 5. The minimum expected count is .14.
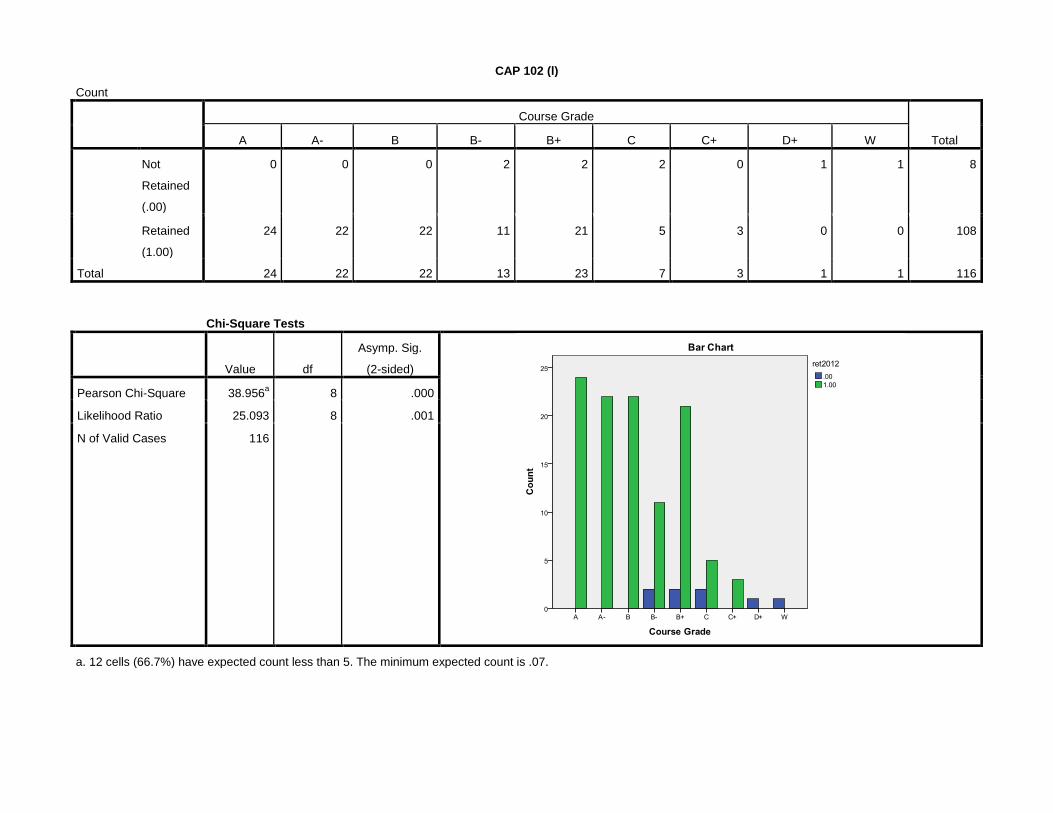
CAP 102 (l)
Count
Course Grade
Total A A- B B- B+ C C+ D+ W
Not
Retained
(.00)
0 0 0 2 2 2 0 1 1 8
Retained
(1.00)
24 22 22 11 21 5 3 0 0 108
Total 24 22 22 13 23 7 3 1 1 116
Chi-Square Tests
Value df
Asymp. Sig.
(2-sided)
Pearson Chi-Square 38.956a 8 .000
Likelihood Ratio 25.093 8 .001
N of Valid Cases 116
a. 12 cells (66.7%) have expected count less than 5. The minimum expected count is .07.
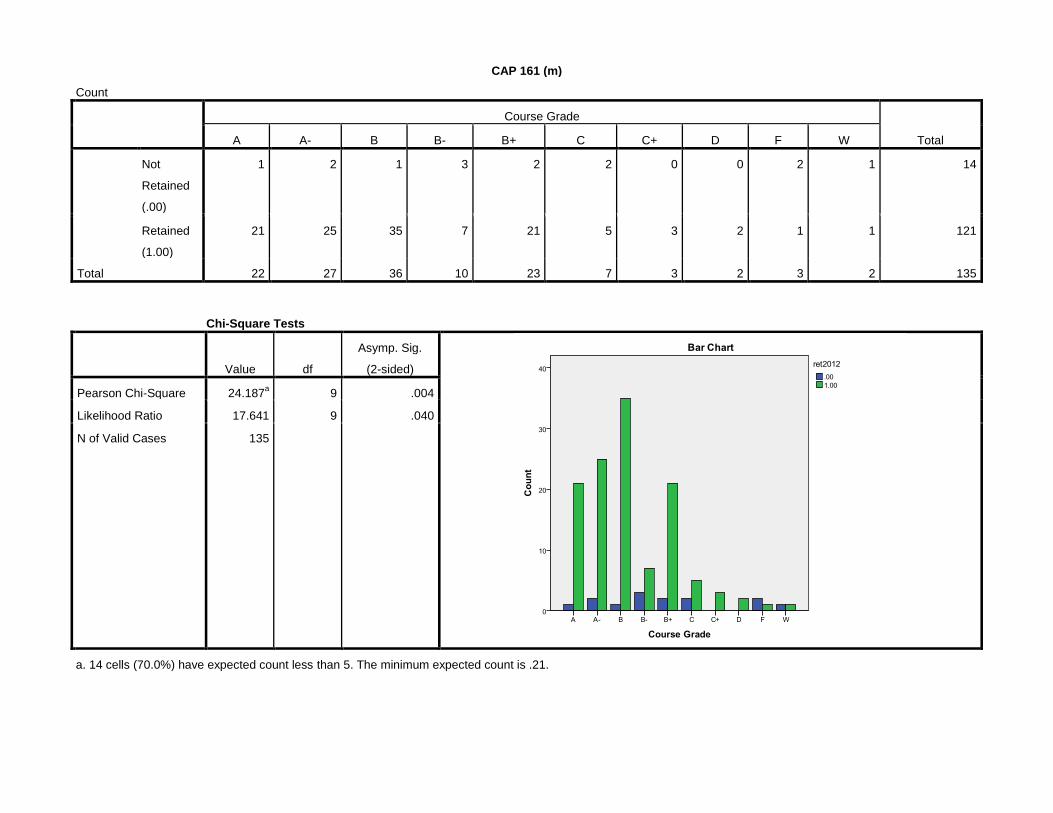
CAP 161 (m)
Count
Course Grade
Total A A- B B- B+ C C+ D F W
Not
Retained
(.00)
1 2 1 3 2 2 0 0 2 1 14
Retained
(1.00)
21 25 35 7 21 5 3 2 1 1 121
Total 22 27 36 10 23 7 3 2 3 2 135
Chi-Square Tests
Value df
Asymp. Sig.
(2-sided)
Pearson Chi-Square 24.187a 9 .004
Likelihood Ratio 17.641 9 .040
N of Valid Cases 135
a. 14 cells (70.0%) have expected count less than 5. The minimum expected count is .21.
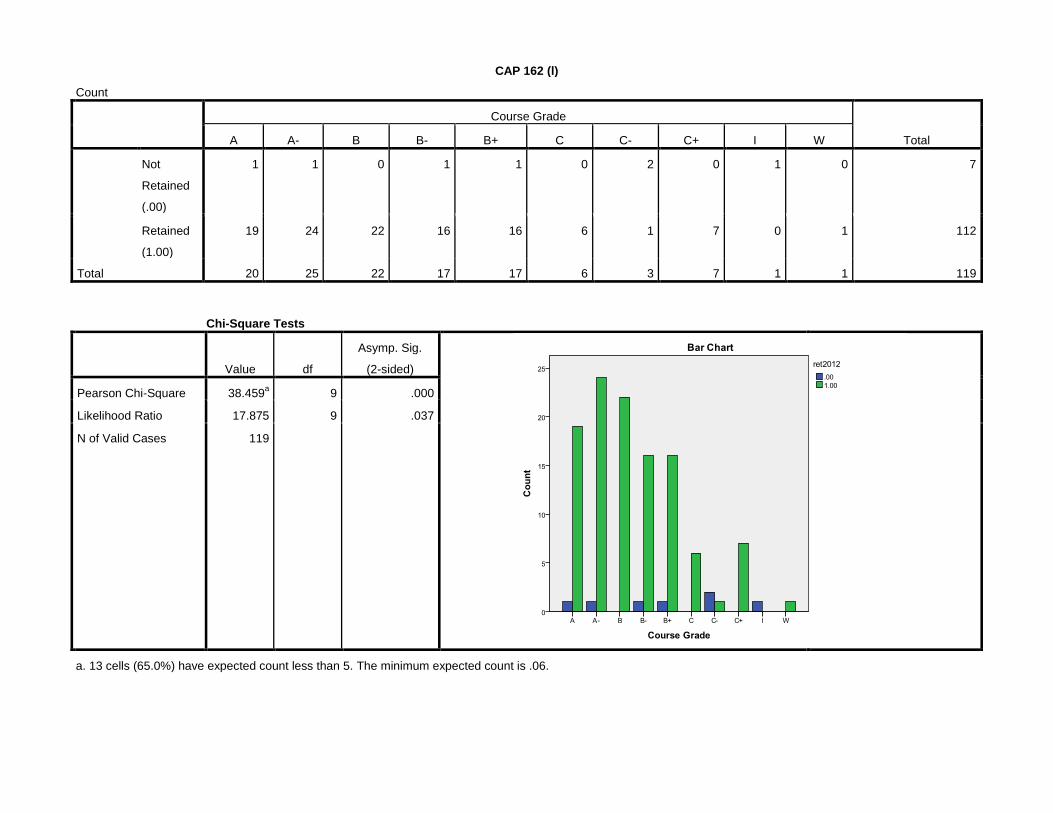
CAP 162 (l)
Count
Course Grade
Total A A- B B- B+ C C- C+ I W
Not
Retained
(.00)
1 1 0 1 1 0 2 0 1 0 7
Retained
(1.00)
19 24 22 16 16 6 1 7 0 1 112
Total 20 25 22 17 17 6 3 7 1 1 119
Chi-Square Tests
Value df
Asymp. Sig.
(2-sided)
Pearson Chi-Square 38.459a 9 .000
Likelihood Ratio 17.875 9 .037
N of Valid Cases 119
a. 13 cells (65.0%) have expected count less than 5. The minimum expected count is .06.
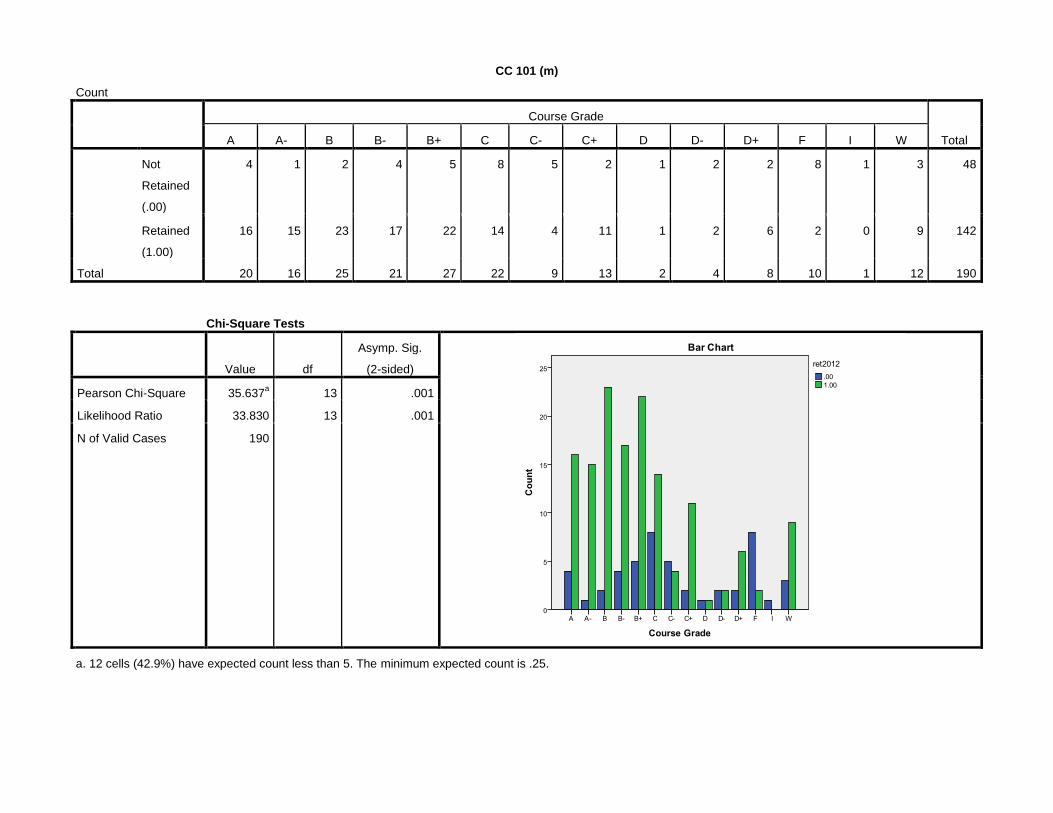
CC 101 (m)
Count
Course Grade
Total A A- B B- B+ C C- C+ D D- D+ F I W
Not
Retained
(.00)
4 1 2 4 5 8 5 2 1 2 2 8 1 3 48
Retained
(1.00)
16 15 23 17 22 14 4 11 1 2 6 2 0 9 142
Total 20 16 25 21 27 22 9 13 2 4 8 10 1 12 190
Chi-Square Tests
Value df
Asymp. Sig.
(2-sided)
Pearson Chi-Square 35.637a 13 .001
Likelihood Ratio 33.830 13 .001
N of Valid Cases 190
a. 12 cells (42.9%) have expected count less than 5. The minimum expected count is .25.
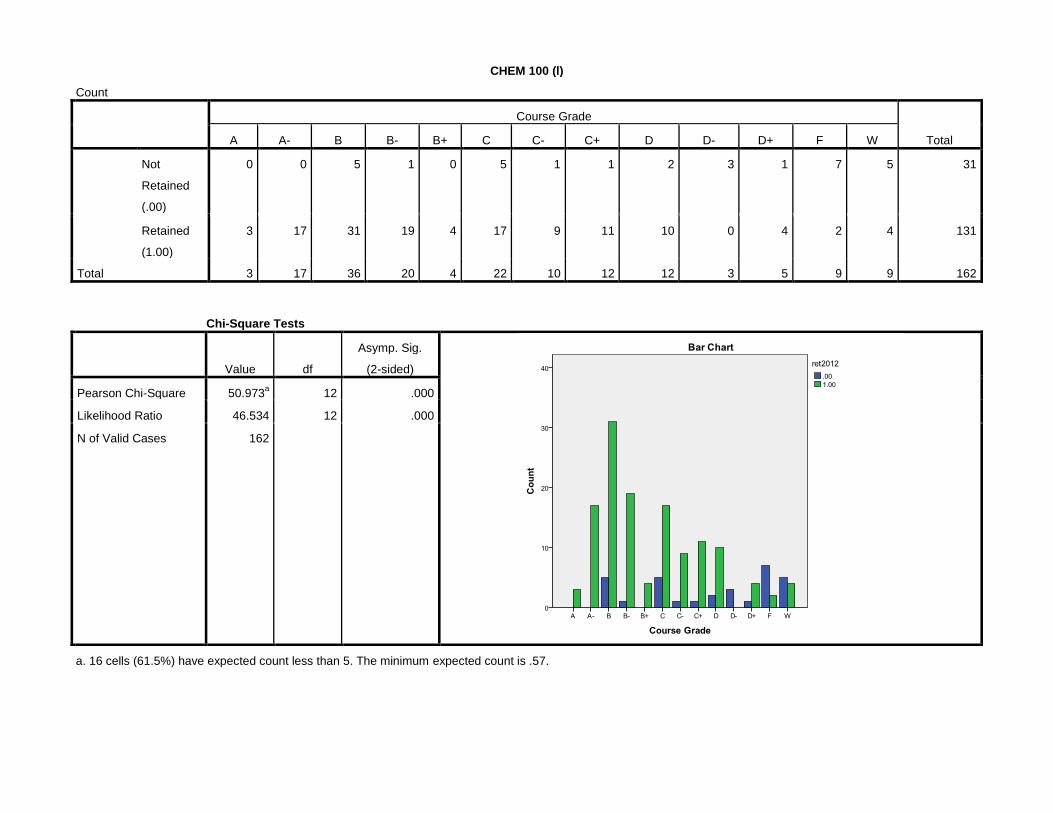
CHEM 100 (l)
Count
Course Grade
Total A A- B B- B+ C C- C+ D D- D+ F W
Not
Retained
(.00)
0 0 5 1 0 5 1 1 2 3 1 7 5 31
Retained
(1.00)
3 17 31 19 4 17 9 11 10 0 4 2 4 131
Total 3 17 36 20 4 22 10 12 12 3 5 9 9 162
Chi-Square Tests
Value df
Asymp. Sig.
(2-sided)
Pearson Chi-Square 50.973a 12 .000
Likelihood Ratio 46.534 12 .000
N of Valid Cases 162
a. 16 cells (61.5%) have expected count less than 5. The minimum expected count is .57.

CHEM 101 (l)
Count
Course Grade
Total A A- B B- B+ C C- C+ D D- D+ F W
Not
Retained
(.00)
3 2 9 8 6 16 6 7 10 0 2 17 13 99
Retained
(1.00)
40 34 41 33 23 22 14 22 5 4 11 5 2 256
Total 43 36 50 41 29 38 20 29 15 4 13 22 15 355
Chi-Square Tests
Value df
Asymp. Sig.
(2-sided)
Pearson Chi-Square 93.177a 12 .000
Likelihood Ratio 92.011 12 .000
N of Valid Cases 355
a. 5 cells (19.2%) have expected count less than 5. The minimum expected count is 1.12.
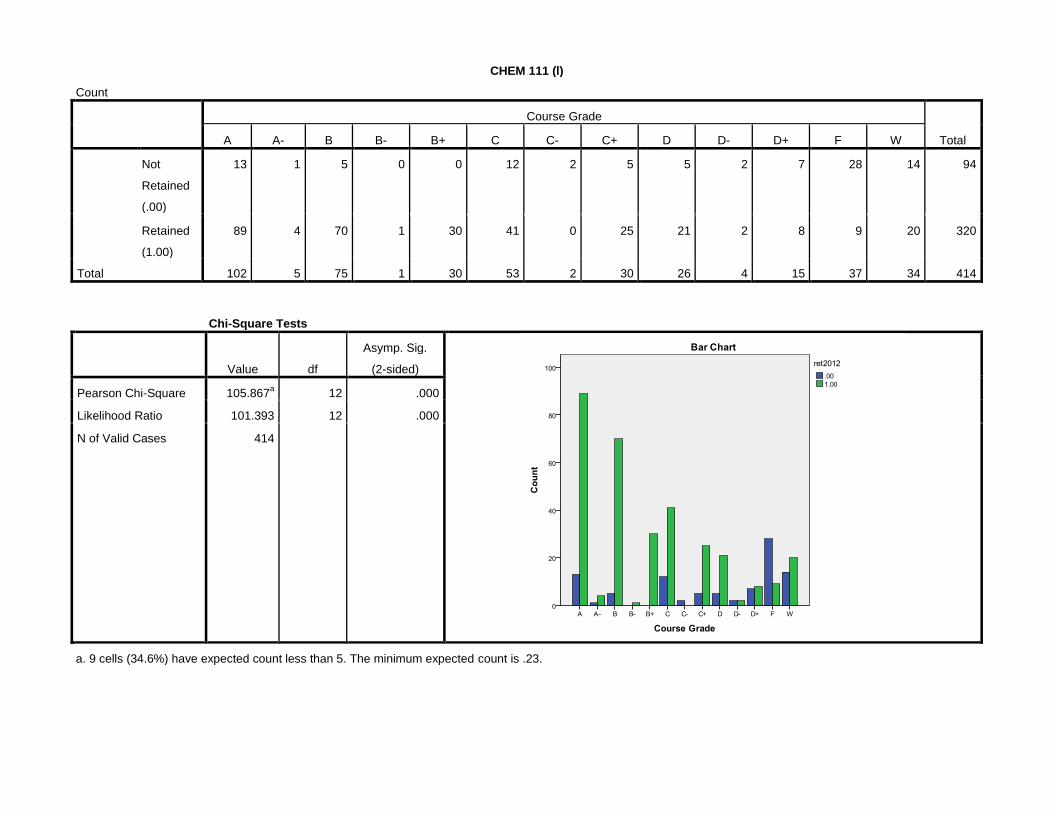
CHEM 111 (l)
Count
Course Grade
Total A A- B B- B+ C C- C+ D D- D+ F W
Not
Retained
(.00)
13 1 5 0 0 12 2 5 5 2 7 28 14 94
Retained
(1.00)
89 4 70 1 30 41 0 25 21 2 8 9 20 320
Total 102 5 75 1 30 53 2 30 26 4 15 37 34 414
Chi-Square Tests
Value df
Asymp. Sig.
(2-sided)
Pearson Chi-Square 105.867a 12 .000
Likelihood Ratio 101.393 12 .000
N of Valid Cases 414
a. 9 cells (34.6%) have expected count less than 5. The minimum expected count is .23.
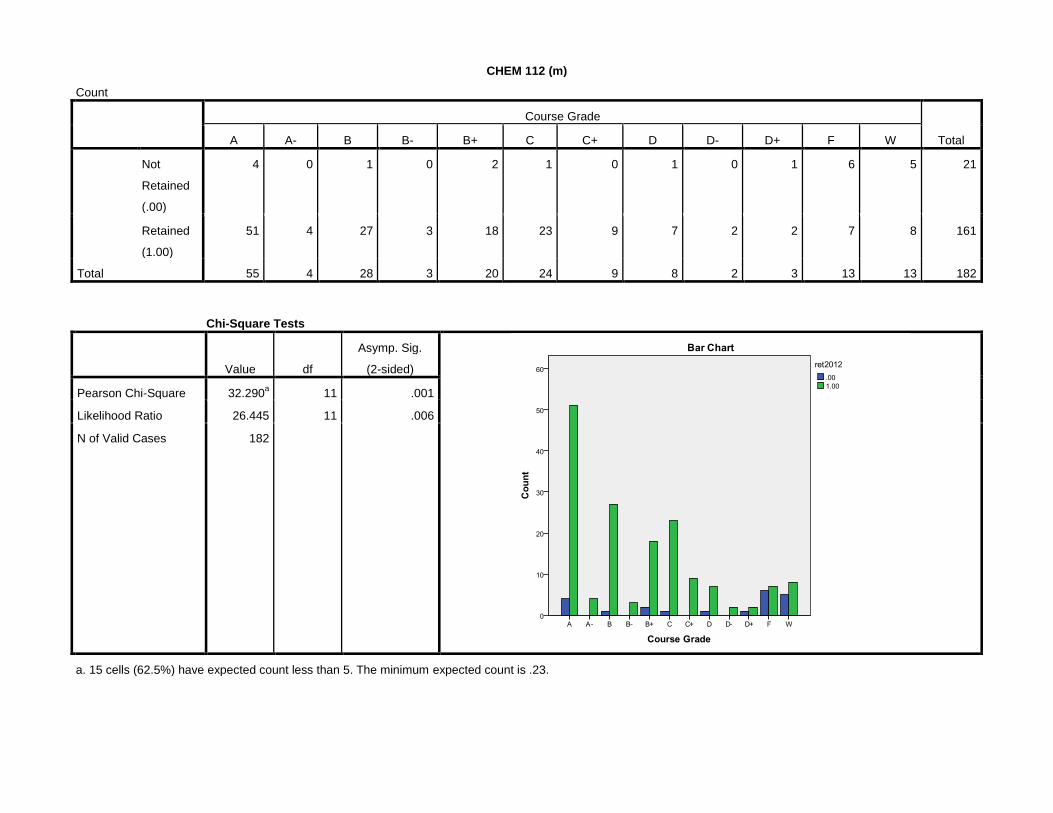
CHEM 112 (m)
Count
Course Grade
Total A A- B B- B+ C C+ D D- D+ F W
Not
Retained
(.00)
4 0 1 0 2 1 0 1 0 1 6 5 21
Retained
(1.00)
51 4 27 3 18 23 9 7 2 2 7 8 161
Total 55 4 28 3 20 24 9 8 2 3 13 13 182
Chi-Square Tests
Value df
Asymp. Sig.
(2-sided)
Pearson Chi-Square 32.290a 11 .001
Likelihood Ratio 26.445 11 .006
N of Valid Cases 182
a. 15 cells (62.5%) have expected count less than 5. The minimum expected count is .23.
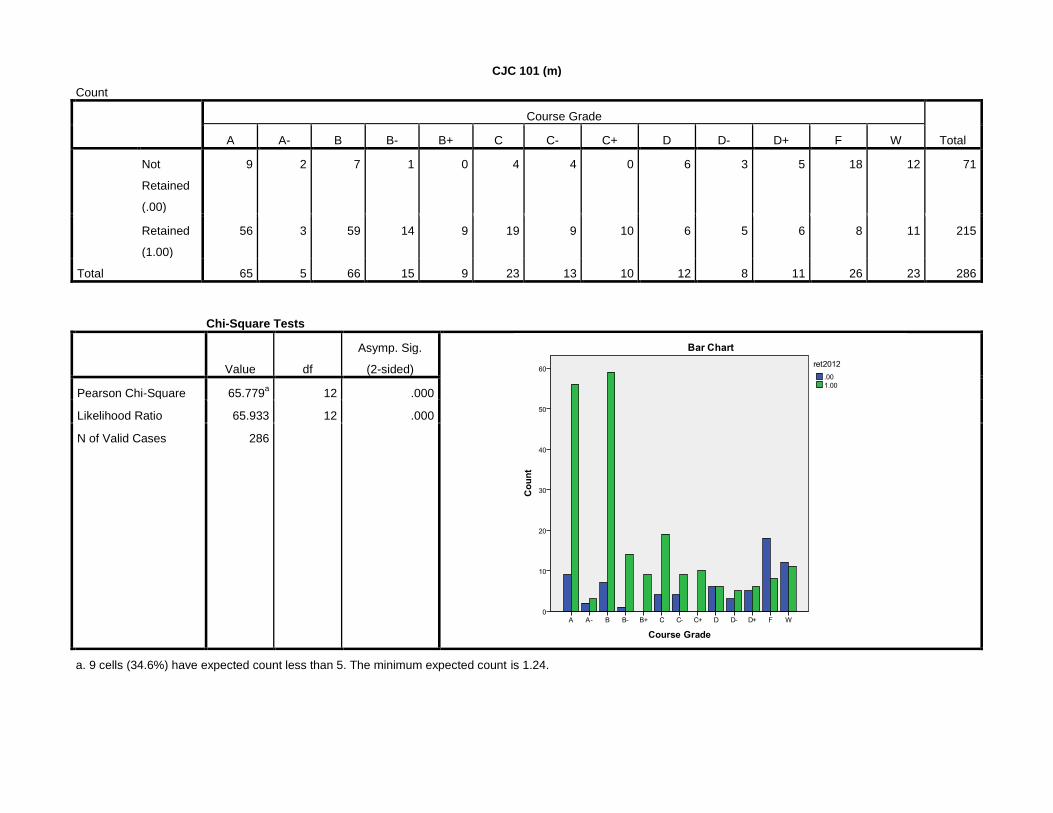
CJC 101 (m)
Count
Course Grade
Total A A- B B- B+ C C- C+ D D- D+ F W
Not
Retained
(.00)
9 2 7 1 0 4 4 0 6 3 5 18 12 71
Retained
(1.00)
56 3 59 14 9 19 9 10 6 5 6 8 11 215
Total 65 5 66 15 9 23 13 10 12 8 11 26 23 286
Chi-Square Tests
Value df
Asymp. Sig.
(2-sided)
Pearson Chi-Square 65.779a 12 .000
Likelihood Ratio 65.933 12 .000
N of Valid Cases 286
a. 9 cells (34.6%) have expected count less than 5. The minimum expected count is 1.24.
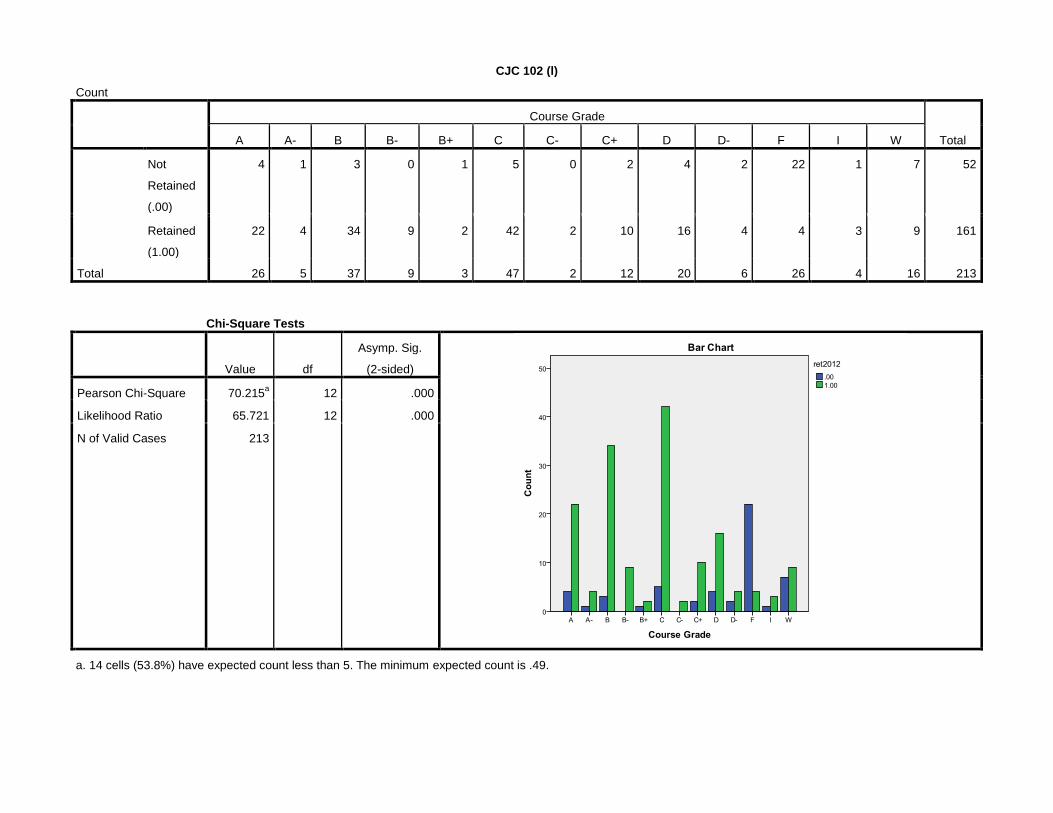
CJC 102 (l)
Count
Course Grade
Total A A- B B- B+ C C- C+ D D- F I W
Not
Retained
(.00)
4 1 3 0 1 5 0 2 4 2 22 1 7 52
Retained
(1.00)
22 4 34 9 2 42 2 10 16 4 4 3 9 161
Total 26 5 37 9 3 47 2 12 20 6 26 4 16 213
Chi-Square Tests
Value df
Asymp. Sig.
(2-sided)
Pearson Chi-Square 70.215a 12 .000
Likelihood Ratio 65.721 12 .000
N of Valid Cases 213
a. 14 cells (53.8%) have expected count less than 5. The minimum expected count is .49.

COMM 210 (m)
Count
Course Grade
Total A A- B B- B+ C C- C+ D D- D+ F I W
Not
Retained
(.00)
7 22 54 43 30 40 13 24 14 8 11 46 5 40 357
Retained
(1.00)
136 259 418 173 251 92 27 140 6 5 12 9 4 33 1565
Total 143 281 472 216 281 132 40 164 20 13 23 55 9 73 1922
Chi-Square Tests
Value df
Asymp. Sig.
(2-sided)
Pearson Chi-Square 374.933a 13 .000
Likelihood Ratio 308.201 13 .000
N of Valid Cases 1922
a. 4 cells (14.3%) have expected count less than 5. The minimum expected count is 1.67.

CS 104 (l)
Count
Course Grade
Total A B B- B+ C C- C+ D D+ F I W
Not
Retained
(.00)
2 6 3 0 6 2 2 2 1 8 0 2 34
Retained
(1.00)
31 28 21 12 8 4 9 1 3 0 2 0 119
Total 33 34 24 12 14 6 11 3 4 8 2 2 153
Chi-Square Tests
Value df
Asymp. Sig.
(2-sided)
Pearson Chi-Square 53.139a 11 .000
Likelihood Ratio 51.719 11 .000
N of Valid Cases 153
a. 14 cells (58.3%) have expected count less than 5. The minimum expected count is .44.

DANC 100 (m)
Count
Course Grade
Total A A- B B- B+ C C- C+ D D- D+ F I W
Not
Retained
(.00)
9 6 5 9 11 6 4 2 3 4 3 15 3 12 92
Retained
(1.00)
107 70 48 31 37 11 5 15 2 2 3 5 6 7 349
Total 116 76 53 40 48 17 9 17 5 6 6 20 9 19 441
Chi-Square Tests
Value df
Asymp. Sig.
(2-sided)
Pearson Chi-Square 102.505a 13 .000
Likelihood Ratio 90.562 13 .000
N of Valid Cases 441
a. 12 cells (42.9%) have expected count less than 5. The minimum expected count is 1.04.
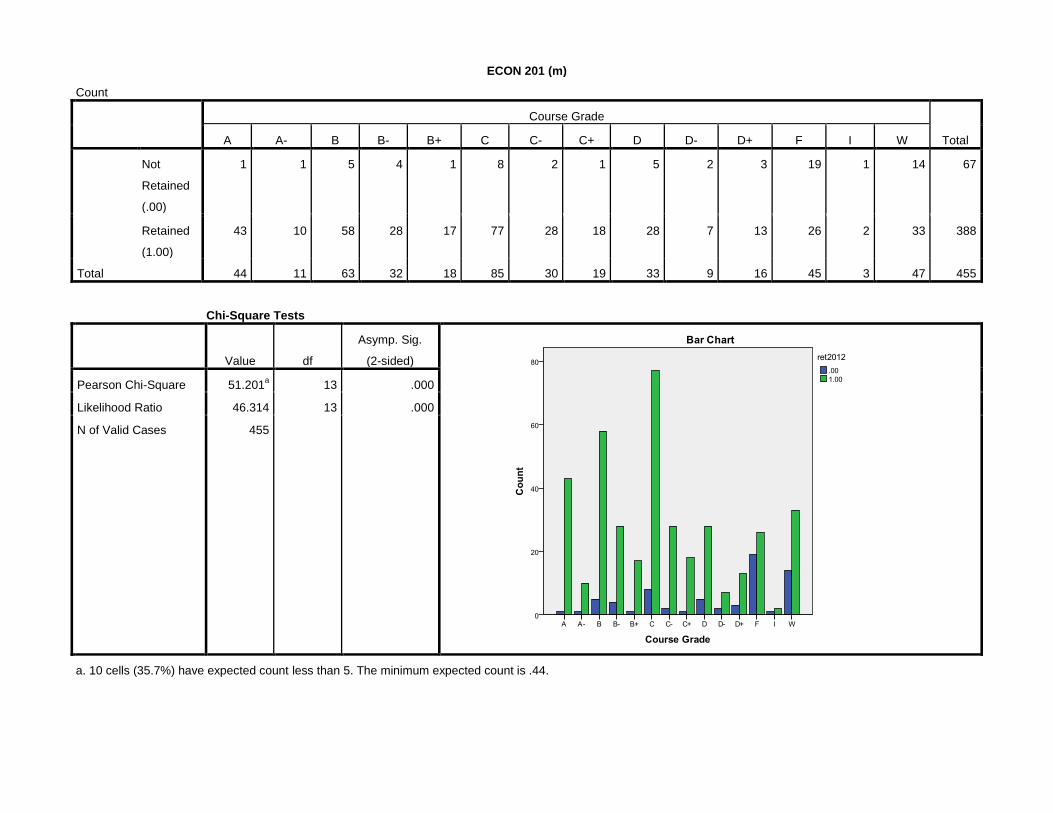
ECON 201 (m)
Count
Course Grade
Total A A- B B- B+ C C- C+ D D- D+ F I W
Not
Retained
(.00)
1 1 5 4 1 8 2 1 5 2 3 19 1 14 67
Retained
(1.00)
43 10 58 28 17 77 28 18 28 7 13 26 2 33 388
Total 44 11 63 32 18 85 30 19 33 9 16 45 3 47 455
Chi-Square Tests
Value df
Asymp. Sig.
(2-sided)
Pearson Chi-Square 51.201a 13 .000
Likelihood Ratio 46.314 13 .000
N of Valid Cases 455
a. 10 cells (35.7%) have expected count less than 5. The minimum expected count is .44.
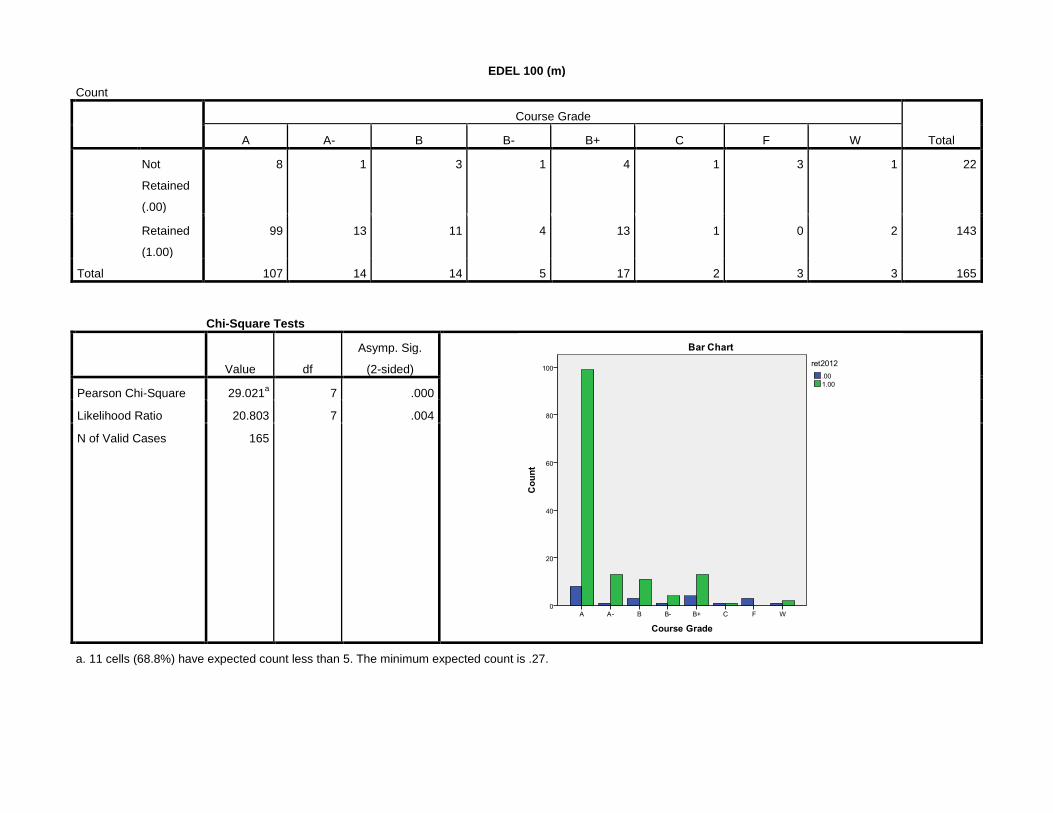
EDEL 100 (m)
Count
Course Grade
Total A A- B B- B+ C F W
Not
Retained
(.00)
8 1 3 1 4 1 3 1 22
Retained
(1.00)
99 13 11 4 13 1 0 2 143
Total 107 14 14 5 17 2 3 3 165
Chi-Square Tests
Value df
Asymp. Sig.
(2-sided)
Pearson Chi-Square 29.021a 7 .000
Likelihood Ratio 20.803 7 .004
N of Valid Cases 165
a. 11 cells (68.8%) have expected count less than 5. The minimum expected count is .27.

EDHI 200 (l)
Count
Course Grade
Total A A- B B- B+ C C- C+ CR D W
Not
Retained
(.00)
3 1 0 2 1 0 2 0 0 1 3 13
Retained
(1.00)
112 15 18 1 8 1 0 2 1 1 14 173
Total 115 16 18 3 9 1 2 2 1 2 17 186
Chi-Square Tests
Value df
Asymp. Sig.
(2-sided)
Pearson Chi-Square 57.009a 10 .000
Likelihood Ratio 30.255 10 .001
N of Valid Cases 186
a. 16 cells (72.7%) have expected count less than 5. The minimum expected count is .07.

EDPS 260 (m)
Count
Course Grade
Total A A- B B- B+ C C- C+ D D- D+ F W
Not
Retained
(.00)
6 2 6 3 0 2 1 0 1 1 0 4 2 28
Retained
(1.00)
67 27 30 8 15 8 3 11 0 0 2 1 1 173
Total 73 29 36 11 15 10 4 11 1 1 2 5 3 201
Chi-Square Tests
Value df
Asymp. Sig.
(2-sided)
Pearson Chi-Square 47.808a 12 .000
Likelihood Ratio 37.592 12 .000
N of Valid Cases 201
a. 17 cells (65.4%) have expected count less than 5. The minimum expected count is .14.

EDTE 120 (m)
Count
Course Grade
Total A A- B B+ C C- C+ F W
Not
Retained
(.00)
4 1 0 2 0 1 0 2 9 19
Retained
(1.00)
46 23 1 4 2 2 5 1 10 94
Total 50 24 1 6 2 3 5 3 19 113
Chi-Square Tests
Value df
Asymp. Sig.
(2-sided)
Pearson Chi-Square 26.907a 8 .001
Likelihood Ratio 24.607 8 .002
N of Valid Cases 113
a. 14 cells (77.8%) have expected count less than 5. The minimum expected count is .17.

ENG 103 (m)
Count
Course Grade
Total A A- B B- B+ C C- C+ D D- D+ F I W
Not
Retained
(.00)
29 54 87 41 68 65 15 40 18 7 4 98 1 68 595
Retained
(1.00)
327 308 418 134 266 106 13 60 8 3 1 16 1 14 1675
Total 356 362 505 175 334 171 28 100 26 10 5 114 2 82 2270
Chi-Square Tests
Value df
Asymp. Sig.
(2-sided)
Pearson Chi-Square 534.295a 13 .000
Likelihood Ratio 493.543 13 .000
N of Valid Cases 2270
a. 5 cells (17.9%) have expected count less than 5. The minimum expected count is .52.
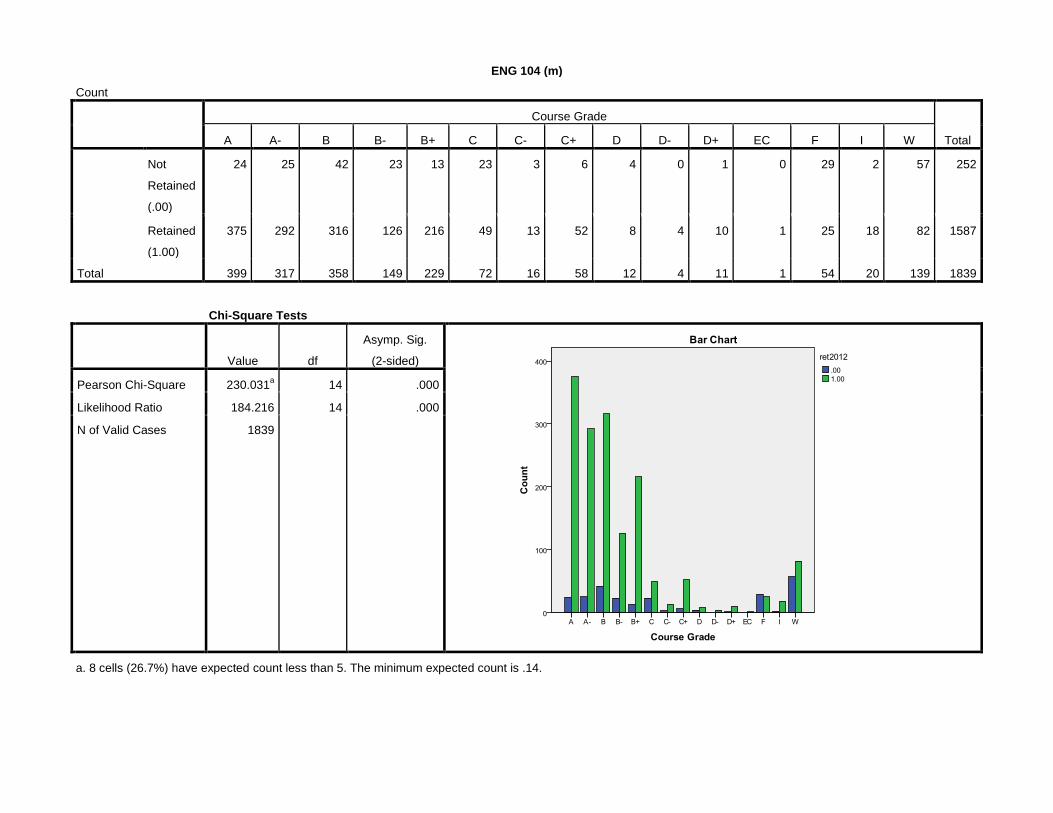
ENG 104 (m)
Count
Course Grade
Total A A- B B- B+ C C- C+ D D- D+ EC F I W
Not
Retained
(.00)
24 25 42 23 13 23 3 6 4 0 1 0 29 2 57 252
Retained
(1.00)
375 292 316 126 216 49 13 52 8 4 10 1 25 18 82 1587
Total 399 317 358 149 229 72 16 58 12 4 11 1 54 20 139 1839
Chi-Square Tests
Value df
Asymp. Sig.
(2-sided)
Pearson Chi-Square 230.031a 14 .000
Likelihood Ratio 184.216 14 .000
N of Valid Cases 1839
a. 8 cells (26.7%) have expected count less than 5. The minimum expected count is .14.
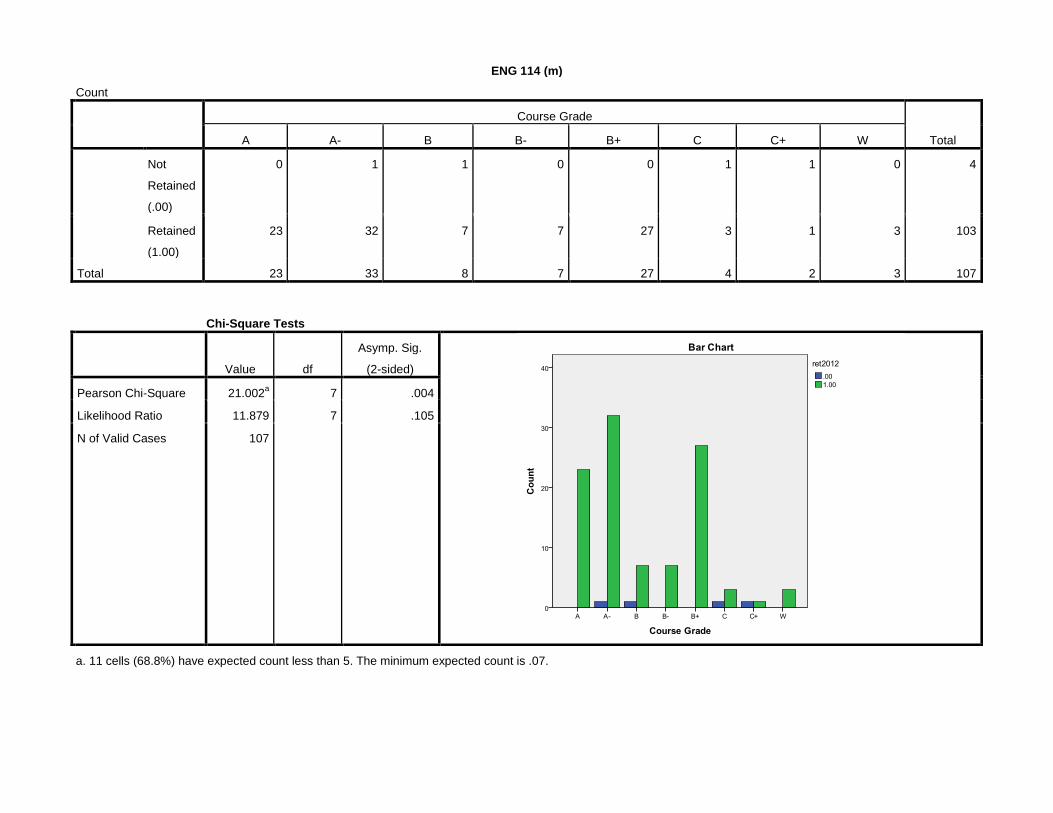
ENG 114 (m)
Count
Course Grade
Total A A- B B- B+ C C+ W
Not
Retained
(.00)
0 1 1 0 0 1 1 0 4
Retained
(1.00)
23 32 7 7 27 3 1 3 103
Total 23 33 8 7 27 4 2 3 107
Chi-Square Tests
Value df
Asymp. Sig.
(2-sided)
Pearson Chi-Square 21.002a 7 .004
Likelihood Ratio 11.879 7 .105
N of Valid Cases 107
a. 11 cells (68.8%) have expected count less than 5. The minimum expected count is .07.
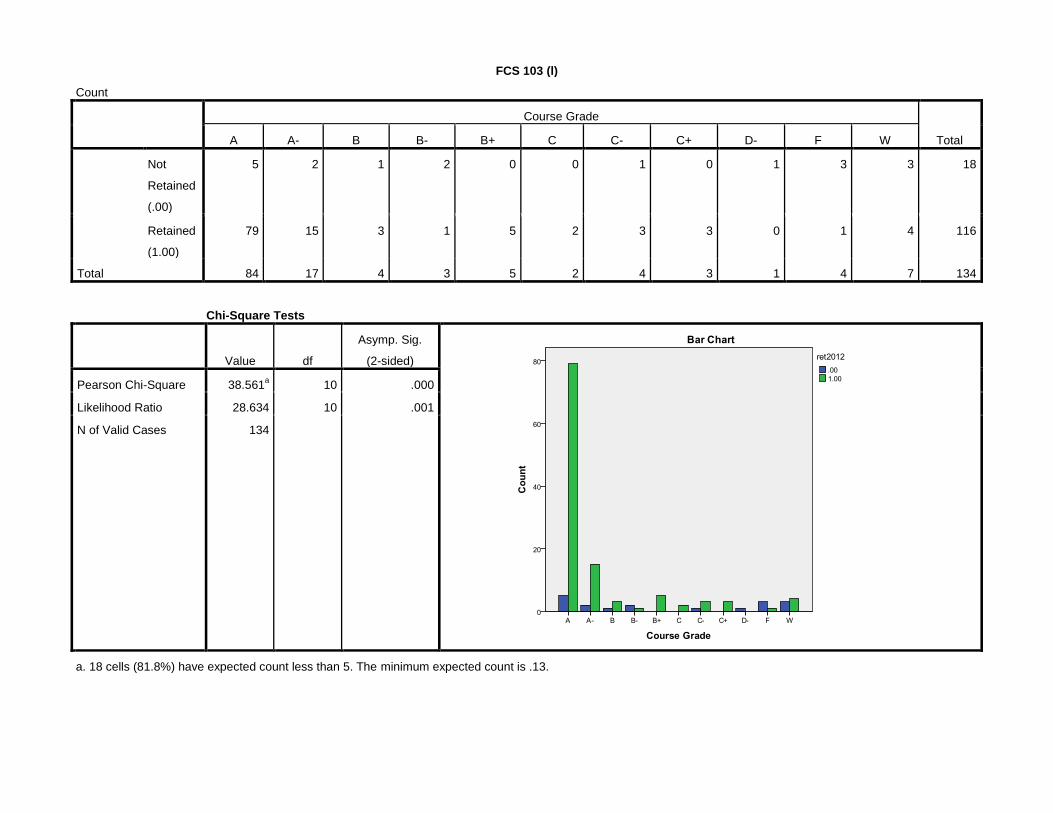
FCS 103 (l)
Count
Course Grade
Total A A- B B- B+ C C- C+ D- F W
Not
Retained
(.00)
5 2 1 2 0 0 1 0 1 3 3 18
Retained
(1.00)
79 15 3 1 5 2 3 3 0 1 4 116
Total 84 17 4 3 5 2 4 3 1 4 7 134
Chi-Square Tests
Value df
Asymp. Sig.
(2-sided)
Pearson Chi-Square 38.561a 10 .000
Likelihood Ratio 28.634 10 .001
N of Valid Cases 134
a. 18 cells (81.8%) have expected count less than 5. The minimum expected count is .13.

FCS 135 (m)
Count
Course Grade
Total A B C D F W
Not
Retained
(.00)
39 33 9 8 9 11 109
Retained
(1.00)
224 114 17 10 8 5 378
Total 263 147 26 18 17 16 487
Chi-Square Tests
Value df
Asymp. Sig.
(2-sided)
Pearson Chi-Square 44.860a 5 .000
Likelihood Ratio 38.878 5 .000
N of Valid Cases 487
a. 3 cells (25.0%) have expected count less than 5. The minimum expected count is 3.58.

FIN 101 (m)
Count
Course Grade
Total A B C D F W
Not
Retained
(.00)
37 78 78 14 58 43 308
Retained
(1.00)
437 583 276 41 20 38 1395
Total 474 661 354 55 78 81 1703
Chi-Square Tests
Value df
Asymp. Sig.
(2-sided)
Pearson Chi-Square 290.884a 5 .000
Likelihood Ratio 233.899 5 .000
N of Valid Cases 1703
a. 0 cells (.0%) have expected count less than 5. The minimum expected count is 9.95.
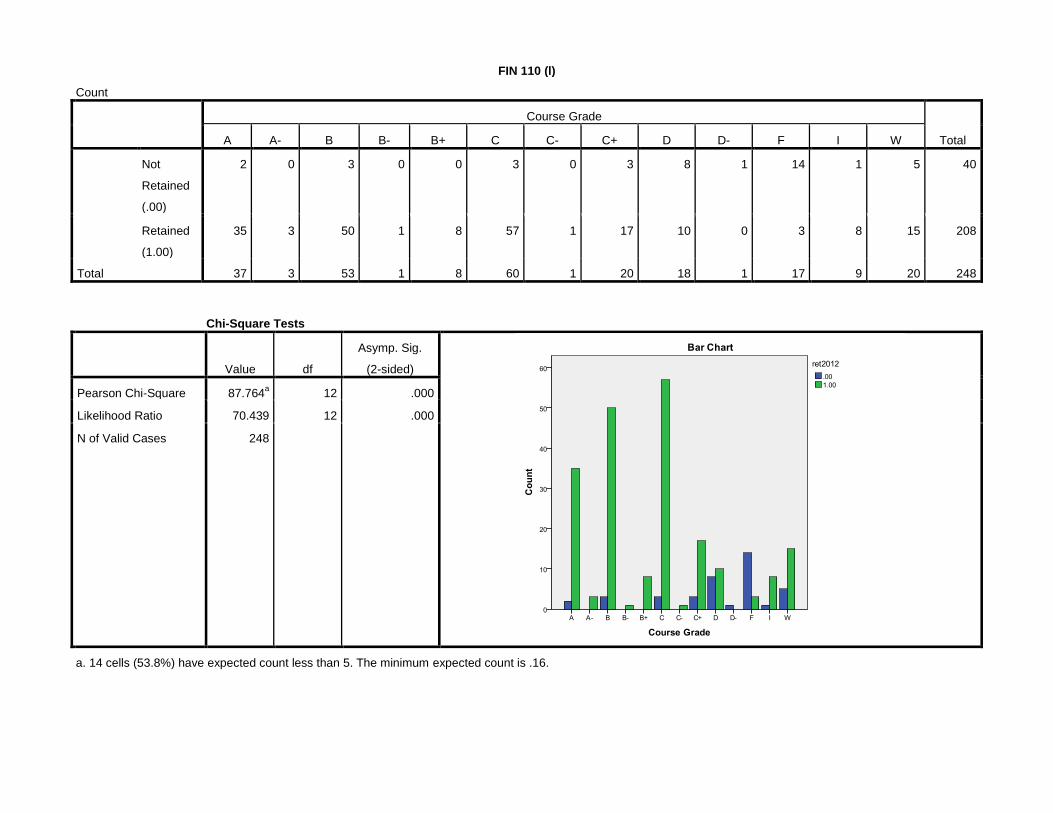
FIN 110 (l)
Count
Course Grade
Total A A- B B- B+ C C- C+ D D- F I W
Not
Retained
(.00)
2 0 3 0 0 3 0 3 8 1 14 1 5 40
Retained
(1.00)
35 3 50 1 8 57 1 17 10 0 3 8 15 208
Total 37 3 53 1 8 60 1 20 18 1 17 9 20 248
Chi-Square Tests
Value df
Asymp. Sig.
(2-sided)
Pearson Chi-Square 87.764a 12 .000
Likelihood Ratio 70.439 12 .000
N of Valid Cases 248
a. 14 cells (53.8%) have expected count less than 5. The minimum expected count is .16.

GEOG 101 (m)
Count
Course Grade
Total A A- B B- B+ C C- C+ D D- D+ F I W
Not
Retained
(.00)
1 4 4 3 1 3 2 2 3 7 1 2 0 6 39
Retained
(1.00)
21 17 34 32 16 23 2 10 6 5 2 8 1 8 185
Total 22 21 38 35 17 26 4 12 9 12 3 10 1 14 224
Chi-Square Tests
Value df
Asymp. Sig.
(2-sided)
Pearson Chi-Square 33.533a 13 .001
Likelihood Ratio 29.224 13 .006
N of Valid Cases 224
a. 15 cells (53.6%) have expected count less than 5. The minimum expected count is .17.
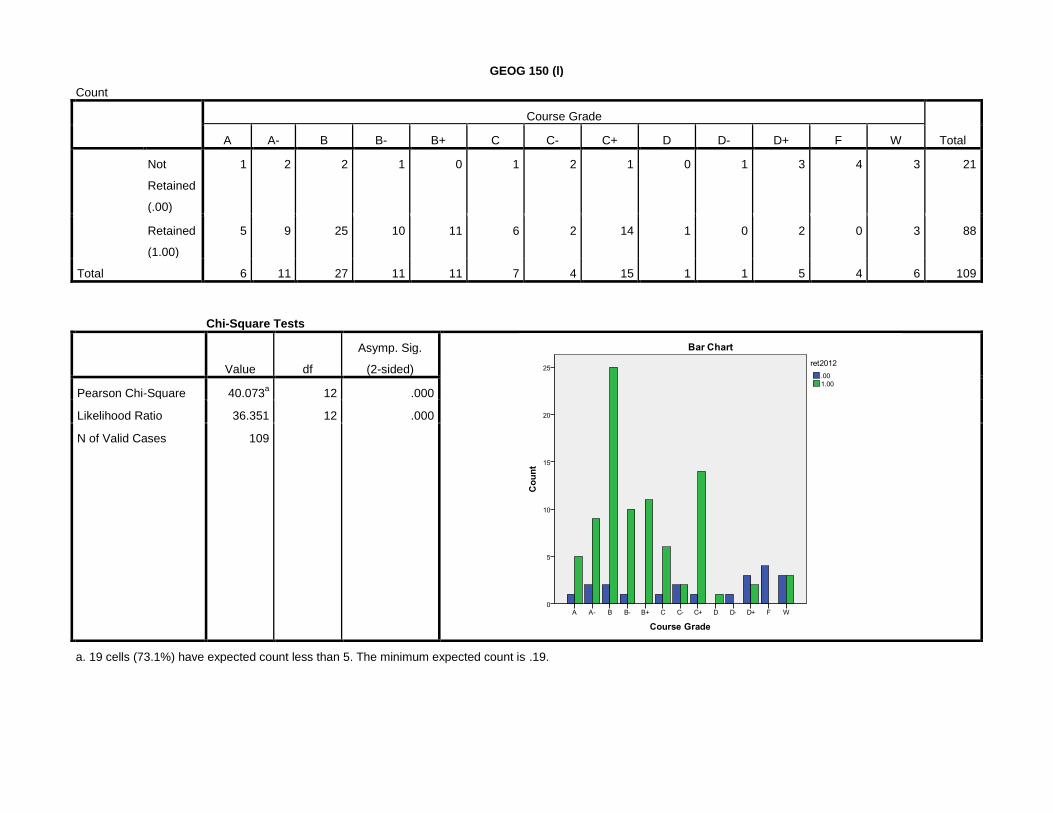
GEOG 150 (l)
Count
Course Grade
Total A A- B B- B+ C C- C+ D D- D+ F W
Not
Retained
(.00)
1 2 2 1 0 1 2 1 0 1 3 4 3 21
Retained
(1.00)
5 9 25 10 11 6 2 14 1 0 2 0 3 88
Total 6 11 27 11 11 7 4 15 1 1 5 4 6 109
Chi-Square Tests
Value df
Asymp. Sig.
(2-sided)
Pearson Chi-Square 40.073a 12 .000
Likelihood Ratio 36.351 12 .000
N of Valid Cases 109
a. 19 cells (73.1%) have expected count less than 5. The minimum expected count is .19.
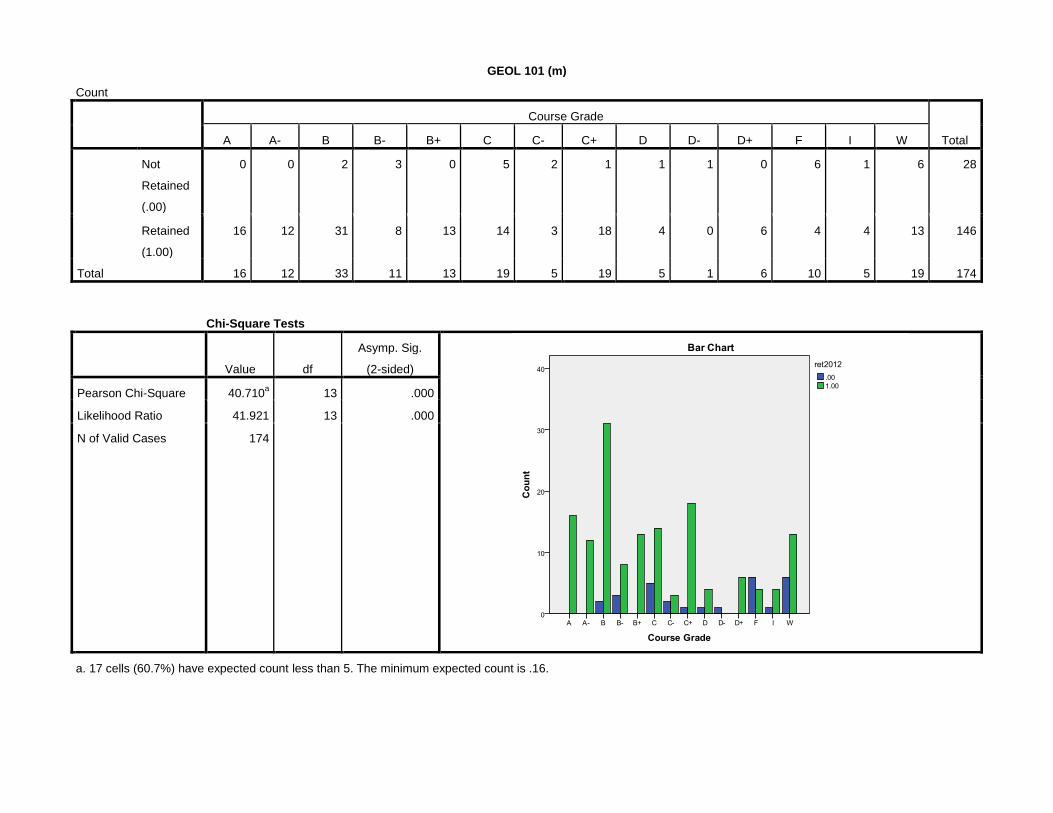
GEOL 101 (m)
Count
Course Grade
Total A A- B B- B+ C C- C+ D D- D+ F I W
Not
Retained
(.00)
0 0 2 3 0 5 2 1 1 1 0 6 1 6 28
Retained
(1.00)
16 12 31 8 13 14 3 18 4 0 6 4 4 13 146
Total 16 12 33 11 13 19 5 19 5 1 6 10 5 19 174
Chi-Square Tests
Value df
Asymp. Sig.
(2-sided)
Pearson Chi-Square 40.710a 13 .000
Likelihood Ratio 41.921 13 .000
N of Valid Cases 174
a. 17 cells (60.7%) have expected count less than 5. The minimum expected count is .16.
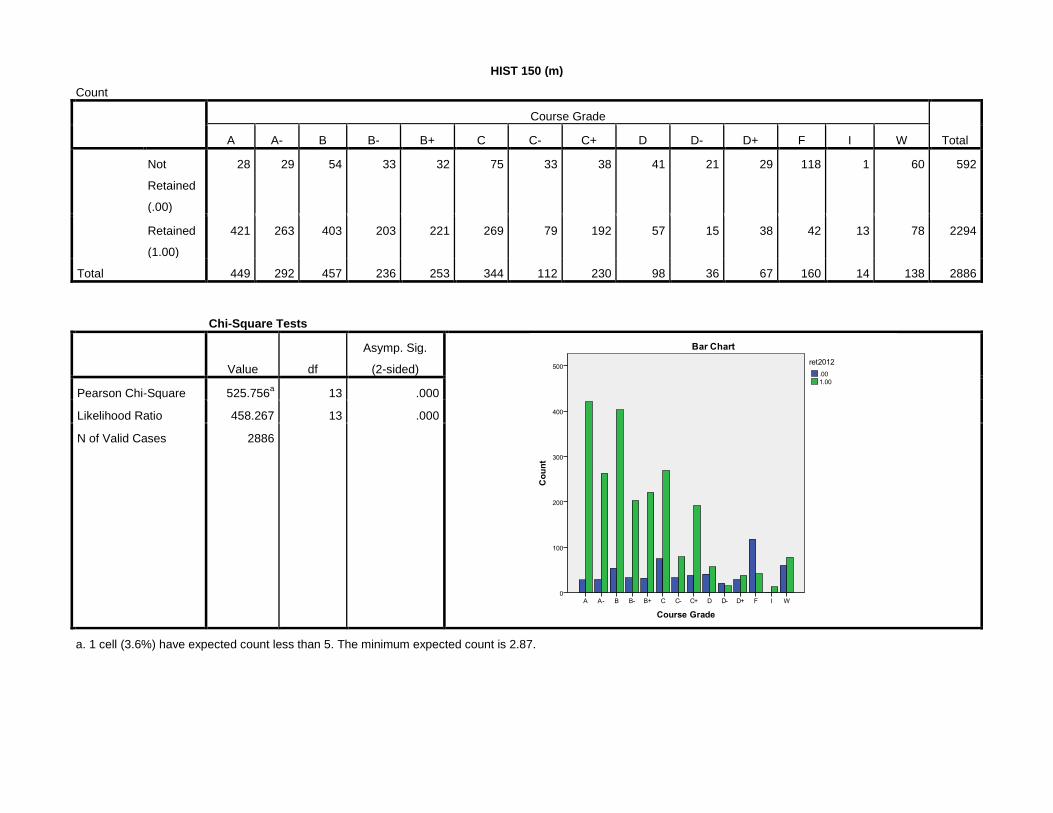
HIST 150 (m)
Count
Course Grade
Total A A- B B- B+ C C- C+ D D- D+ F I W
Not
Retained
(.00)
28 29 54 33 32 75 33 38 41 21 29 118 1 60 592
Retained
(1.00)
421 263 403 203 221 269 79 192 57 15 38 42 13 78 2294
Total 449 292 457 236 253 344 112 230 98 36 67 160 14 138 2886
Chi-Square Tests
Value df
Asymp. Sig.
(2-sided)
Pearson Chi-Square 525.756a 13 .000
Likelihood Ratio 458.267 13 .000
N of Valid Cases 2886
a. 1 cell (3.6%) have expected count less than 5. The minimum expected count is 2.87.

HIST 201 (m)
Count
Course Grade
Total A A- B B- B+ C C- C+ D D- D+ F I W
Not
Retained
(.00)
4 0 6 4 1 3 0 5 3 1 0 9 0 3 39
Retained
(1.00)
39 21 27 16 16 8 4 11 2 1 4 2 2 9 162
Total 43 21 33 20 17 11 4 16 5 2 4 11 2 12 201
Chi-Square Tests
Value df
Asymp. Sig.
(2-sided)
Pearson Chi-Square 48.273a 13 .000
Likelihood Ratio 46.063 13 .000
N of Valid Cases 201
a. 17 cells (60.7%) have expected count less than 5. The minimum expected count is .39.
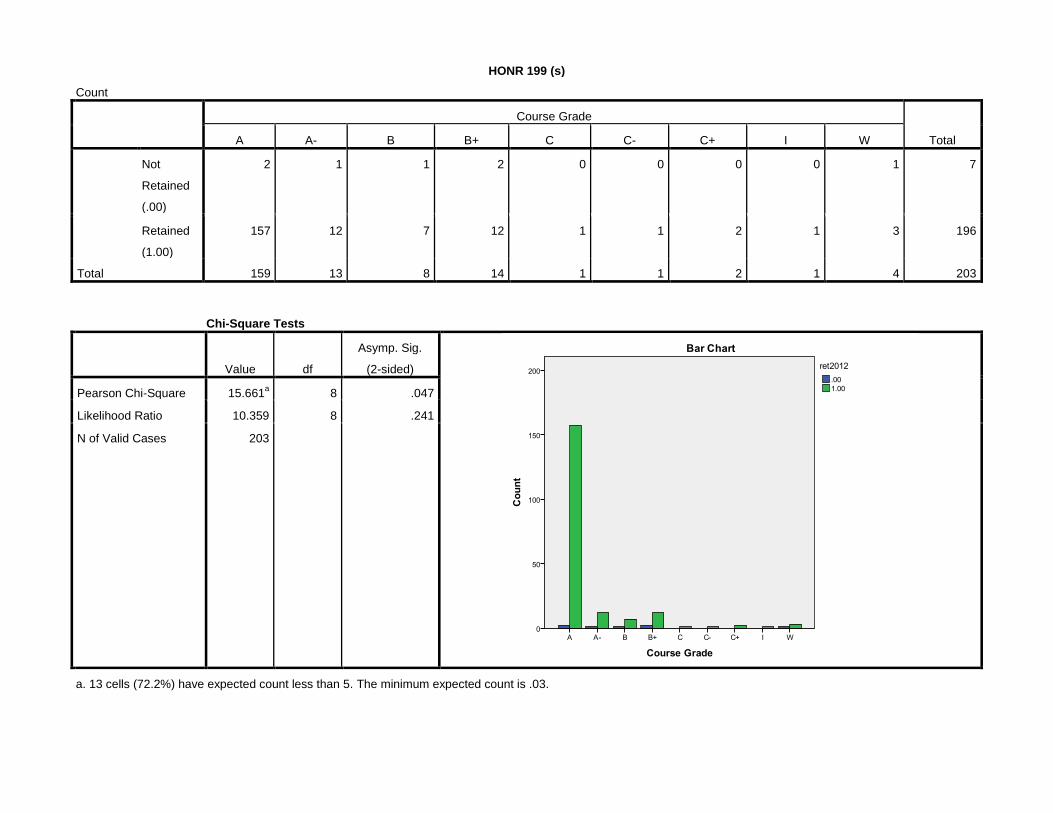
HONR 199 (s)
Count
Course Grade
Total A A- B B+ C C- C+ I W
Not
Retained
(.00)
2 1 1 2 0 0 0 0 1 7
Retained
(1.00)
157 12 7 12 1 1 2 1 3 196
Total 159 13 8 14 1 1 2 1 4 203
Chi-Square Tests
Value df
Asymp. Sig.
(2-sided)
Pearson Chi-Square 15.661a 8 .047
Likelihood Ratio 10.359 8 .241
N of Valid Cases 203
a. 13 cells (72.2%) have expected count less than 5. The minimum expected count is .03.
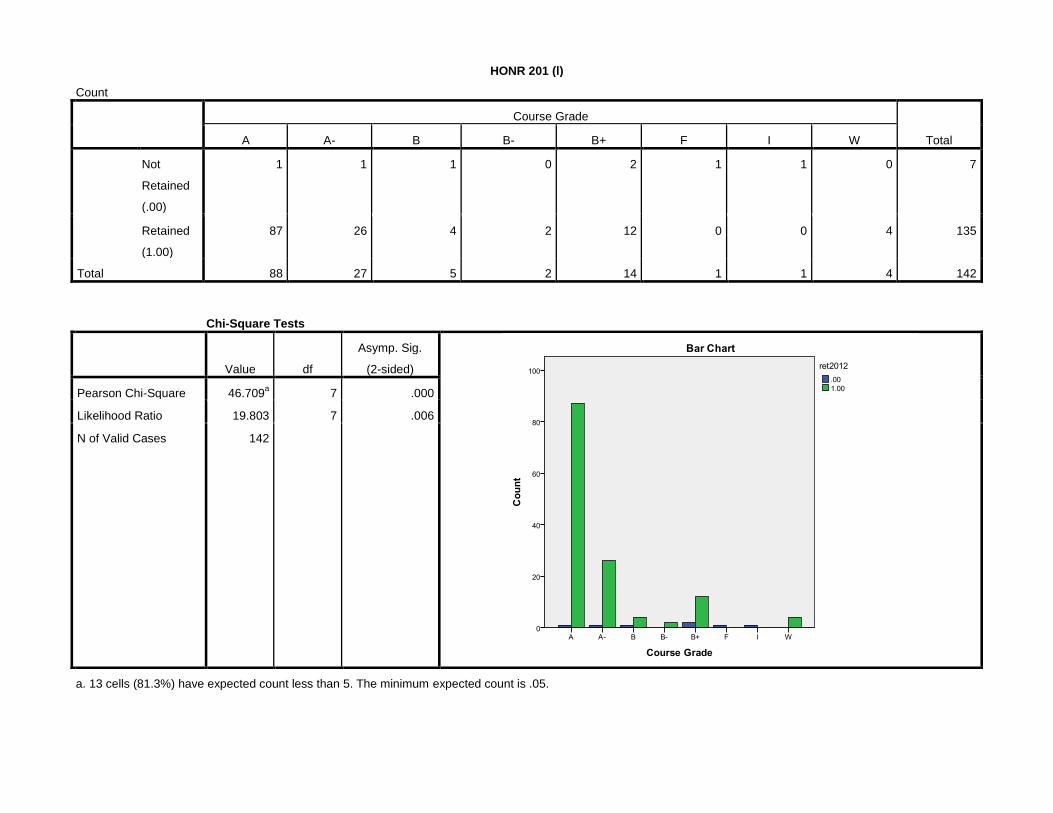
HONR 201 (l)
Count
Course Grade
Total A A- B B- B+ F I W
Not
Retained
(.00)
1 1 1 0 2 1 1 0 7
Retained
(1.00)
87 26 4 2 12 0 0 4 135
Total 88 27 5 2 14 1 1 4 142
Chi-Square Tests
Value df
Asymp. Sig.
(2-sided)
Pearson Chi-Square 46.709a 7 .000
Likelihood Ratio 19.803 7 .006
N of Valid Cases 142
a. 13 cells (81.3%) have expected count less than 5. The minimum expected count is .05.
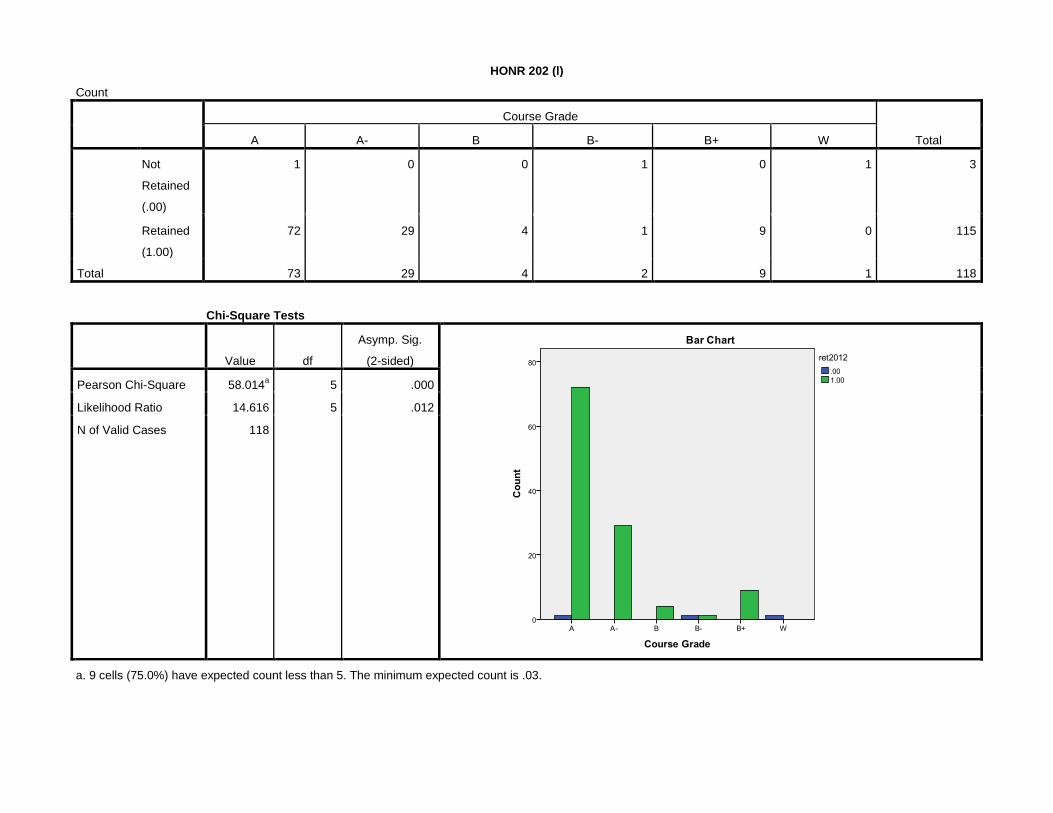
HONR 202 (l)
Count
Course Grade
Total A A- B B- B+ W
Not
Retained
(.00)
1 0 0 1 0 1 3
Retained
(1.00)
72 29 4 1 9 0 115
Total 73 29 4 2 9 1 118
Chi-Square Tests
Value df
Asymp. Sig.
(2-sided)
Pearson Chi-Square 58.014a 5 .000
Likelihood Ratio 14.616 5 .012
N of Valid Cases 118
a. 9 cells (75.0%) have expected count less than 5. The minimum expected count is .03.
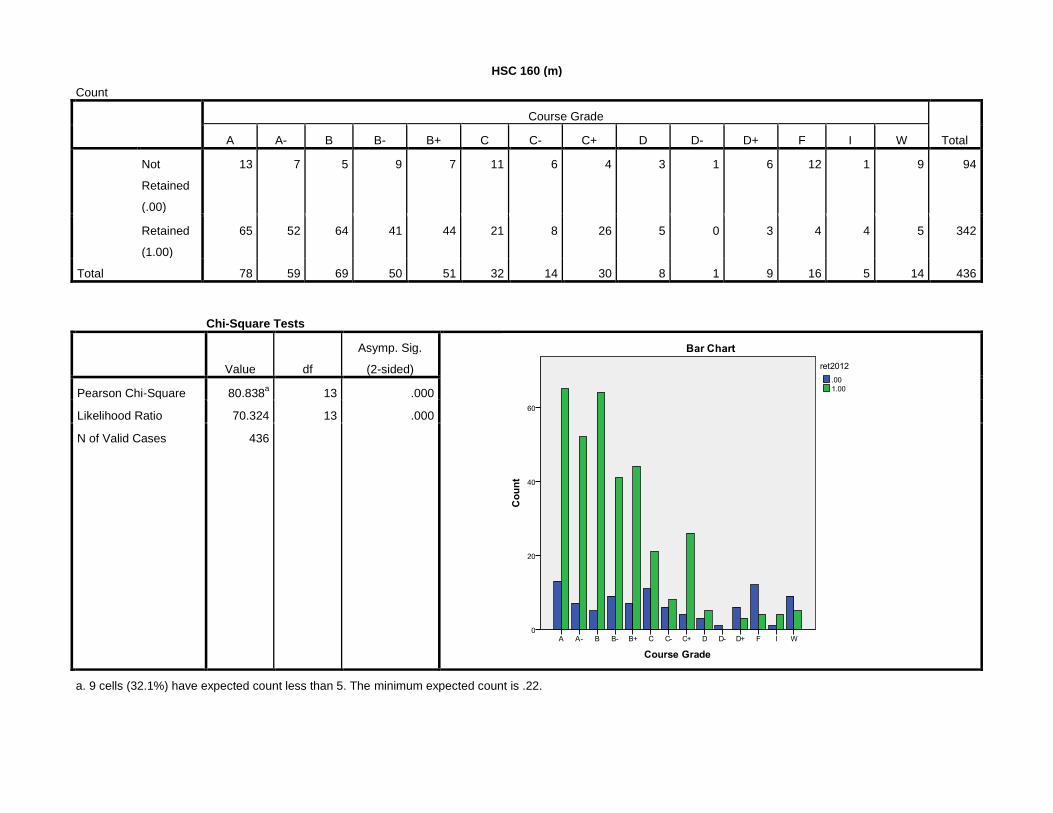
HSC 160 (m)
Count
Course Grade
Total A A- B B- B+ C C- C+ D D- D+ F I W
Not
Retained
(.00)
13 7 5 9 7 11 6 4 3 1 6 12 1 9 94
Retained
(1.00)
65 52 64 41 44 21 8 26 5 0 3 4 4 5 342
Total 78 59 69 50 51 32 14 30 8 1 9 16 5 14 436
Chi-Square Tests
Value df
Asymp. Sig.
(2-sided)
Pearson Chi-Square 80.838a 13 .000
Likelihood Ratio 70.324 13 .000
N of Valid Cases 436
a. 9 cells (32.1%) have expected count less than 5. The minimum expected count is .22.
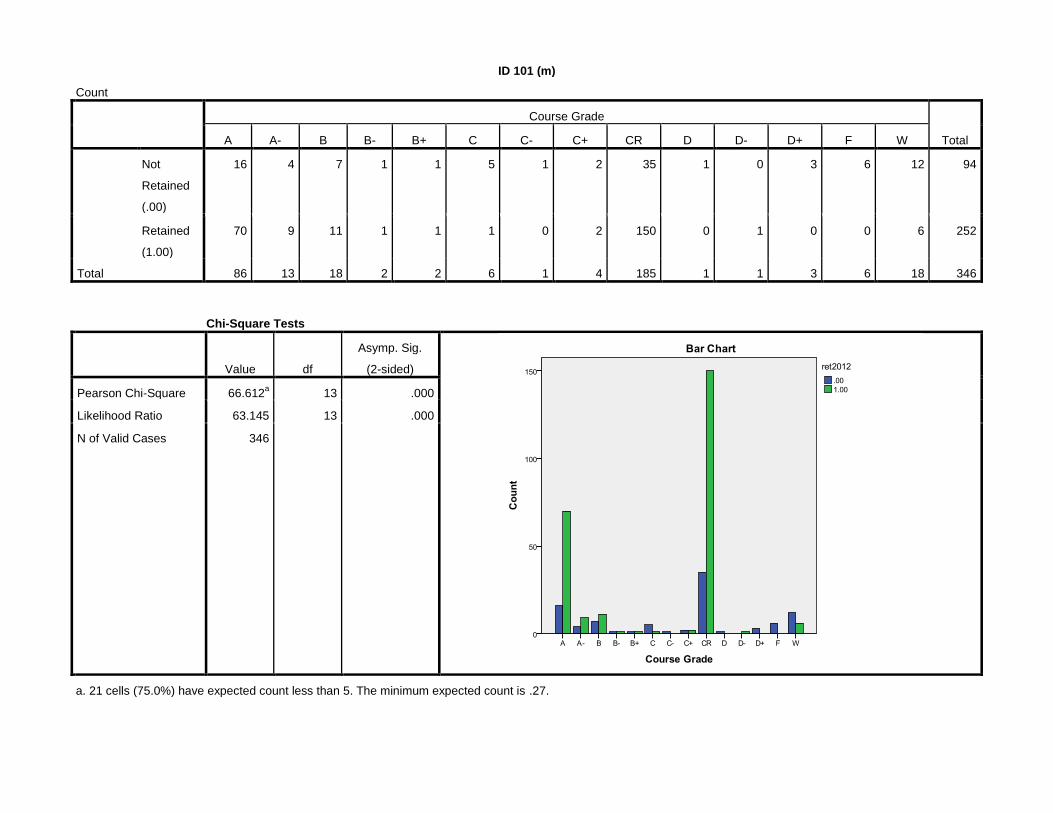
ID 101 (m)
Count
Course Grade
Total A A- B B- B+ C C- C+ CR D D- D+ F W
Not
Retained
(.00)
16 4 7 1 1 5 1 2 35 1 0 3 6 12 94
Retained
(1.00)
70 9 11 1 1 1 0 2 150 0 1 0 0 6 252
Total 86 13 18 2 2 6 1 4 185 1 1 3 6 18 346
Chi-Square Tests
Value df
Asymp. Sig.
(2-sided)
Pearson Chi-Square 66.612a 13 .000
Likelihood Ratio 63.145 13 .000
N of Valid Cases 346
a. 21 cells (75.0%) have expected count less than 5. The minimum expected count is .27.
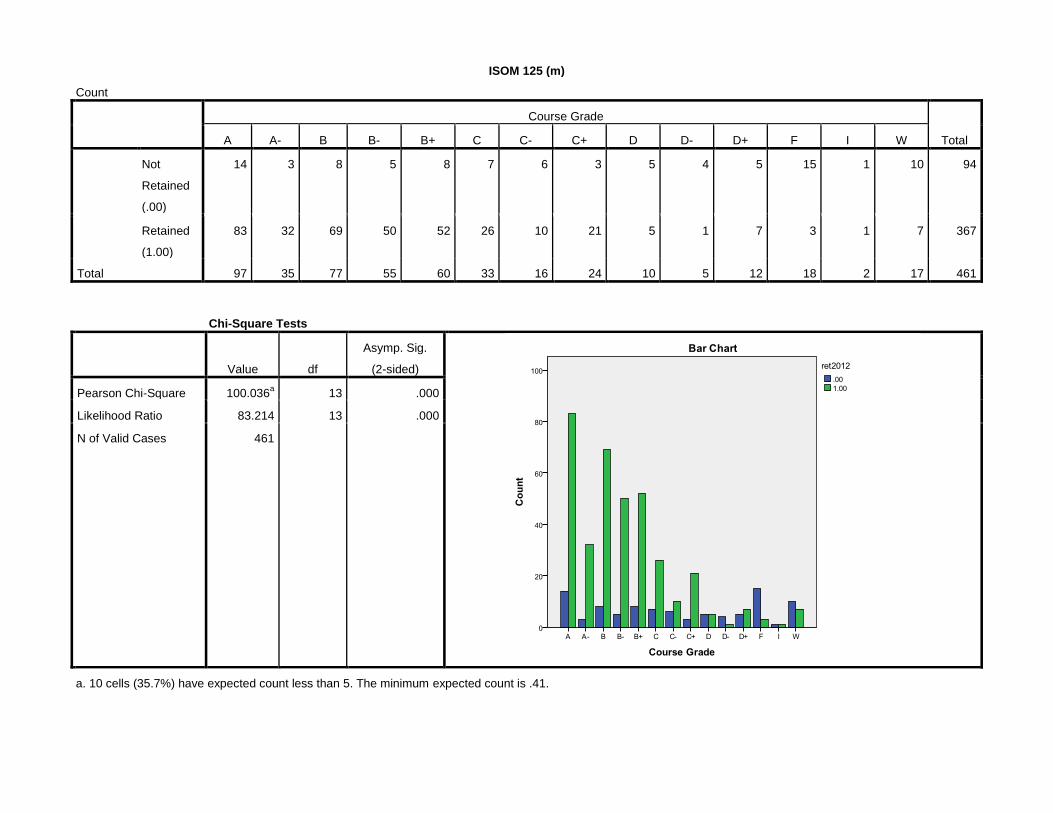
ISOM 125 (m)
Count
Course Grade
Total A A- B B- B+ C C- C+ D D- D+ F I W
Not
Retained
(.00)
14 3 8 5 8 7 6 3 5 4 5 15 1 10 94
Retained
(1.00)
83 32 69 50 52 26 10 21 5 1 7 3 1 7 367
Total 97 35 77 55 60 33 16 24 10 5 12 18 2 17 461
Chi-Square Tests
Value df
Asymp. Sig.
(2-sided)
Pearson Chi-Square 100.036a 13 .000
Likelihood Ratio 83.214 13 .000
N of Valid Cases 461
a. 10 cells (35.7%) have expected count less than 5. The minimum expected count is .41.

ISOM 135 (m)
Count
Course Grade
Total A A- B B- B+ C C- C+ D D- D+ F I W
Not
Retained
(.00)
1 0 8 1 0 3 3 1 1 0 1 8 0 2 29
Retained
(1.00)
42 9 56 18 12 34 4 17 2 1 4 4 2 4 209
Total 43 9 64 19 12 37 7 18 3 1 5 12 2 6 238
Chi-Square Tests
Value df
Asymp. Sig.
(2-sided)
Pearson Chi-Square 52.898a 13 .000
Likelihood Ratio 40.995 13 .000
N of Valid Cases 238
a. 16 cells (57.1%) have expected count less than 5. The minimum expected count is .12.
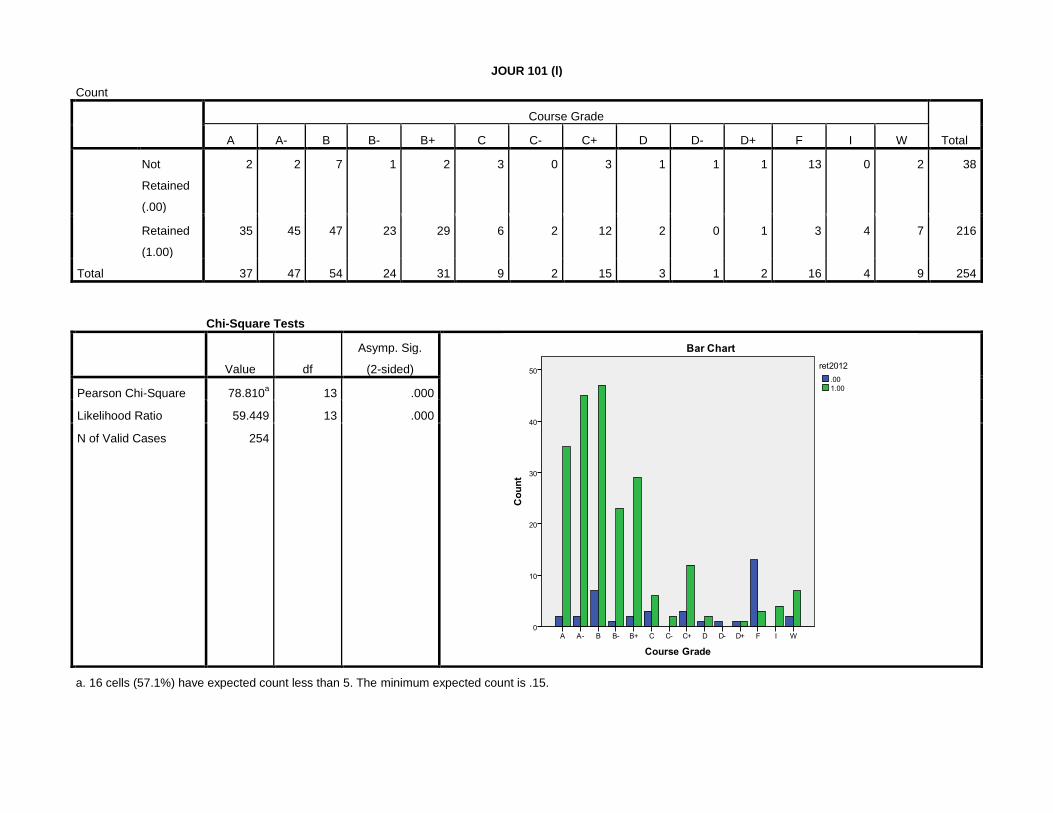
JOUR 101 (l)
Count
Course Grade
Total A A- B B- B+ C C- C+ D D- D+ F I W
Not
Retained
(.00)
2 2 7 1 2 3 0 3 1 1 1 13 0 2 38
Retained
(1.00)
35 45 47 23 29 6 2 12 2 0 1 3 4 7 216
Total 37 47 54 24 31 9 2 15 3 1 2 16 4 9 254
Chi-Square Tests
Value df
Asymp. Sig.
(2-sided)
Pearson Chi-Square 78.810a 13 .000
Likelihood Ratio 59.449 13 .000
N of Valid Cases 254
a. 16 cells (57.1%) have expected count less than 5. The minimum expected count is .15.
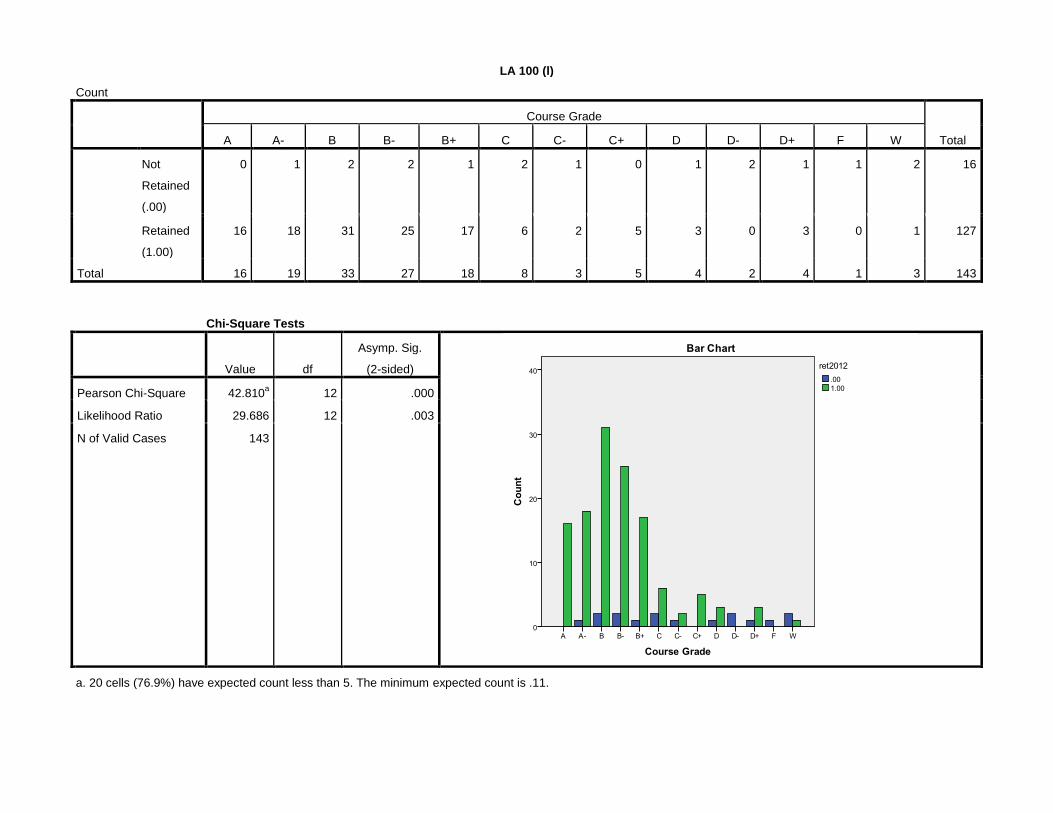
LA 100 (l)
Count
Course Grade
Total A A- B B- B+ C C- C+ D D- D+ F W
Not
Retained
(.00)
0 1 2 2 1 2 1 0 1 2 1 1 2 16
Retained
(1.00)
16 18 31 25 17 6 2 5 3 0 3 0 1 127
Total 16 19 33 27 18 8 3 5 4 2 4 1 3 143
Chi-Square Tests
Value df
Asymp. Sig.
(2-sided)
Pearson Chi-Square 42.810a 12 .000
Likelihood Ratio 29.686 12 .003
N of Valid Cases 143
a. 20 cells (76.9%) have expected count less than 5. The minimum expected count is .11.
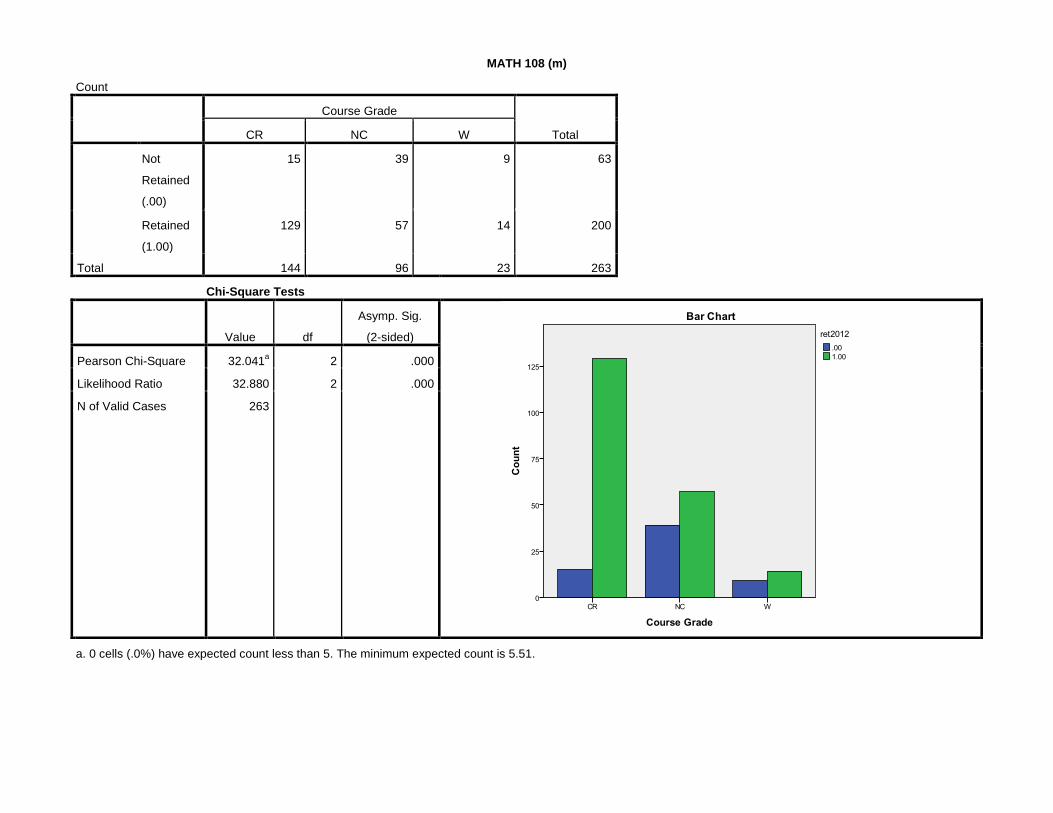
MATH 108 (m)
Count
Course Grade
Total CR NC W
Not
Retained
(.00)
15 39 9 63
Retained
(1.00)
129 57 14 200
Total 144 96 23 263
Chi-Square Tests
Value df
Asymp. Sig.
(2-sided)
Pearson Chi-Square 32.041a 2 .000
Likelihood Ratio 32.880 2 .000
N of Valid Cases 263
a. 0 cells (.0%) have expected count less than 5. The minimum expected count is 5.51.
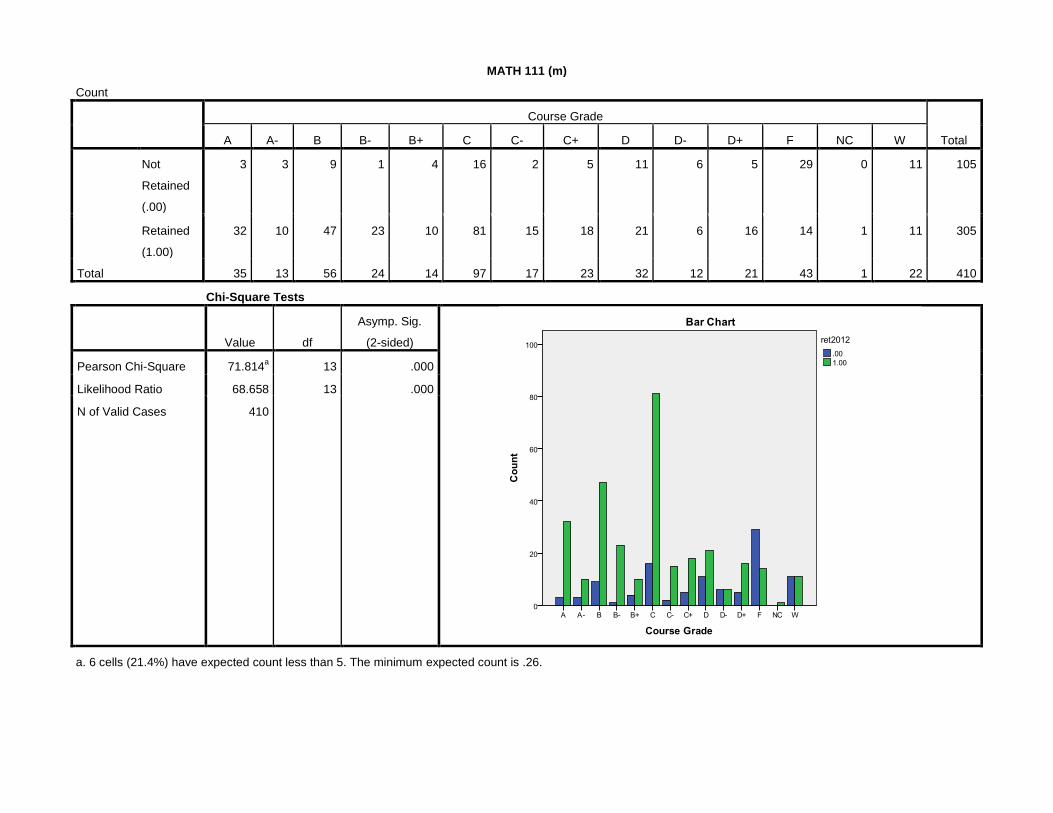
MATH 111 (m)
Count
Course Grade
Total A A- B B- B+ C C- C+ D D- D+ F NC W
Not
Retained
(.00)
3 3 9 1 4 16 2 5 11 6 5 29 0 11 105
Retained
(1.00)
32 10 47 23 10 81 15 18 21 6 16 14 1 11 305
Total 35 13 56 24 14 97 17 23 32 12 21 43 1 22 410
Chi-Square Tests
Value df
Asymp. Sig.
(2-sided)
Pearson Chi-Square 71.814a 13 .000
Likelihood Ratio 68.658 13 .000
N of Valid Cases 410
a. 6 cells (21.4%) have expected count less than 5. The minimum expected count is .26.
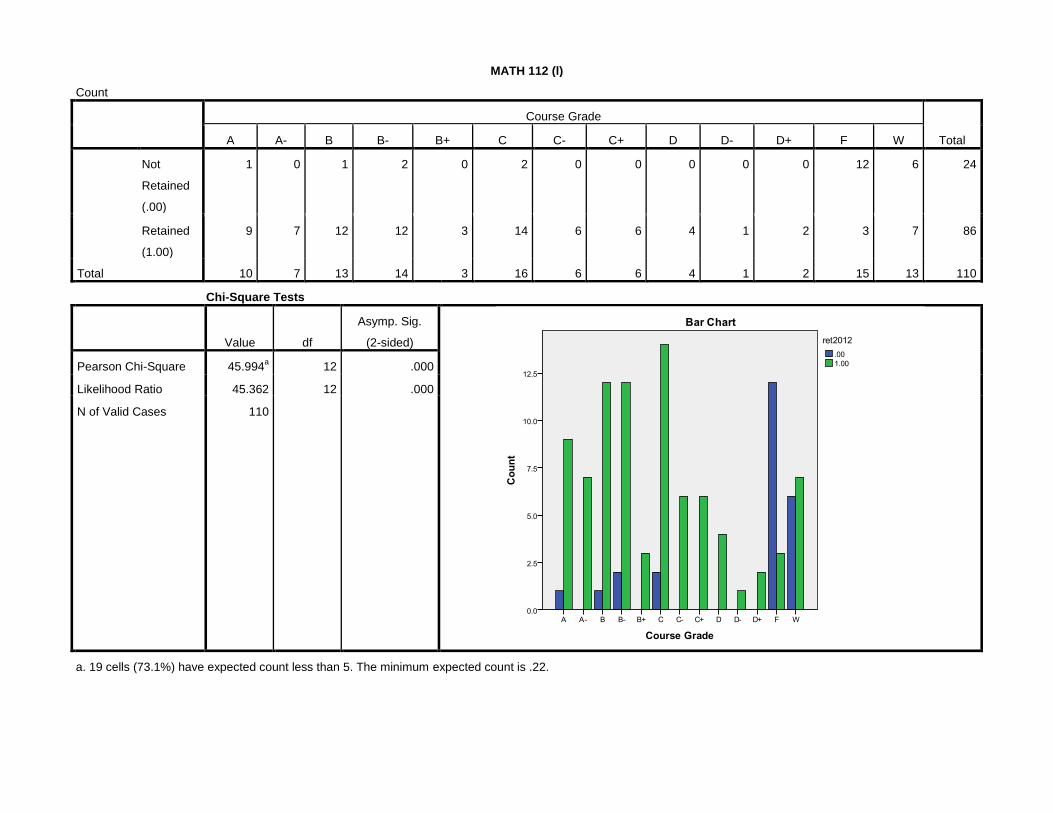
MATH 112 (l)
Count
Course Grade
Total A A- B B- B+ C C- C+ D D- D+ F W
Not
Retained
(.00)
1 0 1 2 0 2 0 0 0 0 0 12 6 24
Retained
(1.00)
9 7 12 12 3 14 6 6 4 1 2 3 7 86
Total 10 7 13 14 3 16 6 6 4 1 2 15 13 110
Chi-Square Tests
Value df
Asymp. Sig.
(2-sided)
Pearson Chi-Square 45.994a 12 .000
Likelihood Ratio 45.362 12 .000
N of Valid Cases 110
a. 19 cells (73.1%) have expected count less than 5. The minimum expected count is .22.
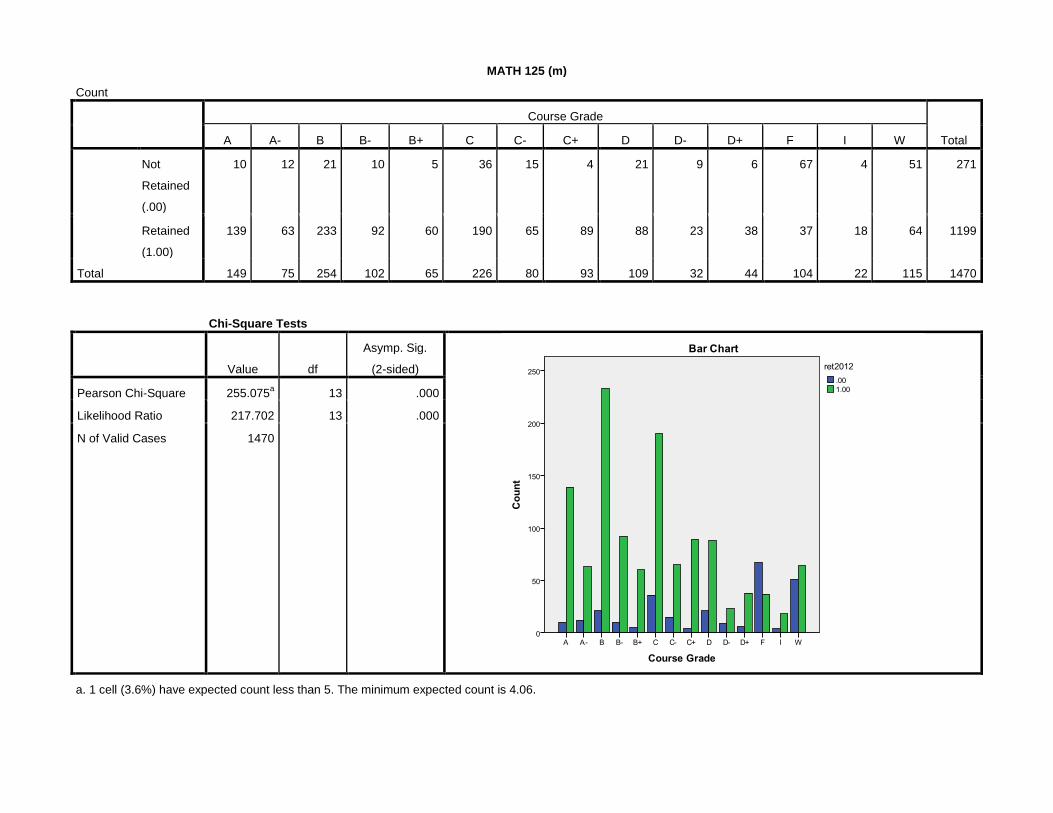
MATH 125 (m)
Count
Course Grade
Total A A- B B- B+ C C- C+ D D- D+ F I W
Not
Retained
(.00)
10 12 21 10 5 36 15 4 21 9 6 67 4 51 271
Retained
(1.00)
139 63 233 92 60 190 65 89 88 23 38 37 18 64 1199
Total 149 75 254 102 65 226 80 93 109 32 44 104 22 115 1470
Chi-Square Tests
Value df
Asymp. Sig.
(2-sided)
Pearson Chi-Square 255.075a 13 .000
Likelihood Ratio 217.702 13 .000
N of Valid Cases 1470
a. 1 cell (3.6%) have expected count less than 5. The minimum expected count is 4.06.
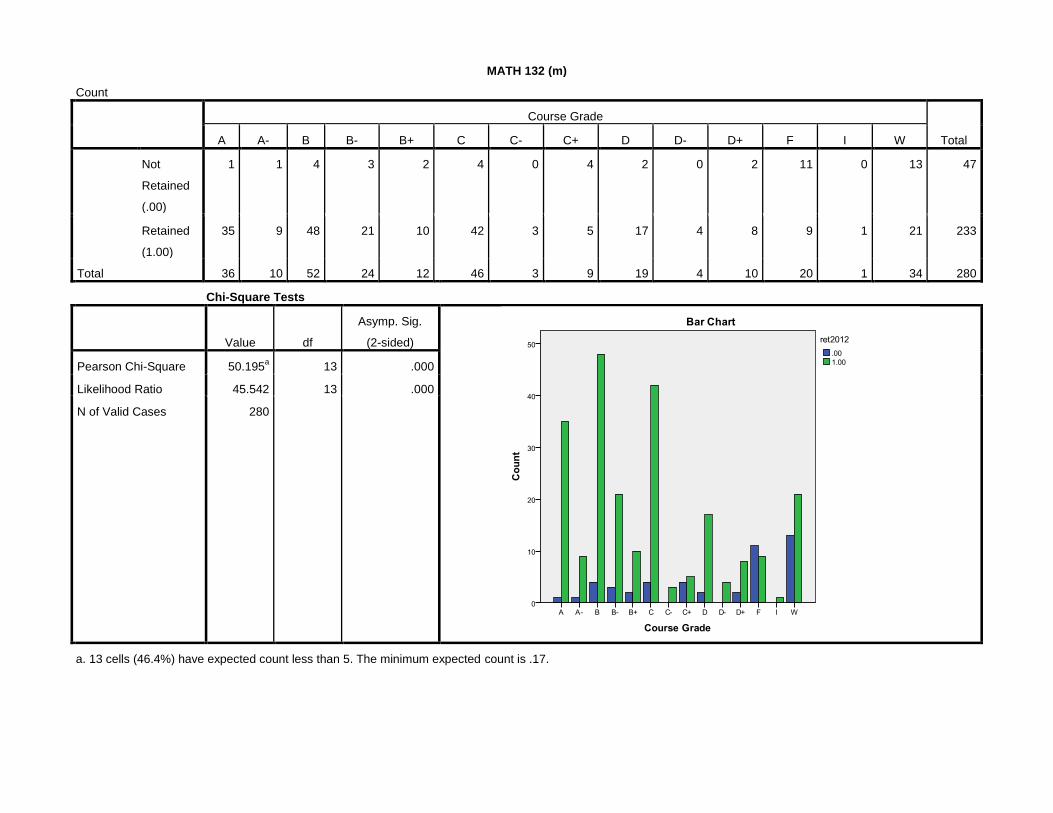
MATH 132 (m)
Count
Course Grade
Total A A- B B- B+ C C- C+ D D- D+ F I W
Not
Retained
(.00)
1 1 4 3 2 4 0 4 2 0 2 11 0 13 47
Retained
(1.00)
35 9 48 21 10 42 3 5 17 4 8 9 1 21 233
Total 36 10 52 24 12 46 3 9 19 4 10 20 1 34 280
Chi-Square Tests
Value df
Asymp. Sig.
(2-sided)
Pearson Chi-Square 50.195a 13 .000
Likelihood Ratio 45.542 13 .000
N of Valid Cases 280
a. 13 cells (46.4%) have expected count less than 5. The minimum expected count is .17.
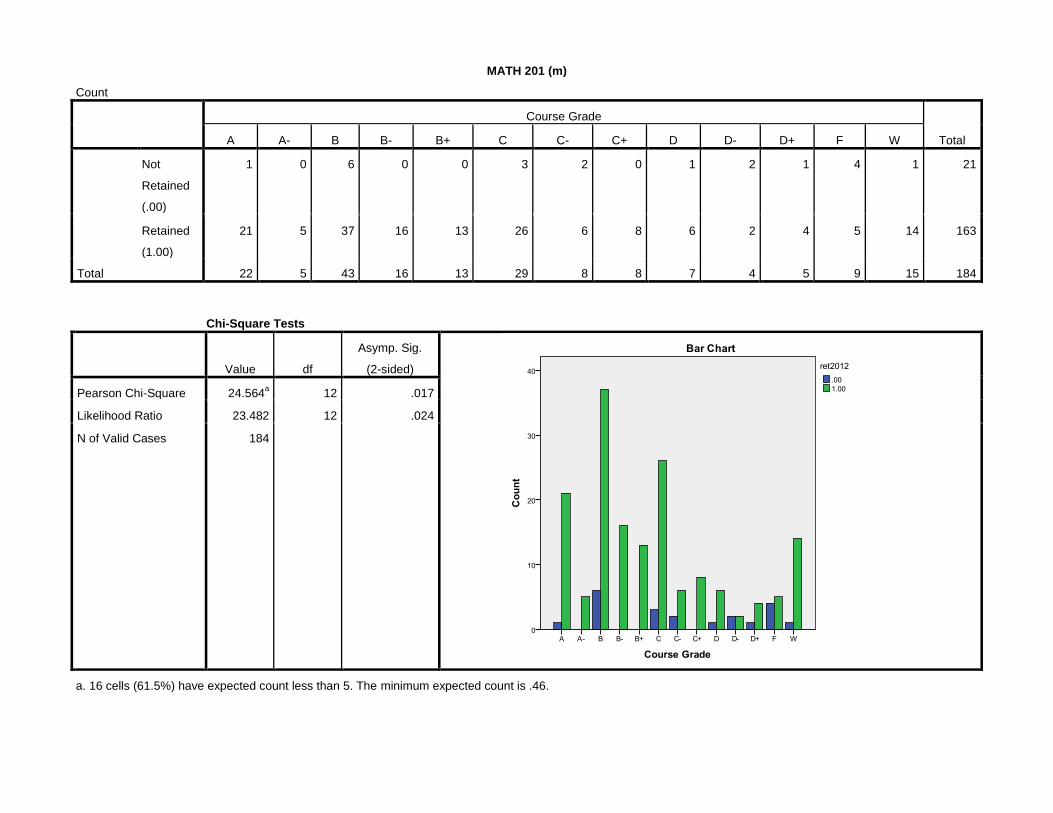
MATH 201 (m)
Count
Course Grade
Total A A- B B- B+ C C- C+ D D- D+ F W
Not
Retained
(.00)
1 0 6 0 0 3 2 0 1 2 1 4 1 21
Retained
(1.00)
21 5 37 16 13 26 6 8 6 2 4 5 14 163
Total 22 5 43 16 13 29 8 8 7 4 5 9 15 184
Chi-Square Tests
Value df
Asymp. Sig.
(2-sided)
Pearson Chi-Square 24.564a 12 .017
Likelihood Ratio 23.482 12 .024
N of Valid Cases 184
a. 16 cells (61.5%) have expected count less than 5. The minimum expected count is .46.
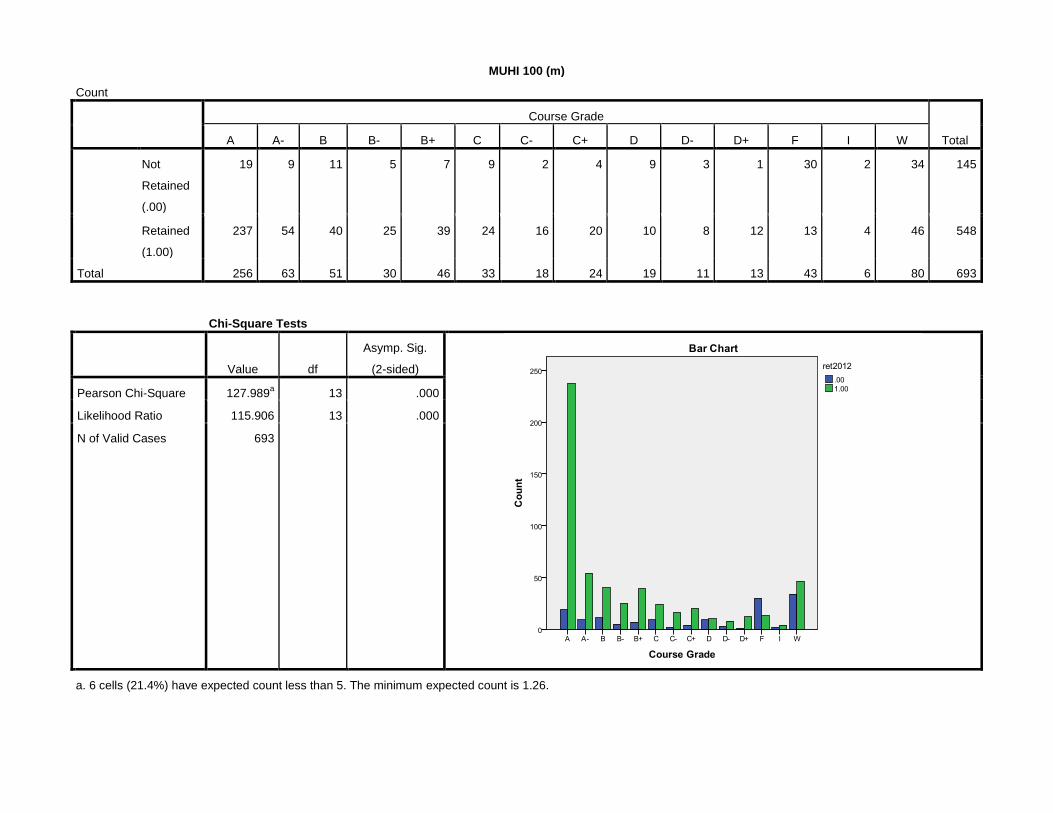
MUHI 100 (m)
Count
Course Grade
Total A A- B B- B+ C C- C+ D D- D+ F I W
Not
Retained
(.00)
19 9 11 5 7 9 2 4 9 3 1 30 2 34 145
Retained
(1.00)
237 54 40 25 39 24 16 20 10 8 12 13 4 46 548
Total 256 63 51 30 46 33 18 24 19 11 13 43 6 80 693
Chi-Square Tests
Value df
Asymp. Sig.
(2-sided)
Pearson Chi-Square 127.989a 13 .000
Likelihood Ratio 115.906 13 .000
N of Valid Cases 693
a. 6 cells (21.4%) have expected count less than 5. The minimum expected count is 1.26.
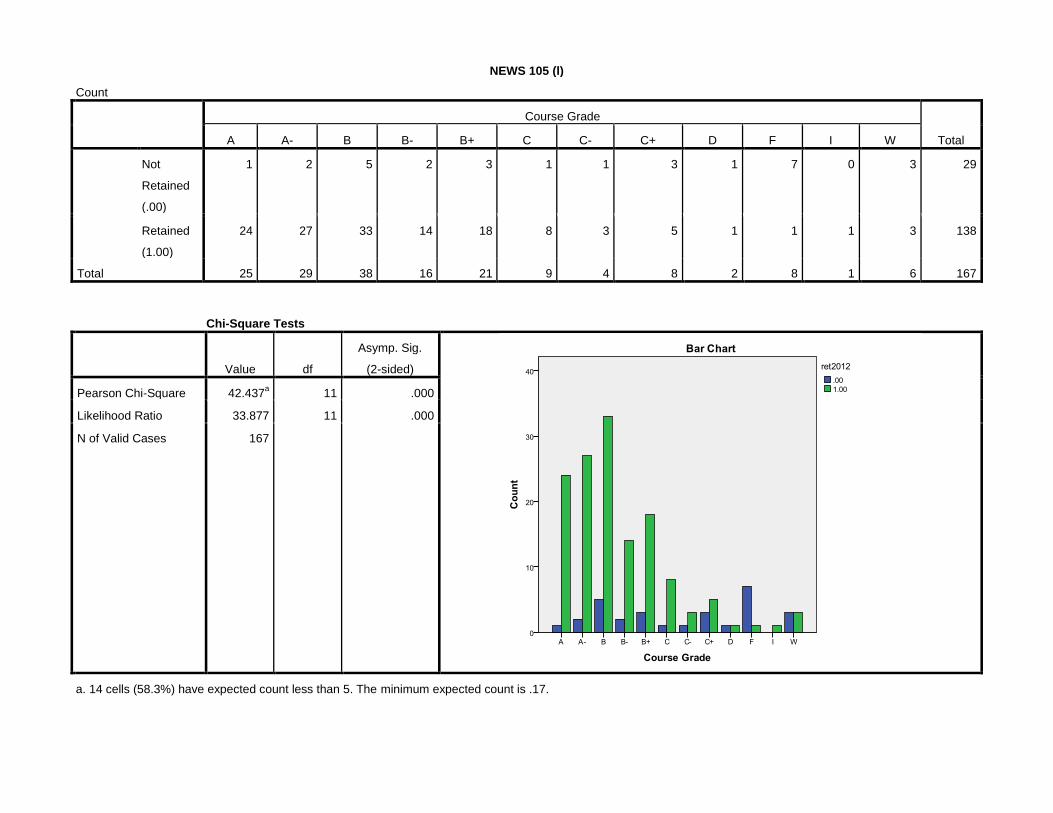
NEWS 105 (l)
Count
Course Grade
Total A A- B B- B+ C C- C+ D F I W
Not
Retained
(.00)
1 2 5 2 3 1 1 3 1 7 0 3 29
Retained
(1.00)
24 27 33 14 18 8 3 5 1 1 1 3 138
Total 25 29 38 16 21 9 4 8 2 8 1 6 167
Chi-Square Tests
Value df
Asymp. Sig.
(2-sided)
Pearson Chi-Square 42.437a 11 .000
Likelihood Ratio 33.877 11 .000
N of Valid Cases 167
a. 14 cells (58.3%) have expected count less than 5. The minimum expected count is .17.

NEWS 108 (l)
Count
Course Grade
Total A A- B B- B+ C C- C+ D D- F W
Not
Retained
(.00)
2 3 5 5 3 0 1 1 1 0 10 2 33
Retained
(1.00)
42 37 27 9 13 1 4 2 0 1 4 4 144
Total 44 40 32 14 16 1 5 3 1 1 14 6 177
Chi-Square Tests
Value df
Asymp. Sig.
(2-sided)
Pearson Chi-Square 43.748a 11 .000
Likelihood Ratio 38.057 11 .000
N of Valid Cases 177
a. 15 cells (62.5%) have expected count less than 5. The minimum expected count is .19.
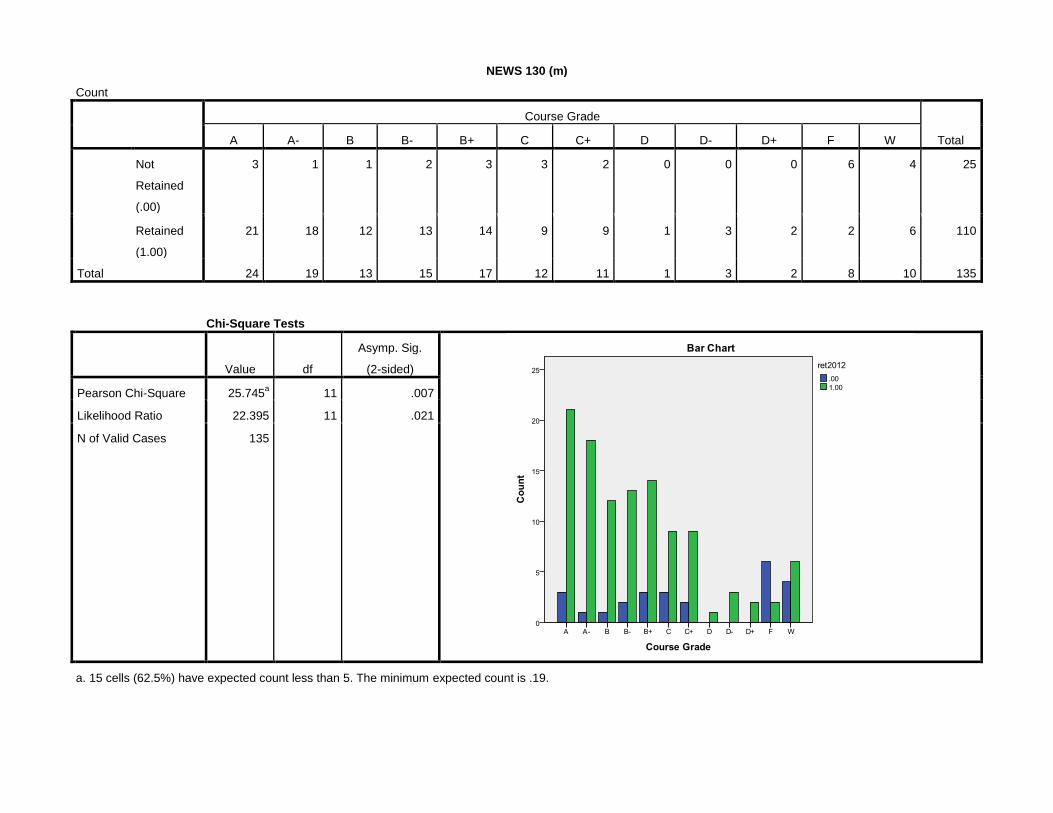
NEWS 130 (m)
Count
Course Grade
Total A A- B B- B+ C C+ D D- D+ F W
Not
Retained
(.00)
3 1 1 2 3 3 2 0 0 0 6 4 25
Retained
(1.00)
21 18 12 13 14 9 9 1 3 2 2 6 110
Total 24 19 13 15 17 12 11 1 3 2 8 10 135
Chi-Square Tests
Value df
Asymp. Sig.
(2-sided)
Pearson Chi-Square 25.745a 11 .007
Likelihood Ratio 22.395 11 .021
N of Valid Cases 135
a. 15 cells (62.5%) have expected count less than 5. The minimum expected count is .19.
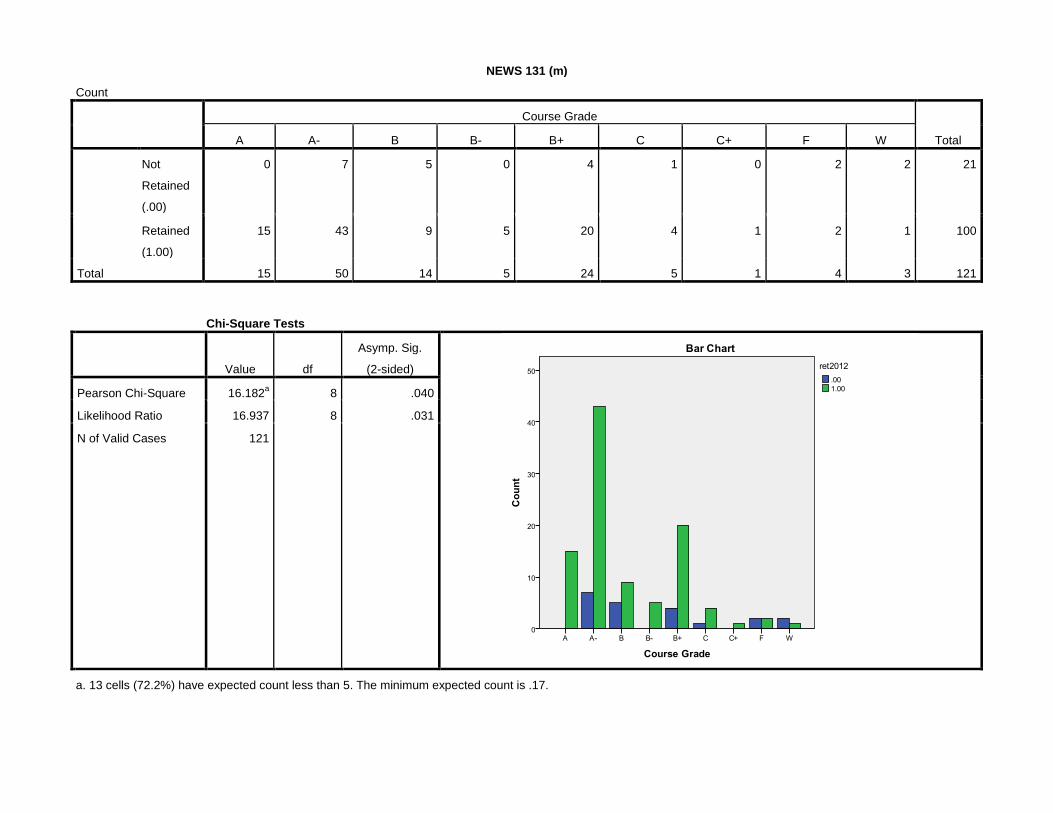
NEWS 131 (m)
Count
Course Grade
Total A A- B B- B+ C C+ F W
Not
Retained
(.00)
0 7 5 0 4 1 0 2 2 21
Retained
(1.00)
15 43 9 5 20 4 1 2 1 100
Total 15 50 14 5 24 5 1 4 3 121
Chi-Square Tests
Value df
Asymp. Sig.
(2-sided)
Pearson Chi-Square 16.182a 8 .040
Likelihood Ratio 16.937 8 .031
N of Valid Cases 121
a. 13 cells (72.2%) have expected count less than 5. The minimum expected count is .17.
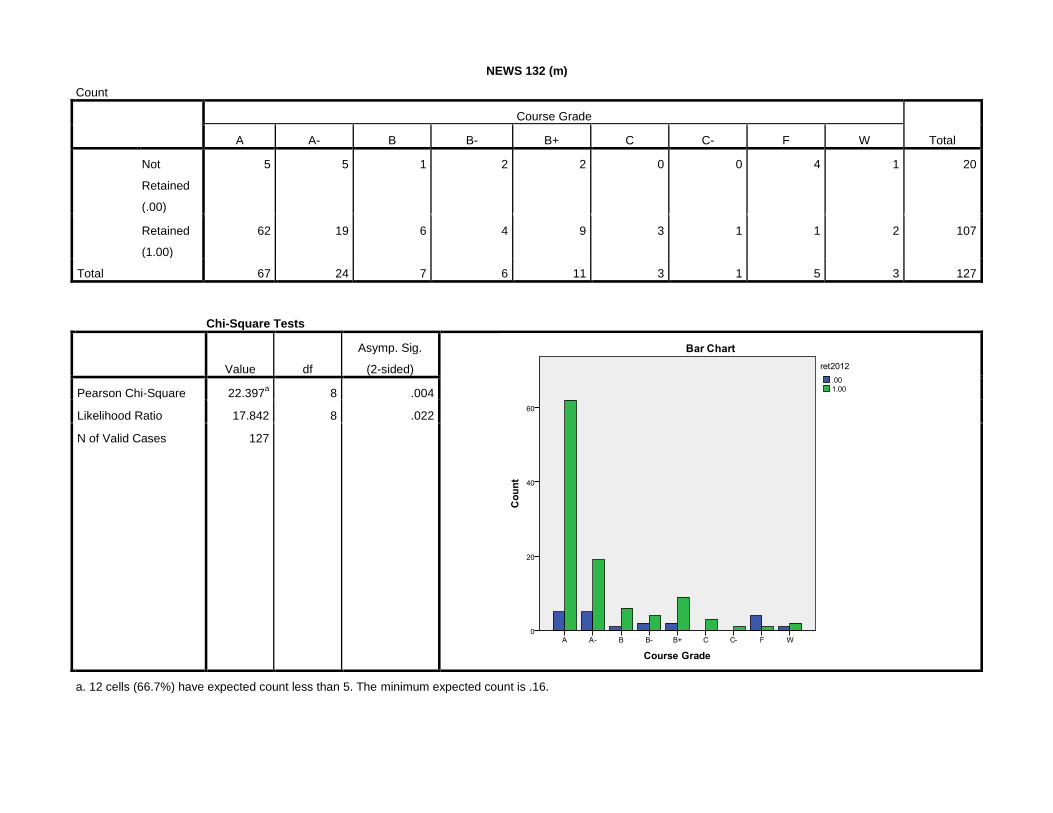
NEWS 132 (m)
Count
Course Grade
Total A A- B B- B+ C C- F W
Not
Retained
(.00)
5 5 1 2 2 0 0 4 1 20
Retained
(1.00)
62 19 6 4 9 3 1 1 2 107
Total 67 24 7 6 11 3 1 5 3 127
Chi-Square Tests
Value df
Asymp. Sig.
(2-sided)
Pearson Chi-Square 22.397a 8 .004
Likelihood Ratio 17.842 8 .022
N of Valid Cases 127
a. 12 cells (66.7%) have expected count less than 5. The minimum expected count is .16.
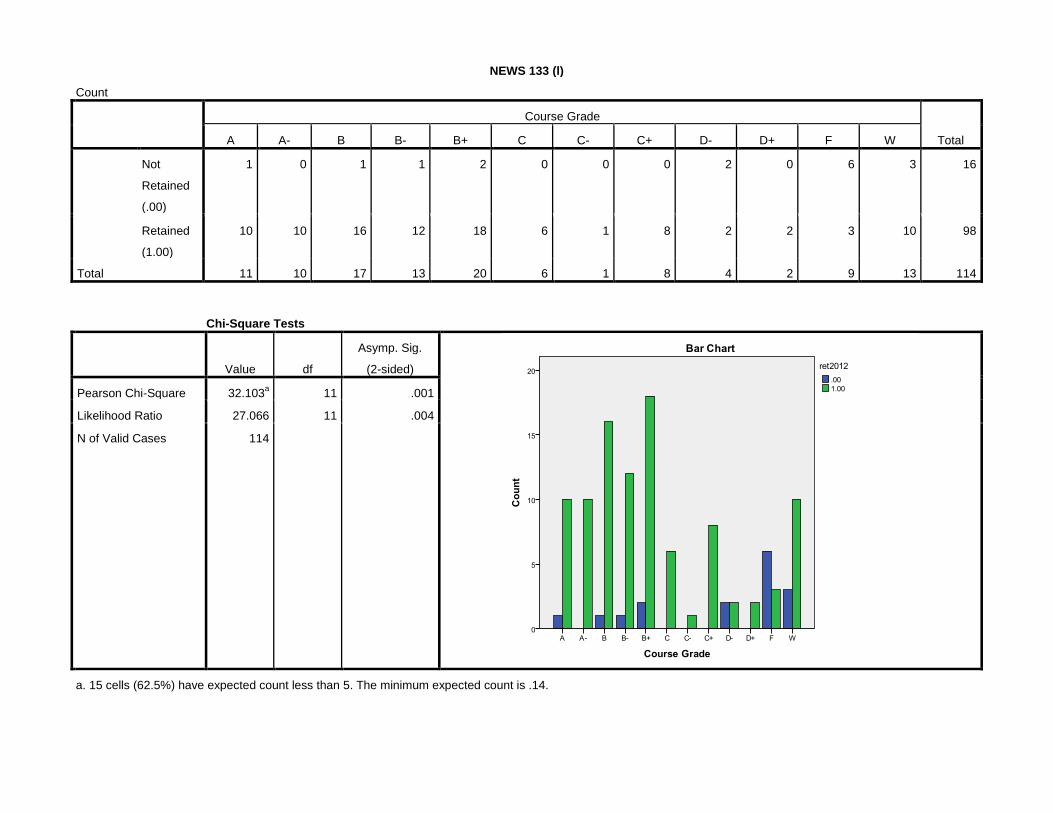
NEWS 133 (l)
Count
Course Grade
Total A A- B B- B+ C C- C+ D- D+ F W
Not
Retained
(.00)
1 0 1 1 2 0 0 0 2 0 6 3 16
Retained
(1.00)
10 10 16 12 18 6 1 8 2 2 3 10 98
Total 11 10 17 13 20 6 1 8 4 2 9 13 114
Chi-Square Tests
Value df
Asymp. Sig.
(2-sided)
Pearson Chi-Square 32.103a 11 .001
Likelihood Ratio 27.066 11 .004
N of Valid Cases 114
a. 15 cells (62.5%) have expected count less than 5. The minimum expected count is .14.
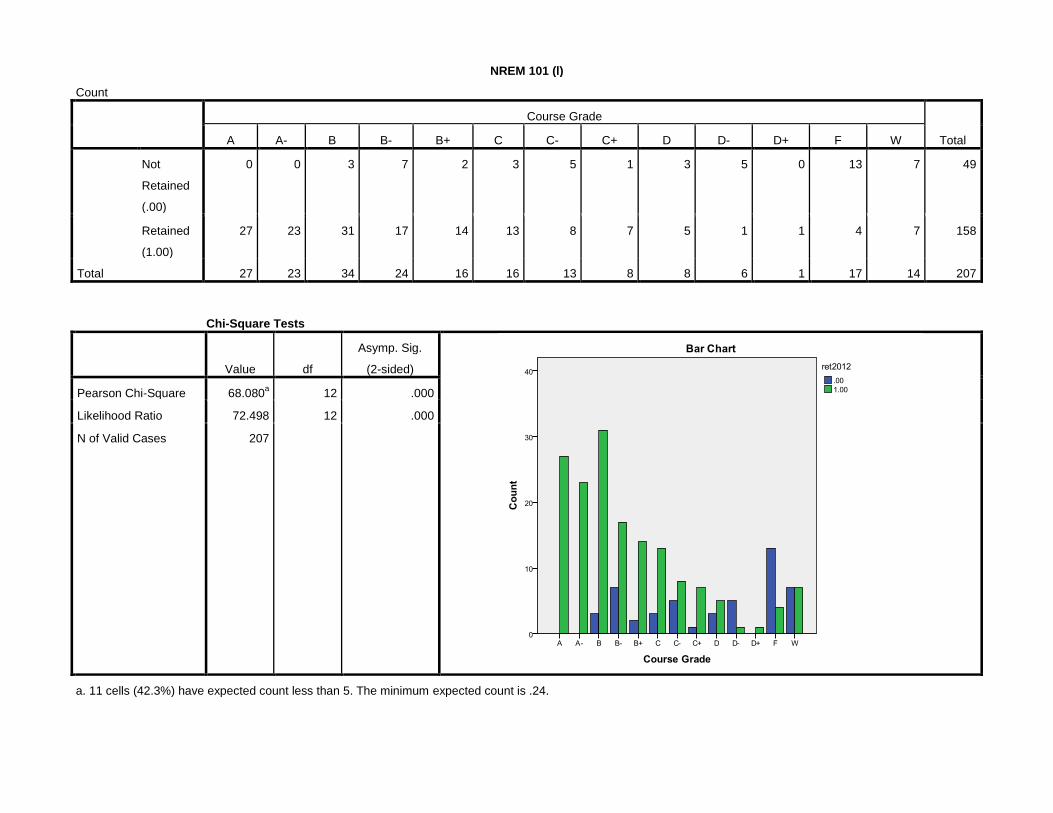
NREM 101 (l)
Count
Course Grade
Total A A- B B- B+ C C- C+ D D- D+ F W
Not
Retained
(.00)
0 0 3 7 2 3 5 1 3 5 0 13 7 49
Retained
(1.00)
27 23 31 17 14 13 8 7 5 1 1 4 7 158
Total 27 23 34 24 16 16 13 8 8 6 1 17 14 207
Chi-Square Tests
Value df
Asymp. Sig.
(2-sided)
Pearson Chi-Square 68.080a 12 .000
Likelihood Ratio 72.498 12 .000
N of Valid Cases 207
a. 11 cells (42.3%) have expected count less than 5. The minimum expected count is .24.
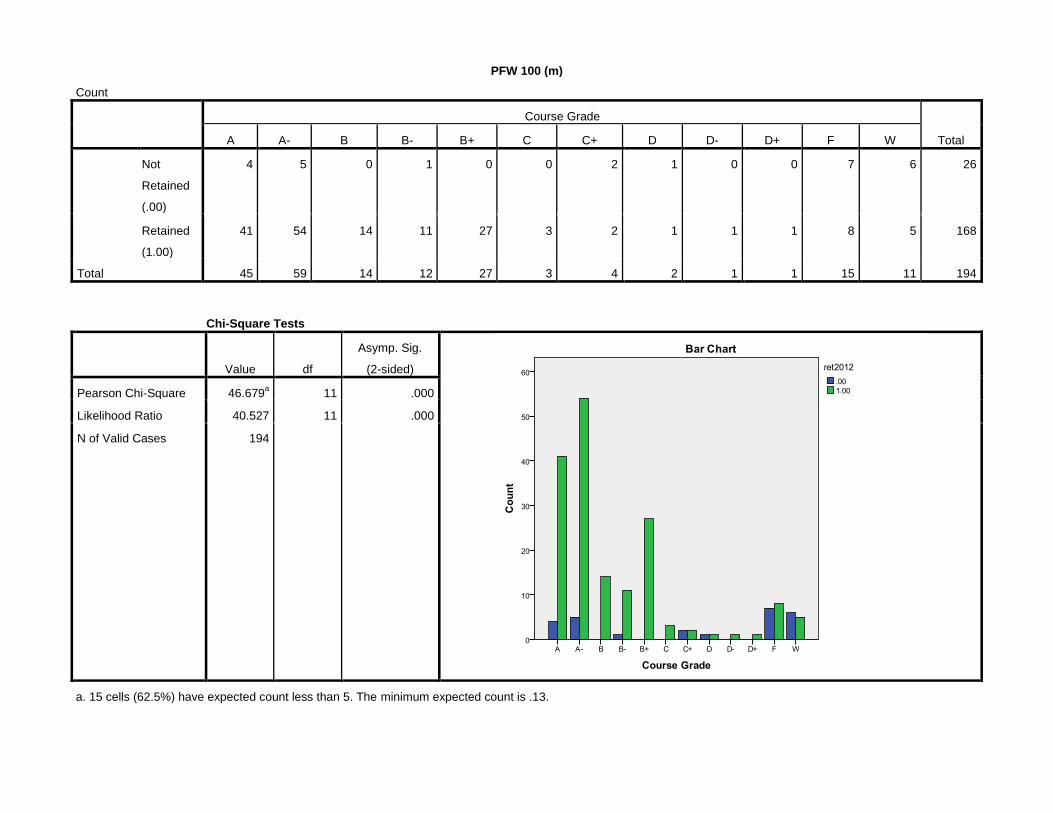
PFW 100 (m)
Count
Course Grade
Total A A- B B- B+ C C+ D D- D+ F W
Not
Retained
(.00)
4 5 0 1 0 0 2 1 0 0 7 6 26
Retained
(1.00)
41 54 14 11 27 3 2 1 1 1 8 5 168
Total 45 59 14 12 27 3 4 2 1 1 15 11 194
Chi-Square Tests
Value df
Asymp. Sig.
(2-sided)
Pearson Chi-Square 46.679a 11 .000
Likelihood Ratio 40.527 11 .000
N of Valid Cases 194
a. 15 cells (62.5%) have expected count less than 5. The minimum expected count is .13.
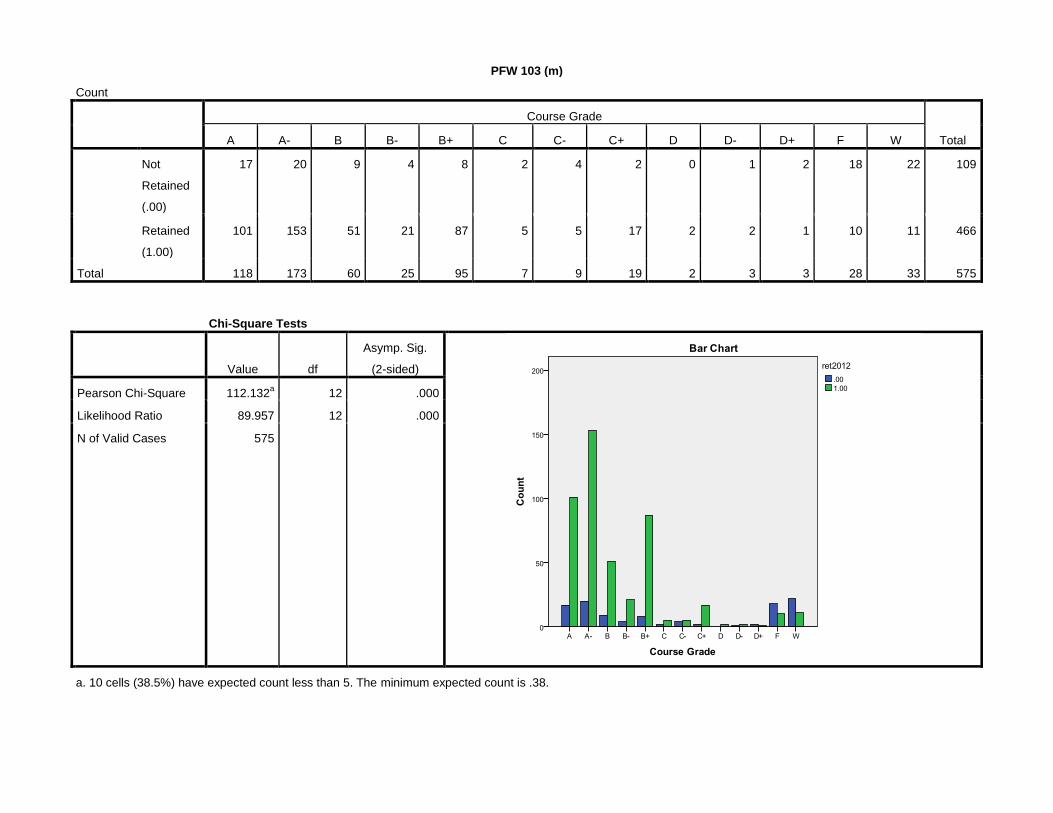
PFW 103 (m)
Count
Course Grade
Total A A- B B- B+ C C- C+ D D- D+ F W
Not
Retained
(.00)
17 20 9 4 8 2 4 2 0 1 2 18 22 109
Retained
(1.00)
101 153 51 21 87 5 5 17 2 2 1 10 11 466
Total 118 173 60 25 95 7 9 19 2 3 3 28 33 575
Chi-Square Tests
Value df
Asymp. Sig.
(2-sided)
Pearson Chi-Square 112.132a 12 .000
Likelihood Ratio 89.957 12 .000
N of Valid Cases 575
a. 10 cells (38.5%) have expected count less than 5. The minimum expected count is .38.
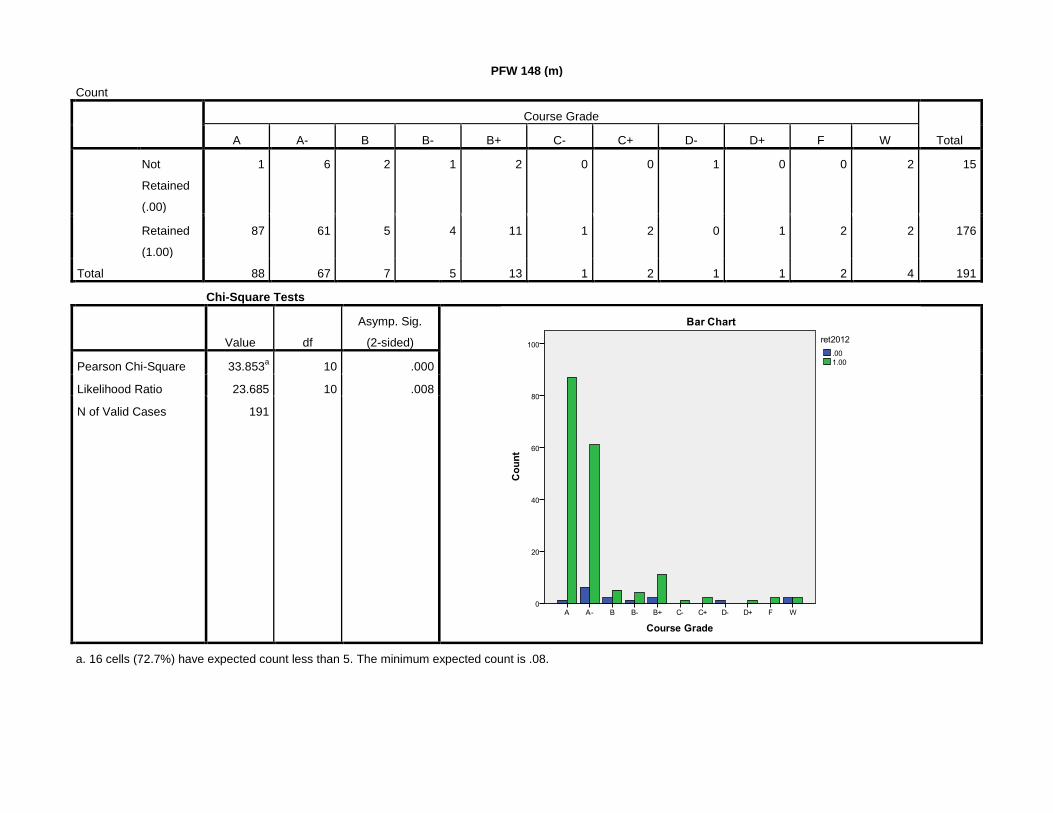
PFW 148 (m)
Count
Course Grade
Total A A- B B- B+ C- C+ D- D+ F W
Not
Retained
(.00)
1 6 2 1 2 0 0 1 0 0 2 15
Retained
(1.00)
87 61 5 4 11 1 2 0 1 2 2 176
Total 88 67 7 5 13 1 2 1 1 2 4 191
Chi-Square Tests
Value df
Asymp. Sig.
(2-sided)
Pearson Chi-Square 33.853a 10 .000
Likelihood Ratio 23.685 10 .008
N of Valid Cases 191
a. 16 cells (72.7%) have expected count less than 5. The minimum expected count is .08.
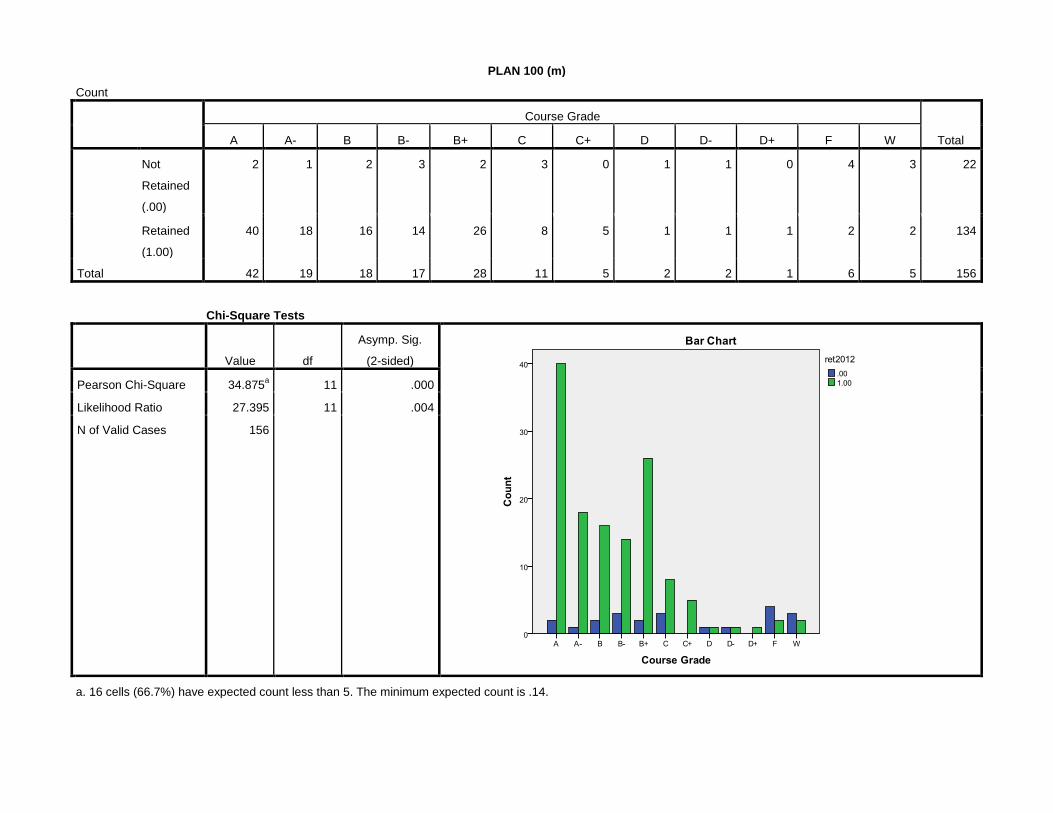
PLAN 100 (m)
Count
Course Grade
Total A A- B B- B+ C C+ D D- D+ F W
Not
Retained
(.00)
2 1 2 3 2 3 0 1 1 0 4 3 22
Retained
(1.00)
40 18 16 14 26 8 5 1 1 1 2 2 134
Total 42 19 18 17 28 11 5 2 2 1 6 5 156
Chi-Square Tests
Value df
Asymp. Sig.
(2-sided)
Pearson Chi-Square 34.875a 11 .000
Likelihood Ratio 27.395 11 .004
N of Valid Cases 156
a. 16 cells (66.7%) have expected count less than 5. The minimum expected count is .14.
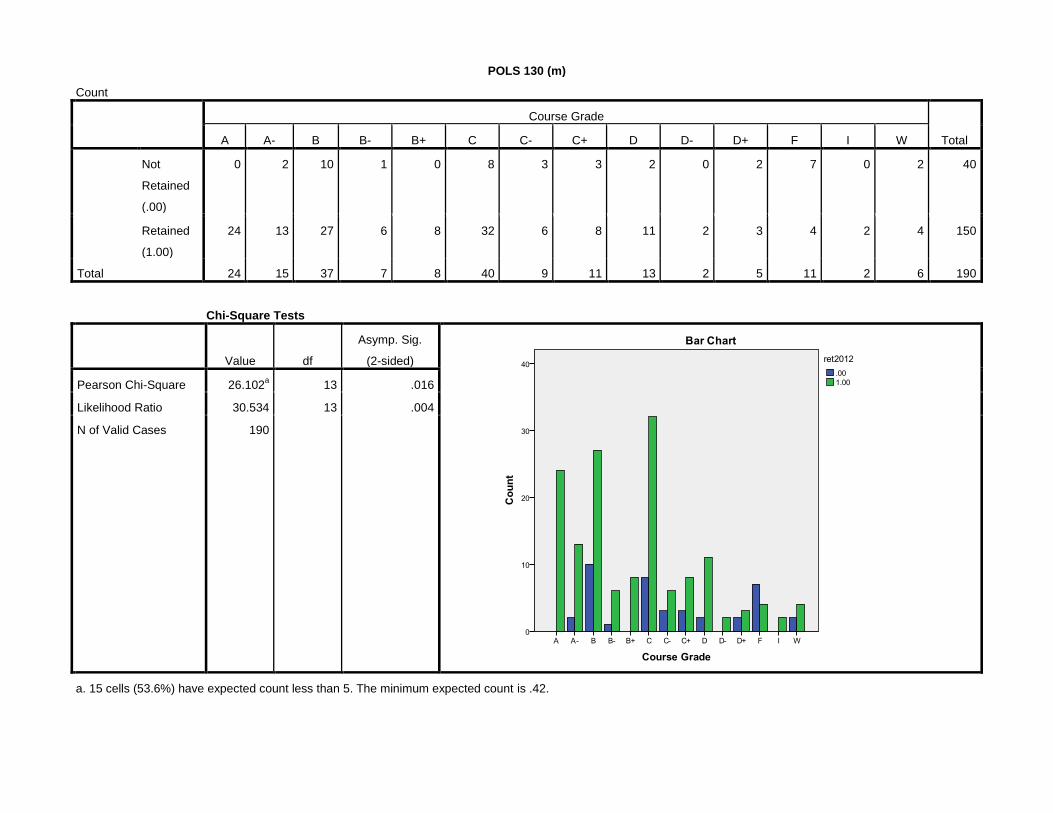
POLS 130 (m)
Count
Course Grade
Total A A- B B- B+ C C- C+ D D- D+ F I W
Not
Retained
(.00)
0 2 10 1 0 8 3 3 2 0 2 7 0 2 40
Retained
(1.00)
24 13 27 6 8 32 6 8 11 2 3 4 2 4 150
Total 24 15 37 7 8 40 9 11 13 2 5 11 2 6 190
Chi-Square Tests
Value df
Asymp. Sig.
(2-sided)
Pearson Chi-Square 26.102a 13 .016
Likelihood Ratio 30.534 13 .004
N of Valid Cases 190
a. 15 cells (53.6%) have expected count less than 5. The minimum expected count is .42.
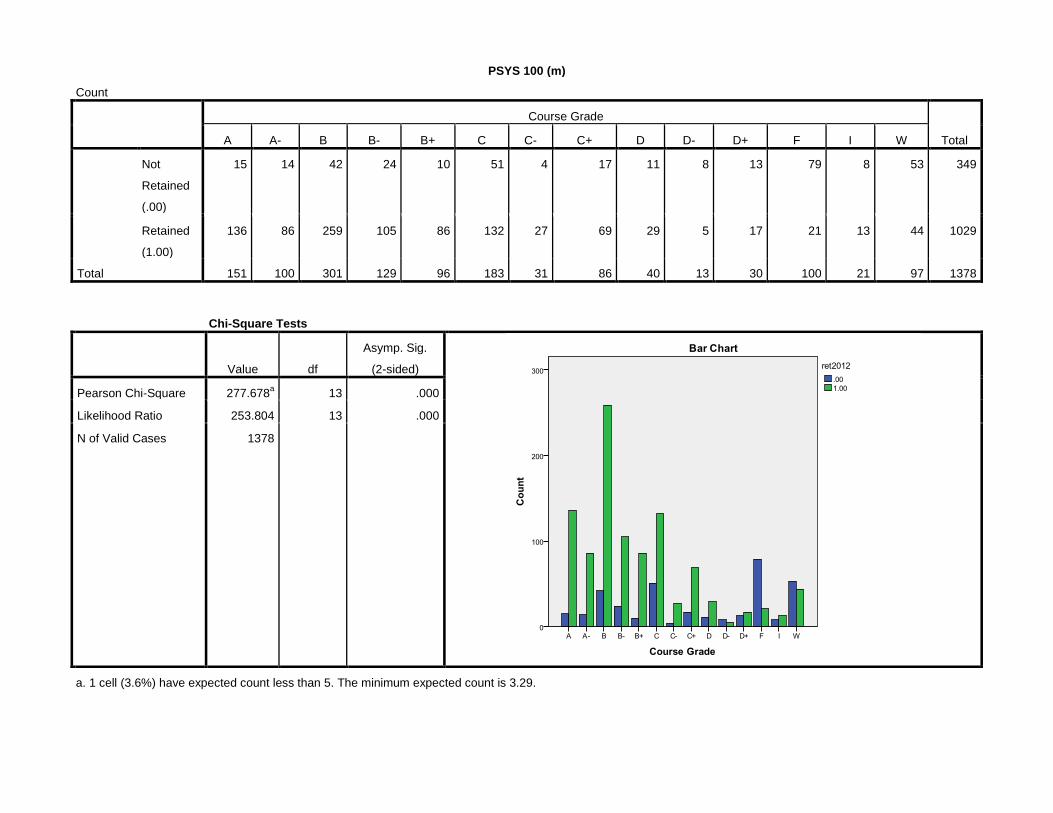
PSYS 100 (m)
Count
Course Grade
Total A A- B B- B+ C C- C+ D D- D+ F I W
Not
Retained
(.00)
15 14 42 24 10 51 4 17 11 8 13 79 8 53 349
Retained
(1.00)
136 86 259 105 86 132 27 69 29 5 17 21 13 44 1029
Total 151 100 301 129 96 183 31 86 40 13 30 100 21 97 1378
Chi-Square Tests
Value df
Asymp. Sig.
(2-sided)
Pearson Chi-Square 277.678a 13 .000
Likelihood Ratio 253.804 13 .000
N of Valid Cases 1378
a. 1 cell (3.6%) have expected count less than 5. The minimum expected count is 3.29.
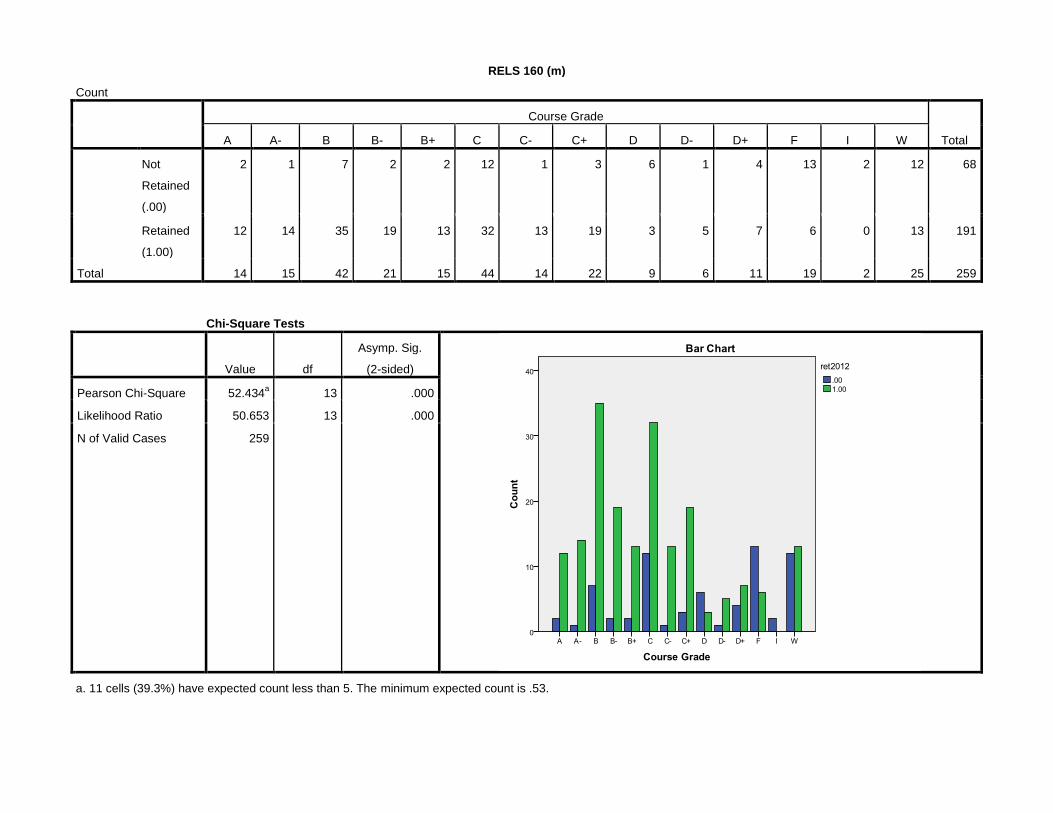
RELS 160 (m)
Count
Course Grade
Total A A- B B- B+ C C- C+ D D- D+ F I W
Not
Retained
(.00)
2 1 7 2 2 12 1 3 6 1 4 13 2 12 68
Retained
(1.00)
12 14 35 19 13 32 13 19 3 5 7 6 0 13 191
Total 14 15 42 21 15 44 14 22 9 6 11 19 2 25 259
Chi-Square Tests
Value df
Asymp. Sig.
(2-sided)
Pearson Chi-Square 52.434a 13 .000
Likelihood Ratio 50.653 13 .000
N of Valid Cases 259
a. 11 cells (39.3%) have expected count less than 5. The minimum expected count is .53.
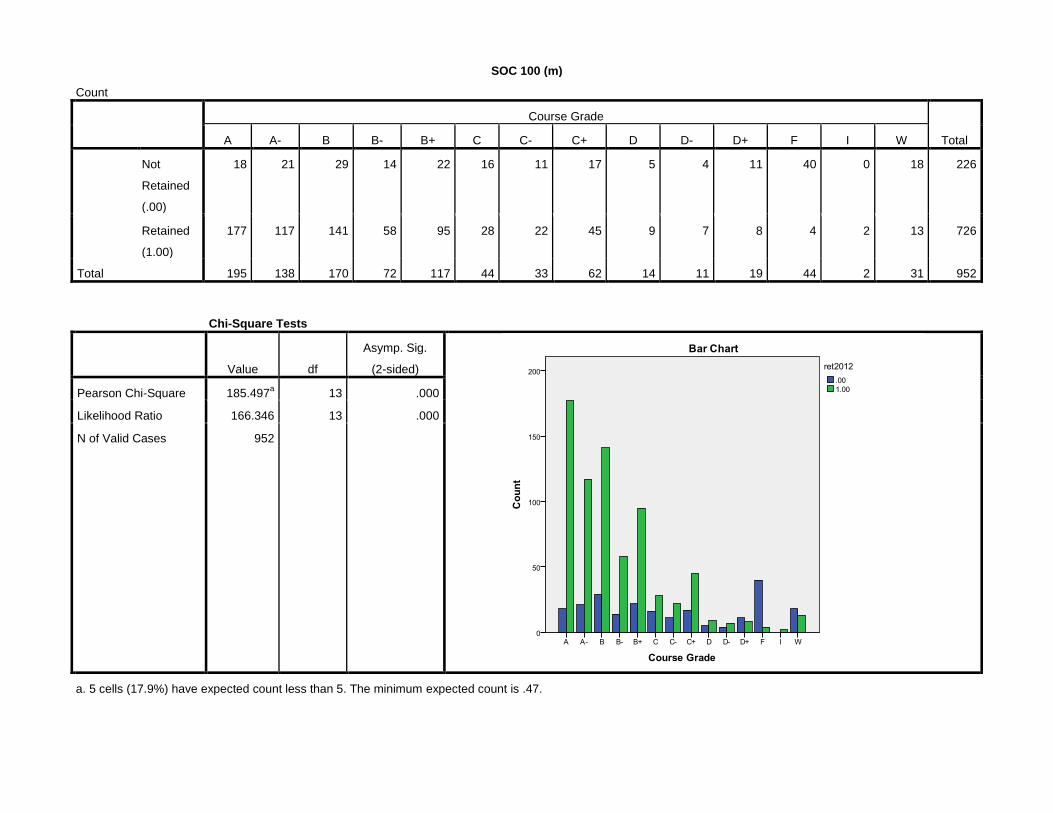
SOC 100 (m)
Count
Course Grade
Total A A- B B- B+ C C- C+ D D- D+ F I W
Not
Retained
(.00)
18 21 29 14 22 16 11 17 5 4 11 40 0 18 226
Retained
(1.00)
177 117 141 58 95 28 22 45 9 7 8 4 2 13 726
Total 195 138 170 72 117 44 33 62 14 11 19 44 2 31 952
Chi-Square Tests
Value df
Asymp. Sig.
(2-sided)
Pearson Chi-Square 185.497a 13 .000
Likelihood Ratio 166.346 13 .000
N of Valid Cases 952
a. 5 cells (17.9%) have expected count less than 5. The minimum expected count is .47.
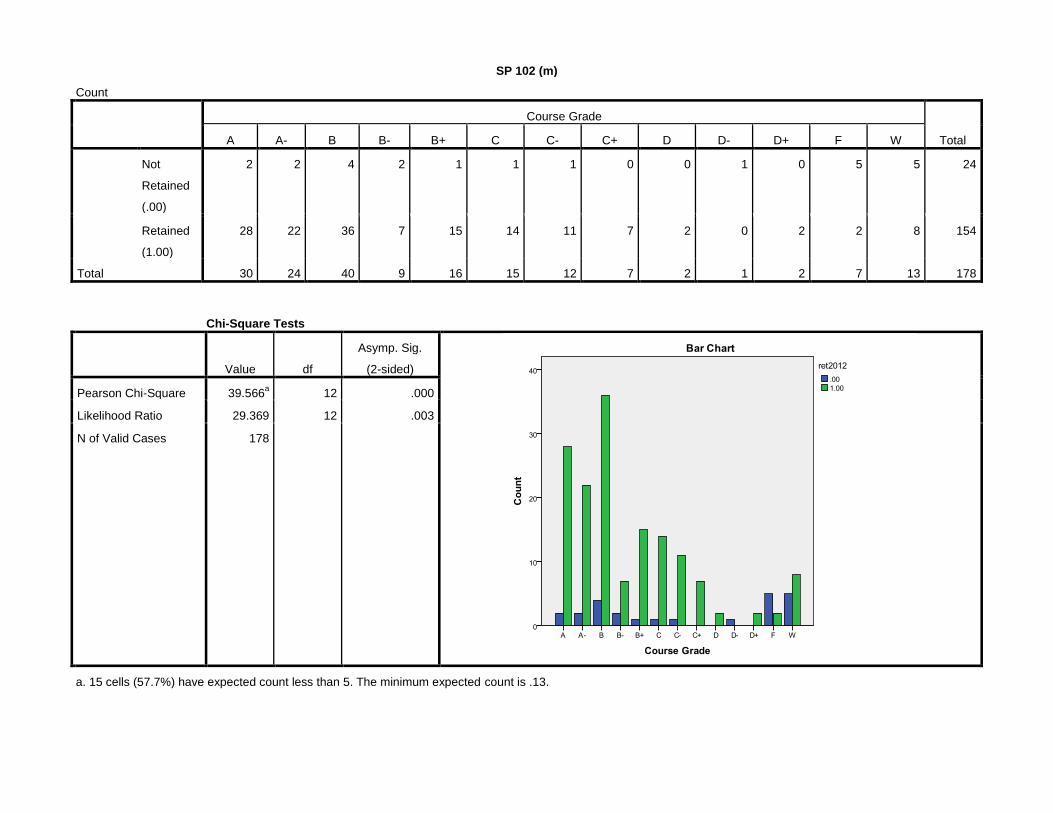
SP 102 (m)
Count
Course Grade
Total A A- B B- B+ C C- C+ D D- D+ F W
Not
Retained
(.00)
2 2 4 2 1 1 1 0 0 1 0 5 5 24
Retained
(1.00)
28 22 36 7 15 14 11 7 2 0 2 2 8 154
Total 30 24 40 9 16 15 12 7 2 1 2 7 13 178
Chi-Square Tests
Value df
Asymp. Sig.
(2-sided)
Pearson Chi-Square 39.566a 12 .000
Likelihood Ratio 29.369 12 .003
N of Valid Cases 178
a. 15 cells (57.7%) have expected count less than 5. The minimum expected count is .13.
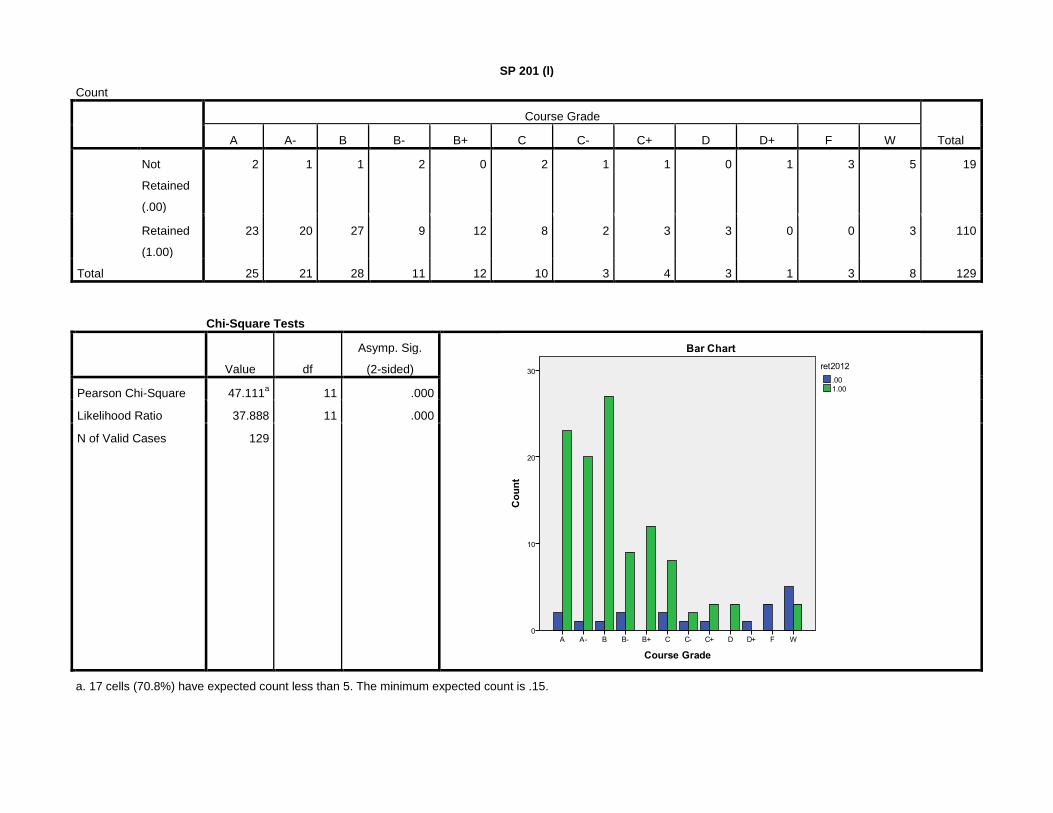
SP 201 (l)
Count
Course Grade
Total A A- B B- B+ C C- C+ D D+ F W
Not
Retained
(.00)
2 1 1 2 0 2 1 1 0 1 3 5 19
Retained
(1.00)
23 20 27 9 12 8 2 3 3 0 0 3 110
Total 25 21 28 11 12 10 3 4 3 1 3 8 129
Chi-Square Tests
Value df
Asymp. Sig.
(2-sided)
Pearson Chi-Square 47.111a 11 .000
Likelihood Ratio 37.888 11 .000
N of Valid Cases 129
a. 17 cells (70.8%) have expected count less than 5. The minimum expected count is .15.
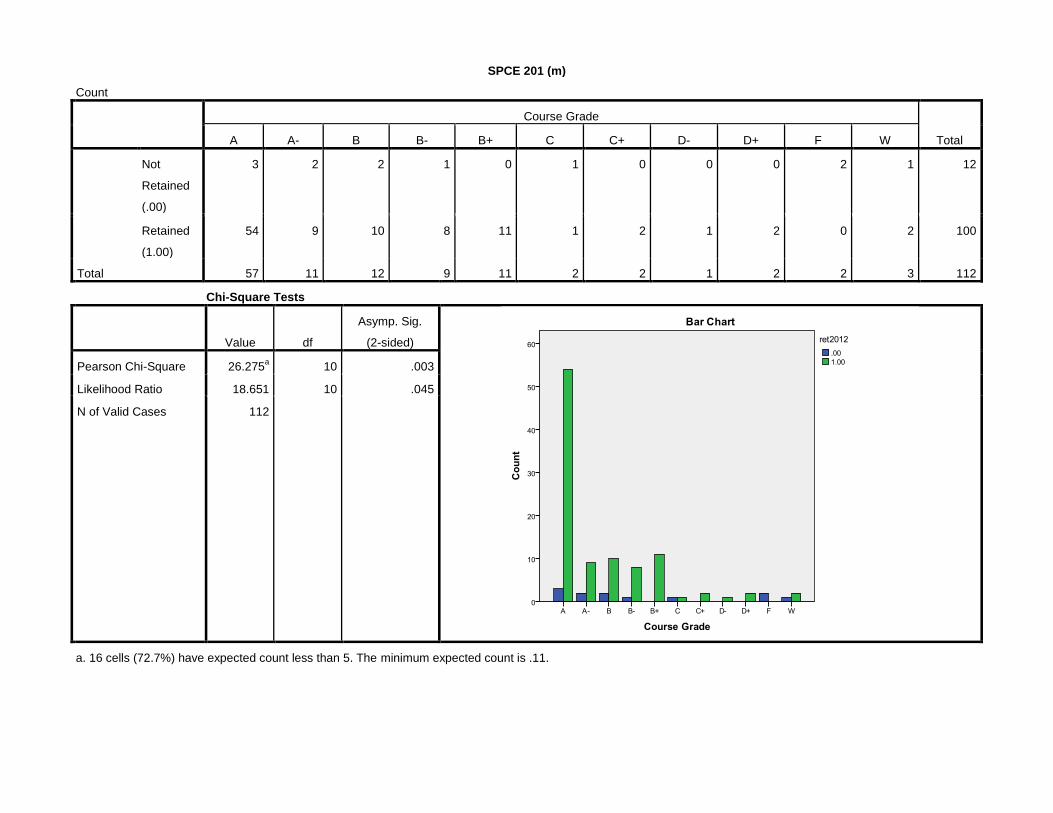
SPCE 201 (m)
Count
Course Grade
Total A A- B B- B+ C C+ D- D+ F W
Not
Retained
(.00)
3 2 2 1 0 1 0 0 0 2 1 12
Retained
(1.00)
54 9 10 8 11 1 2 1 2 0 2 100
Total 57 11 12 9 11 2 2 1 2 2 3 112
Chi-Square Tests
Value df
Asymp. Sig.
(2-sided)
Pearson Chi-Square 26.275a 10 .003
Likelihood Ratio 18.651 10 .045
N of Valid Cases 112
a. 16 cells (72.7%) have expected count less than 5. The minimum expected count is .11.
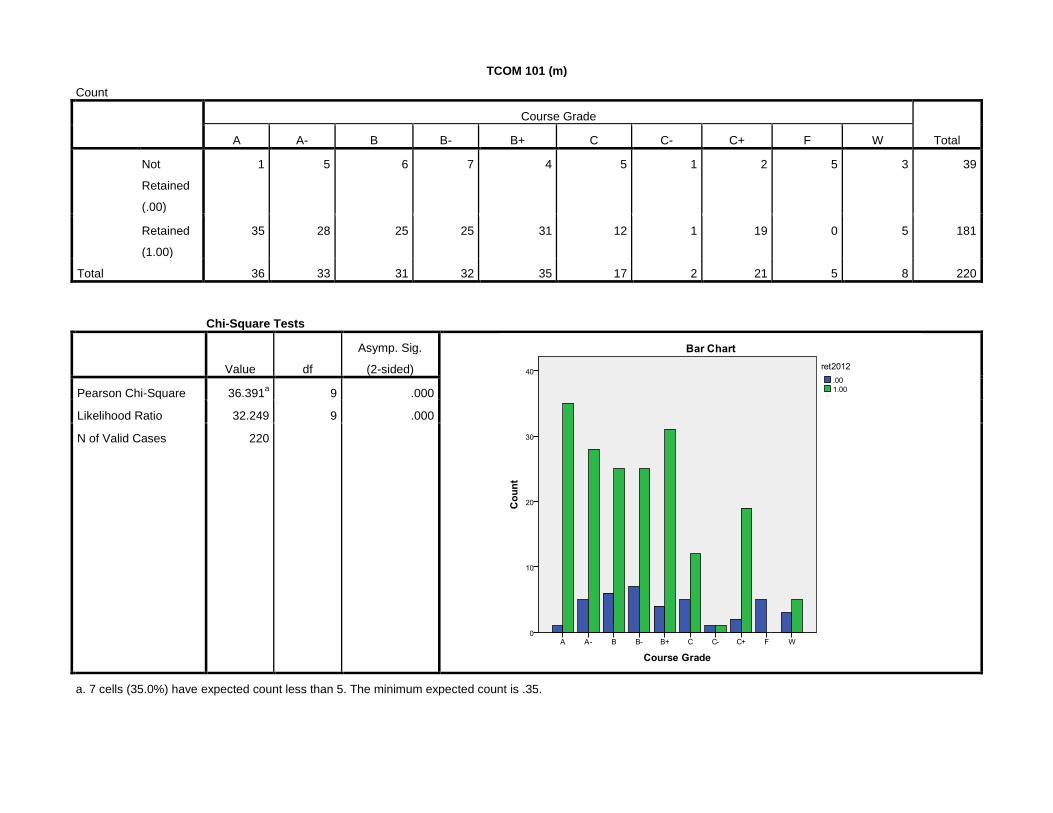
TCOM 101 (m)
Count
Course Grade
Total A A- B B- B+ C C- C+ F W
Not
Retained
(.00)
1 5 6 7 4 5 1 2 5 3 39
Retained
(1.00)
35 28 25 25 31 12 1 19 0 5 181
Total 36 33 31 32 35 17 2 21 5 8 220
Chi-Square Tests
Value df
Asymp. Sig.
(2-sided)
Pearson Chi-Square 36.391a 9 .000
Likelihood Ratio 32.249 9 .000
N of Valid Cases 220
a. 7 cells (35.0%) have expected count less than 5. The minimum expected count is .35.
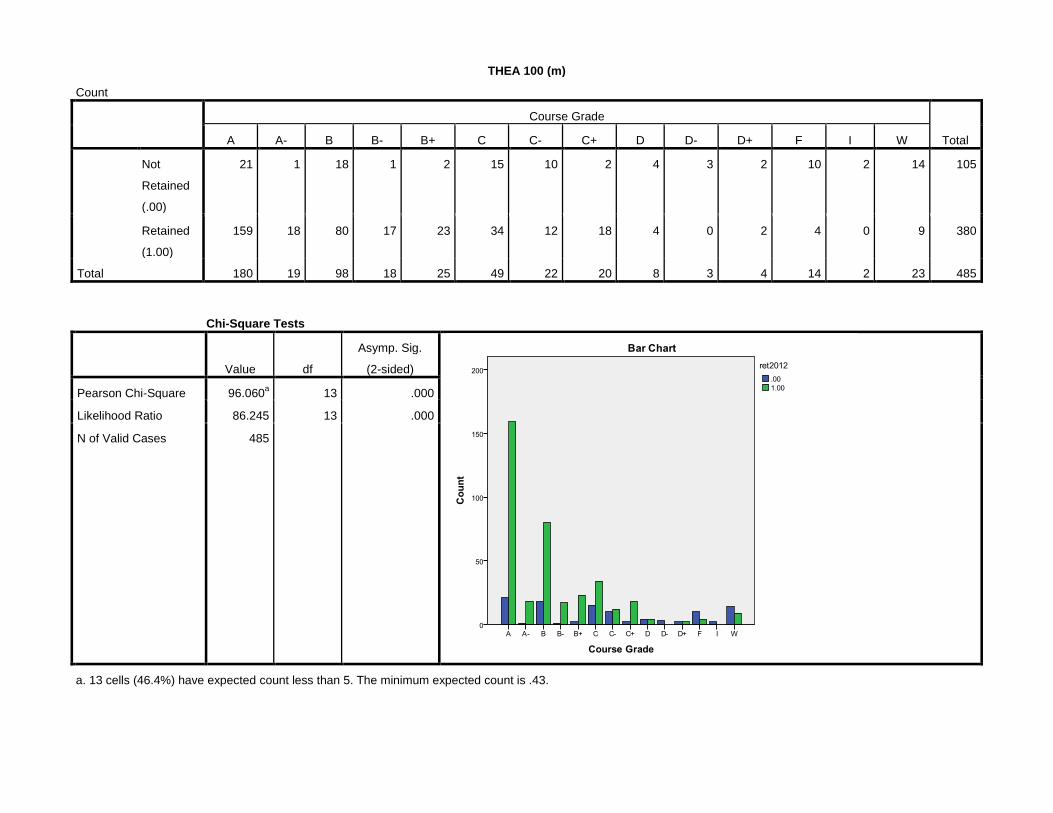
THEA 100 (m)
Count
Course Grade
Total A A- B B- B+ C C- C+ D D- D+ F I W
Not
Retained
(.00)
21 1 18 1 2 15 10 2 4 3 2 10 2 14 105
Retained
(1.00)
159 18 80 17 23 34 12 18 4 0 2 4 0 9 380
Total 180 19 98 18 25 49 22 20 8 3 4 14 2 23 485
Chi-Square Tests
Value df
Asymp. Sig.
(2-sided)
Pearson Chi-Square 96.060a 13 .000
Likelihood Ratio 86.245 13 .000
N of Valid Cases 485
a. 13 cells (46.4%) have expected count less than 5. The minimum expected count is .43.
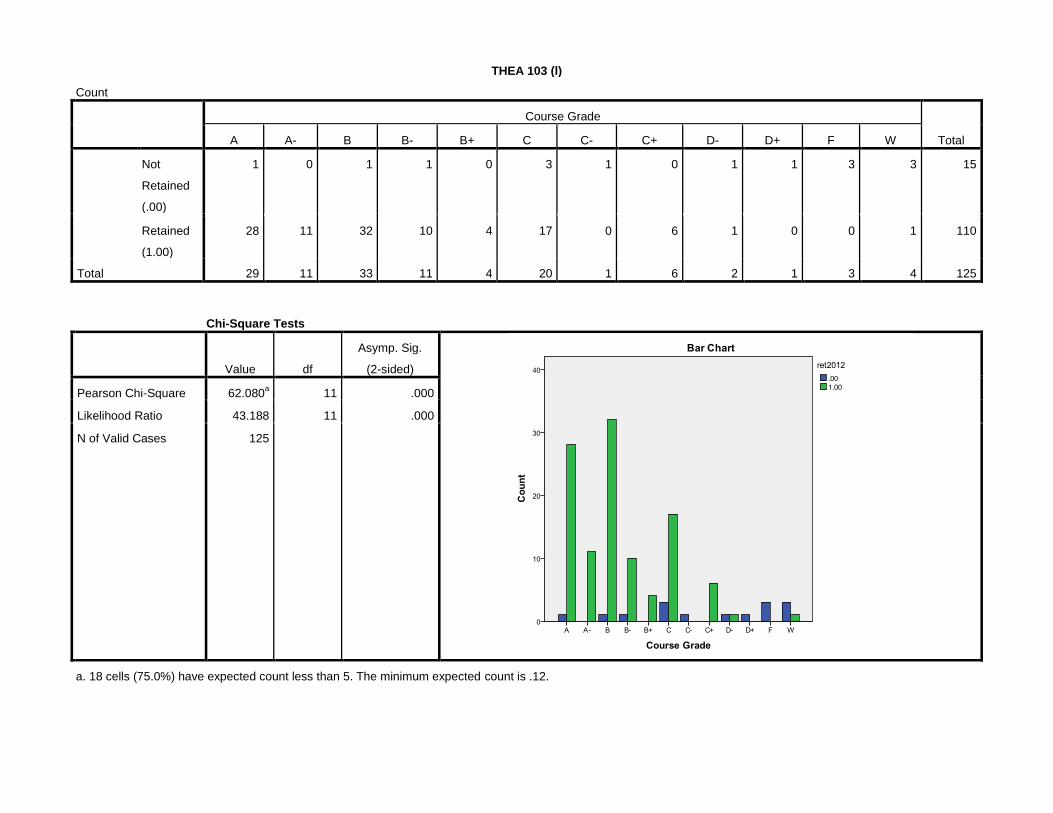
THEA 103 (l)
Count
Course Grade
Total A A- B B- B+ C C- C+ D- D+ F W
Not
Retained
(.00)
1 0 1 1 0 3 1 0 1 1 3 3 15
Retained
(1.00)
28 11 32 10 4 17 0 6 1 0 0 1 110
Total 29 11 33 11 4 20 1 6 2 1 3 4 125
Chi-Square Tests
Value df
Asymp. Sig.
(2-sided)
Pearson Chi-Square 62.080a 11 .000
Likelihood Ratio 43.188 11 .000
N of Valid Cases 125
a. 18 cells (75.0%) have expected count less than 5. The minimum expected count is .12.
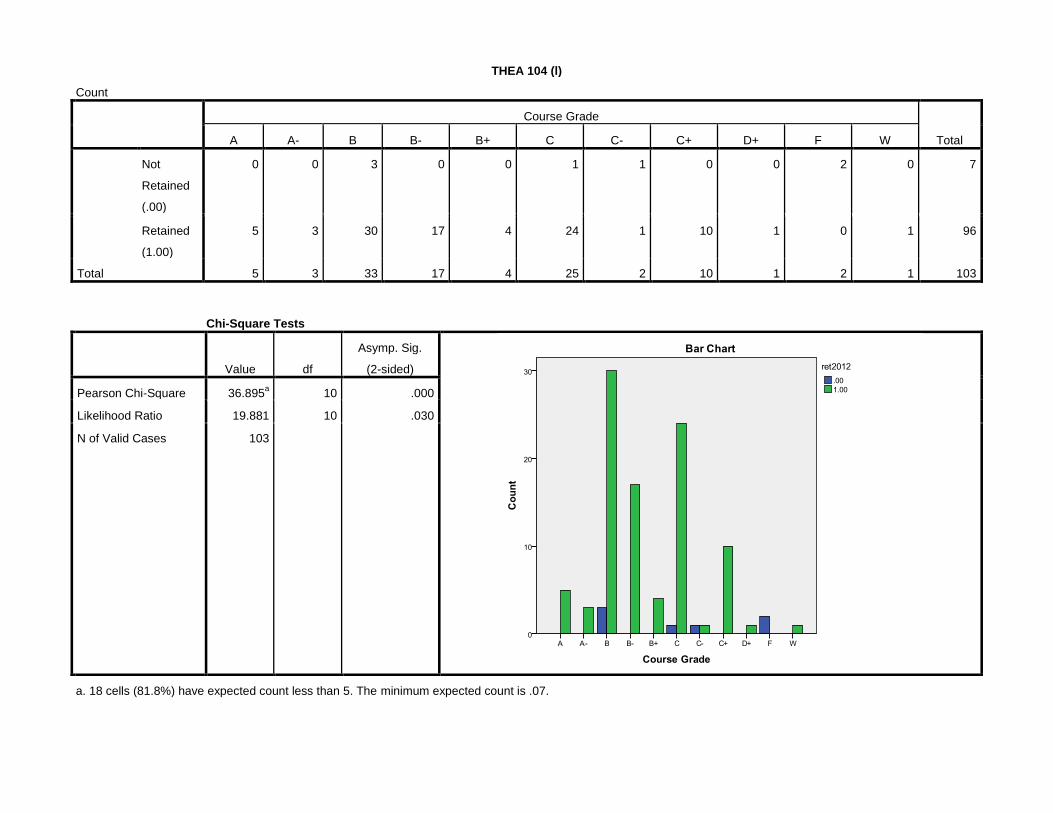
THEA 104 (l)
Count
Course Grade
Total A A- B B- B+ C C- C+ D+ F W
Not
Retained
(.00)
0 0 3 0 0 1 1 0 0 2 0 7
Retained
(1.00)
5 3 30 17 4 24 1 10 1 0 1 96
Total 5 3 33 17 4 25 2 10 1 2 1 103
Chi-Square Tests
Value df
Asymp. Sig.
(2-sided)
Pearson Chi-Square 36.895a 10 .000
Likelihood Ratio 19.881 10 .030
N of Valid Cases 103
a. 18 cells (81.8%) have expected count less than 5. The minimum expected count is .07.
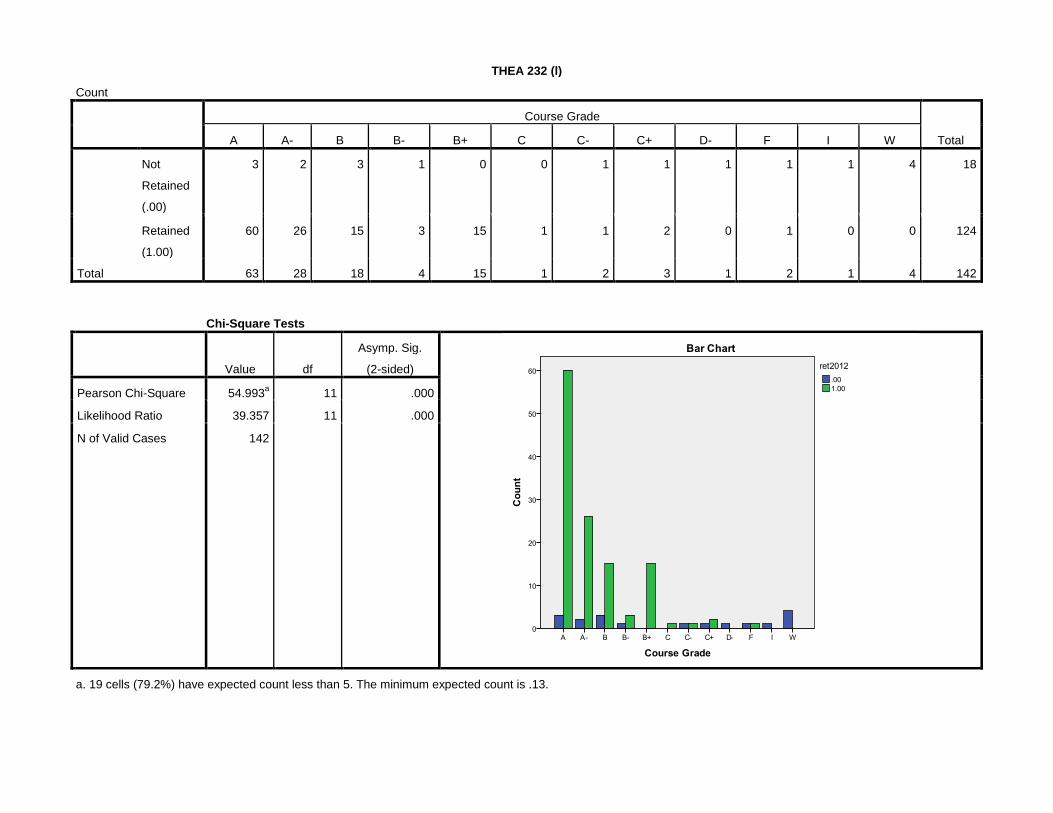
THEA 232 (l)
Count
Course Grade
Total A A- B B- B+ C C- C+ D- F I W
Not
Retained
(.00)
3 2 3 1 0 0 1 1 1 1 1 4 18
Retained
(1.00)
60 26 15 3 15 1 1 2 0 1 0 0 124
Total 63 28 18 4 15 1 2 3 1 2 1 4 142
Chi-Square Tests
Value df
Asymp. Sig.
(2-sided)
Pearson Chi-Square 54.993a 11 .000
Likelihood Ratio 39.357 11 .000
N of Valid Cases 142
a. 19 cells (79.2%) have expected count less than 5. The minimum expected count is .13.
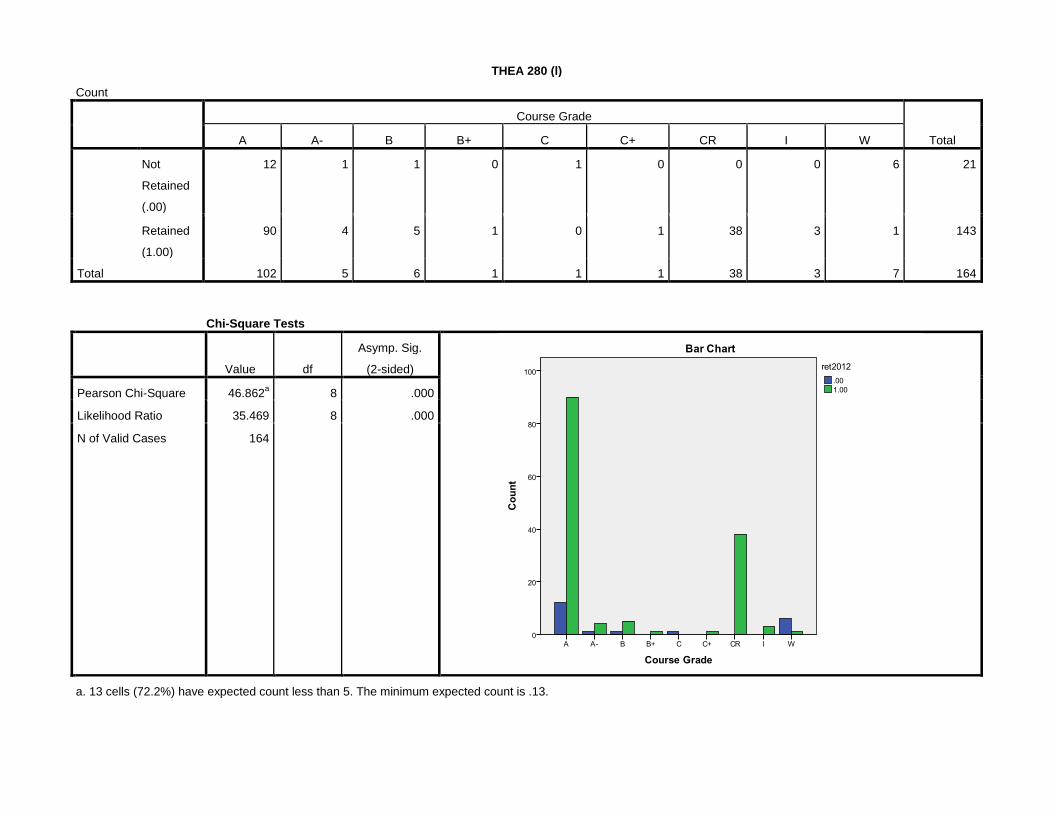
THEA 280 (l)
Count
Course Grade
Total A A- B B+ C C+ CR I W
Not
Retained
(.00)
12 1 1 0 1 0 0 0 6 21
Retained
(1.00)
90 4 5 1 0 1 38 3 1 143
Total 102 5 6 1 1 1 38 3 7 164
Chi-Square Tests
Value df
Asymp. Sig.
(2-sided)
Pearson Chi-Square 46.862a 8 .000
Likelihood Ratio 35.469 8 .000
N of Valid Cases 164
a. 13 cells (72.2%) have expected count less than 5. The minimum expected count is .13.