Embed Size (px)
Citation preview
Department of Health and Human Services
OFFICE OF INSPECTOR GENERAL
MEDICARE RISK HMOPERFORMANCE INDICATORS
sswrcl~.b ~. $
w # 4g JUNE GIBBS BROWN ~ s Inspector General %e+++ OCTOBER 1995
4~daa> OEI 06-91-00734
OFFICE OF INSPECTOR GENERAL
The mission of the OffIce of Inspector General (OIG), as mandated by Public Law 95-452, as
amended, is to protect the integrity of the Department of Health and Human Services’ (HHS) programs as well as the health and welfare of beneficiaries served by those programs. This statutory mission is carried out through a nationwide network of audits, investigations, and inspections conducted by three OIG operating components: the OffIce of Audit Services, the OffIce of Investigations, and the OffIce of Evaluation and Inspections. The OIG also informs the Secretary of HHS of program, and management problems, and recommends courses to correct them.
OFFICE OF AUDIT SERVICES
The OIG’S Ofllce of Audit Services (OAS) provides all auditing services for HHS, either by conducting audits with its own audit resources or by overseeing audit work done by others. Audits examine the performmce of HHS programs and/or its grantees and contractors in carrying out their respective responsibilities and are intended to provide independent assessments of HHS programs and operations in order to reduce waste, abuse, and mismanagement and to promote economy and efilciency throughout the Department.
OFFICE OF INVESTIGATIONS
The OIG’S Ofllce of Investigations (01) conducts criminal, civil, and administrative investigationsof allegations of wrongdoing in HHS programs or to HHS beneficiaries and of unjust enrichmentby providers. The investigative efforts of 01 lead to criminal convictions, administrativesanctions, or civil money penalties. The 01 also oversees State Medicaid fraud control units whichinvestigate and prosecute fraud and patient abuse in the Medicaid program.
OFFICE OF EVALUATION AND INSPECTIONS
The OIG’S OffIce of Evaluation and Inspections (OEI) conducts short-term management andprogram evaluations (called inspections) that focus on issues of concern to the Department, theCongress, and the public. The findings and recommendations contained in these inspection reportsgenerate rapid, accurate, and up-to-date information on the efficiency, vulnerability, andeffectiveness of departmental programs. This report was prepared in the Dallas regional officeunder the direction of Chester B. Slaughter, Regional Inspector General.Project staff
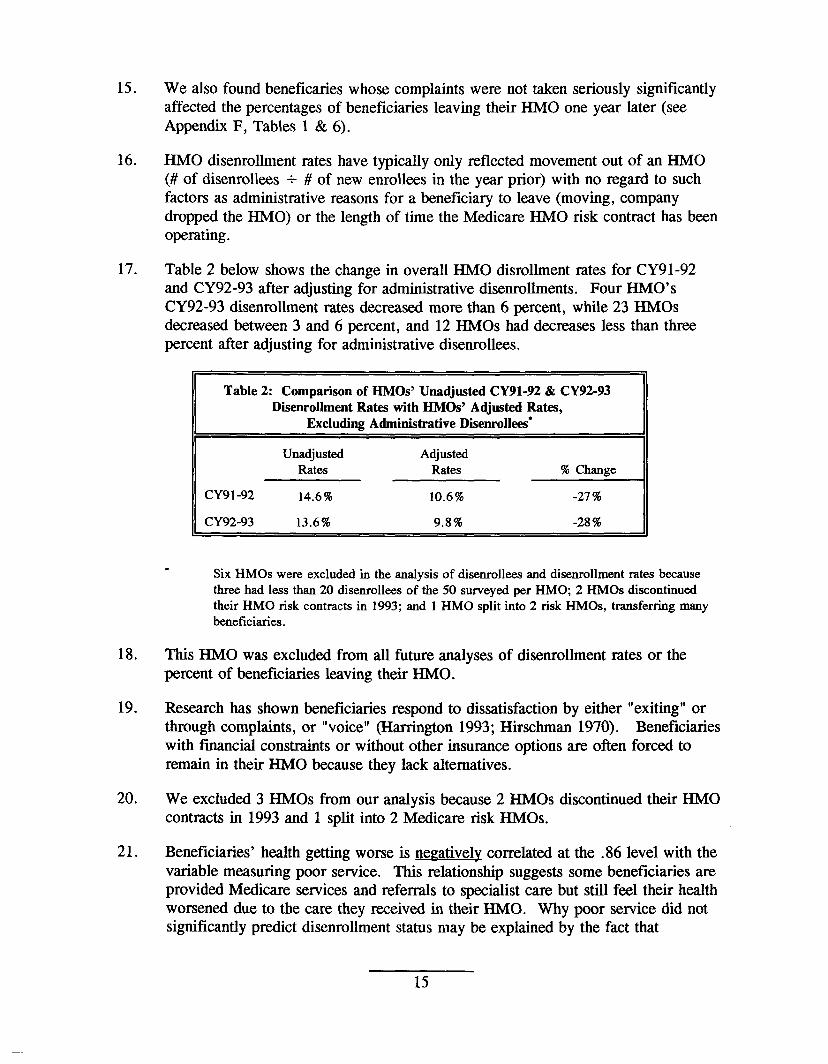
REGION HEADQUARTERS
Michelle Adams Judith Tyler Hugh Hetzer Carolyn Neuwirth Nancy Watts Mark Krushat Sarah Taylor Brian Ritchie
Barbara Tedesco
For additional copies of this report, please contact the Dallas Regional Ofllce at (800) 848-8960.
Department of Health and Human Services
OFFICE OFINSPECTOR
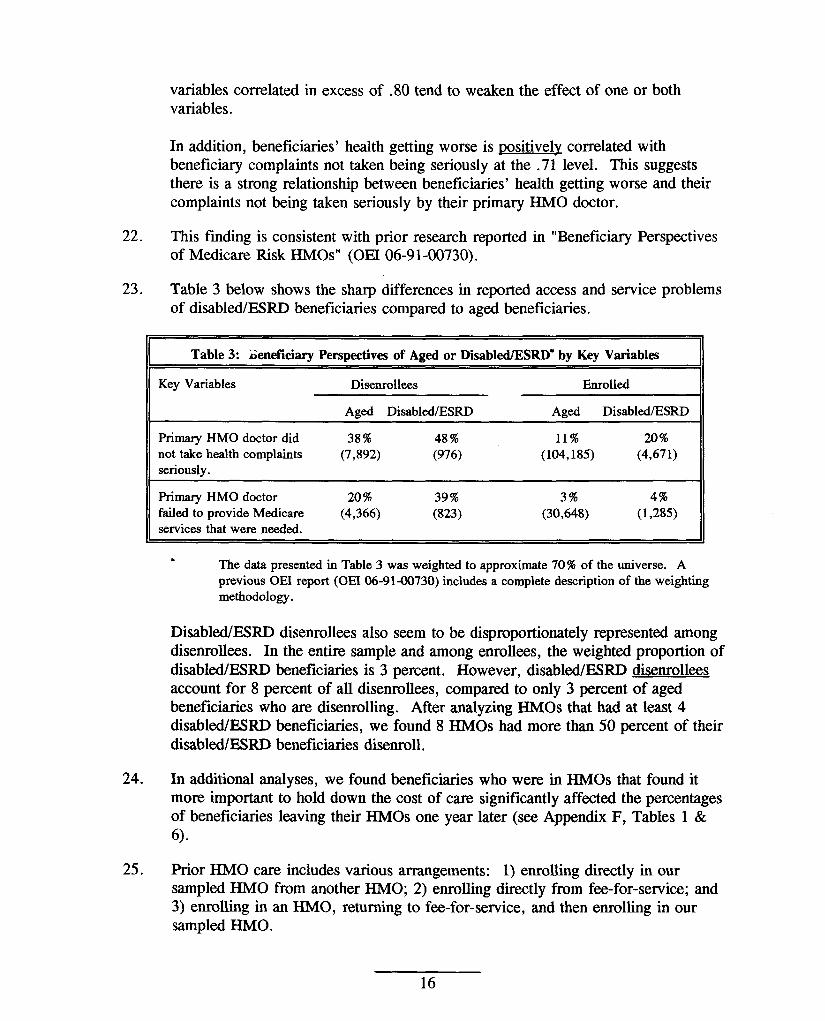
MEDICAREPERFORMANCE
*4. S6WICJ$ “%
~w : s% ~ %‘%za+*2
GENERAL
RISK HMOINDICATORS
JUNE GIBBS BROWN Inspector General
OCTOBER 1995 OEI 06-91-00734
EXECUTIVE SUMMARY
PURPOSE:
To determine the usefulness of HMO disenrollment rates as performance indicators of Medicare risk HMOS, in light of our recent beneficiary survey data.
BACKGROUND AND METHODOLOGY:
The rapidly increasing participation of Medicare and Medicaid beneficiaries in managed care has heightened the need to fmd valid measures and performance indicators for HMOS. Two measures which have been considered by researchers and policy analysts are HMO disenrolhnent rates and direct surveys of HMO members. We previously reported results from a survey of 2,882 enrolled and disenrolled beneficiaries in 45 Medicare risk HMOS. Using our survey data, coupled with disenrollment data for these HMOS, we conducted both beneficiary and HMO-level analyses to assess the validity of using disenrollment rates as indicators of HMO performance, and participant survey data to predict disenrollment. This report presents our analyses and conclusions regarding the viability of these two performance indicators.
FINDINGS
Disenrollrnent Rates as a Pe~orrnance Indicator
HMO disenrollment rates, once properly adjusted, may provide an early alert of possible problems among Medicare risk HMOS. HMOS with higher disenrollrnent rates had more enrollees who reported service access problems. However, the following adjustments to HMO disenrolhnent rates are needed to accurately reflect HMO trends:
� Annualize the rates to more accurately portray disenrollment activity among newer HMO risk contracts.
� Adjust rates for administrative disenrollments (e.g. beneficiaries moving out of the service area).
� Recognize disenrolhnent rates will be understated because they do not capture those beneficiaries who want to leave but cannot.
HMO Disenrollment Palterns
HMOS with more experience in the Medicare risk HMO program experienced the largest decreases in their disenrollment rates over time.
i
Beneficiary Disenrollment Patterns
Beneficiary-level survey data showed beneficiaries who are more likely to disenroll tend to report: 1) declining health due to HMO care; 2) being disabled or having end-stage renal disease (ESIU)); 3) perceiving that their HMO places more importance on holding down the cost of care rather than giving the best medical care possible; and 4) experiencing long waits in a primary HMO doctor’s office.
Beneficiaries leaving Medicare risk HMOS ofien re-enroll directly, or shortly thereafter, in another HMO.
RECOMMENDATIONS
HMO disenrollment rates, in conjunction with beneficiary survey data, appear to be useful HMO performance indicators. Overall, we recommend that HCFA use systematically developed HMO disenrolhnent rates and beneficiary survey data to improve its monitoring activities. We believe this is a particularly important step in light of the anticipated rapid growth of the Medicare risk HMO program. We spcciilcally recommend that HCFA:
Use Disenrolhnent Data
F Tmck disenrollment rates over time to detect potential problems among HMOS.
F Use tijusted disendrnent ties, along with other available HMO information (e.g. beneficiary complaints and appeals lodged against HMOS) to target reviews of HMOS. Adjustments must include: 1) annualizing rates for Medicare risk HMO contracts less than 2 years old to more accurately measure newer HMOS’ disenrollment activity, and 2) excluding administrative disenrollees, which overstate disenrollment rates due to such factors as enrollees moving or HMO plan discontinuation.
� Conduct disenmllment surveys that fully capture all the beneficiary’s reasons for leaving the Medicare risk HMO.
Use Beneficiary Survey Data
F Survey enroUees systematically and routinely on key questions and on their desire to leave/remain with an HMO, to complement disenrollrnent data. Such survey data might be captured nationally, to assist in targeting HMOS for in-depth reviews, or in the HMOS which have been targeted as part of the in-depth review itself.
F Monitor Medicare risk HMOS with high disenrollment rates and repotted service access problems and work with HMOS to respond to the needs of k-neficiaries at risk of disenrolling. This should include activities that: 1) give more attention to the care delivered to disabled/ESRD beneficiaries; 2) reduce the waiting times in
ii
primary HMO doctor offices; and 3) address HMO practices that cause beneficiaries to report declining health status as a result of their HMO care and their sense that the HMO gives too much priority to holding down costs versus giving the best care.
Use Key Questions
Several key questions successfully predicted future disenrollment and HMO disenrollment rates, along with beneficiaries who wanted to leave but felt they could not.
� The questc”onswe found most predictive of benejiciuries’ future disenrollment included:
� Were complaints taken seriously by their HMO doctors?
� Did their primary HMO doctors provide Medicare services, admit them to the hospital, or refer them to a specialist when needed?
� Did they perceive their HMOS as giving too high a priority to holding down the cost of medical care compared to giving the best medical care?
� Did they perceive their health got worse as a result of the medical care they received in their HMO?
� Did they experience long waits (1 hour or more) in their primary HMO doctors’ offices?
AGENCY COMMENTS
HCFA concurred with the report’s recommendations. They noted several projects underway by the OffIce of Managed Care (OMC) and other work groups addressing many of the recommendations. We applaud their efforts. We would emphasize the importance of conducting systematic and ongoing national surveys that are statistically sound and contain a sufficient representation from individual Medicare HMOS to obtain comparable, nonbiased data.
. . . 111
TABLE OF CONTENTS
PAGEEXECUTIVE SUMMARY . . . . . . . . . . . . . . . . . . . . . . . . . . . . . . . . . . . ..i
INTRODUCTION . . . . . . . . . . . . . . . . . . . . . . . . . . . . . . . . . . . . . . . ...1
FINDINGS . . . . . . . . . . . . . . . . . . . . . . . . . . . . . . . . . . . . . . . . . . . . ...5
Disenrollment Rates asaPerformance Indicator . . . . . . . . . . . . . . . . . . . . . 5
HMO Disenrollment Patterns. . . . . . . . . . . . . . . . . . . . . . . . . . . . . . ...7
Beneficiary Disenrollment Patterns . . . . . . . . . . . . . . . . . . . . . . . . . . ...7
RECOMMENDATIONS . . . . . . . . . . . . . . . . . . . . . . . . . . . . . . . . . . . . . 10
AGENCY CO MMENTs .....a.............. . . . . . . . . . . . . . . ...12
ENDNOTES . . . . . . . . . . . . . . . . . . . . . . . . . . . . . . . . . . . . . . . . . . . . . 13
BIBLIOGRAPHY . . . . . . . . . . . . . . . . . . . . . . . . . . . . . . . . . . . . . . . ..18
APPENDICES
A: Adjusted CY92-93Disenrollment Rates by Key Variables . . . . . . . . . . . A-1
B: Annualized CY91-92and CY92-93 Disenrollment Rates for NewHMOs . . . B-1
c: CY92-93Disenrollment Rates Adjusted for Administrative Disenrollees . . . C-1
D: CY91-92and CY92-93Disenrollment RatesbyHMO . . . . . . . . . . . . . D-1
E: Analysis ofBeneficiaries More Likely toDisenroll. . . . . . . . . . . . . . . . .E-l
F: Key Linear Regression Variables and Results . . . . . . . . . . . . . . . . . . . F-1
G: Agency Comments . . . . . . . . . . . . . . . . . . . . . . . . . . . . . . . . . . G-1
INTRODUCTION
PURPOSE
To determine the usefulness of HMO disenrollment rates as performance indicators for Medicare risk HMOS, in light of our recent beneficiary survey data.
BACKGROUND
As of February 1995, the Health Care Financing Administration (HCFA) reported 157 Medicare risk HMO plans served approximately 2.4 milLion beneficiaries, an increase of 70 contracts in just two years. The rapidly increasing participation of Medicare and Medicaid beneficiaries in managed care has heightened the need to fmd valid measures and performance indicators for HMOS. Two measures which have been considered by researchers and policy analysts are HMO disenrollment ratesl and direct surveys of HMO members.
Prior research on disenrolhnent rates and patterns for Medicare risk HMOS has generally been retrospective and limited to disenrollee data. Using this approach, they found disenrollment rates were lower for plans that were nonprofit, not federally qualifkd, and group models (Brown et. al. 1986), and higher for plans that were networldmixed models, for-profit, lacking a chain affiliation, and having fewer than 1,000 or more than 10,000 Medicare beneficiaries enrolled (HCFA 1990). Reasons for disenrollment were discontent with physicians, often caused by poorly established relationships with them; financial constraints, such as high premiums; and HMO pmceduml constraints, such as needing a primary HMO doctor’s referral for other services (Porell et al. 1992; Rossiter et al. 1988, 1989; Ward, R.A. 198’7). Studies exploring the geneml characteristics of disenrollees have found that those reporting access problems were more likely to have Mdlcare entitlement through disability, reported fair or poor health status, had out-of-plan use, had either very high or no HMO physician/specialist use, and disenrolled within three months of enrollment (Porrell et al. i992).
One study on Medicare risk HMOS, which used demographic information for both enrollees and disenrollees, concentrated on beneficiary satisfaction and how this related to disenrollment from social/HMOs2 @rrington et al. 1993). Disenrollees, compared to enrollees, were more likely to not live alone, have some other type of health insurance or Medicaid, have an employer who pays for the insurance, and report having inadequate information when they joined the HMOS. Disenrollees were also more likely to have better health status, have no impairments in activities of daily living, and have required no hospital or chronic care.
1
continuity and consistency with our frost report, we separated enrollees and disenrollees for most HMO-level data analysis. Also, since our individual-level data was a disproportionate sample of enrollees and disenrollees, we had to account for varying response rates per HMO. Specitlcally, enrollees were distributed among all 45 HMOS, but disenrollee representation was limited. Four HMOS had less than 20 of 50 disenrollees return their survey. Thus, for disenrollees only, these 4 HMOS were dropped from fimtber analysis. Our intent was not to generalize our findings to all Medicare risk HMOS but to use our data to detect trends within our own sample, especially to illustrate the utility of HMO-level analyses.
Regression Analysis of Data
We analyzed the data at the beneficiary-level and at the HMO-level, using both linear and logistic regression models. Due to the continuous nature of the dependent variables (e.g. HMO disenrollmefit rates), linear regression models were used for any data aggregated at the HMO-level. Logisitic regression models were used for the beneficiary-level data because the dependent variable in this analysis was binary, either a one (1) if the event occurred or a zero (0) if otherwise.
b Linear remwsion analyses - Beneficiary responses from key survey questions were linked to their respective HMOS and became variables used in all regression analyses, along with structural factors for each HMO. Except for some structural factors, all variables were continuous, measuring the percentage of beneficiaries reporting a particular occurrence within each HMO. Only the dependent variable measuring HMO disenrollment rates is presented as a finding in the main body of this report. Several additional analyses were conducted but are only referenced as an endnote or included in the Appendix material. These analyses included models with dependent variables measuring the percentage of HMO beneficiaries who want to leave but cannot, and those who actually lefi within one year of our survey.
Key survey questions, used to identify potential problems in our companion reports, are included for each HMO in our regression analysis and show the percent of beneficiaries:
� receiving fee-for-service prior health care� self-reporting serious health problemsg� being asked inappropriate questions about health at application� waiting an hour or more to see a primary HMO doctor� perceiving declining health as a result of HMO care� saying their complaints were not taken seriously by a primary HMO doctor� seeking out-of-plan medical care while in the HMO� reporting it was more important to their HMOS to hold down the cost of
medical care than to provide the best medical care possible � saying their primary HMO doctors did not provide Medicare services,
admit them to the hospital, or refer them to a specialist when needed
3
� Logistic remession analvsis - For the logisitic regression, all variables, except age, used individual-level beneficiary data coded as binary variables, i.e., either a characteristic existed (coded as 1) or otherwise (coded as O). The dependent variable, being a sampled disenrollee or otherwise (enrollee), measured the change in the referent category (disenrollee) produced by each independent variable (see Appendix E). Additional independent variables used in logisitic regression analysis include:
� Medicare category: beneficiary was disabled or had end-stage renal disease (ESRD)
� beneficiary’s age � non-competitive area: beneficiary lived in a county with no other Medicare
risk HMO contract � propensity: beneficiary’s propensity to use medical services was low or
medium � prior care: beneficiary was enrolled in an HMO before joining sampled
HMo � health worsened: beneficiary reported health declined due to care provided
by the sampled HMO
This inspection was conducted in accordance with the Quality Standar& for Inspection issued by the President’s Council on Integrity and Eftlciency.
4
FINDINGS
DISENROLLMENT RATES AS A PERFORMANCE INDICATOR
HMO disenrollment raies, once properly tijusted, may provide an early alert of possible problems among Medicare risk HMOS.
HMOS with high disenrollment mtes could be targeted for follow-up analysis and further investigation by HCFA. However, disenrollment rates, like other performance indicators, should not be used as a sole measure of performance but are most helpful when used in conjunction with beneficiary survey data.
HMOS wilh higher disenrollment rates had more enrollees who reported service access problems.
Enrollees who said they experienced poor service, whose complaints were not taken seriously, and who were in for-profit HMOS, were more likely to come from HMOS with higher disenrollment rates.9 These 3 factors helped explain much of the variation in our HMOS’ Calendar Year 1992-93 disenrollment ratesl”, even after controlling for such structural characteristics as HMO type and enrollment size (see Appendix A and Appendix F, Tables 1 and 5).:1
Poor service
� Poor service (e.g. primary HMO doctor did @ provide Medicare services, admit to the hospital, or refer to a specialist when needed) had the largest impact on disenrollrnent rates. 12 HMOS with the 5 highest disenrollment rates were 1.5 times more likely to have beneficiaries who reported poor service (18 percent vs. 12 percent). 13
Complaints not taken seriouslv
� The perception that a primary HMO doctor did @ take a beneficiary’s complaints seriously strongly affects disenrollment rates. 14’15The 3 HMOS with the highest disenrollment rates also have the highest percentages of beneficiaries reporting their complaints were not taken seriously (see Appendix A).
Profit status
� Profit status also significantly influences fi.dnre disenrollrnent rates. Four of the 5 HMOS with the highest disenrollment rates were for profit HMOS.
5
HMO disenrollment ties need adjustment to more accurately reflect trends within HMOS.
HMO disenrollment rates, in their raw form, do not accurately reflect beneficiary disenrollment patterns. They may overstate or understate the true rate. For example, limited GHP information regarding beneficiaries’ reasons for disenrollment would overstate the true disenrollment rate. 16 To correct some of these problems, adjustments are needed before using HMO disenrollment rates.
Annualize HMO disenrollment rates.
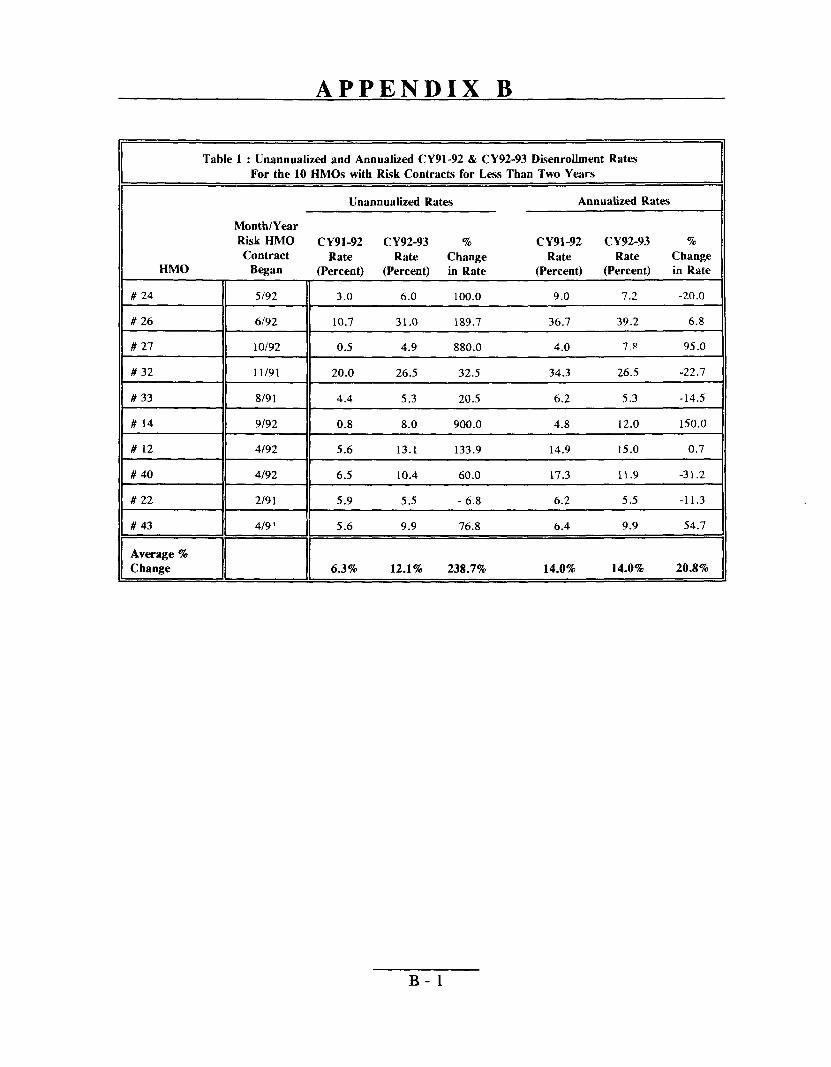
We found the length of the HMO contract sigtilcantly influenced large changes in disenrollment rates over time (see Appendix F, Tables 1 and 2). For the time periods we measured, HMOS with risk contracts less than two years old experienced enormous increases in disenrolhnent rates. These HMOS had disenrollrnent rates that were understated because not enough time had elapsed to fully measure their disenrollment rates. However, after annualizing disenrolhnent rates for our 10 newer HMOS, these increases were less dramatic’ (see Appendix B).
Account for administrative disenrolhnents.
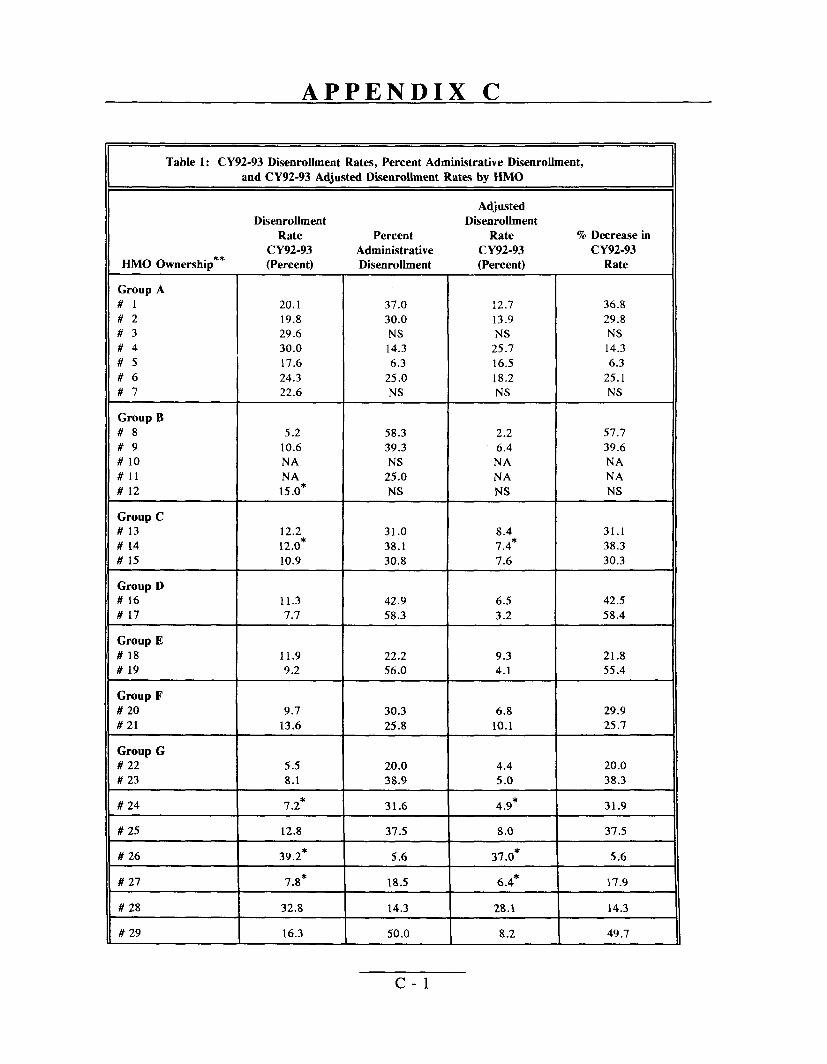
We found administrative disenrollments overstate true HMO disenrollment rates. Almost one-third of disenrollees surveyed left solely for administrative reasons, such as moving, procedural errors, or an HMO no longer participating in the Medicare risk HMO progmm or in a company’s retirement plan. Adjusting for administmtive disenrcdlments resulted in substantial decreases in disenrollment rates for several HMOS; 17 HMOS experienced a drop of 33 percent or more, one declined 71 percent. The average change in disenrollment rate, after adjusting for administrative disenrolkxs, was a decrease of 32 percent17 (see Appendix C).
Using disenrollment rates without feedback on why beneficiaries left can be very misleading. As mentioned, sometimes beneficiaries have only moved or were disenrolled in error. In a more dramatic example, 1 HMO experienced a 725 percent increase in its disenrollment rate from Calendar Years 1991-92 to Calendar Years 1992-93, with a rise from 4 to 33 percent. One year after our survey, 74 percent of surveyed beneficiaries lefl this HMO. Interestingly, our survey feedback for this HMO showed w widespread beneficiary discontent. Upon further examination, we found this increase resulted from the HMO splitting into 2 HMOS. Beneficiaries were administratively transferred from one HMO risk contract to the new risk contract operated by the same company .18
* Annualizeddisenrollmentrates were used in the analysis on page 5 and throughout the remainder of the report, allowing for comparisonsof older and newer HMO risk contracts.
6
Recomize disenrollment rates will not ca@ure information from those enrollees who want to leave but cannot.
Enrollees wanting to leave their HMOS, but saying they cannot, comprise an unmeasured group in any assessment of HMO disenrollment rates, thus, understating the true rate. Ten percent of surveyed enrollees wanted to leave but could not, primarily because they thought they could not afford to leave. One HMO had 26 percent of its beneficiaries reporting this situation+ Since only 9 percent of enrollees wanting to leave actually left within one year after our survey, many of this group’s concerns will not be measured by future HMO disenrollment rates. 19
HMO DISENROLLMENT PATTERNS
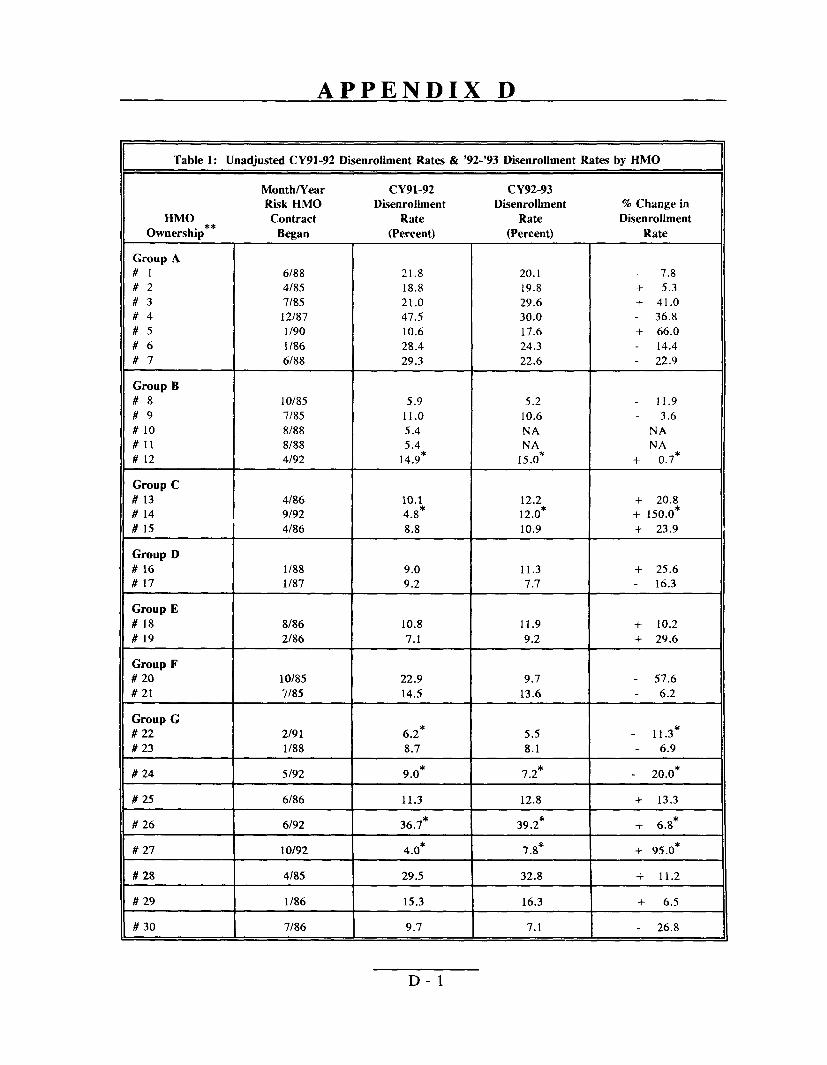
HiWOs with more experience in the Medicare risk HMO program experienced the largest decreases in their disenrollment &es over time.
Although disenrollment rates averaged a 6 percent increase over the two time periods measured, individual HMO disenrollment rates fluctuated rather widely, with an average 26 percent change in absolute value. 20 HMOS with older risk contracts experienced the largest decreases in their disenrollment rates. The largest decrease, 62 percent, occurred in an HMO which began its risk contract in 1987. The largest increase in disenrollment rate, 150 percent after annualizing, occurred in an HMO which began its risk contract in 1992 (see Appendix D).
BENEFICIARY DISENROLLMENT PATTERNS
By using beneficiary survey data responses we were able to determine: 1) which beneficiaries were more likely to be an enrollee or a non-administrative disenrollee based on their answers to key survey questions (see Apyendix E) and 2) beneficiary enrollment patterns before joining and after leaving a sample HMO.
Beneficiaries who are more likely to disenroll tend to repoti declining hedh due to HMO care received, being disabled/ESRD, being in HMOS perceived as @“vingmore impotiance to holding down the cost of care, and experiencing long waits in a primary HMO doctor’s office
In this section, beneficiary responses were analyzed as sampled (e.g. enrolled or disenrolled), and not in reference to their disenrollment status after we surveyed them.
Beneficiaries health worsened
� Beneficiaries saying their health got worse as a result of the care they received from their HMO were 5 times more likely to disenroll.21 This factor was the strongest predictor of disenrollment status.
7
Disabled/ESRD beneficiary
� Disabled/BSRD beneficiaries were 3.5 times more likely to disenroll.zz This group reported more access and service problems compared to aged beneficiaries. 23
Holdimz down costs perceived as more imDortant to HMO than zivin~ the best medical care Dossible
� Beneficiaries perceiving their HMOS give more importance to holding down the cost of care were 3.4 times more likely to disenroll.x
Long waits in primarv HMO doctor’s office
� Long waits in their primary HMO doctor’s office made beneficiaries 2.8 times more likely to dlsenroll.
Beneficiaries leaving Medicare risk HMOS ofien re-enroll immediately, or shortly thereafter, in another HMO.
Beneficiaries switch frequently between fee-for-service and HMOS after they disenroll. However, this disenrollment ofien does not mean beneficiaries leave HMOS for long periods of time. Enrollment patterns among Medicare risk HMOS suggest market factors (e.g. expensive premiums/co-payments) strongly influence beneficiary disenrollment. However, survey data also show perceived service access problems are a major influence on whether beneficiaries disenroll from their HMO.
Previous HMO exwrience:
Of the 31 percent of beneficiaries with prior HMO experience, 69 percent went directly from the prior HMO to our sample HMO, while 31 percent went into fee-for-service. This latter group received care them for an average of 25 months.25 Seven percent of beneficiaries left an HMO in 1 state and enrolled in a new HMO in another state.
Nine percent of beneficiaries disenrolled from their previous HMO, where they averaged 14 months of care, and received fee-for-service care for just over one year. These beneficiaries then re-enrolled in the same HMO, receiving an average of 23 months of care.
8
!Mnmle HMO ex~erience:
Beneficiaries stayed in our sample HMOS an average of 26 months: 18 percent wereenrolled between 1 and 3 months; 22 percent, four months to 1 year; 19 percent, at least1 year; and 41 percent, more than 2 years. Of the beneficiaries who were surveyed asdisenrollees, the following were some of the most frequent reasons for leaving:
� 31 percent said their premium/co-payments were too expensive� 30 percent did not like their choice of doctors� 25 percent moved� 25 percent wanted to use the doctor they had prior to this HMO
24 percent did not like going through their primary HMO doctor for other services
Of the 5 percent who said they planned to leave their HMO, ahnost half (47 percent) actually left within me year. Over one-third who planned an administrative deparhme (i.e. moving), in fact, left their HMO. Thus, information on beneficiaries planning to leave may provide powefil insight for predicting future beneficiary disenrollment.
Post HMO ex~erience:
Sixty-five percent of beneficiaries went directly back into fee-for-service after disenrolling from their HMOS.2GJ27However, 18 percent of this group stayed in fee-for-service an average of 5 months and then returned to an HMO. Therefore, nearly half of beneficiaries leaving their HMO, either initially or eventually, enrolled in an Hl 10. Ten percent of these beneficiaries enrolled in a new HMO in another state. Another 12 percent of beneficiaries switched back to the same HMO they were in prior to joining our sampled HMo.
Twelve percent of beneficiaries received care through fee-for-service for an average of 5 months before m-enrolling in the same HMO in which they were sampled. Their reasons for leaving include: 1) moving; 2) wanting to use the doctor they had prior to this HMO; 3) not liking their choice of doctors; and 4) the premium/co-payment being too costly.
9
c
RECOMMENDATIONS
HMOdisenrollrnent rates, inconjunction with beneficia.ry survey data, appear to be usefulHMO performance indicators. High disenrollment rates or frequent reports of serviceaccess problems should be a warning to HCFA of a potentially problematic HMO.Overall, we recommend that HCFA use systematically developed HMO disenrollmentrates and beneficiary survey data to improve its monitoring activities. We believe this is aparticularly important step in light of the anticipated rapid growth of the Medicare riskHMO progmm. We specifically recommend that HCFA:
USE DISENROLLMENT DATA
� Track disenrollment rules over time to detect potential problems among HMOS. HMOS experiencing larger than average increases in disenrollment rates should be monitored more closely.
� Use tijusted disenrollment rates, along with other available HMO information (e.g. beneficiary complaints and appeals lodged against HMOS) to target reviews of HMOS. Adjustments must include:
� Annualizing rates for Medicare risk HMO contracts less than 2 years old to more accurately measure newer HMOS’ disenrolhnent activity. Waiting to evaluate HMOS until they become fidly operational might jeopardize the health of and service to Medicare beneficiaries, especially since nearly half of risk contracts are less than 2 years old. Alternative methods, such as annualizing, will allow HCFA and other researchers to keep abreast of potential problems of all HMOS and not just the HMOS with older contracts.
� Excluding administrative disenrollees, which overstate disenrollment rates due to such factors as enrollees moving or HMO plan discontinuation.
� Conduct disenrollment surveys that fully capture all the beneficiary’s reasons for leaving the Medicare risk HMO. This information should be included in the GHP data fdes.
USE BENEFICIARY SURVEY DATA
As discussed in previous OIG reports providing results of our beneficiary survey data, this information can be useful in a number of different ways. We emphasize here two uses: supplementing disenrollment data to assess HMO performance, and pinpointing problem areas that might lead beneficiaries to disenroll.
10
� Survey enrollees systemah”cally and routinely on key questions and on their desire to leave/remain with an HMO, to complement disenrollment data. Such survey data might be captured nationally, to assist in targeting HMOS for in-depth reviews, or in the KMOS which have been targeted as part of the in-depth review itself.
� Monitor Medicare risk HMOS with high disenrollment nrtes and repotied service access problems and work with HMOS to respond to the needs of beneficiaries at risk of disenrolling. This should include activities that: 1) give more attention to the care delivered to disabled/ESRD beneficiaries; 2) reduce the waiting times in primary HMO doctor ofilces; and 3) address HMO practices that cause beneficiaries to report declining health status as a result of their HMO care and their sense that the HMO gives too much priority to holding down costs versus giving the best care.
USE KEY QUESTIONS
Several key questions successfully predicted future disenrollment and HMO disenrollment rates, along with beneficiaries who wanted to leave but felt they could not.
F The questions we found most predictive of beneficiaries’ fidure disenrollment included:
� Were complaints taken seriously by their HMO doctors?
� Did their p~imary HMO doctors provide Medicare services, admit them to the hospital, or refer them to a specialist when needed?
* Did they perceive their HMOS as giving too high a priority to holding down the cost of medical care compared to giving the best medical care?
� Did they perceive their health got worse as a result of the medical care they received in their HMO?
� Did they experience long waits (1 hour or more) in their primary HMO doctors’ offices?
11
AGENCY COMMENTS
We received comments from the Health Care Financing Administration (HCFA). The full text of their comments is in Appendix G.
The HCFA concurred with all of the report’s recommendations. HCFA noted that the Office of Managed Care (OMC) has developed a plan profde report which incorpomtes a number of data elements on disenrollrnent. These profdes are reviewed on an ongoing basis by OMC’S Operations and Oversight Team. HCFA reports it is currently implementing a new disenrollment form to capture signiilcant data regarding motivations for disenrollment. With the addition of this information, we believe that HCFA should be able to adjust HMO disenrollment rates by accounting for administrative disenrollments. As it pursues this initiative, we suggest that HCFA: 1) attempt to capture all the beneficiaries’ significant reasons for leaving the Medicare risk HMO; 2) include disenrollment information in the GHP data files so that researchers can properly adjust disenrollment rates when studying Medicare risk HMOS; and 3) annualize disenrollment rates to improve comparability of newer HMO contracts with older ones.
A work group within HCFA is also currently developing a strategy on beneficiary satisfaction surveys. We applaud their efforts. Due to the difficulties involved in measuring satisfaction, we urge that the survey focus more on measuring enrollee service access than on beneficiary satisfaction. We would emphasize the importance of conducting systematic and ongoing national surveys that are statistically sound and contain a sufficient representation from individual Medicare HMOS to obtain comparable, nonbiased data. These surveys should ask key questions that we know are predictive of future disenrollment and also focus on service access for disabled/ESRD beneficiaries. The results of these surveys should be included in the HMO plan profde report and used proactively by HCFA to detect potential problems among HMOS.
12
EN DNOTES
1. Several researchers have suggested Medicare risk HMOS should be required to disclose disenrolltnent rates to serve as a proxy for such things as enrollment and service access problems (Prasad and Javalgi 1992; Porrell et al. 1992).
2. Social/Health Maintenance Organizations offer expanded benefits in addition to those normally offered by Medicare risk HMOS, such as outpatient prescription drugs, eyeglasses, and/or chronic care benefits. In return for these expanded benefits, beneficiaries am charged premiums.
3. We did not speciilcally ask beneficiaries about their satisfaction with the HMOS, as the concept of satisfaction is less objective than, and sometimes independent of, the issues of membership in a Medicare risk HMO.
4. Since our primary focus was Medicare beneficiaries’ perceptions, we collected information from them and did not contact HMOS or their staffs, nor did we attempt to assess the quality or propriety of medical care rendered by the HMOS to these beneficiaries.
5. We selected a stratifkxl random sample from HCFA’S Group Health Plan (GHP) data base. First, we sampled 45 HMOS from the 87 HMOS under a risk contract with HCFA as of February 1993. Beginning with the GHP data, we counted the number of enrollments occurring within calendar years 1991 and 1992. For this cohort, we then calculated the proportion of disenrollments within the following 12 months. Based on this disenrollment rate, we divided the 87 risk HMOS into three strata of 29 HMOS each. Within each strata, we selected 15 HMOS by simple random sampling. Second, from each sampled HMO, we randomly selected 50 Medicare beneficiaries who were enrolled as of February 28, 1993 and 50 who had disenrolled between November 1992 and February 1993 inclusive. When the total number per HMO for either group was less than 50, we selected them all. Using HCFA’s Enrollment Data Base, we excluded, from the sampling universe, beneficiaries who had died or who appeared as current enrollees, but had actually disenrolled since the last update to the GHP fde. This process resulted in 2,217 enrollees and 1,915 disenrollees for a total of 4,132 beneficiaries. A total of 2882 surveys were deemed usable, yielding an unweighed return rate of 70 % overall, 77% for enrollees (N= 1,705) and 61% for disenrollees (N= 1, 17’7).
6. See “Beneficiary Perspectives of Medicare Risk HMOS, ” OEI-06-9 1-00730 and “Medicare Risk HMOS: Beneficiary Enrollment and Service Access Problems, ” OEI-06-91-00731 .
13
7.
8.
9.
10.
11.
12.
13.
14.
HMO model types are divided into three categories. Group models contract with independent, multispecialty physician groups. Individual practice associations (IPAs) contract with independent physicians or small, single specialty physician groups who also maintain private practices co-jointly with their HMO contract. Staff models directly employ salaried physicians to serve patients.
Beneficiaries with serious health problems had one or more illnesses, e.g., heart attack, cancer, or pneumonia.
As found in past surveys, disenrollees are consistently more dissatisfied than enrolled beneficiaries (OIG/OEI 1994; Barrington 1993). We found survey data of enrollees more powerfully differentiates problematic HMOS. We were able to explain 20 percent more of the variation in disenrolhnent rates for CY92-93 by using the experiences of just enrollees.
HMO disenrollment rates for 1992-93 were adjusted as discussed on page 6 to— more accurately reflect each HMO’s true dlse~ollment rate.
Table 1 below shows the sharp contrast between the average percentage of beneficiaries reporting service problems at the 5 HMOS with the highest disenrolhnent rates compared to other surveyed HMOS.
Table 1: Comparisonof HMOSWith Top 5 Dknrolhnent Rates Compared To AU Other Surveyed HMOs by Key Variables
Top 5 HMOSwith Highest Disenrollment Other Surveyed
Key Variables Rates HMOS
Receivedpoor service 18.0% 12.1%
Complaintsnot taken seriouslyby primary HMO doctor 21.4% 15.4%
* Six HMOSwere excluded in the analysis of disenrolleesand disenrolhnent rates because three had less than 20 disenrokes of the 50 suweyedper HMO;2 HMOSdiscontinued theirHMOrisk contracts in 1993; and 1 HMO split into 2 risk HMOS, transferring many beneficiaries.
For every 1 percent increase in HMO beneficiaries reporting poor service, HMO disenrollment rates changed .68 percent.
Poor service also signitlcantly influenced the percentage of beneficiaries who wanted to leave but could not (see Appendix F, Tables 1 & 3).
Future HMO disenrolhnent rates increased .51 percent for every 1 percent increase in HMO beneficiaries’ complaints not being taken seriously.
14
15. We also found beneficiaries whose complaints were not taken seriously significantly affected the percentages of beneficiaries leaving their HMO one year later (see Appendix F, Tables 1 & 6).
16. HMO disenrolhnent rates have typically only reflected movement out of an HMO (#of disenrollees -+ # of new enrollees in the year prior) with no regard to such factors as administrative reasons for a beneficiary to leave (moving, company dropped the HMO) or the length of time the Medicare HMO risk contract has been operating.
17. Table 2 below shows the change in overall HMO disrollment rates for CY91-92 and CY92-93 after adjusting for administmtive disenrollments. Four HMO’s CY92-93 disenrollment rates decreased more than 6 percent, while 23 HMOS decreased between 3 and 6 percent, and 12 HMOS had decreases less than three percent after adjusting for administmtive disenrollees.
Table 2: Comparison of HMOS’ Unadjusted CY91-92 & CY92-93Dkenrollment Rates with HMOS’ Adjusted Rates,
Excluding Administrative Dkenrollees”
Unadjusted Adjusted Rates Rates !%Change
CY91-92 14.6% 10.6% -27%
CY92-93 13.6% 9.8% -28 % II
* SIXHMOSwere excluded in the analysis of disenrolleesand disenrollmentrates because three had less than 20 disenrolleesof the 50 surveyedper HMO; 2 HMOSdiscontinued their HMO risk contracts in 1993; and 1 HMO split into 2 risk HMOS, transferring many beneficiaries.
18. This HMO was excluded from all i%ture analyses of disenrolhnent rates or the percent of beneficiaries leaving their HMO.
19. Research has shown beneficiaries respond to dissatisfaction by either “exiting” or through complaints, or “voice” (Wrrington 1993; Hirschman 1970). Beneficiaries with financial constraints or without other insurance options are often forced to remain in their HMO because they lack alternatives.
20. We excluded 3 HMOS from our analysis because 2 HMOS discontinued their HMO contracts in 1993 and 1 split into 2 Medicare risk HMOS.
21. Beneficiaries’ health getting worse is ne~ativel~ correlated at the .86 level with the variable measuring poor service. This relationship suggests some beneficiaries are provided Medicare services and referrals to specialist care but stiLlfeel their health worsened due to the care they received in their HMO. Why poor service did not significantly predict disenrollment status may be explained by the fact that
15
variables correlated in excess of .80 tend to weaken the effect of one or both variables.
In addition, beneficiaries’ health getting worse is positivelv correlated with beneficiary complaints not taken being seriously at the .71 level. This suggests there is a strong relationship between beneficiaries’ health getting worse and their complaints not being taken seriously by their primary HMO doctor.
22. This finding is consistent with prior research reported in “Beneficiary Perspectives of Medicare Risk HMOS” (OEI 06-91-00730).
23. Table 3 below shows the sharp differences in reported access and service problems of disabled/ESRD beneficiaries compared to aged beneficiaries.
Table 3: Geneflciary Perspectives of Aged or Dkabled/ESRD* by Key Variables
Key Variables Disenrollees Enrolled
Aged Disabled/ESRD Aged Disabled/ESRD
Primary HMO doctor did 38% 48% 11% 20% not tie healthcomplaints (7,892) (976) (104,185) (4,671) seriously.
PrimaryHMOdoctor 20% 39% 3% 4% failedto provideMedicare (4,366) (823) (30,648) (1,285) servicesthat wereneeded.
* The data presented in Table 3 was weighted to approximate 70% of the universe. A
previous OEI report (OEI 06-91-00730)includesa completedescriptionof the weighting methodology.
Disabled/FZSRD disenrollees also seem to be disproportionately represented among disenrollees. In the entire sample and among enrollees, the weighted proportion of disabled/ESRD beneficiaries is 3 percent. However, disabled/ESRD disenrollees account for 8 percent of all disenrollees, compared to only 3 percent of aged beneficiaries who are disenrolling. After analyzing HMOS that had at least 4 disabled/ESRD beneficiaries, we found 8 HMOS had mom than 50 percent of their disabled/ESRD beneficiaries disenroI1.
24. In additional analyses, we found beneficiaries who were in HMOS that found it more important to hold down the cost of care signifkantly affected the percentages of beneficiaries leaving their HMOS one year later (see Appendix F, Tables 1 & 6).
25. Prior HMO care includes various arrangements: 1) enrolling directly in our sampled HMO from another HMO; 2) enrolling directly from fee-for-service; and 3)enrolling in an HMO, returning to fee-for-service, and then enrolling in our sampled HMo.
16
26. SeeEndnote #10.
27. One study of disenrolhnent patterns of Medicare risk beneficiaries found beneficiaries were less likely to enroll in another HMO if they had some type of “other insurance” (Barrington 1993).
17
BIBLIOGRAPHY
Brown, R. S. 1988. Biased Selection in the Medicare Competition Demonstrations. Princeton, N. J.: Mathematical Policy Research.
Brown, R. S., K. Langwell, K. Berman, A. Ciemenecki, L. Nelson, A. Schreier, and A. Tucker. 1986. Enrollment and Disenrollment in Medicare Competition Demonstration Plans: A Descriptive Analysis. Mathematical Policy Research, under Health Care Financing Administration contract # 500-83-0047.
Barrington, C., R.J. Newcomer, and S. Preston. 1993. “A Comparison of S/HMO Disenrollees and Continuing Members, ” Inquiry 30:429-440.
Health Care Financing Administration. 1990. Disenrollment Experience in the Medicare HMO and (34P Risk Program: 1985 to 1988. Report to Congress, Department of Health and Human Services.
Hirschman, A. O. 1970. Exit, Voice and Loyalty: Responses to Decline in Firms, Organizations and States. Cambridge, Mass.: Harvard University Press.
OffIce of Inspector General, Department of Health. and Human Services. 1994. Beneficiary Perspectives of Medicare Risk HMOS. OEI-06-91-00730.
Porrell, F., C. Cocotas, P. Perales, C. Tompkins, and M. Glavin. 1992. Factors Associated w“thDisenrollment j?om Medicare HMOS: Findings @om a survey of DisenroUees. Cooperative Agreement to the Health Policy Research Consortium of Brandeis University under contract # 99-C99256/l 1-06.
Porrell, F. and C. Tompkins. 1993. “Medicare Risk Contracting: Identifying Factors Assoicated with Market Exit, ” Inquiry 30:157-169.
Prasad, V.K. and J.G. Rajshekhar. 1992. “Understanding Needs and Concerns of the Elderly Regarding Medicare Health Maintenance Organizations, ” Z%eJourrud of Consumer A#airs 26:1:47-67.
Rossiter, L., K. Langwell, T.H. Wan, and M. Rivnyak. 1989. “Patient Satisfaction Among Elderly Enrollees and Disenrollees in Medicare Health Maintenance Organizations: Results from the National Medicare Competition Evaluation, ” Journul of the American Medical Association 262:1:57-63.
18
Rossiter, L., T. Wan, K. Langwell, J. Hadley, A. Tucker, M. Rivnyak, K. Sullivan, and J. Narcross. 1988. Nationul Medicare Competition Evaluation: An analysis of Patient Satisfaction for Enrollees and Disenrollees in Medicare Risk-Based Plans. Williamson Institute for Health Studies, Medical College of Virginia and Mathematical Policy Research, under contract # 500-83-0047.
Ward, R.A. 1987. “HMO Satisfaction and Understanding Among Recent Medicare Enrollees, ” Journal of Health and Social Behuvior 24:325-337.
19
APPENDIX A
Table 1: AdjustedCY92-93D~enrolbnentRates By Key Survey
(Enrollees onlv}
Adjusted Disenrollment Rate Poor
CY92-93 Service*** HMO Ownership** (Percent) (Poor)
Group ~ #1 12.7 #2 13.9 #3 NS #4 25.7 #5 16.5 #6 18.2 #7 NS
Group B #8 2.2 #9 6.4 # 10 NA #11 NA # 12 NS
Group C # 13 8.4 # 14 7.4* # 15 7.6
Group D # 16 6.5 # 17 3.2
Group E # 18 9.3 # 19 4.1
Group F # 20 6.8 # 21 10.1
Group G # 22 4.4 # 23 5.0
#24 I 4.9*
# 25 I 8.0
# 26 I 37.0*
8.0 6.9
13.3 11.8 2.6
13.8 5.6
2.8 2.8 2.9
13.8 3.1
0.0 0.0
12.0
13.2
Variables
ComplaintsNot Taken Seriously (Percent)
7.7 10.7 20.7 17.9 15.0 10.3 19.0
2.8 8.1 6.3
16.1 20.0
6.3 3.6 3.8
15.0 5.9 I 8.1
17.6 15.0 6.7 I 16.1
6.1 11.1 8.1 I 17.1
3.8 I 12.9
3.7 I 11.1
3.2 I 12.1
11.8 I 23.8
6.7 I 10.3
23.5 I 21.7
7.0 I 13.3
6.1 8.6
A-1
Table 1:
HMO Ownership**
# 30
#31
# 32
# 33
# 34
# 35
# 36
# 37
# 38
# 39
#40
#41
# 42 —
# 43
#44
# 45
*
Adjusted CY92-93 Disenrollment Rates By Key Survey Variables (Enrollees only)
Adjusted Disenrollment Rate Poor Complaints Not Taken
CY92-93 Service*** Seriously (Percent) (Poor) (Percent) L
5.9 5.1 7.5
15.5 10.3 6.5
20.2 12.5 7.7
4.2 10.0 13.6
1.9 5.6 5.7
3.5 7.5 7.1
10.2 10.3 13.8
13.4 16.2 12.8
15.0 10.8 18.4
5.4 6.1 8.6
8.1* 6.9 8.6
NA 9.7 6.3
4.2 6.1 5.6
6.6 8.3 4.9
3.4 7.9 7.9
2.3 9.7 25.0 \
Annualized diaemolhnent rate based on the number of disenrollees for the period of time the HMO risk contract existed. This technique allows for comparison among newer and more established HMOS.
** HMOS are grouped together if they are owned by the same parent company.
*** Primary HMO doctor did not provide Medicare services, admit to the hospital, or refer to a specialist when needed.
NS Not Sufficient Data - Five HMOS were excluded in the analysis of disemollees and disenrollment rates because less than 20 of the 50 disenrollees returned their survey.
NA Not Applicable - Three HMOS were not included in this analysis, H0616 and H0617 discontinued their risk contract in 1993 and H9049 split into two risk HMOS, transferring many beneficiaries into H3856.
A-2
Table 2: Top 5 Adjusted CY92-93 Disenrollment Rates by Key Survey Variables
Adjusted Disenrollment Poor Complaints Not Taken Rate CY92-93 Service** Seriously
HMO Ownership (Percent) (Percent) (Percent)
# 26 37.0* 11.8 23.8
# 28 28.1 23.5 21.7
#4 25.7 11.8 17.9
# 32 20.2 12.5 7.7
#6 18.2 13.8 10.3
* Annualized disemollment rate based on the number of disemollees for the period of time the HMO risk contract existed. This technique allows for comparison among newer and more established HMOS.
** Primary HMO doctor did not provide Medicare services, admit to the hospital, or refer to a specialist when needed.
A-3
APPENDIX B
Table 1 : Unannualiied and Annualized CY91 -92 & CY92-93 Disenrollment Rates For the 10 HMOS with Risk Contracts for Less Than Two Years
Unannualiied Rates Annualized Rates
Month/Year Risk HMO CY91-92 CY92-93 % CY91 -92 CY92-93 %
Contract Rate Rate Change Rate Rate Change HMO Began (Percent) (Percent) in Rate (Percent) (Percent) in Rate
# 24 5192 3.0 6.0 100.0 9.0 7.2 -20.0
# 26 6{92 10.7 31.0 189.7 36.7 39.2 6.8
# 27 10/92 0.5 4.9 880.0 4.0 7,9 95.0
# 32 11/91 20.0 26.5 32.5 34.3 26.5 -22.7
# 33 8/91 4.4 5.3 20.5 6.2 5.3 -14.5
# 14 9/92 0.8 8.0 900.0 4.8 12.0 150.0
# 12 4/92 5.6 13.1 133.9 14.9 15.0 0.7
# 40 4/92 6.5 10.4 60.0 17.3 11.9 -31.2
# 22 2/9 1
# 43 419 ‘
mm -::,::2: 1:: l:; :
B-1
APPENDIX C
Table 1: CY92-93 Dkenrollment Rates, Percent Administrative Disenrollment,
and CY92-93 Adjusted Dsenrollment Rates by HMO
Dkenrollment Rate
CY92-93 HMO Ownership** (Percent)
Group A #1 20.1 #2 19.8 #3 29.6 #4 30.0 #5 17.6 #6 24.3 #7 22.6
Group B #8 5.2 #9 10.6 # 10 NA #11 NA # 12 15.0*
Group C # 13 12.2 # 14 12.0* # 15 10.9
Group D # 16 11.3 # 17 7.7
Group E # 18 11.9 # 19 9.2
Group F # 20 9.7 # 21 13.6
Group G # 22 5.5 # 23 8.1
#24 7.2*
#25 12.8
# 26 39.2*
# 27 7.8*
# 28 32.8
# 29 16.3
Percent Administrative Disenrolhnent
37.0 30.0 NS 14.3 6.3
25.0 NS
58.3 39.3 NS
25.0 NS
31.0 38.1 30.8
42.9 58.3
22.2 56.0
30.3 25.8
20.0 38.9
31.6
37.5
5.6
18.5
14.3
50.0
Adjusted Disenrollment
Rate % Decrease in
CY92-93 CY92-93 (Percent) Rate
12.7 36.8
13.9 29.8 NS NS
25.7 14.3
16.5 6.3
18.2 25.1 NS NS
2.2 57.7
6.4 39.6 NA NA NA NA NS NS
8.4 31.1 7.4* 38.3 7.6 30.3
6.5 42.5 3.2 58.4
9.3 21.8 4.1 55.4
6.8 29.9 10.1 25.7
4.4 20.0 5.0 38.3
4.9* 31.9
8.0 37.5
37.0* 5.6
6.4* 17.9
28.1 14.3
8.2 49.7
c-1
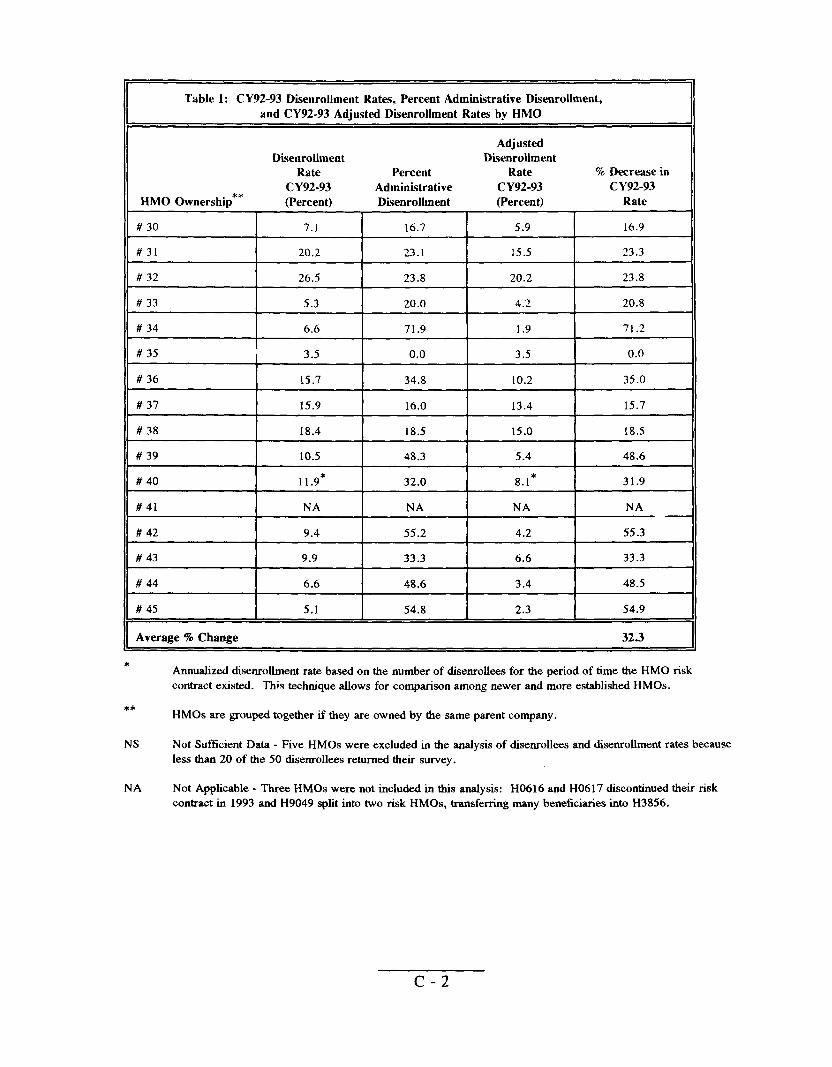
Table 1: CY92-93 DisenroUment Rates, Percent Adminiitrative Disenrollment,
and CY92-93 Adjusted Disenrollment Rates by HMO
Adjusted DEenrollment DBenroUment
Rate Percent Rate % Darease in
CY92-93 Administrative CY92-93 CY92-93 HMO Ownership** (Percent) Disenrollment (Percent) Rate
# 30 7.1 16.7 5.9 16.9
#31 20.2 23.1 15.5 23.3
# 32 26.5 23.8 20.2 23.8
# 33 5.3 20.0 4.2 20.8
# 34 6.6 71.9 1.9 71.2
# 35 3.5 0.0 3.5 0.0
# 36 15.7 34.8 10.2 35.0
# 37 15.9 16.0 13.4 15.7
# 38 18.4 18.5 15.0 18.5
# 39 10.5 48.3 5.4 48.6
# 40 11.9* 32.0 8.1* 31.9
# 41 NA NA NA NA
# 42 9.4 55.2 4.2 55.3
# 43 9.9 33.3 6.6 33.3
# 44 6.6 48.6 3.4 48.5
# 45 5.1 54.8 2.3 54.9
Average % Change 32.3
* Annualized diseorolhnent rate based on the number of disenrollees for the period of time the HMO risk contract existed. This technique allows for comparison among newer and more established HMOS.
** HMOS are grouped together if they are owned by the same parent company.
NS Not Sufficient Data - Five HMOS were excluded in the analysis of disenrolkes and disenrollment rates because less than 20 of the 50 disenrollees returned their survey.
NA Not Applicable - Three HMOS were not incIuded in this analysis: H0616 and H0617 discontinued their risk contract in 1993 and H9049 split into two risk HMOS, transferring many beneficiaries into H3856,
c-2
APPENDIX D
Table 1:
HMO Ownership**
Group A#1#2#3#4#5#6#7
Group B#8#9# 10#11 # 12
Group C # 13 # 14 # 15
Group D # 16 # 17
Group E
# 18 # 19
Group F # 20 # 21
Group G # 22 # 23
# 24
# 25
# 26
#27
# 28
#29
# 30
Unadjusted CY91-92
Month/Year Risk HMO
Contract Began
6/88 4185 7185 12/87 1/90 1/86 6188
10/85 7185 8/88 8188 4192
4{86 9192 4186
1/88 1187
8186 2186
10I85 7185
2191 1/88
5192
6/86
6192
10/92
4/85
1/86
7186
Disenrollment Rates
CY91-92 Disenrollment
Rate (Percent)
21.8 18.8 21.0 47.5 10.6 28.4 29.3
5.9 11.0 5.4 5.4
14.9*
10.1 4.8* 8.8
9.0 9.2
10.8 7.1
22.9 14.5
6.2* 8.7
9.0*
11.3
36.7*
4.0*
29.5
15.3
9.7
D-1
& ‘92-’93 Disenrollment Rates by HMO
CY92-93 Disenrollment % Change in
Rate Dkenrollment
(Percent) Rate
20.1 7.8
19.8 + 5.3
29.6 + 41.0 30.0 36.8 17.6 + 66.0 24.3 14.4 22.6 22.9
5.2 11.9 10.6 3.6 NA NA NA NA
15.0* + 0.7*
12.2 + 20.8 12.0* + 150.0* 10.9 + 23.9
11.3 + 25.6 7.7 16.3
11.9 + 10.2 9.2 + 29.6
9.7 57.6 13.6 6.2
5.5 11.3* 8.1 6.9
7.2* 20.0*
12.8 + 13.3
39.2* + 6.8*
7.8* + 95.0*
32.8 + 11.2
16.3 + 6.5
7.1 26.8 I
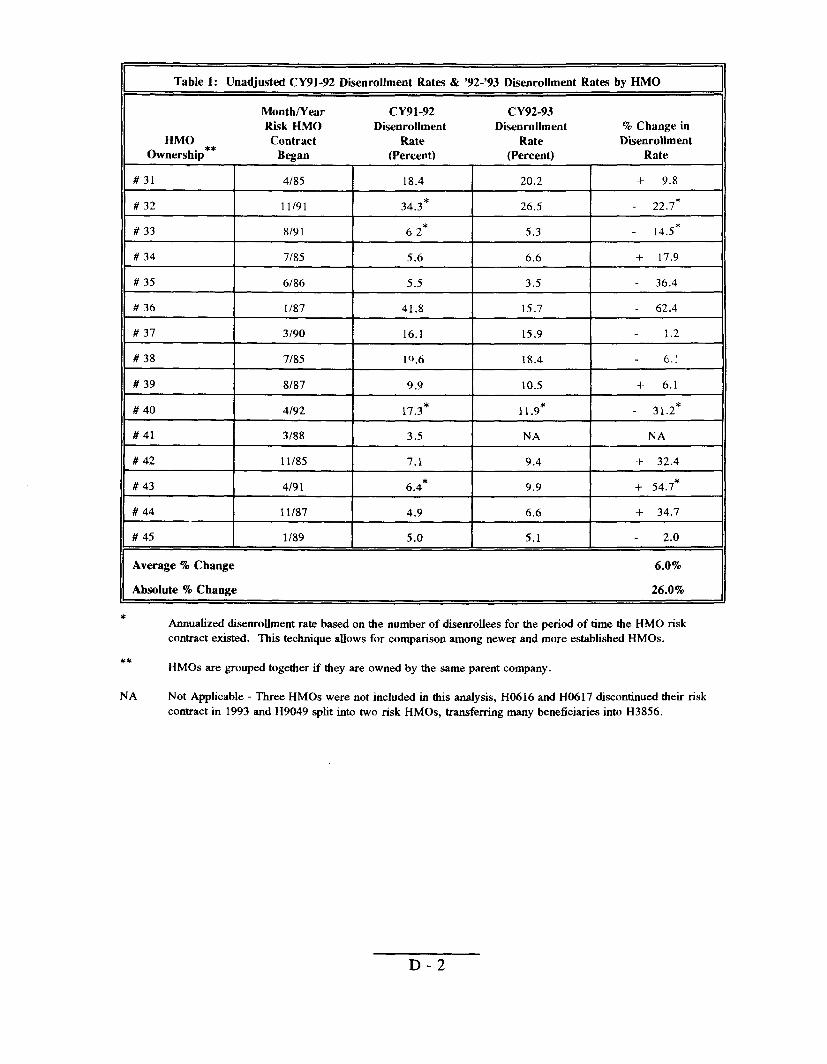
Table 1: Unadjusted CY91-92 DisenrolJment Rates & ‘92-’93 Dfienrollment Rates by HMO
Month/Year CY91-92 CY92-93 Risk HMO Disenrollment Disenrollment % Change in
HMO Contract Rate Rate Duenrollment Ownership** Began (Percent) (Percent) Rate
#31 4/85 18.4 20.2 + 9.8
# 32 11/91 34.3* 26.5 22.7*
# 33 8/9 1 6.2* 5.3 14.5*
# 34 7/85 5.6 6.6 + 17.9
# 35 6/86 5.5 3.5 36.4
# 36 1/87 41.8 15.7 62.4
# 37 3/90 16.1 15.9 1.2
# 38 7185 10.6 18.4 6.:
# 39 818-? 9.9 10.5 + 6.1
#40 4[92 17.3* 11 .9* 31 .2*
# 41 3188 3.5 NA NA
# 42 11/85 7.1 9.4 + 32.4
# 43 4191 6.4* 9.9 + 54.7*
# 44 11/87 4.9 6.6 + 34.7
#45 1/89 5.0 5.1 2.0
Average % Change 6.0%
Absolute % Change 26.0%
* Annualized disenrolhnent rate based on the number of disenrollees for the period of time the HMO risk contract existed. This technique allows for comparison among newer and more established HMOS.
** HMOS are grouped together if they are owned by the same parent company.
NA Not Applicable - Three HMOS were not included in this analysis, H0616 and H0617 discontinued their risk contract in 1993 and H9049 split into two risk HMOS, transferring many beneficiaries into H3856.
D-2
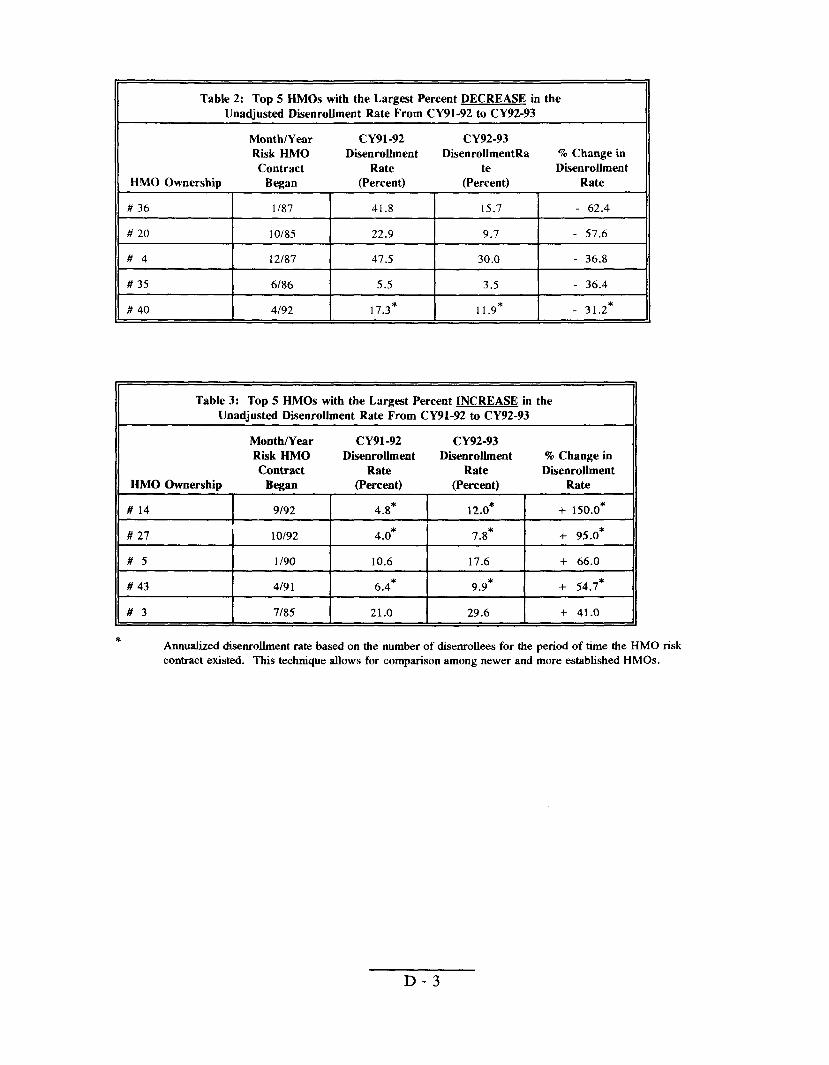
Table 2: Top 5 HMOS with the Largest Percent DECREASE in the
Unadjusted Disenrollment Rate From CY91-92 to CY92-93
Month/Year CY91-92 CY92-93 Risk HMO DisenroUment DisenroUmentRa % Change in
Contract Rate te DisenroUment HMO Ownership Began (Percent) (Percent) Rate
# 36 1/87 41.8 15.7 - 62.4
# 20 10/85 22.9 9.7 - 57.6
#4 i2187 47.5 30.0 - 36.8
# 35 6/86 5.5 3.5 - 36.4
# 40 4/92 17.3* 11 .9* - 31.2*
Table 3: Top 5 HMOS with the Largest Percent lNCREASE in the Unadjusted DisenroUment Rate From CY91-92 to CY92-93
MonthNear CY91-92 CY92-93 Risk HMO DisenroUment DisenroUment % Change in Contract Rate Rate DMenroUment
HMO Ownership Began (Percent) (Percent) Rate
# 14 I 9192 4.8* 12.0* + 150.0*
# 27 10/92 4.0* 7.8* + 95.0*
#5 1/90 10.6 17.6 + 66.0
# 43 4/9 1 6.4* 9.9* 4- 54.7*
#3 7185 21.0 29.6 + 41.0
* Annualized disenroilment rate based on the number of disenroUees for the period of time the HMO risk contract existed. This technique allows for comparison among newer and more established HMOS.
D-3
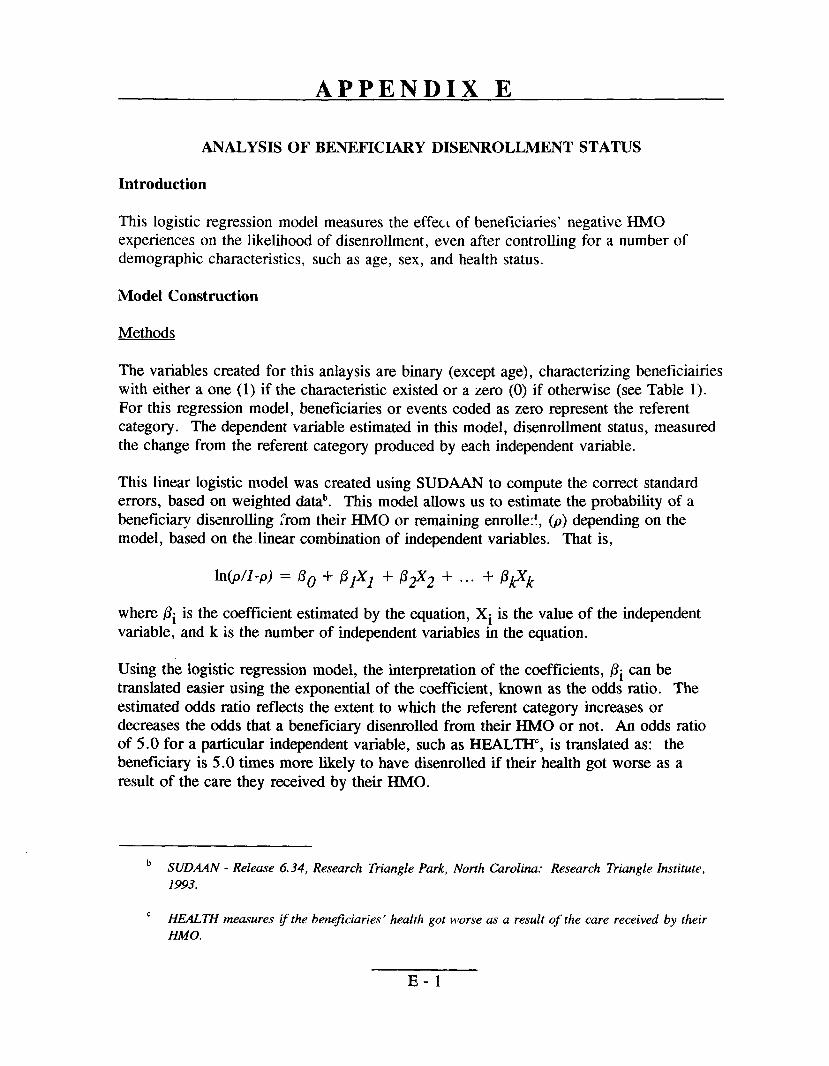
APPENDIX E
ANALYSIS OF BENEFICIARY DISENROLLMENT STATUS
Introduction
This logistic regression model measures the eff~l of beneficiaries’ negative HMO experiences on the likelihood of disenrollment, even after controlling for a number of demographic characteristics, such as age, sex, and health status.
Model Construction
Methods
The variables created for this anlaysis are binary (except age), characterizing beneficiaries with either a one (1) if the characteristic existed or a zero (0) if otherwise (see Table 1). For this regression model, beneficiaries or events coded as zero represent the referent category. The dependent variable estimated in this model, disenrollment status, measured the change from the referent category produced by each independent variable.
This linear logistic model was created using SUDAAN to compute the correct standard errors, based on weighted datab. This model allows us to estimate the probability of a beneficiary disenrolling ~rom their HMO or remaining enrollefl, (p) depending on the model, based on the linear combination of independent variables. That is,
where pi is the coefficient estimated by the equation, Xi is the value of the independent variable, and k is the number of independent variables in the equation.
Using the logistic regression model, the interpretation of the coefficients, pi can be translated easier using the exponential of the coefficient, known as the odds ratio. The estimated odds ratio reflects the extent to which the refenmt category increases or decreases the odds that a beneficiary disenrolled from their HMO or not. An odds ratio of 5.0 for a particular independent variable, such as HEALTH’, is translated as: the beneficiary is 5.0 times more likely to have disenrolled if their health got worse as a result of the care they received by their HMO.
b SUDAAN - Release 6.34, Research Triangle park, North Carolinu: Research Triangle Institute,
1993.
c HEALTH measures Lythe beneficiaries’ health got worse as a result of the care received by their
HMO.
E-1
Results of the Regression Model
Tables 1 and 2 provide the logistic results for the regression model. Beneficiaries with missing data for any of the variables were excluded from the analysis. Each table provides the estimated odds ratios and the estimated lower and upper limits of the 95 percent confidence intervals. Odd ratios with values greater than one (1) indicate that beneficiaries with the characteristic have a greater likelihood of being disenrolled than beneficiaries in the referent group. Confidence intervals including the value one (1) indicate the characteristic does not have a significant effect at the 95 percent confidence interval on whether a beneficiary has disenrolled or not.
Table 2 includes the full model measuring the probability of a beneficiary being disenrolled or not. Highlighted variables are statistically sigtilcant at the 95 percent confidence interval or better.
Discussion of the Results
Variables influencing beneficiaries to disenroll, after adjusting for everything else include: 1) beneficiaries’ health getting worse as a result of the care received by their HMO, 2) beneficiaries having prior HMO experience, 3) beneficiaries’ HMO prioritizing holding down the cost of medical care, and 4) beneficiaries usually waiting an hour or more before seeing primary HMO doctor.
E-2
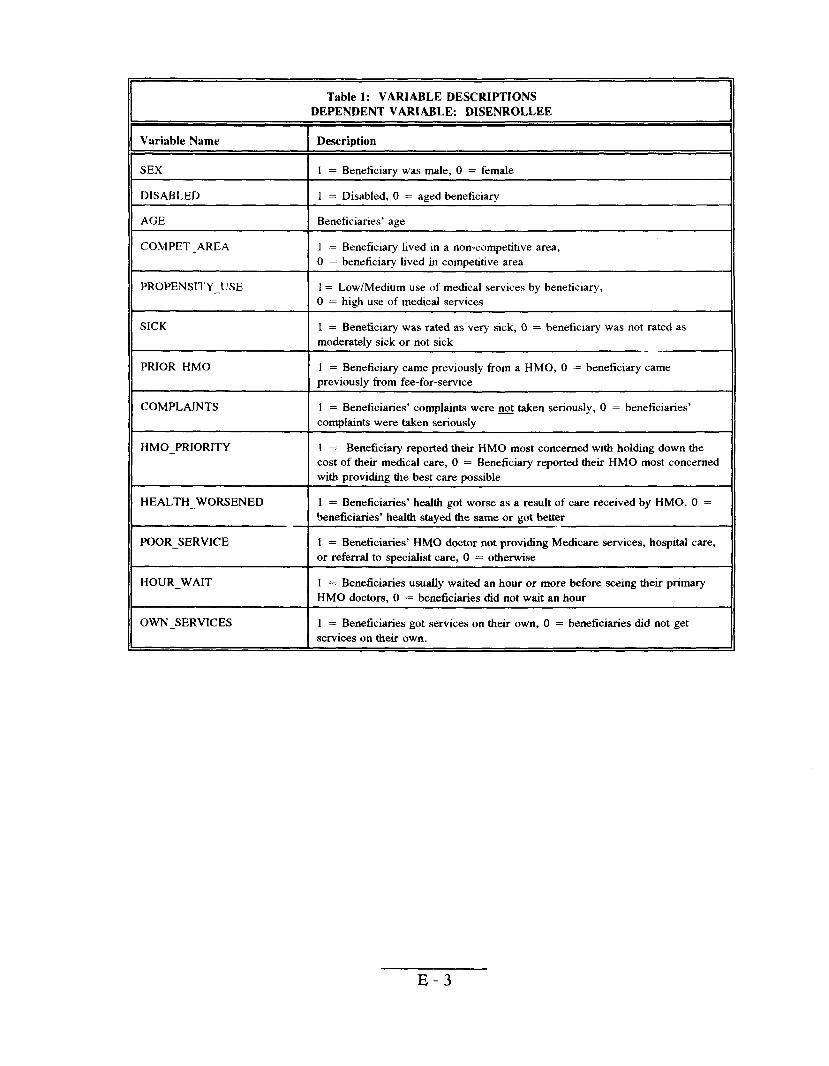
Table 1: VARIABLE DESCRIPTIONS DEPENDENT VARIABLE: DISENROLLEE
Variable Name I Description
SEX [ 1 = Beneficiary was male, O = female
DISABLED 1 = Disabled, O = aged beneficiary~
AGE Beneficiaries’ age I
COMPET_AREA ] 1 = Beneficiary lived in a non-competitive area,
IO = beneficiary lived in competitive area
PROPENSITY_USE 1= Low/Medium use of medical services by beneficiary,
I O = high use of medical services
SICK 1 = Beneficiary was rated as very sick, O = beneficiary was not rated as moderately sick or not sick -.
PRIOR —HMO ] 1 = Beneficiary came previously from a HMO, O = beneficiary came
Ipreviously from fee-for-service
COMPLAINTS I 1 = Beneficiaries’ complaints were@ take. seriously, O = beneficiaries’ I complaints were taken seriously
HMO_PRIORITY 1 = Beneficiary reported their HMO most concerned with holding down the
I cost of their medical care, O = Beneficiary reported their HMO most concerned
Iwith providing the best care possible
HEALTH_WORSENED ] 1 = Beneficiaries’ health got worse as a result of care received by HMO, O =
I beneficiaries’ health staYed the same or got better
POOR_SERVICE = Beneficiaries’ HMO doctor not providing Medicare services, hospital care, or referral to specialist care, O = otherwiseI 1
HOUR_WAIT I1=Beneficiaries usually waited an hour or more before seeing their primary HMO doctors, O = beneficiaries did not wait an hour
OWN_SERVICES = Beneficiaries got services on their own, O = beneficiaries did not get services on their own.I 1
E-3
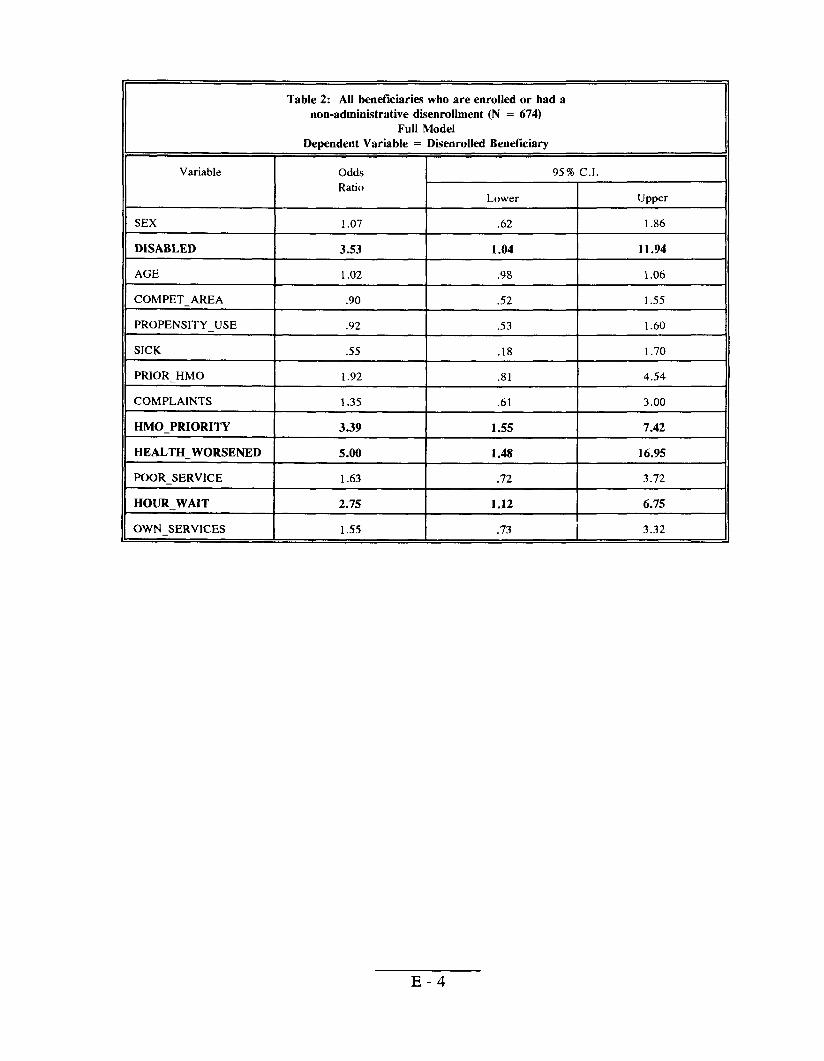
Table 2: All beneficiaries who are enrolkd or had a non-administrative disenrollment (N = 674)
Full Model Dependent Variable = Disenrolled Beneficiary
Variable
SEX
DISABLED
AGE
COMPET_AREA
PROPENSITY_ USE
SICK
PRIOR_HMO
COMPLAINTS
HMO_PRIORITY
HEALTH_WORSENED
POOR_SERVICE
HOUR_WAIT
OWN SERVICES
Odds 95% C.1. Ratio
Lower Upper
1.07 .62 1.86
3.53 1.04 11.94
1.02 .98 1.06
.90 .52 1.55
.92 .53 1.60
.55 .18 1.70
1.92 .81 4.54
1.35 .61 3.00
3.39 1.55 7.42
5.00 1.48 16.95
1.63 .72 3.72
2.75 1.12 6.75
1.55 .73 I 3.32
E-4
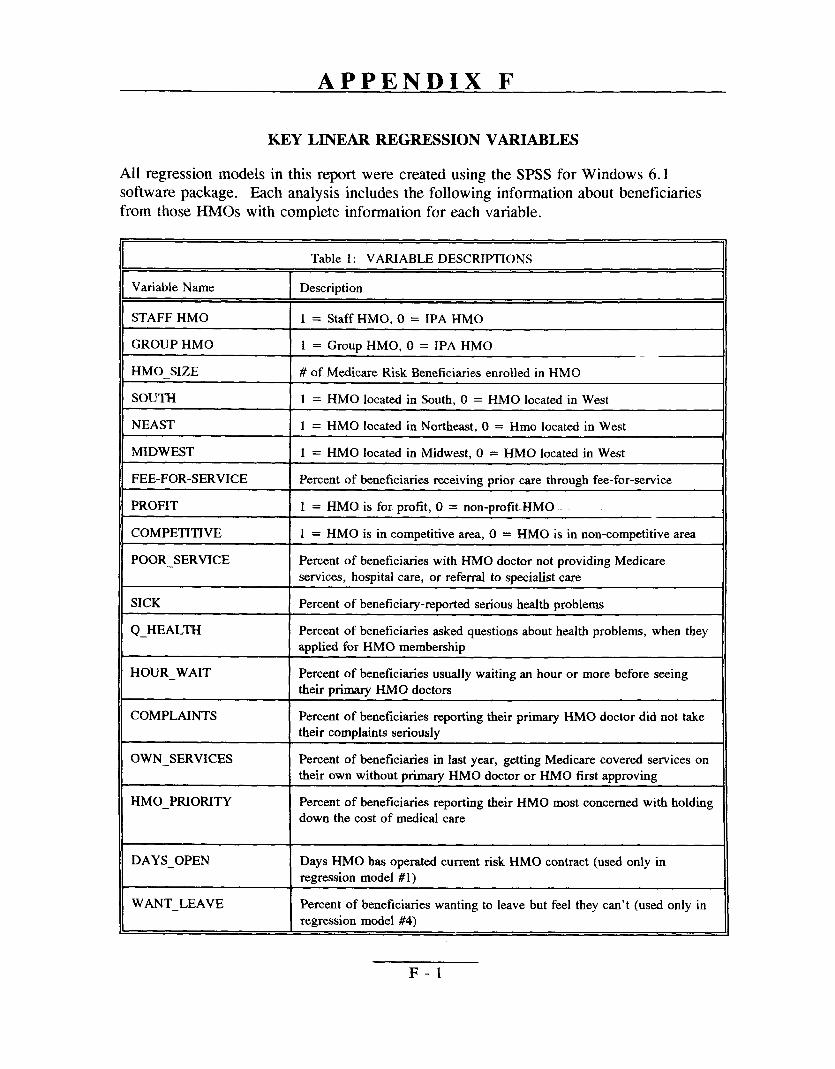
APPENDIX F
KEY LINEAR REGRESSION VARIABLES
All regression models in this report were created using the SPSS for Windows 6.1 software package. Each analysis includes the following information about beneficiaries from those FINIOs with complete information for each variable.
Table 1: VARIABLEDESCRIPTIONS
Variable Name Description
STAFF HMO 1 = Staff HMO, O = IPA HMO
GROUP HMO 1 = Group HMO, O = IPA HMO
HMO_SIZE # of Me&care Risk Beneficiariesenrokd in HMO
SOUTH 1 = HMO located in South, O = HMO located in West
NEAST 1 = HMO located h Northeast, O = Hmo located in West
MIDWEST 1 = HMO located in Midwest, O = HMO located in West
FEE-FOR-SERVICE Percent of beneficiaries receiving prior care through fee-for-service
PROFIT 1 = HMO is for profit, O = non-profit. HMO
COMPETITIVE 1 = HMO is in competitive area, O = HMO is in non-competitive area
POOR_SERVICE Percent of beneficiaries with HMO doctor not providing Medicare
services, hospital care, or referral to specialist care
SICK Percent of beneficia~-reported serious health problems
Q_HEALTH Percent of beneficiaries asked questions about health problems, when they applied for HMO membership
HOUR_WAIT Percent of beneficiaries usually waiting an hour or more before seeing their primary HMO doctors
COMPLAINTS Percent of beneficiaries reporting their primary HMO doctor did not take their complaints seriously
OWN_SERVICES Percent of beneficiaries in last year, getting Medicare covered services on their own without primary HMO doctor or HMO first approving
HMO_PRIORITY Percent of beneficiaries reporting their HMO most concerned with holding
down the cost of medical care
DAYS_OPEN Days HMO has operated current risk HMO contract (used only in
regression model #1)
WANT_LEAVE Percent of beneficiaries wanting to leave but feel they can’t (used only in
regression model #4)
F-1
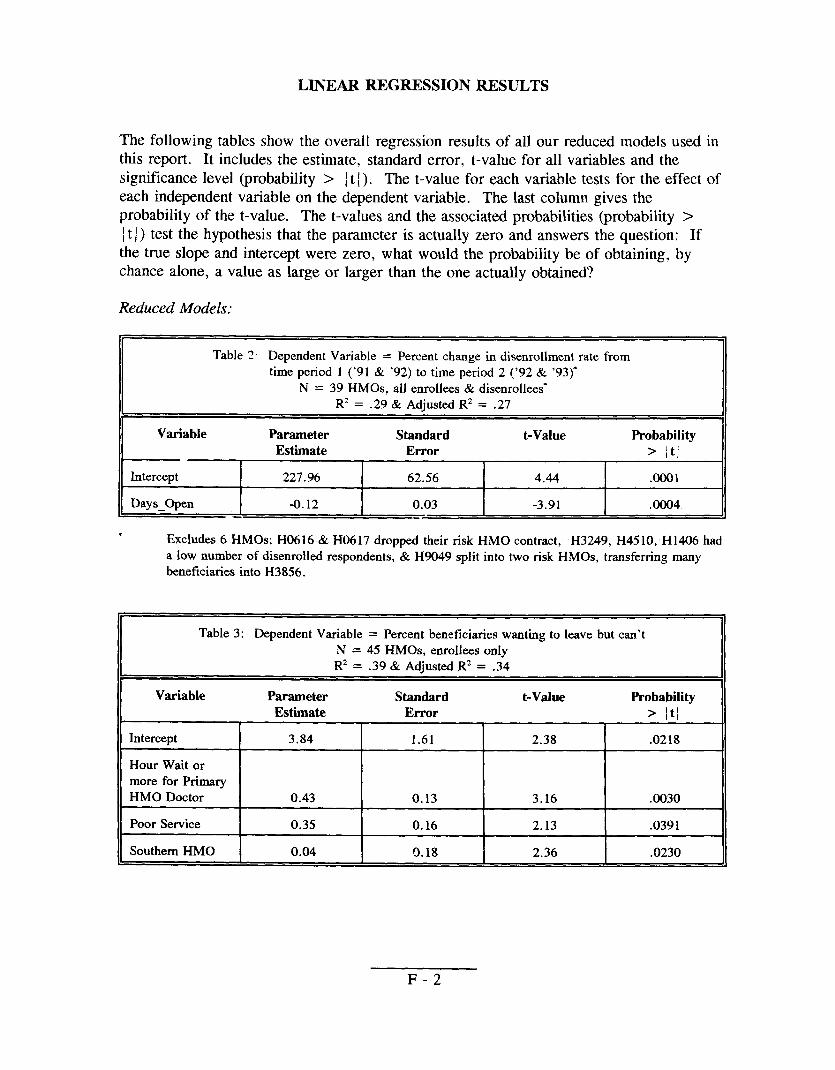
LINEAR REGRESSION RESULTS
The following tables show the overall regression results of all our reduced models used in this report. It includes the estimate, standard error, t-value for all variables and the significance level (probability > ~t [). The t-value for each variable tests for the effect of each independent variable on the dependent variable. The last column gives the probability of the t-value. The t-values and the associated probabilities (probability > ~t ~) test the hypothesis that the parameter is actually zero and answers the question: If the true slope and intercept were zero, what would the probability be of obtaining, by chance alone, a value as large or larger than the one actually obtained?
Reduced Models:
Table 2 Dependent Variable = Percent change in disenrollment rate from time period 1 (’91 & ’92) to time period 2 (’92 & ‘93)”
N = 39 HMOS, all enrollees & disenrollees” R2 = .29 & Adjusttxl R* = .27
Variable Parameter Standard t-Value Probability
Estimate Error > /tj I I I I
Intercept ~ 227.96 ! 62.56 [ 4.44 1
.Ooo1
Days Open I -0.12 I 0.03 I -3.91 I ,0004
* Excludes 6 HMOS; H0616 & H(M 17 dropped their risk HMO contract, H3249, H45 10, H 1406 had
a low number of disenroiled respondents, & H9049 split into two risk I-IMOS, transferring many beneficiaries into H3856.
Table 3: Dependent Variable = Percent beneficiaries wanting to leave but can’t
N = 45 HMOS, enrollees onlyR2 = .39& Adjusted R2 = .34
Variable Parameter Standard t-Value Probability
Estimate Error > ~t~
Intercept 3.84 1.61 2.38 .0218
Hour Wait or more for Primary HMO Doctor 0.43 0.13 3.16 .0030
Poor Service 0.35 0.16 2.13 .0391
Southern HMO 0.04 0.18 2.36 .0230
F-2
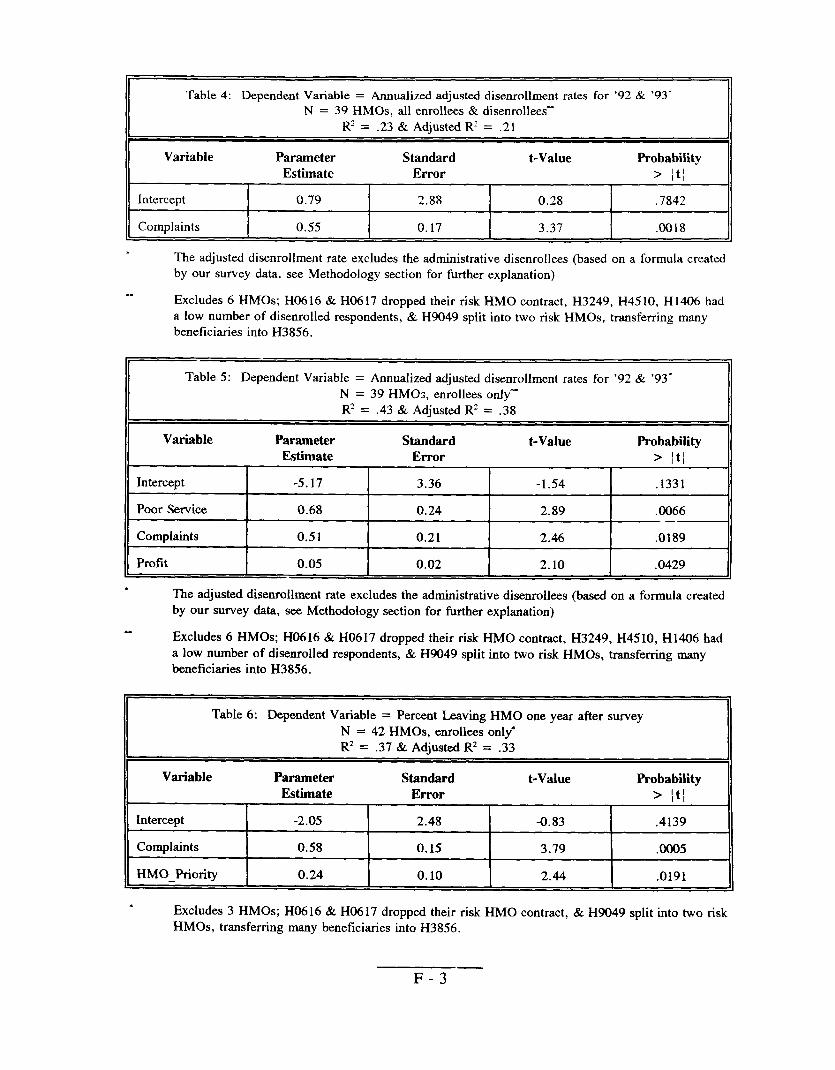
Table 4: Dependent Variable = Annualized adjusted disenrollment rates for ’92 & ’93” N = 39 HMOS, all enrollees & disenrollees
R’ = .23& Adjusted R2= .21
Variable Parameter Standard t-Value Probability
Estimate Error > ~t~ I I I I
Intercept 0.79 2.88 0.28 ,7842 I { 1 1
Complaints I 0.55 0.17 3.37 .0018
. The adjusted disenrollment rate excludes the administrative dise~ollees (based on a formula created by our survey data, see Methodology seetion for further explanation)
-.. . . . . . . . . . .. -—.bxcludes 6 HMOS; H(I616 & H0617 dropped their risk HMO contract, H3249, H45 10, H 1406 had
a low number of disenrolled respondents, & H9049 split into two risk HMOS, transferring many beneficiaries into H3856.
Table 5: Dependent Variable = Annualized adjusted disenrollment rates for ’92 & ’93-
N = 39 HMCS, enrollees only-R2 = .43 & Adjusted Rz = .38
Variable Parameter Standard t-Value Probability Estimate Error > jt~
Intercept -5.17 3.36 -1.54 .1331
Poor Service 0.68 0.24 2.89 .0066 —
Complaints 0.51 0.21 2.46 .0189
Profit 0.05 0.02 2.10 .0429
* The adjusted disenrollment rate excludes the administrativedisenrollees (based on a formula created by our survey data, see Methodology section for further explanation)
Excludes 6 HMOS; H0616 &H0617 dropped their risk HMO contract, H3249, H45 10, H 1406 had a low number of disenrolled respondents, & H9049 split into two risk HMOS, transferring many beneficiaries into H3856.
Table 6: Dependent Variable = Percent Leaving HMO one year after survey
N = 42 HMOS, enrollees only*
R2 = .37 & Adjusted R2 = .33
Variable Parameter Standard t-Value Probability Estimate Error > ~t~
Intercept -2.05 2.48 -0.83 .4139
complaints 0.58 0.15 3.79 .0005
HMO_Priority 0.24 0.10 2.44 .0191
* Excludes 3 HMOS; H0616 & H0617 dropped their risk HMO contract, & H9049 split into two risk HMOS, transferring many beneficiaries into H3856.
F-3—
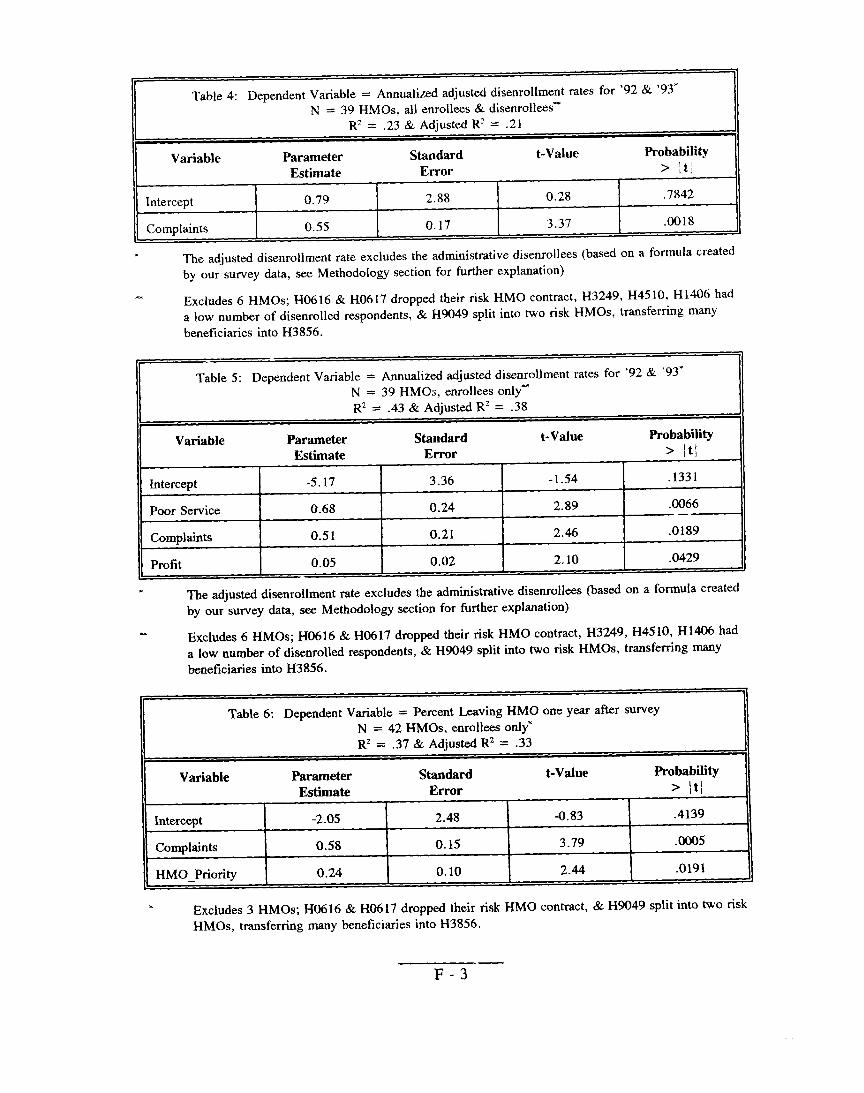
Table 4: Dependent Variable = Annualized adjusted disenrollment rates for ’92 & ’93” N = 39 HMOS, all enrollees & disenrolleess
Rz = .23& Adiusted Rz = .21
Variable Parameter Standard t-Value Probability
Estimate Error > ~t~
Intercept 0.79 2.88 0.28 .7842
Complaints 0.55 0.17 3.37 .0018
. The adjusted disenrollment rate excludes the administrative disenrollees (based on a formula created by our survey data, see Methodology section for further explanation)
Excludes 6 HMOS; H0616 & H0617 dropped their risk HMO contract, H3249, H45 10, H 1406 had a low number of disenrolled respondents, & H9049 split into two risk HMOS, trmsfeming m~Y beneficiariesinto H3856.
Table 5: Dependent Variable = Annualized adjusted disenrollment rates for ’92 & ’93-N = 39 HM@s, enrollees only-
R2 = .43 & Adiusted R’ = .3S
Variable Parameter Standard t-Value Probability Estimate Error > ~t~
Intercept -5.17 3.36 -1.54 .1331
Poor Service 0.68 0.24 2.89 .0066 _—
Complaints 0.51 0.21 2.46 .0189
Profit 0.05 0.02 2.10 .0429
* The adjusted disenrollment rate excludes the adminktrative disenrollees(based on a formula created by our survey data, see Methodology section for further explanation)
Excludes6 HMOS;H0616 &H0617 dropped their risk HMO contract, H3249, H4510, H1406had a low number of disenrolledrespondents, & H9049 split into hvo risk HMOS, transferring manY beneficiariesinto H3856.
Table 6: DependentVariable = Percent LeavingHMO one year after surveyN = 42 HMOS,enrolleesonly*R’ = .37 & Ad@sted R2 = .33
Variable Parameter Standard t-Value Probability Estimate Error > ~t~
Intercept -2.05 2.48 -0.83 .4139
complaints 0.58 0.15 3.79 .0005
HMO_Priority 0.24 0.10 2.44 .0191
. Excludes 3 HMOS; H0616 & H0617 dropped their risk HMO contract, & H9049 split into two risk HMOS, transferring many beneficiariesinto H3856.
F-3
II
APPENDIX G
TEXT OF AGENCY COMMENTS
G-1
W8-2S# ~
DEPARTMENT OF HEALTH& HUMAN SERVICES
-@‘%. \
DATE
FROM
; SUB~CT
TO
SET I 1995
Bruce C. Vladec I LP@
Administrator %- “
Office of Inspector General (OIG) Draft Report: “Medicare
Maintenance Organization (HMO) Performance Indicators,”
June Gibbs Brown
Inspector General
We reviewed the above-referenced report which analyzes the
OIG beneficiary su~ey data and fiture HMO disenrollment
service access relates to disenrollment status. Our comments
recommendations are attached.
Health Care Fin~n~ing Administration
The Administrator Washington, D.C. 20201
Risk Health
(OEI-06-9 1-00734)
relationship between
and, specifically, how
on the report
Thank you for the opportunity to review and comment .n this report.
Attachment
G-2
Comments of the Health Care Financing Administration (HCFA)on Office of Insuector General (OIG) Draft Reoort:
“Medicare Risk Health Maintenance Organization (HMO) Performance.”(OEI-06-9 1-00734)
OIG RecommendationTrack disenrollment rates over time to detect potential problems among HMOS. I-lMOs
experiencing larger than average increases in ciisenrollment rates Should be monitored more
closely.
HCFA Re.monseWe concur. HCFA has been tracking disenrollment rates over time to detect potential problemsamong HMOS. Our Office of Managed Care (OMC) developed a plan profile report in 1991which incorporates various key indicators of a Medicare contractor’s HMO performance and
includes a number of significant data elements on disenrollment. OMC’s Operations and
oversight Team reviews these data on an ongoing basis as well as before conducting a monitoring
site visit of a Medicare contractor. OMc also tracks disenrollment via other data; e.g., HCFA
Medicare Hotline data, reconsiderations.
OIG Recommendation
Use adjusted disenrollment rates, along with other availab]e HM() information (e.g., beneficiary
complaints and appeals lodged against HMOS) to target review-s of HMOS,
HCFA Response
We concur. The C)Mc puts disenrollment rates in context with other ~f10 information as part of
targeting reviews of contractors. We believe, however, that the OIG may & underestimating the
degree to which disenrollment occurs due to shopping for benefits on the part of beneficiaries.
OIG Recommendation
Conduct disenrollment surveys that folly capture all the beneficiary’s reasons for leaving the
Medicare risk HMO. This information should be included in the Group Health Plan data files.
HCFA ResDonse
We concur and are implementing a new disenro]lment form that has been designed to captu[e
significant data regarding motivation for disenrollment.
OIG Recommendation
Survey enrollees systematically and routinely on key questions and on their desire to leave/remain
with an HMO, to complement disenrollment data.
G-3
Page 2
HCFA ResDonseWe concur. A work group is currently developing a strategy on the conduct of beneficiarysatisfaction surveys. Items being considered are a national survey versus individual HMOsurveys, subject areas to cover, types of questions to ask, approaches for evaluation of surveys,existing surveys, as well as other relevant areas.
(.
OIG RecommendationMonitor Medicare risk HMOS with high disenrollment rates and reported service access problemsand work with HMOS to respond to the needs of beneficiaries at risk of disenrolling.
HCFA ResDonseWe concur. DisenroIlment rates are monitored on an ongoing basis with special sensiti v;.Y andfollow up with HMOS which show high disenrollment rates and reported access problems.
Comments on Kev O uestions
The key questions offered by the OIG as predictive of beneficiaries’ future disenrollment will be
shared with the work group referenced above.
G-4


![URING THE RIBAL DISENROLLMENT PIDEMIC IN SEARCH OF A REMEDY · 2015] IN SEARCH OF A REMEDY 387 tribal public as well. 12 Those seeking legal relief from disenrollment efforts normally](https://img.pdfslide.us/doc/110x75/5ed1c00783dbc5372751633b/uring-the-ribal-disenrollment-pidemic-in-search-of-a-remedy-2015-in-search-of-a.jpg)