Embed Size (px)
Citation preview
U.S. DEPARTMENT OF COMMERCENATIONAL OCEANIC AND ATMOSPHERIC ADMINISTRATION
NATIONAL WEATHER SERVICE' NATIONAL METEOROLOGICAL CENTER
OFFICE NOTE 368
OPC UNIFIED MARINE DATABASE VERIFICATION SYSTEM
Vera M. GeraldNational Meteorological Center
This is an unreviewed manuscript, primarily intended for informalexchange of information among NMC staff members
U. S. DEPARTMENT OF COMMERCENATIONAL OCEANIC AND ATMOSPHERIC ADMINISTRATION
OCEAN PRODUCTS CENTER
TECHNICAL NOTE*
OPC Unified Marine Database Verification System
Vera M. Gerald
THIS IS AN UNREVIEWED MANUSCRIPT, PRIMARILY INTENDED FOREXCHANGE OF INFORMATION AMONG NMC STAFF MEMBERS
INTERNAL
*OPC Contribution No. 43NMC Office Note No. 368
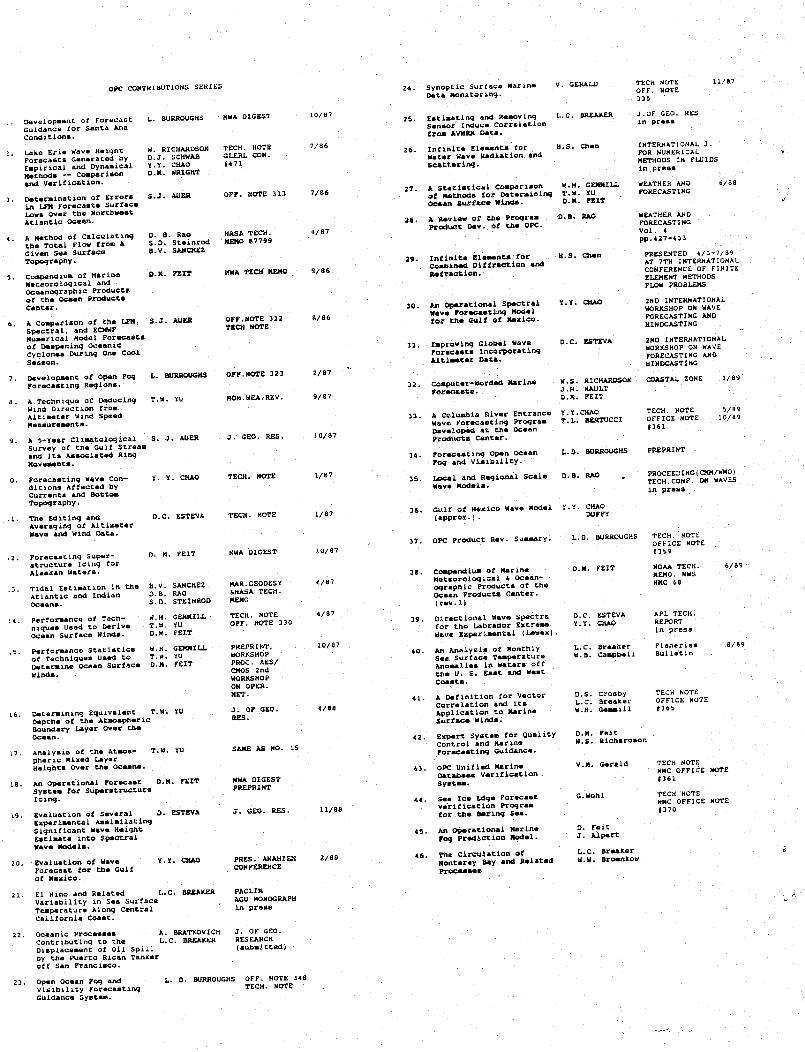
OPC CONTrIHUTIONS SERIES
Development of Forecast L. UKKuuUnGuidance for Santa AnraConditions.
2.Lake Erie Wave Height W. RICHARDSONForecasts Generated by o.J. SCHWABEmpirical and Dynamical YIY CHAOMethods -- Comparison 0.N. WRIGHTend verification.
. Determination of Errors S.J. AUERin LFM Forecasts SurfaceLosw Over the NorthwestAtlantic Ocean,
. A NMethod of Calculating D. a. Raothe Total Flov from A S.D SteinrodGiven Sea Surface B.V. SANCHEZTopography.
5. Compendium of Marine 0.. FEElTMeteorological andOceanographic Productsof the ocean ProductsCenter.
6. A Comparison of the LFR, S.J. AUERSpectral, and ECMWFNumerical Model Forecastsof Dampening OceanicCyclones During One CoolSeason.
7 Development of open Fog L. BUJRROUHSForecasting Regions.
S. A Technique of Deducing T.W. YuWind Direction fromAltimeter Wind SpeedMesuroenta.
. A 5-Year Climatological S. 3. AUERSurvey of the Gulf Streamand Its Associated RingMovesents.
.0. Forecasting Wave Con- Y. Y. CHAOditions Affected bycurrents and BottomTopography.
1. The Editing and D.C. ESTEVAAveraging of AltimeterWayve and Wind Data.
2. Forecasting Super-structure Icing for
Alaskan Waters.
3. Tidal Estimation in theAtlantic and IndianOceans.
Performance of Tech-niques Used to DeriveOcean Surface winds.
.5. PerformanCe Statisticsof Techniques Used toDetermine ocean SurfaceWinds.
24. Synoptic Surtace NMarine V. GERALDData Monitoring.
TECH. NOTEGI.ERL CON.4471
10/87
7/86
OFF. "OE 313 7/86
NASA TECH.DO 87799
25. Estimating and Removing L. C. BREAKERSensor Induce Correlationfrom AVKR Data.
26. Infinite Elements for H.S. ChenWater Wave RAdiation andscattering.
27. A Statietical Comparison W.N. GEMILLof MthIods for Determining T.W. YUocean surface Wind. D.M. F71T
28. A Reviewv of the Program
Product Dev. of the OPC.4/87
mNRA TECH KmtO 9/86
OFF.NOTE 312TECH NOTE
OFF.NOTE 323
29. Infinite Elements forCombined Diffraction ndRefraction.
30 An Operational SpectralWave Forecasting Modelfor the Gulf of exico.8/86
31. Improving Global Wev-Forecasts IncorporatingAltimeter Data.
2/87
MON.WEA.REV. 9/87
3. GEO. RES. 10/87
TECh. NOTE
TECH. NOTE
0. 8. FElT NWA DIGEST
B.V. SANCHEZD. . RAOS, D. STEINROD
W H GEKRILLT.W. YUD.. FEIT
W.H. GEMEILLT.W. YUD .. FElT
6. Determining Equivalent T.W. YUDepths of the AtmosphericBoundary Layer Over theOcean.
L7. Analysis of the Ateos- T.W. YUpheric Mixed LayerReighte Over cthe Oceans.
la. An Operational Forecast D.8. FEETSystem for SuperstructureIcing.
19g. Evaluation of Several 0. ESTEVAExperimental AssimilatingSignificant Wave HeightEstimte into SpectralWave Models.
20 Evaluation of WavYe .Y. CHAOForecast for the Gulfof Mexico.
21 El Mino and Related L.C. BREAKERVariability in Sea SurfaceTemperature Along Central
California Coast.
22. Oceanic Processes A. BRATKOVICH
Contributing to the L.C. BREAKER
Displacement of O11 Spill
by the Puerto Rican Tankeroff San Francisco.
MAR. GEODESY&NASA TECH.MEMO
TECH. NOTE
OFF. OTE 330
PREPRINT,WORKSHOPPROC. AES/CMOS 2ndWORKSHOPON OPER.MET.
J. OF GEO.RES.
32 Cosputer-Worded MarineForecasts.
3. A Columbia River EntranceWave Forecasting ProgramDeveloped at the OceanProducts Center.
34. Forecasting Open OceanFog and Visibility.
35 Local and Regional ScaleWave Modele.
l/S7
1/8710/97
10/87
4/87
4/87
10/87
4/88
SAME AS NO. 15S
NWA DIGESTPREPRINT
J. GEO. RES. 11/88
PRES. ANAH IECONFERENCE
TECH NOTEOFF. NOTE3:15
J .OF GEO. RESin press
1/87
INTERNATIONAL J.FOR NUHERICALMETHOOS IN FLUIDS
in press
WEATHER AND 6/88
FORECASTING
D B. AO WEATHER ANDFORECASTINGVol. 4pp.427-432
E.S. Chan PRESENTED 4/3-7/89AT 7TH INTERNATIONALCONFERENCE OF FINITEELEMENT METHODSFLOW PROSLEMS
Y.Y, CHA 2ND INTERNATIONALWOReSHOP ON WAVEFORECASTING AND
HINDCASTING
D.C. ESTEVA 2ND INTERNATIONALWORKSHOP ON WAVEFORECASTING ANDHINDCASTING
Wt S RICHARDSON COASTAL ZONE i/89
J 11 NAU LTD.8. FEIT
Y. Y. CHAOT.L. aERTUCCI
L.D. BUJRROUGHS
D.8. RAO
TECH. NOTEOFFICE NOTE1361
5/ /86910/89
PPEPRINT
PROCEED1RG(COO/wHO)TECH.CONF. ON WAVES
in press
36, Gulf of Mexico Wave model Y.Y CHAO(approx, ). DFFY
37. oPC Product Rev. Summary.
28, Compendium of MarineMetmoroloqical 6 Ocean-oqgraphnc Products of theOcean Products Center.(rev. 1)
39 Directional Wave Spectrafor the Labrador ExtremeWave Experimental (Lewex)
40. An Analysis of Monthly
SBa Surface TmaperatureAnomalies in Watere offcthe U. S. East and WestCoasts.
41. A Definition for VectorCorrelation and itsApplication to MarineSurface Winds.
42 Expert System for QualityControl and MarineForec-tintg Guidance.
43. OPc Unified arinaDatabase VerificationSystem.
44. Sea Ice Edge ForecastVerification Proqramfor the Srinq Sea.
45. An Operational MarineFog Prediction Model.
46. The Circulation OfMonterey Bay and RelatedProcEmses
2/88
L.D. BURROUGHS TECH. NOTEOFFICE NOTE
1369
D0M. FEIT NOAA TECH.MEMO. NWSNMC 68
D.C. ESTEVA APL TECH.
Y.y. CHAO REPORTin press
L.C. Breaker FisheriesW.B. Campball Bulletin
6/89
8/89
D.S. Crosby TECH NOTEL.C. BreaKer OFFICE NOTEW.N. Gammill 2365
0.,. FeltW.S. Richardson
V.m. Gerald TECH NOTENMC OFFICE NOTE1361
G.Wohl TECH NOTENMC OFFICE NOTE#370
0. Feit3. Alpert
L. C Breakerw.W. BroenkoS
PACLINAGU MONOGRAPHin press
.J OF GEO.RESEARCH
(submitted)
23. Open Ocean Fog andVisibility ForecastingGuidance System.
L. D. BURROUGHS OFF. NOTE 348TECH. NOTE
.. _.-A u~ t- a DIGESTNl- -.----
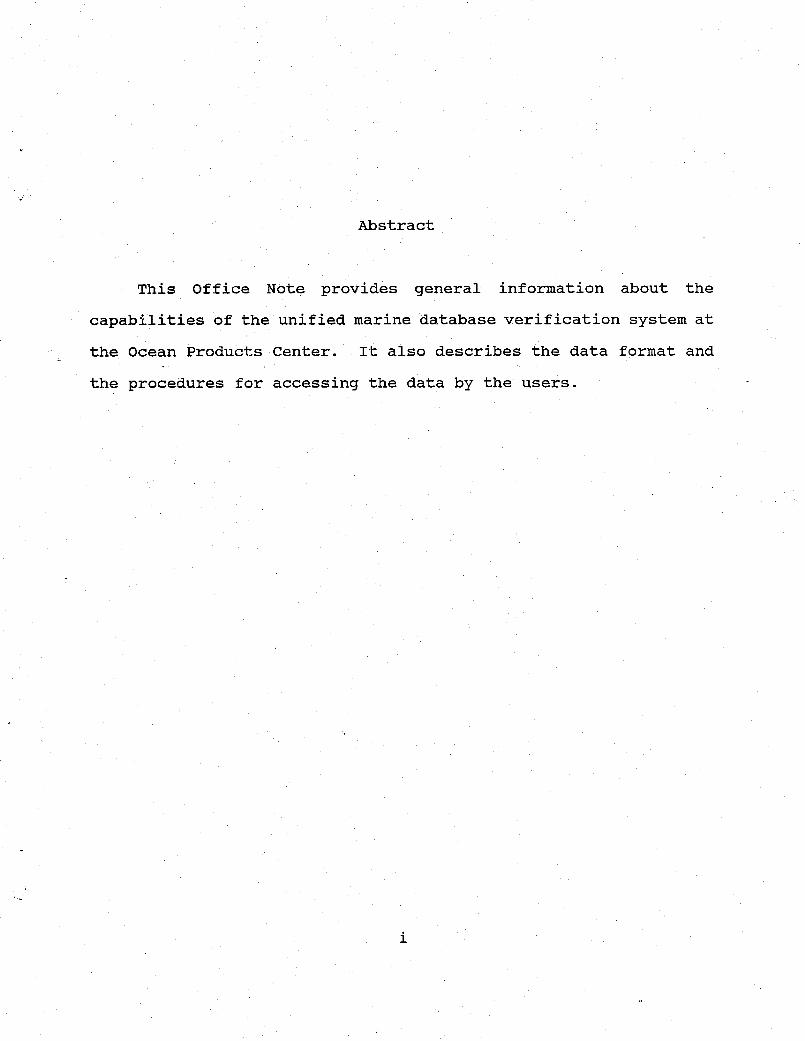
Abstract
This Office Note provides general information about the
capabilities of the unified marine database verification system at
the Ocean Products Center. It also describes the data format and
the procedures for accessing the data by the users.
i
INTRODUCTION
The Marine Prediction Branch(MPB) of the National
Meteorological Center(NMC) and the Ocean Products Center (OPC) is
responsible for producing objective analysis and forecast products
on various marine meteorological and oceanographic variables.
These analyses and forecasts are provided directly to the marine
community for use in weather forecasting guidance and as boundary
conditions to ocean models.
An important activity of MPB involves evaluating and
monitoring the performance of these models. To address this matter
a unified marine products verification database system was designed
to provide easy access to marine information from NMC's diverse
database system. This common database matches analyses and
forecasts of wind speed and direction, fog and visibility, air and
sea surface temperature, wave height and direction, relative
humidity and mean sea level pressure with the observed data
reported by ships, fixed and drifting buoys, and other marine
platforms.
Monthly verification statistics, such as, root mean square
error, bias, and correlation coefficient, are used in monitoring
and evaluating these analyses and forecasts. Statistical results
from selected marine models are presented and discussed each month
during the OPC's products performance review. For a complete
1
summary of the monthly performance evaluation of selected
operational marine products see Burroughs(1989).
METHOD
A. Model Outputs
The analyses and forecasts monitored within the unified marine
database verification system come from the NMC's regional(RGL) and
aviation(AVA) models, the MPB's models, and Fleet Numerical
Oceanographic Center's (FNOC) Global Spectral Oceanographic Wave
Model(GSOWM).
In general, output fields from these models are saved at
12-hour increments out to 72 hours. Table I. gives complete
details of all fields extracted during the OOz GMT cycle.
B. VERIFICATION DATA
The observed data, Table II, come from NMC's synoptic surface
marine datasets. These datasets contain real-time marine
observations reported by Volunteering Observing Ships (VOS), Navy
and NOAA research vessels, fixed and drifting buoys, ocean weather
stations (OWS), and marine reporting stations (MARS). NMC receives
these reports via the Global Telecommunication System (GTS), the
Geostationary Operational Environmental Satellite (GOES) network,
and Coastal radio station transmissions.
2

DATA MATCH-UP
A. Record Format
All analysis and forecast fields verifying with the current
00z and 12z ship data are extracted from an 8-day circular file.
For each report a value of the gridded field at the observed
position(latitude,longitude) is generated by quadratic
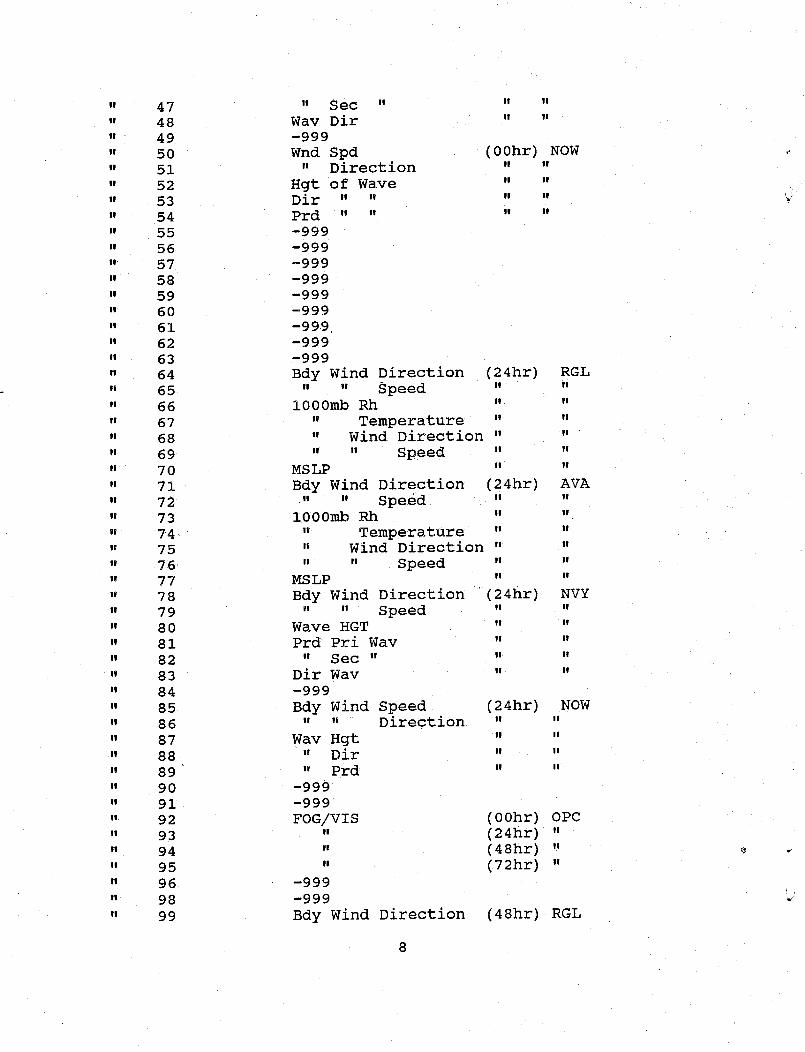
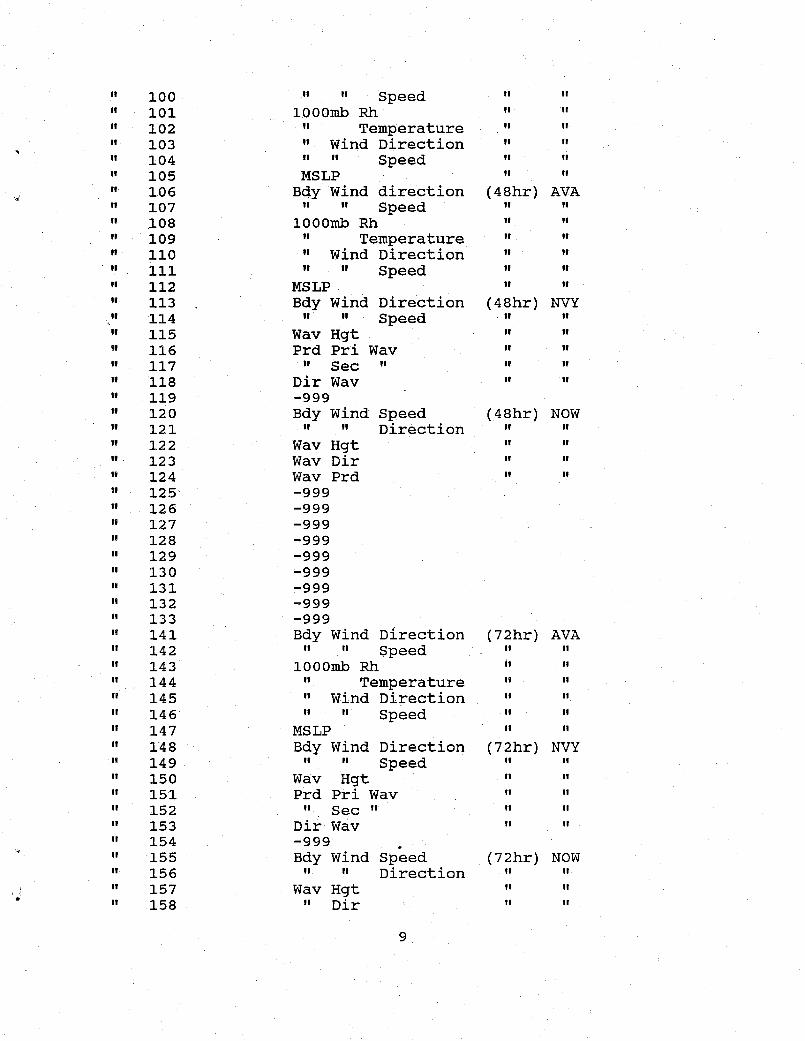
interpolation. Table III depicts the unified marine verification
database 164 indexed array/record format.
The daily match-up of the observed data and the model outputs
are written to a 17-day circular file called, NWS.WD21.OPC.UNF-
DATA.CYC00. Approximately 1800 records are processed daily. Each
record is packed and blocked with format control. At the end of a
15-day cycle the dataset is transferred from disk to tape.
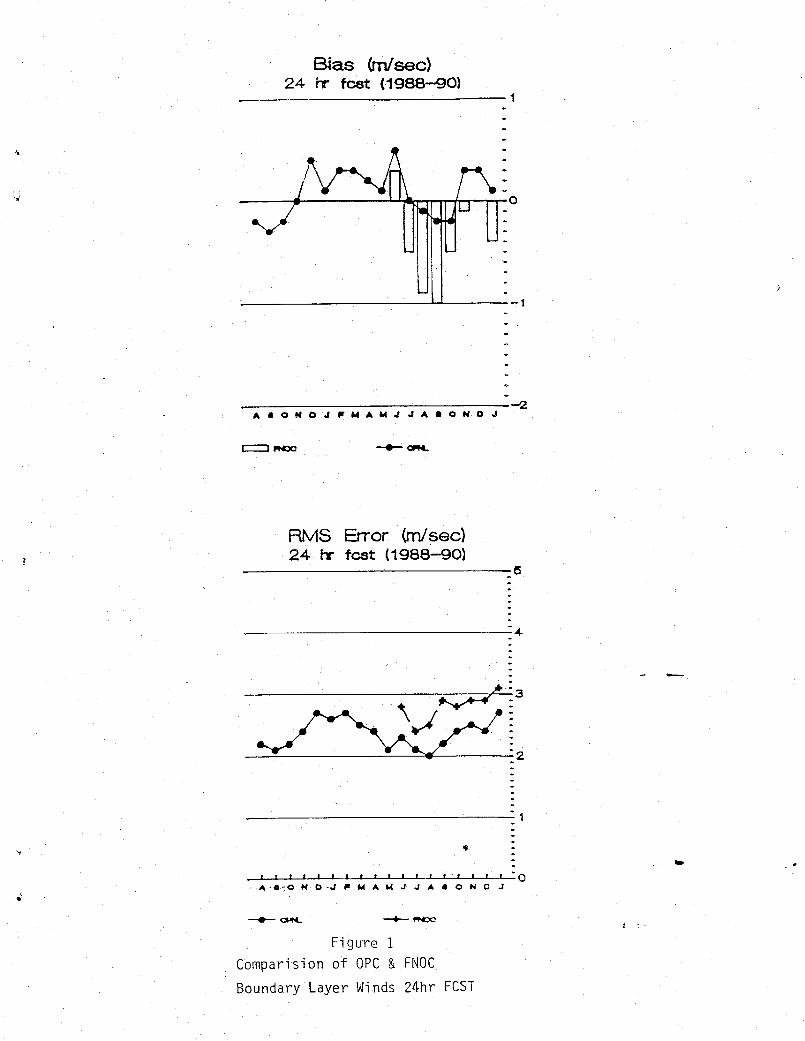
B. Statistical Evaluations
The boundary layer wind model is verified against fixed buoy
data. Statistics of bias and root mean square(RMS) error are used
to evaluate the analyses and forecasts. Figure 1 shows the 24hr
forecast RMS and bias errors in meters/second for the OPC and FNOC
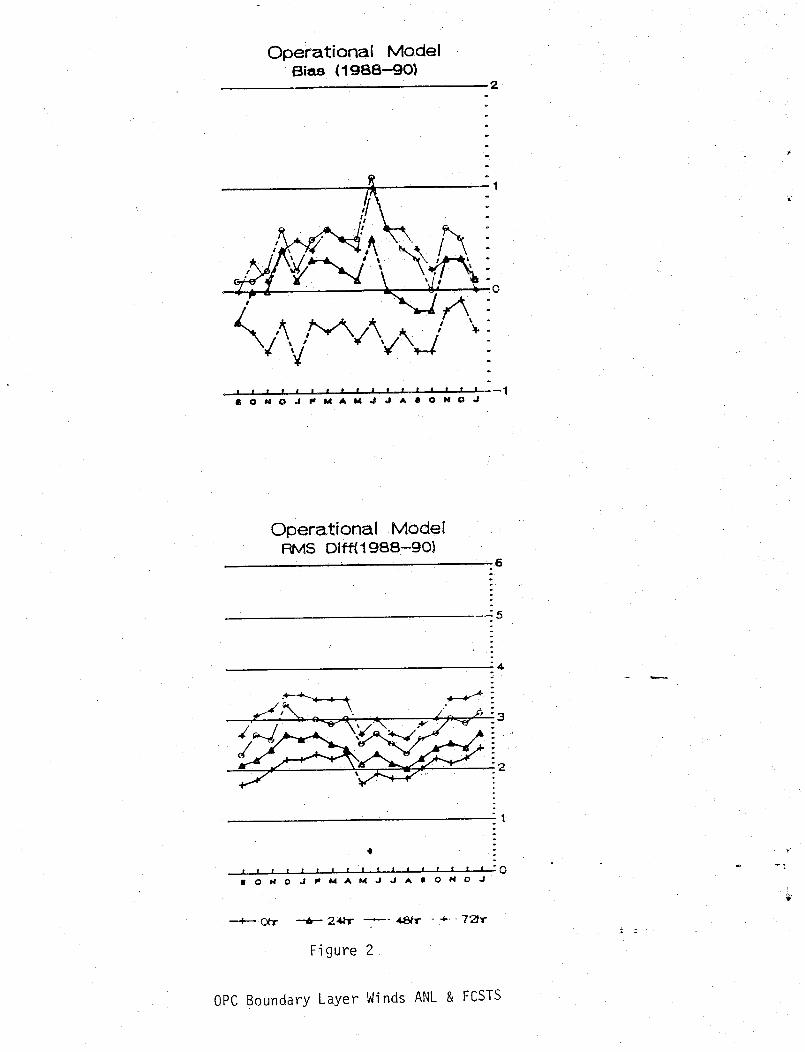
boundary layer winds for June 1989 - January 1990. Figure 2
displays OPC wind analysis and forecast errors of bias and RMS in
meters/second for Sept 1989 - Jan 1990.
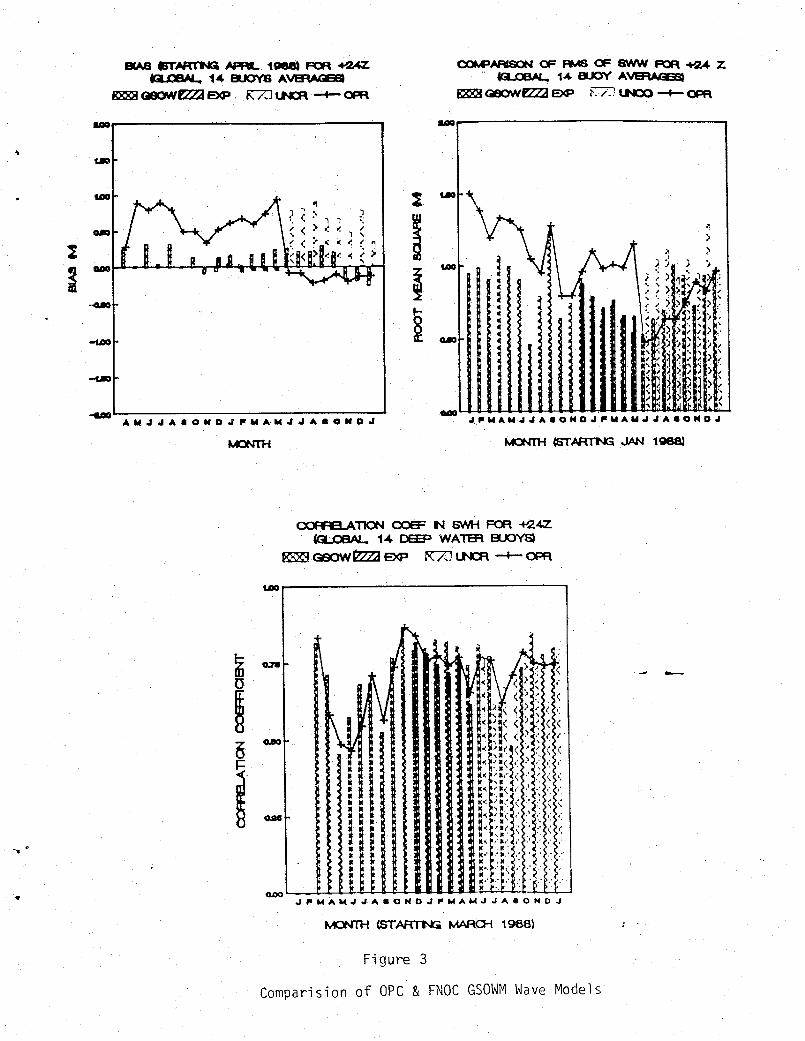
The OPC wave model is verified against 14 offshore deep water
3
fixed buoys. The evaluation of the OPC wave model performance is
based upon statistics of bias(m), RMS(m) error, and correlation
coefficient. Figure 3 shows the statistical comparison between the
OPC and GSOWM wave models.
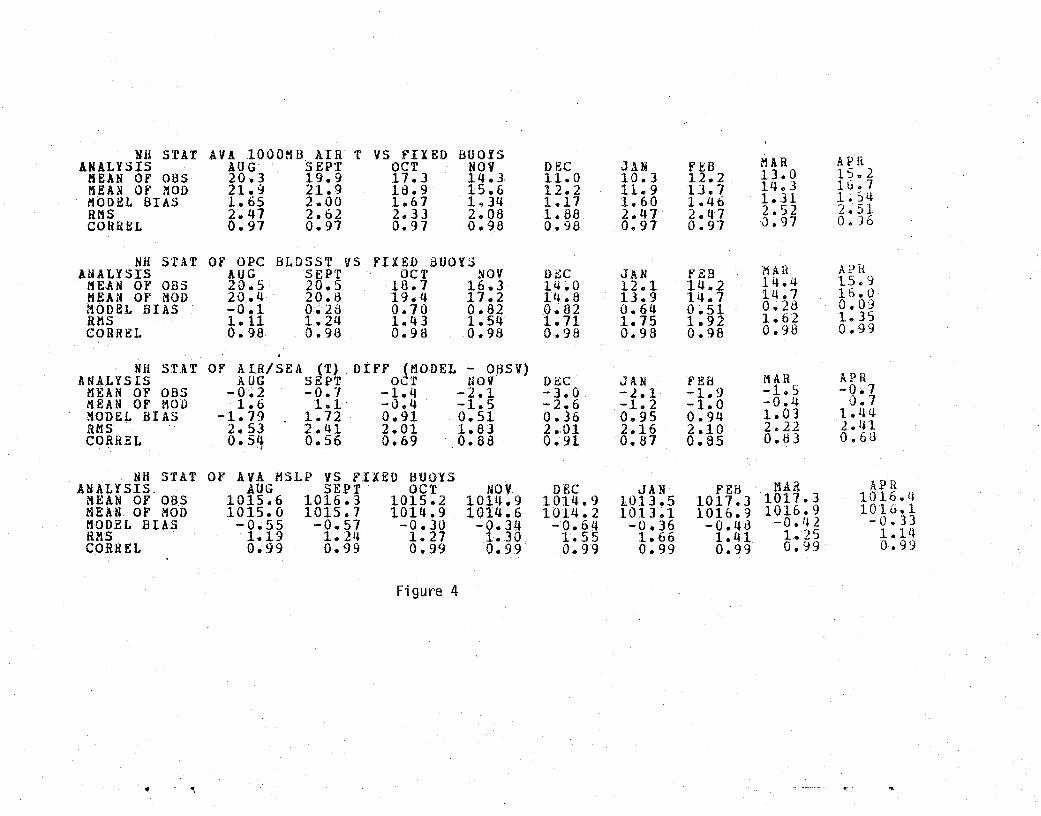
Figure 4 depicts statistical verification of air and sea
surface temperature analyses, air/sea temperature differences, and
mean sea level pressure with fixed buoy data.
SUMMARY
The development of the unified marine verification database
system allows statistical evaluation and comparison of selected
operational marine products in a timely fashion. These performance
statistics(RMS error, bias, and correlation coefficient) are
presented and discussed each month during the OPC products
performance review.
ACKNOWLEDGEMENT
The author would like to thank Dr. D. B. Rao, Mr. W. Gemmill,
and Mr. D. Feit for their suggestions and guidance during the
writing of this office note. Thanks to Susan Hubbard for the
typing.
4
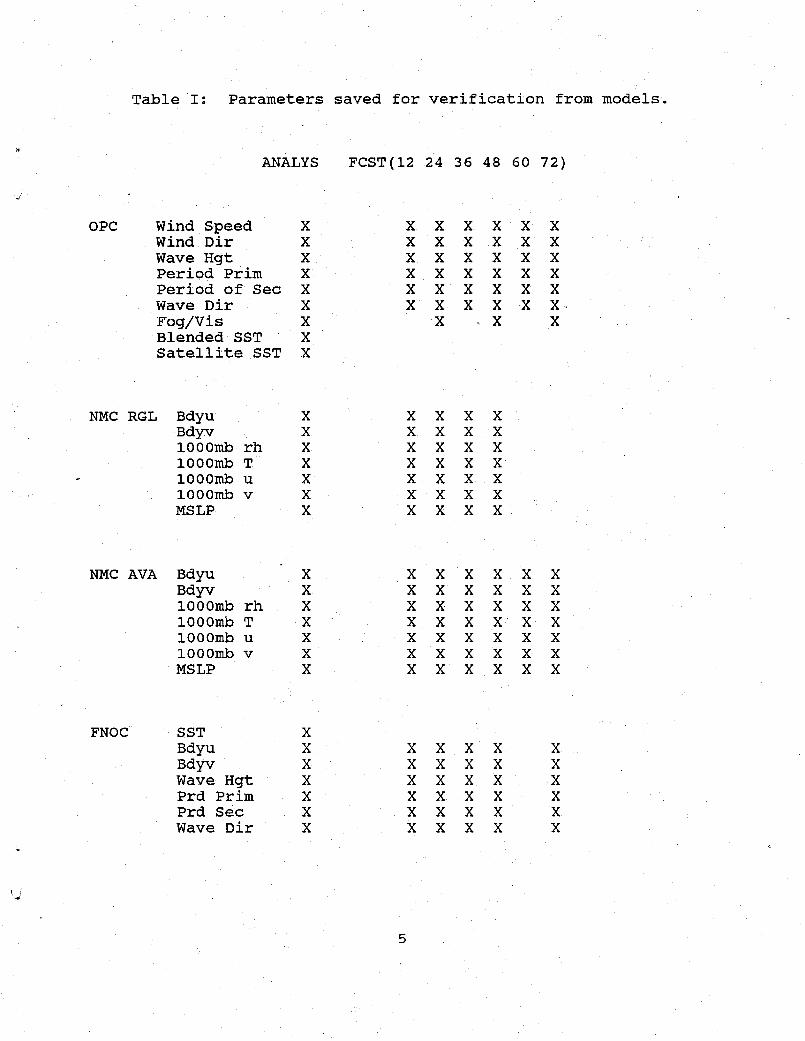
Table I: Parameters saved for verification from models.
ANALYS FCST(12 24 36 48 60 72)
OPC Wind Speed XWind Dir XWave Hgt XPeriod Prim XPeriod of Sec XWave Dir XFog/Vis XBlended SST XSatellite SST X
NMC RGL Bdyu XBdyv X1000mb rh X1000mb T X1000mb u X1000mb v XMSLP X
NMC AVA Bdyu XBdyv X1000mb rh X1000mb T X1000mb u X1000mb v XMSLP X
FNOC SST XBdyu XBdyv XWave Hgt XPrd Prim XPrd Sec XWave Dir X
xxx xx x xxx xx x xxx xx x xxx xx x xxx xx x x x x x x x
x x
xxx xxxx xxxx xxxx xxxx xxxx xxxx x
xx xxxxx xxxxx xxxxx xxxxx xxxxx xxxxXxx x
x xx xx xx xx xx xx xx xx xx xx xx x
xxxxxx
5
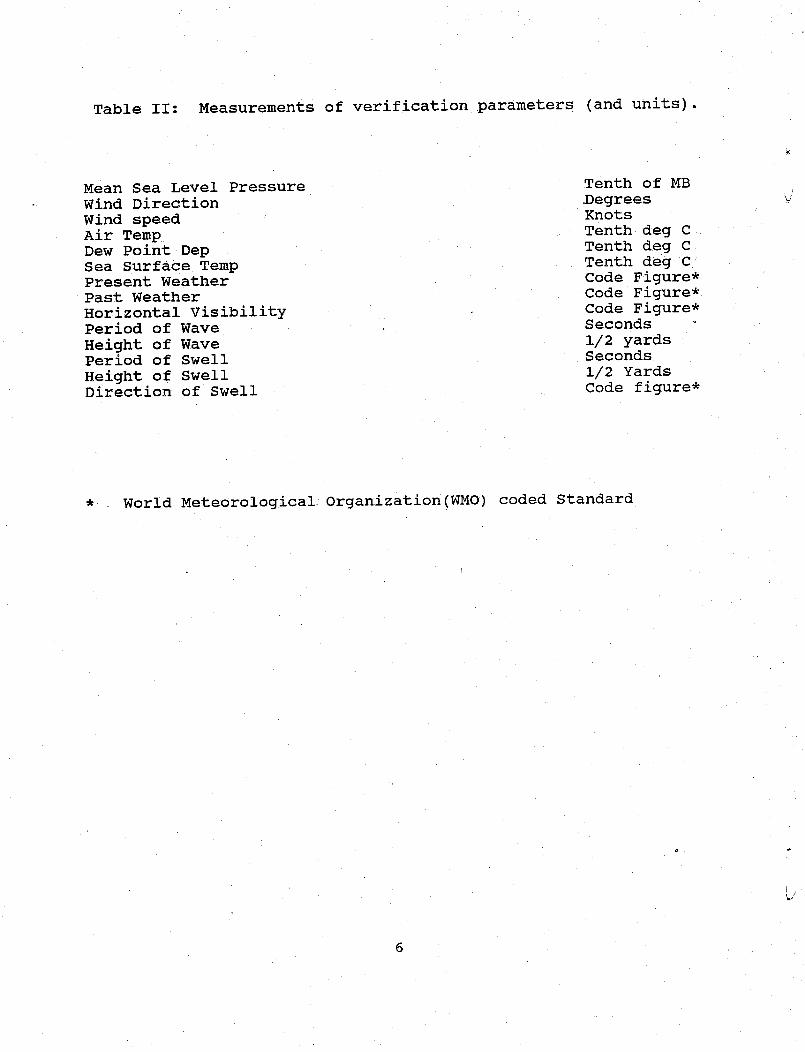
Table II: Measurements of verification parameters (and units).
Mean Sea Level PressureWind DirectionWind speedAir TempDew Point DepSea Surface TempPresent WeatherPast WeatherHorizontal VisibilityPeriod of WaveHeight of WavePeriod of SwellHeight of SwellDirection of Swell
Tenth of MBDegreesKnotsTenth deg CTenth deg CTenth deg CCode Figure*Code Figure*Code Figure*Seconds1/2 yardsSeconds1/2 YardsCode figure*
* World Meteorological Organization(WMO) coded Standard
6
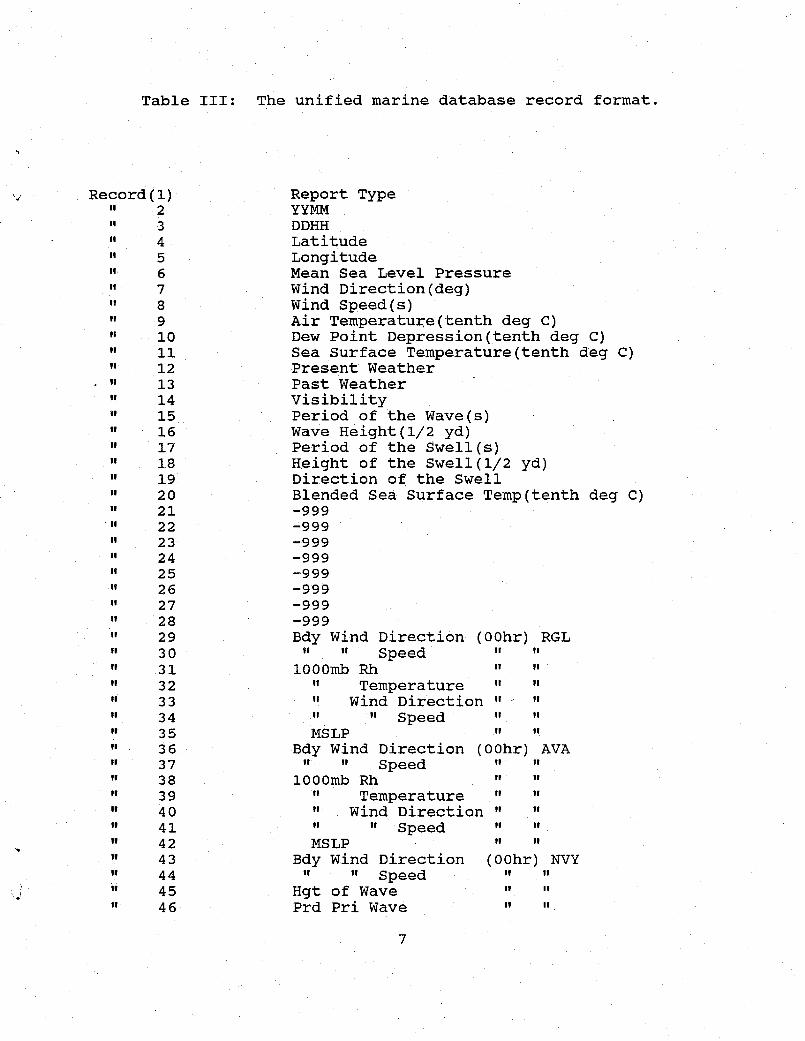
Table III: The unified marine database record format.
Record(1)"i 2*. 3
4
" 5" 6
" 7
" 8"i 9
" 10" 11
" 12" 13" 14" 15
" 16" 17" 18
" 19" 20" 21" 22" 23" 24" 25
26" 27" 28" 29" 30" 31" 32
"H 33" 34
" 35" - 36" 37
" 38.. 39
" 40" 41
42" 43" 44i" 45
" 46
Report TypeYYMMDDHHLatitudeLongitudeMean Sea Level PressureWind Direction(deg)Wind Speed(s)Air Temperature(tenth deg C)Dew Point Depression(tenth deg C)Sea Surface Temperature(tenth deg C)Present WeatherPast WeatherVisibilityPeriod of the Wave(s)Wave Height(1/2 yd)Period of the Swell(s)Height of the Swell(1/2 yd)Direction of the SwellBlended Sea Surface Temp(tenth deg C)-999-999-999-999-999-999-999-999Bdy Wind Direction (00hr) RGLi" " Speed t" "
1000mb Rh " "" Temperature " "
" Wind Direction "- "" i" Speed " "MSLP " "
Bdy Wind Direction (00hr) AVA" it Sne-ed to if
-U ---
1000mb Rh " "" Temperature i" "i
" Wind Direction " "i" " Speed I" "MSLP "
Bdy Wind Direction (00hr)" -" Speed "i
Hgt of Wave "Prd Pri Wave "
NVYI.
I.
I,
7
" Sec " I "Way Dir " "-999Wnd Spd (OOhr)" Direction " "
Hgt of Wave " "iDir " " " "
Prd " "-999-999-999-999-999-999-999,-999-999Bdy Wind Direction (24hr)
1" " Speed "1000mb Rh
" Temperature "" Wind Direction"" " Speed "
MSLP "Bdy Wind Direction (24hr)" " Speed "
1000mb Rh "I" Temperature "
" Wind Direction"" " Speed "
MSLP "Bdy Wind Direction (24hr)" " Speed "
Wave HGT "Prd Pri Wav "
" Sec U BTi,,
-999Bdy Wind Speed,, " Direction
Wav Hgt" Dir" Prd-999-999FOG/VIS
'BIIof*.
-999-999Bdy Wind Direction
(24hr)..i!
.I
I.
(00hr)(24hr)(48hr)(72hr)
(48hr) RGL
8
" 47" 48", 49" 50" 51" 52" 53
54" 55" 56
57" 58" 59" 60" 61" 62" 63" 64" 65" 66" 67
" 68" 69" 70" 71" 72" 73I' 74" 75" 76'" 77"B 78.. 79
80" 81" 82
83" 84" 85" 86" 87" 88"' 89" 90" 91" 92" 93.. 94., 95" 96" 98.. 99
NOW
RGL!1
!1
!1
!1
it
..
AVA.,!i
I.
..i!
I.
NVYI.
i!
I!
I.
I!
NOWI.
I,
I!
I!
OPC....I.
" 100" 101" 102" 103" 104"i 105
" 106"I 107
" 108"I 109" 110" 11" 112" 113" 114
" 115" 116
" 117" 118
" 119" 120" 121" 122" 123" 124" 125" 126
" 127" 128" 129" 130" 131" 132" 133" 141" 142" 143" 144" 145" 146" 147" 148" 149" 150" 151" 152" 153" 154" 155" 156" 157" 158
t" " Speed1000mb Rh
" Temperature" Wind Direction
" " SpeedMSLPBdy Wind direction
" " Speed1000mb Rh" Temperature" Wind Direction" " Speed
MSLPBdy Wind DirectionI" " Speed
Wav HgtPrd Pri Wav" Sec "
Dir Way-999Bdy Wind Speed" " Direction
Wav HgtWav DirWav Prd-999-999-999-999-999-999-999-999-999Bdy Wind Direction" " Speed
1000mb Rh" Temperature" Wind Direction" " Speed
MSLPBdy Wind Direction" " Speed
Wav HgtPrd Pri Wav
" Sec "Dir Wav-999Bdy Wind Speed" " Direction
Way Hgt" Dir
I!
I!
I!
!!
(48hr)!1
11
It
it(48hr)it
!1
'Iitit
'I
II
FI
II
ll
Fi
AVAIF
ll
oI
llIt
II
(48hr) NVYi t
if If
if It
o .It
it It
(48hr)It
..
NOWI!
It
it It
it if
(72hr)Itif11
If
Jl
I,
If
(72hr)If
AVAI!
!!!!!!!!!l
NVY!S
ll llt
ll ll
ll It
ll ll
(72hr) NOWif ! l
of !!
!! !l
9
it If
(00hr) NVY
I" 159" 160" 161" 162if 163
" Prd-999-999-999SST ANL
10
v
To
Bias (n/sec)24 fr fcst (1988--90)
I
-°
-3
-2
AS..O-N-O.J FMAMJJA*ONO J
AMS: Error (rn/see)24 Of fost (1988-90)
:4
'-
a / 2~~~~~~~
I
9
,,, . . I . ., . I I A I I QAh; at- ON-J $ U .1 4 A 6 N 0 4
--+1'--- MCC
Figure 1
Comparision of OPC & FNOC
Boundary Layer Winds 24hr FCST
Operational ModelBias (1988-90)
-2
N 0 J F M A M J J A * 0 N G J
Operational ModelRMS Diffl( 1988-90)
: ;~~6:
:5
4
· v ~'. .4, . ~ ;.,34/ ~ ~ ~ -- \ 2'-1'V'
, , \s / X ./~,,Ar* A ll~~~~~~~~~~~~~~~~~~~~~~~~~~~~~~~~~~~~~~~~~~~~~~~
. ! I . f !- I ! ! ! f t t I N :
a C N C J t 4 A M J J A *O 0 NO J;.)
; Or & 24t 4tr --- -72-rFigure 2
OPC Boundary Layer Winds ANL & FCSTS
IC - ! 4w, -: :4
"Y-1111-�7:
-1
.
BA 4TARTN3 APL 1ge R FO ZG 14 BLIJOS AVRAG
RRS 380WE EDP .7C Li -4- OKR
AMIJ J A O N D J PLAI
MONTH
I
i
I
CO"..A1A COEF N. SVA FOR +24ZI.OBEAL. 14 DE WATM BUOYS)
R G9OW= EXP 170 + - OPR
6
i
J P , A J JA ONHO J PMAM J J AO ND J
MON TAFH MARCH 198)
Figure 3
Comparision of OPC & FNOC GSOWM Wave Models
COMPSN OF FOS6 aF 8WW PFOR .24 Z. OBN... 14 BuoY AVE:A::
w 2 Ew P s w + CPR
J IMAMJ JAOOD J PMAJ JAONDJ
MONH TTARTn7G JAN 198
NH STATANALYSISMEAN OF OBSMEAN OF MODMODEL BIASRMSCOREL
NH STATANALYSISMEAN OF OBSMEAN OF MODMODEL BIASRMSCORREL
Nil STATANALYSISMEAN OF OBSMEAN OF MODMODEL BIASRHSCORREL
NH STATANALYSISMEAN OF OBSMEAN OF MODMODEL BIASRMSCORREL
AVA 1000MB AIR TAUG SEPTr20.3 19.921.9 21.91.65 2.002.47 2.620.97 0.97
OF OPC BLDSST VSAUG SEPT20.5 20.520.4 20.8-0.1 0.281.11 1.240.98 0.98
VS FIXEDOCT17.318.91.672.330.97
BUOYSNOV14 .315.61 342. 080. 98
FIXED BUOYSOCT NOV18.7 16.319.4 17.20.70 0.821.43 1.540.98 0.98
OF A R/SEA (T) DIFF (MODEL - OSV)AUG SEPT OCT NOV
-0.2 -0 7 -1.4 -2.11.6 1.1 -0.4 -1.5-1.79 1.72 0.91 0.512.53 2.41 2.01 1.830.54 0.56 0.69 0.88
OF AVA MSLP VS FIXED BUOYSAUG SEPT OCT NOV
1015.6 1016.3 1015.2 101. 91015.0 1015.7 1014.9 1014.6-0.55 -0.57 -0.30 -0.341.19 1.24 1.27 1.300.99 0.99 0.99 0.99
DEC11.012.21.171.880.98
DEC14.014 . 80.821.710.98
DEC-3.0-2.60 . 362.010.91
DEC1014.91014.2-0.64
1.550.99
JAN10.311 .91. 602.* 470.97
JAN12.113.90.641.750.98
J N-2.1-1.20. 952.160. 87
JAN1013.51013.1-0.361.660. 99
FEB12.21 3.71.462 0.970 .97
MAR13.014.31.312.520.97
FEB14.2 14.414. 14. 740.51 0.281.92 1.620.98 0.98
F'EB MAR-1. 9 -1.5-1.0 -0.40.94 1.0'32.10 2.220.85 0.83
FEB iMAR1017.3 1017.31016.9 1016.9-0.48 -0.421.41 1.250.99 0.99
A P R1 5. 21 b . 716.72 * 542.) 510. 96
AP f15. 91 b6.0O . 0 90.091.350.99
APR-0.7-0. 7
I. it 442.1410 . 68
APR1016. 141010 . 1
-0 . 331 . 140 .9')
Figure 4
9 -

1'
v&$ ttT OF C ~
*t^4rEs of
:::
Ir~~~~~~~~~~~~~~~~~~~~
:~~ D
Oa .
:~~~~~~~. i