Embed Size (px)
Citation preview

Office market response to earthquake-prone building policy in New Zealand
Dr Olga FilippovaThe University of AucklandDepartment of Property
2015 ERES ConferenceIstanbul, Turkey

22 February 2011
• 6.3 magnitude earthquake• Epicenter 10km from Christchurch CBD• Followed 7.1 quake in Sept (no deaths)• 185 killed in Feb quake, 115 in CTV Bldg
Introduction
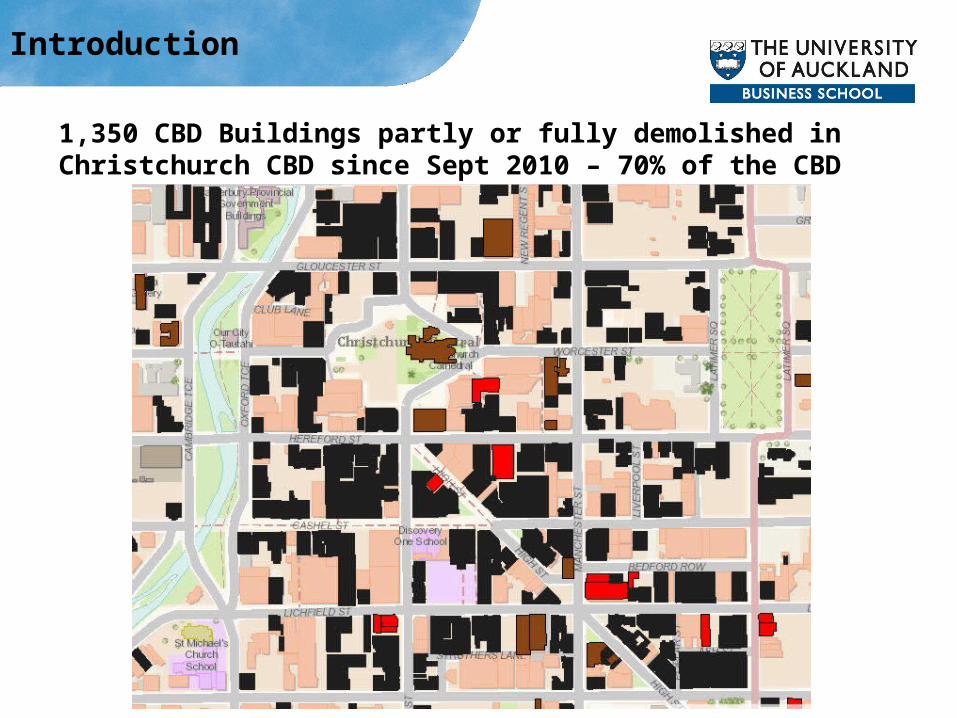
1,350 CBD Buildings partly or fully demolished in Christchurch CBD since Sept 2010 – 70% of the CBD
Introduction

Canterbury Earthquakes Royal Commission
• Volume 4: Earthquake-prone buildings• Released Dec 2012• Basis for Earthquake-prone buildings bill
(amendment to Building Act)• Move towards nationwide standard of
34%+ of ‘New Building Standard’ (NBS)• Earthquake-prone building stock mainly
built before 1976 seismic design standards– An earthquake-prone building is one that is likely
to fail in a moderate earthquake and is 1/3 or less of the strength of a building designed to the current Building Code
– An earthquake-prone building is less than 34% NBS
Introduction

Assessment of earthquake prone buildings
• Some Councils (Wellington & Auckland) taking active approach
• Assessing pre-1976 commercial and multi-storey residential building stock
• Council supplies landlords with a seismic performance report including % of NBS
• High NBS tends to be flaunted by landlords while sub 34% scores are reluctantly divulged to tenants
Introduction
Wellington
Auckland
Christchurch

Key post-earthquake market impacts
• Increased awareness of building standards
• Tenant priorities vary by group (corporates vs SMEs)
• Seismic concerns have now overtaken the focus on Sustainable Buildings
• Insurance impact all but small tenants most
• Firm origin influences risk perception and behaviour
• Most effects have faded over time or mitigated through leases
Interviews with leasing agents
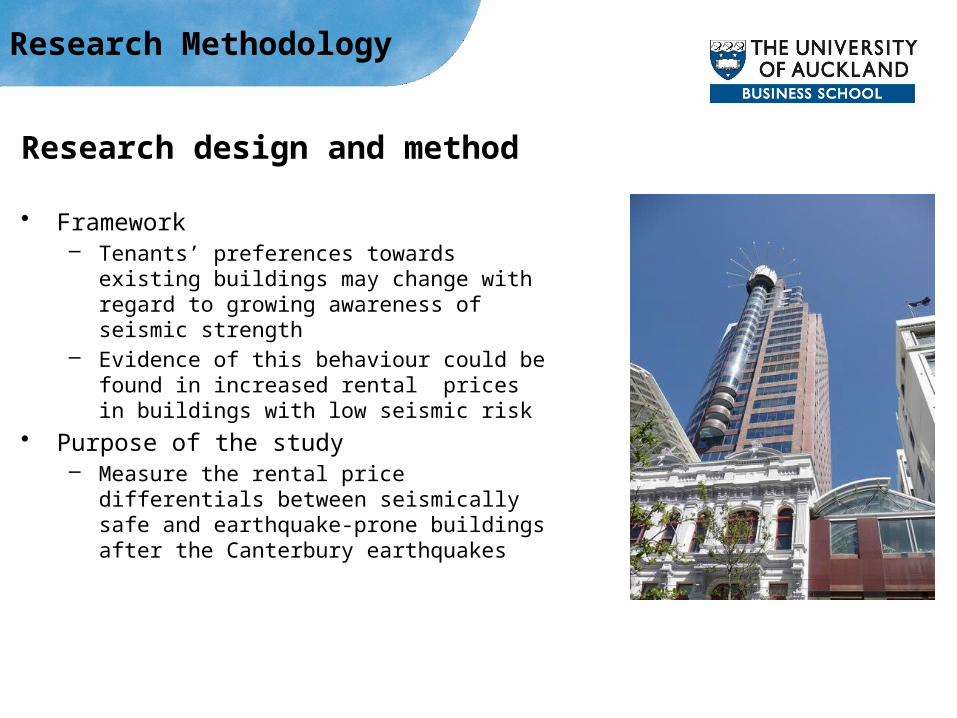
Research design and method
• Framework– Tenants’ preferences towards existing
buildings may change with regard to growing awareness of seismic strength
– Evidence of this behaviour could be found in increased rental prices in buildings with low seismic risk
• Purpose of the study– Measure the rental price differentials
between seismically safe and earthquake-prone buildings after the Canterbury earthquakes
Research Methodology

Previous office studies
• Asking rent for the dependent variable dominates– Property market suffers from information constraints– Further complicated by the confidentiality clauses
(Dunse et al. 1998)– Individual lease transactions appear in
Brennan et al. (1984) and Gabe and Rehm (2014)
• Location, age and size are the main contributors in explaining the variation in rent
• ‘Rent premium’ studies employ hedonic modelling as the standard methodology for examining price determinants
Research Methodology

Data
• Office leasing transactions– A sample of 2012-2014 leasing
transactions for the Auckland (67) and Wellington (97) CBDs
– Including net effective rent, locational and physical characteristics
– Source Colliers International (NZ)• Seismic performance of buildings
– Percentages of the National Building Standard (%NBS) of buildings used in analysis
– Source Auckland and Wellington City Councils; online listings
Research Methodology
AUCKLAND CBD PRECINCT MAP

Method
• Log-linear hedonic rent model– lnRi = αi + βxi + φZi + εi
– Ri is the natural log of effective rent per m2 in a given leasing transaction
– xi is a vector of explanatory characteristics such as building class, submarket and %NBS
– Zi is a vector of time related variables such as lease commencement year
Research Methodology

Descriptive statistics
Research Methodology
Auckland Wellington
Area leased (m2)
Mean 939 846
Min 103 55
Max 6,216 13,205
Net face rent (NZ$/m2/yr)
Mean 324 288
Min 200 98
Max 555 433
Net effective rent (NZ$/m2/yr)
Mean 296 228
Min 117 98
Max 540 414
Building class
P 17 -
A 16 4
B 13 31
C 21 62

Hedonic model estimates
Results
Auckland Wellington
Variable Coefficient t-Statistic Coefficientt-
Statistic Constant 5.408 23.44*** 5.474 22.61***
Ln Area leased 0.030 0.88 -0.038 -1.09Lease 2013 0.015 0.20 0.028 0.51Lease 2014 0.057 0.65 -0.008 -0.08Class Premium 0.358 3.74***
Class A 0.053 0.613 0.424 0.00***
Class C -0.208 -2.42** -0.301 0.00***
Outside core -0.134 -1.83* 0.196 0.00***
Fringe -0.315 -1.91*
Te Aro -0.159 -0.04***
Thorndon -0.043 -0.71NBS 2.5E-04 0.47 0.004 0.01***
R2 0.622 0.555F-stat 11.934 12.035
N 67 97
Significant at *** 0.01, ** 0.05 and *0.1 levels

Hedonic model
• Is there a rental price premium in buildings with higher NBS ratings?– Wellington - Yes
• Statistically significant rent premium as the value of NBS increases
• 0.44% for every percentage increase in NBS rating
• Tenants’ WTP by increasing rating from EQP (33%) to Low risk (67%) is $34/sqm based on average eff rent of $228
• Built on a faultline and has the highest earthquake risk in NZ
– Auckland - No• No rent premium found• A long way from high seismic activity with
a major shake expected every 10K-20K years
• Greater risk of tsunamis, volcanic eruptions and floods
Results
Wellington
Auckland
Christchurch

Next steps
• Collect additional leasing transactions from buildings with moderate and high earthquake risk
• Test other control variables such as building age, size and height
• Analyse leasing transactions that took place before the earthquakes (introduction of new policies)– Colliers International made available a sample
of their records from 2010 – 2012 for the same study areas
Results