Embed Size (px)
Citation preview

1
1
Phone: +61 2 9292 7400
Fax: +61 2 9292 7404
Address: Level 14, 347 Kent Street Sydney NSW 2000
Email: [email protected]
Follow us: Visit www.prpsydney.com.au
© Copyright Preston Rowe Paterson NSW Pty Limited
INSIDE THIS ISSUE:
Sydney CBD Office Market 2
North Sydney Office Market 5
Crows Nest/ St Leonard's Office Market 7
Parramatta Office Market 9
Chatswood Office Market 11
North Ryde/ Macquarie Park Office
Market 12
Economic Fundamentals 14
About Preston Rowe Paterson 17
Contact Us 19
Sydney Metropolitan
Office Market Report
First Half 2017 HIGHLIGHTS
The strong office market in Sydney CBD is reiterated by its lowest vacancy rates out of all major
cities around Australia, as well as the large amount of office supply that is expected to enter
Sydney’s market by 2019.
North Sydney has experienced strong growths in office developments over the past eighteen
months as a result of strong demand from expanding commerce industries. Notably, Premium
Grade and A Grade stock increased over the six months to January.
Parramatta is experiencing extensive changes in their urban landscape, with more than $12 billion worth of
investment in its pipeline, including the upgrade of the Civic Square which alone costs around $2 billion.
Total office space in the North Ryde/ Macquarie Park zone stands at 878,950 square metres, an
increase of over 60% when compared to ten years prior. Vacancy rate across the North Ryde/
Macquarie Park office market increased by 0.4% to 7.5% over the six months to January 2017.

2
Phone: +61 2 9292 7400
Fax: +61 2 9292 7404
Address: Level 14, 347 Kent Street Sydney NSW 2000
Email: [email protected]
Follow us: Visit www.prpsydney.com.au
© Copyright Preston Rowe Paterson NSW Pty Limited
2
SALES
183-185 Clarence Street, Sydney, NSW
2000
Built has purchased a 99-year leasehold
to a 3,600 m2 office building for $22.75
million. The 1,000 m2 site was sold by
Vietnamese Vingroup. The new owners
plan to refurbish to create up to 8,000 m2
of office and retail with up to seven
additional levels on the current buildings.
The sale reflects a rate of $22,750 psm.
296 and Lot 1, 300 George Street, Sydney, NSW 2000
A Hong Kong investor has sold a three-level commercial property to
another Asian investor for $9 million. The 423.3 m2 property occupies an
82.2 m2 site and is home to Lee’s Malaysian restaurant. The restaurant
brings in a gross annual rent of $197,389 but the rest of the property is
vacant. If the property was fully leased, it could return about $607,389 in
gross annual rent. The sale reflects a rate of $21,262 psm.
20 Bridge Street, Sydney, NSW 2000
Kumpulan Wang Persaraan has sold a
13-level office tower to a Hong Kong
buyer for between $330 and $350
million. The property known as
Exchange Centre is an A-grade office
complex with 20,347 m2 of net lettable
area. ASX Group occupies over 45% of
the building with 11 years left on their
lease. The WALE of the building is
around 7-years. The property could be
redeveloped with a higher height
potential.
Sydney CBD 275 George Street, Sydney, NSW 2000
John Holland has bought a 14-storey, 7,357 m2 office building from QIC
Global Real Estate for over $82 million. The B-grade building, formerly
known as the ANZ Bank Building, was constructed in 1966 and was last
refurbished in 2003. The buyer plans to demolish the office tower and
construct a new 15-storey building of around 8,023 m2. The sale reflects a
rate of $11,146 psm.
320 Pitt Street, Sydney, NSW 2000
ARA Asset Management has bought a 21,159 m2 office tower from
Propertylink Office Partnership II for $280 million. The property is leased to
Telstra until 2020 and has sold on an initial yield of 6.26%. The sale
reflects a rate of $13,233 psm.
LEASES
126 Phillip Street, Sydney, NSW 2000
Allens Linklaters has re-signed to lease office space
for 7.5-years. The company will occupy 8,424 m2 of
space for an undisclosed amount.
Lvl 10/111 Elizabeth Street, Sydney, NSW 2000
16 Wardell Chambers has moved from their 39 Martin Place offices to a
newly lease 753 m2 B-grade office after being displaced by the Sydney
Metro construction. The chambers agreed to a 7-year lease at a gross
annual rent of $845 psm.
Level 19, 66 Goulburn Street, Sydney,
NSW 2000
National Disability Services Limited has
agreed to a 5-year lease for a whole-floor
937 m2 office. GDI Property Group is the
landlord and the net annual rent is $665 psm
for the A-grade space.

3
Phone: +61 2 9292 7400
Fax: +61 2 9292 7404
Address: Level 14, 347 Kent Street Sydney NSW 2000
Email: [email protected]
Follow us: Visit www.prpsydney.com.au
© Copyright Preston Rowe Paterson NSW Pty Limited
3
Tower 1, International Towers Sydney
The completion of this building in the fourth quarter of 2016 has added an
extra 103,041 square metres of net lettable area into Sydney’s office
market. The tower also houses 8,000 square metres of retail space ad
1,100 square metres of space of other uses. A total of 48 levels and a
larger-than-average floorplate size of 2,300 square metres adds
uniqueness to this Lendlease-owned Premium Grade building. Currently,
major tenants of Tower 1 include wholesaler and liquor importer Pernod
Ricard Winemakers, HSBC, PwC, Marsh & McLennan and Servcorp.
333 George Street
Charter Hall-owned 333 George Street was completed in the fourth
quarter of 2016 and adds an extra 12,514 square metres of office space in
Sydney’s commercial office market. Furthermore, there’s a retail area of
2,100 square metres in size. There are 14 office levels throughout the
building, with an average floorplate size of 950 square metres and a total
of 20 car spaces. Major tenants of this building include law firm Clyde &
Co and National Australia Bank, HSBC and Woolworths in the main
George Street frontage.
1 Farrer Place, Sydney, NSW 2000
Savills Australia has secured
2,200 m2 of premium-grade
office space at Governor Phillip
Tower for 9-years. The company
will occupy all of Level 25 and
part of Level 24 and pay a net
annual rent of between about
$1,200 to $1,600 psm.
223 Liverpool Street, Sydney, NSW 2000
Hub Australia will take over almost all the floors in a commercial building.
The company will occupy 4,200 m2 of the building which includes four of
the five floors.
140 Elizabeth Street, Sydney, NSW 2000
A circa 1990 office building on a 1,047 m2 site
has found a new tenant. The Australian Acad-
emy of Commerce & Cambridge will occupy
2,900 m2 of space in the B-grade, 10-level
building from the Salvation Army (NSW) Prop-
erty Trust on a 5-year lease. The lease is for
levels 5 to 10 and four parking spaces. The
DEVELOPMENTS
According to the Property Council of Australia, the completion of mainly
full and partial refurbishment around the Sydney Central Business District
will result in the addition of approximately 84,364 square metres of net
lettable area for over the first half of 2017, though no new development is
expected to be completed within this time. This is an addition on top of
2016’s completed construction, which has added 119,305 square metres
of space over the 2016 calendar year. PRP notes however, that a total of
128,326 square metres of office space was withdrawn over the six months
to January 2016, through the conversion of office space for residential and
hotel use, demolition and partial or full refurbishment. We outline below
some of the construction that have been completed in 2016 as well as
those that are expected to be refurbished by the first half of 2017.

4
Phone: +61 2 9292 7400
Fax: +61 2 9292 7404
Address: Level 14, 347 Kent Street Sydney NSW 2000
Email: [email protected]
Follow us: Visit www.prpsydney.com.au
© Copyright Preston Rowe Paterson NSW Pty Limited
4
Chart 1– Sydney CBD Office Stock Vacancy by Grade— Source— PCA
Project Address Development
Type Owner NLA
Expected Completion Date
80-82 Pitt Street Full
Refurbishment Yorkban Pty Ltd 9,700 Q1 2017
60 Margaret Street Partial
Refurbishment Mirvac Group (50%) / Pacific Alliance Group
(50%) 10,030 Q1 2017
1 Farrer Place Partial
Refurbishment DEXUS Property Group (50%) & Lendlease
(25%) & The GPT Group (25%) 1,234 Q2 2017
400 George Street Partial
Refurbishment Investa Property Group (75%) / Prudential
Australia Property Trust (25%) 8,463 Q2 2017
680 George Street Partial
Refurbishment Australian Wholesale Property Fund (50%) /
Brookfield Australia (50%) 2,667 Q2 2017
10 Shelley Street Full
Refurbishment Brookfield Asset Management 24,986 Q2 2017
11-17 York Street Full
Refurbishment Memocorp Australia Pty Ltd 11,227 Q2 2017
201 Sussex Street (Tower 3) Partial
Refurbishment The GPT Group 14,823 Q2 2017
OFFICE STOCK
Sydney’s office buildings continue to be one of Australia’s most sought
after assets by both foreign and domestic investors. Its strong
performance is reiterated by its lowest vacancy rates out of all major cities
around Australia, as well as the large amount of office supply that is
expected to enter Sydney’s market by 2019. Sydney’s office stock mirror
that of the rest of Australia in that it is predominantly A Grade stock. For
January 2017, total A Grade stock increased slightly to 1,809,622 square
metres. Over the same period, Premium Grade stock also increased to
1,118,972 square metres. In contrast, B Grade, C Grade and D Grade
offices experienced declines over the period. B Grade stock currently
stand at 1,439,949 square metres, C Grade stock at 525,730 square
metres and D Grade stock at 185,626 square metres.
0
500,000
1,000,000
1,500,000
2,000,000
2,500,000
3,000,000
3,500,000
4,000,000
4,500,000
5,000,000
5,500,000
Jan-10 Jul-10 Jan-11 Jul-11 Jan-12 Jul-12 Jan-13 Jul-13 Jan-14 Jul-14 Jan-15 Jul-15 Jan-16 Jul-16 Jan-17
Off
ice
Sto
ck L
evel
s (
Sq
uar
e M
etre
s)
Premium Grade A-Grade B-Grade C-Grade D-Grade
Source: PCA/Preston Rowe Paterson
Even though there has been a high volume of space added over the year
to January, a significant amount of office space have been withdrawn over
the same period due to major infrastructure changes, refurbishments and
conversions throughout the Sydney CBD, which ultimately resulted in a
negative net supply of -2,316 square metres. Overall in Sydney’s office
market, supply additions declined by 23,488 square metres over the year
to 126,010 square metres, whilst withdrawals increased by 81,109 square
metres to 128,326 square metres.
VACANCY RATES
Total vacancy of Sydney CBD’s office space increased over the half year
to January 2017, by 0.6% to 6.2%. This increase was attributed to the
increase in direct vacancy, which jumped 0.7% to 5.6% over the period.
Sub-lease vacancy declined by 0.1% down to 0.6%. All office grades,
except for D-Grade offices, experience increased in their vacancy rates
over the six month period. Premium Offices experienced an increase of
1.1% in vacancy to 12.3%, whilst A, B and C Grade Offices increased to
4.2% (+ 0.2%), 4.0% (+0.6%) and 6.6% (+0.7%) respectively. D Grade
buildings experienced a decline of 0.9%, down to 2.9% during the period.
According to the Property Council of Australia, the decline in demand calls
for the need to boost economic growth and encouragement of businesses
to start up around the central business district in order to cater for the
growing population in conjunction with remaining internationally competi-
tive in the global economy.
Table 1– Developments in Sydney CBD over the first half of 2017— Source— PCA

5
Phone: +61 2 9292 7400
Fax: +61 2 9292 7404
Address: Level 14, 347 Kent Street Sydney NSW 2000
Email: [email protected]
Follow us: Visit www.prpsydney.com.au
© Copyright Preston Rowe Paterson NSW Pty Limited
5
Demand for Sydney CBD’s office stock has stemmed from a variety of
sectors, including finance & insurance, government departments,
technology companies and media & advertising. Notably, tech companies
have taken up office spaces left behind by downsizing law firms, including
Uber and Amazon, both of whom have signed tenancy deals to lease offices
around the Sydney CBD. An increased number of small businesses have
also demand Sydney office spaces over the year to 2017, of which the trend
seems to be for these small businesses to move into more efficient and
higher quality spaces in a much sought after location.
NET ABSORPTION
The Sydney CBD office market absorbed 17,964 square metres over six
months to January 2017. Over the twelve months to January 2017, net
absorption over the year declined by 139,186 square metres. Over the same
period, all graded stock experienced a decline in their net absorption, with
Premium Grade experiencing the highest decline, of 9.0% over the year. C-
Grade stock declined by 5.8%, A-Grade stock declined by 2.2%, whilst B
Grade and D Grade stock declined by 0.5% and 0.6%, respectively.
SALES
146 Arthur Street, North Sydney, NSW 2060
Chinese-backed Aqualand has purchased an office block from General Nice
Group for $78 million. The building was constructed in 1989 and was
recently refurbished. The 8,171 m2 of net lettable area property features 10
levels of office space, three levels of basement car parking for 124 vehicles
and views of Neutral Bay and Sydney Harbour. The sale reflects a rate of
$9,546 psm. North Sydney is located about 3.8 km north of the Sydney
CBD.
LEASES
80 Pacific Highway, North Sydney, NSW 2060
Arthur J Gallagher will pay a net annual rent of between $700 to $800 psm
for 2,026 m2 of office space as it consolidates its operations into one
location. Mirvac leased the A-grade space to the insurance company for 7-
years. The property is undergoing renovations. North Sydney is located 3.8
km north of Sydney’s CBD.
DEVELOPMENT
North Sydney is currently experiencing strong office developments
throughout city, fuelled by a changing infrastructure and commercial
environment. Notably, the planned Sydney Metro Line has had a significant
impact on the restructuring and reallocation of tenants in and around
Sydney’s office spaces, with many opting to relocating up North Sydney and
other north shore markets. North Sydney’s office market will receive an
extra 134,260 square metres of space through developments and
refurbishments by the end of 2019. At this stage, there is a total of 15,118
square metres of stock that have been withdrawal, through demolition,
conversion to residential sites or partial refurbishments.
177 Pacific Highway
This new A Grade office tower, located on the corner of Berry Street and
Pacific Highway and recently completed in the fourth quarter of 2016, will
provide close to 40,000 square metres of Net Lettable Area into North
Chart 2– Sydney CBD Total Vacancy Rate (%)— Source— PCA
1.0
3.0
5.0
7.0
9.0
11.0
13.0
15.0
Jan-10 Jul-10 Jan-11 Jul-11 Jan-12 Jul-12 Jan-13 Jul-13 Jan-14 Jul-14 Jan-15 Jul-15 Jan-16 Jul-16 Jan-17
Tota
l Vac
ancy
Rat
e (%
)
Premium Grade A-Grade B-Grade C-Grade D-Grade
Source: PCA/Preston Rowe Paterson
Chart 3– Sydney CBD Net Absorption, 12 months to…— Source— PCA
-175,000
-150,000
-125,000
-100,000
-75,000
-50,000
-25,000
0
25,000
50,000
75,000
100,000
125,000
150,000
175,000
Jan-10 Jul-10 Jan-11 Jul-11 Jan-12 Jul-12 Jan-13 Jul-13 Jan-14 Jul-14 Jan-15 Jul-15 Jan-16 Jul-16 Jan-17
Aud
ited
Net
Abs
orpt
ion
12 m
onth
s to
... (S
quar
e M
etre
s)
Net Absorption
Source: PCA/Preston Rowe Paterson
NORTH SYDNEY

6
Phone: +61 2 9292 7400
Fax: +61 2 9292 7404
Address: Level 14, 347 Kent Street Sydney NSW 2000
Email: [email protected]
Follow us: Visit www.prpsydney.com.au
© Copyright Preston Rowe Paterson NSW Pty Limited
6
Sydney’s office market. Furthermore, an addition of 370 square metres of
retail space will be available, that will provide an array of contemporary
restaurants and cafes, as well as laneway style retailers. The new building
will provide large and flexible floor plate sizes which ranges from 1,198 to
1,565 square metres with in-built access floors and end-core that can create
large, efficient, flexible office spaces in combination with extensive city
views. The building boasts 31 levels of office and retail space, along with 4
levels of underground parking with 112 car spaces in total.
100 Mount Street
A new office building is under construction at 100 Mount Street, and will
become North Sydney’s tallest and largest office tower upon its expected
completion in the first half of 2019. The building will provide 42,000 square
metres of Net Lettable Area, along with 400 square metres of retail space
over 34 office levels. The development will offer floor plate sizes ranging
from 1,200-1,300 square metres, and will target 5-Star Green Star and 5-
Star NABERS Energy Ratings. The
building will have an open public
space at ground level, two ground-
floor retail areas, end of trip facili-
ties that will provide change room
amenities, as well as showers and
lockers. Furthermore, the building
will be fitted with premium quality
finishes and services, along with
basement level parking for 113
vehicles.
Project Address Development
Type Owner NLA
Expected Completion Date
1 Denison New Development
(DA Approved) Winten property Group 45,720 Mooted
101 Miller Street Partial Mirvac Group (50%) / TIAA Henderson
(50%) 5,713 Q3 2016
100 Pacific Highway Partial Leighton Properties / ISPT 1,408 Q1 2017
Table 2– Developments in North Sydney over the first half of 2017— Source— PCA
OFFICE STOCK North Sydney has experienced strong growths in office developments over
the past eighteen months as a result of strong demand from expanding
commerce industries. Notably, Premium Grade and A Grade stock
increased over the six months to January. Premium Grade market
experienced an increase of 5,713 square metres to 36,500 square metres,
whilst A-Grade stock increased by 38,011 square metres to 224,307 square
metres. In contrast, B Grade and C Grade offices experienced declines in
their stock over the same period. B Grade stock declined by 8,462 square
metres to 410,504 square metres, whilst C Grade office stock declined by
5,248 square metres to 138,253 square metres. D Grade stock
experienced no change in their stock, remaining at 12,932 square metres
over the six months to January 2017. Overall, North Sydney’s total office
stock increased by 30,014 square metres.
Chart 4– North Sydney Office Stock Vacancy by Grade— Source— PCA
0
100,000
200,000
300,000
400,000
500,000
600,000
700,000
800,000
900,000
1,000,000
Jan-10 Jul-10 Jan-11 Jul-11 Jan-12 Jul-12 Jan-13 Jul-13 Jan-14 Jul-14 Jan-15 Jul-15 Jan-16 Jul-16 Jan-17
Offi
ce S
tock
Lev
els
(Squ
are
Met
res)
Premium Grade A-Grade B-Grade C-Grade D-Grade
Source: PCA/Preston Rowe Paterson

7
Phone: +61 2 9292 7400
Fax: +61 2 9292 7404
Address: Level 14, 347 Kent Street Sydney NSW 2000
Email: [email protected]
Follow us: Visit www.prpsydney.com.au
© Copyright Preston Rowe Paterson NSW Pty Limited
7
VACANCY RATE Total office vacancy in North Sydney’s office market increased by 0.1%,
from 7.0% in July 2016, to 7.1% in January 2017. Direct Vacancy declined
by 0.2% to 6.5%, whilst sub-lease vacancy increased by 0.3% to 0.6%.
When we look at the different office grades in North Sydney, Premium
Grade office vacancy declined by 16.1% from 41.2% to 25.2%. Similarly,
but not to the same extent, A Grade and C Grade office vacancies declined
by 0.2% and 1.3%, respectively, down to 5.2% and 3.5%. In contrast, B
Grade and D Grade office vacancy increased by 1.0% and 0.4%,
respectively, up to 6.7% and 3.3%. The planned Sydney Metro Line from
Chatswood through to the Sydney Central Business District, have led to a
decline in stock withdrawal from compulsory acquisition, with four buildings
withdrawn in the third quarter of 2016 from North Sydney alone.
NET ABSORPTION Net absorption in North Sydney’s office market stood at 1,198 square metres of
space over the six months to January 2017. This figure comes after a decline in net
absorption of 20,849 square metres over the six months to July 2016. When we look
at the change in occupied stock over the twelve months to January, total change
stands at 0.2%, an increase of 2.9% from July 2016’s figure. Premium Grade stock
experienced a decline of 25.2% in occupied stock over the period, whilst B Grade
and C Grade buildings experienced a decline of -3.4% and -10.5%, respectively. A
Grade stock experienced an increase of 22.6% in their occupied stock over the
year, whilst D Grade stock experienced an increase of 3.3% in occupied stock.
Chart 5– North Sydney Total Vacancy Rate (%)— Source— PCA
0.0
5.0
10.0
15.0
20.0
25.0
30.0
35.0
40.0
45.0
Jan-10 Jul-10 Jan-11 Jul-11 Jan-12 Jul-12 Jan-13 Jul-13 Jan-14 Jul-14 Jan-15 Jul-15 Jan-16 Jul-16 Jan-17
Tota
l Vac
ancy
Rat
e (%
)
Premium Grade A-Grade B-Grade C-Grade D-Grade
Source: PCA/Preston Rowe Paterson
-40,000
-35,000
-30,000
-25,000
-20,000
-15,000
-10,000
-5,000
0
5,000
10,000
15,000
20,000
25,000
30,000
35,000
40,000
Jan-10 Jul-10 Jan-11 Jul-11 Jan-12 Jul-12 Jan-13 Jul-13 Jan-14 Jul-14 Jan-15 Jul-15 Jan-16 Jul-16 Jan-17
Aud
ited
Net
Abs
orpt
ion
12 m
onth
s to
... (S
quar
e M
etre
s)
Net Absorption
Source: PCA/Preston Rowe Paterson
Chart 6– North Sydney Net Absorption, 12 months to…— Source— PCA
CROWS NEST/ ST LEONARDS
SALES
84 Alexander Street, Crows Nest, NSW 2065
REGNO has paid $8 million for 12 office strata units in one line. The buyer also
owns an adjoining site that has DA approval for 16 apartments with retail space
so the buyer has the ability to apply for development across the two sites total-
ling 1,000 m2. The sale reflects a rate of $666,667 per strata unit. Crows Nest
is located around 6 km north of the Sydney CBD.
39-47 Albany Street, Crows Nest, NSW 2065
A fully-leased, 3-storey office building has been sold by Pindan Capital for $22
million at a 4% yield. The 3,286 m2 building has three street frontages and 40
Car spaces. The site is zoned mixed-use so it has development upside post
2021 when the leases for the three tenants cease. The sale reflects a rate of
$6,695 psm. Crows Nest is located about 6 km north of Sydney’s CBD.
LEASES
Level 2, 170 Pacific Highway, St Leonards, NSW 2065
A private landlord has leased a B-grade, 1,006 m2 whole-floor office to SFI
Australia for 7-years. SFI will occupy the property for a net annual rent of
around $420 psm. The lobby, car park and lifts in the property have recently
been refurbished. St Leonards is located around 6.6 km north of the Sydney
CBD.

8
Phone: +61 2 9292 7400
Fax: +61 2 9292 7404
Address: Level 14, 347 Kent Street Sydney NSW 2000
Email: [email protected]
Follow us: Visit www.prpsydney.com.au
© Copyright Preston Rowe Paterson NSW Pty Limited
8
DEVELOPMENTS
CROWS NEST/ ST LEONARDS
Project Address Development Type Owner NLA Expected Completion Date
472-494 Pacific Highway New Development
(Construction Stage) Mirvac Group 4,600 Q4 2019
18-20 Atchison Street New Development
(DA Applied) Electroboard 2,300 Mooted
219-247 Pacific Highway (Gore Hill Technology Park – Building D1)
New Development (DA Approved)
Lindsay Bennelong Development 16,000 Mooted
219-247 Pacific Highway (Gore Hill Technology Park – Building D2)
New Development (DA Approved)
Lindsay Bennelong Development 15,000 Mooted
219-247 Pacific Highway Gore Hill Technology Park – Building D3)
New Development (DA Approved)
Lindsay Bennelong Development 15,000 Mooted
28 Chandos Street Partial
Refurbishment Myrna Pty Ltd 400 Q4 2016
1-3 Atchison Street Partial
Refurbishment Mews Investments Bondi Pty Ltd 1,825 Q1 2017
OFFICE STOCK The Crow’s Nest/ St Leonard’s office market remain dominated by C-
Grade towers, which currently take up 44.4% of total office stock. Preston
Rowe Paterson notes, however, that C Grade stock have slowly
diminished over time, with a withdrawal around 13,000 square metres of C
-Grade space over the six months to January 2017. A-Grade buildings
currently take up 32.5% of total office space, with total A-Grade space
having remained unchanged since January 2013 at 102,699 square
metres. B Grade stock in this area have declined by 4,833 square metres
over the six months to January, declining to 63,377 square metres. They
currently take up 20.1% of total space in Crow’s Nest/St Leonards. D
Grade stock remain unchanged at 12,569 square metres, and take up
4.0% of total office stock as of January 2017. Total stock declined by
18,089 square metres down to 315,542 square metres.
Chart 7– Crows Nest/ St Leonards Office Stock Vacancy by Grade— Source— PCA
0
50,000
100,000
150,000
200,000
250,000
300,000
350,000
400,000
Jan-10 Jul-10 Jan-11 Jul-11 Jan-12 Jul-12 Jan-13 Jul-13 Jan-14 Jul-14 Jan-15 Jul-15 Jan-16 Jul-16 Jan-17
Off
ice
Sto
ck L
evel
s (
Sq
uar
e M
etre
s)
A-Grade B-Grade C-Grade D-Grade
Source: PCA/Preston Rowe Paterson
VACANCY RATES Total office vacancy in Crow’s Nest/St Leonards office market increased
by 2.2% over the half year to January, from July 2016’s rate of 8.3% to
January’s 10.5% vacancy rate. This change was attributed to by an
increase in direct vacancy rate to 9.5%, whilst sub-lease vacancy
remained unchanged at 1.0%. Total vacancy increased in A-Grade and B-
Grade offices, and declined in C-Grade and D-Grade offices. A Grade
vacancy increased by 3.0% to 7.0%, whilst B Grade vacancy increased by
11.5% to 17.8%. In contrast, C-Grade vacancy declined by 2.8% to 9.6%,
whilst D Grade vacancy declined by 2.5% to 12.1%. The decline in C-
Grade and D-Grade vacancy is mainly attributed to the withdrawal of
space over the past six months and from the demolition of properties for
the Sydney Metro rail system.
Chart 8– Crows Nest/ St Leonards Total Vacancy Rate — Source— PCA
0.0
5.0
10.0
15.0
20.0
25.0
Jan-
10
Apr
-10
Jul-1
0
Oct
-10
Jan-
11
Apr
-11
Jul-1
1
Oct
-11
Jan-
12
Apr
-12
Jul-1
2
Oct
-12
Jan-
13
Apr
-13
Jul-1
3
Oct
-13
Jan-
14
Apr
-14
Jul-1
4
Oct
-14
Jan-
15
Apr
-15
Jul-1
5
Oct
-15
Jan-
16
Apr
-16
Jul-1
6
Oct
-16
Jan-
17
Tota
l Vac
ancy
Rat
e (%
)
A-Grade B-Grade C-Grade D-Grade
Source: PCA/Preston Rowe Paterson
Table 3– Developments in Crows Nest/ St Leonards over the first half of 2017— Source— PCA
9
Phone: +61 2 9292 7400
Fax: +61 2 9292 7404
Address: Level 14, 347 Kent Street Sydney NSW 2000
Email: [email protected]
Follow us: Visit www.prpsydney.com.au
© Copyright Preston Rowe Paterson NSW Pty Limited
9
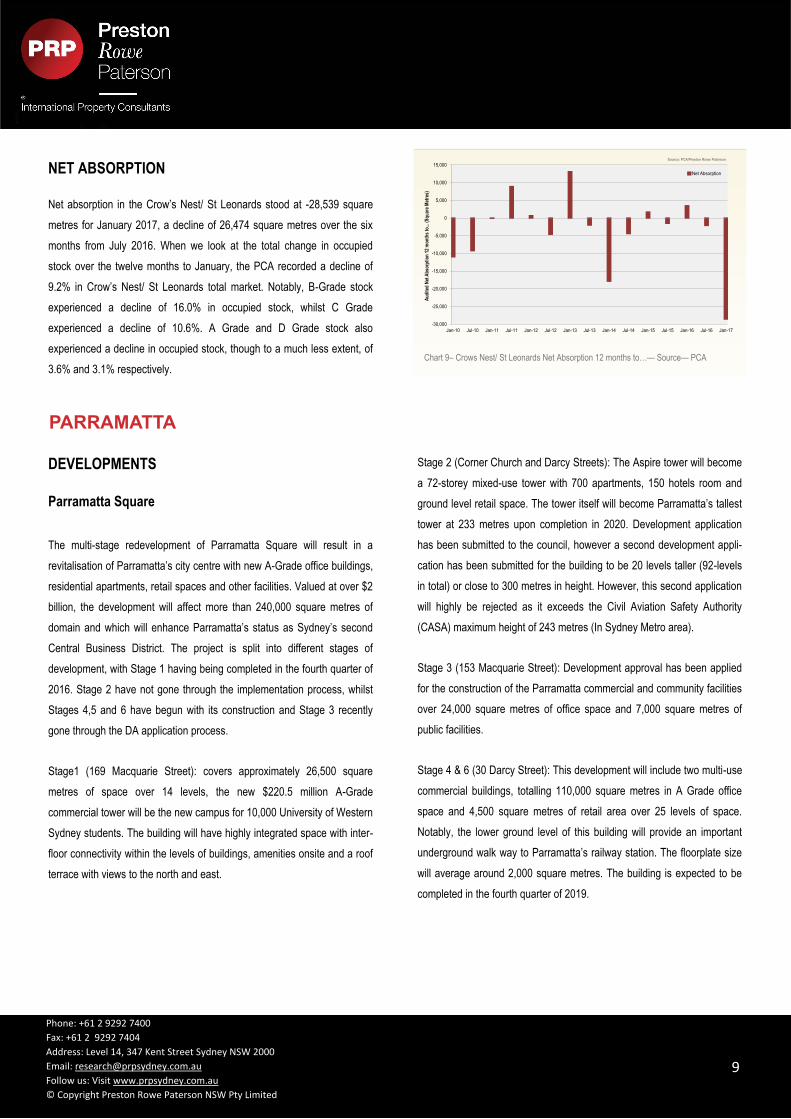
NET ABSORPTION
Net absorption in the Crow’s Nest/ St Leonards stood at -28,539 square
metres for January 2017, a decline of 26,474 square metres over the six
months from July 2016. When we look at the total change in occupied
stock over the twelve months to January, the PCA recorded a decline of
9.2% in Crow’s Nest/ St Leonards total market. Notably, B-Grade stock
experienced a decline of 16.0% in occupied stock, whilst C Grade
experienced a decline of 10.6%. A Grade and D Grade stock also
experienced a decline in occupied stock, though to a much less extent, of
3.6% and 3.1% respectively.
Chart 9– Crows Nest/ St Leonards Net Absorption 12 months to…— Source— PCA
-30,000
-25,000
-20,000
-15,000
-10,000
-5,000
0
5,000
10,000
15,000
Jan-10 Jul-10 Jan-11 Jul-11 Jan-12 Jul-12 Jan-13 Jul-13 Jan-14 Jul-14 Jan-15 Jul-15 Jan-16 Jul-16 Jan-17
Au
dit
ed N
et A
bso
rpti
on
12
mo
nth
s to
... (S
qu
are
Met
res)
Net Absorption
Source: PCA/Preston Rowe Paterson
PARRAMATTA
DEVELOPMENTS
Parramatta Square
The multi-stage redevelopment of Parramatta Square will result in a
revitalisation of Parramatta’s city centre with new A-Grade office buildings,
residential apartments, retail spaces and other facilities. Valued at over $2
billion, the development will affect more than 240,000 square metres of
domain and which will enhance Parramatta’s status as Sydney’s second
Central Business District. The project is split into different stages of
development, with Stage 1 having being completed in the fourth quarter of
2016. Stage 2 have not gone through the implementation process, whilst
Stages 4,5 and 6 have begun with its construction and Stage 3 recently
gone through the DA application process.
Stage1 (169 Macquarie Street): covers approximately 26,500 square
metres of space over 14 levels, the new $220.5 million A-Grade
commercial tower will be the new campus for 10,000 University of Western
Sydney students. The building will have highly integrated space with inter-
floor connectivity within the levels of buildings, amenities onsite and a roof
terrace with views to the north and east.
Stage 2 (Corner Church and Darcy Streets): The Aspire tower will become
a 72-storey mixed-use tower with 700 apartments, 150 hotels room and
ground level retail space. The tower itself will become Parramatta’s tallest
tower at 233 metres upon completion in 2020. Development application
has been submitted to the council, however a second development appli-
cation has been submitted for the building to be 20 levels taller (92-levels
in total) or close to 300 metres in height. However, this second application
will highly be rejected as it exceeds the Civil Aviation Safety Authority
(CASA) maximum height of 243 metres (In Sydney Metro area).
Stage 3 (153 Macquarie Street): Development approval has been applied
for the construction of the Parramatta commercial and community facilities
over 24,000 square metres of office space and 7,000 square metres of
public facilities.
Stage 4 & 6 (30 Darcy Street): This development will include two multi-use
commercial buildings, totalling 110,000 square metres in A Grade office
space and 4,500 square metres of retail area over 25 levels of space.
Notably, the lower ground level of this building will provide an important
underground walk way to Parramatta’s railway station. The floorplate size
will average around 2,000 square metres. The building is expected to be
completed in the fourth quarter of 2019.

10
Phone: +61 2 9292 7400
Fax: +61 2 9292 7404
Address: Level 14, 347 Kent Street Sydney NSW 2000
Email: [email protected]
Follow us: Visit www.prpsydney.com.au
© Copyright Preston Rowe Paterson NSW Pty Limited
10
OFFICE STOCK Parramatta City is experiencing extensive changes in their urban landscape, with
more than $12 billion worth of investment in its pipeline, including the upgrade of the
Civic Square which alone costs around $2 billion. In pursuit of being Sydney’s other
major capital city, Parramatta currently boasts major upgrades to its town centre,
Pirtek sporting stadium, Riverbank Precinct, the completion of a new University of
Western Sydney campus, the proposed fast train from the new airport at Badgerys
Creek to Sydney CBD and a light rail network that will connect the two Sydney
CBD’s together. All these factors will work together to boost Parramatta’s appeal as
a commercial centre as Preston Rowe Paterson notes through the development of
office stock, notably that of middle quality assets, over the last ten years. Total
office stock over the last ten years had grown by 18%, to the current figure of
707,099 square metres for January 2017. We note that B Grade and D Grade office
stock both increased by more than 70% over the last ten years. There’s currently
219.303 square metres of B Grade office stock, whilst D Grade stock stand at
87,806 square metres. Over the ten year period, A Grade assets declined by 5%,
down to the current 299,617 square metres and C Grade assets declined by 4% to
100,373 square metres.
VACANCY RATES According to the PCA, Parramatta’s office market has the third lowest vacancy rate
in Australia. Over the half year to January 2017, total vacancy rate declined by
0.2% to 4.3%, with East Melbourne and Southbank in Victoria experiencing lower
vacancy rates. This change is attributed to a decline of 0.3% in direct vacancy,
whilst sub-lease vacancy increased by 0.1%. Over six months, B Grade and D
Grade office vacancy declined by 0.6% and 0.8%, respectively. Their respective
vacancy rate stand at 6.2% and 4.3%. A Grade offices remain fully occupied,
though over the year had declined by 1.7%. C Grade offices increased by 2.2%
over six months to January 2017. According to the Property Council’s NSW
Executive Director, Jane Fitzgerald, Parramatta’s low vacancy rate means that it
will become harder to obtain office space, especially if there is no A Grade space
available. Even though 30 per cent of Australia’s top 500 companies have offices in
Parramatta, if you are a big company looking for A Grade space, you will have to
look outside Parramatta.
NET ABSORPTION Net absorption in Parramatta’s office market stands at 32,128 square metres for
January 2017, an increase of 18,831 square metres over six months. When we look
at the change in stock, we note that Parramatta experienced a change of 5.0% over
the twelve months to January. A Grade stock experienced a change of 11.4%
Chart 10– Parramatta Office Stock Vacancy by Grade— Source— PCA
Project Address Development
Type Owner NLA
Expected Completion Date
159-175 Church Street New Development
(DA Approved) Scentre Group 35,000 Mooted
169 Macquarie Street New Development
(Complete) Charter Hall Group 26,000 Q4 2016
105 Phillip Street New Development
(Construction) DEXUS Property Group 25,000 Q2 2018
30 Darcy Street New Development
(Construction) Parramatta City Council 110,000 Q4 2019
153 Macquarie Street New Development
(DA Applied) Parramatta City Council / Walker Corporation 42,000 Mooted
0
100,000
200,000
300,000
400,000
500,000
600,000
700,000
800,000
Jan-10 Jul-10 Jan-11 Jul-11 Jan-12 Jul-12 Jan-13 Jul-13 Jan-14 Jul-14 Jan-15 Jul-15 Jan-16 Jul-16 Jan-17
Off
ice
Sto
ck L
evel
s (
Sq
uar
e M
etre
s)
A-Grade B-Grade C-Grade D-Grade
Source: PCA/Preston Rowe Paterson
Chart 11– Parramatta Total Vacancy Rate (%)— Source— PCA
0.0
2.0
4.0
6.0
8.0
10.0
12.0
14.0
16.0
18.0
20.0
Jan-
10
Apr
-10
Jul-1
0
Oct
-10
Jan-
11
Apr
-11
Jul-1
1
Oct
-11
Jan-
12
Apr
-12
Jul-1
2
Oct
-12
Jan-
13
Apr
-13
Jul-1
3
Oct
-13
Jan-
14
Apr
-14
Jul-1
4
Oct
-14
Jan-
15
Apr
-15
Jul-1
5
Oct
-15
Jan-
16
Apr
-16
Jul-1
6
Oct
-16
Jan-
17
Tota
l Vac
ancy
Rat
e (%
)
A-Grade B-Grade C-Grade D-Grade
Source: PCA/Preston Rowe Paterson
Table 4– Developments in Parramatta over the first half of 2017— Source— PCA

11
Phone: +61 2 9292 7400
Fax: +61 2 9292 7404
Address: Level 14, 347 Kent Street Sydney NSW 2000
Email: [email protected]
Follow us: Visit www.prpsydney.com.au
© Copyright Preston Rowe Paterson NSW Pty Limited
11
in total occupied stock over the twelve months, whilst B Grade stock experienced a
2.6% in total occupied stock. In contrast, C Grade and D Grade stock experienced
declines in their total occupied stock. C Grade experienced a decline of 0.7% in
occupied stock over twelve months, whilst D Grade stock experienced a decline of
3.6%.
Chart 12- Parramatta Net Absorption 12 months to…— Source— PCA
-10,000
-5,000
0
5,000
10,000
15,000
20,000
25,000
30,000
35,000
Jan-10 Jul-10 Jan-11 Jul-11 Jan-12 Jul-12 Jan-13 Jul-13 Jan-14 Jul-14 Jan-15 Jul-15 Jan-16 Jul-16 Jan-17
Au
dit
ed N
et A
bso
rpti
on
12
mo
nth
s to
... (
Sq
uar
e M
etre
s)
Source: PCA/Preston Rowe Paterson
CHATSWOOD
SALES
1-5 Railway Street, Chatswood, NSW 2067
Chatswood Central has sold to Lotus Group and iProsperity Group for around
$115 million. The two commercial offices that are linked by a retail podium are
96% leased and have a total lettable area of 18,247 m2. The properties have a
WALE of 3-years and the 3,806 m2 site has development upside. There is
also basement parking accessed from Railway Street. The sale reflects a rate
of $6,241 psm. Chatswood is located about 12.2 km north of the Sydney CBD.
LEASES
465 Victoria Avenue, Chatswood, NSW 2067
Carnival Australia will occupy 3,500 m2 of office space in levels three to six of
a 15-level A-grade commercial office. Hines Global REIT leased the property
to the new tenant for a net annual rent of around $460 to $500 psm.
Chatswood is located about 12.2 km north of Sydney’s CBD.
OFFICE STOCK
Chatswood benefits from being one of Sydney Metropolitan’s largest mixed-
used centres that entails a thorough mix of commercial, retail and residential
developments. However, Chatswood’s office market has not changed for
eighteen months with no withdrawals or additional supply. The lack of addition
to this niche office market is mainly influenced by the lack of development
sites as well as the largest focus being placed on residential development
in the area. No new developments have been approved or planned and this
means that the lack of supply with continue for at least another two years.
Chatswood’s office market current remain dominated by A Grade office stock,
which take up 56% of total stock with 157,412 square metres of space. B
Grade and C Grade stock take up a respective 27% and 16% of total stock,
with 76,046 square metres and 45,007 square metres respectively. D Grade
stock take up close to 0.2% of total stock, with 454 square metres.
VACANCY RATES
The North Shore office market, which consists of offices in North Sydney,
Crows Nest/ St Leonards and Chatswood, experienced an overall increase in
their vacancy rate over the six months to January 2017, from 7.3% to 8.0%.
This change was mainly attributed to the increase in supply combined with
increased demand in most of the areas in the North Shore. For office buildings
in Chatswood, total vacancy increased by 1.2% to 7.7% over the six months to
January 2017. The increase was mainly attributed to by a rise in direct
vacancy, which increased by 2.0% to 7.2%. This was offset by a decline in sub
-lease vacancy, which decreased by 0.8% down to 0.5%. A Grade, C Grade
and D Grade vacancy increased over the half year, to 8.0 %(+1.9%), 3.9%
(+1.4%) and 100% (+100%) respectively. In contrast, B Grade offices
experienced a decline in vacancy, of 0.9% down to 8.9%.
0
50,000
100,000
150,000
200,000
250,000
300,000
350,000
Jan-10 Jul-10 Jan-11 Jul-11 Jan-12 Jul-12 Jan-13 Jul-13 Jan-14 Jul-14 Jan-15 Jul-15 Jan-16 Jul-16 Jan-17
Off
ice
Sto
ck L
evel
s (S
quar
e M
etre
s)
A-Grade B-Grade C-Grade D-Grade
Source: PCA/Preston Rowe Paterson
0.0
10.0
20.0
30.0
40.0
50.0
60.0
70.0
80.0
90.0
100.0
Jan-10 Jul-10 Jan-11 Jul-11 Jan-12 Jul-12 Jan-13 Jul-13 Jan-14 Jul-14 Jan-15 Jul-15 Jan-16 Jul-16 Jan-17
Tota
l Vac
ancy
Rat
e (%
)
A-Grade B-Grade C-Grade D-Grade
Source: PCA/Preston Rowe Paterson
Chart 13– Chatswood Office Stock Levels by Grade— Source— PCA
Chart 14– Chatswood Total Vacancy Rate (%)— Source— PCA
12
Phone: +61 2 9292 7400
Fax: +61 2 9292 7404
Address: Level 14, 347 Kent Street Sydney NSW 2000
Email: [email protected]
Follow us: Visit www.prpsydney.com.au
© Copyright Preston Rowe Paterson NSW Pty Limited
12
NORTH RYDE/ MACQUARIE PARK
DEVELOPMENT
Project Address Development Type Owner NLA Expected Completion
Date
66-82 Talavera Road New Development
(Complete) Holdmark 5,000 Q3 2016
8 Khartoum Road (DEV) New Development
(Construction stage ) Goodman 10,000 Q2 2017
396 Lane Cove Road New Development
(Early Feasibility stage) Frasers Property / Winten Property Group 74,000 Mooted
31-35 Epping Road New Development
(DA Applied) Harvey Norman Group 14,477 Mooted
Lot 8 Julius Avenue (Incl Lot 9) New Development
(DA Approved) ISPT Pty Ltd 34,194 Mooted
97-99 Waterloo Road Full Refurbishment Goodman 8,146 Q3 2017
OFFICE STOCK
The North Ryde/ Macquarie Park office market boasts as Australia’s
largest non-CBD office market and as an economic hub of global
businesses that specialise in commercial and technology intensive
activities. The 200 hectare employment area was formed in the late 1960s
in order to support the intertwining of technology businesses with the then
newly built Macquarie University. The planned Sydney Metro and
significant employment growth over the years will benefit the city
substantial, though investment needs to be encouraged to support this
growth. Today, total office space in the North Ryde/ Macquarie Park zone
stands at 878,950 square metres, an increase of over 60% when
compared to ten years prior. A Grade office stock take up 73% of total
Table 5– Developments in North Ryde/ Macquarie Park over the first half of 2017— Source— PCA
office stock in North Ryde/ Macquarie Park with a total of 640,620 square
metres. This figure represents increase of 5,000 square metres over the six
months to January 2017. B Grade stock take up 25% of total stock with
220,224 square metres, though this figure represents a decline of 9,417
square metres. C Grade and D Grade stock remain unchanged at 1.8% and
0.3% of total stock respectively, at 15,385 square metres and 2,721 square
metres. Over the six months, total supply stand at 5,000 square metres, and
withdrawals amounting to 9,417 square metres.
Vacancy Rates
Vacancy rate across the North Ryde/ Macquarie Park office market in-
creased by 0.4% to 7.5% over the six months to January 2017. Direct va-
cancy declined by 0.5%, to 6.7%, whilst sub-lease vacancy increased
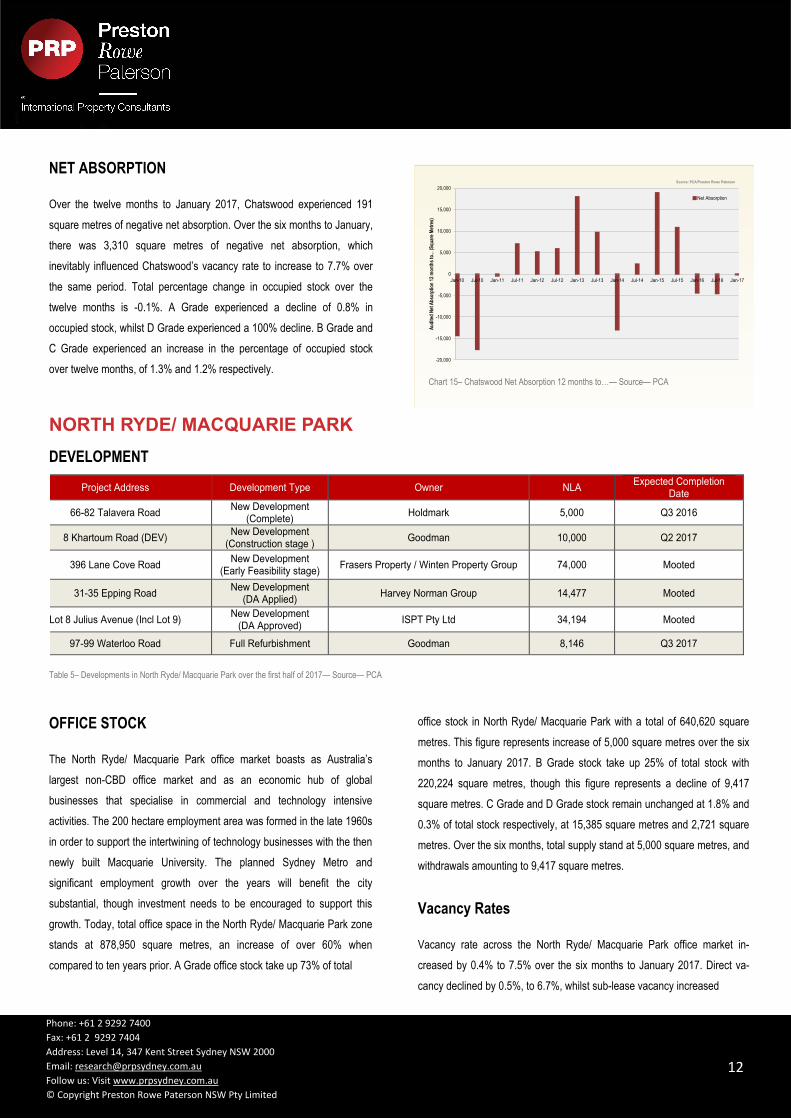
NET ABSORPTION
Over the twelve months to January 2017, Chatswood experienced 191
square metres of negative net absorption. Over the six months to January,
there was 3,310 square metres of negative net absorption, which
inevitably influenced Chatswood’s vacancy rate to increase to 7.7% over
the same period. Total percentage change in occupied stock over the
twelve months is -0.1%. A Grade experienced a decline of 0.8% in
occupied stock, whilst D Grade experienced a 100% decline. B Grade and
C Grade experienced an increase in the percentage of occupied stock
over twelve months, of 1.3% and 1.2% respectively.
-20,000
-15,000
-10,000
-5,000
0
5,000
10,000
15,000
20,000
Jan-10 Jul-10 Jan-11 Jul-11 Jan-12 Jul-12 Jan-13 Jul-13 Jan-14 Jul-14 Jan-15 Jul-15 Jan-16 Jul-16 Jan-17
Au
dit
ed N
et A
bso
rpti
on
12
mo
nth
s to
... (
Sq
uar
e M
etre
s)
Net Absorption
Source: PCA/Preston Rowe Paterson
Chart 15– Chatswood Net Absorption 12 months to…— Source— PCA

13
Phone: +61 2 9292 7400
Fax: +61 2 9292 7404
Address: Level 14, 347 Kent Street Sydney NSW 2000
Email: [email protected]
Follow us: Visit www.prpsydney.com.au
© Copyright Preston Rowe Paterson NSW Pty Limited
13
-10,000
0
10,000
20,000
30,000
40,000
50,000
Jan-10 Jul-10 Jan-11 Jul-11 Jan-12 Jul-12 Jan-13 Jul-13 Jan-14 Jul-14 Jan-15 Jul-15 Jan-16 Jul-16 Jan-17
Au
dit
ed N
et A
bso
rpti
on
12
mo
nth
s to
... (
Sq
uar
e M
etre
s)
Net Absorption
Source: PCA/Preston Rowe Paterson
0.0
5.0
10.0
15.0
20.0
25.0
30.0
35.0
40.0
45.0
Jan-10 Jul-10 Jan-11 Jul-11 Jan-12 Jul-12 Jan-13 Jul-13 Jan-14 Jul-14 Jan-15 Jul-15 Jan-16 Jul-16 Jan-17
Tota
l Vac
ancy
Rat
e (%
)
A-Grade B-Grade C-Grade
Source: PCA/Preston Rowe Paterson
Chart 17– North Ryde/ Macquarie Park Net Absorption 12 months to…— Source— PCA
Chart 18– North Ryde/Macquarie Park Total Vacancy Rate (%)— Source— PCA
by 0.3% to 0.9%. According to data from the PCA, vacancy rate in this
area increased due to declining demand across all grades of offices. The
NSW Executive Director, Jane Fitzgerald, states that the North Ryde/
Macquarie Park office market softened, with negative demand across all
graded spaces over the six months to January. A Grade and C Grade
offices experienced a respective increase of 0.9% and 0.3% in vacancy
rate, to 5.1% and 10.7%, respectively. In contrast, B Grade offices experi-
enced a decline in vacancy rate, of 0.7% down to 14.2%.
NET ABSORPTION
Net absorption of office spaces in North Ryde/Macquarie Park over the
twelve months to January 2017 stand at a negative 3,268 square metres.
The total change in occupied stock over twelve months stand at -0.4%. B
Grade and C Grade stock experienced a decline of -1.5% and -7.3% in
0
100,000
200,000
300,000
400,000
500,000
600,000
700,000
800,000
900,000
1,000,000
Jan-10 Jul-10 Jan-11 Jul-11 Jan-12 Jul-12 Jan-13 Jul-13 Jan-14 Jul-14 Jan-15 Jul-15 Jan-16 Jul-16 Jan-17
Off
ice
Sto
ck L
evel
s (
Sq
uar
e M
etre
s)
A-Grade B-Grade C-Grade D-Grade
Source: PCA/Preston Rowe Paterson
Chart 16– North Ryde/ Macquarie Park Office Stock Vacancy by Grade— Source— PCA
occupied stock over twelve months, whilst A Grade stock experienced a
change of 0.1% over the same period.

14
Phone: +61 2 9292 7400
Fax: +61 2 9292 7404
Address: Level 14, 347 Kent Street Sydney NSW 2000
Email: [email protected]
Follow us: Visit www.prpsydney.com.au
© Copyright Preston Rowe Paterson NSW Pty Limited
14
Consumer Price Index
The June quarter Consumer Price Index (CPI) figures will not be available until 27th
July, hence March quarter figures will be used for the following analysis. CPI increased
by 0.5% over the March quarter, following an increase of 0.5% in the December quarter
2016. The main contributor to this increase was the Housing group (+0.8% over the
quarter), the Transport group (+1.5% over the quarter), the Health group (+2.0%),
Education group (+3.1%) and the Alcohol and tobacco Group (+1.1%). In contrast, the
main inhibitors to further increases in CPI were the Furnishing, household equipment &
services group (-1.0%), Recreation & culture group (-0.7%), Clothing and footwear
group (-1.4%), Communications group (-0.3%) and Food & alcoholic beverage group (-
0.2%).
Over the year to March 2017, All Groups CPI increased across all eight capital cities in
Australia, with Melbourne and Sydney recording the biggest yearly increase, of +2.5%
and +2.4% respectively. In contrast, Darwin recorded the lowest increase, with an
annual change of 0.5%. Over the March quarter, CPI increased in all capital cities,
except for Darwin.
Economic Fundamentals
Business Sentiment
Both business conditions and business confidence declined over the month of May.
Figures released by National Australia Bank indicate that business conditions dropped
by 1 point, to +12 index points, whilst business confidence index fell by 6 points to +7
index points. In stating this, both indices remain slightly above their long-run average
index (+5 for business conditions, +6 for business confidence), with leading indicators
for both business condition and business confidence remaining relatively strong. NAB’s
chief economist, Alan Oster, noted that a disconnect is present when we look at
evidence of solid business activity in conjunction with data that indicates a slowdown in
consumer spending. With weak household data and wage growth remaining at record
low, and a strong business sector, Mr Oster have noted how this ‘disparity resolves itself
will be critical to the outlook for growth’.
According to the Westpac Melbourne Institute Index of Consumer Sentiment, consumers
over the month of June are feeling the most pessimistic since the Reserve Bank’s 2016
rate cuts. The index fell 1.8% from 98.0 in May to 96.2 in June, with a reading below 100
indicating that the number of pessimists outweigh optimists in their outlook of the
economy. The main contributor to the results stems from the March quarter GDP figures,
which produced relatively weak results. Annual growth had declined to 1.7%, the slowest
increase since the GFC prompting consumers’ pessimistic responses during the June
survey.
Job security remains a topic on most consumers’ mind, with the Westpac Melbourne
Institute Unemployment Expectations Index increasing from 135.5 to 140.3, with a lower
number indicating that fewer consumers expect unemployment to rise over the next
twelve months. In saying this, job figures have come out positive, with unemployment
expectations showing a positive improvement, as average index figures for 2015 and
2016 were both at 144 points.
Consumer Sentiment
-0.20
0.00
0.20
0.40
0.60
0.80
1.00
1.20
107.0
107.5
108.0
108.5
109.0
109.5
110.0
110.5
111.0
111.5
112.0
Australia Sydney Melbourne Brisbane Adelaide Perth Hobart Darwin Canberra
% C
hang
e Fr
om P
revi
ous
Qua
rter
Con
sum
er P
rice
Inde
x (A
ll G
roup
s)
CPI (All Groups) Percentage Change From Previous QuarterSource: ABS/Preston Rowe Paterson Research
Chart 1—All Group CPI (Capital Cities) and Percentage Change from December 2016 to March 2017—Source—
ABS
Net Balance
March 2017 April 2017 May 2017
Business confidence 7 13 7
Business conditions 14 13 12
Table 1— Monthly Net Balance of Business confidence index and Business conditions index — Source— National
Chart 2—Consumer Sentiment Index, February 2016 to February 2017—Source—Westpac Melbourne Institute Survey
90
92
94
96
98
100
102
104
Jun-16 Jul-16 Aug-16 Sep-16 Oct-16 Nov-16 Dec-16 Jan-17 Feb-17 Mar-17 Apr-17 May-17 Jun-17
Con
sum
er S
entim
ent
Consumer Sentiment Index
Source: Westpac Melbourne Institute /Preston Rowe Paterson Research
June 2016 May 2017 June 2017
Consumer Sentiment Index 102.2 98 111.3
Family finance vs. a year ago 90.3 82.6 81.4
Economic conditions next 12 months 97.9 95.9 91.3
Time to buy a dwelling 103.7 90.0 90.9
Table 2— Consumer Sentiment– June 2017 — Source— National Australia Bank

15
Phone: +61 2 9292 7400
Fax: +61 2 9292 7404
Address: Level 14, 347 Kent Street Sydney NSW 2000
Email: [email protected]
Follow us: Visit www.prpsydney.com.au
© Copyright Preston Rowe Paterson NSW Pty Limited
15
Over the first quarter of 2017, Australia’s gross domestic product (GDP) increased by
a seasonally adjusted 0.3%- a relatively weak figure when compared to December
2016 quarterly increase of 1.1%. Over the twelve months to March 2017, Australia’s
economy grew by 1.7%, relatively weaker than the 2.4% yearly increase in the fourth
quarter 2016. Many economists had anticipated weaker growth over March quarter,
after current account figures had indicated a dramatic slowdown in exports over the
three months. However, the quarter’s growth now means that Australia has
experienced 103 quarters without a technical recession (defined as two consecutive
quarters of negative growths).
We note that export of goods and services declined by a seasonally adjusted 1.6%
over the quarter. The main influence was a decline in the export of mineral ores and
coal, which contributed to a 2.6% decline in the export of goods. The export of
services partially offset this decline by increasing by 2.5% over the quarter, though
was not enough to stimulate an overall positive growth after the previous six quarters
of growth. Moreover, terms of trade increased by 6.6% over the quarter, a decline
from the 9.6% increase from last quarter.
Dwelling investments declined by 4.4% over the March quarter, though over the
twelve months, dwelling investment has declined by 2.5%. Victoria was the only state
to experience an increase in dwelling investment over the quarter, though at a
Gross Domestic Product
Over the month to May 2017, seasonally adjusted unemployment rate declined to 5.5%,
the lowest level since February 2013. There were 52,100 new persons in full time em-
ployment, though the number of persons starting part-time roles declined by 10,100-
bringing the net total number of employed persons to 42,000 over the month. Over the
same period, the participation rate declined to 64.9% (-0.1%), underemployment rate
declined to 8.8% (-0.1%) and the underutilisation rate declined to 14.4% (-0.4%).
New South Wales experienced the largest month-on-month increase in employment with
32,600 persons. Victoria and Queensland experienced the next largest increases, with
6,900 persons and 5,500 persons respectively. When we look at the unemployment rate
around the country, South Australia and Western Australia experienced the largest
decline, both by -0.4%. Tasmania experienced an increase of 0.2%, whilst New South
Wales increased by 0.1%. Tasmania experienced an increase of 0.8% in their participa-
tion rate, whilst Western Australia experienced a decline of 0.1% in theirs.
Unemployment
-1.00%
-0.80%
-0.60%
-0.40%
-0.20%
0.00%
0.20%
0.40%
0.60%
0.80%
1.00%
1.20%
1.40%
-15.00%
-10.00%
-5.00%
0.00%
5.00%
10.00%
15.00%
20.00%
25.00%
Dec
-10
Mar
-11
Jun-
11
Sep
-11
Dec
-11
Mar
-12
Jun-
12
Sep
-12
Dec
-12
Mar
-13
Jun-
13
Sep
-13
Dec
-13
Mar
-14
Jun-
14
Sep
-14
Dec
-14
Mar
-15
Jun-
15
Sep
-15
Dec
-15
Mar
-16
Jun-
16
Sep
-16
Dec
-16
Qu
arte
rly
Ch
ang
e in
GD
P
Qu
arte
rly
Ch
ang
e in
Dw
ellin
g a
nd
No
n-D
wel
ling
Inve
stm
ents
Dwelling Investment Non-Dwelling Construction Gross Domestic Product
Source: RBA /Preston Rowe Paterson Research
Chart 3— Percentage Change in Dwelling, Non-Dwelling Investments and GDP— Source: ABS
Chart 4— Seasonally Adjusted GDP and Seasonally Adjusted Change in GDP— Source: ABS
-2.0
-1.5
-1.0
-0.5
0.0
0.5
1.0
1.5
2.0
250,000.0
300,000.0
350,000.0
400,000.0
450,000.0
Mar
-12
Jun-
12
Sep
-12
Dec
-12
Mar
-13
Jun-
13
Sep
-13
Dec
-13
Mar
-14
Jun-
14
Sep
-14
Dec
-14
Mar
-15
Jun-
15
Sep
-15
Dec
-15
Mar
-16
Jun-
16
Sep
-16
Dec
-16
Mar
-17
Per
cent
age
(%)
GD
P ($
Mill
ions
)
Gross Domestic Product Seasonally Adjusted % Change Seasonally Adjusted
Source: RBA /Preston Rowe Paterson Research
Chart 5— Unemployment Persons and Unemployment Rate, March 2011 to March 2017 — Source: ABS
2.00
2.50
3.00
3.50
4.00
4.50
5.00
5.50
6.00
6.50
7.00
500,000
550,000
600,000
650,000
700,000
750,000
800,000
May
-12
Nov
-12
May
-13
Nov
-13
May
-14
Nov
-14
May
-15
Nov
-15
May
-16
Nov
-16
May
-17
Un
emp
loym
ent
rate
(%
)
Un
emp
loye
d p
erso
ns
Unemployed Persons Unemployment Rate
Source: ABS/Preston Rowe Paterson Research
Table 3— Unemployment Rate and Participation Rate, February vs. March 2017 — Source: ABS
Unemployment Rate (%) Participation Rate (%)
April May April May
Australia 5.7 5.5 ▼ 64.9 64.9 ▬
New South Wales 4.7 4.8 ▲ 65.3 65.2 ▼
Victoria 6.1 6.0 ▼ 66.0 65.5 ▼
Queensland 6.3 6.1 ▼ 69.0 68.1 ▼
South Australia 7.3 6.9 ▼ 65.0 64.8 ▼
Western Australia 5.9 5.5 ▼ 68.8 67.5 ▼
Tasmania 5.9 6.1 ▲ 59.5 59.9 ▲
Northern Territory* 3.3 3.2 ▼ 74.3 65.6 ▼
Australian Capital Territory* 3.6 3.5 ▼ 67.8 66.1 ▼

16
Phone: +61 2 9292 7400
Fax: +61 2 9292 7404
Address: Level 14, 347 Kent Street Sydney NSW 2000
Email: [email protected]
Follow us: Visit www.prpsydney.com.au
© Copyright Preston Rowe Paterson NSW Pty Limited
16
10-year government bond yield in Australia declined by 0.14% to 2.41% over the
month to June 2017. Over three months, the 10-year bond yields declined by 0.40%,
though when compared to June 2016, yields had increased by 0.29%. Australia’s 90-
day bill rate declined by 0.01% over the month, to 1.72%. This figure signifies a
0.07% decline over the quarter and a 0.27% decline over the year. Historically,
Australian government yields are usually higher than that of the US government
yields. However, the differential between Australian and US 10-year government
bonds have narrowed to just 16 basis points at the end of June as global investors
price in more monetary tightening by the Federal Reserve. We note that Australian 10
-year bond yields, being influenced by the global increase in yields, had increased by
53 basis points since August last year, during which yields dropped to a historical low
of 1.88%. Preston Rowe Paterson notes that long term bond yields have been
declining gradually since the 1980’s, and we consider the sharp increase in late
December 2016 and the current elevated bond yields a normalisation of 10-year
government bonds after it dropped to a record low in August 2016.
10 Year Bond & 90 Day Bill Rate
The Board of the Reserve Bank left rates unchanged at 1.5% for the tenth consecutive
month at their June meeting. The main concerns brought up at the board meeting
included concerns surrounding Australia’s low wage growth and the imbalance between
the housing markets around various parts of Australia. Ultimately, the Reserve Bank
strives to achieve financial stability by pursuing an inflation target of two to three percent
over the medium term. As the nation transitions through the mining boom investment
phase, interest rates were cut to its lowest historical levels in order to support economic
growth within the country. Reserve Bank board members noted the importance of a
prudent regulatory body in promoting financial stability, and noted the need for a strong
relationship built between the Bank and banking regulators, especially Australia
Prudential Regulatory Authority (APRA).
Interest Rates
The Board’s decision to keep interest rates unchanged stemmed from upbeat messag-
es from world economic growth, in conjunction with the prospect of world-wide increase
of wages and prices as the labour markets in many countries begin to improve. It was
also noted that headline inflation in many countries have increased over the past twelve
months, though core inflation remain relatively low. In the domestic economy, improve-
ments in business conditions and business investments, in the parts of the economy
that was not directly affected by the slowdown in mining investments contributed to the
Board’s interest rate decisions. Slow wage growth continue to highlighted, with mem-
bers pointing out the low increase in income and high levels of household debts as
being the main inhibitors to household consumption.
Exchange Rate
Chart 8— Movement in Exchange Rate over the year to March 2016— Source: RBA
1.0
1.5
2.0
2.5
3.0
3.5
4.0
4.5
5.0
Mar-
12
Jun
-12
Se
p-1
2
De
c-12
Mar-
13
Jun
-13
Se
p-1
3
De
c-13
Mar-
14
Jun
-14
Se
p-1
4
De
c-14
Mar-
15
Jun
-15
Se
p-1
5
De
c-15
Mar-
16
Jun
-16
Se
p-1
6
De
c-16
Mar-
17
Jun
-17
Pe
rce
nta
ge
(%
)
RBA Cash Rate
Source: RBA /Preston Rowe Paterson Research
Chart 7— Reserve Bank of Australia Overnight Cash rate—Source: RBA
40
50
60
70
80
90
100
0.4000
0.5000
0.6000
0.7000
0.8000
0.9000
1.0000
Jun-16 Sep-16 Dec-16 Mar-17 Jun-17
1 $A
UD
bu
ys (
Yen
)
1 $A
UD
bu
ys (
US
, UK
, Eu
ro)
US $ UK Pound Euro Yen
Source: RBA /Preston Rowe Paterson Research
Chart 6— Monthly Movement of 90-day Bill, 10-year bond yields and Cash rate—Source: RBA
1.00
1.50
2.00
2.50
3.00
3.50
4.00
4.50
5.00
Jun-
12
Sep
-12
Dec
-12
Mar
-13
Jun-
13
Sep
-13
Dec
-13
Mar
-14
Jun-
14
Sep
-14
Dec
-14
Mar
-15
Jun-
15
Sep
-15
Dec
-15
Mar
-16
Jun-
16
Sep
-16
Dec
-16
Mar
-17
Jun-
17
Per
cen
tag
e (%
)
10 Yr Bond 90 Day Bill Cash Rate
Source: RBA /Preston Rowe Paterson Research

17
Phone: +61 2 9292 7400
Fax: +61 2 9292 7404
Address: Level 14, 347 Kent Street Sydney NSW 2000
Email: [email protected]
Follow us: Visit www.prpsydney.com.au
© Copyright Preston Rowe Paterson NSW Pty Limited
17
O r Resear At Preston Rowe Paterson, we pride ourselves on the research which we prepare in the market sectors with in which
we operate. These include Commercia l, Retail, Industrial, Hotel & Leisure and Residential proper ty markets as well as infrastructure, capita l and plant and machinery markets
We a e ered Investment
Development Asset Corporate Real Estate
Mortgage Government Insurance
Occupancy Sustainability Research Real Estate Investment Valuation
Real Estate Development Valuation Property Consultancy and Advisory Transaction Advisory
Property and Asset Management Listed Fund, Property Trust, Super Fund and Syndicate
Advisors Plant & Machinery Valuation
General and Insurance Valuation Economic and Property Market Research
We a e all ty es ered
We regularly provide valuation, proper ty and asset management, consultancy and leasing services for all types of Real Estate including:
CBD and Metropolitan commercia l office buildings Retail shopping centres and shops Industrial, office/warehouses and factories
Business parks Hotels (accommodation) and resor ts Hotels (pubs), motels and caravan parks
Residential development projects Residential dwellings (individual houses and apar tments/
units)
Rural properties Special purpose properties such as: nursing homes; private
hospita ls, service stations, oil terminals and refineries, theatre complexes; etc.
Infrastructure
We a e all ty es f ered
We regularly under take valuations of a ll forms of plant, machinery, furniture, fittings and equipment including:
Mining & earth moving equipment/road plant Office fit outs, equipment & furniture Agricultural machinery & equipment Heavy, light commercial & passenger vehicles
Industrial manufacturing equipment Wineries and processing plants Special purpose plant, machinery & equipment
Extractive industries, land fills and resource based enterprises
Hotel furniture, fittings & equipment
We a e all ered Preston Rowe Paterson acts for an array of clients with all types of real estate, plant, machinery and equipment interests such as:
Accountants Banks, finance companies and lending institutions Commercial and Residentia l non bank lenders
Co-operatives Developers Finance and mor tgage brokers
Hotel owners and operators Institutional investors Insurance brokers and companies
Investment advisors Lessors and lessees Listed and private companies corporations Listed Property Trusts
Local, State and Federal Government Depar tments and Agencies
Mining companies
Mortgage trusts Overseas clients Private investors
Property Syndication Managers Rural landholders Self managed super funds Solicitors and barristers
Sovereign wealth funds Stock brokers Trustee and Custodial companies

18
Phone: +61 2 9292 7400
Fax: +61 2 9292 7404
Address: Level 14, 347 Kent Street Sydney NSW 2000
Email: [email protected]
Follow us: Visit www.prpsydney.com.au
© Copyright Preston Rowe Paterson NSW Pty Limited
18
We a e all ered
From our capita l city and regional office locations we serve our client’s needs throughout Australia. Globally, we operate directly
or via our relationship offices for special purpose real estate asset classes, infrastructure and plant & machinery.
We a e ered Our clients seek our property (real estate, infrastructure, p lant
and machinery) services for a multitude of reasons including: Acquisitions & Disposals Alternative use & highest and best use analysis Asset Management
Asset Valuations for financial reporting to meet ASIC, AASB, IFRS & IVSC guidelines
Compulsory acquisition and resumption
Corporate merger & acquisition real estate due diligence Due Diligence management for acquisitions and sales Facilities management
Feasibility studies Funds management advice & portfo lio analysis Income and outgoings projections and analysis Insurance valuations (replacement & reinstatement costs)
Leasing vacant space with in managed properties Listed proper ty trust & investment fund valuations & revalua-
tions
Litigation support Marketing & development strategies Mortgage valuations
Property Management Property syndicate valuations and re-valuations Rating and taxing objections Receivership, Insolvency and liquidation valuations and sup-
port/advice Relocation advice, strategies and consultancy Rental assessments and determinations
Sensitivity analysis Strategic proper ty planning

19
Phone: +61 2 9292 7400
Fax: +61 2 9292 7404
Address: Level 14, 347 Kent Street Sydney NSW 2000
Email: [email protected]
Follow us: Visit www.prpsydney.com.au
© Copyright Preston Rowe Paterson NSW Pty Limited
19
Head Office (Sydney)
Level 14, 347 Kent Street
Sydney NSW 2000
PO BOX 4120, Sydney NSW 2001
P: 02 9292 7400
F: 02 9292 7404
National Directors
Gregory Preston
M: 0408 622 400
Gregory Rowe M: 0411 191 179
Neal Ellis
M: 0417 053 116
Damian Kininmonth
M: 0417 059 836
Greg Sugars M: 0435 911 465
E: greg.su [email protected]
www.prp.com.au
Capital City Offices
Adelaide
Rob Simmons M: 0418 857 555
Brisbane
Troy Chaplin M: 0419 029 045
Hobart
Damien Taplin
M: 0418 513 003
Shelley Taplin
M: 0413 309 895 E: [email protected]
Melbourne
Neal Ellis
M: 0417 053 116 E: [email protected]
Damian Kininmonth
M: 0417 059 836
Perth Cameron Sharp
M: 0438 069 103
Sydney
Gregory Preston M: 0408 622 400
Gregory Rowe
M: 0411 191 179
Affiliat e offices in Canberra, Darw in and ot her regional
areas.
Regional Offices
Albury Wodonga
Michael Redfern
M: 0428 235 588 E: [email protected]
Ballarat
Darren Evans
M: 0417 380 324
E: [email protected] Peter Murphy
M: 0402 058 775
Bendigo
Damien Jerinic M: 0409 820 623
Central Coast/Gosford
Colin Pugsley
M: 0435 376 630 E: [email protected]
Dubbo
James Skuthorp
M: 0409 466 779
Tom Needham
M: 0412 740 093 E: [email protected]
Geelong
Gareth Kent
M: 0413 407 820
Stuart Mcdonald
M: 0405 266 783 E: [email protected]
Gippsland
Tim Barlow
M: 0400 724 444 E: [email protected]
Alexandra Ellis
M: 0407 724 444
Griffith
Dan Hogg
M: 0408 585 119 E: [email protected]
Horsham Ben Sawyer
M: 0429 826 541
Launceston
Damien Taplin
M: 0418 513 003
Mornington
Neal Ellis M: 0417 053 116
Damian Kininmonth
M: 0417 059 836
Mount Gambier
Stuart McDonald M: 0405 2660783
Newcastle
Robert Dupont
M: 0418 681 874 E: [email protected]
David Rich
M: 0413 052 166
Southport Ian Hawley
M: 0458 700 272
Troy Chaplin
M: 0419 029 045 E: [email protected]
Swan Hill
Ian Boyd-Law
M: 0418 5980232 E: [email protected]
Tamworth
Bruce Sharrock
M: 0429 465 012 E: [email protected]
Matt Spencer
M: 0447 227 002
Wagga Wagga Dan Hogg
M: 0408 585 119
Warrnambool
Stuart McDonald M: 0405 266 783 E: [email protected]
New Zealand Offices
Head Office (Auckland)
Greg Sugars M: +64 (0)27 777 9010
E: greg.su [email protected] z
Mitchell Stubbs
M: +64 (0)27 774 34100 E: [email protected]
Dunedin
James Stowell
M: +64 (0)17 807 3866
Greymouth Mark Bollard
M: +64 (0)27 694 7041
E: [email protected] z
Tauranga Alex Haden
M: +64 (0)21 833 118
www.prpnz.nz
Asian Offices Associated office networks throughout:
China
Hong Kong
Japan
Philippines
Thailand
Preston Rowe Paterson Australasia Pty Ltd
ACN: 060 005 807
The information provided within this publication should be
regarded solely as a general guide. We believe that the
information herein is accurate however no warranty of accuracy or reliability is given in relation to any
information contained in this publication. Nor is any
responsibility for any loss or damage whatsoever arising in
any way for any representation, act or omission, whether
expressed or implied (including responsibility to any person or entity by reason of negligence) accepted by
Preston Rowe Paterson Australasia Pty Ltd or any of its
associated offices or any officer, agent or employee of
Preston Rowe Paterson Australasia Pty Limited.