Embed Size (px)
Citation preview

AGUIRRE NEWMAN | 1
OFFICE MARKET REPORT
MADRID AND BARCELONA
July 2017

2 | Market Report. July 2017
OFFICE MARKET REPORT
MADRID AND BARCELONA
July 2017

AGUIRRE NEWMAN | 3
Aguirre Newman has carried out this report based on its faithful knowledge and understanding, and according to the specific conditions of the real estate market at the time of its preparation. In producing this report, Aguirre Newman: (i) does not offer, deliver and/or confer any declaration and/or guarantee, either express or implicit, (ii) nor does it accept any responsibility regarding the accuracy or integrity of the information contained herein.
Aguirre Newman authorises only partial reproduction of this report, not in its entirety. In every case, any partial reproduction of this report must be referred to as an “extract” of a complete report prepared by Aguirre Newman.
It is prohibited to send or distribute this work without the express consent of Aguirre Newman.
4 | Market Report. July 2017
MADRID BARCELONA
January 2017 July 2017 Variation July 2016 July 2017 Variation
Stock at 1 July (sqm) 12,860,397 12,862,320 0.0% 5,944,153 5,964,953 0.3%
New Projects (sqm). Half-yearly 16,251 1,923 -88.2% 26,500 20,800 -21.5%
Gross Take-up (sqm). Half-yearly 223,089 275,037 23.3% 169,667 207,653 22.4%
Gross Take-up/Stock (%) 1.7% 2.1% 23.3% 2.9% 3.5% 22.0%
Vacancy (%) 11.4% 10.8% -5.3% 9.50% 8.43% -11.3%
Vacancy Rate CBD (%) 10.4% 11.0% 60 bp 2.9% 1.8% -110 bp
Vacancy Rate DEC (%) 15.5% 14.6% -90 bp 12.8% 12.4% -40 bp
Average Rental Price CBD (€/sqm/month) 27.89 28.94 3.8% 16.80 18.23 8.5%
Average Rental Price DEC (€/sqm/month) 12.27 12.61 2.8% 13.49 13.97 3.6%
Initial Yield CBD (%) 4.25% 3.50% -75 bp 4.50% 4.25% -25 bp
Initial Yield DEC (%) 6.50% 5.75% -75 bp 6.50% 6.00% -50 bp
Spanish economic growth remained upbeat throughout H1 2017, exceeding consensus forecasts made at the beginning of the year. GDP grew by 0.8% in Q1, indicating a 3.3% annualised increase. The economic improvement during this period has been underpinned by improved domestic demand, as a result of increased investment in construction and capital goods and a greater contribution of the external sector to the economy. The latter registered the best figure seen for the last 10 years, bolstered by the sale of goods and the excellent performance of the tourism sector.
Economic forecasts for the rest of the year signal continued economic growth of over 3.0% thanks to the strong activity expected in the external sector and improved domestic demand. The rate of employment growth picked up in H1 and will remain positive over the next few months. The unemployment rate is expected to break below the 17% barrier by year-end 2017. Economic activity is expected to remain upbeat into 2018, and is set to grow by 2.8% over the whole year, with unemployment forecast to drop to almost 15%.
In H1 2017, office take-up in Madrid and Barcelona extended the performance seen in 2016. In Madrid, take-up remained at similar
levels to those registered in 2016, whilst figures for Barcelona grew by almost 30%. On the other hand, rental levels have increased across all submarkets analysed, both in Madrid and Barcelona. Vacancy has continued to trend downwards, primarily due to strong demand.
During H1 2017, real estate investment in the Madrid and Barcelona markets reached close to €1,160 million. We would particularly note the frenetic activity in Barcelona, close to 50% of total investment volume, which is the highest figure in the past 10 years, with political uncertainties not seeming to have affected this figure. Initial yields varied in both markets. Whilst initial yields in the Madrid market remained stable over H1 2017 after experiencing strong corrections during H2 2016, they continued to tighten in the Barcelona market, standing at close to 4.25% in the CBD.
The table below highlights the annual changes in the main market indicators for the Madrid and Barcelona office markets:
1. General market overview
AGUIRRE NEWMAN | 5
Office stock barely changed over H1 2017, standing at 12,862,320 sqm in July 2017. During the past 2 years, development activity has primarily focused on property refurbishments, with 350,000 sqm expected to be refurbished between 2017 and 2018. The most significant element of H1 2017 was the completion of refurbishment works in the Prado Urban Business Park, Don Ramón de la Cruz 82 and Sor Ángela de la Cruz 6.
Business activity improved over the six months; take-up levels in Q1 reached approximately 110,000 sqm, and Q2 saw much more activity, registering 165,000 sqm (+60% on Q1). Gross take-up for H1 therefore stood at 275,037 sqm, very similar to that of H1 2016. Take-up in the Business District (CBD and RBD) was positive with significant signings in emblematic buildings such as Edificio Beatriz, Torre Picasso and Torre Europa.
The market also saw an increase in large transactions, with 25 transactions over 3,000 sqm, which accounted for 42% of all the transactions completed. We would also highlight the return of the Banking/Finance sector to the market, and above all Public Authorities.The overall Madrid vacancy rate fell significantly in the past six months,
There has been an overall upswing in rents in all areas of
the market, with a 6.7% increase over the last 12 months.
2. Conclusions: Madrid Market
from 11.4% in January 2017 to 10.8% in July 2017, reducing availability by more than 74,000 sqm. The vacancy rate fell the most in the Rest of the Business District (by 120 basis points), and the out-of-town areas (DEC and OUT) saw notable improvements to their vacancy rates, falling by 15% in the DEC area, its best figure since 2010.
During H1 2017, there was an increase in average rents across all areas, posting an average rise of 3.9% h-o-h. The average rent in the Central Business District (CBD) has risen to €28.94 per sqm/month, while average rents in the Decentralised Area (DEC) have reached €12.61 per sqm/month. The highest rental increase by area was registered in the Rest of the Business District (RBD) area, with an average half-yearly increase of 7.7%. This increase in the Business District has primarily been due to the shift in companies’ requirements, which now prioritise location and the quality of a property over letting costs.
The average rental price in the CBD is €28.94 per sqm/month.
6 | Market Report. July 2017
2. Conclusions: Barcelona Market
During H1 2017 only 20,800 sqm of new office projects came on to the market, all of which were located in the Decentralised Area (DEC). Barcelona office stock has increased and now stands at 5,964,953 sqm. Of the total current office stock, more than 58.4% is located in the City Centre areas, while the rest is located in the Decentralised and Out-of-Town areas.
Demand was very healthy during H1 2017, reaching 207,653 sqm, up 29.3% on H1 2016 and 22.4% on H2 2016. Demand picked up more pace each month, with 127,000 sqm signed during Q2. Demand was high in the Rest of the City area (RC), where take-up was well above normal average levels (53,403 sqm). However, the Decentralised Area (DEC) saw the greatest take-up levels, reaching 88,549 sqm.
With demand on the up, and a lack of new projects, the vacancy rate gradually fell, standing at 8.43% in July 2017. There are currently 503,000 sqm of office space available; meaning that vacant space
Record high H1 take-up in Barcelona.
dropped by 62,000 sqm during the past 6 months. The area where the vacancy rate fell the most was the Central Business District (CBD), where it now stands at 1.8%. Over the last 18 months, the vacancy rate in Barcelona fell by more than 300 basis points.
Rents have been growing across all areas analysed, with notable growth in the city centre, driven by the very low vacancy rate, which stands below 2.00% in the Central Business District (CBD). Maximum rents in the Central Business District reached €23.00 per sqm/month, whilst average rents were close to €18.50 per sqm/month.
AGUIRRE NEWMAN | 7
2. Conclusions: Investment Market
During H1, investment activity remained at the high levels seen in the past two years, reaching more than €1,160 million in the Madrid and Barcelona markets.
Investor activity in the Barcelona office market was close to the levels registered in Madrid, and reached a 10-year record high. This market does not appear to have been affected by political uncertainty.
The lion’s share of market activity was registered by institutional funds and Socimis, both in terms of total investment volumes and the number of transactions completed. Private investors, insurance companies/mutual insurance companies and real estate companies remained active in the market, focusing their purchases on smaller transactions. There were a significant number of transactions completed in out-of-
town markets, owing to the lack of product in the Business District and demand from certain investors for properties located in decentralised areas in need of management.
Yield expectations in Madrid appear to have stabilised in recent months, with an estimated initial yield of 3.5% for the CBD market. In Barcelona, the initial yield has continued to gradually tighten over the last few months, falling to around 4.25% in the CBD.
Increase in Barcelona’s investment market share. The
main transactions were carried out in the DEC and OUT areas.
8 | Market Report. July 2017
3. Outlook: Madrid Market
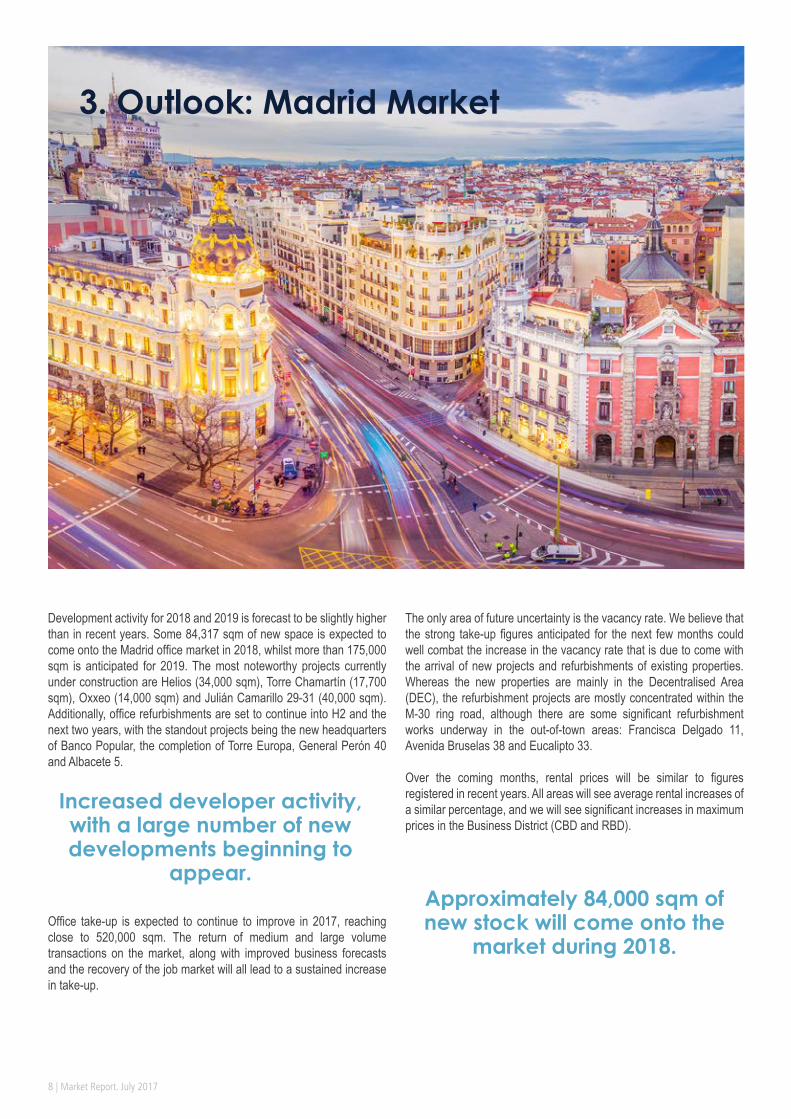
Development activity for 2018 and 2019 is forecast to be slightly higher than in recent years. Some 84,317 sqm of new space is expected to come onto the Madrid office market in 2018, whilst more than 175,000 sqm is anticipated for 2019. The most noteworthy projects currently under construction are Helios (34,000 sqm), Torre Chamartín (17,700 sqm), Oxxeo (14,000 sqm) and Julián Camarillo 29-31 (40,000 sqm). Additionally, office refurbishments are set to continue into H2 and the next two years, with the standout projects being the new headquarters of Banco Popular, the completion of Torre Europa, General Perón 40 and Albacete 5.
Office take-up is expected to continue to improve in 2017, reaching close to 520,000 sqm. The return of medium and large volume transactions on the market, along with improved business forecasts and the recovery of the job market will all lead to a sustained increase in take-up.
Increased developer activity, with a large number of new developments beginning to
appear.
The only area of future uncertainty is the vacancy rate. We believe that the strong take-up figures anticipated for the next few months could well combat the increase in the vacancy rate that is due to come with the arrival of new projects and refurbishments of existing properties. Whereas the new properties are mainly in the Decentralised Area (DEC), the refurbishment projects are mostly concentrated within the M-30 ring road, although there are some significant refurbishment works underway in the out-of-town areas: Francisca Delgado 11, Avenida Bruselas 38 and Eucalipto 33.
Over the coming months, rental prices will be similar to figures registered in recent years. All areas will see average rental increases of a similar percentage, and we will see significant increases in maximum prices in the Business District (CBD and RBD).
Approximately 84,000 sqm of new stock will come onto the
market during 2018.
AGUIRRE NEWMAN | 9
The outlook for new projects in H2 2017 is virtually flat, with the only scheduled addition being 2,750 sqm in the 22@ district. The big change will come in 2018, when 123,500 sqm of new office space is due to come onto the market, 47% of which already has a tenant in place. 78% of new supply scheduled for 2018 is located in the 22@ district, whilst the rest of the new projects are located in the towns of Cerdanyola and San Cugat, which are situated in the OUT area.
In terms of take-up forecasts for the rest of 2017, combining the H1 figure and the transactions already underway, we estimate that the year-end figure could reach 390,000 sqm.
A strong increase is expected in the CBD and RBD as a result of the lack of available stock in these areas.
3. Outlook: Barcelona Market
The vacancy rate is set to continue to fall for the remainder of the year, following the trend of the last few years, given the low levels of supply coming onto the market. During 2018, given the significant amount of new stock due to come onto the market, we believe that the vacancy rate will continue to fall, albeit at a slower pace.
Rents will continue to rise in H2, with growth gathering speed in the Business District (CBD and RBD) and in the prime properties in the DEC area, owing to the lack of available good quality space. The remainder of market areas will register general rental increases, although at a more moderate rate.

10 | Market Report. July 2017
3. Outlook: Investment Market
The strong correlation between GDP growth and the performance of the office market makes us very positive about the latter, until the end of 2018 at the very least. In the current macro-economic backdrop, the Spanish real estate market will continue to perform well in terms of geographical assignment of capital by both national and international investors.
Investment property will remain in short supply. Properties whose owners have remained out of the market in recent years are expected to come onto the market, as they realise that now is the right time to sell. On the other hand, buyers with significant property portfolios are aiming to rotate their less strategic assets over the coming months, either via individual sales or portfolio sales.
An investment volume of over €3,000 million is
expected to be reached by year-end.
Although interest rates will start to rise in the coming months, the real estate yield has ample margin to stay at its current level, and may even fall in the out-of-town markets, if the spread between interest rates and yield tends towards its historical average.

AGUIRRE NEWMAN | 11

12 | Market Report. July 2017
Madrid Market
AGUIRRE NEWMAN | 13
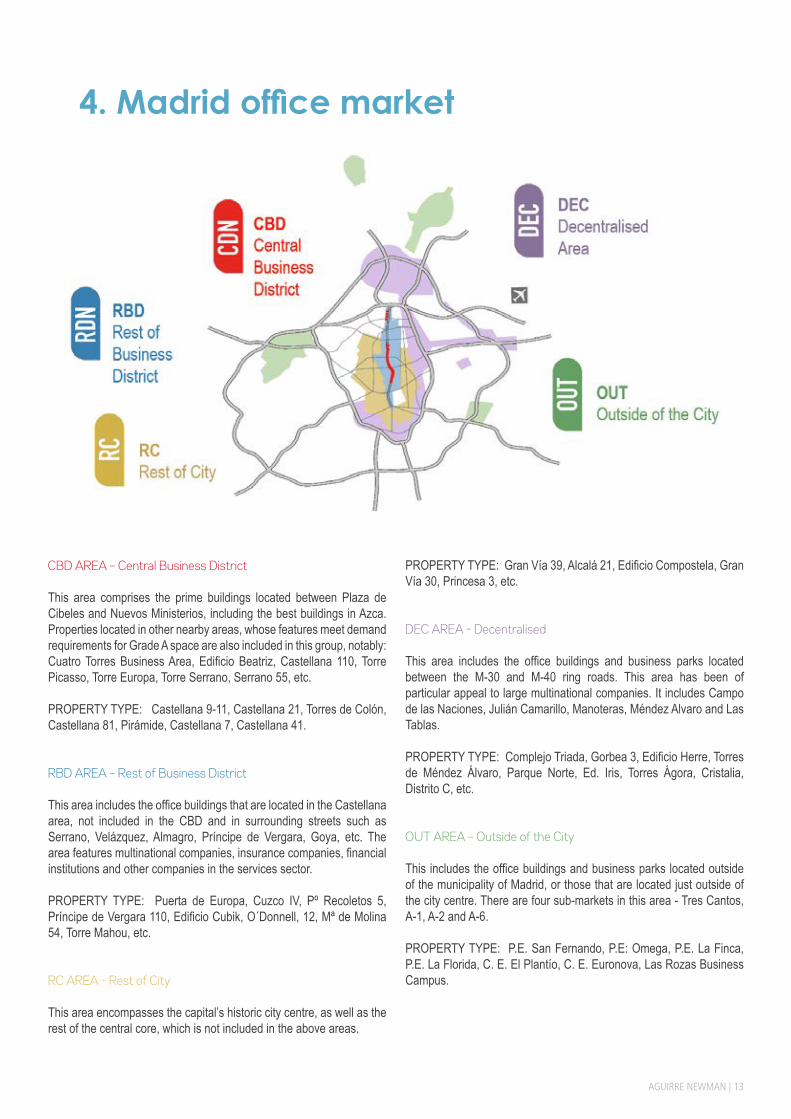
CBD AREA – Central Business District
This area comprises the prime buildings located between Plaza de Cibeles and Nuevos Ministerios, including the best buildings in Azca. Properties located in other nearby areas, whose features meet demand requirements for Grade A space are also included in this group, notably: Cuatro Torres Business Area, Edificio Beatriz, Castellana 110, Torre Picasso, Torre Europa, Torre Serrano, Serrano 55, etc.
PROPERTY TYPE: Castellana 9-11, Castellana 21, Torres de Colón, Castellana 81, Pirámide, Castellana 7, Castellana 41.
RBD AREA – Rest of Business District This area includes the office buildings that are located in the Castellana area, not included in the CBD and in surrounding streets such as Serrano, Velázquez, Almagro, Príncipe de Vergara, Goya, etc. The area features multinational companies, insurance companies, financial institutions and other companies in the services sector.
PROPERTY TYPE: Puerta de Europa, Cuzco IV, Pº Recoletos 5, Príncipe de Vergara 110, Edificio Cubik, O´Donnell, 12, Mª de Molina 54, Torre Mahou, etc.
RC AREA - Rest of City This area encompasses the capital’s historic city centre, as well as the rest of the central core, which is not included in the above areas.
PROPERTY TYPE: Gran Vía 39, Alcalá 21, Edificio Compostela, Gran Vía 30, Princesa 3, etc.
DEC AREA - Decentralised This area includes the office buildings and business parks located between the M-30 and M-40 ring roads. This area has been of particular appeal to large multinational companies. It includes Campo de las Naciones, Julián Camarillo, Manoteras, Méndez Alvaro and Las Tablas.
PROPERTY TYPE: Complejo Triada, Gorbea 3, Edificio Herre, Torres de Méndez Álvaro, Parque Norte, Ed. Iris, Torres Ágora, Cristalia, Distrito C, etc.
OUT AREA – Outside of the City This includes the office buildings and business parks located outside of the municipality of Madrid, or those that are located just outside of the city centre. There are four sub-markets in this area - Tres Cantos, A-1, A-2 and A-6.
PROPERTY TYPE: P.E. San Fernando, P.E: Omega, P.E. La Finca, P.E. La Florida, C. E. El Plantío, C. E. Euronova, Las Rozas Business Campus.
4. Madrid office market
14 | Market Report. July 2017
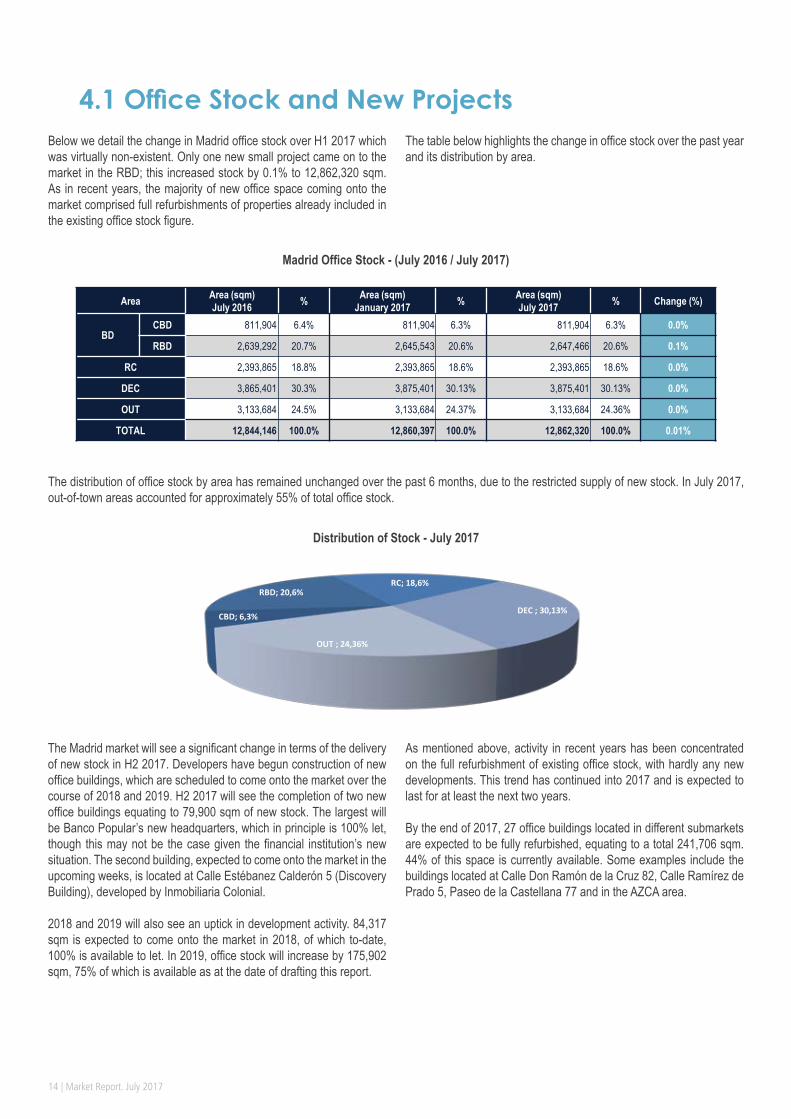
CBD; 6,3%
RBD; 20,6%RC; 18,6%
DEC ; 30,13%
OUT ; 24,36%
Area Area (sqm) July 2016 % Area (sqm)
January 2017 % Area (sqm) July 2017 % Change (%)
BDCBD 811,904 6.4% 811,904 6.3% 811,904 6.3% 0.0%
RBD 2,639,292 20.7% 2,645,543 20.6% 2,647,466 20.6% 0.1%
RC 2,393,865 18.8% 2,393,865 18.6% 2,393,865 18.6% 0.0%
DEC 3,865,401 30.3% 3,875,401 30.13% 3,875,401 30.13% 0.0%
OUT 3,133,684 24.5% 3,133,684 24.37% 3,133,684 24.36% 0.0%
TOTAL 12,844,146 100.0% 12,860,397 100.0% 12,862,320 100.0% 0.01%
Below we detail the change in Madrid office stock over H1 2017 which was virtually non-existent. Only one new small project came on to the market in the RBD; this increased stock by 0.1% to 12,862,320 sqm. As in recent years, the majority of new office space coming onto the market comprised full refurbishments of properties already included in the existing office stock figure.
The table below highlights the change in office stock over the past year and its distribution by area.
4.1 Office Stock and New Projects
Madrid Office Stock - (July 2016 / July 2017)
The distribution of office stock by area has remained unchanged over the past 6 months, due to the restricted supply of new stock. In July 2017, out-of-town areas accounted for approximately 55% of total office stock.
Distribution of Stock - July 2017
The Madrid market will see a significant change in terms of the delivery of new stock in H2 2017. Developers have begun construction of new office buildings, which are scheduled to come onto the market over the course of 2018 and 2019. H2 2017 will see the completion of two new office buildings equating to 79,900 sqm of new stock. The largest will be Banco Popular’s new headquarters, which in principle is 100% let, though this may not be the case given the financial institution’s new situation. The second building, expected to come onto the market in the upcoming weeks, is located at Calle Estébanez Calderón 5 (Discovery Building), developed by Inmobiliaria Colonial.
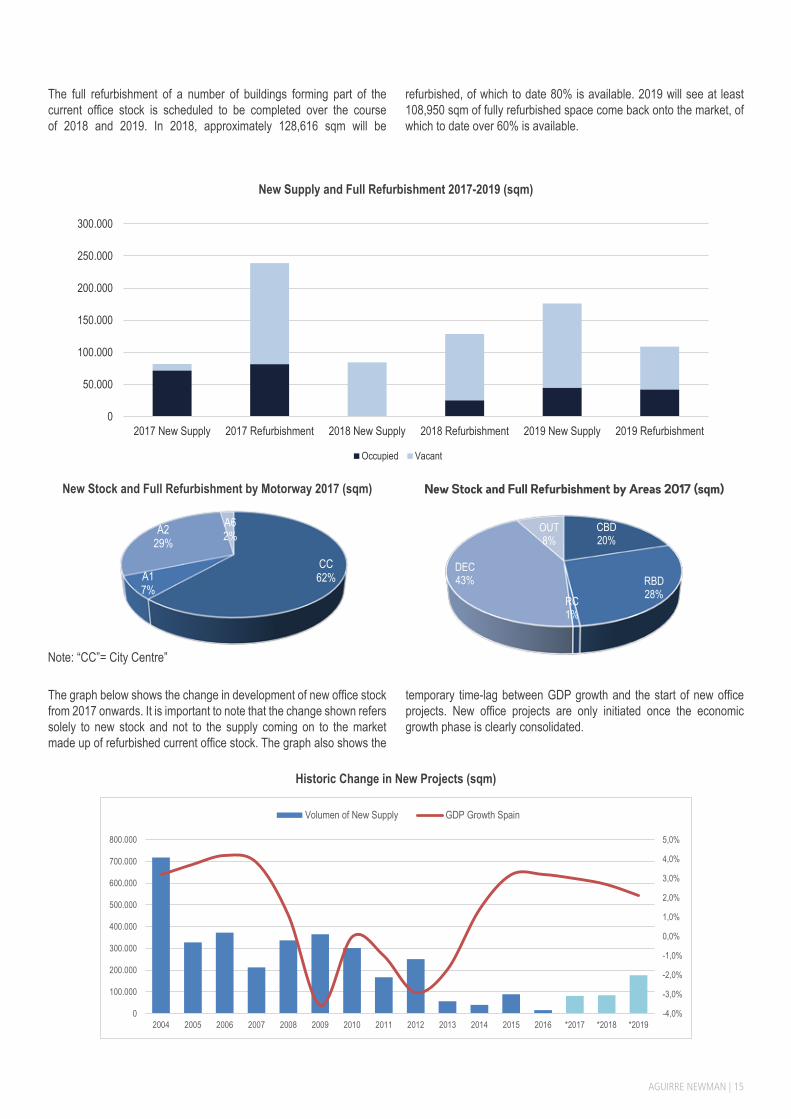
2018 and 2019 will also see an uptick in development activity. 84,317 sqm is expected to come onto the market in 2018, of which to-date, 100% is available to let. In 2019, office stock will increase by 175,902 sqm, 75% of which is available as at the date of drafting this report.
As mentioned above, activity in recent years has been concentrated on the full refurbishment of existing office stock, with hardly any new developments. This trend has continued into 2017 and is expected to last for at least the next two years.
By the end of 2017, 27 office buildings located in different submarkets are expected to be fully refurbished, equating to a total 241,706 sqm. 44% of this space is currently available. Some examples include the buildings located at Calle Don Ramón de la Cruz 82, Calle Ramírez de Prado 5, Paseo de la Castellana 77 and in the AZCA area.
AGUIRRE NEWMAN | 15
The full refurbishment of a number of buildings forming part of the current office stock is scheduled to be completed over the course of 2018 and 2019. In 2018, approximately 128,616 sqm will be
refurbished, of which to date 80% is available. 2019 will see at least 108,950 sqm of fully refurbished space come back onto the market, of which to date over 60% is available.
New Supply and Full Refurbishment 2017-2019 (sqm)
New Stock and Full Refurbishment by Motorway 2017 (sqm) New Stock and Full Refurbishment by Areas 2017 (sqm)
Note: “CC”= City Centre”
The graph below shows the change in development of new office stock from 2017 onwards. It is important to note that the change shown refers solely to new stock and not to the supply coming on to the market made up of refurbished current office stock. The graph also shows the
temporary time-lag between GDP growth and the start of new office projects. New office projects are only initiated once the economic growth phase is clearly consolidated.
CC62%A1
7%
A229%
A62%
Historic Change in New Projects (sqm)
0
50.000
100.000
150.000
200.000
250.000
300.000
2017 New Supply 2017 Refurbishment 2018 New Supply 2018 Refurbishment 2019 New Supply 2019 Refurbishment
Occupied Vacant
CBD20%
RBD28%RC
1%
DEC43%
OUT8%
-4,0%
-3,0%
-2,0%
-1,0%
0,0%
1,0%
2,0%
3,0%
4,0%
5,0%
0
100.000
200.000
300.000
400.000
500.000
600.000
700.000
800.000
2004 2005 2006 2007 2008 2009 2010 2011 2012 2013 2014 2015 2016 *2017 *2018 *2019
Volumen of New Supply GDP Growth Spain
16 | Market Report. July 2017
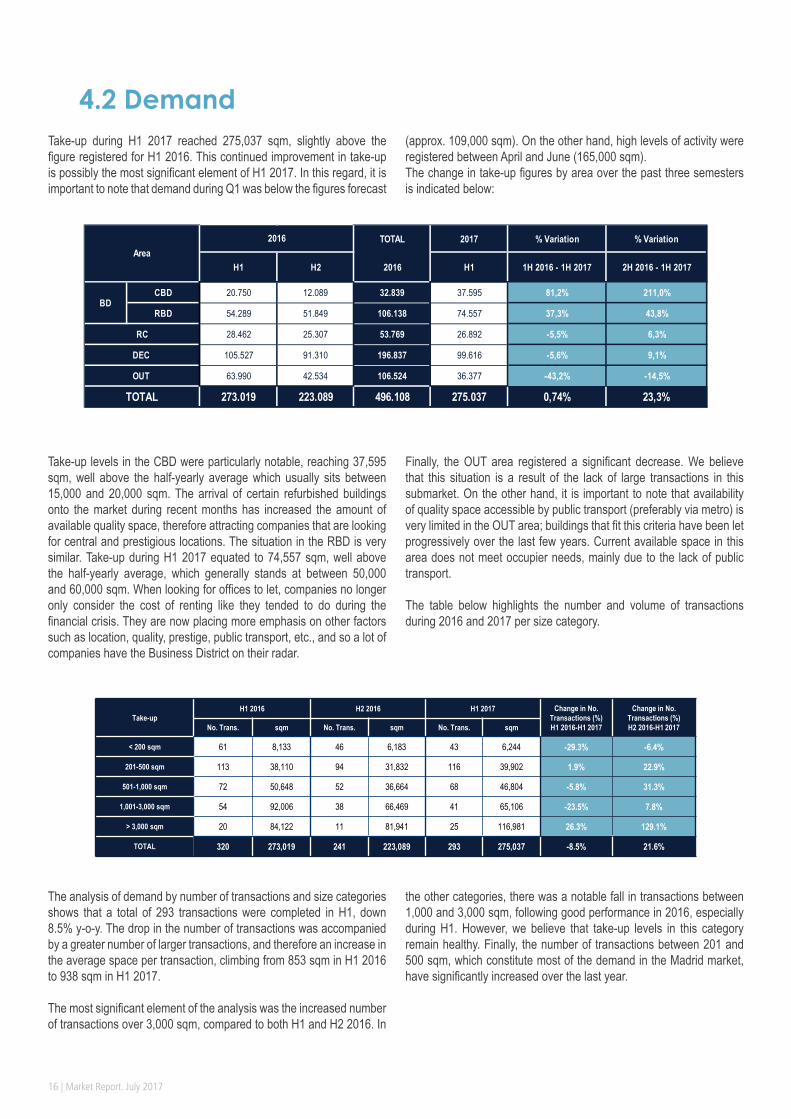
Take-up during H1 2017 reached 275,037 sqm, slightly above the figure registered for H1 2016. This continued improvement in take-up is possibly the most significant element of H1 2017. In this regard, it is important to note that demand during Q1 was below the figures forecast
(approx. 109,000 sqm). On the other hand, high levels of activity were registered between April and June (165,000 sqm).The change in take-up figures by area over the past three semesters is indicated below:
4.2 Demand
Take-up levels in the CBD were particularly notable, reaching 37,595 sqm, well above the half-yearly average which usually sits between 15,000 and 20,000 sqm. The arrival of certain refurbished buildings onto the market during recent months has increased the amount of available quality space, therefore attracting companies that are looking for central and prestigious locations. The situation in the RBD is very similar. Take-up during H1 2017 equated to 74,557 sqm, well above the half-yearly average, which generally stands at between 50,000 and 60,000 sqm. When looking for offices to let, companies no longer only consider the cost of renting like they tended to do during the financial crisis. They are now placing more emphasis on other factors such as location, quality, prestige, public transport, etc., and so a lot of companies have the Business District on their radar.
Finally, the OUT area registered a significant decrease. We believe that this situation is a result of the lack of large transactions in this submarket. On the other hand, it is important to note that availability of quality space accessible by public transport (preferably via metro) is very limited in the OUT area; buildings that fit this criteria have been let progressively over the last few years. Current available space in this area does not meet occupier needs, mainly due to the lack of public transport.
The table below highlights the number and volume of transactions during 2016 and 2017 per size category.
The analysis of demand by number of transactions and size categories shows that a total of 293 transactions were completed in H1, down 8.5% y-o-y. The drop in the number of transactions was accompanied by a greater number of larger transactions, and therefore an increase in the average space per transaction, climbing from 853 sqm in H1 2016 to 938 sqm in H1 2017.
The most significant element of the analysis was the increased number of transactions over 3,000 sqm, compared to both H1 and H2 2016. In
the other categories, there was a notable fall in transactions between 1,000 and 3,000 sqm, following good performance in 2016, especially during H1. However, we believe that take-up levels in this category remain healthy. Finally, the number of transactions between 201 and 500 sqm, which constitute most of the demand in the Madrid market, have significantly increased over the last year.
Take-upH1 2016 H2 2016 H1 2017 Change in No.
Transactions (%)H1 2016-H1 2017
Change in No. Transactions (%)H2 2016-H1 2017No. Trans. sqm No. Trans. sqm No. Trans. sqm
< 200 sqm 61 8,133 46 6,183 43 6,244 -29.3% -6.4%
201-500 sqm 113 38,110 94 31,832 116 39,902 1.9% 22.9%
501-1,000 sqm 72 50,648 52 36,664 68 46,804 -5.8% 31.3%
1,001-3,000 sqm 54 92,006 38 66,469 41 65,106 -23.5% 7.8%
> 3,000 sqm 20 84,122 11 81,941 25 116,981 26.3% 129.1%
TOTAL 320 273,019 241 223,089 293 275,037 -8.5% 21.6%
TOTAL 2017 % Variation % Variation
H1 H2 2016 H1 1H 2016 - 1H 2017 2H 2016 - 1H 2017
CBD 20.750 12.089 32.839 37.595 81,2% 211,0%
RBD 54.289 51.849 106.138 74.557 37,3% 43,8%
28.462 25.307 53.769 26.892 -5,5% 6,3%
105.527 91.310 196.837 99.616 -5,6% 9,1%
63.990 42.534 106.524 36.377 -43,2% -14,5%
273.019 223.089 496.108 275.037 0,74% 23,3%
2016
TOTAL
Area
BD
OUT
RC
DEC
AGUIRRE NEWMAN | 17
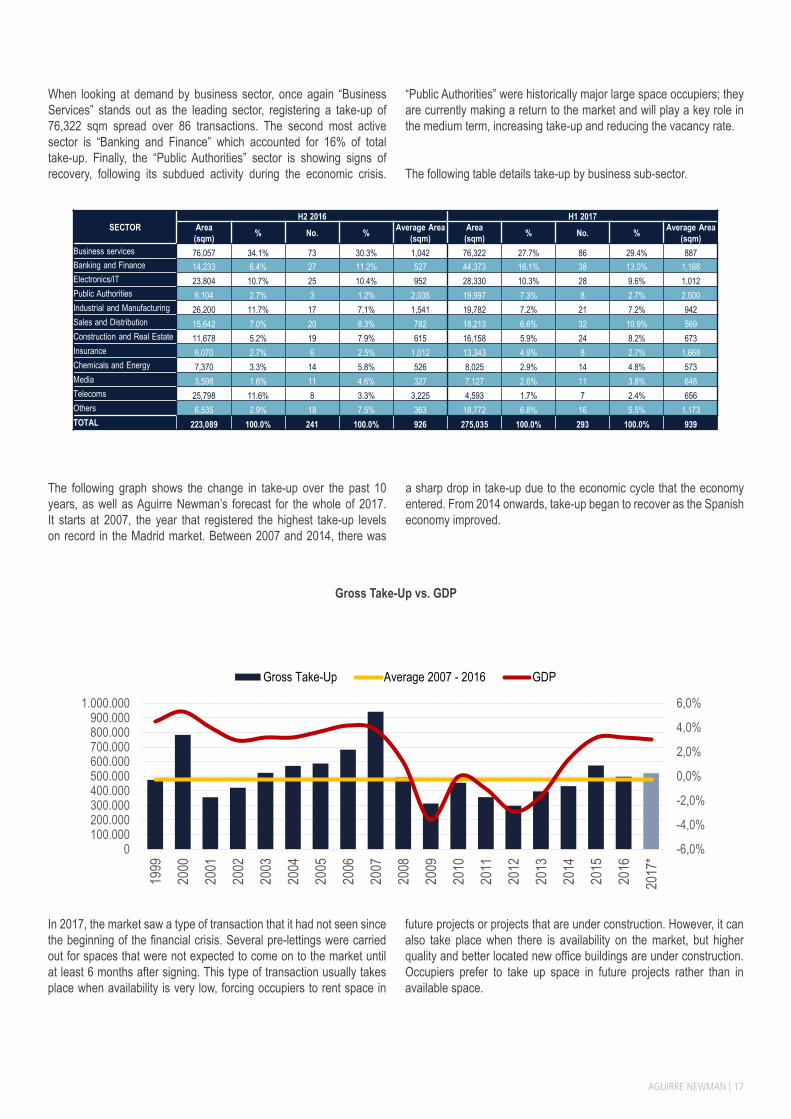
When looking at demand by business sector, once again “Business Services” stands out as the leading sector, registering a take-up of 76,322 sqm spread over 86 transactions. The second most active sector is “Banking and Finance” which accounted for 16% of total take-up. Finally, the “Public Authorities” sector is showing signs of recovery, following its subdued activity during the economic crisis.
“Public Authorities” were historically major large space occupiers; they are currently making a return to the market and will play a key role in the medium term, increasing take-up and reducing the vacancy rate.
The following table details take-up by business sub-sector.
Gross Take-Up vs. GDP
In 2017, the market saw a type of transaction that it had not seen since the beginning of the financial crisis. Several pre-lettings were carried out for spaces that were not expected to come on to the market until at least 6 months after signing. This type of transaction usually takes place when availability is very low, forcing occupiers to rent space in
future projects or projects that are under construction. However, it can also take place when there is availability on the market, but higher quality and better located new office buildings are under construction. Occupiers prefer to take up space in future projects rather than in available space.
The following graph shows the change in take-up over the past 10 years, as well as Aguirre Newman’s forecast for the whole of 2017. It starts at 2007, the year that registered the highest take-up levels on record in the Madrid market. Between 2007 and 2014, there was
a sharp drop in take-up due to the economic cycle that the economy entered. From 2014 onwards, take-up began to recover as the Spanish economy improved.
SECTORH2 2016 H1 2017
Area(sqm) % No. % Average Area
(sqm)Area(sqm) % No. % Average Area
(sqm)Business services 76,057 34.1% 73 30.3% 1,042 76,322 27.7% 86 29.4% 887Banking and Finance 14,233 6.4% 27 11.2% 527 44,373 16.1% 38 13.0% 1,168Electronics/IT 23,804 10.7% 25 10.4% 952 28,330 10.3% 28 9.6% 1,012Public Authorities 6,104 2.7% 3 1.2% 2,035 19,997 7.3% 8 2.7% 2,500Industrial and Manufacturing 26,200 11.7% 17 7.1% 1,541 19,782 7.2% 21 7.2% 942Sales and Distribution 15,642 7.0% 20 8.3% 782 18,213 6.6% 32 10.9% 569Construction and Real Estate 11,678 5.2% 19 7.9% 615 16,158 5.9% 24 8.2% 673Insurance 6,070 2.7% 6 2.5% 1,012 13,343 4.9% 8 2.7% 1,668Chemicals and Energy 7,370 3.3% 14 5.8% 526 8,025 2.9% 14 4.8% 573Media 3,598 1.6% 11 4.6% 327 7,127 2.6% 11 3.8% 648Telecoms 25,798 11.6% 8 3.3% 3,225 4,593 1.7% 7 2.4% 656Others 6,535 2.9% 18 7.5% 363 18,772 6.8% 16 5.5% 1,173TOTAL 223,089 100.0% 241 100.0% 926 275,035 100.0% 293 100.0% 939
-6,0%
-4,0%
-2,0%
0,0%
2,0%
4,0%
6,0%
0100.000200.000300.000400.000500.000600.000700.000800.000900.000
1.000.000
1999
2000
2001
2002
2003
2004
2005
2006
2007
2008
2009
2010
2011
2012
2013
2014
2015
2016
2017
*
Gross Take-Up Average 2007 - 2016 GDP
18 | Market Report. July 2017
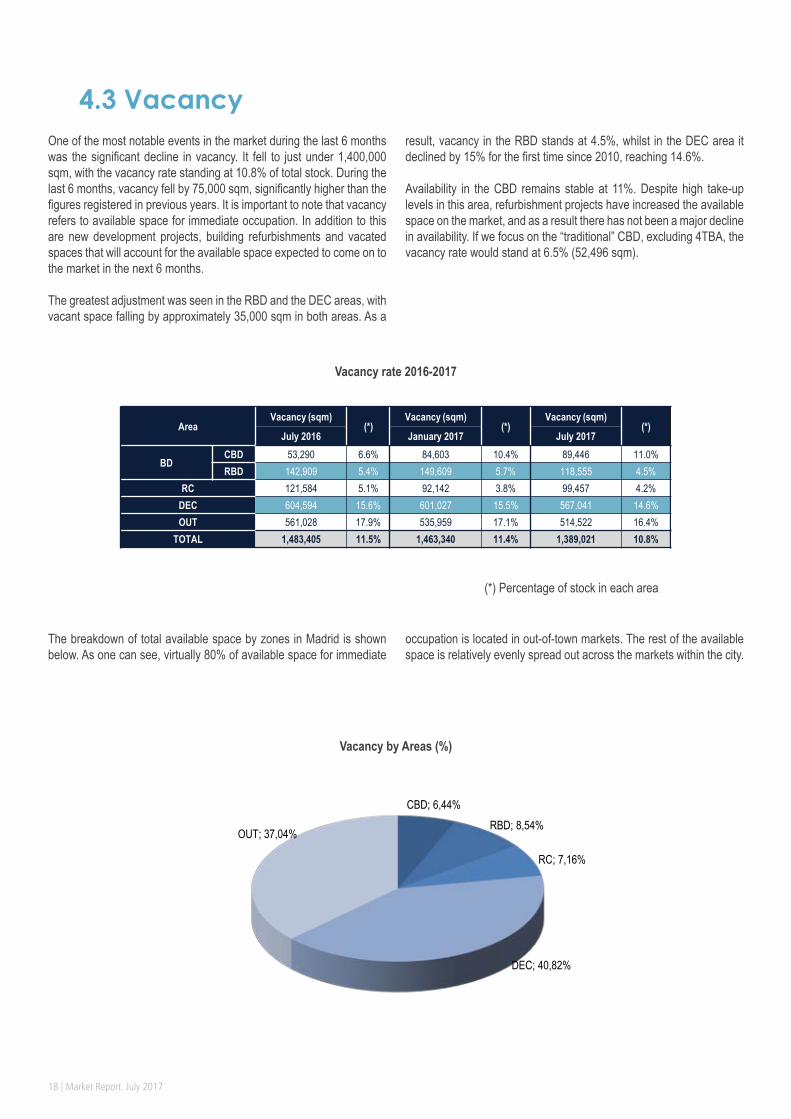
One of the most notable events in the market during the last 6 months was the significant decline in vacancy. It fell to just under 1,400,000 sqm, with the vacancy rate standing at 10.8% of total stock. During the last 6 months, vacancy fell by 75,000 sqm, significantly higher than the figures registered in previous years. It is important to note that vacancy refers to available space for immediate occupation. In addition to this are new development projects, building refurbishments and vacated spaces that will account for the available space expected to come on to the market in the next 6 months.
The greatest adjustment was seen in the RBD and the DEC areas, with vacant space falling by approximately 35,000 sqm in both areas. As a
result, vacancy in the RBD stands at 4.5%, whilst in the DEC area it declined by 15% for the first time since 2010, reaching 14.6%.
Availability in the CBD remains stable at 11%. Despite high take-up levels in this area, refurbishment projects have increased the available space on the market, and as a result there has not been a major decline in availability. If we focus on the “traditional” CBD, excluding 4TBA, the vacancy rate would stand at 6.5% (52,496 sqm).
4.3 Vacancy
The breakdown of total available space by zones in Madrid is shown below. As one can see, virtually 80% of available space for immediate
(*) Percentage of stock in each area
Vacancy by Areas (%)
Vacancy rate 2016-2017
occupation is located in out-of-town markets. The rest of the available space is relatively evenly spread out across the markets within the city.
AreaVacancy (sqm)
(*)Vacancy (sqm)
(*)Vacancy (sqm)
(*)July 2016 January 2017 July 2017
BDCBD 53,290 6.6% 84,603 10.4% 89,446 11.0%RBD 142,909 5.4% 149,609 5.7% 118,555 4.5%
RC 121,584 5.1% 92,142 3.8% 99,457 4.2%DEC 604,594 15.6% 601,027 15.5% 567,041 14.6%OUT 561,028 17.9% 535,959 17.1% 514,522 16.4%
TOTAL 1,483,405 11.5% 1,463,340 11.4% 1,389,021 10.8%
CBD; 6,44%RBD; 8,54%
RC; 7,16%
DEC; 40,82%
OUT; 37,04%
AGUIRRE NEWMAN | 19
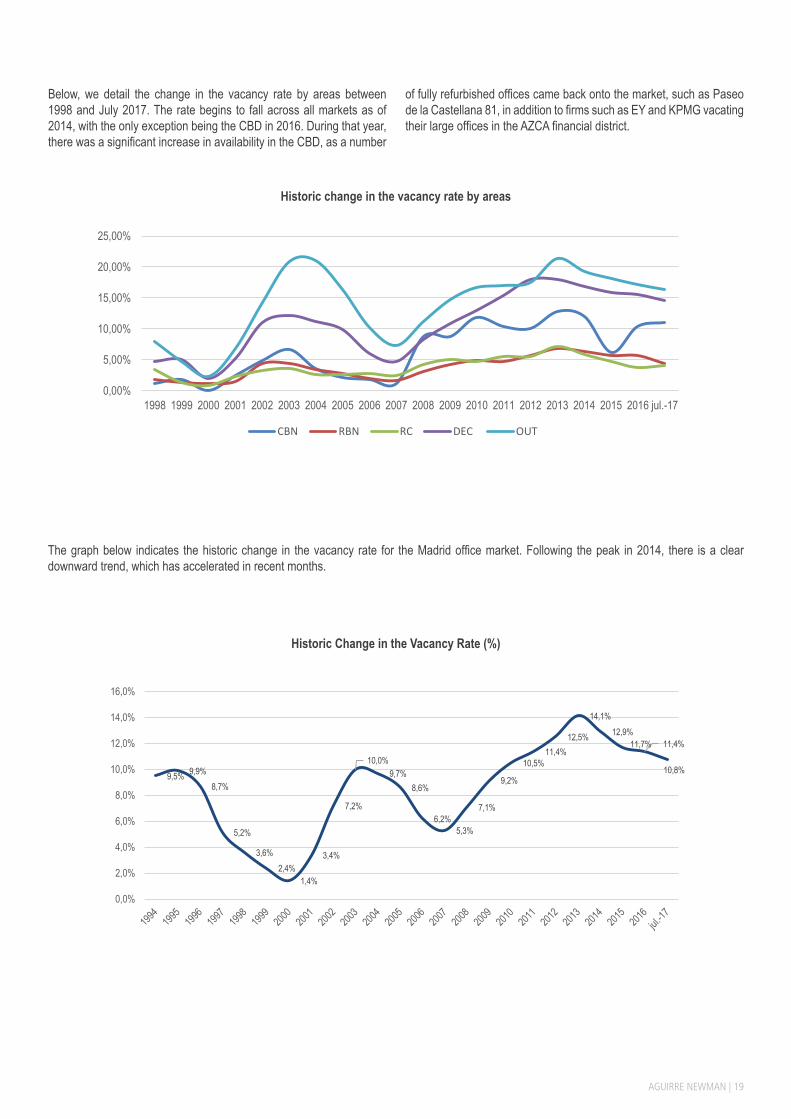
Below, we detail the change in the vacancy rate by areas between 1998 and July 2017. The rate begins to fall across all markets as of 2014, with the only exception being the CBD in 2016. During that year, there was a significant increase in availability in the CBD, as a number
of fully refurbished offices came back onto the market, such as Paseo de la Castellana 81, in addition to firms such as EY and KPMG vacating their large offices in the AZCA financial district.
Historic change in the vacancy rate by areas
The graph below indicates the historic change in the vacancy rate for the Madrid office market. Following the peak in 2014, there is a clear downward trend, which has accelerated in recent months.
Historic Change in the Vacancy Rate (%)
9,5% 9,9%8,7%
5,2%
3,6%2,4%
1,4%
3,4%
7,2%
10,0%9,7%
8,6%
6,2%5,3%
7,1%
9,2%
10,5%11,4%
12,5%
14,1%12,9%
11,7% 11,4%
10,8%
0,0%
2,0%
4,0%
6,0%
8,0%
10,0%
12,0%
14,0%
16,0%
0,00%
5,00%
10,00%
15,00%
20,00%
25,00%
1998 1999 2000 2001 2002 2003 2004 2005 2006 2007 2008 2009 2010 2011 2012 2013 2014 2015 2016 jul.-17
CBN RBN RC DEC OUT
20 | Market Report. July 2017
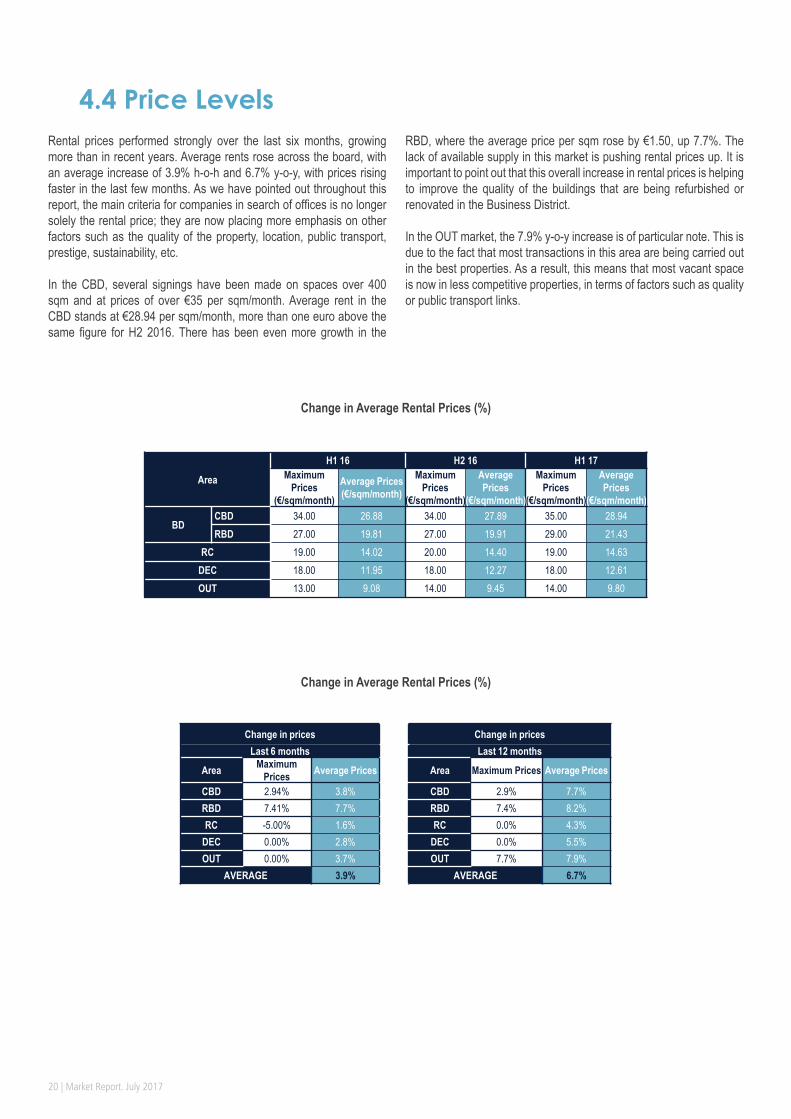
Rental prices performed strongly over the last six months, growing more than in recent years. Average rents rose across the board, with an average increase of 3.9% h-o-h and 6.7% y-o-y, with prices rising faster in the last few months. As we have pointed out throughout this report, the main criteria for companies in search of offices is no longer solely the rental price; they are now placing more emphasis on other factors such as the quality of the property, location, public transport, prestige, sustainability, etc.
In the CBD, several signings have been made on spaces over 400 sqm and at prices of over €35 per sqm/month. Average rent in the CBD stands at €28.94 per sqm/month, more than one euro above the same figure for H2 2016. There has been even more growth in the
RBD, where the average price per sqm rose by €1.50, up 7.7%. The lack of available supply in this market is pushing rental prices up. It is important to point out that this overall increase in rental prices is helping to improve the quality of the buildings that are being refurbished or renovated in the Business District.
In the OUT market, the 7.9% y-o-y increase is of particular note. This is due to the fact that most transactions in this area are being carried out in the best properties. As a result, this means that most vacant space is now in less competitive properties, in terms of factors such as quality or public transport links.
4.4 Price Levels
Change in Average Rental Prices (%)
Change in Average Rental Prices (%)
Area
H1 16 H2 16 H1 17Maximum
Prices (€/sqm/month)
Average Prices (€/sqm/month)
Maximum Prices
(€/sqm/month)
Average Prices
(€/sqm/month)
Maximum Prices
(€/sqm/month)
Average Prices
(€/sqm/month)
BDCBD 34.00 26.88 34.00 27.89 35.00 28.94RBD 27.00 19.81 27.00 19.91 29.00 21.43
RC 19.00 14.02 20.00 14.40 19.00 14.63DEC 18.00 11.95 18.00 12.27 18.00 12.61OUT 13.00 9.08 14.00 9.45 14.00 9.80
Change in prices Change in pricesLast 6 months Last 12 months
Area Maximum Prices Average Prices Area Maximum Prices Average Prices
CBD 2.94% 3.8% CBD 2.9% 7.7%RBD 7.41% 7.7% RBD 7.4% 8.2%RC -5.00% 1.6% RC 0.0% 4.3%
DEC 0.00% 2.8% DEC 0.0% 5.5%OUT 0.00% 3.7% OUT 7.7% 7.9%
AVERAGE 3.9% AVERAGE 6.7%
AGUIRRE NEWMAN | 21
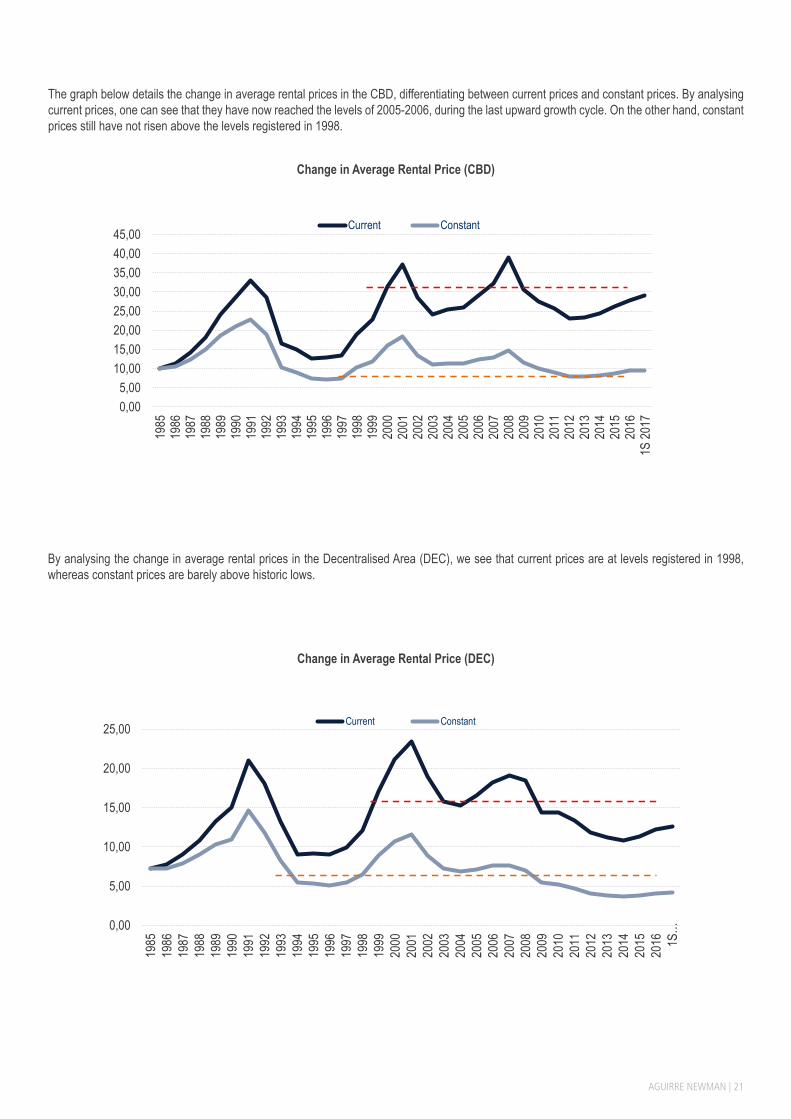
The graph below details the change in average rental prices in the CBD, differentiating between current prices and constant prices. By analysing current prices, one can see that they have now reached the levels of 2005-2006, during the last upward growth cycle. On the other hand, constant prices still have not risen above the levels registered in 1998.
Change in Average Rental Price (CBD)
By analysing the change in average rental prices in the Decentralised Area (DEC), we see that current prices are at levels registered in 1998, whereas constant prices are barely above historic lows.
Change in Average Rental Price (DEC)
0,005,00
10,0015,0020,0025,0030,0035,0040,0045,00
1985
1986
1987
1988
1989
1990
1991
1992
1993
1994
1995
1996
1997
1998
1999
2000
2001
2002
2003
2004
2005
2006
2007
2008
2009
2010
2011
2012
2013
2014
2015
2016
1S 20
17
Current Constant
0,00
5,00
10,00
15,00
20,00
25,00
1985
1986
1987
1988
1989
1990
1991
1992
1993
1994
1995
1996
1997
1998
1999
2000
2001
2002
2003
2004
2005
2006
2007
2008
2009
2010
2011
2012
2013
2014
2015
2016 1S
…
Current Constant
22 | Market Report. July 2017
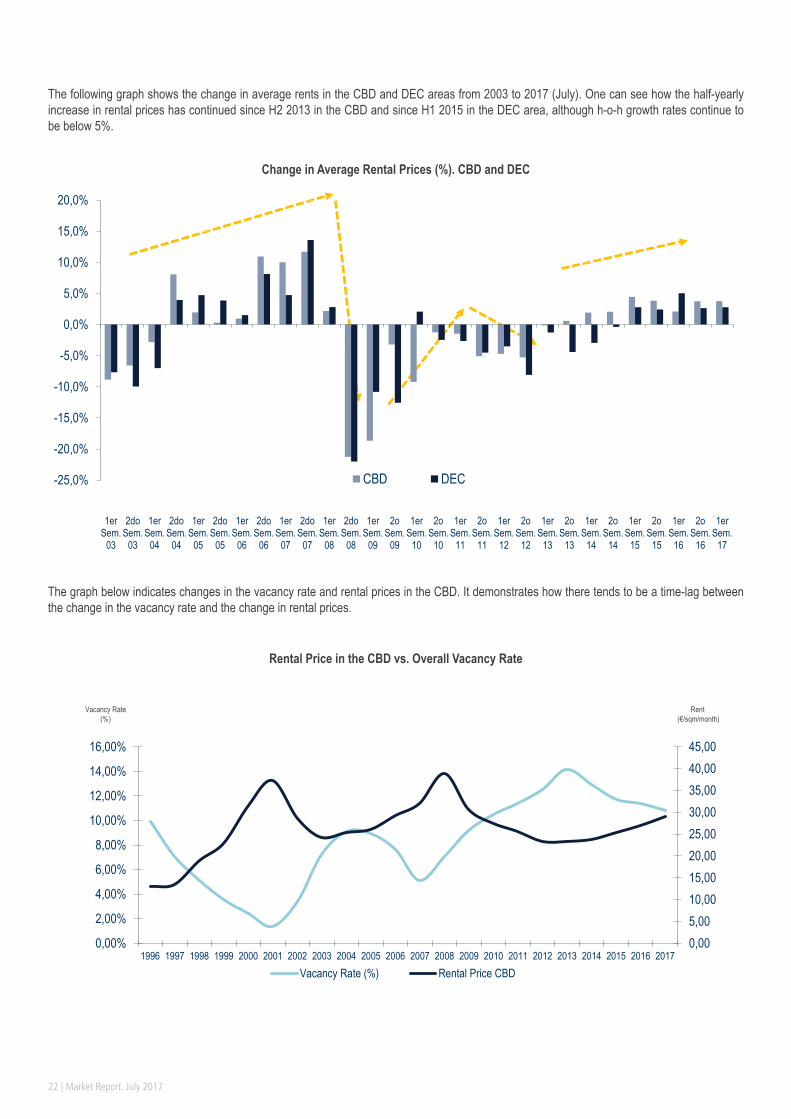
The following graph shows the change in average rents in the CBD and DEC areas from 2003 to 2017 (July). One can see how the half-yearly increase in rental prices has continued since H2 2013 in the CBD and since H1 2015 in the DEC area, although h-o-h growth rates continue to be below 5%.
Change in Average Rental Prices (%). CBD and DEC
The graph below indicates changes in the vacancy rate and rental prices in the CBD. It demonstrates how there tends to be a time-lag between the change in the vacancy rate and the change in rental prices.
Rental Price in the CBD vs. Overall Vacancy Rate
-25,0%
-20,0%
-15,0%
-10,0%
-5,0%
0,0%
5,0%
10,0%
15,0%
20,0%
1erSem.
03
2doSem.
03
1erSem.
04
2doSem.
04
1erSem.
05
2doSem.
05
1erSem.
06
2doSem.
06
1erSem.
07
2doSem.
07
1erSem.
08
2doSem.
08
1erSem.
09
2oSem.
09
1erSem.
10
2oSem.
10
1erSem.
11
2oSem.
11
1erSem.
12
2oSem.
12
1erSem.
13
2oSem.
13
1erSem.
14
2oSem.
14
1erSem.
15
2oSem.
15
1erSem.
16
2oSem.
16
1erSem.
17
CBD DEC
Vacancy Rate(%)
Rent(€/sqm/month)
0,005,0010,0015,0020,0025,0030,0035,0040,0045,00
0,00%
2,00%
4,00%
6,00%
8,00%
10,00%
12,00%
14,00%
16,00%
1996 1997 1998 1999 2000 2001 2002 2003 2004 2005 2006 2007 2008 2009 2010 2011 2012 2013 2014 2015 2016 2017Vacancy Rate (%) Rental Price CBD
AGUIRRE NEWMAN | 23
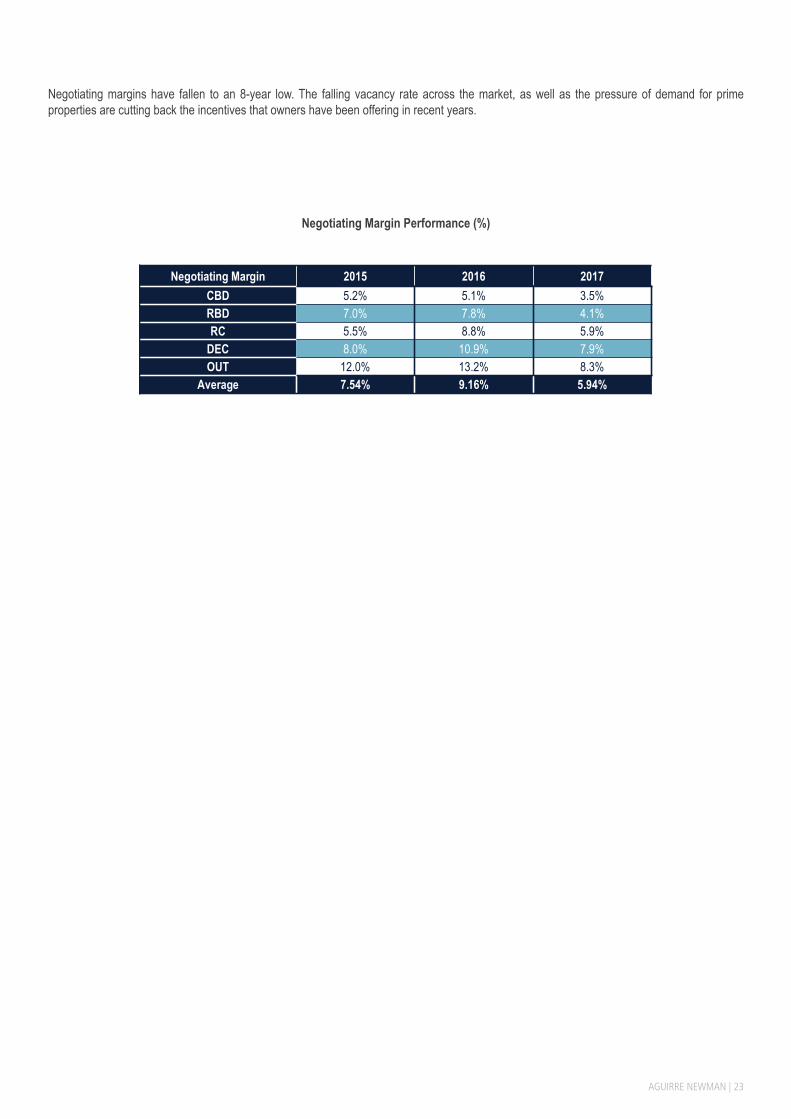
Negotiating margins have fallen to an 8-year low. The falling vacancy rate across the market, as well as the pressure of demand for prime properties are cutting back the incentives that owners have been offering in recent years.
Negotiating Margin Performance (%)
Negotiating Margin 2015 2016 2017CBD 5.2% 5.1% 3.5%RBD 7.0% 7.8% 4.1%RC 5.5% 8.8% 5.9%
DEC 8.0% 10.9% 7.9%OUT 12.0% 13.2% 8.3%
Average 7.54% 9.16% 5.94%
24 | Market Report. July 2017
Barcelona Market
AGUIRRE NEWMAN | 25
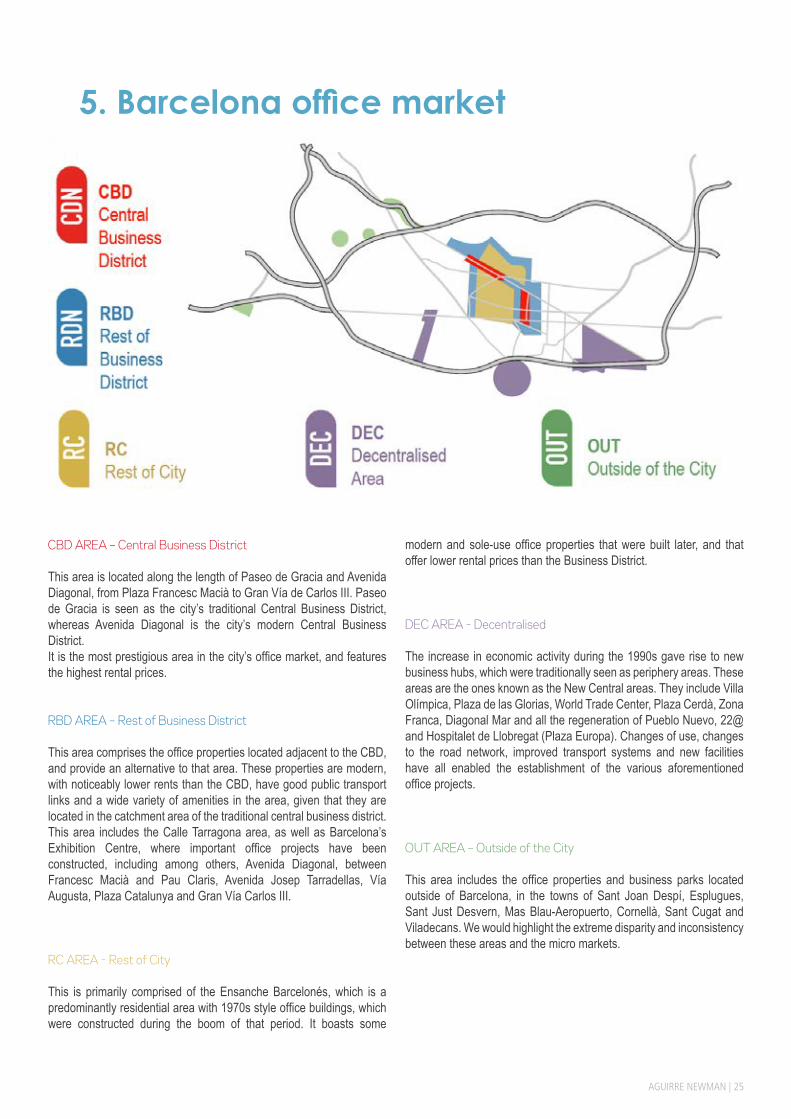
CBD AREA – Central Business District
This area is located along the length of Paseo de Gracia and Avenida Diagonal, from Plaza Francesc Macià to Gran Vía de Carlos III. Paseo de Gracia is seen as the city’s traditional Central Business District, whereas Avenida Diagonal is the city’s modern Central Business District.It is the most prestigious area in the city’s office market, and features the highest rental prices. RBD AREA – Rest of Business District This area comprises the office properties located adjacent to the CBD, and provide an alternative to that area. These properties are modern, with noticeably lower rents than the CBD, have good public transport links and a wide variety of amenities in the area, given that they are located in the catchment area of the traditional central business district.This area includes the Calle Tarragona area, as well as Barcelona’s Exhibition Centre, where important office projects have been constructed, including among others, Avenida Diagonal, between Francesc Macià and Pau Claris, Avenida Josep Tarradellas, Vía Augusta, Plaza Catalunya and Gran Vía Carlos III.
RC AREA - Rest of City This is primarily comprised of the Ensanche Barcelonés, which is a predominantly residential area with 1970s style office buildings, which were constructed during the boom of that period. It boasts some
modern and sole-use office properties that were built later, and that offer lower rental prices than the Business District.
DEC AREA - Decentralised The increase in economic activity during the 1990s gave rise to new business hubs, which were traditionally seen as periphery areas. These areas are the ones known as the New Central areas. They include Villa Olímpica, Plaza de las Glorias, World Trade Center, Plaza Cerdà, Zona Franca, Diagonal Mar and all the regeneration of Pueblo Nuevo, 22@ and Hospitalet de Llobregat (Plaza Europa). Changes of use, changes to the road network, improved transport systems and new facilities have all enabled the establishment of the various aforementioned office projects.
OUT AREA – Outside of the City This area includes the office properties and business parks located outside of Barcelona, in the towns of Sant Joan Despí, Esplugues, Sant Just Desvern, Mas Blau-Aeropuerto, Cornellà, Sant Cugat and Viladecans. We would highlight the extreme disparity and inconsistency between these areas and the micro markets.
5. Barcelona office market
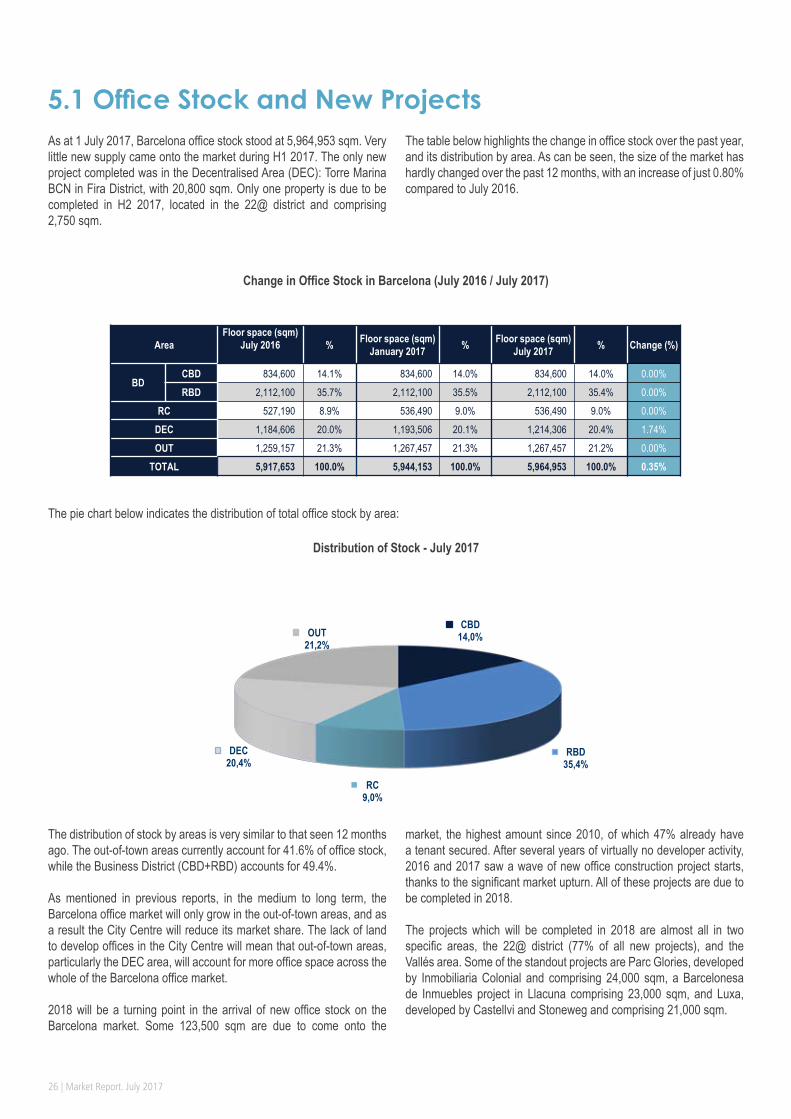
26 | Market Report. July 2017
As at 1 July 2017, Barcelona office stock stood at 5,964,953 sqm. Very little new supply came onto the market during H1 2017. The only new project completed was in the Decentralised Area (DEC): Torre Marina BCN in Fira District, with 20,800 sqm. Only one property is due to be completed in H2 2017, located in the 22@ district and comprising 2,750 sqm.
The table below highlights the change in office stock over the past year, and its distribution by area. As can be seen, the size of the market has hardly changed over the past 12 months, with an increase of just 0.80% compared to July 2016.
5.1 Office Stock and New Projects
Change in Office Stock in Barcelona (July 2016 / July 2017)
The pie chart below indicates the distribution of total office stock by area:
Distribution of Stock - July 2017
The distribution of stock by areas is very similar to that seen 12 months ago. The out-of-town areas currently account for 41.6% of office stock, while the Business District (CBD+RBD) accounts for 49.4%.
As mentioned in previous reports, in the medium to long term, the Barcelona office market will only grow in the out-of-town areas, and as a result the City Centre will reduce its market share. The lack of land to develop offices in the City Centre will mean that out-of-town areas, particularly the DEC area, will account for more office space across the whole of the Barcelona office market.
2018 will be a turning point in the arrival of new office stock on the Barcelona market. Some 123,500 sqm are due to come onto the
market, the highest amount since 2010, of which 47% already have a tenant secured. After several years of virtually no developer activity, 2016 and 2017 saw a wave of new office construction project starts, thanks to the significant market upturn. All of these projects are due to be completed in 2018. The projects which will be completed in 2018 are almost all in two specific areas, the 22@ district (77% of all new projects), and the Vallés area. Some of the standout projects are Parc Glories, developed by Inmobiliaria Colonial and comprising 24,000 sqm, a Barcelonesa de Inmuebles project in Llacuna comprising 23,000 sqm, and Luxa, developed by Castellvi and Stoneweg and comprising 21,000 sqm.
AreaFloor space (sqm)
July 2016 % Floor space (sqm) January 2017 % Floor space (sqm)
July 2017 % Change (%)
BDCBD 834,600 14.1% 834,600 14.0% 834,600 14.0% 0.00%RBD 2,112,100 35.7% 2,112,100 35.5% 2,112,100 35.4% 0.00%
RC 527,190 8.9% 536,490 9.0% 536,490 9.0% 0.00%DEC 1,184,606 20.0% 1,193,506 20.1% 1,214,306 20.4% 1.74%OUT 1,259,157 21.3% 1,267,457 21.3% 1,267,457 21.2% 0.00%
TOTAL 5,917,653 100.0% 5,944,153 100.0% 5,964,953 100.0% 0.35%
CBD14,0%
RBD35,4%
RC9,0%
DEC 20,4%
OUT 21,2%
AGUIRRE NEWMAN | 27
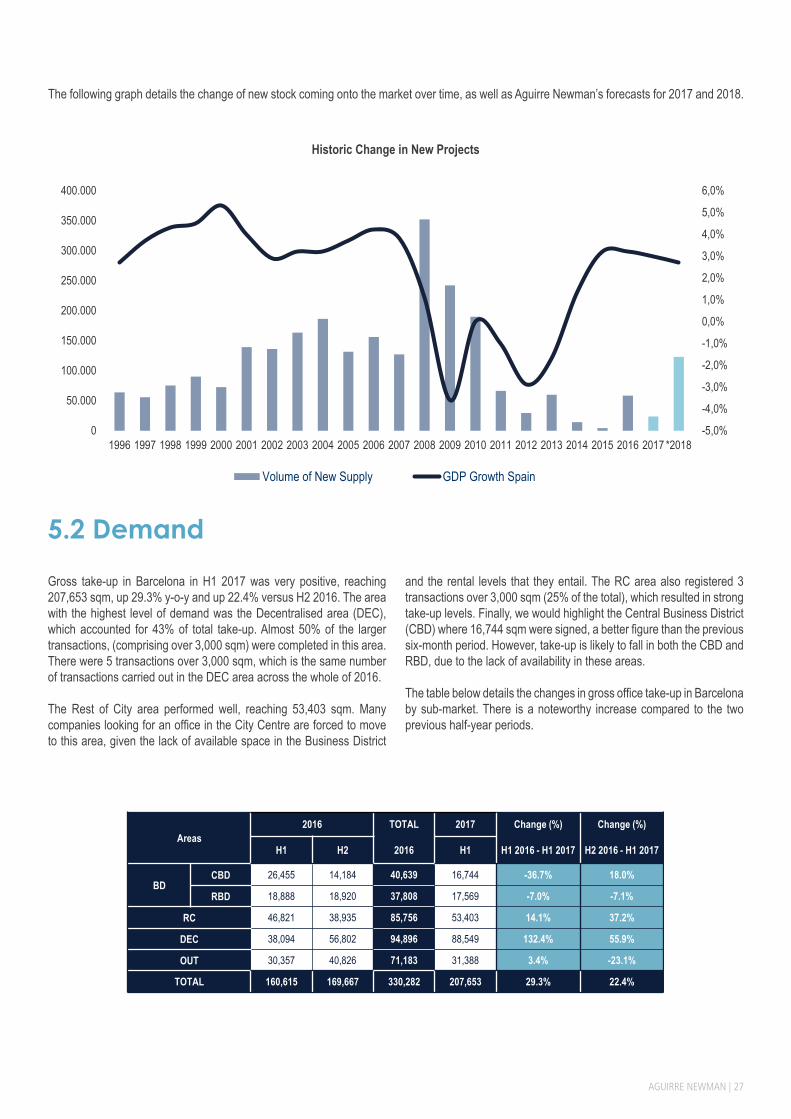
The following graph details the change of new stock coming onto the market over time, as well as Aguirre Newman’s forecasts for 2017 and 2018.
Historic Change in New Projects
5.2 DemandGross take-up in Barcelona in H1 2017 was very positive, reaching 207,653 sqm, up 29.3% y-o-y and up 22.4% versus H2 2016. The area with the highest level of demand was the Decentralised area (DEC), which accounted for 43% of total take-up. Almost 50% of the larger transactions, (comprising over 3,000 sqm) were completed in this area. There were 5 transactions over 3,000 sqm, which is the same number of transactions carried out in the DEC area across the whole of 2016.
The Rest of City area performed well, reaching 53,403 sqm. Many companies looking for an office in the City Centre are forced to move to this area, given the lack of available space in the Business District
and the rental levels that they entail. The RC area also registered 3 transactions over 3,000 sqm (25% of the total), which resulted in strong take-up levels. Finally, we would highlight the Central Business District (CBD) where 16,744 sqm were signed, a better figure than the previous six-month period. However, take-up is likely to fall in both the CBD and RBD, due to the lack of availability in these areas.
The table below details the changes in gross office take-up in Barcelona by sub-market. There is a noteworthy increase compared to the two previous half-year periods.
Areas2016 TOTAL 2017 Change (%) Change (%)
H1 H2 2016 H1 H1 2016 - H1 2017 H2 2016 - H1 2017
BDCBD 26,455 14,184 40,639 16,744 -36.7% 18.0%
RBD 18,888 18,920 37,808 17,569 -7.0% -7.1%
RC 46,821 38,935 85,756 53,403 14.1% 37.2%
DEC 38,094 56,802 94,896 88,549 132.4% 55.9%
OUT 30,357 40,826 71,183 31,388 3.4% -23.1%
TOTAL 160,615 169,667 330,282 207,653 29.3% 22.4%
-5,0%
-4,0%
-3,0%
-2,0%
-1,0%
0,0%
1,0%
2,0%
3,0%
4,0%
5,0%
6,0%
0
50.000
100.000
150.000
200.000
250.000
300.000
350.000
400.000
1996 1997 1998 1999 2000 2001 2002 2003 2004 2005 2006 2007 2008 2009 2010 2011 2012 2013 2014 2015 2016 2017 *2018
Volume of New Supply GDP Growth Spain
28 | Market Report. July 2017
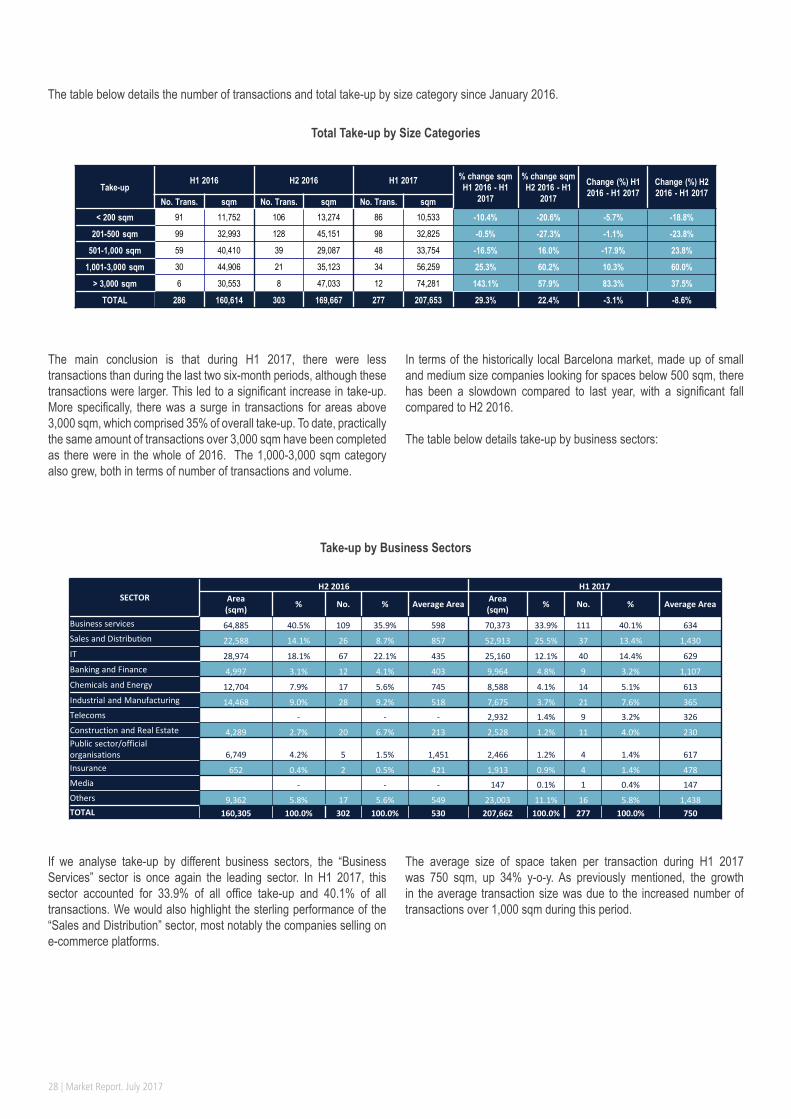
The table below details the number of transactions and total take-up by size category since January 2016.
Total Take-up by Size Categories
The main conclusion is that during H1 2017, there were less transactions than during the last two six-month periods, although these transactions were larger. This led to a significant increase in take-up. More specifically, there was a surge in transactions for areas above 3,000 sqm, which comprised 35% of overall take-up. To date, practically the same amount of transactions over 3,000 sqm have been completed as there were in the whole of 2016. The 1,000-3,000 sqm category also grew, both in terms of number of transactions and volume.
In terms of the historically local Barcelona market, made up of small and medium size companies looking for spaces below 500 sqm, there has been a slowdown compared to last year, with a significant fall compared to H2 2016.
The table below details take-up by business sectors:
Take-up by Business Sectors
If we analyse take-up by different business sectors, the “Business Services” sector is once again the leading sector. In H1 2017, this sector accounted for 33.9% of all office take-up and 40.1% of all transactions. We would also highlight the sterling performance of the “Sales and Distribution” sector, most notably the companies selling on e-commerce platforms.
The average size of space taken per transaction during H1 2017 was 750 sqm, up 34% y-o-y. As previously mentioned, the growth in the average transaction size was due to the increased number of transactions over 1,000 sqm during this period.
Take-upH1 2016 H2 2016 H1 2017 % change sqm
H1 2016 - H1 2017
% change sqm H2 2016 - H1
2017
Change (%) H1 2016 - H1 2017
Change (%) H2 2016 - H1 2017
No. Trans. sqm No. Trans. sqm No. Trans. sqm< 200 sqm 91 11,752 106 13,274 86 10,533 -10.4% -20.6% -5.7% -18.8%
201-500 sqm 99 32,993 128 45,151 98 32,825 -0.5% -27.3% -1.1% -23.8%
501-1,000 sqm 59 40,410 39 29,087 48 33,754 -16.5% 16.0% -17.9% 23.8%
1,001-3,000 sqm 30 44,906 21 35,123 34 56,259 25.3% 60.2% 10.3% 60.0%
> 3,000 sqm 6 30,553 8 47,033 12 74,281 143.1% 57.9% 83.3% 37.5%
TOTAL 286 160,614 303 169,667 277 207,653 29.3% 22.4% -3.1% -8.6%
SECTORH2 2016 H1 2017
Area(sqm) % No. % Average Area Area
(sqm) % No. % Average Area
Business services 64,885 40.5% 109 35.9% 598 70,373 33.9% 111 40.1% 634Sales and Distribution 22,588 14.1% 26 8.7% 857 52,913 25.5% 37 13.4% 1,430IT 28,974 18.1% 67 22.1% 435 25,160 12.1% 40 14.4% 629Banking and Finance 4,997 3.1% 12 4.1% 403 9,964 4.8% 9 3.2% 1,107Chemicals and Energy 12,704 7.9% 17 5.6% 745 8,588 4.1% 14 5.1% 613Industrial and Manufacturing 14,468 9.0% 28 9.2% 518 7,675 3.7% 21 7.6% 365Telecoms 0 - 0 - - 2,932 1.4% 9 3.2% 326Construction and Real Estate 4,289 2.7% 20 6.7% 213 2,528 1.2% 11 4.0% 230Public sector/official organisations 6,749 4.2% 5 1.5% 1,451 2,466 1.2% 4 1.4% 617Insurance 652 0.4% 2 0.5% 421 1,913 0.9% 4 1.4% 478Media 0 - 0 - - 147 0.1% 1 0.4% 147Others 9,362 5.8% 17 5.6% 549 23,003 11.1% 16 5.8% 1,438TOTAL 160,305 100.0% 302 100.0% 530 207,662 100.0% 277 100.0% 750
AGUIRRE NEWMAN | 29
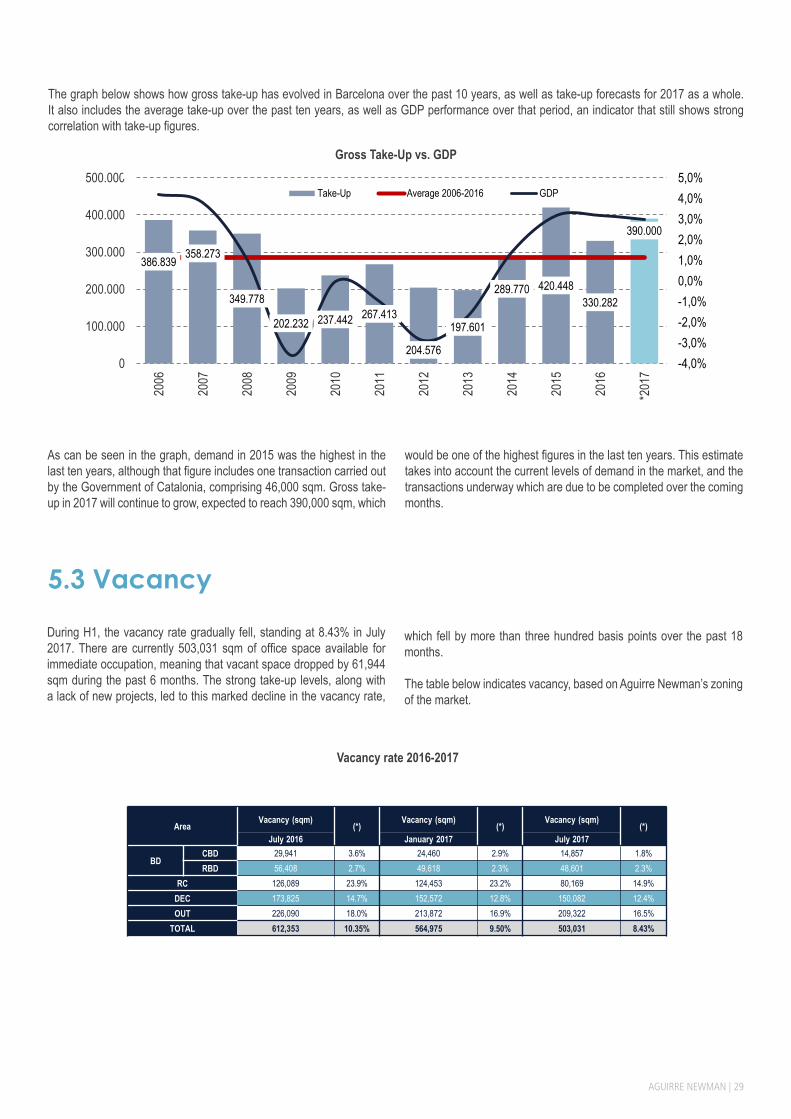
The graph below shows how gross take-up has evolved in Barcelona over the past 10 years, as well as take-up forecasts for 2017 as a whole. It also includes the average take-up over the past ten years, as well as GDP performance over that period, an indicator that still shows strong correlation with take-up figures.
Gross Take-Up vs. GDP
As can be seen in the graph, demand in 2015 was the highest in the last ten years, although that figure includes one transaction carried out by the Government of Catalonia, comprising 46,000 sqm. Gross take-up in 2017 will continue to grow, expected to reach 390,000 sqm, which
would be one of the highest figures in the last ten years. This estimate takes into account the current levels of demand in the market, and the transactions underway which are due to be completed over the coming months.
5.3 Vacancy
During H1, the vacancy rate gradually fell, standing at 8.43% in July 2017. There are currently 503,031 sqm of office space available for immediate occupation, meaning that vacant space dropped by 61,944 sqm during the past 6 months. The strong take-up levels, along with a lack of new projects, led to this marked decline in the vacancy rate,
which fell by more than three hundred basis points over the past 18 months.
The table below indicates vacancy, based on Aguirre Newman’s zoning of the market.
Vacancy rate 2016-2017
AreaVacancy (sqm)
(*)Vacancy (sqm)
(*)Vacancy (sqm)
(*)July 2016 January 2017 July 2017
BDCBD 29,941 3.6% 24,460 2.9% 14,857 1.8%RBD 56,408 2.7% 49,618 2.3% 48,601 2.3%
RC 126,089 23.9% 124,453 23.2% 80,169 14.9%DEC 173,825 14.7% 152,572 12.8% 150,082 12.4%OUT 226,090 18.0% 213,872 16.9% 209,322 16.5%
TOTAL 612,353 10.35% 564,975 9.50% 503,031 8.43%
386.839358.273
349.778
202.232 237.442 267.413
204.576
197.601
289.770 420.448330.282
390.000
-4,0%-3,0%-2,0%-1,0%0,0%1,0%2,0%3,0%4,0%5,0%
0
100.000
200.000
300.000
400.000
500.00020
06
2007
2008
2009
2010
2011
2012
2013
2014
2015
2016
*201
7
Take-Up Average 2006-2016 GDP
30 | Market Report. July 2017
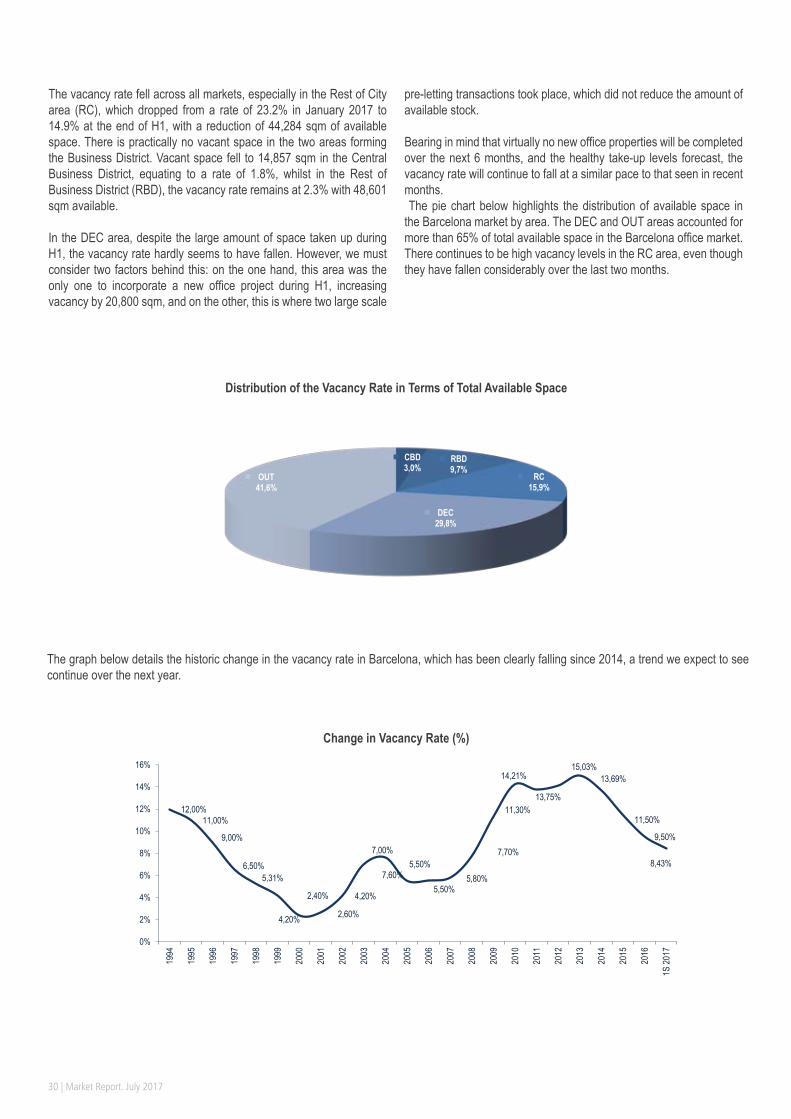
The vacancy rate fell across all markets, especially in the Rest of City area (RC), which dropped from a rate of 23.2% in January 2017 to 14.9% at the end of H1, with a reduction of 44,284 sqm of available space. There is practically no vacant space in the two areas forming the Business District. Vacant space fell to 14,857 sqm in the Central Business District, equating to a rate of 1.8%, whilst in the Rest of Business District (RBD), the vacancy rate remains at 2.3% with 48,601 sqm available.
In the DEC area, despite the large amount of space taken up during H1, the vacancy rate hardly seems to have fallen. However, we must consider two factors behind this: on the one hand, this area was the only one to incorporate a new office project during H1, increasing vacancy by 20,800 sqm, and on the other, this is where two large scale
pre-letting transactions took place, which did not reduce the amount of available stock.
Bearing in mind that virtually no new office properties will be completed over the next 6 months, and the healthy take-up levels forecast, the vacancy rate will continue to fall at a similar pace to that seen in recent months. The pie chart below highlights the distribution of available space in the Barcelona market by area. The DEC and OUT areas accounted for more than 65% of total available space in the Barcelona office market. There continues to be high vacancy levels in the RC area, even though they have fallen considerably over the last two months.
Distribution of the Vacancy Rate in Terms of Total Available Space
The graph below details the historic change in the vacancy rate in Barcelona, which has been clearly falling since 2014, a trend we expect to see continue over the next year.
Change in Vacancy Rate (%)
12,00%11,00%
9,00%
6,50%5,31%
4,20%
2,40%
2,60%
4,20%
7,00%
7,60%5,50%
5,50%5,80%
7,70%
11,30%
14,21%
13,75%
15,03%13,69%
11,50%
9,50%
8,43%
0%
2%
4%
6%
8%
10%
12%
14%
16%
1994
1995
1996
1997
1998
1999
2000
2001
2002
2003
2004
2005
2006
2007
2008
2009
2010
2011
2012
2013
2014
2015
2016
1S 20
17
CBD3,0%
RBD9,7%
RC15,9%
DEC29,8%
OUT41,6%
AGUIRRE NEWMAN | 31
5.4 Price levelsDuring H1 2017, average and maximum rental prices generally increased across all areas. That said, the greatest increases were in the prime properties in the best areas, and this was reflected in the significant increase in maximum rents across all areas over the last 12 months. Generally speaking, the increase in average rents stood at around 5.0% compared to the previous half, and almost 5.6% compared to rents one year ago. The highest increases in average rents over the past 12 months were registered in the Central Business District (CBD) and the Decentralised Area (DEC).
The maximum rent reached €22.75 per sqm/month, although some properties could close 2017 in the region of €23.00 per sqm/month. Elsewhere, the average rent in the CBD reached €18.23 per sqm/month, the highest figure achieved since 2008. Average and maximum prices in the Business District (CBD + RBD) will continue to grow significantly, as a result of the low vacancy rate, and the needs of certain companies to move into offices in these markets.
In the DEC market, there was a major increase in maximum rents throughout last year, reaching €18.50 per sqm/month for the top properties in the Glòries area, within the 22@ district. Top rents in this area stand at similar levels to the RBD, and just below the average rental levels of the CBD. The Glòries area is establishing itself as a new Business District, attracting companies who are looking to move into state-of-the-art, prestigious properties, in excellent locations, with good public transport links and services nearby.
In the OUT market, we can distinguish between two different situations. On the one hand, in Sant Cugat, there is a low vacancy rate and rental prices are starting to tick up. There is a local demand from companies in the area who are looking for more space. The other situation is found in towns across Baix Llobregat, where market recovery has been timid, and so rental prices are changing at a much slower pace.
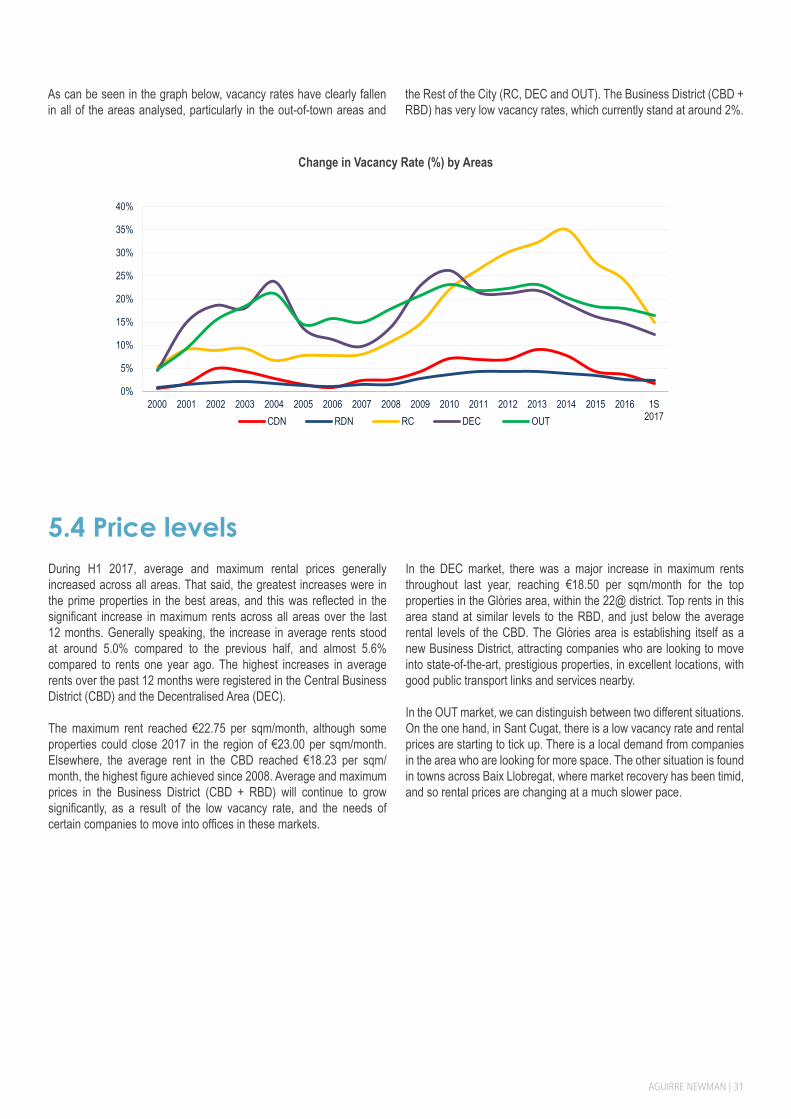
As can be seen in the graph below, vacancy rates have clearly fallen in all of the areas analysed, particularly in the out-of-town areas and
the Rest of the City (RC, DEC and OUT). The Business District (CBD + RBD) has very low vacancy rates, which currently stand at around 2%.
Change in Vacancy Rate (%) by Areas
0%
5%
10%
15%
20%
25%
30%
35%
40%
2000 2001 2002 2003 2004 2005 2006 2007 2008 2009 2010 2011 2012 2013 2014 2015 2016 1S2017CDN RDN RC DEC OUT
32 | Market Report. July 2017
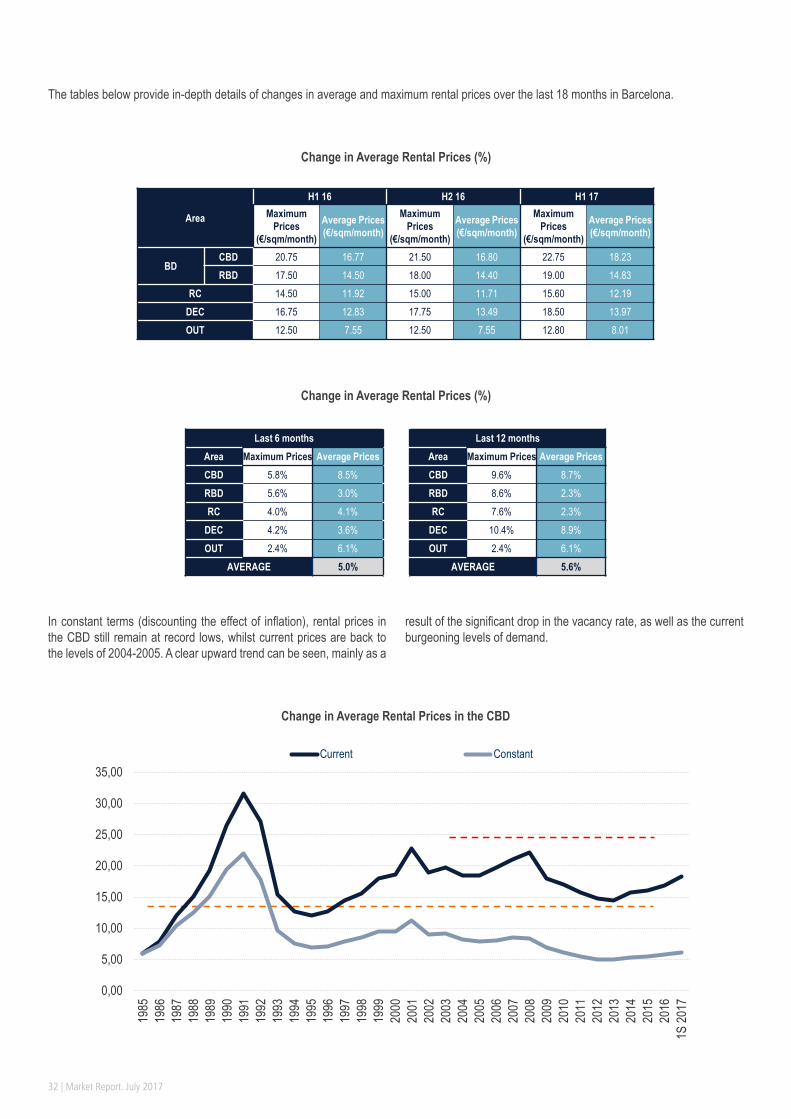
The tables below provide in-depth details of changes in average and maximum rental prices over the last 18 months in Barcelona.
Change in Average Rental Prices (%)
Change in Average Rental Prices (%)
In constant terms (discounting the effect of inflation), rental prices in the CBD still remain at record lows, whilst current prices are back to the levels of 2004-2005. A clear upward trend can be seen, mainly as a
result of the significant drop in the vacancy rate, as well as the current burgeoning levels of demand.
Change in Average Rental Prices in the CBD
Area
H1 16 H2 16 H1 17Maximum
Prices (€/sqm/month)
Average Prices (€/sqm/month)
Maximum Prices
(€/sqm/month)
Average Prices (€/sqm/month)
Maximum Prices
(€/sqm/month)
Average Prices (€/sqm/month)
BDCBD 20.75 16.77 21.50 16.80 22.75 18.23RBD 17.50 14.50 18.00 14.40 19.00 14.83
RC 14.50 11.92 15.00 11.71 15.60 12.19DEC 16.75 12.83 17.75 13.49 18.50 13.97OUT 12.50 7.55 12.50 7.55 12.80 8.01
Last 6 months Last 12 monthsArea Maximum Prices Average Prices Area Maximum Prices Average PricesCBD 5.8% 8.5% CBD 9.6% 8.7%RBD 5.6% 3.0% RBD 8.6% 2.3%RC 4.0% 4.1% RC 7.6% 2.3%
DEC 4.2% 3.6% DEC 10.4% 8.9%OUT 2.4% 6.1% OUT 2.4% 6.1%
AVERAGE 5.0% AVERAGE 5.6%
0,00
5,00
10,00
15,00
20,00
25,00
30,00
35,00
1985
1986
1987
1988
1989
1990
1991
1992
1993
1994
1995
1996
1997
1998
1999
2000
2001
2002
2003
2004
2005
2006
2007
2008
2009
2010
2011
2012
2013
2014
2015
2016
1S 20
17
Current Constant

AGUIRRE NEWMAN | 33

34 | Market Report. July 2017
Investment Market
AGUIRRE NEWMAN | 35
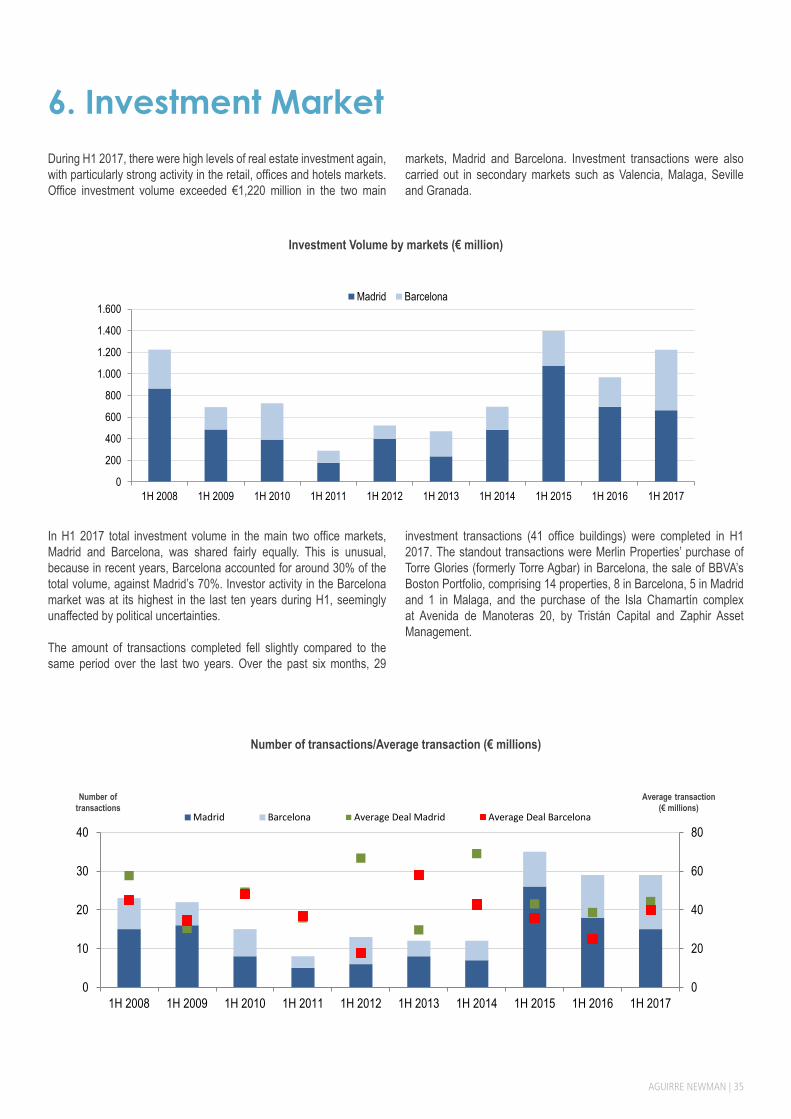
6. Investment MarketDuring H1 2017, there were high levels of real estate investment again, with particularly strong activity in the retail, offices and hotels markets. Office investment volume exceeded €1,220 million in the two main
markets, Madrid and Barcelona. Investment transactions were also carried out in secondary markets such as Valencia, Malaga, Seville and Granada.
Investment Volume by markets (€ million)
In H1 2017 total investment volume in the main two office markets, Madrid and Barcelona, was shared fairly equally. This is unusual, because in recent years, Barcelona accounted for around 30% of the total volume, against Madrid’s 70%. Investor activity in the Barcelona market was at its highest in the last ten years during H1, seemingly unaffected by political uncertainties. The amount of transactions completed fell slightly compared to the same period over the last two years. Over the past six months, 29
investment transactions (41 office buildings) were completed in H1 2017. The standout transactions were Merlin Properties’ purchase of Torre Glories (formerly Torre Agbar) in Barcelona, the sale of BBVA’s Boston Portfolio, comprising 14 properties, 8 in Barcelona, 5 in Madrid and 1 in Malaga, and the purchase of the Isla Chamartín complex at Avenida de Manoteras 20, by Tristán Capital and Zaphir Asset Management.
Number of transactions/Average transaction (€ millions)
0
200
400
600
800
1.000
1.200
1.400
1.600
1H 2008 1H 2009 1H 2010 1H 2011 1H 2012 1H 2013 1H 2014 1H 2015 1H 2016 1H 2017
Madrid Barcelona
Number of transactions
Average transaction(€ millions)
0
20
40
60
80
0
10
20
30
40
1H 2008 1H 2009 1H 2010 1H 2011 1H 2012 1H 2013 1H 2014 1H 2015 1H 2016 1H 2017
Madrid Barcelona Average Deal Madrid Average Deal Barcelona
36 | Market Report. July 2017
Real estate investment conditions continue to be very healthy in the office market. From a macro perspective, the outlook for economic growth in 2017 is far better than the initial forecasts, and this situation is boosting confidence among investors with an interest in Spain. At the same time, there is still a high level of liquidity in the market due to global expansive monetary policy, although this does look set to
end in the short term. In terms of microeconomics, the office market is showing robust fundamentals, with demand and rents recovering against a backdrop of gradually (and in some cases rapidly) falling vacancy rates. Below we detail the main market characteristics of H1 2017.
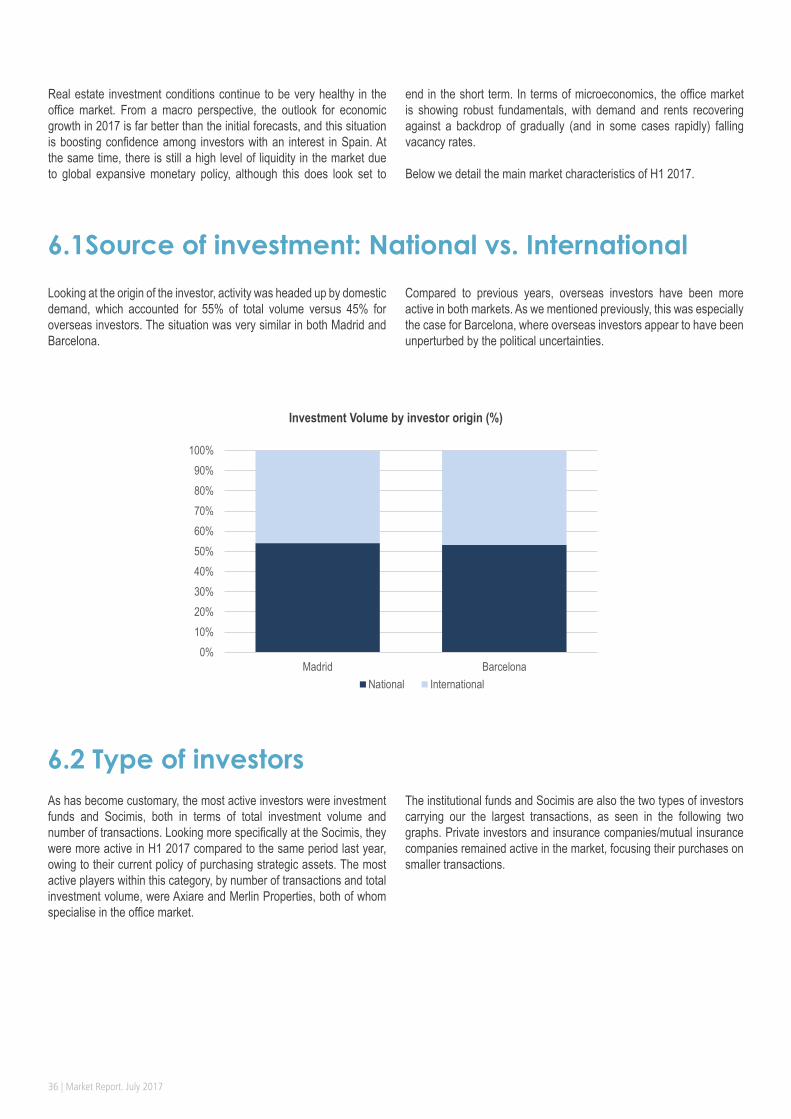
Investment Volume by investor origin (%)
Looking at the origin of the investor, activity was headed up by domestic demand, which accounted for 55% of total volume versus 45% for overseas investors. The situation was very similar in both Madrid and Barcelona.
Compared to previous years, overseas investors have been more active in both markets. As we mentioned previously, this was especially the case for Barcelona, where overseas investors appear to have been unperturbed by the political uncertainties.
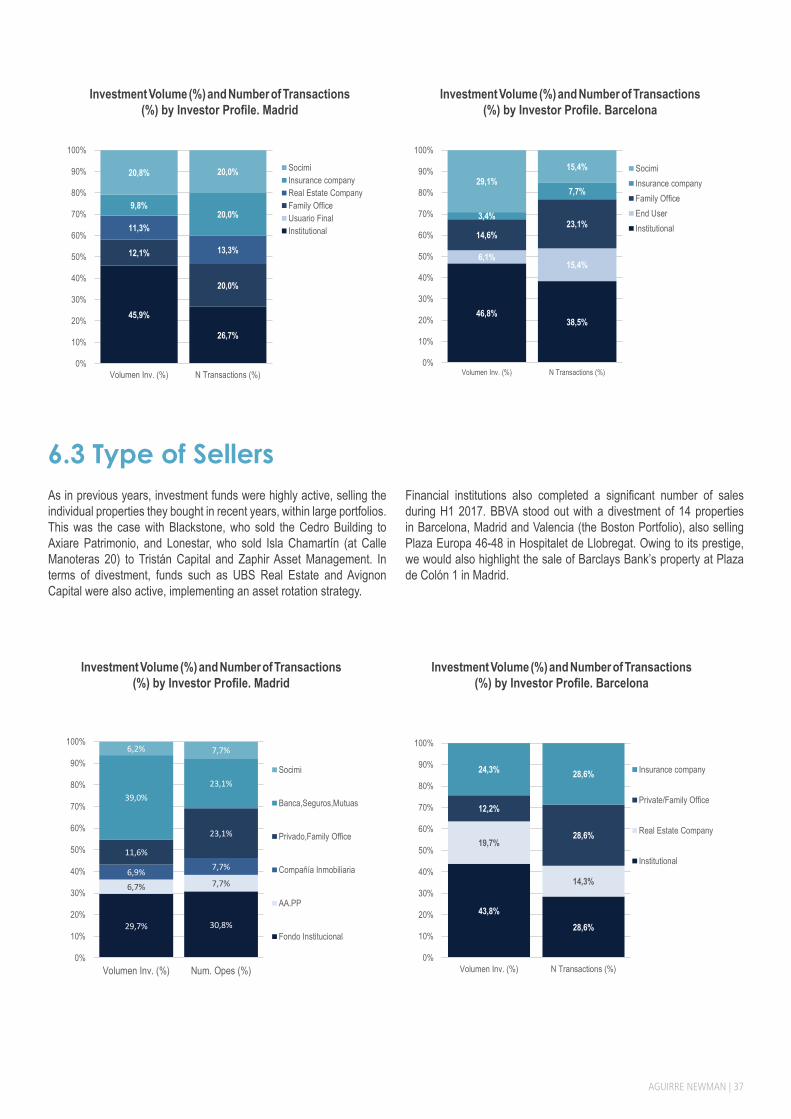
As has become customary, the most active investors were investment funds and Socimis, both in terms of total investment volume and number of transactions. Looking more specifically at the Socimis, they were more active in H1 2017 compared to the same period last year, owing to their current policy of purchasing strategic assets. The most active players within this category, by number of transactions and total investment volume, were Axiare and Merlin Properties, both of whom specialise in the office market.
The institutional funds and Socimis are also the two types of investors carrying our the largest transactions, as seen in the following two graphs. Private investors and insurance companies/mutual insurance companies remained active in the market, focusing their purchases on smaller transactions.
6.1Source of investment: National vs. International
6.2 Type of investors
0%10%20%30%40%50%60%70%80%90%
100%
Madrid BarcelonaNational International
AGUIRRE NEWMAN | 37
Investment Volume (%) and Number of Transactions (%) by Investor Profile. Madrid
Investment Volume (%) and Number of Transactions (%) by Investor Profile. Barcelona
As in previous years, investment funds were highly active, selling the individual properties they bought in recent years, within large portfolios. This was the case with Blackstone, who sold the Cedro Building to Axiare Patrimonio, and Lonestar, who sold Isla Chamartín (at Calle Manoteras 20) to Tristán Capital and Zaphir Asset Management. In terms of divestment, funds such as UBS Real Estate and Avignon Capital were also active, implementing an asset rotation strategy.
Financial institutions also completed a significant number of sales during H1 2017. BBVA stood out with a divestment of 14 properties in Barcelona, Madrid and Valencia (the Boston Portfolio), also selling Plaza Europa 46-48 in Hospitalet de Llobregat. Owing to its prestige, we would also highlight the sale of Barclays Bank’s property at Plaza de Colón 1 in Madrid.
6.3 Type of Sellers
Investment Volume (%) and Number of Transactions (%) by Investor Profile. Madrid
Investment Volume (%) and Number of Transactions (%) by Investor Profile. Barcelona
29,7% 30,8%
6,7% 7,7%6,9% 7,7%
11,6%
23,1%
39,0%23,1%
6,2% 7,7%
0%
10%
20%
30%
40%
50%
60%
70%
80%
90%
100%
Volumen Inv. (%) Num. Opes (%)
Socimi
Banca,Seguros,Mutuas
Privado,Family Office
Compañía Inmobiliaria
AA.PP
Fondo Institucional
45,9%
26,7%
12,1%
20,0%
11,3%
13,3%
9,8%20,0%
20,8% 20,0%
0%
10%
20%
30%
40%
50%
60%
70%
80%
90%
100%
Volumen Inv. (%) N Transactions (%)
SocimiInsurance companyReal Estate CompanyFamily OfficeUsuario FinalInstitutional
46,8%38,5%
6,1%15,4%
14,6%23,1%
3,4%
7,7%29,1%
15,4%
0%
10%
20%
30%
40%
50%
60%
70%
80%
90%
100%
Volumen Inv. (%) N Transactions (%)
SocimiInsurance companyFamily OfficeEnd UserInstitutional
43,8%28,6%
19,7%
14,3%
12,2%
28,6%
24,3% 28,6%
0%
10%
20%
30%
40%
50%
60%
70%
80%
90%
100%
Volumen Inv. (%) N Transactions (%)
Insurance company
Private/Family Office
Real Estate Company
Institutional
38 | Market Report. July 2017
Number of properties sold by area. Madrid (%) Number of properties sold by area. Barcelona (%)
The main national and international banks that specialise in financing real estate investment transactions continued to lend in H1 2017. The general terms offered by the market put the LTV between 55-60%, with maximums of 70% for the prime market, and Euribor spreads from 175 basis points. The yield compression that started at the end of 2013 in prime markets, and that followed suit in the remaining markets in 2014, became more stable over recent months in Madrid. It is unlikely that yields will tighten further in the Madrid Business District (CBD and RBD), given the sharp decline which has already occurred, and the fact that we are already at record lows. On the other hand, we could see greater declines in the out-of-town markets (DEC and OUT), if take-up and rents increase as significantly as they have in other areas. In the Barcelona market, the initial yield has continued to gradually tighten over the last few months. With a greater margin of adjustment compared to Madrid, yields have continued to be pushed down by high levels of investor interest and healthy performances in terms of take-up, rental prices and vacancy rates.
The spread versus the German 10-year bond yield remains very high, although it fell slightly compared to the last two years. Over the past 20 years, the average yield spread for the CBD market in Madrid and Barcelona versus German bonds has been 222 bp and 252 bp respectively. The spread is currently much higher, standing at 295 bp in Madrid and 370 bp in Barcelona. The European Central Bank, pursuing the route taken by the FED, is starting to hint at a possible hardening of monetary policy in 2018. This would initially consist of a gradual tapering of liquidity injections, which the ECB has been doing already via debt acquisition. Towards the end of 2018, the current unique monetary situation would then begin to return to normal, with some increases in interest rates. Although interest rates will start to rise in the coming months, the real estate yield has a wide margin to stay at its current level, and may even fall in the out-of-town markets, if the spread between interest rates and the yield tends towards its historical average.
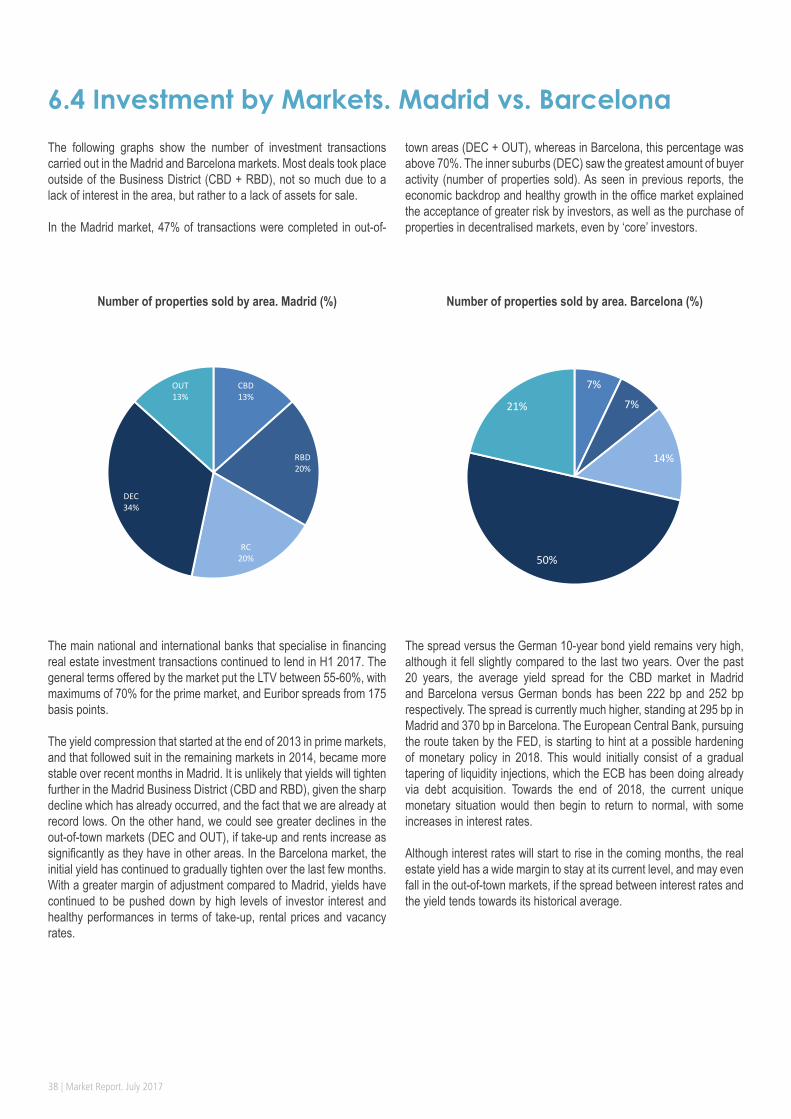
The following graphs show the number of investment transactions carried out in the Madrid and Barcelona markets. Most deals took place outside of the Business District (CBD + RBD), not so much due to a lack of interest in the area, but rather to a lack of assets for sale. In the Madrid market, 47% of transactions were completed in out-of-
town areas (DEC + OUT), whereas in Barcelona, this percentage was above 70%. The inner suburbs (DEC) saw the greatest amount of buyer activity (number of properties sold). As seen in previous reports, the economic backdrop and healthy growth in the office market explained the acceptance of greater risk by investors, as well as the purchase of properties in decentralised markets, even by ‘core’ investors.
6.4 Investment by Markets. Madrid vs. Barcelona
CBD13%
RBD20%
RC20%
DEC34%
OUT13%
7%
7%
14%
50%
21%
AGUIRRE NEWMAN | 39
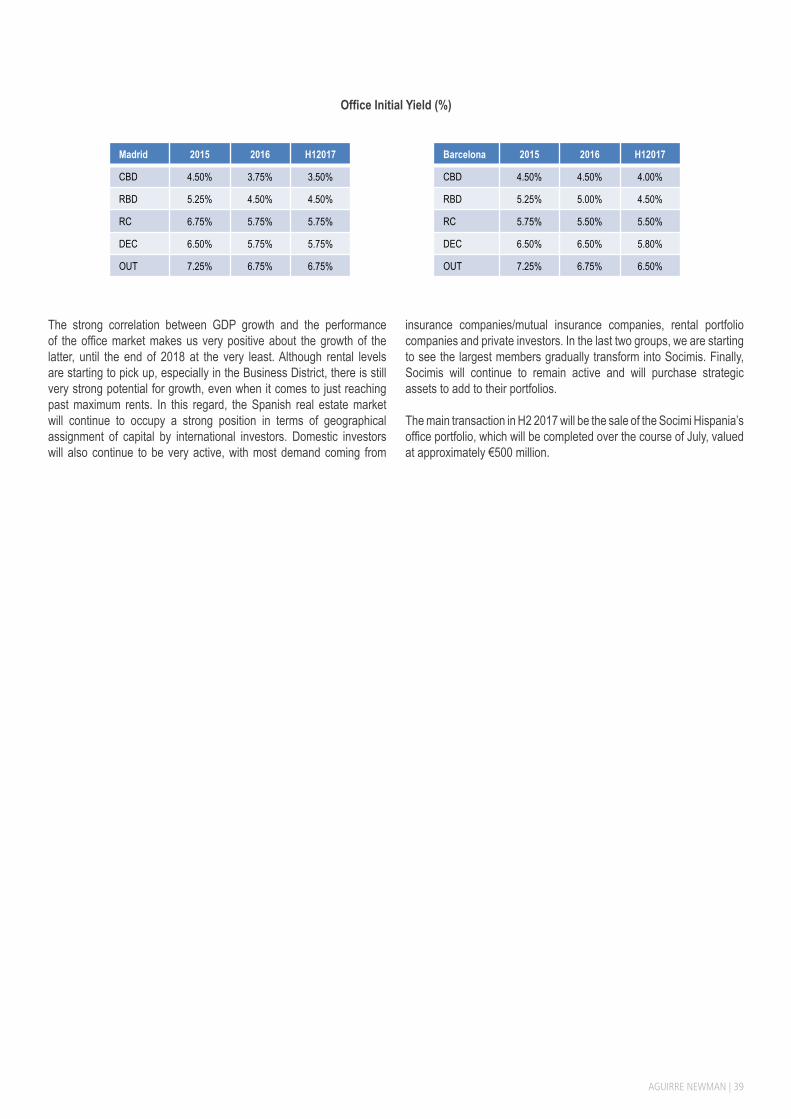
Office Initial Yield (%)
The strong correlation between GDP growth and the performance of the office market makes us very positive about the growth of the latter, until the end of 2018 at the very least. Although rental levels are starting to pick up, especially in the Business District, there is still very strong potential for growth, even when it comes to just reaching past maximum rents. In this regard, the Spanish real estate market will continue to occupy a strong position in terms of geographical assignment of capital by international investors. Domestic investors will also continue to be very active, with most demand coming from
insurance companies/mutual insurance companies, rental portfolio companies and private investors. In the last two groups, we are starting to see the largest members gradually transform into Socimis. Finally, Socimis will continue to remain active and will purchase strategic assets to add to their portfolios. The main transaction in H2 2017 will be the sale of the Socimi Hispania’s office portfolio, which will be completed over the course of July, valued at approximately €500 million.
Madrid 2015 2016 H12017
CBD 4.50% 3.75% 3.50%
RBD 5.25% 4.50% 4.50%
RC 6.75% 5.75% 5.75%
DEC 6.50% 5.75% 5.75%
OUT 7.25% 6.75% 6.75%
Barcelona 2015 2016 H12017
CBD 4.50% 4.50% 4.00%
RBD 5.25% 5.00% 4.50%
RC 5.75% 5.50% 5.50%
DEC 6.50% 6.50% 5.80%
OUT 7.25% 6.75% 6.50%

40 | Market Report. July 2017
AGUIRRE NEWMAN | 41
Aguirre Newman MadridC/ General Lacy, 23
28045 - Madrid Tel +34 91 319 13 14
Aguirre Newman BarcelonaAvenida Diagonal, 615
08028 - BarcelonaTel. +34 93 439 54 54
Aguirre Newman MálagaC/ Puerta del Mar, 18, 8º-D
29005 - MálagaTel. +34 952 062 782
Aguirre Newman LisboaPraça Marquês de Pombal, nº 16-7º
1250 - 163 LisboaTel. +351 21 313 9000
Aguirre Newman OportoPraça Mouzinho de Albuquerque, 113 – 5º
4100-359 PortoTelef. +351 22 120 1387
Aguirre Newman MéxicoMonte Pelvoux 120, Piso 3
Lomas de Chapultepec, México D.F.Tel. +52 (55) 5202 2045
Aguirre Newman ColombiaCalle 93 # 11 A - 11
Of. 602, Bogotá D.C.Tel: +57 1 7957498
Pelayo Barroso Director of Market Research and Analysis+34 91 319 13 [email protected]
Ángel EstebaranzDirector of Business Space+34 91 319 13 [email protected]
Gonzalo Ladrón de GuevaraDirector of Investment Offices+34 91 319 13 [email protected]
Contact

42 | Market Report. July 2017
Madrid | Barcelona | Málaga | Lisbon | Porto | Mexico City | Bogotá