Embed Size (px)
Citation preview


Office Location:
Nature Conservation Foundation and
Holématthi Nature Foundation
135, 14th
Main, 30th
Cross,
Banashankari 2nd
Stage,
Bengaluru – 560 070
Karnataka, India
TeleFax: +91-80-2671 6897
Email: [email protected]
Website: www.ncf-india.org
Citation
Gubbi, S., Menon, A.M., Suthar, S, & Poornesha, H.C. (2021) Variation in leopard density
and abundance: Multi-year study in Cauvery Wildlife Sanctuary, Nature Conservation
Foundation, Mysore and Holématthi Nature Foundation, Bengaluru, India.
Contents
Introduction 1
Study Area 1
Methodology 5
Results 8
Discussion 12
References 17
Appendices 22

Acknowledgements
We sincerely thank the Karnataka Forest Department for permissions to carry out the study in
Cauvery Wildlife Sanctuary and all the support provided by them. We are grateful to
Shri. Vasantha Reddy K.V., Dr.Ramesh Kumar and Dr. S. Ramesh, the former Deputy
Conservator of Forests and Shri. H.C. Girish, the present Deputy Conservator of Forests for
all the cooperation during our work.
We would like to acknowledge the support provided by all the Assistant Conservator of
Forests and Range Forest Officers. All the Deputy Range Forest Officers, Forest Guards and
Watchers have proved to be the greatest source of assistance and we are thankful to them.
1
Introduction
The leopard (Panthera pardus) is a geographically widespread member of the Felidae family,
and occupies a broad ecological niche from rainforests in the tropics to open grasslands to
deserts to islands (Stein et al. 2020). Due to their high tolerance for human pressure and
catholic diet, they have adapted to human-dominated landscapes and around large
metropolitan cities (Hayward et al. 2006; Athreya et al. 2013; Odden et al. 2014; Bhatia et al.
2013). This also makes them a highly conflict-prone species.
Out of the nine discrete populations or subspecies recognised by phylogenetic analysis of
mitochondrial DNA sequences and polymorphic microsatellite loci, the one present in India
is Panthera pardus fusca (Uphyrkina et al. 2001). Globally, the leopard falls under the
‘Vulnerable’ category as classified by the IUCN Red List of Threatened Species (Stein et
al. 2020). At a national level, they are listed as a Schedule 1 species under the Wildlife
Protection Act 1972 in India, which provides the highest level of protection.
In order to observe temporal changes in population sizes, along with baseline population
estimates, systematic monitoring of the population during regular intervals needs to be
carried out. Systematic long-term monitoring studies help identify spatial and temporal trends
in population data (Yoccoz et al. 2001). Variables that contribute to the increasing or
decreasing trend can be identified which will either help evaluate the impact of existing
management practices or implement new and more effective management practices (Clutton-
Brock & Sheldon 2010; Campbell et al. 2011; Caro 2011; Henschel & Ray 2015; Ramesh et
al. 2017). Additionally, more detailed insight into population dynamics can be achieved
through long-term monitoring of wildlife (Pelton & van Manen 1996). Even though there are
a few population studies providing baseline information for leopards from within PAs, other
forested and human dominated habitats (Harihar et al. 2009; Athreya et al. 2013; Borah et
al. 2014; Gubbi et al. 2017a, 2019b, 2019c, 2020d, 2021a), there is little to no data on long-
term monitoring of leopard populations over temporal scales.
Such long-term monitoring can also help in conservation management of leopards that are
exposed to various threats that include habitat loss and fragmentation, retaliatory killing,
vehicular collisions, poaching, depletion of prey and other unconventional threats (Gubbi et
al. 2014a; Jacobson et al. 2016; Gubbi et al. 2017a, 2019a, 2021c).
This report provides the results of a long-term population monitoring study carried in
Cauvery Wildlife Sanctuary (CWS) in southern Karnataka from 2014 to 2020.
The main objectives of the study were
To estimate baseline population abundance and density of leopards
To monitor long-term variation in population abundance and density of leopards
To observe difference in detection rate between male and female leopards
To establish the Relative Abundance Index (RAI) of prey species
Study Area
Cauvery Wildlife Sanctuary (CWS), located at the confluence of the Eastern and Western
Ghats, was declared a wildlife sanctuary in 1987 covering an area of 527 km2, then expanded
to 1027.5 km2 in 2011 and furthermore to 1080.9 km
2 in 2019. It lies within three districts of
Karnataka, namely, Ramanagara, Chamrajanagara and Mandya districts in Kanakapura,
2
Kollegala and Malavalli Taluk respectively. There are seven administrative ranges, which
includes Halguru, Sangama, Mugguru, Kothanur, Hanur, Cowdalli and Gopinatham.
CWS, named after the river Cauvery flowing for 105 km from west to east through the
protected area, is an integral part of the contiguous landscape which forms the confluence
between the Eastern and Western Ghats. Apart from the river Cauvery, Arkavathy and
Shimsha are important tributaries of Cauvery which are permanent water sources that flow
through CWS. The northern boundary of CWS is connected with Bannerghatta National Park
(BNP, 260.5 km2) and in the south it connects to Malai Mahadeshwara Wildlife Sanctuary
(MM Hills, 906.1 km2), which further joins with Biligiri Rangaswamy Temple Tiger Reserve
(574.8 km2) and Sathyamangalam Tiger Reserve (BRT TR, 1411.6 km
2), forming a
contiguous forest area of 4234 km2
(Map 1). CWS is further connected by Reserved Forests
in Tamil Nadu to North Cauvery Wildlife Sanctuary (523.1 km2) also forming a part of this
contiguous landscape.
It is typically characterised by woodland savanna, dry deciduous and riparian vegetation but
also has thorny scrub, moist deciduous, bamboo forest and semi-evergreen vegetation (Reddy
2015; Gubbi et al. 2017b). Map 2 depicts the vegetation structure and other physical features
of CWS. The altitude of the CWS ranges between 254 and 1514 m above mean sea level.
Annually, the average rainfall of CWS varies between 750-800 mm. The temperature ranges
between 15 to 42°C (Reddy 2015).
There are 35 village enclosures within the sanctuary and 72 villages within a two km radius
around the sanctuary (Reddy 2015; MoEFCC 2017). The human density within the park is
about 18.3 individuals per km2. The people living in the region mostly belong to the Gounder,
Lambani, and Soliga communities (Reddy 2015). They are largely involved in rainfed
agriculture and animal husbandry; and they are dependent on the forest for fuel wood, fodder
and other non-timber forest products.
Location coordinates
Latitude: 11°56'55.45"N to 12°24'36.70"N
Longitude: 77° 9'35.13"E to 77°46'40.60"E
Figure 1. Cauvery Wildlife Sanctuary is characterised by dry deciduous and riparian vegetation but
also have thorny scrub, moist deciduous, bamboo forest and evergreen shola vegetation
3
Flora
The various forest and vegetation types in CWS includes southern tropical dry deciduous,
woodland savanna, moist deciduous, mixed deciduous evergreen shola and riverine habitat.
Some common dry deciduous species such as Albizzia amara, Acacia leucophloea,
Choroxylon swietenia, Azadirachta indica, Tamarindus indica, Emblica officinalis,
Anogeissus latifolia, Sapindus emarginatus, Wrightia tinctoria, Terminalia chebula, Zizyphus
xylopyrus are present at lower elevations. Hardwickia binata occurs in areas with elevation
below 762 m. Moist deciduous forests are usually found above 900 m in areas of
Gopinatham range and some common species are Pterocarpus marsupium, Tectona grandis,
Mangifera indica. Dalbergia latifolia, Adina cordifolia, Vitex altissima, Anogeissus latifolia
and Bridelia retusa. The bamboo forests present in certain ranges are composed of two main
species i.e Dendrocalamus strictus and Bambusa arundinacea.The riverine vegetation is
dominated by Terminalia arjuna, Tamarindus indica, Pongamia glabra, Vitex altissima,
Eugenia jamboolina, Mytragaina spp. and a few species of Ficus. Sunil et al. (2019) suggests
that Terminalia arjuna is a key stone species of riparian habitats in south India as higher
native plant diversity and soil carbon content was observed under its canopy as opposed to
areas devoid of T. arjuna where the dominance of non-native species was evident. The
evergreen shola forests cover only about 3 per cent of the sanctuary. The invasive Lantana
camara and Eupatorium are present in some parts of the sanctuary.
Fauna
CWS harbours large mammals including tiger (Panthera tigris), leopard (Panthera pardus
fusca), dhole (Cuon alpinus), jackal (Canis aureus), sloth bear (Melursus ursinus), elephant
(Elephas maximus), gaur (Bos gaurus), wild pig (Sus scrofa), sambar (Rusa unicolor), chital
(Axis axis), barking deer (Muntiacus muntjak), four-horned antelope (Tetracerus
quadricornis), mouse deer (Moschiola indica), tufted grey langur(Semnopithecus priam),
bonnet macaque (Macaca radiata), black-naped hare (Lepus nigricollis), Indian crested
porcupine (Hystrix indica), the endangered Indian pangolin (Manis crassicaudata) and the
endemic Madras tree shrew (Anathana ellioti) (Reddy 2015; Gubbi et al. 2017a). Jungle cat
(Felis chaus), rusty spotted cat (Prionailurus rubiginosus), small Indian civet (Viverricula
indica), common palm civet (Paradoxurus hermaphrodites), Indian grey mongoose
(Herpestes edwardsii), ruddy mongoose (Herpestes smithii), smooth-coated otter (Lutrogale
perspicillata) are some of the smaller carnivores found in CWS (Gubbi et al. 2017a). The
grizzled giant squirrel (Ratufa macroura), which is endemic to southern India and Sri Lanka,
is found in the riparian forests of CWS and is known to be the northern most population
(Nagulu et al. 2000; Baskaran et al.2011; Arya 2018). The Ratel (Mellivora capensis) was
captured for the first time in CWS during a camera trap survey in 2014 (Gubbi et al. 2014b).
Additionally, the Indian grey wolf was photo-captured for the first time in CWS (Gubbi et al.
2020b), establishing an extent of its distribution in southern India.
CWS has 58 species of freshwater fishes, of which eight are endemic to the Cauvery river
system namely, Arulius barb (Dawkinsia arulius), Dawkinsia rubrotinctus, Red Canarese
barb (Hypselobarbus dubius), Korhi barb (Hypselobarbus micropogon), Kantaka
barb(Osteochilichthys brevidorsalis), Pigmouth carp (Labeo kontius), Hump-backed mahseer
(Tor remadevi) and Nilgiri mystus (Hemibagrus punctatus) (Pinder & Raghavan 2013;
Sreenivasan et al. 2021).

4
Map 1. Cauvery Wildlife Sanctuary, Malai Mahadeshwara Wildlife Sanctuary, Biligiri Rangaswamy
Temple Tiger Reserve, Bannerghatta National Park and adjoining forests in Tamil Nadu.

5
Map 2. Major vegetation types and other physical features in Cauvery Wildlife Sanctuary
The marsh crocodile (Crocodylus palustris) is found along the river Cauvery (Pinder &
Raghavan 2013). Saw-scaled viper (Echiscarinatus), Indian cobra (Naja naja), Russel’s viper
(Daboia russelii), Indian rock python (Python molurus), rat snake (Ptyas mucosa) and
common sand boa (Eryx conicus) are some of the snakes found in CWS (Nagulu et al. 2000;
Reddy 2015).
CWS supports more than 280 species of birds (Reddy 2015). The White-rumped vulture
(Gyps bengalensis), Indian vulture (Gyps indicus), Red-headed Vulture (Sarcogyps calvus)
are critically endangered (BirdLife 2021). Some rare birds that occur in CWS include the
Nilgiri wood-pigeon (Columba elphinstonii), greater spotted eagle (Clanga clanga), white-
naped tit (Parus nuchalis), pied-crested tit (Parus nuchalis) and yellow-throated bulbul
(Pycnonotus xantholaemus) (Sadananda et al. 2010; BirdLife 2021). The Cauvery river basin
is also important wintering area for the vulnerable Greater Spotted Eagle (Aquila clanga)
(Shivprakash et al. 2006).
Methodology
Camera trapping
The study area was divided into five blocks in the year 2014 and 2016; and into seven blocks
for the 2018 and 2020 sessions. The survey area increased from 1027.5 km2 in 2014 to
6
1080.9 km2
in 2016, 2018 and 2020. Even though the PA size was increased only in 2019, the
adjoining forested areas were surveyed in 2016 and 2018 as well. In order to ensure high
capture probability of leopards, the locations of the camera traps were identified before the
initial deployment based on indirect evidences of leopard presence i.e. scat, scrape marks,
and pugmarks. Panthera V4 and V6 motion detection cameras were deployed on either side
of animal trails or forest roads in order to ensure that both right and left flanks of the animal
were photo-captured. The camera trap was secured using python cables to an appropriate
support at a height of ~ 40 cm from the ground, which is considered as the optimal height to
capture the flanks of a leopard clearly.
The camera trap exercise was carried out every alternate year from 2014 to 2020. The camera
traps were deployed for 55 days in 2014, 80 days in 2016 and 112 days in 2018 and 2020.
The survey period, number of locations and number of unique occasions per block when the
camera traps were deployed is given in
Table 1. Camera trap effort is calculated by multiplying the number of locations by the
number of occasions when camera trap is supposedly functioning. The population of leopards
was assumed to be closed (no mortality, natality, immigration and emigration) within the
study site due to the short camera-trapping period.
The camera traps were operational throughout the day and night over 24 hours. They were
periodically checked every 2-3 days to download photographs, replace batteries and ensure
that they were working properly. An automated classifier built on the Python programming
language (version 3.6) was utilised to classify and segregate the downloaded photos into
folders based on the species (Rampi et al. Unpublished). The classifier was trained to identify
species from this region. The folders with images were then validated manually to make sure
they were categorised correctly and name of the species was written to the image metadata
using the software Digikam (Version 5.8.0; Gilles et al. 2018). The unique combination of
Table 1. Survey period, number of locations, occasions per block and camera trap effort for each
survey year in Cauvery Wildlife Sanctuary
Year Survey period No. of locations Occasions per block Camera
trapping effort
2014 04-Jan-14 to 04-Mar-14 332 11 3,648
2016 22-Dec-15 to 19-Mar-16 373 16 5,951
2018 12-Aug-18 to 26-Dec-18 472 16 7,490
2020 11-Mar-20 to 26-Jul-20 490 16 7,781
the camera trap location and camera ID provided the date, time and geographical coordinates
for each photo-captured species. The leopard images were extracted from the categorised data
and individuals were matched based on the rosette patterns on their respective flanks using
Wild-ID (Bolger et al. 2011). Images that did not show the flanks or part of the flank clearly
were not used during this identification process. The flanks, i.e. either right or left, with
maximum number of unique individuals were used for analysis.
Density and abundance estimation
SECR package (version 4.2), which is based on Spatially Explicit Capture-Recapture

7
methodology, was used as the statistical analysis tool to estimate the abundance and density
of leopards within the study area (Efford 2018). This was carried out on RStudio
(version 1.1.463). The input files used by the SECR analysis include the detector layout,
capture history matrix and mask layer, which were prepared according to the SECR
operational manuals. The detector layout file had information about the functioning and non-
functioning camera traps on the different sampling occasions which is represented as 1 and 0
respectively. The mask layer is composed of a shapefile which holds the spatial information
about suitable habitat (Efford 2018). A buffer was generated around the camera traps using
the ‘suggest.buffer’ function in the SECR package. The capture history matrix has unique
entries of an identified individual, its associated location and sampling occasion. The capture
probabilities are then estimated by the SECR package using the spatial information in the
input files and models are fitted by maximising the likelihood (Borchers and Efford 2008).
The model with the best estimates of density and abundance are selected based on the
Akaike’s Information Criterion (AIC) for likelihood-based models. A finite mixture model
was selected which used hazard rate as detection function and accounted for the
heterogeneity in detection probabilities among individuals. This model considers the
difference between frequently captured individuals by the camera trap as opposed to rarely
captured individuals.
Detection rates
The number of detections per individual was noted per survey year. A detection was
considered if an individual was photo-captured at a location on a discrete occasion i.e. 24
hours apart. The detection rates were calculated separately for males and females per survey
year by dividing the total number of male/female detections by the number of male/female
individuals identified. The number of years an individual was detected was also recorded
(Appendix-4).
Relative Abundance Index calculation
The relative abundance index (RAI) was calculated for all prey species using the
photographic capture rate i.e. the number of independent photo captures for a particular
species per 100 trap days. The photographic capture rates correlate with density estimates for
large terrestrial mammals and thus RAI can be used as a valid index of density for unmarked
species (Rovero & Marshall 2009; Palmer et al. 2018).
Firstly, different mammal species were segregated into separate folders. An event for a
species was extracted by matching photographs from cameras placed on either side of the
trail using the timestamp in the image metadata. This process was run using a VBA (Visual
Basic for Applications) script in excel. The number of individual events for each species was
extracted separately. In the case of livestock, cow, buffalo, donkey and domestic pig were
grouped as large livestock while sheep and goat were grouped as small livestock. A threshold
time interval (or event duration) was predefined considering the amount of time taken by
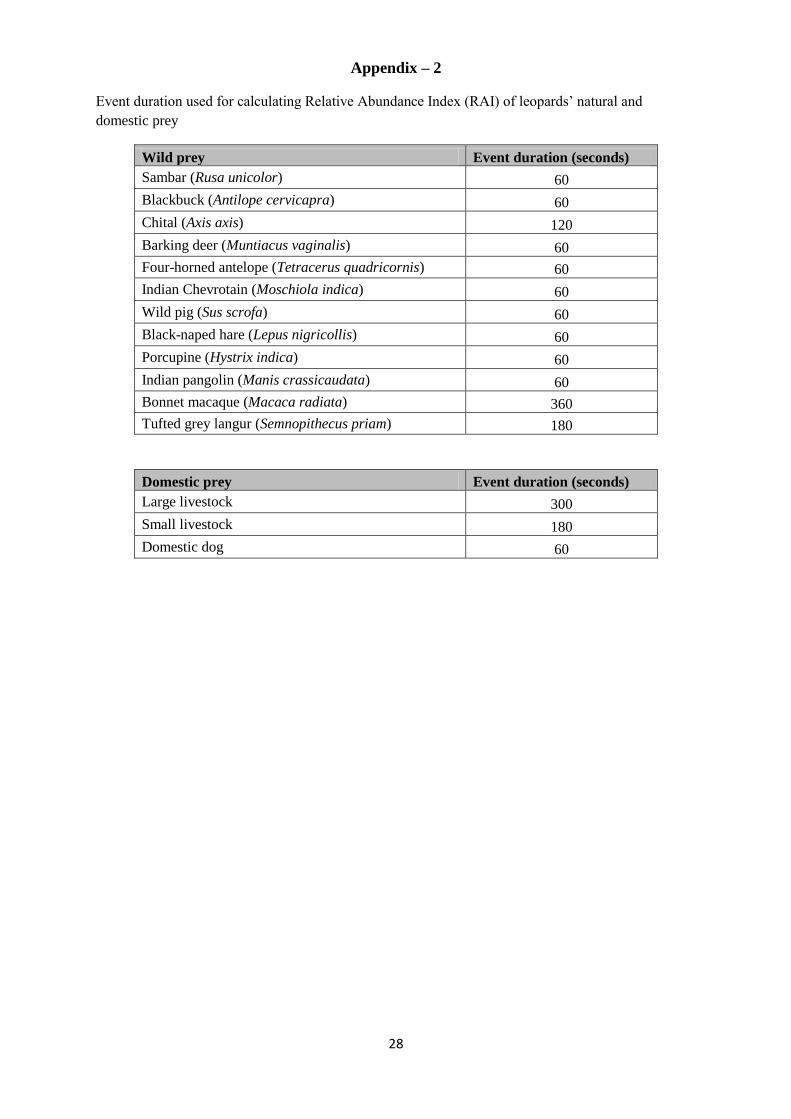
different species (individually or as a group) to cross the camera trap location (Appendix-2).
Photos with multiple individuals of the same species were considered as one event.
8
After the number of independent events for each species was tabulated, it was divided by the
total number of camera trapping days and further multiplied by 100 to give the RAI for each
species per 100 trap days.
Results
Abundance and density estimates for leopards
The camera traps captured 2,588 leopard images between 2014-2020 and a total of 191 adult
individual leopards were identified. The number of individuals photo-captured in each survey
year is tabulated in Table 2. Of the identified individuals, 94 were female and 78 were male.
The sex of 19 individuals could not be determined. A total of 12 cubs and 10 subadults were
also identified. The low capture probabilities of cubs and the transient nature of subadults
make them unsuitable to be used for analysis (Karanth 1995; Grey et al. 2013). Accounting
for individual heterogeneity, individuals were segregated into two groups with different
detection probabilities.
The SECR analysis provided a mean leopard abundance estimates of 59.65 ± 5.51 in 2014,
53.05 ± 1.95 in 2016, 77.22 ± 2.35 in 2018 and 96.94 ± 5 in 2020. Density estimates of
leopards per 100 km2 were 5.29 ± 0.84 in 2014, 4.69 ± 0.67 in 2016, 6.85 ± 0.81 in 2018 and
8.54 ± 0.97 in 2020. The σ values and ranges for all estimated values are given in Table 3.
Figure2 and Figure 3 show scatter plots of the population density estimates and abundance in
CWS respectively. The pixel densities of leopards for each survey year are depicted in Figure
4.
Table 2. Results of the camera trapping exercise in Cauvery Wildlife Sanctuary.
Year Number of images Number of
individuals
Number of
females, males
Number of cubs,
subadults
2014 374 43 26, 17 7, 0
2016 461 50 22, 23 0, 0
2018 865 73 38, 32 2, 2
2020 888 87 49, 31 3, 8
Table 3. SECR analysis results of leopards for all four survey years (2014, 2016, 2018, 2020) in
Cauvery Wildlife Sanctuary.
Year N (SE) N Range D (SE) D Range σ (SE) in
metres σ Range
2014 59.65 (5.51) 51.88-74.34 5.29 (0.84) 3.88-7.22
1504.93
(325.18) 990.11-2287.43
2016 53.05 (1.95) 50.97-59.6 4.69 (0.67) 3.56-6.2
2313.88
(539.66) 1473.81-3632.79
2018 77.22 (2.35) 74.52-84.72 6.85 (0.81) 5.44-8.62
3234.08
(217.01) 2835.95-3688.12
2020 96.94 (5.00) 90.91-112.23 8.54 (0.97) 6.83-10.66
2242.7
(245.35) 1809.49-2779.68
N - Estimate of total number of individuals in the study area, D – No of leopards/100 km2, σ – Spatial
scale of detection function (in meters)
9
Figure 2. Trend of leopard population density estimate (y-axis) over the survey period (x-axis, in
years) with error bars in Cauvery Wildlife Sanctuary
Figure 3. Trend of leopard population abundance estimate (y-axis) over the survey period (x-axis, in
years) with error bars in Cauvery Wildlife Sanctuary
10
Figure 4. Pixel densities of leopards in Cauvery Wildlife Sanctuary during each of the survey years.
Detection rates
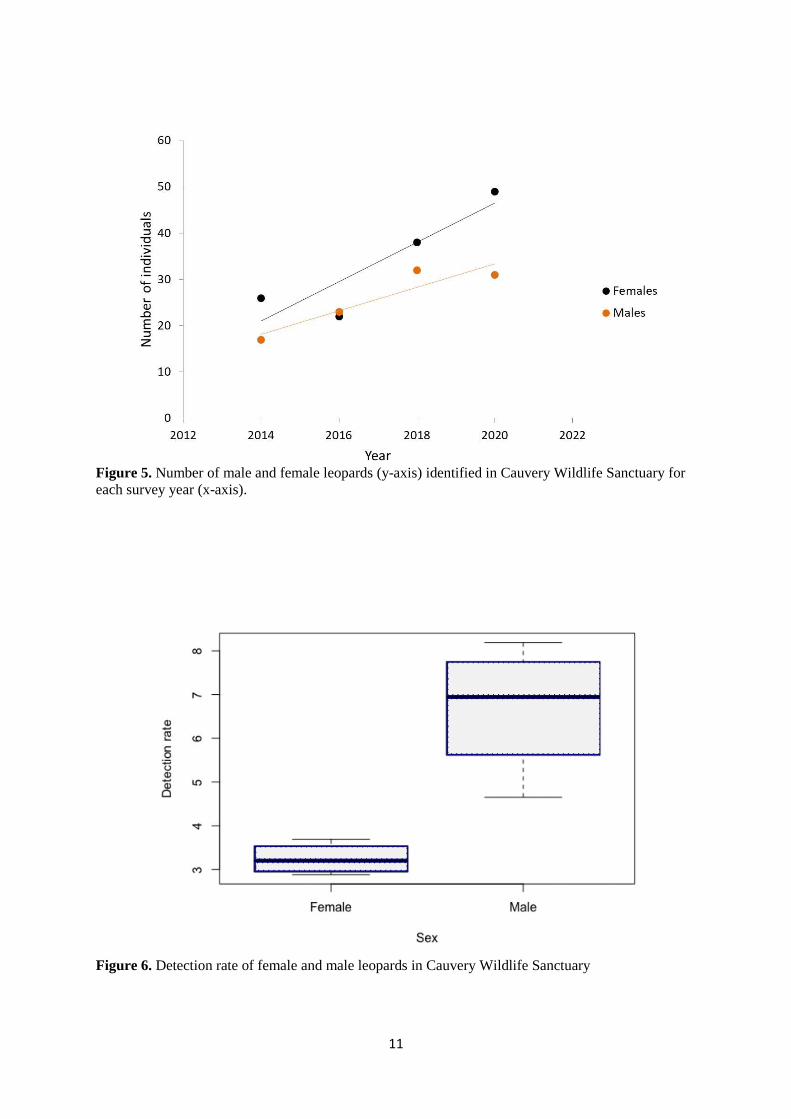
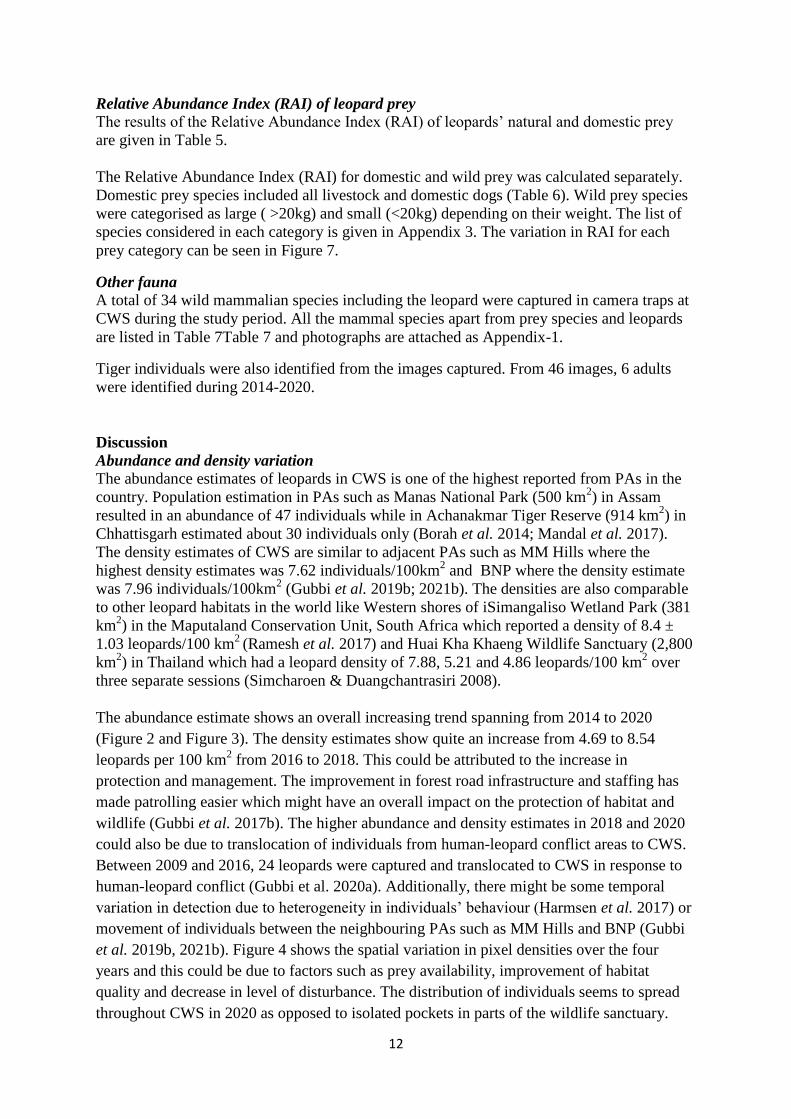
From the total number of individuals identified, the number of females is more than the
number of males (Table 2, Figure 5). The number of detections and detection rate for males
and females is given in Table 4. The mean of male and female detection rate is 6.68 and 3.24
respectively. The median for male and female detection rate was calculated as 6.94 and 3.19
respectively (Figure 6).
Table 4. The number of detections and detection rates for males and females in Cauvery Wildlife
Sanctuary
Year Detections
#
(males)
Detection rate*
(males)
Detections
(females)
Detection rate
(females)
2014 79 4.65 75 2.88
2016 151 6.57 66 3
2018 262 8.19 129 3.39
2020 227 7.32 181 3.69 #
*
11
Figure 5. Number of male and female leopards (y-axis) identified in Cauvery Wildlife Sanctuary for
each survey year (x-axis).
Figure 6. Detection rate of female and male leopards in Cauvery Wildlife Sanctuary
12
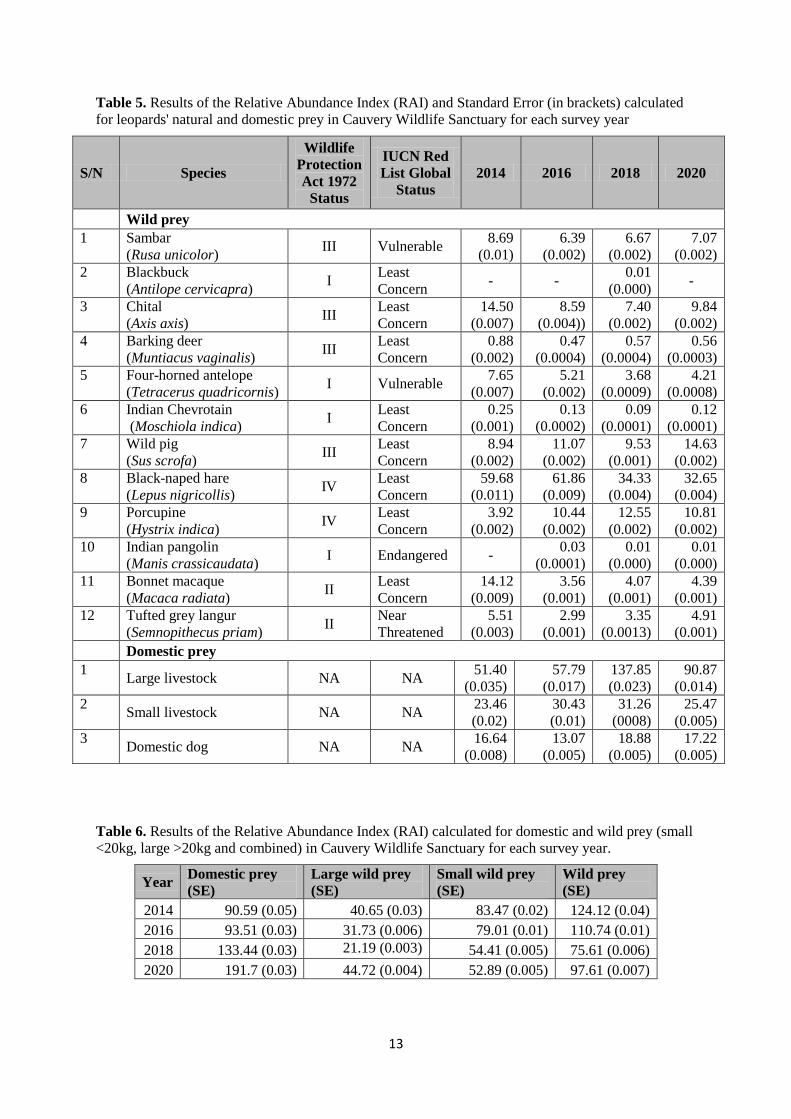
Relative Abundance Index (RAI) of leopard prey
The results of the Relative Abundance Index (RAI) of leopards’ natural and domestic prey
are given in Table 5.
The Relative Abundance Index (RAI) for domestic and wild prey was calculated separately.
Domestic prey species included all livestock and domestic dogs (Table 6). Wild prey species
were categorised as large ( >20kg) and small (<20kg) depending on their weight. The list of
species considered in each category is given in Appendix 3. The variation in RAI for each
prey category can be seen in Figure 7.
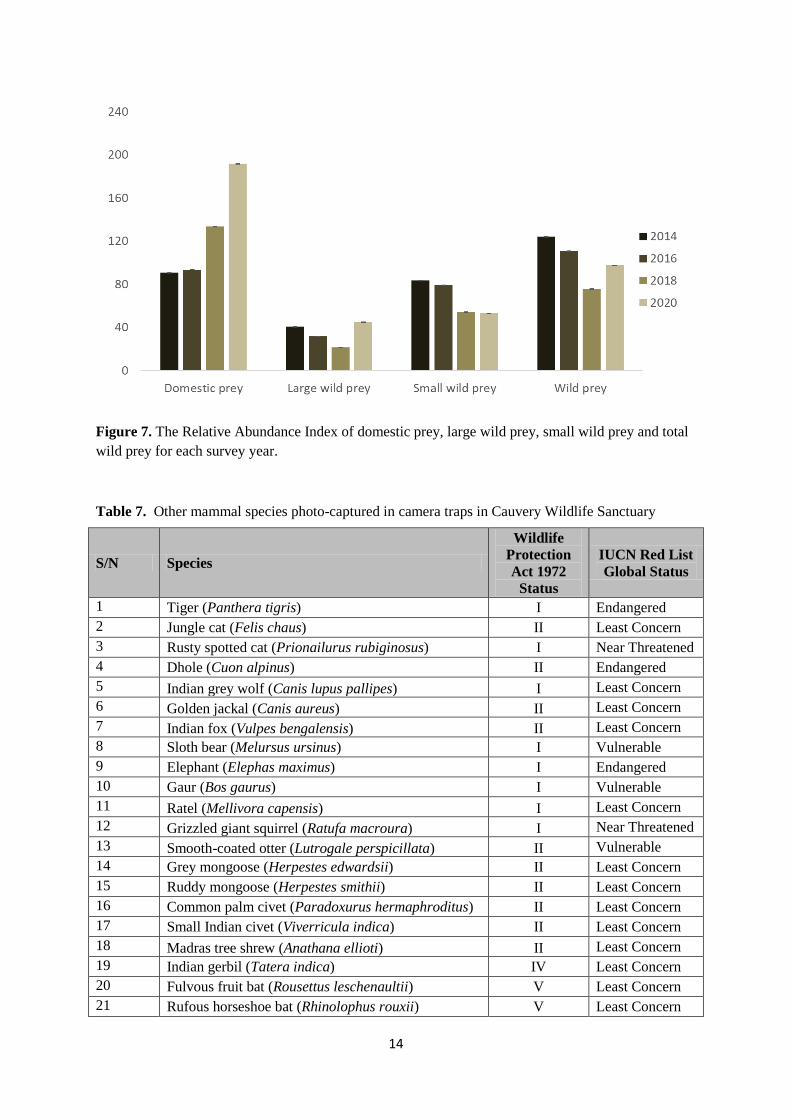
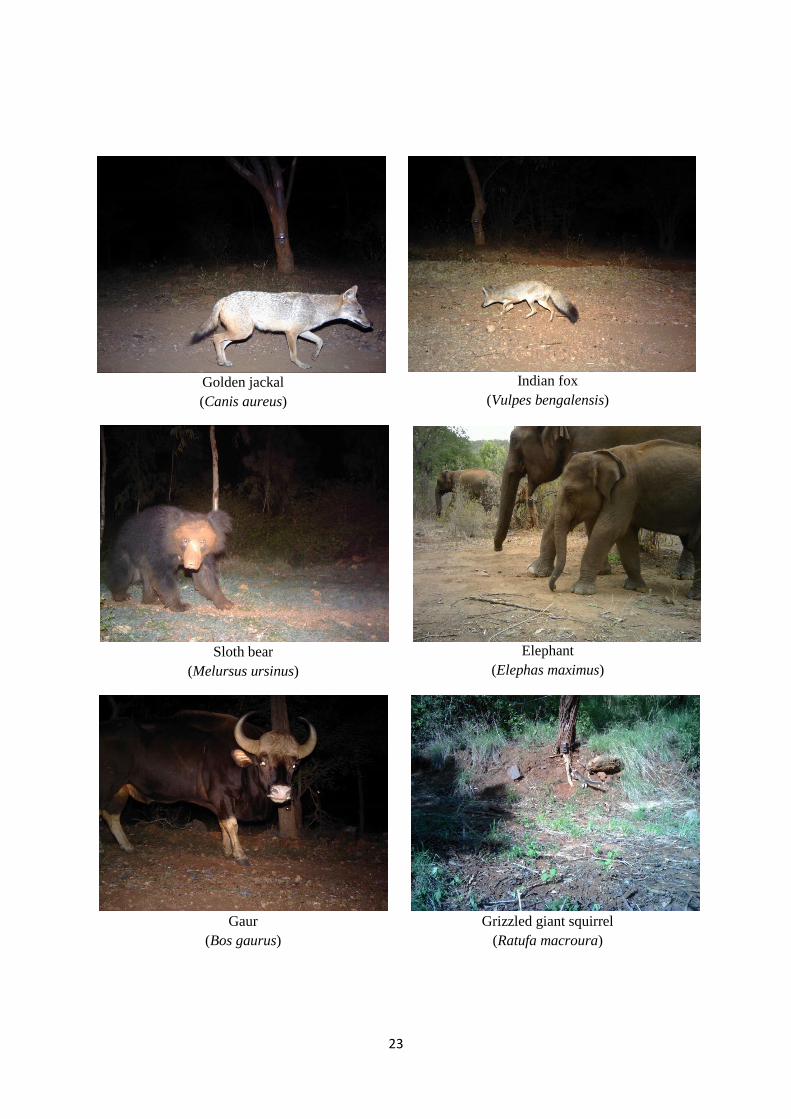
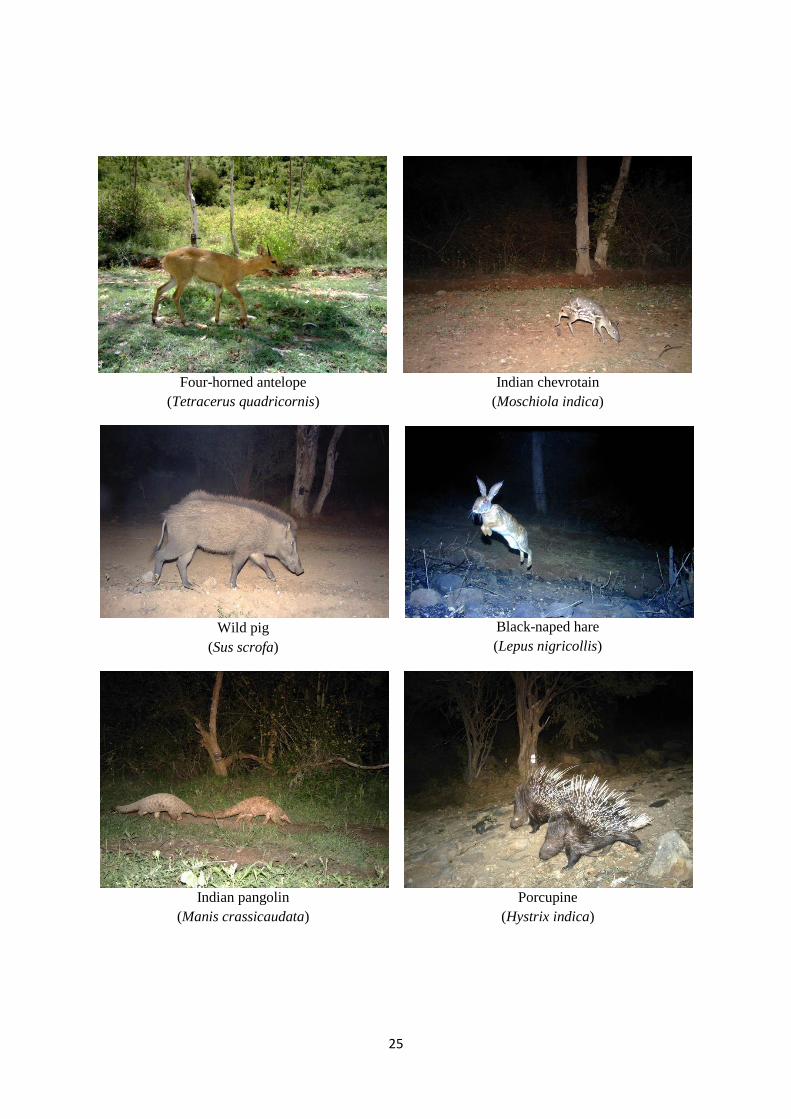
Other fauna A total of 34 wild mammalian species including the leopard were captured in camera traps at
CWS during the study period. All the mammal species apart from prey species and leopards
are listed in Table 7Table 7 and photographs are attached as Appendix-1.
Tiger individuals were also identified from the images captured. From 46 images, 6 adults
were identified during 2014-2020.
Discussion
Abundance and density variation The abundance estimates of leopards in CWS is one of the highest reported from PAs in the
country. Population estimation in PAs such as Manas National Park (500 km2) in Assam
resulted in an abundance of 47 individuals while in Achanakmar Tiger Reserve (914 km2) in
Chhattisgarh estimated about 30 individuals only (Borah et al. 2014; Mandal et al. 2017).
The density estimates of CWS are similar to adjacent PAs such as MM Hills where the
highest density estimates was 7.62 individuals/100km2 and BNP where the density estimate
was 7.96 individuals/100km2 (Gubbi et al. 2019b; 2021b). The densities are also comparable
to other leopard habitats in the world like Western shores of iSimangaliso Wetland Park (381
km2) in the Maputaland Conservation Unit, South Africa which reported a density of 8.4 ±
1.03 leopards/100 km2
(Ramesh et al. 2017) and Huai Kha Khaeng Wildlife Sanctuary (2,800
km2) in Thailand which had a leopard density of 7.88, 5.21 and 4.86 leopards/100 km
2 over
three separate sessions (Simcharoen & Duangchantrasiri 2008).
The abundance estimate shows an overall increasing trend spanning from 2014 to 2020
(Figure 2 and Figure 3). The density estimates show quite an increase from 4.69 to 8.54
leopards per 100 km2 from 2016 to 2018. This could be attributed to the increase in
protection and management. The improvement in forest road infrastructure and staffing has
made patrolling easier which might have an overall impact on the protection of habitat and
wildlife (Gubbi et al. 2017b). The higher abundance and density estimates in 2018 and 2020
could also be due to translocation of individuals from human-leopard conflict areas to CWS.
Between 2009 and 2016, 24 leopards were captured and translocated to CWS in response to
human-leopard conflict (Gubbi et al. 2020a). Additionally, there might be some temporal
variation in detection due to heterogeneity in individuals’ behaviour (Harmsen et al. 2017) or
movement of individuals between the neighbouring PAs such as MM Hills and BNP (Gubbi
et al. 2019b, 2021b). Figure 4 shows the spatial variation in pixel densities over the four
years and this could be due to factors such as prey availability, improvement of habitat
quality and decrease in level of disturbance. The distribution of individuals seems to spread
throughout CWS in 2020 as opposed to isolated pockets in parts of the wildlife sanctuary.
13
Table 5. Results of the Relative Abundance Index (RAI) and Standard Error (in brackets) calculated
for leopards' natural and domestic prey in Cauvery Wildlife Sanctuary for each survey year
S/N Species
Wildlife
Protection
Act 1972
Status
IUCN Red
List Global
Status
2014 2016 2018 2020
Wild prey
1 Sambar
(Rusa unicolor) III Vulnerable
8.69
(0.01)
6.39
(0.002)
6.67
(0.002)
7.07
(0.002)
2 Blackbuck
(Antilope cervicapra) I
Least
Concern - -
0.01
(0.000) -
3 Chital
(Axis axis) III
Least
Concern
14.50
(0.007)
8.59
(0.004))
7.40
(0.002)
9.84
(0.002)
4 Barking deer
(Muntiacus vaginalis) III
Least
Concern
0.88
(0.002)
0.47
(0.0004)
0.57
(0.0004)
0.56
(0.0003)
5 Four-horned antelope
(Tetracerus quadricornis) I Vulnerable
7.65
(0.007)
5.21
(0.002)
3.68
(0.0009)
4.21
(0.0008)
6 Indian Chevrotain
(Moschiola indica) I
Least
Concern
0.25
(0.001)
0.13
(0.0002)
0.09
(0.0001)
0.12
(0.0001)
7 Wild pig
(Sus scrofa) III
Least
Concern
8.94
(0.002)
11.07
(0.002)
9.53
(0.001)
14.63
(0.002)
8 Black-naped hare
(Lepus nigricollis) IV
Least
Concern
59.68
(0.011)
61.86
(0.009)
34.33
(0.004)
32.65
(0.004)
9 Porcupine
(Hystrix indica) IV
Least
Concern
3.92
(0.002)
10.44
(0.002)
12.55
(0.002)
10.81
(0.002)
10 Indian pangolin
(Manis crassicaudata) I Endangered -
0.03
(0.0001)
0.01
(0.000)
0.01
(0.000)
11 Bonnet macaque
(Macaca radiata) II
Least
Concern
14.12
(0.009)
3.56
(0.001)
4.07
(0.001)
4.39
(0.001)
12 Tufted grey langur
(Semnopithecus priam) II
Near
Threatened
5.51
(0.003)
2.99
(0.001)
3.35
(0.0013)
4.91
(0.001)
Domestic prey
1 Large livestock NA NA
51.40
(0.035)
57.79
(0.017)
137.85
(0.023)
90.87
(0.014)
2 Small livestock NA NA
23.46
(0.02)
30.43
(0.01)
31.26
(0008)
25.47
(0.005)
3 Domestic dog NA NA
16.64
(0.008)
13.07
(0.005)
18.88
(0.005)
17.22
(0.005)
Table 6. Results of the Relative Abundance Index (RAI) calculated for domestic and wild prey (small
<20kg, large >20kg and combined) in Cauvery Wildlife Sanctuary for each survey year.
Year Domestic prey
(SE)
Large wild prey
(SE)
Small wild prey
(SE)
Wild prey
(SE)
2014 90.59 (0.05) 40.65 (0.03) 83.47 (0.02) 124.12 (0.04)
2016 93.51 (0.03) 31.73 (0.006) 79.01 (0.01) 110.74 (0.01)
2018 133.44 (0.03) 21.19 (0.003) 54.41 (0.005) 75.61 (0.006)
2020 191.7 (0.03) 44.72 (0.004) 52.89 (0.005) 97.61 (0.007)
14
Figure 7. The Relative Abundance Index of domestic prey, large wild prey, small wild prey and total
wild prey for each survey year.
Table 7. Other mammal species photo-captured in camera traps in Cauvery Wildlife Sanctuary
S/N Species
Wildlife
Protection
Act 1972
Status
IUCN Red List
Global Status
1 Tiger (Panthera tigris) I Endangered
2 Jungle cat (Felis chaus) II Least Concern
3 Rusty spotted cat (Prionailurus rubiginosus) I Near Threatened
4 Dhole (Cuon alpinus) II Endangered
5 Indian grey wolf (Canis lupus pallipes) I Least Concern
6 Golden jackal (Canis aureus) II Least Concern
7 Indian fox (Vulpes bengalensis) II Least Concern
8 Sloth bear (Melursus ursinus) I Vulnerable
9 Elephant (Elephas maximus) I Endangered
10 Gaur (Bos gaurus) I Vulnerable
11 Ratel (Mellivora capensis) I Least Concern
12 Grizzled giant squirrel (Ratufa macroura) I Near Threatened
13 Smooth-coated otter (Lutrogale perspicillata) II Vulnerable
14 Grey mongoose (Herpestes edwardsii) II Least Concern
15 Ruddy mongoose (Herpestes smithii) II Least Concern
16 Common palm civet (Paradoxurus hermaphroditus) II Least Concern
17 Small Indian civet (Viverricula indica) II Least Concern
18 Madras tree shrew (Anathana ellioti) II Least Concern
19 Indian gerbil (Tatera indica) IV Least Concern
20 Fulvous fruit bat (Rousettus leschenaultii) V Least Concern
21 Rufous horseshoe bat (Rhinolophus rouxii) V Least Concern

15
Population turnover
The turnover of new individuals is higher in CWS than the adjoining MM Hills (Gubbi et al.
2021b). The baseline population estimation was 46 individuals to which 36 new individual
were added in 2016, 61 in 2018 and 48 in 2020. As mentioned before, the new individuals
could also be leopards that are translocated from other areas. Within CWS, only three
individuals were captured all four years (Figure 8), and 10 were captured during three of the
survey years (Appendix-4). Of the 43 captured in two survey years, 29 were common
between 2018 and 2020. Since the survey was conducted every alternate year, if individuals
were captured two consecutive surveys, we could assume that they could be residents having
spent at least three years in the area (Harmsen et al. 2017). This information could help
establish home ranges for a few resident individuals.
A total of 56 individuals were recorded in at least two survey years and 31of them were
identified as females. Even though the number of females were higher than males (Table 2,
Figure 5), the detection rates of females were lower compared to males (Table 4, Figure 6).
This could be an indication of behavioural differences in female and male movement.
Females might be denning or may avoid movement on trails to avoid provoking infanticide of
their dependent cubs (Harmsen et al. 2017). More female turnover is an indicator of healthy
leopard populations as it suggests that habitat quality is good enough to maintain territory and
availability of prey (Nowell & Jackson 1996; Kandel et al. 2020). The higher number of
females corroborates with data in other PAs such as MM Hills and BRT TR (Gubbi et al.
2019c, 2021b). The turnover of male individuals has an impact of the reproductive output of
the population (Balme et al. 2013).
The photo-captures of 12 cubs and 10 subadults suggest the presence of breeding females as
well. Breeding females play a crucial role in the population stability of large carnivores
(Nowell & Jackson 1996; Balme et al. 2013; Kandel et al. 2020). Two subadults and one cub
were captured in 2018 and 2020 suggesting survival of offspring. More information is
required to understand survival of cubs but camera trap surveys might not be ideal due to
their low detection probabilities (Karanth 1995; Grey et al. 2013; Harmsen et al. 2017).
Variables affecting leopard populations
Temporal variation could be attributed to behavioural differences such as females denning or
protecting young ones, individuals following prey species or dispersing individuals (Harmsen
et al. 2017). CWS has 24 common individuals with MM Hills and two individuals which
have been recorded in BNP. Movement of individuals within the landscape could contribute
to temporal variation in abundance and density in the sanctuary. One of the individuals
common to CWS and BNP moved nearly 16 km (shortest distance between the two farthest
camera trapped locations) within two months (December 2018 to February 2019) (Gubbi et
al. 2019b). This highlights the importance of maintaining connectivity within the landscape.
The area surrounding the BNP connecting Cauvery Wildlife Sanctuary, which acts as a
wildlife corridor, is composed of degraded native forest, agricultural land and plantations
(Rashmi & Lele 2010; Adhikari et al. 2014).
Habitat fragmentation caused by changing land-use practices and expansion into forest area
can prove detrimental to leopard and their prey populations (Fahrig 2003; Jacobson et al.
2016). Movement of individuals between fragmented patches can result in conflict situation

16
leading to their capture or persecution (Athreya et al. 2015; Gubbi et al. 2020a). Hence,
ensuring that the forest connectivity is maintained is very crucial both for people and wildlife.
Leopards’ space use and density depends on the proportion of natural habitats and availability
of large wild prey (Dickman & Marker 2005; Khorozyan et al. 2008; Ramesh et al. 2017;
Gubbi et al. 2020c). Gubbi et al. (2017b) showed a general declining trend in forest cover in
this area previously between 2000 and 2014. These areas which have been initially under the
pressure of encroachment and extractive activities have been monitored and managed more
efficiently after the expansion of the PA in 2011.
Overall wild prey RAI however does not show any drastic increase or decrease (Figure 7).
Domestic prey RAI shows a steady increase from 2014 to 2020. The increase in livestock
grazing can have a significant impact on the natural vegetation which in turn affects natural
wild prey populations (Khan et al. 1996; WallisDeVries 1998; Madhusudan 2004). The RAI
of large and small wild prey seems to go down in 2018 which could be due to reduced
movement during monsoons and post monsoons (August to December), which was the
sampling period, due to widespread fodder availability. Prey population dynamics and factors
that contribute to their decline should be studied in depth to implement effective strategies to
manage dependent predator populations (Hayward et al. 2006; Athreya et al. 2013). Gubbi et
al. (2017b) showed the overlap of livestock presence and forest cover decline. Additional to
the above mentioned variables, poaching can seriously impact prey species densities
(Madhusudan & Karanth 2002). A temporal analysis of forest offence cases of prey poaching
could help analyse the trends.
Figure 8. Polygon formed with all capture locations from 2014 to 2020 showing potential home
range of CUL-06 (female; gravid), CUL-14 (female) and CUL-24 (male)

17
Other fauna Apart from leopards and their prey species, CWS is part of a landscape that is of utmost
importance for the conservation of species such as elephants and tigers (Gubbi et al. 2017b).
Additionally, we have recorded the first photographic evidence of species like ratel and the
Indian grey wolf (Gubbi et al. 2014b, 2020b), establishing an extent of their distribution in
southern India.
Conclusion Long term monitoring of leopard populations is difficult but extremely important to
understand for drawing up suitable management strategies. The status of their population can
highlight fundamental issues in the management and protection of their habitats and prey
populations. Some habitats such as tropical evergreen forests often get more conservation
attention as opposed to other lesser known habitats such as woodland savannah and scrub
forests. Leopards are found in a wide variety of habitats and thus Gubbi et al. (2020c) argues
that leopards can be used as an indicator to prioritise habitats for conservation such as scrub,
rocky outcrops and woodland savannah which are usually neglected.
References
Adhikari, S., Southworth, J., & Nagendra, H. (2014). Understanding forest loss and recovery:
a spatiotemporal analysis of land change in and around Bannerghatta National Park,
India. Journal of Land Use Science, 10(4), 402-424.
https://doi.org/10.1080/1747423X.2014.920425
Arya, U. (2018) Ecology of Grizzled Giant Squirrel R. macroura in Cauvery Wildlife
Sanctuary, Karnataka, Southern India (Master’s thesis, India Institute of Science
Education and Research, Pune, India). Retrieved from
http://dr.iiserpune.ac.in:8080/xmlui/bitstream/handle/123456789/1006/THESIS_upendra_
arya.PDF?sequence=1&isAllowed=y
Athreya, V., Odden, M., Linnell, J. D., Krishnaswamy, J., & Karanth, U. (2013). Big cats in
our backyards: persistence of large carnivores in a human dominated landscape in
India. PloS one, 8(3), e57872. https://doi.org/10.1371/journal.pone.0057872
Athreya, V., Srivathsa, A., Puri, M., Karanth, K. K., Kumar, N. S., & Karanth, K. U. (2015).
Spotted in the news: using media reports to examine leopard distribution, depredation,
and management practices outside protected areas in Southern India. PLoS One, 10(11),
e0142647. https://doi.org/10.1371/journal.pone.0142647
Balme, G. A., Batchelor, A., de Woronin Britz, N., Seymour, G., Grover, M., Hes, L.,
Macdonald, D.W., & Hunter, L. T. (2013). Reproductive success of female leopards P
anthera pardus: the importance of top‐down processes. Mammal Review, 43(3), 221-237.
doi:10.1111/j.1365-2907.2012.00219.x
Baskaran, N., Senthilkumar, K., & Saravanan, M. (2011). A new site record of the Grizzled
Giant Squirrel Ratufa macroura (Pennant, 1769) in the Hosur forest division, Eastern
Ghats, India and its conservation significance. Journal of Threatened Taxa, 1837-1841.
Bhatia, S., Athreya, V., Grenyer, R., & Macdonald, D. W. (2013). Understanding the role of
representations of human–leopard conflict in Mumbai through media‐content
analysis. Conservation Biology, 27(3), 588-594. doi: 10.1111/cobi.12037
BirdLife International (2021) Important Bird Areas factsheet: Cauvery Wildlife Sanctuary.
Downloaded from http://www.birdlife.org on 06 April 2021.

18
Bolger, D. T., Vance, B., Morrison, T. A., & Farid, H. (2011). Wild-ID user guide: pattern
extraction and matching software for computer-assisted photographic mark recapture
analysis. Dartmouth College, Hanover, United States of America.
Borah, J., Sharma, T., Das, D., Rabha, N., Kakati, N., Basumatary, A., & Vattakaven, J.
(2014). Abundance and density estimates for common leopard Panthera pardus and
clouded leopard Neofelis nebulosa in Manas National Park, Assam, India. Oryx, 48(1), 149-
155. doi:10.1017/S0030605312000373
Borchers, D. L., & Efford, M. G. (2008). Spatially explicit maximum likelihood methods for
capture–recapture studies. Biometrics, 64(2), 377-385. doi: 10.1111/j.1541-
0420.2007.00927.x
Campbell, G., Kuehl, H., Diarrassouba, A., N'Goran, P. K., & Boesch, C. (2011). Long-term
research sites as refugia for threatened and over-harvested species. Biology letters, 7(5),
723-726. doi:10.1098/rsbl.2011.0155
Caro, T. (2011). On the merits and feasibility of wildlife monitoring for conservation: a case
study from Katavi National Park, Tanzania. African Journal of Ecology, 49(3), 320-331.
https://doi.org/10.1111/j.1365-2028.2011.01268.x
Clutton-Brock, T., & Sheldon, B. C. (2010). Individuals and populations: the role of long-
term, individual-based studies of animals in ecology and evolutionary biology. Trends in
ecology & evolution, 25(10), 562-573. doi:10.1016/j.tree.2010.08.002
Dickman, A. J., & Marker, L. L. (2005). Factors affecting leopard (Panthera pardus) spatial
ecology, with particular reference to Namibian farmlands. South African Journal of
Wildlife Research, 35(2), 105-115.
Efford, M. (2018). Spatially Explicit Capture-Recapture. R package version 3.1.7
Fahrig, L. (2003). Effects of habitat fragmentation on biodiversity. Annual review of ecology,
evolution, and systematics, 34(1), 487-515.
https://doi.org/10.1146/annurev.ecolsys.34.011802.132419
Gilles, C., Wiesweg, M., Qualmann, M., Hansen, M.G., Rytilahti, T., Welwarsky, M.,
Narboux, J., Frank, M., Lecureuil, N., Palani, A., Clemens, A., Spendrin, P., Pontabry, J.,
Baecker, A., Cruz, F.J., Raju, R., Ahrens, J., Albers, T. & Holzer R. (2018). DigiKam:
Professional Photo Management with the Power of Open Source [Version 5.8.0], Boston,
United States of America.
Grey, J. N. C., Kent, V. T., & Hill, R. A. (2013). Evidence of a high density population of
harvested leopards in a montane environment. PloS one, 8(12), e82832.
https://doi.org/10.1371/journal.pone.0082832
Gubbi, S., Poornesha, H. C., Daithota, A., & Nagashettihalli, H. (2014a). Roads emerging as
a critical threat to leopards in India. Cat news, 60, 30-31.
Gubbi, S., Reddy, V., Nagashettihalli, H., Bhat, R., & Madhusudan, M. D. (2014b).
Photographic records of the Ratel Mellivora capensis from the southern Indian state of
Karnataka. Small Carnivore Conservation, 50, 42-44.
Gubbi, S., Nagashettihalli, H., Bhat, R., Poornesha, H.C., Anoop, A., & Madhusudan, M.D.
(2017a). Ecology and conservation of leopards in protected and multiple use forests in
Karnataka. Nature Conservation Foundation, Mysore, India.
Gubbi, S., Harish, N. S., Kolekar, A., Poornesha, H. C., Reddy, V., Mumtaz, J., &
Madhusudan, M. D. (2017b). From intent to action: a case study for the expansion of tiger

19
conservation from southern India. Global Ecology and Conservation, 9, 11-20.
https://doi.org/10.1016/j.gecco.2016.11.001
Gubbi, S., Kolekar, A., Chakraborty, P., & Kumara. V (2019a). Big cat in well: an
unconventional threat to leopards in southern India. Oryx.
doi:10.1017/S0030605319000280
Gubbi, S., Nagashettihalli, H., Suthar, S. & Menon, A.M. (2019b). Leopards of Bannerghatta
National Park: A camera-trapping exercise to estimate abundance and densities of
leopards, Nature Conservation Foundation, Mysore, India.
Gubbi, S., Nagashettihalli, H., Suthar, S. & Menon, A.M. (2019c). Report on monitoring of
leopards at Biligiri Rangaswamy Temple Tiger Reserve in Karnataka, Nature
Conservation Foundation, Mysore, India.
Gubbi, S., Kolekar, A., & Kumara, V. (2020a). Policy to on-ground action: Evaluating a
conflict policy guideline for leopards in India. Journal of International Wildlife Law &
Policy, 23(2), 127-140. https://doi.org/10.1080/13880292.2020.1818428
Gubbi, S., Ramesh, S., Menon, A.M., Girish, M.N., Poornesha, H.C. (2020b). The lone wolf:
new distribution update of the Indian grey wolf (Canis lupus pallipes) in southern India.
Canid Biology & Conservation 22(6):21-24. URL:
http://www.canids.org/CBC/22/Indian_grey_wolf_distribution.pdf.
Gubbi, S., Sharma, K., & Kumara, V. (2020c). Every hill has its leopard: patterns of space
use by leopards (Panthera pardus) in a mixed use landscape in India. PeerJ, 8, e10072.
doi:10.7717/peerj.10072
Gubbi, S., Suthar, S., Girish, M. N. & Menon, A.M. (2020d). Rosettes in Chikkaballapura:
Estimating leopard densities and abundance through camera trapping, Nature
Conservation Foundation, Mysore, India.
Gubbi, S., Menon, A.M., Prabhu, K., & Suthar, S. (2021a) The leopards of Marikanive:
Population estimation of leopards in the Marikanive State Forest, Chitradurga , Nature
Conservation Foundation, Mysore, India.
Gubbi, S., Menon, A.M., Suthar, S. & Poornesha, H.C. (2021b) Monitoring leopard
population in Malai Mahadeshwara Wildlife Sanctuary between 2014 and 2020. Nature
Conservation Foundation, Mysore, India.
Gubbi, S., Kolekar, A., & Kumara, V. (2021c). Quantifying Wire Snares as a Threat to
Leopards in Karnataka, India. Tropical Conservation Science, 14: 1-8
https://doi.org/10.1177/19400829211023264
Harihar, A., Pandav, B., & Goyal, S. P. (2009). Density of leopards (Panthera pardus) in the
Chilla Range of Rajaji National Park, Uttarakhand, India. Mammalia, 73(1), 68-71.
doi:10.1515/MAMM.2009.007
Harmsen, B. J., Foster, R. J., Sanchez, E., Gutierrez-González, C. E., Silver, S. C., Ostro, L.
E. T., Kelly, M. J. , Kay, E., & Quigley, H. (2017). Long term monitoring of jaguars in
the Cockscomb Basin Wildlife Sanctuary, Belize; Implications for camera trap studies of
carnivores. PloS one, 12(6), e0179505. https://doi.org/10.1371/journal.pone.0179505
Hayward, M. W., Henschel, P., O'brien, J., Hofmeyr, M., Balme, G., & Kerley, G. I. H.
(2006). Prey preferences of the leopard (Panthera pardus). Journal of Zoology, 270(2),
298-313. doi:10.1111/j.1469-7998.2006.00139.x
20
Henschel, P., & Ray, J. (2015). Leopards in African Rainforests-Survey and Monitoring
Techniques. Wildlife Conservation Society, Bronx, United States of America
Jacobson, A. P., Gerngross, P., Lemeris Jr, J. R., Schoonover, R. F., Anco, C., Breitenmoser-
Würsten, C., Durant, S. M., Farhadinia, M. S., Henschel, P., Kamler, J. F., Laguardia, A.,
Rostro-Garcia, S., Stein, A. B., & Dollar, L. (2016). Leopard (Panthera pardus) status,
distribution, and the research efforts across its range. PeerJ, 4, e1974.
https://doi.org/10.7717/peerj.1974
Kandel, S. R., Lamichhane, B. R., & Subedi, N. (2020). Leopard (Panthera pardus) density
and diet in a forest corridor of Terai: implications for conservation and conflict
management. Wildlife Research, 47(6), 460-467. https://doi.org/10.1071/WR19126
Karanth, K. U. (1995). Estimating tiger Panthera tigris populations from camera-trap data
using capture—recapture models. Biological conservation, 71(3), 333-338.
https://doi.org/10.1016/0006-3207(94)00057-W
Khan, J. A., Chellam, R., Rodgers, W. A., & Johnsingh, A. J. T. (1996). Ungulate densities
and biomass in the tropical dry deciduous forests of Gir, Gujarat, India. Journal of
Tropical Ecology, 149-162. https://doi.org/10.1017/S0266467400009366
Khorozyan, I. G., Malkhasyan, A. G., & Abramov, A. V. (2008). Presence–absence surveys
of prey and their use in predicting leopard (Panthera pardus) densities: a case study from
Armenia. Integrative Zoology, 3(4), 322-332. doi: 10.1111/j.1749-4877.2008.00111.x
Madhusudan, M. D., & Karanth, K. U. (2002). Local hunting and the conservation of large
mammals in India. Ambio, 49-54.
Madhusudan, M. D. (2004). Recovery of wild large herbivores following livestock decline in
a tropical Indian wildlife reserve. Journal of Applied Ecology, 41(5), 858-869.
Mandal, D., Basak, K., Mishra, R. P., Kaul, R., & Mondal, K. (2017). Status of leopard
Panthera pardus and striped hyena Hyaena hyaena and their prey in Achanakmar Tiger
Reserve, Central India. Journal of Zoology Studies, 4(4), 34-41.
Ministry of Environment, Forest and Climate Change (2017) The Gazette of India:
Extraordinary, 46(152), Controller of Publication, Delhi, India.
Nagulu, V., Rao, V. V., & Srinivasulu, C. (2000). Wildlife Heritage of the Deccan. Deccan
Heritage, 34-38.
Nowell, K., & Jackson, P. (1996). ‘Wild Cats: Status Survey and Conservation Action Plan
(Vol. 382)’. IUCN, Gland, Switzerland.
Odden, M., Athreya, V., Rattan, S., & Linnell, J. D. (2014). Adaptable neighbours:
movement patterns of GPS-collared leopards in human dominated landscapes in
India. PLoS One, 9(11), e112044. https://doi.org/10.1371/journal.pone.0112044
Palmer, M. S., Swanson, A., Kosmala, M., Arnold, T., & Packer, C. (2018). Evaluating
relative abundance indices for terrestrial herbivores from large-scale camera trap
surveys. African journal of ecology, 56(4), 791-803. https://doi.org/10.1111/aje.12566
Pelton, M. R., & van Manen, F. T. (1996). Benefits and pitfalls of long-term research: a case
study of black bears in Great Smoky Mountains National Park. Wildlife Society Bulletin,
443-450.
Pinder, A. C., & Raghavan, R. (2013). Conserving the endangered mahseers (Tor spp.) of
India: the positive role of recreational fisheries. Current Science, 104(11), 1472-1475.

21
Ramesh, T., Kalle, R., Rosenlund, H., & Downs, C. T. (2017). Low leopard populations in
protected areas of Maputaland: a consequence of poaching, habitat condition, abundance
of prey, and a top predator. Ecology and evolution, 7(6), 1964-1973. doi:
10.1002/ece3.2771
Rashmi, M. K., & Lele, N. (2010). Spatial modeling and validation of forest cover change in
Kanakapura region using GEOMOD. Journal of the Indian Society of Remote
Sensing, 38(1), 45-54.
Reddy, V. K. V. (2015) Management Plan of Cauvery Wildlife Sanctuary, 2015-16 to 2024-
25. Government of Karnataka, Bangalore, India.
Rovero, F., & Marshall, A. R. (2009). Camera trapping photographic rate as an index of
density in forest ungulates. Journal of Applied Ecology, 46(5), 1011-1017. doi:
10.1111/j.1365-2664.2009.01705.x
Sadananda, K. B., Tanuja, D. H., Sahana, M., Girija, T., Sharath, A., Vishwanath, M. K., &
Shivaprakash, A. (2010). Observations on the White-naped Tit Parus nuchalis in Cauvery
Wildlife Sanctuary, Karnataka. Indian Birds, 6(1), 12-14.
Shivprakash, A., Das, K. K., Shivanand, T., Girija, T., & Sharath, A. (2006). Notes on the
breeding of the Indian Spotted Eagle Aquila hastata. Indian Birds, 2(1), 2-4.
Simcharoen, S., & Duangchantrasiri, S. (2008). Monitoring of the leopard population at Khao
Nang Rum in Huai Kha Khaeng Wildlife Sanctuary. Thai J For 27: 68-80.
Sreenivasan, N., Mahesh, N., & Raghavan, R. (2021). Freshwater fishes of Cauvery Wildlife
Sanctuary, Western Ghats of Karnataka, India. Journal of Threatened Taxa, 13(1), 17470-
17476. https://doi.org/10.11609/jott.6778.13.1.17470-17476
Stein, A.B., Athreya, V., Gerngross, P., Balme, G., Henschel, P., Karanth, U., Miquelle, D.,
Rostro-Garcia, S., Kamler, J.F., Laguardia, A., Khorozyan, I. & Ghoddousi,
A. (2020). Panthera pardus (amended version of 2019 assessment). The IUCN Red List of
Threatened Species 2020:
e.T15954A163991139. https://dx.doi.org/10.2305/IUCN.UK.2020-
1.RLTS.T15954A163991139.en. Downloaded on 01 March 2021.
Sunil, C., Somashekar, R. K., & Nagaraja, B. C. (2019). Influence of Terminalia arjuna on
the riparian landscapes of the River Cauvery of South India. Landscape Research.
https://doi.org/10.1080/01426397.2018.1560400
Uphyrkina, O., Johnson, W. E., Quigley, H., Miquelle, D., Marker, L., Bush, M., & O'Brien,
S. J. (2001). Phylogenetics, genome diversity and origin of modern leopard, Panthera
pardus. Molecular ecology, 10(11), 2617-2633. https://doi.org/10.1046/j.0962-
1083.2001.01350.x
WallisDeVries, M. F. (1998). Habitat quality and the performance of large herbivores.
In Grazing and conservation management (pp. 275-320). Springer, Dordrecht.
Yoccoz, N. G., Nichols, J. D., & Boulinier, T. (2001). Monitoring of biological diversity in
space and time. Trends in ecology & evolution, 16(8), 446-453.
https://doi.org/10.1016/S0169-5347(01)02205-4

22
Appendices
Appendix – 1
Photographs of mammal species captured in Cauvery Wildlife Sanctuary during camera trapping
session in 2014, 2016, 2018 and 2020.
Leopard
(Panthera pardus fusca)
Tiger
(Panthera tigris)
Jungle cat
(Felis chaus)
Rusty spotted cat
(Prionailurus rubiginosus)
Dhole
(Cuon alpinus)
Indian grey wolf
(Canis lupus pallipes)
23
Golden jackal
(Canis aureus)
Indian fox
(Vulpes bengalensis)
Sloth bear
(Melursus ursinus)
Elephant
(Elephas maximus)
Gaur
(Bos gaurus)
Grizzled giant squirrel
(Ratufa macroura)

24
Smooth-coated otter
(Lutrogale perspicillata)
Ratel
(Mellivora capensis)
Sambar
(Rusa unicolor)
Chital
(Axis axis)
Blackbuck
(Antilope cervicapra)
Barking deer
(Muntiacus vaginalis)
25
Four-horned antelope
(Tetracerus quadricornis)
Indian chevrotain
(Moschiola indica)
Wild pig
(Sus scrofa)
Black-naped hare
(Lepus nigricollis)
Indian pangolin
(Manis crassicaudata)
Porcupine
(Hystrix indica)

26
Bonnet macaque
(Macaca radiata)
Tufted grey langur
(Semnopithecus priam)
Grey mongoose
(Herpestes edwardsii)
Ruddy mongoose
(Herpestes smithii)
Common palm civet
(Paradoxurus hermaphroditus)
Small Indian civet
(Viverricula indica)

27
Madras tree shrew
(Anathana ellioti)
Indian gerbil
(Tatera indica)
Fulvous fruit bat
(Rousettus leschenaultii)
Rufous horseshoe bat
(Rhinolophus rouxii)
28
Appendix – 2
Event duration used for calculating Relative Abundance Index (RAI) of leopards’ natural and
domestic prey
Wild prey Event duration (seconds)
Sambar (Rusa unicolor) 60
Blackbuck (Antilope cervicapra) 60
Chital (Axis axis) 120
Barking deer (Muntiacus vaginalis) 60
Four-horned antelope (Tetracerus quadricornis) 60
Indian Chevrotain (Moschiola indica) 60
Wild pig (Sus scrofa) 60
Black-naped hare (Lepus nigricollis) 60
Porcupine (Hystrix indica) 60
Indian pangolin (Manis crassicaudata) 60
Bonnet macaque (Macaca radiata) 360
Tufted grey langur (Semnopithecus priam) 180
Domestic prey Event duration (seconds)
Large livestock 300
Small livestock 180
Domestic dog 60

29
Appendix – 3
Categorisation of prey species into large and small wild prey
Species Scientific name
Small Wild Prey (SWP) <20 kg
Black-naped hare Lepus nigricollis
Bonnet macaque Macaca radiata
Tufted grey langur Semnopithecus priam
Mouse deer Moschiola indica
Porcupine Hystrix indica
Indian pangolin Manis crassicaudata
Large Wild Prey (LWP) >20 kg
Barking deer Muntiacus vaginalis
Blackbuck Antilope cervicapra
Chital Axis axis
Four-horned antelope Tetracerus quadricornis
Sambar Rusa unicolor
Wild pig Sus scrofa
Domestic prey
Buffalo Bubalus bubalis
Cow Bos taurus
Donkey Equus africanus asinus
Goat Capra aegagrus hircus
Sheep Ovis aries
Domestic pig Sus scrofa domesticus
Domestic dog Canis lupus familiaris

30
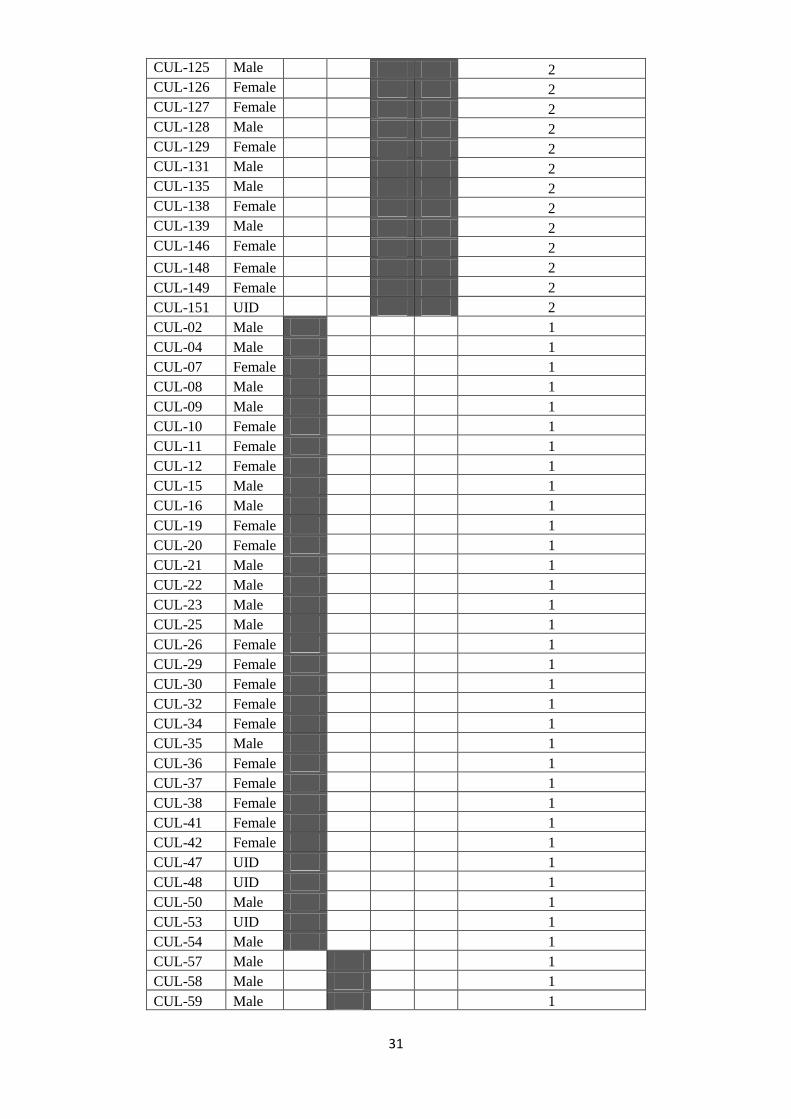
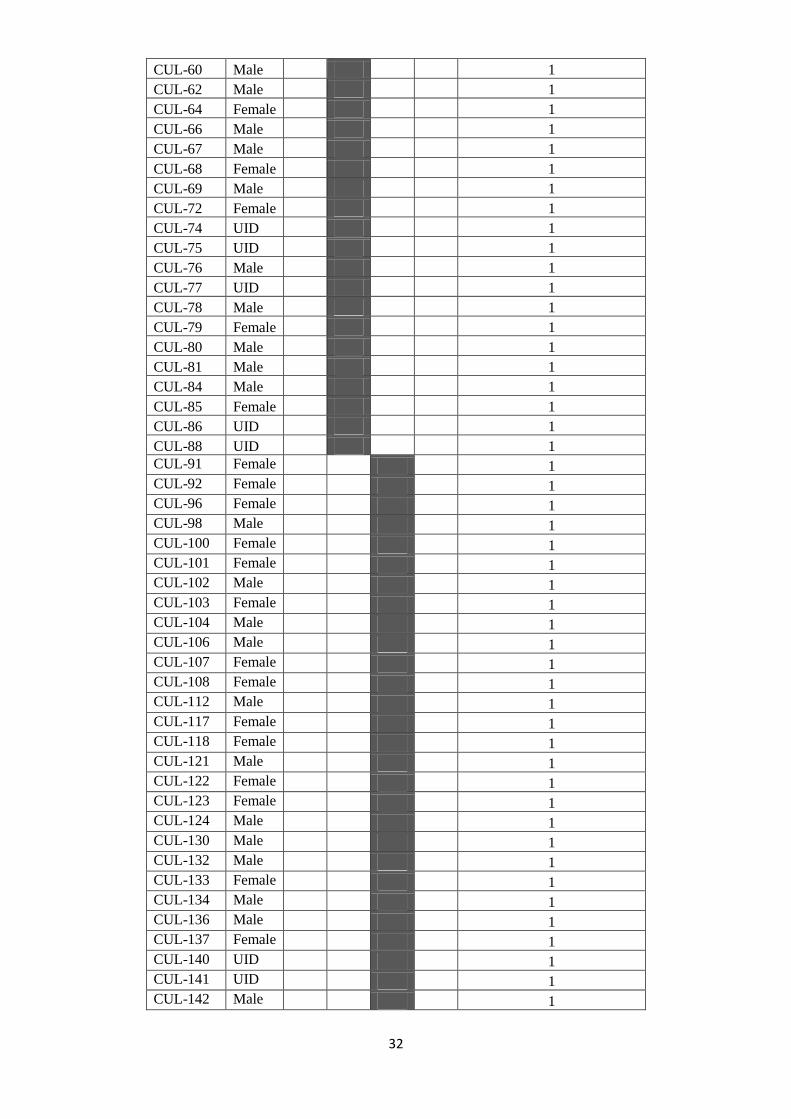
Appendix-4
Leopard individuals captured in Cauvery Wildlife Sanctuary in each survey year are depicted with the
darkened cells.
Individual Sex 2014 2016 2018 2020 Number of years captured
CUL-06 Female 4
CUL-14 Female 4
CUL-24 Male 4
CUL-17 Male 3
CUL-18 Female 3
CUL-27 Female 3
CUL-40 Female 3
CUL-51 Female 3
CUL-65 Female 3
CUL-71 Female 3
CUL-83 Female 3
CUL-87 Female 3
CUL-89 Male 3
CUL-01 Male 2
CUL-03 Female 2
CUL-05 Male 2
CUL-13 Male 2
CUL-28 Female 2
CUL-31 Female 2
CUL-33 Female 2
CUL-39 Female 2
CUL-44 Female 2
CUL-61 Male 2
CUL-63 Male 2
CUL-70 Male 2
CUL-73 Female 2
CUL-82 Male 2
CUL-90 Female 2
CUL-93 Male 2
CUL-94 Female 2
CUL-95 Female 2
CUL-97 Female 2
CUL-99 Male 2
CUL-105 Female 2
CUL-109 Male 2
CUL-110 Female 2
CUL-111 Male 2
CUL-113 Female 2
CUL-114 Female 2
CUL-115 Male 2
CUL-116 Male 2
CUL-119 Male 2
CUL-120 Female 2
31
CUL-125 Male 2
CUL-126 Female 2
CUL-127 Female 2
CUL-128 Male 2
CUL-129 Female 2
CUL-131 Male 2
CUL-135 Male 2
CUL-138 Female 2
CUL-139 Male 2
CUL-146 Female 2
CUL-148 Female 2
CUL-149 Female 2
CUL-151 UID 2
CUL-02 Male 1
CUL-04 Male 1
CUL-07 Female 1
CUL-08 Male 1
CUL-09 Male 1
CUL-10 Female 1
CUL-11 Female 1
CUL-12 Female 1
CUL-15 Male 1
CUL-16 Male 1
CUL-19 Female 1
CUL-20 Female 1
CUL-21 Male 1
CUL-22 Male 1
CUL-23 Male 1
CUL-25 Male 1
CUL-26 Female 1
CUL-29 Female 1
CUL-30 Female 1
CUL-32 Female 1
CUL-34 Female 1
CUL-35 Male 1
CUL-36 Female 1
CUL-37 Female 1
CUL-38 Female 1
CUL-41 Female 1
CUL-42 Female 1
CUL-47 UID 1
CUL-48 UID 1
CUL-50 Male 1
CUL-53 UID 1
CUL-54 Male 1
CUL-57 Male 1
CUL-58 Male 1
CUL-59 Male 1
32
CUL-60 Male 1
CUL-62 Male 1
CUL-64 Female 1
CUL-66 Male 1
CUL-67 Male 1
CUL-68 Female 1
CUL-69 Male 1
CUL-72 Female 1
CUL-74 UID 1
CUL-75 UID 1
CUL-76 Male 1
CUL-77 UID 1
CUL-78 Male 1
CUL-79 Female 1
CUL-80 Male 1
CUL-81 Male 1
CUL-84 Male 1
CUL-85 Female 1
CUL-86 UID 1
CUL-88 UID 1
CUL-91 Female 1
CUL-92 Female 1
CUL-96 Female 1
CUL-98 Male 1
CUL-100 Female 1
CUL-101 Female 1
CUL-102 Male 1
CUL-103 Female 1
CUL-104 Male 1
CUL-106 Male 1
CUL-107 Female 1
CUL-108 Female 1
CUL-112 Male 1
CUL-117 Female 1
CUL-118 Female 1
CUL-121 Male 1
CUL-122 Female 1
CUL-123 Female 1
CUL-124 Male 1
CUL-130 Male 1
CUL-132 Male 1
CUL-133 Female 1
CUL-134 Male 1
CUL-136 Male 1
CUL-137 Female 1
CUL-140 UID 1
CUL-141 UID 1
CUL-142 Male 1

33
CUL-143 Male 1
CUL-144 Female 1
CUL-145 UID 1
CUL-147 UID 1
CUL-152 UID 1
CUL-153 Female 1
CUL-154 UID 1
CUL-155 Female 1
CUL-156 Male 1
CUL-157 Male 1
CUL-158 Male 1
CUL-159 Male 1
CUL-160 Female 1
CUL-161 Male 1
CUL-162 Female 1
CUL-163 Female 1
CUL-164 Female 1
CUL-165 Male 1
CUL-166 Female 1
CUL-167 Female 1
CUL-168 Female 1
CUL-169 Female 1
CUL-170 UID 1
CUL-171 Female 1
CUL-172 Female 1
CUL-173 Female 1
CUL-174 Male 1
CUL-175 Male 1
CUL-176 Female 1
CUL-177 Male 1
CUL-178 Female 1
CUL-179 Female 1
CUL-180 Male 1
CUL-181 Female 1
CUL-182 Female 1
CUL-183 Female 1
CUL-184 Male 1
CUL-185 Male 1
CUL-186 Female 1
CUL-187 Male 1
CUL-188 Female 1
CUL-189 Male 1
CUL-190 Female 1
CUL-191 Male 1
CUL-192 Male 1
CUL-193 Male 1
CUL-194 Female 1
CUL-195 Female 1

34
CUL-196 UID 1
CUL-197 UID 1
CUL-198 Female 1
CUL-199 UID 1

Research team
Dr.Sanjay Gubbi
Harish N.S.
Girish M. N.
Shravan Suthar
Poornesha H.C.
Amrita M. Menon
Sandesh Appu Naik
Gnanendra L.
Ravidas Ganesh Gawda
Ruma K. Kandurkar
Praveen T. V.