Embed Size (px)
Citation preview

Office for Budget Responsibility
Economic and fiscal outlook
March 2019
CP 50

Office for Budget Responsibility: Economic and fiscal outlook
Presented to Parliament by the Exchequer Secretary to the Treasury by Command of Her Majesty
March 2019
CP 50

© Crown copyright 2019
This publication is licensed under the terms of the Open Government Licence v3.0 except where otherwise stated. To view this licence, visit nationalarchives. gov.uk/doc/open-government-licence/version/3
Where we have identified any third party copyright information you will need to obtain permission from the copyright holders concerned.
This publication is available at www.gov.uk/government/publications
Any enquiries regarding this publication should be sent to us at [email protected]
ISBN 978-1-5286-1090-2 CCS0319708842 03/19
Printed on paper containing 75% recycled fibre content minimum
Printed in the UK by the APS Group on behalf of the Controller of Her Majesty’s Stationery Office

Contents
Foreword...................................................................................... 1
Chapter 1 Executive summary
Overview ................................................................................ 5
Economic developments since our previous forecast .................. 7
The economic outlook ............................................................. 8
The fiscal outlook .................................................................. 11
Performance against the Government’s fiscal targets............... 17
Chapter 2 Developments since the last forecast
Economic developments ........................................................ 19
Fiscal developments .............................................................. 22
Developments in outside forecasts .......................................... 22
Chapter 3 Economic outlook
Introduction .......................................................................... 25
Assumptions regarding the UK’s exit from the EU .................... 25
The output gap and potential output....................................... 29
Key economy forecast assumptions......................................... 33
Prospects for real GDP growth ............................................... 39
Prospects for inflation ............................................................ 44
Prospects for nominal GDP .................................................... 46
Prospects for individual sectors of the economy ....................... 47
Box 3.1: UK stockbuilding...................................................... 54
Risks and uncertainties........................................................... 59
Comparison with external forecasters ..................................... 61
Chapter 4 Fiscal outlook
Introduction .......................................................................... 69
Assumptions regarding the UK’s exit from the EU .................... 70

Policy announcements ........................................................... 71
Classification changes ........................................................... 72
Public sector receipts ............................................................. 73
Public sector expenditure ....................................................... 89
Deficit aggregates ............................................................... 114
Box 4.1: How do governments respond to good
and bad news in our forecasts?..................................... 119
Financial transactions and cash borrowing ........................... 122
Balance sheet aggregates .................................................... 130
Financial sector interventions ............................................... 137
Risks, uncertainties and contingent liabilities ......................... 139
International comparisons.................................................... 142
Chapter 5 Performance against the Government’s fiscal targets
Introduction ........................................................................ 145
The Government’s fiscal targets ........................................... 145
The implications of our central forecast................................. 146
Recognising uncertainty ....................................................... 155
Annex A Policy measures announced since October
Overview ............................................................................ 163
Government policy decisions................................................ 163
Uncertainty ......................................................................... 171
Update on previous measures .............................................. 173
Policy risks .......................................................................... 178
Annex B Accounting for student loans
Introduction ........................................................................ 183
Fiscal illusions from student loans......................................... 184
The proposed ONS approach: part grant, part loan.............. 186
Fiscal impacts of the new treatment ...................................... 188
Determinants of student loans estimates ............................... 189
Revisions to outturns and forecasts ....................................... 192
Index of charts and tables ............................................................................. 195
Supplementary information and charts and tables data are available on our website.
Foreword
The Office for Budget Responsibility (OBR) was established in 2010 to provide independent and
authoritative analysis of the UK’s public finances.
In this Economic and fiscal outlook (EFO) we set out forecasts to 2023-24. We also assess whether
the Government is on course to meet the medium-term fiscal and welfare spending targets that it
has set itself. The forecasts presented in this document represent the collective view of the three
independent members of the OBR’s Budget Responsibility Committee (BRC). We take full
responsibility for the judgements that underpin them and for the conclusions we have reached.
We have, of course, been hugely supported in this by the staff of the OBR. We are enormously
grateful for the hard work, expertise and professionalism that they have brought to the task. Given
the highly disaggregated nature of the fiscal forecasts we produce, we have also drawn heavily on
the work and expertise of officials across government, including in HM Revenue and Customs, the
Department for Work and Pensions, HM Treasury, the Ministry of Housing, Communities and Local
Government, the Department for Business, Energy and Industrial Strategy, the Department for
Education, the Ministry of Justice, the Home Office, the Oil and Gas Authority, the Office for
National Statistics, the UK Debt Management Office, the Scottish Government and Scottish Fiscal
Commission, the Welsh Government, the Department for Communities in Northern Ireland,
Transport for London and various public service pension schemes. We are grateful for their time and
patience.
Given the legal requirement for the OBR to base its forecasts on current Government policy, we
once again asked the Government to provide us with any detail on post-Brexit policies in relation to
trade, migration and EU finances. We also requested guidance on the policy assumptions we should
make in the event of a ‘no deal’ exit from the EU:
• On future migration and trade regimes, as on previous occasions, the Government directed us
to the July 2018 White Paper on the future relationship between the UK and EU.1 It also pointed
us to its December 2018 White Paper: The UK’s future skills-based immigration system, which
sets out high-level objectives for future migration policy.2
• On future financial flows, the Government directed us to the Withdrawal Agreement, which puts
in legal form the financial settlement that was set out in the December 2017 Joint Report.3,4 In
addition, the Government directed us to the Political Declaration, which sets out the aims of a
framework for areas of possible future collaboration.5
1 Department for Exiting the European Union, The future relationship between the United Kingdom and the European Union, July 2018. 2 Home Office, The UK’s future skills-based immigration system, December 2018. 3 Department for Exiting the European Union, Withdrawal agreement and Political Declaration, November 2018. 4 Prime Minister’s Office and Department for Exiting the European Union, Joint report on progress during phase 1 of negotiations under Article 50 TEU on the UK’s orderly withdrawal from the EU, December 2017. 5 Department for Exiting the European Union, Withdrawal agreement and Political Declaration, November 2018.
1 Economic and fiscal outlook
Foreword
• On ‘no deal’ planning the Government directed us to the 106 technical notices published over
Autumn 2018 and the no deal readiness assessment published in February 2019. 6
As with the Government’s previous publications, securing the outcomes that it seeks will depend on
further policy development by the UK authorities and on the continuing negotiations with the EU,
once the process of withdrawal has been settled.
Our forecasts continue to be based on the provisional broad-brush adjustments that we made in our
November 2016 EFO to incorporate the possible impact of Brexit. These are set out in Chapter 3
(economy) and Chapter 4 (fiscal) of this document. We will review these assumptions once the final
Withdrawal Agreement has been approved (or not) by both the UK and the EU, and as more flesh is
put on the bones of the accompanying Political Declaration.
In the Foreword to our October 2018 EFO we identified several shortcomings in the forecast process
on that occasion that led to inconsistencies between our final forecast and the Treasury’s policy package, resulting from the late delivery of policy information from the Treasury. We have worked
with the Treasury to make mutually beneficial improvements to the process, including agreeing a
timetable that incorporates earlier deadlines for policy measures to be sent to us and enhancing the
process for assessing and incorporating the indirect effects of the policy package on the economy.
These changes have made the process smoother this time around, albeit in a forecast that does not
incorporate wide-ranging policy measures with a large cumulative effect. We are satisfied that the
Treasury recognises the importance of the changes we have made to the process.
While the forecast process has improved since October, it is unfortunate that we did not receive
confirmation of the Spring Statement date until 29 January, almost four weeks later than the 10-
week minimum set out in the Memorandum of Understanding between the OBR, HM Treasury and
other departments.7 Some uncertainty around timing was understandable given the critical stage of
the Brexit process. But compressing the timetable can adversely affect the accuracy and consistency
of our forecasts, so it is essential that this is not allowed to set a precedent for future fiscal events.
The full forecast timetable has been as follows:
• On 5 December the Treasury notified us that we should prepare to publish a forecast, no
earlier than the week beginning 25 February, without confirming the specific date necessary to
ensure a robust timetable. We agreed to start the process on this basis, but requested that the
specific date be confirmed in early January. We continued to prepare our forecasts to this
provisional timetable until the Spring Statement date was publicly confirmed by the Chancellor
on 29 January. At the Treasury’s request, we incorporated deadlines within the timetable that
allowed for the possibility of changing the Spring Statement to a full policy event.
6 Department for Exiting the European Union, Implications for business and trade of a no deal exit on 29 March 2019, February 2019. 7 Office for Budget Responsibility, Memorandum of understanding between the Office for Budget Responsibility, HM Treasury, the Department for Work & Pensions and HM Revenue & Customs, 2017.
Economic and fiscal outlook 2
Foreword
• We began the forecast process with the preparation by OBR staff of a revised economy
forecast, drawing on data released since our previous forecast in October and with our
preliminary judgements on the outlook for the economy. We sent our first economy forecast to
the Chancellor on 22 January.
• Using the economic determinants from this forecast (such as the components of nominal
income and spending, unemployment, inflation and interest rates) we then commissioned new
forecasts from the relevant government departments for the various tax and spending streams
that in aggregate determine the state of the public finances. We discussed these in detail with
the officials producing them, which allowed us to investigate proposed changes in forecasting
methodology and to assess the significance of recent tax and spending outturns. In many
cases, the BRC requested changes to methodology and/or the interpretation of recent data. We
sent our first fiscal forecast (including a provisional judgement on progress towards meeting
the fiscal targets) on 31 January.
• As the process continued, we identified key judgements that we would need to make to
generate our full economy forecast. Where we thought it would be helpful, we commissioned
analysis from the relevant analysts in the Treasury to inform our views. The BRC then agreed
the key judgements, allowing the production by OBR staff of a second full economy forecast.
• This provided the basis for a further round of fiscal forecasts. Discussion of these with HMRC,
DWP and other departments gave us the opportunity to follow up our requests for further
analysis, methodological changes and alternative judgements made during the previous
round. We provided our second economy and fiscal forecast to the Chancellor on 14 February.
• We then produced a third economy and fiscal forecast, which allowed us to take on latest data
and to ensure that our judgements on the fiscal forecast had been reflected. We completed this
final pre-policy-measures forecast and sent it to the Chancellor on 27 February.
• In line with the forecast timetable agreed with the Treasury, we were provided with details of
policy decisions with a potential wider impact on the economy forecast on 1 March. The BRC
met the Chancellor to discuss the forecast on 5 March.
• Meanwhile, we were scrutinising the costing of tax and spending measures that had been
announced since the Budget, and revisiting the universal credit costings we were unable to
certify then. After scrutinising updated and additional material provided by DWP analysts,
some corrections to these costings proved necessary, although thankfully these were relatively
small. At the time of closing this forecast, we still had queries about the analysis and modelling
that underpinned the estimated effects on disability benefits spending of the changes
associated with completing the transition of working-age claimants from disability living
allowance to personal independence payment. And, as usual, the BRC requested changes to
almost all the draft costings prepared by departments.
3 Economic and fiscal outlook

Foreword
• The Treasury made a written request, as provided for in the MoU between us, that we provide
the Chancellor and an agreed list of his special advisers and officials with a near-final draft of
the EFO on 8 March. This allowed the Treasury to prepare the Chancellor’s statement. We also
provided pre-release access to the full and final EFO on 12 March.
During the forecasting period, the BRC held around 40 scrutiny and challenge meetings with
officials from other departments, in addition to numerous further meetings at staff level. We have
been provided with all the information and analysis that we requested and have come under no
pressure from Ministers, advisers or officials to change any of our conclusions as the forecast has
progressed. A full log of our substantive contact with Ministers, their offices and special advisers can
be found on our website. This includes the list of special advisers and officials that received the near-
final draft of the EFO on 8 March.
Our non-executive members Sir Christopher Kelly and Bronwyn Curtis OBE provide additional
assurance over how we engage with the Treasury and other departments by reviewing any
correspondence that OBR staff feel either breaches the MoU requirement that it be confined to
factual comments only or could be construed as doing so. That review will take place over the next
two weeks and any concerns our non-executive members have will be raised with the Treasury’s Permanent Secretary or the Treasury Select Committee, if they deem that appropriate.
We would be pleased to receive feedback on any aspect of the content or presentation of our
analysis. This can be sent to [email protected].
Robert Chote Sir Charles Bean Andy King
The Budget Responsibility Committee
Economic and fiscal outlook 4
1 Executive summary
Overview
1.1 Economic growth in the UK and globally has slowed since the Budget in October, leading us
to revise down our near-term GDP forecast. But tax receipts have performed better than we
expected in the final months of 2018-19 and we judge that much of this buoyancy will
endure. Together with downward pressure on debt interest spending from lower market
interest rates, this delivers a modest medium-term improvement in the public finances. The
Chancellor has banked most of it in lower borrowing, but has spent some on higher
planned public services spending. Of the six forecasts we have produced since the EU
referendum, four have shown an improved outlook for the public finances and two have
shown a deterioration – but each one has been accompanied by some fiscal giveaway.
1.2 This forecast has been produced against the backdrop of considerable uncertainty over the
next steps in the Brexit process. With discussions in Brussels continuing and Parliament
scheduled to vote on various Brexit-related questions in the week of the Spring Statement,
we have no meaningful basis for changing the broad-brush assumptions that have
underpinned our forecasts since the referendum. So we continue to assume – consistent with
government policy at the time we finalised our forecast – that the UK makes an orderly
departure from the EU on 29 March into a transition period that lasts to the end of 2020.
1.3 Alternative outcomes, including a disorderly ‘no deal’ exit, remain the biggest short-term
risks to the forecast. But the smoothness, or otherwise, of the UK’s withdrawal from the EU is
but one step in the Brexit process, as negotiations on the terms of the UK’s future
relationship with the EU have yet to begin in earnest. So many decisions remain to be taken
that will help determine the eventual impact of Brexit on the economy and public finances.
1.4 The economy ended 2018 growing a little less strongly than we expected in October. In
recent weeks survey indicators of current activity have weakened materially, in part reflecting
heightened uncertainty related to Brexit. As a result, we have revised our forecast for GDP
growth this year down to 1.2 per cent – more than reversing the upward revision we made
in October in response to the Government’s discretionary fiscal loosening in the Budget. But
we have not altered our assessment of the outlook for potential output, so our medium-term
forecast is little changed: GDP growth still settles down to around 1½ per cent a year.
1.5 We now expect public sector net borrowing to come in at £22.8 billion (1.1 per cent of
GDP) this year, down £2.7 billion since October thanks primarily to higher income tax
receipts and lower debt interest spending. By 2023-24 the improvement since October is
£6.3 billion, again thanks primarily to higher income tax receipts and lower debt interest
spending (Chart 1.1). These downward pressures on borrowing are partially offset by the
5 Economic and fiscal outlook
Executive summary
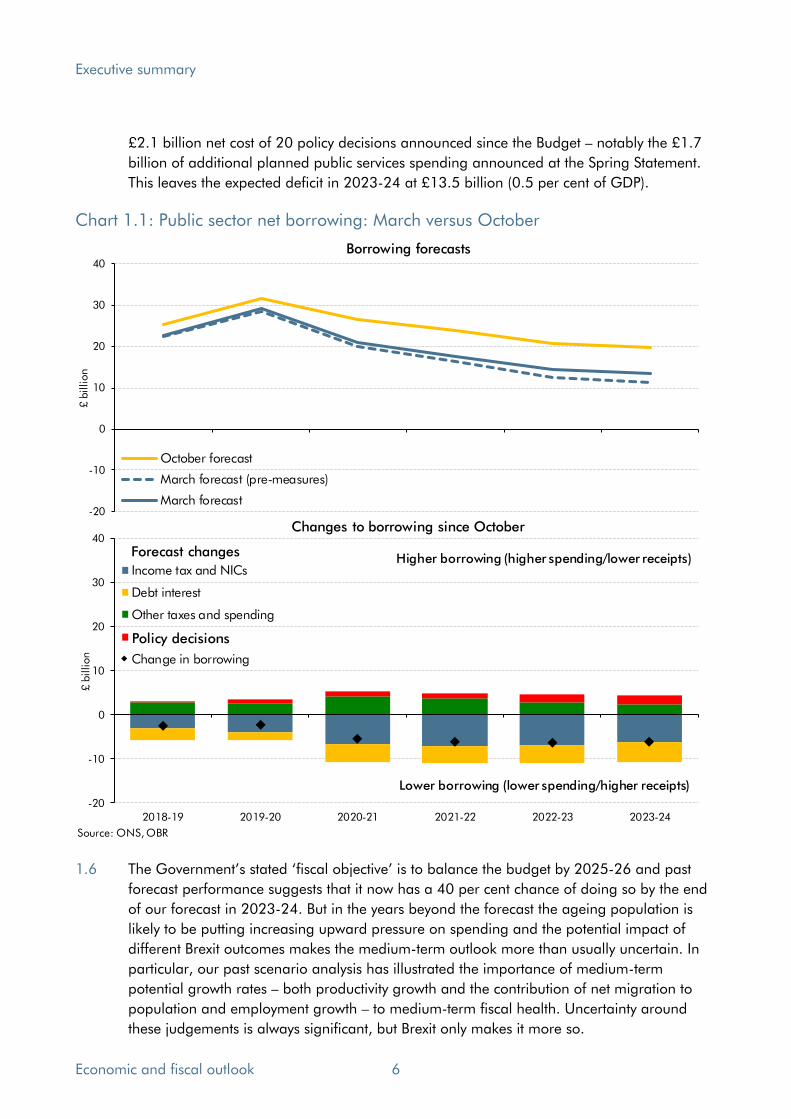
£2.1 billion net cost of 20 policy decisions announced since the Budget – notably the £1.7
billion of additional planned public services spending announced at the Spring Statement.
This leaves the expected deficit in 2023-24 at £13.5 billion (0.5 per cent of GDP).
Chart 1.1: Public sector net borrowing: March versus October
-20
-10
0
10
20
30
40
£ b
illion
October forecast
March forecast (pre-measures)
March forecast
Borrowing forecasts
-20
-10
0
10
20
30
40
2018-19 2019-20 2020-21 2021-22 2022-23 2023-24
£ b
illion
Income tax and NICs
Debt interest
Other taxes and spending
Change in borrowing
Source: ONS, OBR
Higher borrowing (higher spending/lower receipts)
Lower borrowing (lower spending/higher receipts)
Policy decisions
Forecast changes
Changes to borrowing since October
1.6 The Government’s stated ‘fiscal objective’ is to balance the budget by 2025-26 and past
forecast performance suggests that it now has a 40 per cent chance of doing so by the end
of our forecast in 2023-24. But in the years beyond the forecast the ageing population is
likely to be putting increasing upward pressure on spending and the potential impact of
different Brexit outcomes makes the medium-term outlook more than usually uncertain. In
particular, our past scenario analysis has illustrated the importance of medium-term
potential growth rates – both productivity growth and the contribution of net migration to
population and employment growth – to medium-term fiscal health. Uncertainty around
these judgements is always significant, but Brexit only makes it more so.
Economic and fiscal outlook 6

Executive summary
1.7 As regards the Government’s other fiscal targets, the forecast changes and policy decisions
leave the Chancellor with £26.6 billion (1.2 per cent of GDP) of headroom against his fiscal
mandate, which requires the structural budget deficit to lie below 2 per cent of GDP in
2020-21. This is up from £15.4 billion in October, as the fiscal costs of the temporary near-
term cyclical weakness of the economy have been swamped by the fiscal gains from higher
income tax and lower debt interest spending. The Chancellor also meets his supplementary
target of reducing net debt as a share of GDP in 2020-21. In this forecast it falls by 3.2 per
cent of GDP in that year, unchanged from October. (The ending of the Bank of England’s Term Funding Scheme contributes 2.2 percentage points of the decline.)
1.8 One risk to the public finance metrics that we do expect to crystallise over the coming
months is an improvement in the accounting treatment of student loans. From September
the Office for National Statistics will treat them partly as loans and partly as grants,
reflecting the fact that a large proportion of the loan outlays and associated interest are not
expected to be repaid. We do not yet know exactly how this will be done, so cannot reflect
the change in our central forecast. But we estimate that it could increase the structural
budget deficit by around £12 billion or 0.5 per cent of GDP in 2020-21. This would absorb
almost half the Government’s current headroom of 1.2 per cent of GDP against the fiscal
mandate as well as making a balanced budget harder to achieve.
Economic developments since our previous forecast
1.9 Real GDP grew by 0.8 per cent in the second half of 2018. That was a little weaker than we
expected in October, as an upside surprise in the third quarter was more than offset by an
unexpectedly large slowdown in the fourth. Net trade and private investment were markedly
weaker than expected, weighed down by a slowing global economy and Brexit-related
uncertainty. Business investment has fallen for four consecutive quarters – its longest
continuous decline since the financial crisis. Although the figures are volatile, monthly data
suggest that GDP fell in December. Moreover, a broad range of survey indicators suggest
that the softness has continued into 2019.
1.10 There is growing survey evidence that firms are building up stocks ahead of Brexit, although
this is less evident in the official data. The CIPS UK manufacturing PMI reported sharp rises
in both purchasing activity and a record stockpiling of inputs in February. But much of this is
likely to be imported goods and materials – especially those imported from the EU – so that
its impact on real GDP growth is likely to be largely offset by higher imports.
1.11 The recent growth disappointment has not been confined to the UK. Quarterly GDP growth
slowed in most major economies at the end of 2018. Growth in the euro area slowed to 0.2
per cent in each of the third and fourth quarters of 2018. US GDP growth was supported by
fiscal policy in 2018, but still slowed to 0.6 per cent in the fourth quarter. Thanks to the
relatively sharp slowdown in most other G7 economies, the UK moved from the bottom of
the G7 GDP growth league table at the start of 2018 to the middle of it by the end.
1.12 Despite slightly weaker GDP growth, the 211,000 increase in employment in the second
half of 2018 was slightly higher than we forecast in October. This was entirely accounted for
7 Economic and fiscal outlook

Executive summary
by a rise in participation, leaving the unemployment rate broadly flat at 4.0 per cent of the
labour force rather than dipping to 3.8 per cent as we expected in October. Average
earnings growth was also somewhat higher than expected, leading to stronger growth in
labour income that helps explain the buoyancy in income tax receipts in 2018-19.
1.13 Oil prices rose steadily in the first three quarters of 2018, then fell sharply to average $68 a
barrel in the fourth quarter – around 20 per cent lower than we assumed in October, based
on futures prices at the time. Partly as a result, CPI inflation fell back to 2.3 per cent in the
fourth quarter and to 1.8 per cent in January 2019. This is the first time for two years that
inflation has fallen below the Government’s 2 per cent target. GDP deflator inflation has
been in line with forecast. Combined with the weakness in activity, this means nominal GDP
growth in the second half of 2018 was 0.1 per cent lower than we expected in October.
The economic outlook
1.14 Parliament requires us to produce our forecasts on the basis of stated government policy,
but not necessarily assuming that particular objectives are achieved. With the terms of the
UK’s exit from the EU, and the nature of the future relationship, still to be settled, this is not
straightforward. In November 2018, the Withdrawal Agreement and Political Declaration
setting out the framework for the future relationship between the UK and EU were
published. The UK Government also published an immigration White Paper in December,
setting out proposals for the UK immigration regime in the post-transition period.
1.15 At the point we finalised this document (10 March) the precise terms on which the UK will
depart from the EU remained unclear. With no meaningful basis on which to predict the
nature of the future relationship between the UK and the EU, we have retained the broad-
brush assumptions on productivity, trade and migration in our previous post-referendum
forecasts. Reflecting the Withdrawal Agreement, we incorporate a transition period until
December 2020, during which the terms on which the UK and EU trade with each other will
remain unchanged. This means that we continue to assume that the UK makes an orderly
transition to a new – though as yet undefined – long-term relationship. But there remains
considerable uncertainty about the economic and fiscal implications of different potential
outcomes, including the impact of any policy response that might accompany them.
1.16 On this basis, we have left our assumptions about potential output growth unchanged in this
forecast. We judge that the economy was operating slightly above potential in the fourth
quarter of 2018 – by 0.2 per cent, little changed from the margin we assumed in October.
We have revised real GDP growth in 2019 down from 1.6 to 1.2 per cent, below our
estimate of potential output growth. This pushes the output gap into negative territory in
2020 (which is also the fiscal mandate target year). The downward revision is in part due to
slackening momentum in 2018 and our judgement that this will continue into early 2019,
offsetting the discretionary fiscal loosening announced in the Budget. As Brexit uncertainty
begins to dissipate, and productivity growth gradually improves, we expect GDP growth to
pick up to 1.4 per cent in 2020 and to 1.6 per cent a year thereafter as the small margin of
spare capacity is absorbed.
Economic and fiscal outlook 8

Executive summary
1.17 In the near term, the weakness in activity is concentrated in business investment and net
trade. Uncertainty related to the Brexit process sees business investment fall for a second
successive calendar year in 2019 – its weakest performance since the financial crisis. A
softening in the global outlook – and in particular a reduction in the trade intensity of world
GDP growth due to ongoing trade disputes – has dampened the outlook for UK export
market growth relative to October. As a result, net trade is now expected to reduce output
growth modestly in every year of the forecast.
1.18 Consistent with surveys suggesting an easing in employment intentions, we expect the
unemployment rate to rise marginally to 4.1 per cent in 2019 as output falls below
potential. We then expect it to fall back to our estimate of its equilibrium of rate of 4 per
cent by late 2022. The increase in employment over the forecast is more than accounted for
by population growth.
1.19 Average earnings growth has been stronger than we expected in our previous forecast. We
assume that some of this momentum is maintained, with growth of 3.1 per cent in 2019, up
from 2.5 per cent in our October forecast. Average earnings growth reaches 3.3 per cent by
2023, reflecting a modest increase in productivity growth.
1.20 We have revised down our forecast for CPI inflation since October, reflecting the recent fall
in the oil price and the modest disinflationary effect of the small degree of spare capacity
we expect to open up. CPI inflation dips to 1.9 per cent in 2020, returning to the 2 per cent
target thereafter. We have made a larger downward revision to RPI inflation due to the
much weaker outlook for house prices in 2019 and 2020.
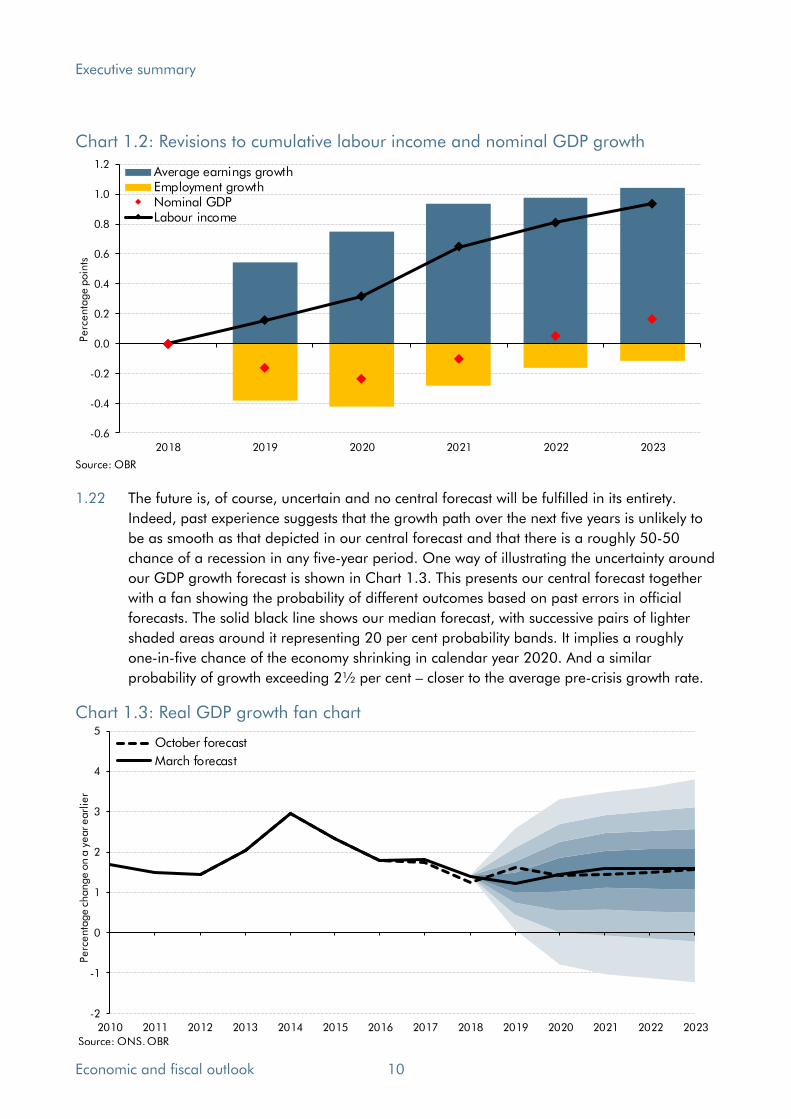
1.21 The small revisions to our GDP and inflation forecasts leave nominal GDP growth virtually
unchanged from October over the forecast, growing by 18.6 per cent between 2018-19
and 2023-24, up from 18.4 per cent in October. But the composition of that growth is more
‘tax-rich’ than we expected then. Looking at the income measure, the upward revision to
earnings growth means that cumulative labour income growth is just under 1 percentage
point higher than we forecast in October, despite slightly weaker than expected employment
growth (Chart 1.2). This boosts income tax and NICs receipts. In the expenditure measure of
nominal GDP, we expect this higher labour income to raise nominal consumer spending as
a share of GDP relative to our October forecast, which in turn boosts VAT receipts.
9 Economic and fiscal outlook
Executive summary
Chart 1.2: Revisions to cumulative labour income and nominal GDP growth
-0.6
-0.4
-0.2
0.0
0.2
0.4
0.6
0.8
1.0
1.2
2018 2019 2020 2021 2022 2023
Perc
enta
ge p
oin
ts
Average earnings growthEmployment growthNominal GDPLabour income
Source: OBR
1.22 The future is, of course, uncertain and no central forecast will be fulfilled in its entirety.
Indeed, past experience suggests that the growth path over the next five years is unlikely to
be as smooth as that depicted in our central forecast and that there is a roughly 50-50
chance of a recession in any five-year period. One way of illustrating the uncertainty around
our GDP growth forecast is shown in Chart 1.3. This presents our central forecast together
with a fan showing the probability of different outcomes based on past errors in official
forecasts. The solid black line shows our median forecast, with successive pairs of lighter
shaded areas around it representing 20 per cent probability bands. It implies a roughly
one-in-five chance of the economy shrinking in calendar year 2020. And a similar
probability of growth exceeding 2½ per cent – closer to the average pre-crisis growth rate.
Chart 1.3: Real GDP growth fan chart
-2
-1
0
1
2
3
4
5
2010 2011 2012 2013 2014 2015 2016 2017 2018 2019 2020 2021 2022 2023
Perc
enta
ge c
hange o
n a
year earl
ier
October forecast
March forecast
Source: ONS, OBR
Economic and fiscal outlook 10

Executive summary
Table 1.1: Overview of the economy forecast
Outturn
2017 2018 2019 2020 2021 2022 2023
Output at constant market prices
Gross domestic product (GDP) 1.8 1.4 1.2 1.4 1.6 1.6 1.6
GDP per capita 1.2 0.8 0.6 0.9 1.1 1.1 1.1
GDP levels (2017=100) 100.0 101.4 102.7 104.1 105.8 107.5 109.2
Output gap 0.0 0.2 -0.1 -0.2 -0.1 0.0 0.0
Expenditure components of real GDP
Household consumption 2.1 1.7 1.1 1.5 1.6 1.6 1.6
General government consumption -0.2 0.2 2.1 1.7 1.6 1.6 1.7
Business investment 1.5 -0.9 -1.0 2.3 2.3 2.4 2.4
General government investment 3.7 0.5 5.9 1.8 2.2 0.9 2.0
Net trade1 0.5 -0.2 -0.5 -0.2 -0.1 -0.1 -0.2
Inflation
CPI 2.7 2.5 2.1 1.9 2.0 2.0 2.0
Labour market
Employment (millions) 32.1 32.4 32.6 32.7 32.9 33.0 33.2
Average earnings 2.8 3.0 3.1 3.0 3.1 3.1 3.3
LFS unemployment (rate, per cent) 4.4 4.1 4.1 4.1 4.1 4.0 4.0
Output at constant market prices
Gross domestic product (GDP) 0.1 0.1 -0.4 0.0 0.1 0.1 0.0
GDP per capita 0.1 0.1 -0.4 0.0 0.1 0.1 0.0
GDP levels (2017=100) 0.0 0.1 -0.2 -0.2 -0.1 0.0 0.1
Output gap 0.0 0.0 -0.4 -0.4 -0.2 -0.1 -0.1
Expenditure components of real GDP
Household consumption 0.3 0.4 -0.1 0.3 0.3 0.2 0.1
General government consumption -0.1 -0.8 0.0 -0.3 -0.1 0.0 0.1
Business investment -0.2 -1.4 -3.2 0.2 0.3 0.3 0.2
General government investment 2.0 0.7 0.3 -1.5 0.4 0.1 0.6
Net trade1 -0.1 -0.4 -0.3 -0.1 -0.1 0.0 0.0
Inflation
CPI 0.0 -0.1 0.0 -0.1 -0.1 -0.1 0.0
Labour market
Employment (millions) 0.0 0.0 -0.1 -0.1 -0.1 -0.1 0.0
Average earnings 0.0 0.4 0.6 0.2 0.2 0.0 0.0
LFS unemployment (rate, per cent) 0.0 0.1 0.4 0.3 0.2 0.1 0.01 Contribution to GDP growth.
Changes since October forecast
Forecast
Percentage change on a year earlier, unless otherwise stated
The fiscal outlook
1.23 Public sector net borrowing has fallen sharply over the past decade, from its post-crisis peak
of 9.9 per cent of GDP (£153.1 billion) in 2009-10 to 1.1 per cent of GDP (£22.8 billion) in
2018-19 on our latest forecast. With the output gap in 2018-19 assumed to be slightly
positive, we judge that the structural deficit (which excludes the effect of the economic cycle)
will be a little higher than the headline deficit at 1.2 per cent of GDP. It is therefore already
below the 2 per cent of GDP target ceiling the Chancellor has set himself for 2020-21.
11 Economic and fiscal outlook

Executive summary
1.24 Table 1.2 shows that on current policy – including our assumptions regarding the UK’s exit
from the EU and new policies announced since our October forecast – we expect the deficit
to remain below 2 per cent of GDP throughout the forecast. It rises modestly in 2019-20,
then falls slowly in the four years to 2023-24. Our central forecast is for a structural deficit
of 0.8 per cent of GDP in 2020-21, well below the ceiling set in the ‘fiscal mandate’.
Table 1.2: Overview of the fiscal forecast
Outturn
2017-18 2018-19 2019-20 2020-21 2021-22 2022-23 2023-24
Revenue and spending
Public sector current receipts 36.4 37.0 36.9 37.1 37.1 37.2 37.2
Total managed expenditure 38.5 38.1 38.2 38.0 37.9 37.7 37.8
Deficit: Current and previous fiscal mandate measures
Cyclically adjusted net borrowing 2.0 1.2 1.3 0.8 0.7 0.6 0.5
Public sector net borrowing 2.0 1.1 1.3 0.9 0.7 0.6 0.5
Cyclically adjusted current budget deficit -0.1 -0.9 -0.8 -1.4 -1.5 -1.5 -1.6
Debt: Supplementary target
Public sector net debt 84.7 83.3 82.2 79.0 74.9 74.0 73.0
Revenue and spending
Public sector current receipts 753.1 789.0 811.4 844.0 874.0 906.6 941.5
Total managed expenditure 795.0 811.8 840.7 865.2 891.7 921.0 954.9
Deficit: Current and previous fiscal mandate measures
Cyclically adjusted net borrowing 41.5 24.9 28.7 18.9 15.9 13.9 13.4
Public sector net borrowing 41.9 22.8 29.3 21.2 17.6 14.4 13.5
Cyclically adjusted current budget deficit -1.3 -18.3 -18.3 -31.6 -34.5 -37.3 -40.4
Debt: Supplementary target
Public sector net debt 1779 1803 1838 1828 1796 1838 1878
£ billion
Per cent of GDP
Forecast
Changes in public sector net borrowing
1.25 As in October, we have revised down our pre-measures forecast for borrowing in every year
– but by only about half as much as in that forecast. This is driven by the relatively unusual
combination of an upward revision to receipts and a downward revision to debt interest
spending – only the fifth time that revisions to receipts and debt interest spending have
pushed borrowing in the same direction in the 19 forecast revisions since June 2010.
1.26 The drivers of these revisions are dominated by two factors:
• Despite little change in our forecast for nominal GDP growth, the tax-to-GDP ratio has
been revised up. This largely reflects near-term momentum in earnings growth and a
buoyant effective tax rate on labour income due to particularly strong earnings growth
among the highest earners. Both have boosted income tax and NICs receipts.
• Market-derived expectations of future interest rates are lower than in October,
reducing our forecast for debt interest payments. This is, however, likely to reflect the
market pricing in some probability of a ‘no deal’ Brexit and an associated monetary
Economic and fiscal outlook 12

Executive summary
policy easing. So to some extent it will not be consistent with the assumption of a
smooth exit that underpins our economy and receipts forecasts. If a smooth Brexit is
achieved, market interest rates – and our debt interest forecast – could rise again.
1.27 Chart 1.4 breaks down the main movements in our forecast since October.
Chart 1.4: Sources of revisions to our pre-measures PSNB forecast
-14
-12
-10
-8
-6
-4
-2
0
2
4
6
2018-19 2019-20 2020-21 2021-22 2022-23 2023-24
£ b
illion
Income tax and NICsDebt interestOther taxesOther spendingPSNB
Source: OBR
Factors increasing borrowing
Factors decreasing borrowing
1.28 Presented with this improvement in the outlook for the public finances, the Government has
once again decided to loosen discretionary fiscal policy – albeit modestly. This is the sixth
time in the six Budgets, Autumn and Spring Statements since the EU referendum that the
Chancellor has loosened the purse strings. Taken together, these discretionary moves have
significantly eased the squeeze on public spending that he inherited from his predecessor.
Underlying revisions to borrowing in 2018-19
1.29 Over the first 10 months of 2018-19, borrowing has fallen somewhat faster than we
assumed in our full-year forecast from October. This mainly reflects strong receipts growth
in January, the largest month for central government receipts, which were 9.8 per cent
higher than a year earlier.
1.30 Around half the January strength reflected self-assessment (SA) income tax and capital gains
tax payments that relate largely to liabilities incurred in 2017-18. Initial HMRC analysis
indicates that this strength was broadly based across the various SA tax streams, leading us
to revise up our 2018-19 SA income tax and CGT forecast by £1.7 billion. Our revisions to
other receipts forecasts for this year are largely offsetting, with higher PAYE income tax and
NICs receipts (partly driven by the continued strength in earnings growth, especially among
the highest earners) offset by weaker VAT and corporation tax revenues.
13 Economic and fiscal outlook
Executive summary
1.31 We have revised our spending forecast for 2018-19 down by £0.9 billion. That is more than
explained by lower debt interest, where RPI inflation in January 2019 – the key month for
accrued interest on index-linked gilts – was lower than we had predicted in October. (RPI
inflation feeds through to accrued interest on index-linked gilts with a lag of two months.)
1.32 Taking those factors into account, and bearing in mind that the new policy decisions do not
affect borrowing materially this year, we have revised overall borrowing in 2018-19 down
by £2.7 billion to £22.8 billion. That is broadly in line with the in-year forecast that would
be generated by extrapolating the year-to-date performance of the public finances.
Underlying revisions to borrowing from 2019-20 onwards
1.33 From 2019-20 onwards, our pre-measures borrowing forecast has been revised down in
every year, by £6.8 billion (0.3 per cent of GDP) a year on average:
• Just over half the revision reflects higher receipts, which are up by £3.5 billion a year
on average. That is more than explained by strength in income tax and NICs receipts,
thanks to the higher 2018-19 starting point and slightly stronger earnings growth. This
is partly offset by downward revisions to oil and gas revenues (due to lower oil and gas
prices), capital tax receipts (due to lower equity prices) and interest and dividend
receipts (due to lower market expectations of future interest rates).
• Just under half the revision reflects lower spending, which is down by £3.3 billion a
year on average. This is dominated by lower spending on debt interest, reflecting
lower near-term RPI inflation and lower market expectations for interest rates across
the forecast. Other spending revisions are largely offsetting, with higher welfare
spending (largely driven by an upward revision to our disability benefits forecast) offset
by other smaller items.
Government decisions
1.34 The Government does not consider this Spring Statement to be a full ‘fiscal event’ and has not produced a ‘scorecard’ of policy measures. But several measures have been announced
since the Budget and departmental spending totals were increased again in the Statement
itself. Overall, these changes add to borrowing by increasing amounts over the forecast
period, rising from £0.7 billion in 2019-20 to £2.1 billion in 2023-24:
• Total departmental spending has been increased by £0.2 billion in 2019-20, rising to
£1.7 billion in 2023-34. This comprises two main parts. First, the decision to keep
non-NHS current departmental spending flat in real terms despite higher GDP deflator
inflation adds amounts rising to £0.8 billion in 2023-24. Second, a further addition to
NHS funding – again to maintain real-terms funding in the face of revisions to GDP
deflator inflation – adds amounts that also rise to £0.8 billion in 2023-24.
• Several policy changes to universal credit (UC) and disability benefits. These include
delaying the rollout of personal independence payment and stopping the review of
some existing cases to free up capacity to finish the rollout. This costs £0.2 billion a
Economic and fiscal outlook 14

Executive summary
year on average from 2020-21 onwards. The decision not to limit the number of UC
child elements for some new UC claims and changes to the profile of the UC
managed migration phase have broadly offsetting effects over the five years.
• Other policy changes are smaller and their effects are largely offsetting. They include
raising the fees payable for an application for a grant of probate and the doubling of
the ‘immigration health surcharge’. Annex A provides more detail.
1.35 The modest net giveaway led us to revise our nominal GDP forecast up a fraction. This
reduces borrowing marginally in every year via higher tax revenues. Higher departmental
spending raises contributions to public service pension schemes, reducing net expenditure.
These effects are shown in the ‘Indirect effects’ row in Table 1.3.
Table 1.3: Changes to public sector net borrowing since October 230
Outturn
2017-18 2018-19 2019-20 2020-21 2021-22 2022-23 2023-24
October forecast 39.8 25.5 31.8 26.7 23.8 20.8 19.8
March forecast 41.9 22.8 29.3 21.2 17.6 14.4 13.5
Change 2.1 -2.7 -2.4 -5.5 -6.2 -6.4 -6.3
Underlying revisions to receipts 0.9 -1.7 -1.0 -2.5 -3.7 -5.0 -5.2
of which:
Income tax and NICs 1.1 -3.0 -4.0 -6.6 -7.1 -6.9 -6.1
VAT -0.1 0.5 0.6 0.4 0.1 -0.1 -0.3
Onshore corporation tax 0.4 1.2 0.7 0.2 -0.4 -0.6 -0.7
Capital taxes 0.0 -0.6 1.1 2.2 2.2 2.0 2.1
Other -0.4 0.2 0.6 1.3 1.4 0.5 -0.1
Underlying revisions to spending 1.2 -1.2 -2.2 -4.1 -3.6 -3.2 -3.2
of which:
Debt interest 0.0 -2.7 -1.9 -4.1 -4.0 -4.1 -4.6
Welfare spending 0.0 0.0 0.0 0.4 0.6 1.0 1.7
Departmental spending 0.5 -0.8 -0.8 0.0 0.0 0.0 0.0
Other changes 0.7 2.4 0.5 -0.4 -0.2 -0.1 -0.3
Total effect of Government decisions - 0.3 0.7 1.2 1.2 1.8 2.1
of which:
Departmental spending - 0.3 0.2 1.4 0.8 1.7 1.7
Other measures - 0.0 1.0 0.1 0.8 0.4 0.7
Indirect effects - 0.0 -0.4 -0.3 -0.4 -0.3 -0.3Memo: March pre-measures forecast 41.9 22.5 28.6 20.0 16.4 12.6 11.4
Note: This table uses the convention that a negative figure means a reduction in PSNB, i.e. an increase in receipts or a reduction in
spending will have a negative effect on PSNB.
£ billion
Forecast
15 Economic and fiscal outlook

Executive summary
Changes to public sector net debt
1.36 Our forecast for public sector net debt (PSND) has been revised down since October, by
steadily increasing amounts that reach 1.1 per cent of GDP in 2023-24.
1.37 We have revised down our pre-measures forecast due to:
• Modestly higher nominal GDP, which reduces the debt-to-GDP ratio slightly from
2020-21 onwards.
• The downward revisions to our pre-measures forecast for public sector net borrowing
reduce cash debt and the debt-to-GDP ratio by progressively larger amounts. This is
the largest source of change to our debt forecast since October.
• Upward revisions to our pre-measures financial transactions forecast, mainly due to
changes related to the timing of onshore corporation tax payments.
• Early redemptions in the Term Funding Scheme reduce debt at the start of the forecast
but this unwinds by 2021-22. Higher gilt prices and the assumption that the APF no
longer sells any assets within the forecast period increasingly add to debt.
1.38 As regards Government policy decisions, a short delay to a large UK Asset Resolution
(UKAR) asset sale increases debt in 2018-19 but this unwinds in 2019-20, after which the
effects of lower departmental spending dominate.
Table 1.4: Changes to public sector net debt since October
2018-19 2019-20 2020-21 2021-22 2022-23 2023-24
October forecast 83.7 82.8 79.7 75.7 75.0 74.1
March forecast 83.3 82.2 79.0 74.9 74.0 73.0
Change -0.4 -0.6 -0.7 -0.8 -1.0 -1.1
of which:
Change in nominal GDP1 -0.1 -0.1 -0.1 -0.2 -0.3 -0.3
Change in cash level of net debt -0.3 -0.6 -0.6 -0.6 -0.7 -0.7
October forecast 1810 1851 1841 1809 1856 1896
March forecast 1803 1839 1828 1796 1838 1878
Like-for-like change in cash debt -7 -12 -13 -13 -18 -19
of which:
Underlying forecast revisions -11 -11 -12 -13 -20 -23
Public sector net borrowing (pre-measures) -3 -6 -13 -20 -28 -37
Financial transactions (pre-measures) -6 -3 1 5 5 6
Valuation changes -1 -2 0 2 3 8
Effect of Government decisions 4 -1 -1 0 2 4
Affecting public sector net borrowing 0 1 3 5 7 9
Affecting financial transactions 4 -2 -3 -3 -3 -3
Indirect effects 0 0 -1 -1 -1 -21 Non-seasonally adjusted GDP centred end-March.
Per cent of GDP
Forecast
£ billion
Economic and fiscal outlook 16

Executive summary
The accounting treatment of student loans
1.39 The ONS plans to improve the accounting treatment for student loans. Compared to the
current treatment, spending will rise and receipts will fall, reflecting estimates of how much
of the principal extended and interest charged will never actually be paid. Our preliminary
estimate is that this will raise the recorded deficit by amounts rising from around £10 billion
in 2018-19 to £14 billion in 2023-24. These changes also produce lower valuations of the
stock of outstanding loans and so increase public sector net financial liabilities. This would
rise by 2.8 per cent of GDP compared to our central forecast from 2018-19 onwards. Cash
based measures such as the central government net cash requirement (CGNCR) and PSND
will not be affected by the change. Annex B provides further detail.
Performance against the Government’s fiscal targets
1.40 The Charter for Budget Responsibility requires the OBR to judge whether the Government
has a greater than 50 per cent chance of meeting its fiscal targets under current policy. The
latest version was approved by Parliament in January 2017.1
1.41 The current Charter states that the Government’s objective for fiscal policy is to “return the
public finances to balance at the earliest possible date in the next Parliament”. At the time
that it was drawn up, ‘the next Parliament’ was expected to run from 2020 to 2025.
1.42 The Charter also sets out targets for borrowing, debt and welfare spending that require:
• The structural deficit (cyclically adjusted public sector net borrowing) to lie below 2 per
cent of GDP by 2020-21 (the ‘fiscal mandate’).
• Public sector net debt to fall relative to GDP in 2020-21 (the ‘supplementary target’).
• Welfare spending (excluding the state pension and payments closely linked to the
economic cycle) to lie below a ‘welfare cap’. The latest version sets the effective cap 3
per cent above our November 2017 forecast for 2022-23 at £135 billion, with the
level of spending to be adjusted for subsequent changes in our inflation forecast.
1.43 Our central forecast implies that all three targets are on course to be met:
• Fiscal mandate: the structural deficit falls to 0.8 per cent of GDP in the target year,
giving a margin against the mandate of 1.2 per cent of GDP (£26.6 billion). These
margins are up from 0.7 per cent of GDP and £15.4 billion in October, with a little
under half due to lower structural spending and the rest from higher structural receipts.
• Supplementary target: public sector net debt falls by 3.2 per cent of GDP in 2020-21,
unchanged from our October forecast. The repayment of loans issued under the
Bank’s Term Funding Scheme at the end of their four-year term accounts for 2.2 per
cent of GDP of the year-on-year fall.
1 The latest and previous versions are available on the ‘Legislation and related material’ page of our website.
17 Economic and fiscal outlook
Executive summary
• Welfare cap: the relevant welfare spending is forecast to be £1.6 billion below the cap
in 2022-23, and £5.5 billion below the cap-plus-margin.
1.44 Achieving the broader balanced budget fiscal objective in 2025-26, looks challenging
(although this lies beyond our formal forecasting horizon). In particular, this is a period in
which population ageing will continue to exert upward pressure on spending, and more so
than in recent years when the state pension age has been rising. That said, the chances of
the Government balancing the budget by 2025-26 – ignoring the potential effects of the
new accounting treatment for student loans – look greater than they did in October. The
probability of balancing the budget as early as 2023-24 (based purely on past forecast
performance), is now 40 per cent, up from 35 per cent in October.
1.45 The uncertainties around our central forecast reflect those regarding the outlook for the
economy and those regarding the performance of revenues and spending in any given state
of the economy. We assess the robustness of our judgements in three ways:
• First, by looking at past forecast errors. If our central forecasts are as accurate as
official forecasts in the past, then the chance that the structural deficit would be below
2 per cent of GDP in 2020-21is around 75 per cent – slightly higher than in October.
• Second, by looking at the sensitivity of the deficit to key features of the economy
forecast. The 1.2 per cent of GDP margin relative to the 2 per cent structural deficit
ceiling would fall to zero if potential output were 2.4 per cent lower, or if the effective
tax rate were 1.2 per cent of GDP lower for structural reasons.
• Third, drawing on our previous economic scenarios to examine the channels through
which a ‘no deal’ Brexit could affect the public finances. We conclude that the range of
possible fiscal outcomes is clearly large, given the uncertainty both around the
economic impact and around the nature and effectiveness of any policy response. But
while the short-term shock to the economy would no doubt have fiscal costs, the more
significant channels would probably be via its longer-term impact on potential output.
The direct fiscal effects of any policy response (such as tariff policy or fiscal stimulus)
would also affect the final path of the deficit, though this is presently unknowable.
Economic and fiscal outlook 18

2 Developments since the last forecast
2.1 This chapter summarises:
• the main economic and fiscal developments since our previous forecast in October
(from paragraph 2.2); and
• recent external forecasts for the UK economy (from paragraph 2.12).
Economic developments
GDP growth since our October 2018 forecast
2.2 Since our October forecast, the ONS has published Quarterly National Accounts for the
third quarter of 2018, which included upward revisions to GDP in 2017. The ONS has also
published its first estimate of GDP for the fourth quarter of 2018, which included upward
revisions to GDP in the first half of 2018. The net effect was to increase real GDP growth
from the fourth quarter of 2016 to the second quarter of 2018 from 1.9 to 2.1 per cent.
Private consumption more than explained this upward revision (Table 2.1).
Table 2.1: Contributions to real GDP growth from 2016Q4 to 2018Q2
Private
consumption
Government
consumption
Government
investment
Private
investmentNet trade Stocks
GDP growth,
per cent
October forecast 1.5 0.0 0.0 1.0 0.0 -0.8 1.9
Latest data 1.9 -0.1 0.0 1.0 -0.3 -0.9 2.1
Difference1 0.4 0.0 0.0 0.0 -0.2 -0.1 0.2
Percentage points
1 Difference in unrounded numbers, rounded to one decimal place.
Note: Components may not sum to total due to rounding, chain linking and statistical discrepancy. The statistical discrepancy is 0.0
percentage points for the latest data, and -0.2 percentage points for our October forecast.
2.3 In the second half of 2018, GDP grew by 0.8 per cent – a little lower than in our October
forecast (Table 2.2). The largest contributors were stockbuilding and private consumption,
which were both stronger than expected. In contrast, the contributions from net trade and
private investment were both markedly weaker than expected. The unexpectedly negative
contribution from net trade largely reflects weaker than expected export growth.
19 Economic and fiscal outlook

Developments since the last forecast
Table 2.2: Contributions to real GDP growth from 2018Q2 to 2018Q4
Private
consumption
Government
consumption
Government
investment
Private
investmentNet trade Stocks
GDP growth,
per cent
October forecast 0.2 0.3 0.2 0.2 0.6 -0.6 0.9
Latest data 0.5 0.2 0.2 -0.5 -0.1 0.4 0.8
Difference1 0.3 -0.1 0.0 -0.7 -0.6 1.0 -0.1
Percentage points
1 Difference in unrounded numbers, rounded to one decimal place.
Note: Components may not sum to total due to rounding. The statistical discrepancy is 0.0 percentage points for the latest data, and
0.0 for our October forecast.
2.4 GDP deflator inflation in the second half of 2018 was in line with our October forecast
(Table 2.3). Import prices rose less than expected (implying less of a drag on GDP deflator
inflation) and there were modest upside surprises in the government consumption and
government investment deflators. But these were offset by lower than expected inflation for
the export and private consumption deflators.
Table 2.3: Contributions to GDP deflator inflation from 2018Q2 to 2018Q4
Private
consumption
Government
consumption
Government
investment
Private
investmentExports Imports Stocks
October forecast 0.8 0.0 0.0 0.1 0.5 -0.9 0.3 0.9
Latest data 0.7 0.1 0.0 0.1 0.2 -0.6 0.3 0.9
Difference1 -0.1 0.1 0.1 0.0 -0.3 0.3 0.0 0.0
Percentage points
1 Difference in unrounded numbers, rounded to one decimal place.
Note: Components may not sum to total due to rounding, the statistical discrepancy, and changing weights. The statistical discrepancy
is 0.0 percentage points for the latest data, and 0.0 percentage points for our October forecast. Contributions are calculated on a fixed
weight basis, except the stocks contribution which includes the effects of price and volume changes.
Deflator
inflation,
per cent
2.5 Putting real GDP growth and GDP deflator inflation together, nominal GDP grew by 1.7 per
cent in the second half of 2018 – slightly below our October forecast (Table 2.4). Smaller
contributions than expected from private investment and net trade were only partly offset by
larger ones from stockbuilding, private consumption and government investment.
Table 2.4: Contributions to nominal GDP growth from 2018Q2 to 2018Q4
Private
consumption
Government
consumption
Government
investment
Private
investmentNet trade Stocks
October forecast 1.1 0.4 0.1 0.3 0.2 -0.3 1.8
Latest data 1.3 0.3 0.2 -0.4 -0.5 0.6 1.7
Difference1 0.2 0.0 0.1 -0.7 -0.7 1.0 -0.11 Difference in unrounded numbers, rounded to one decimal place.Note: Components may not sum to total due to rounding. The statistical discrepancy is 0.0 percentage points for the latest data, and
0.0 for our October forecast.
Percentage pointsGDP growth,
per cent
Economic and fiscal outlook 20
Developments since the last forecast
Conditioning assumptions
2.6 Sterling oil prices have fallen significantly since our October forecast. Our latest assumption
for the first quarter of 2019 is just under £48 per barrel – around 23 per cent down since
October (Table 2.5). Our current conditioning assumption for the sterling effective exchange
rate is slightly below October’s, largely reflecting a depreciation against the dollar. The FTSE
all-share index rose at the start of 2019, but this followed large falls in late 2018. The level
assumed for the first quarter of 2019 is just over 7 per cent below our October assumption.
Mortgage interest rates have been only a little lower than in our October forecast.
Table 2.5: Conditioning assumptions in 2019Q1
Oil price (£
per barrel)
US$/£
exchange
rate
€/£
exchange
rate
Sterling
exchange
rate index
Equity prices
(FTSE all-
share index)
Mortgage
interest rates
(%)1
October forecast 62.2 1.31 1.12 78.2 4142 2.55
Latest assumption 47.7 1.29 1.13 78.0 3850 2.50
Per cent difference -23.3 -1.8 1.6 -0.2 -7.1 -0.051 Difference is in percentage points.Note: Conditioning assumptions in October were based on a 10-day average of data up to 4 October 2018. The latest assumptions
are based on data up to 14 February 2019.
The labour market
2.7 The unemployment rate was 4.0 per cent in the fourth quarter of 2018. This was unchanged
from the second quarter (Table 2.6) but higher than we expected in October. Over the same
period, the employment rate increased by 0.2 percentage points, in line with our October
forecast. Average earnings growth – on the National Accounts derived measure that we
focus on in our economy forecast – was somewhat stronger than we expected.
Table 2.6: Labour market indicators from 2018Q2 to 2018Q4
Percentage change
Total
employmentUnemployment Participation
Employment
rate
Unemployment
rateAverage earnings
October forecast 189 -87 102 0.2 -0.3 1.5
Latest data 211 1 212 0.2 0.0 2.1
Difference1 22 88 110 0.0 0.2 0.6
Change in thousands Change in rate
1 Difference in unrounded numbers, rounded to one decimal place.
CPI inflation
2.8 CPI inflation was above the 2 per cent target throughout 2018, averaging 2.5 per cent. In
the fourth quarter of 2018 it had fallen back to 2.3 per cent – somewhat lower than we
expected in our October forecast. CPI inflation fell further in January 2019 to 1.8 per cent,
largely reflecting lower gas, electricity and petrol prices. This was the first time in two years
that inflation was below the 2 per cent inflation target.
21 Economic and fiscal outlook
Developments since the last forecast
The housing market
2.9 Average house prices rose 2.7 per cent in the fourth quarter of 2018 – slightly below our
October forecast. Annual growth in the Nationwide and Halifax indices both slowed to 1.3
per cent in the fourth quarter of 2018 and leading indicators of housing activity and prices
have weakened noticeably since our October forecast.
The global economy
2.10 World GDP is estimated to have grown by 3.7 per cent in 2018 – in line with our October
forecast. Although euro area and US GDP are estimated to have risen by 1.8 per cent, and
2.9 per cent respectively, quarterly growth slowed in the second half of 2018. The rate of
quarterly growth fell by 0.2 percentage points in the euro area and 0.4 percentage points in
the US between the second and fourth quarter of 2018. Inflation has risen in the euro area
by 0.5 percentage points between the fourth quarter of 2017 and fourth quarter of 2018 to
1.9 per cent. Inflation in the US rose by 0.1 percentage points to 2.2 per cent.
Fiscal developments
2.11 Over the first 10 months of 2018-19, the deficit has fallen faster than our October forecast
for the full year. In the year to date, the deficit is down by £18.5 billion (46.6 per cent) on a
year earlier, versus our October forecast for a full-year fall of £16.4 billion (39.2 per cent).
The unexpectedly rapid fall largely reflects strength in January tax receipts, with central
government receipts up 9.8 per cent on a year earlier. Nearly half of this relates to self-
assessment income tax and capital gains tax, largely reflecting income and capital gains tax
liabilities generated in 2017-18. Our latest fiscal forecast – which includes a small
downward revision to borrowing this year – is detailed in Chapter 4.
Developments in outside forecasts
2.12 Many private sector, academic and other outside organisations produce forecasts for the UK
economy. 1 This section sets out some of the movements in these forecasts since our October
EFO. When interpreting the average of outside forecasts, it is important to bear in mind that
different bodies may forecast somewhat different definitions of the same variables and that
the average forecast need not be internally consistent. At the current juncture, it is worth
noting in particular that forecasters may differ in their Brexit assumptions.
Real GDP growth
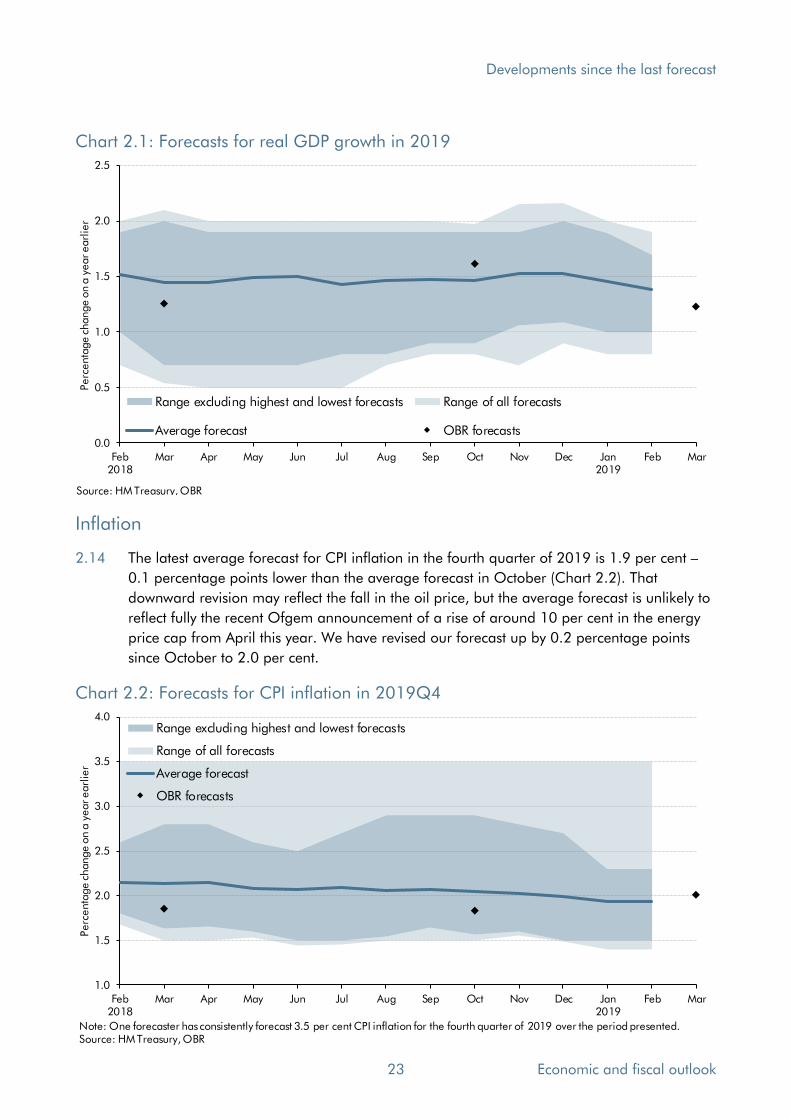
2.13 The average forecast for real GDP growth in 2019 currently stands at 1.4 per cent (Chart
2.1). This is slightly lower than the average forecast of 1.5 per cent in October, which
probably reflects the effect of relatively weak quarterly GDP growth at the end of 2018. The
average GDP growth forecast then rises to 1.6 per cent in 2020. Our forecast for GDP
growth in 2019 is currently a little below the average, at 1.2 per cent.
1 See HM Treasury, Forecasts for the UK economy: February 2019. A full list of contributors is available at the back of the Treasury publication. Several financial reporting services also monitor average or consensus figures.
Economic and fiscal outlook 22
Developments since the last forecast
Chart 2.1: Forecasts for real GDP growth in 2019
0.0
0.5
1.0
1.5
2.0
2.5
Feb2018
Mar Apr May Jun Jul Aug Sep Oct Nov Dec Jan2019
Feb Mar
Perc
enta
ge c
hange o
n a
year earl
ier
Range excluding highest and lowest forecasts Range of all forecasts
Average forecast OBR forecasts
Source: HM Treasury, OBR
Inflation
2.14 The latest average forecast for CPI inflation in the fourth quarter of 2019 is 1.9 per cent – 0.1 percentage points lower than the average forecast in October (Chart 2.2). That
downward revision may reflect the fall in the oil price, but the average forecast is unlikely to
reflect fully the recent Ofgem announcement of a rise of around 10 per cent in the energy
price cap from April this year. We have revised our forecast up by 0.2 percentage points
since October to 2.0 per cent.
Chart 2.2: Forecasts for CPI inflation in 2019Q4
1.0
1.5
2.0
2.5
3.0
3.5
4.0
Feb2018
Mar Apr May Jun Jul Aug Sep Oct Nov Dec Jan2019
Feb Mar
Perc
enta
ge c
hange o
n a
year earl
ier
Range excluding highest and lowest forecasts
Range of all forecasts
Average forecast
OBR forecasts
Note: One forecaster has consistently forecast 3.5 per cent CPI inflation for the fourth quarter of 2019 over the period presented.Source: HM Treasury, OBR
23 Economic and fiscal outlook

Developments since the last forecast
The labour market
2.15 The latest average forecast for the unemployment rate in the fourth quarter of 2019 is 4.1
per cent (Chart 2.3) – down 0.1 percentage points from October. We have revised our
forecast up since October by 0.4 percentage points. It is now in line with the latest average.
Chart 2.3: Forecasts for unemployment in 2019Q4
3.0
3.5
4.0
4.5
5.0
5.5
Feb2018
Mar Apr May Jun Jul Aug Sep Oct Nov Dec Jan2019
Feb Mar
Per ce
nt
Range excluding highest and lowest forecasts Range of all forecasts
Average forecast OBR forecasts
Source: HM Treasury, OBR
The public finances
2.16 Public sector net borrowing has fallen slightly faster than we expected in October and in this
EFO we have lowered our full-year forecast by £2.7 billion to £22.8 billion. The latest
average forecast for borrowing in 2018-19 is higher than ours at £33.1 billion, although
these forecasts were all prepared before the latest Public sector finances data release on 21
February that reported strong growth in January tax receipts.
2.17 The average of the smaller sample of medium-term forecasts suggests that borrowing will
continue to fall modestly year on year, reaching £27.4 billion in 2023-24. This is a slower
decline from a higher level than in our central forecast. As well as reflecting differences in
views about the economic outlook, most external forecasts will be based on what their
authors consider to be the most likely path of fiscal policy. In contrast, Parliament requires
us to base our forecasts solely on the Government’s current policies. Outside forecasters may also have made different assumptions about the fiscal consequences of Brexit, beyond
those captured by their views on how it will affect the economy – for example, regarding
contributions to the EU after March 2019 and any offsetting spending in other areas.
Economic and fiscal outlook 24
3 Economic outlook
Introduction
3.1 This chapter:
• describes our assumptions and judgements in respect of the UK’s forthcoming exit
from the EU (from paragraph 3.2);
• sets out our estimates of the amount of spare capacity in the economy and our
judgement regarding the growth in the economy’s productive potential that underpins
our forecasts for actual GDP growth (from paragraph 3.9);
• describes the key conditioning assumptions for the forecast, including credit conditions,
the exchange rate and the world economy (from paragraph 3.20);
• sets out our real GDP growth forecasts (from paragraph 3.38) and the outlook for
inflation (from paragraph 3.46) and nominal GDP (from paragraph 3.52);
• discusses recent developments and prospects for the household, corporate,
government and external sectors of the economy (from paragraph 3.54); and
• outlines risks and uncertainties (from paragraph 3.91) and compares our central
forecast with those of selected external organisations (from paragraph 3.93).
Assumptions and judgements for the UK’s exit from the EU
Current assumptions and judgements
3.2 The OBR is required by legislation to produce its forecasts based on current government
policy (but not necessarily assuming that particular policy objectives will be met). With the
terms of the UK’s exit from the EU and the nature of the future relationship between the two
still to be settled, this is not straightforward. We asked the Government if it wished to
provide any additional information on post-Brexit policies in relation to trade and migration
that would be relevant to our forecasts. As set out in the Foreword, it directed us to the July
2018 White Paper on the future relationship between the UK and EU and the immigration
White Paper published in December 2018.1, 2
1 Department for Exiting the European Union, The future relationship between the United Kingdom and the European Union, July 2018. 2 HM Government, The UK’s future skills-based immigration system, December 2018.
25 Economic and fiscal outlook
Economic outlook
3.3 Parliament is scheduled to vote on various Brexit-related questions in the week of the Spring
Statement – after we closed the forecast. But reflecting the draft Withdrawal Agreement
published in November 2018, our forecast incorporates a transition period until December
2020 – during which time the terms on which the UK and EU trade with each other will
remain unchanged.3 This means that we continue to assume that the UK makes an orderly
transition to a new – though, as yet, undefined – long-term relationship. Our remit does not
allow us to produce scenarios based on alternative government policy, such as the UK
leaving the EU without the implementation of a Withdrawal Agreement. But our Brexit
discussion paper sets out how different trading and migration relationships could affect our
forecasts,4 and Chapter 5 summarises some of our previous scenarios that shed light on the
responsiveness of the public finances to changes in the outlook.
3.4 Given the relatively high-level nature of the Political Declaration – which accompanied the
Withdrawal Agreement – and the current uncertainty as to how the Government will respond
to the choices and trade-offs it faces during the negotiations regarding the future
relationship between the UK and the EU, we still have no meaningful basis for predicting the
post-Brexit trading relationship beyond the near term. We have not made any changes to
our net migration forecast on the basis of the Government’s immigration White Paper as the Government only plans to publish final immigration rules after a year of consultation. We
have therefore retained the same broad-brush assumptions regarding Brexit that
underpinned our previous post-referendum forecasts. Specifically, for the economy forecast,
we assume that:
• The UK leaves the EU on 29 March 2019 – two years after Article 50 was invoked – but there is a transition period until December 2020.
• The extra frictions associated with new trading arrangements with the EU and other
countries slows import and export growth over a 10-year period. We calibrated this
based on external studies of different possible trade regimes and have assumed
broadly offsetting impacts from exports and imports on net trade and GDP growth.
• The vote to leave the EU will be associated with lower net inward migration, but that
net inward migration will remain above ‘tens of thousands’. We assume that the UK adopts a tighter migration regime than that currently in place and that ‘pull factors’ – such as a fall in the value of UK wages in prospective immigrants’ home currencies due to the past depreciation of the pound – will be weaker. The data do indeed
suggest that inward migration from the EU has fallen since the referendum, consistent
with the weakening of pull factors. But overall net inward migration has not fallen to
the extent implied by the ONS principal migration projections (which we use as the
base for our forecast), as the fall in net immigration from the EU has been partially
offset by a rise in net immigration from non-EU countries.
3 For more information, see European Commission, Draft Agreement on the withdrawal of the United Kingdom of Great Britain and Northern Ireland from the European Union and the European Atomic Energy Community, 2018. 4 OBR, Brexit and the OBR’s forecasts, 2018.
Economic and fiscal outlook 26
Economic outlook
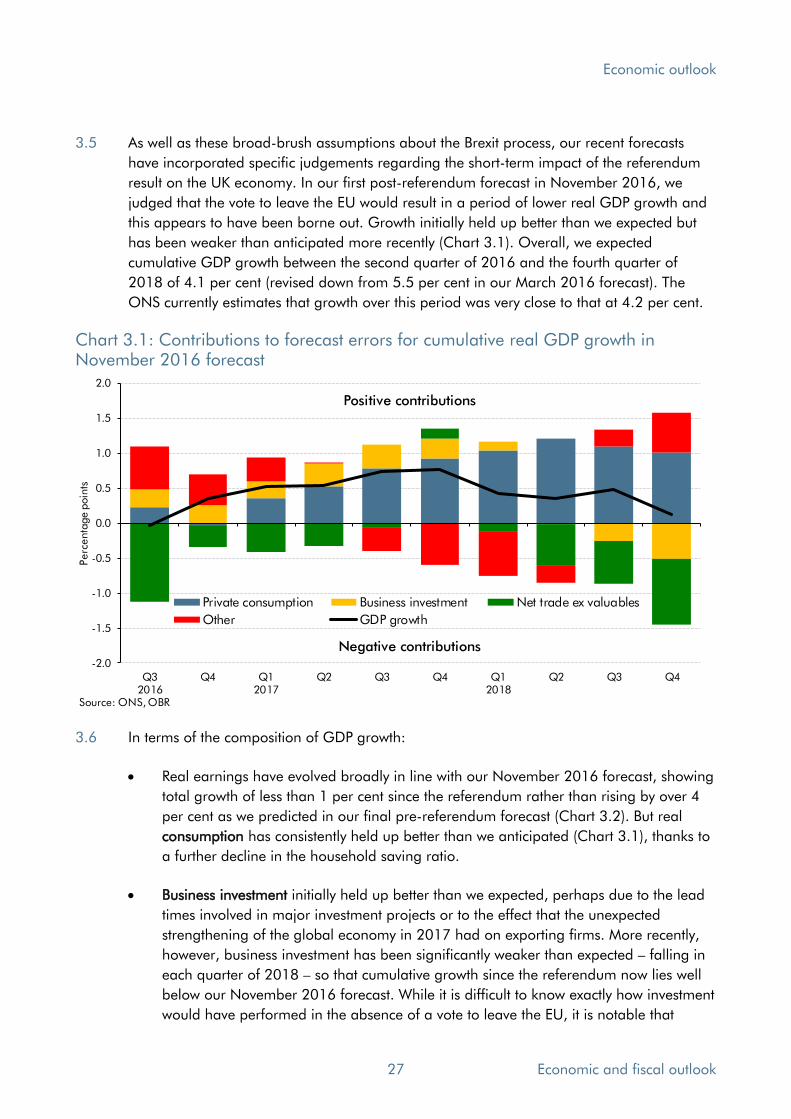
3.5 As well as these broad-brush assumptions about the Brexit process, our recent forecasts
have incorporated specific judgements regarding the short-term impact of the referendum
result on the UK economy. In our first post-referendum forecast in November 2016, we
judged that the vote to leave the EU would result in a period of lower real GDP growth and
this appears to have been borne out. Growth initially held up better than we expected but
has been weaker than anticipated more recently (Chart 3.1). Overall, we expected
cumulative GDP growth between the second quarter of 2016 and the fourth quarter of
2018 of 4.1 per cent (revised down from 5.5 per cent in our March 2016 forecast). The
ONS currently estimates that growth over this period was very close to that at 4.2 per cent.
Chart 3.1: Contributions to forecast errors for cumulative real GDP growth in November 2016 forecast
-2.0
-1.5
-1.0
-0.5
0.0
0.5
1.0
1.5
2.0
Q32016
Q4 Q12017
Q2 Q3 Q4 Q12018
Q2 Q3 Q4
Perc
enta
ge p
oin
ts
Private consumption Business investment Net trade ex valuables
Other GDP growth
Source: ONS, OBR
Negative contributions
Positive contributions
3.6 In terms of the composition of GDP growth:
• Real earnings have evolved broadly in line with our November 2016 forecast, showing
total growth of less than 1 per cent since the referendum rather than rising by over 4
per cent as we predicted in our final pre-referendum forecast (Chart 3.2). But real
consumption has consistently held up better than we anticipated (Chart 3.1), thanks to
a further decline in the household saving ratio.
• Business investment initially held up better than we expected, perhaps due to the lead
times involved in major investment projects or to the effect that the unexpected
strengthening of the global economy in 2017 had on exporting firms. More recently,
however, business investment has been significantly weaker than expected – falling in
each quarter of 2018 – so that cumulative growth since the referendum now lies well
below our November 2016 forecast. While it is difficult to know exactly how investment
would have performed in the absence of a vote to leave the EU, it is notable that
27 Economic and fiscal outlook

Economic outlook
growth in non-dwellings investment has been significantly weaker in the UK than in the
other G7 economies since the referendum (Chart 3.3).
• We expected the substantial fall in the pound around the time of the referendum to
provide only a modest boost to net trade. While trade outturns have been volatile, net
trade has been significantly weaker than we expected – reducing GDP growth since the
referendum rather than raising it. This suggests that the fall in the pound around the
time of the referendum has not provided much of a boost to GDP growth.
Chart 3.2: Contributions to real Chart 3.3: G7 non-dwellings investment earnings growth
-8
-6
-4
-2
0
2
4
6
8
Q22016
Q4 Q22017
Q4 Q22018
Q4
Per ce
nt
Average earningsCPI inflationReal earningsMarch 2016 real earningsNovember 2016 real earnings
Source: ONS, OBR
98
100
102
104
106
108
110
112
114
Q22016
Q4 Q22017
Q4 Q22018
Q4
Q2 2
016=
100
CanadaFranceGermanyItalyJapanUSUK
Source: OECD
Future forecast issues
3.7 When more substantive detail is available on the future trade and migration relationship
between the UK and EU, we will adjust our Brexit assumptions appropriately. Our
November 2016 lowering of the path of potential output largely reflected the effects of
weaker business investment on potential productivity growth and of lower migration on
labour supply. But as time passes, impediments to the exploitation of comparative
advantage as a result of increased trade barriers are likely to become more salient. We will
also need to assess the likely impact on both the volume and composition of migrant flows
of any new migration regime.
3.8 These are static effects – one-off shifts in the potential level of output in the economy,
although they affect growth rates as the economy moves to that new steady-state. But some
studies suggest that increased barriers to trade, migration and foreign direct investment are
also likely to have further adverse dynamic effects – persistent effects on the growth rate of
potential output – for example, by impeding technology transfer and slowing innovation and
technological progress. There is little consensus on the size of such effects and they are likely
to interact. So, rather than quantify them individually, we will probably take them into
account in a broad-brush fashion in our top-down judgements on potential productivity and
output.
Economic and fiscal outlook 28
Economic outlook
The output gap and potential output
3.9 Judgements about the margin by which economic activity currently exceeds or falls short of
its potential or sustainable level, and about the future growth of potential output provide the
foundations of our forecast. They determine the scope for growth in GDP over the next five
years consistent with the Bank of England meeting its inflation target over the medium term.
3.10 An estimate of the output gap is also necessary for us to judge the size of the structural
budget deficit – the deficit that would be observed if the economy were operating at its
sustainable level.5 If the economy were running below potential, part of the headline deficit
would be cyclical, and could therefore be expected to diminish as the output gap closed and
above-trend growth boosted revenues and reduced spending. The opposite would be the
case if the economy were running above potential.
3.11 In this section, we describe our latest estimates for the output gap and consider the pace at
which potential output will grow in the future. Then we describe our central forecast for the
path that actual output will take over the next five years, relative to that for potential.
Our latest estimates of the output gap
3.12 The first step in our forecast is to assess how the current level of activity compares with the
level consistent with stable inflation in the long term (or potential output) – the output gap.
Potential output cannot be observed directly, but various techniques can be used to infer it,
including survey indicators, statistical filters and production functions. Every method has
limitations and none avoids the need for judgement.6 We therefore consider a broad range
of evidence at each forecast. Specifically, our judgement is informed by estimates of the
output gap implied by nine different approaches (Charts 3.4 and 3.5), although we place
more weight on some than others and this can vary from forecast to forecast:
• Surveys from the Confederation of British Industry (CBI) and British Chambers of
Commerce (BCC) suggest that firms faced heightened recruitment difficulties and were
operating at full capacity in 2018. Both the ‘principal components’ and ‘aggregate
composite’ estimates derived from these surveys moved into positive territory in 2017,
and have stayed significantly positive as firms have reported elevated recruitment
difficulties. We put limited weight on these measures in our overall assessment as they
tend to be volatile and have recently suggested implausible degrees of overheating.
• The two ‘statistical filters’ that utilise output data alone imply that the economy is
currently operating slightly below potential. We place less weight on these measures
too, as they are prone to substantial revision as new data becomes available.
5 The methodology we use is described in Helgadottir et al (2012): OBR Working Paper No.3: Cyclically adjusting the public finances. 6 Methodological details, along with some of the strengths and weaknesses of each approach, were set out in Murray (2014): OBR Working Paper No.5: Output gap measurement: judgement and uncertainty. See also our Briefing Paper No.2: Estimating the output gap and Pybus (2011): OBR Working Paper No.1: Estimating the UK’s historical output gap.
29 Economic and fiscal outlook
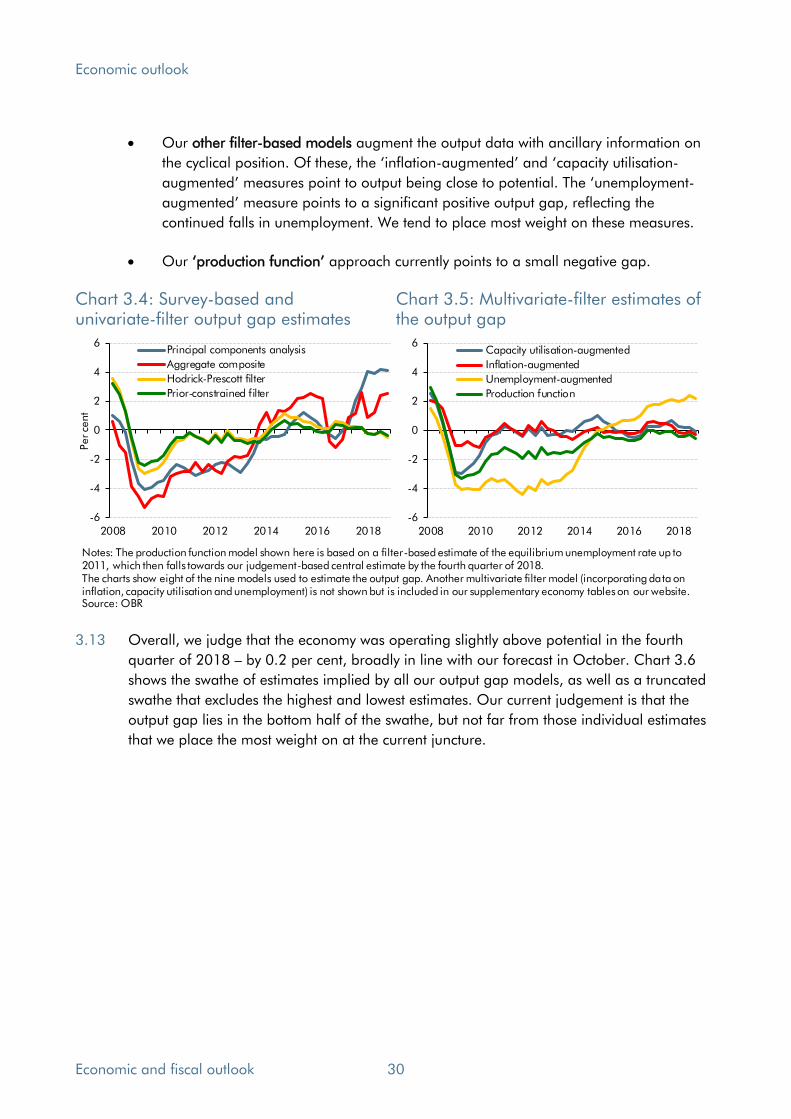
Economic outlook
• Our other filter-based models augment the output data with ancillary information on
the cyclical position. Of these, the ‘inflation-augmented’ and ‘capacity utilisation-
augmented’ measures point to output being close to potential. The ‘unemployment-
augmented’ measure points to a significant positive output gap, reflecting the continued falls in unemployment. We tend to place most weight on these measures.
• Our ‘production function’ approach currently points to a small negative gap.
Chart 3.4: Survey-based and Chart 3.5: Multivariate-filter estimates of univariate-filter output gap estimates the output gap
-6
-4
-2
0
2
4
6
2008 2010 2012 2014 2016 2018
Per ce
nt
Principal components analysis
Aggregate composite
Hodrick-Prescott filter
Prior-constrained filter
-6
-4
-2
0
2
4
6
2008 2010 2012 2014 2016 2018
Capacity utilisation-augmented
Inflation-augmented
Unemployment-augmented
Production function
Notes: The production function model shown here is based on a filter-based estimate of the equilibrium unemployment rate up to 2011, which then falls towards our judgement-based central estimate by the fourth quarter of 2018.The charts show eight of the nine models used to estimate the output gap. Another multivariate filter model (incorporating data on inflation, capacity utilisation and unemployment) is not shown but is included in our supplementary economy tables on our website.Source: OBR
3.13 Overall, we judge that the economy was operating slightly above potential in the fourth
quarter of 2018 – by 0.2 per cent, broadly in line with our forecast in October. Chart 3.6
shows the swathe of estimates implied by all our output gap models, as well as a truncated
swathe that excludes the highest and lowest estimates. Our current judgement is that the
output gap lies in the bottom half of the swathe, but not far from those individual estimates
that we place the most weight on at the current juncture.
Economic and fiscal outlook 30

Economic outlook
Chart 3.6: Range of output gap estimates
-6
-4
-2
0
2
4
6
Q12008
Q3 Q12009
Q3 Q12010
Q3 Q12011
Q3 Q12012
Q3 Q12013
Q3 Q12014
Q3 Q12015
Q3 Q12016
Q3 Q12017
Q3 Q12018
Q3
Per ce
nt
Range excluding highest and lowest estimatesRange of all estimatesOBR estimate
Source: OBR
3.14 Charts 3.7 and 3.8 compare our estimates of the output gap for 2018 and 2019 to those of
other forecasters, as set out in the Treasury’s Forecasts for the UK economy.7 These may
differ as a result of differences of judgement, or because of differences in the associated
concepts of potential output. The average estimate of the output gap is around zero in both
2018 and 2019, which is close to our estimates (+0.2 per cent and -0.1 per cent
respectively). These differences are very small relative to previous estimates of the output
gap and the uncertainty surrounding them.
Chart 3.7: Output gap estimates: 2018 Chart 3.8: Output gap estimates: 2019
-2.0
-1.6
-1.2
-0.8
-0.4
0.0
0.4
0.8
1.2
Per ce
nt
Average = 0.0 per cent
-2.0
-1.6
-1.2
-0.8
-0.4
0.0
0.4
0.8
1.2
Per ce
nt
Source: HM Treasury
Average = 0.0 per cent
7 2018 and 2019 output gap estimates are from HM Treasury, Forecasts for the UK economy, January and February editions respectively.
31 Economic and fiscal outlook

Economic outlook
The path of potential output
3.15 Our forecast for the size of the economy in five years’ time is in large part derived from our judgement regarding the prospective path for potential output, as a persistent output gap
would be incompatible with the Monetary Policy Committee (MPC) achieving and
maintaining its inflation objective over the medium term. There is considerable uncertainty
surrounding this judgement, which is only heightened by the UK’s prospective departure from the EU.
3.16 A key judgement relates to whether the stagnation in productivity since the financial crisis
will continue or unwind (and, if the latter, at what pace). Given that the unemployment rate
is nearing historical lows and it is government policy to limit inward migration, it is unlikely
that strong employment growth can continue to compensate for weak productivity growth. A
revival in productivity growth is therefore essential if even the subdued output growth rates
of the past few years are to be maintained.
3.17 There are four elements to our forecast for the potential total number of hours worked in the
economy: the number of adults in the country; the proportion of them participating in the
labour market; the proportion of those that could find employment; and the average
number of hours that they, in turn, would be willing and able to work:
• Population. Net inward migration in the year to the third quarter of 2018 has fallen
back from the levels seen in 2015 and 2016. The ONS has highlighted unusually high
uncertainty around the recent data, with different sources suggesting very different
paths for net migration of students in particular.8 Net inward migration was slightly
higher than implied by the ONS ‘principal’ population projection, which assumes a gradual decline in net inflows, reaching 165,000 a year in 2023. This part of our
forecast is unchanged from October. While the immigration regime following Brexit is
still uncertain, were it to be stricter, the result would be a smaller population and
labour force which in turn would reduce potential output.
• Participation. We forecast the participation rate using the same cohort-based labour
market model that underpins our long-term projections.9 It delivers a participation rate
that rises slightly in the near term before falling in the medium term, as the rising
share of the elderly outweighs the effect of increased participation by those nearing
retirement. Trend participation rates in this forecast are similar to those assumed in our
July 2018 Fiscal Sustainability Report.
• Employment. The proportion of those active in the labour force that would be able to
find employment sustainably is governed by our judgement regarding the equilibrium
unemployment rate. We expect it to remain around 4 per cent across the forecast.
• Average hours. We continue to assume that equilibrium average hours worked will
remain broadly flat.
8 See the ONS February 2019 Migration Statistics Quarterly Report for more information. 9 Annex A of our July 2014 Fiscal sustainability report discusses our longer-term approach to labour market modelling in more detail.
Economic and fiscal outlook 32
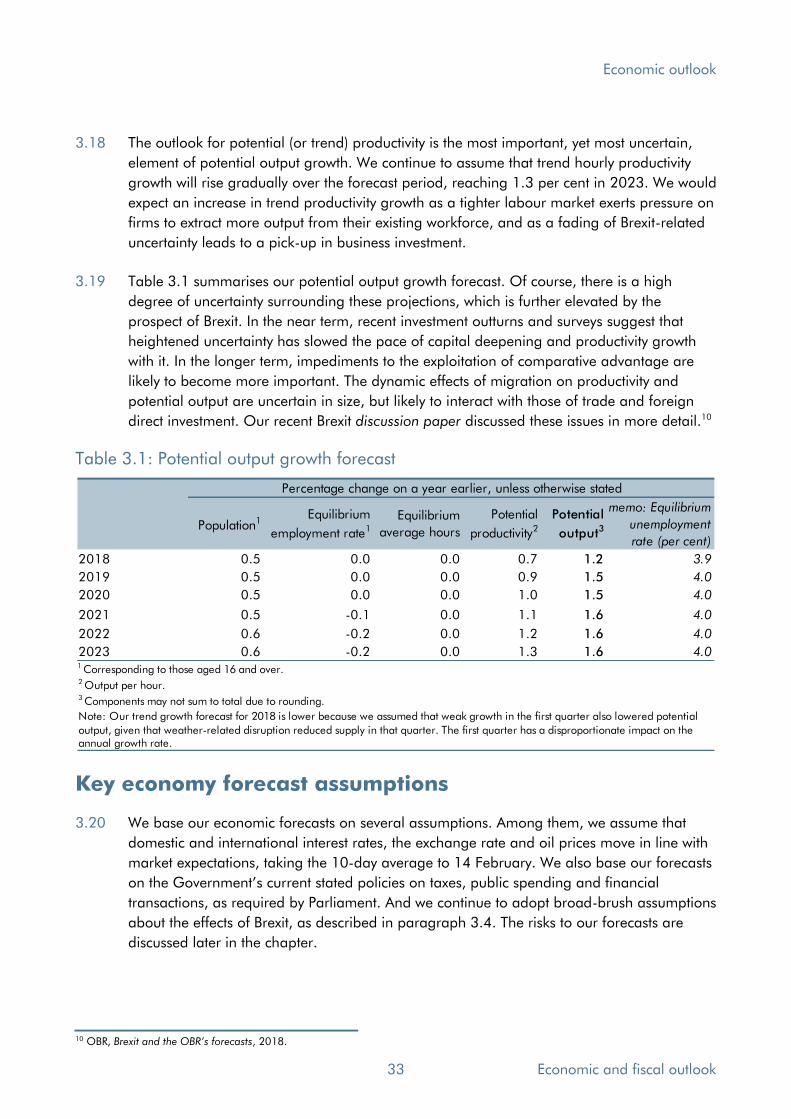
Economic outlook
3.18 The outlook for potential (or trend) productivity is the most important, yet most uncertain,
element of potential output growth. We continue to assume that trend hourly productivity
growth will rise gradually over the forecast period, reaching 1.3 per cent in 2023. We would
expect an increase in trend productivity growth as a tighter labour market exerts pressure on
firms to extract more output from their existing workforce, and as a fading of Brexit-related
uncertainty leads to a pick-up in business investment.
3.19 Table 3.1 summarises our potential output growth forecast. Of course, there is a high
degree of uncertainty surrounding these projections, which is further elevated by the
prospect of Brexit. In the near term, recent investment outturns and surveys suggest that
heightened uncertainty has slowed the pace of capital deepening and productivity growth
with it. In the longer term, impediments to the exploitation of comparative advantage are
likely to become more important. The dynamic effects of migration on productivity and
potential output are uncertain in size, but likely to interact with those of trade and foreign
direct investment. Our recent Brexit discussion paper discussed these issues in more detail.10
Table 3.1: Potential output growth forecast
Population1Equilibrium
employment rate1
Equilibrium
average hours
Potential
productivity2
Potential
output3
memo: Equilibrium
unemployment
rate (per cent)
2018 0.5 0.0 0.0 0.7 1.2 3.9
2019 0.5 0.0 0.0 0.9 1.5 4.0
2020 0.5 0.0 0.0 1.0 1.5 4.0
2021 0.5 -0.1 0.0 1.1 1.6 4.0
2022 0.6 -0.2 0.0 1.2 1.6 4.0
2023 0.6 -0.2 0.0 1.3 1.6 4.0
Percentage change on a year earlier, unless otherwise stated
1 Corresponding to those aged 16 and over. 2 Output per hour.3 Components may not sum to total due to rounding.
Note: Our trend growth forecast for 2018 is lower because we assumed that weak growth in the first quarter also lowered potential
output, given that weather-related disruption reduced supply in that quarter. The first quarter has a disproportionate impact on theannual growth rate.
Key economy forecast assumptions
3.20 We base our economic forecasts on several assumptions. Among them, we assume that
domestic and international interest rates, the exchange rate and oil prices move in line with
market expectations, taking the 10-day average to 14 February. We also base our forecasts
on the Government’s current stated policies on taxes, public spending and financial
transactions, as required by Parliament. And we continue to adopt broad-brush assumptions
about the effects of Brexit, as described in paragraph 3.4. The risks to our forecasts are
discussed later in the chapter.
10 OBR, Brexit and the OBR’s forecasts, 2018.
33 Economic and fiscal outlook

Economic outlook
Credit conditions
3.21 The MPC voted unanimously to maintain Bank Rate at 0.75 per cent at its February meeting.
The Committee also voted unanimously to maintain the stock of corporate and UK
government bond purchases at its current level. This decision reflected the view of the
Committee that “the current stance of monetary policy is appropriate”, based on a judgement that “demand and potential supply are currently broadly in balance”.
3.22 The market interest rates which our forecasts are based on suggest that market participants
expect Bank Rate to rise gradually over the next five years (Chart 3.9), but more slowly than
in our October forecast. Bank rate reached 1.52 per cent the first quarter of 2024 in our
October forecast, but it only reaches 1.16 per cent in this one. The MPC noted in February
that “an ongoing tightening of monetary policy over the forecast period…would be
appropriate to return inflation sustainably to the 2% target”, but that any future increases in
Bank Rate are likely to be “at a gradual pace and to a limited extent”.11
3.23 The fall in interest rate expectations since October may reflect market participants pricing in
a higher probability of a ‘no deal’ Brexit and associated monetary policy easing. This may
not be consistent with the assumption of a smooth exit that underpins the rest of our
forecast. If that were the case, interest rate expectations could rise if the possibility of a
disorderly Brexit were to be removed. Interest rate expectations increased slightly in the
period after we closed our pre-measures forecast. The four-day average to 1 March
(following the Prime Minister’s announcement of the three Brexit votes from 12 to 14 March)
showed Bank Rate reaching 1.26 per cent in the first quarter of 2024. In recent testimony at
the Treasury Select Committee, Governor Mark Carney stated: “Given the exceptional
circumstance associated with Brexit, I would expect the Committee to provide whatever
monetary support it can consistent with the price stability remit given to the Committee by
Parliament.”
3.24 Gilt rates have remained relatively stable over the past few quarters, but are presently a little
below the level assumed in our October forecast. The 20-year gilt rate was 1.9 per cent in
the fourth quarter of 2018 compared to the 2.0 per cent in our October forecast. Gilt rates
are expected to edge up, but to remain below the level in our October forecast. Global
bond yields are projected to be below the rates we assumed in October (Chart 3.10).
11 Bank of England, Inflation Report, February 2019.
Economic and fiscal outlook 34
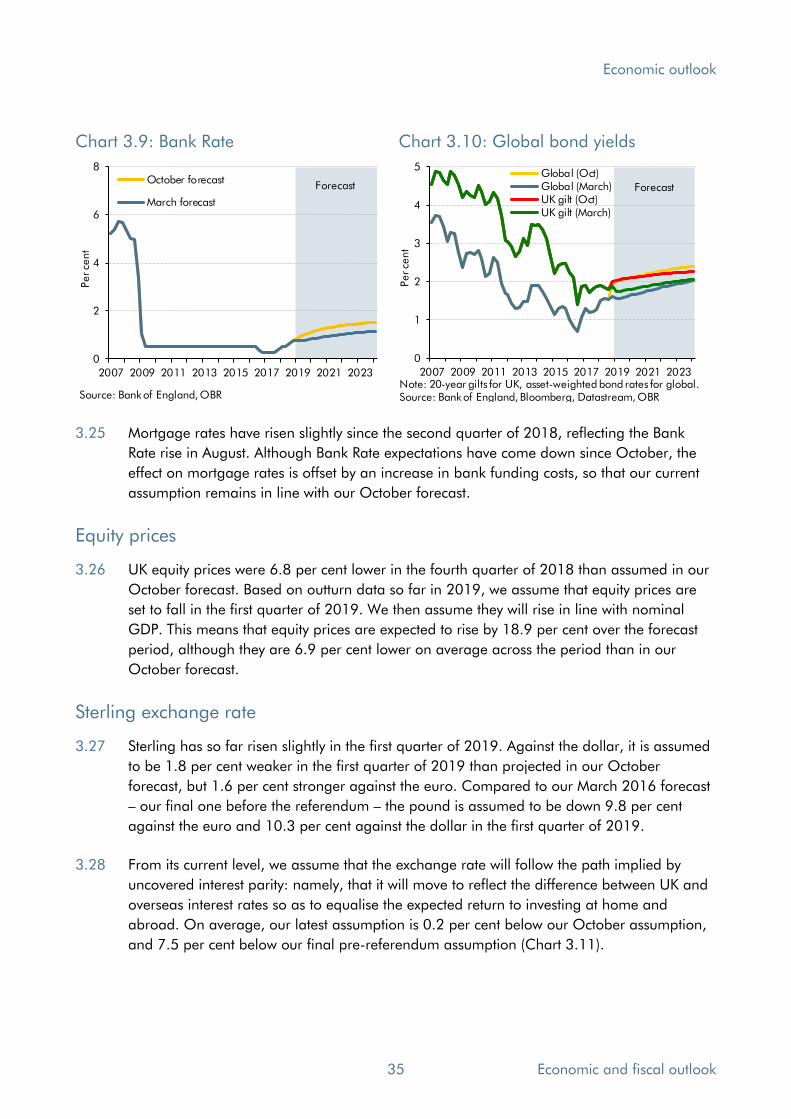
Economic outlook
Chart 3.9: Bank Rate Chart 3.10: Global bond yields
0
1
2
3
4
5
2007 2009 2011 2013 2015 2017 2019 2021 2023
Per ce
nt
Global (Oct)Global (March)UK gilt (Oct)UK gilt (March)
Note: 20-year gilts for UK, asset-weighted bond rates for global.Source: Bank of England, Bloomberg, Datastream, OBR
Forecast
0
2
4
6
8
2007 2009 2011 2013 2015 2017 2019 2021 2023
Per ce
nt
October forecast
March forecast
Forecast
Source: Bank of England, OBR
3.25 Mortgage rates have risen slightly since the second quarter of 2018, reflecting the Bank
Rate rise in August. Although Bank Rate expectations have come down since October, the
effect on mortgage rates is offset by an increase in bank funding costs, so that our current
assumption remains in line with our October forecast.
Equity prices
3.26 UK equity prices were 6.8 per cent lower in the fourth quarter of 2018 than assumed in our
October forecast. Based on outturn data so far in 2019, we assume that equity prices are
set to fall in the first quarter of 2019. We then assume they will rise in line with nominal
GDP. This means that equity prices are expected to rise by 18.9 per cent over the forecast
period, although they are 6.9 per cent lower on average across the period than in our
October forecast.
Sterling exchange rate
3.27 Sterling has so far risen slightly in the first quarter of 2019. Against the dollar, it is assumed
to be 1.8 per cent weaker in the first quarter of 2019 than projected in our October
forecast, but 1.6 per cent stronger against the euro. Compared to our March 2016 forecast
– our final one before the referendum – the pound is assumed to be down 9.8 per cent
against the euro and 10.3 per cent against the dollar in the first quarter of 2019.
3.28 From its current level, we assume that the exchange rate will follow the path implied by
uncovered interest parity: namely, that it will move to reflect the difference between UK and
overseas interest rates so as to equalise the expected return to investing at home and
abroad. On average, our latest assumption is 0.2 per cent below our October assumption,
and 7.5 per cent below our final pre-referendum assumption (Chart 3.11).
35 Economic and fiscal outlook
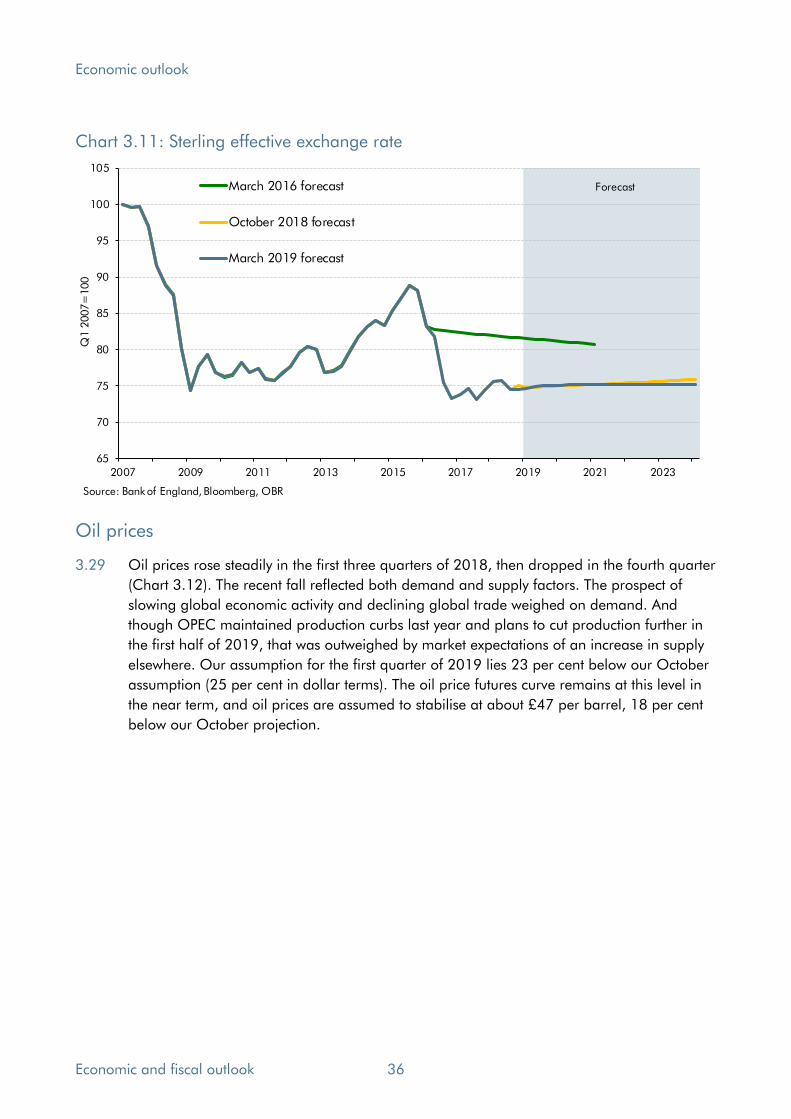
Economic outlook
Chart 3.11: Sterling effective exchange rate
65
70
75
80
85
90
95
100
105
2007 2009 2011 2013 2015 2017 2019 2021 2023
Q1 2
007=
100
March 2016 forecast
October 2018 forecast
March 2019 forecast
Source: Bank of England, Bloomberg, OBR
Forecast
Oil prices
3.29 Oil prices rose steadily in the first three quarters of 2018, then dropped in the fourth quarter
(Chart 3.12). The recent fall reflected both demand and supply factors. The prospect of
slowing global economic activity and declining global trade weighed on demand. And
though OPEC maintained production curbs last year and plans to cut production further in
the first half of 2019, that was outweighed by market expectations of an increase in supply
elsewhere. Our assumption for the first quarter of 2019 lies 23 per cent below our October
assumption (25 per cent in dollar terms). The oil price futures curve remains at this level in
the near term, and oil prices are assumed to stabilise at about £47 per barrel, 18 per cent
below our October projection.
Economic and fiscal outlook 36

Economic outlook
Chart 3.12: Oil price
0
10
20
30
40
50
60
70
80
2007 2008 2009 2010 2011 2012 2013 2014 2015 2016 2017 2018 2019 2020 2021 2022 2023 2024
£ p
er
barr
el
October forecast
March forecast
Forecast
Source: Datastream, IMF, OBR
Oil and gas production
3.30 Our potential output forecast excludes the small but volatile oil and gas sector, so to
complete our GDP forecast we add on a forecast for oil and gas production. Our
production forecasts are informed by the projections published by the Oil and Gas Authority
(OGA). Based on an early version of the OGA’s latest Stewardship Survey, we have revised
production down compared to October. Since we closed our forecast, BEIS announced an
upward revision to the 2018 oil production data, which came too late for us to incorporate
into our forecast. The latest estimate is that oil production in 2018 rose by 9.4 per cent on a
year earlier, higher than the 1.7 per cent rise we had assumed in our forecast. We will
incorporate this revision into our next forecast. Our oil and gas expenditure forecasts are
also informed by OGA projections. We have revised overall expenditure down since
October, reflecting weaker than expected spending in 2018.
Fiscal policy
3.31 Our forecast is based on current government policy and announced plans for spending and
taxes. Since October, the Government has announced modest increases in departmental
spending and several other tax and spending measures (see Annex A). Using ‘multipliers’ to
estimate the effect of fiscal policy changes on GDP,12 they imply a negligible effect on real
GDP growth. The higher level of government consumption raises cumulative nominal GDP
growth by 0.1 percentage points by the end of the forecast. The fiscal implications of these
measures are discussed in Chapter 4 and Annex A.
12 For further details see Box 3.2 of our July 2015 Economic and fiscal outlook.
37 Economic and fiscal outlook
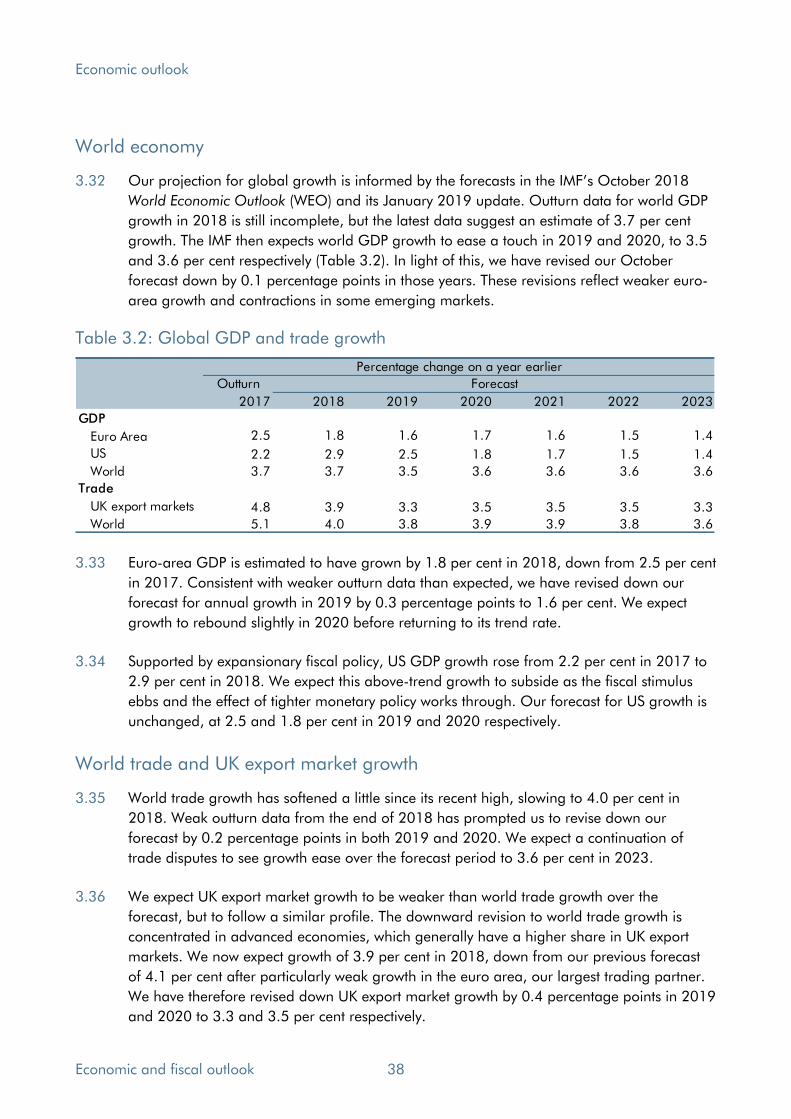
Economic outlook
World economy
3.32 Our projection for global growth is informed by the forecasts in the IMF’s October 2018 World Economic Outlook (WEO) and its January 2019 update. Outturn data for world GDP
growth in 2018 is still incomplete, but the latest data suggest an estimate of 3.7 per cent
growth. The IMF then expects world GDP growth to ease a touch in 2019 and 2020, to 3.5
and 3.6 per cent respectively (Table 3.2). In light of this, we have revised our October
forecast down by 0.1 percentage points in those years. These revisions reflect weaker euro-
area growth and contractions in some emerging markets.
Table 3.2: Global GDP and trade growth
Outturn
2017 2018 2019 2020 2021 2022 2023
GDP
Euro Area 2.5 1.8 1.6 1.7 1.6 1.5 1.4
US 2.2 2.9 2.5 1.8 1.7 1.5 1.4
World 3.7 3.7 3.5 3.6 3.6 3.6 3.6
Trade
UK export markets 4.8 3.9 3.3 3.5 3.5 3.5 3.3
World 5.1 4.0 3.8 3.9 3.9 3.8 3.6
Percentage change on a year earlier
Forecast
3.33 Euro-area GDP is estimated to have grown by 1.8 per cent in 2018, down from 2.5 per cent
in 2017. Consistent with weaker outturn data than expected, we have revised down our
forecast for annual growth in 2019 by 0.3 percentage points to 1.6 per cent. We expect
growth to rebound slightly in 2020 before returning to its trend rate.
3.34 Supported by expansionary fiscal policy, US GDP growth rose from 2.2 per cent in 2017 to
2.9 per cent in 2018. We expect this above-trend growth to subside as the fiscal stimulus
ebbs and the effect of tighter monetary policy works through. Our forecast for US growth is
unchanged, at 2.5 and 1.8 per cent in 2019 and 2020 respectively.
World trade and UK export market growth
3.35 World trade growth has softened a little since its recent high, slowing to 4.0 per cent in
2018. Weak outturn data from the end of 2018 has prompted us to revise down our
forecast by 0.2 percentage points in both 2019 and 2020. We expect a continuation of
trade disputes to see growth ease over the forecast period to 3.6 per cent in 2023.
3.36 We expect UK export market growth to be weaker than world trade growth over the
forecast, but to follow a similar profile. The downward revision to world trade growth is
concentrated in advanced economies, which generally have a higher share in UK export
markets. We now expect growth of 3.9 per cent in 2018, down from our previous forecast
of 4.1 per cent after particularly weak growth in the euro area, our largest trading partner.
We have therefore revised down UK export market growth by 0.4 percentage points in 2019
and 2020 to 3.3 and 3.5 per cent respectively.
Economic and fiscal outlook 38
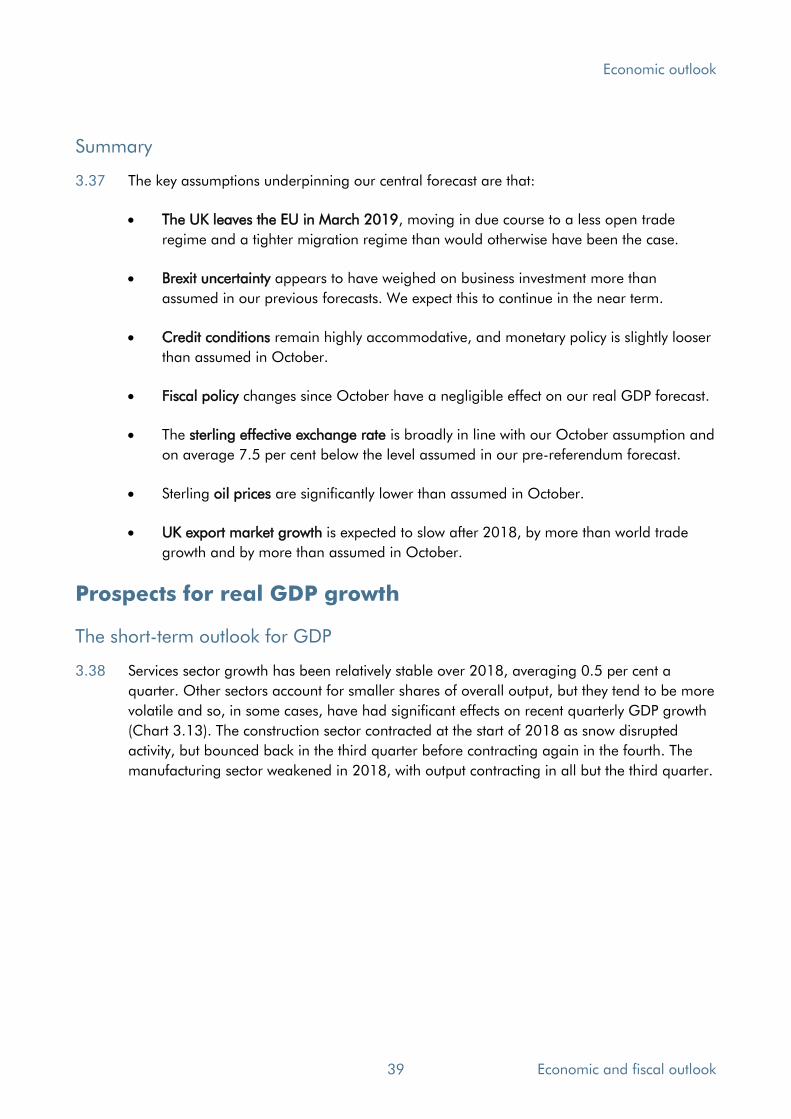
Economic outlook
Summary
3.37 The key assumptions underpinning our central forecast are that:
• The UK leaves the EU in March 2019, moving in due course to a less open trade
regime and a tighter migration regime than would otherwise have been the case.
• Brexit uncertainty appears to have weighed on business investment more than
assumed in our previous forecasts. We expect this to continue in the near term.
• Credit conditions remain highly accommodative, and monetary policy is slightly looser
than assumed in October.
• Fiscal policy changes since October have a negligible effect on our real GDP forecast.
• The sterling effective exchange rate is broadly in line with our October assumption and
on average 7.5 per cent below the level assumed in our pre-referendum forecast.
• Sterling oil prices are significantly lower than assumed in October.
• UK export market growth is expected to slow after 2018, by more than world trade
growth and by more than assumed in October.
Prospects for real GDP growth
The short-term outlook for GDP
3.38 Services sector growth has been relatively stable over 2018, averaging 0.5 per cent a
quarter. Other sectors account for smaller shares of overall output, but they tend to be more
volatile and so, in some cases, have had significant effects on recent quarterly GDP growth
(Chart 3.13). The construction sector contracted at the start of 2018 as snow disrupted
activity, but bounced back in the third quarter before contracting again in the fourth. The
manufacturing sector weakened in 2018, with output contracting in all but the third quarter.
39 Economic and fiscal outlook
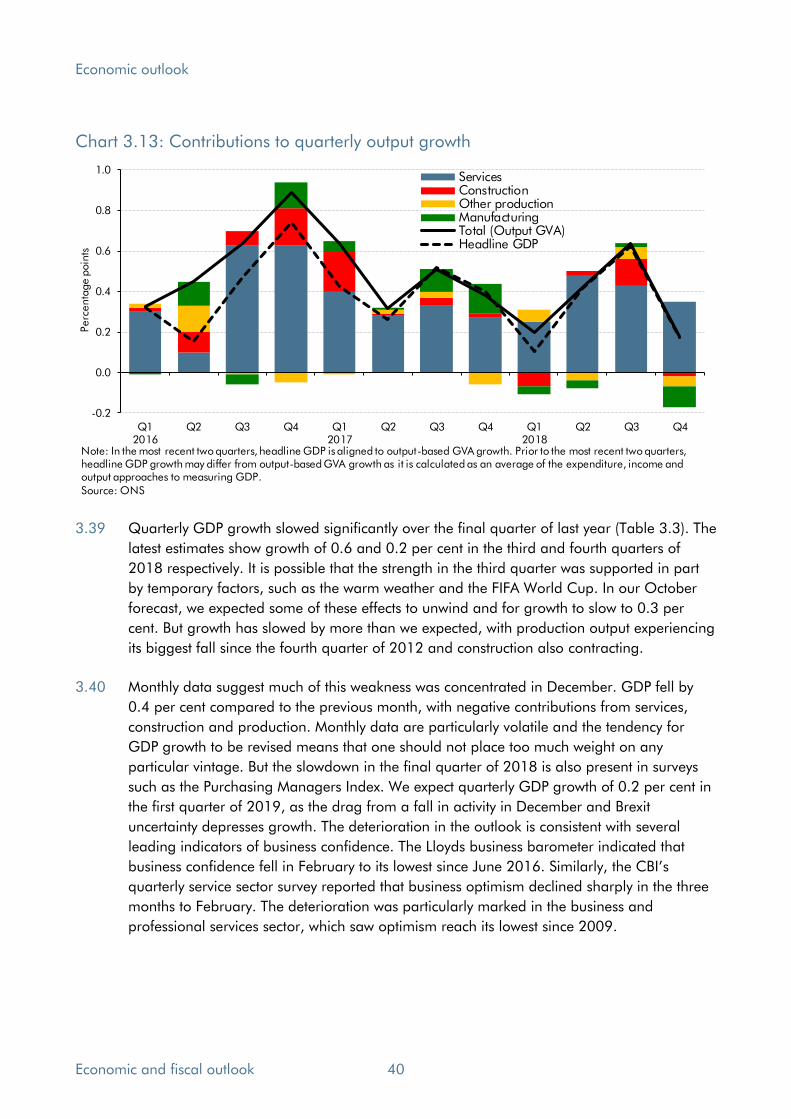
Economic outlook
Chart 3.13: Contributions to quarterly output growth
-0.2
0.0
0.2
0.4
0.6
0.8
1.0
Q12016
Q2 Q3 Q4 Q12017
Q2 Q3 Q4 Q12018
Q2 Q3 Q4
Perc
enta
ge p
oin
ts
ServicesConstructionOther productionManufacturingTotal (Output GVA)Headline GDP
Source: ONS
Note: In the most recent two quarters, headline GDP is aligned to output-based GVA growth. Prior to the most recent two quarters, headline GDP growth may differ from output-based GVA growth as it is calculated as an average of the expenditure, income and output approaches to measuring GDP.
3.39 Quarterly GDP growth slowed significantly over the final quarter of last year (Table 3.3). The
latest estimates show growth of 0.6 and 0.2 per cent in the third and fourth quarters of
2018 respectively. It is possible that the strength in the third quarter was supported in part
by temporary factors, such as the warm weather and the FIFA World Cup. In our October
forecast, we expected some of these effects to unwind and for growth to slow to 0.3 per
cent. But growth has slowed by more than we expected, with production output experiencing
its biggest fall since the fourth quarter of 2012 and construction also contracting.
3.40 Monthly data suggest much of this weakness was concentrated in December. GDP fell by
0.4 per cent compared to the previous month, with negative contributions from services,
construction and production. Monthly data are particularly volatile and the tendency for
GDP growth to be revised means that one should not place too much weight on any
particular vintage. But the slowdown in the final quarter of 2018 is also present in surveys
such as the Purchasing Managers Index. We expect quarterly GDP growth of 0.2 per cent in
the first quarter of 2019, as the drag from a fall in activity in December and Brexit
uncertainty depresses growth. The deterioration in the outlook is consistent with several
leading indicators of business confidence. The Lloyds business barometer indicated that
business confidence fell in February to its lowest since June 2016. Similarly, the CBI’s quarterly service sector survey reported that business optimism declined sharply in the three
months to February. The deterioration was particularly marked in the business and
professional services sector, which saw optimism reach its lowest since 2009.
Economic and fiscal outlook 40

Economic outlook
Table 3.3: The quarterly GDP profile
Q1 Q2 Q3 Q4 Q1 Q2 Q3 Q4 Q1 Q2 Q3 Q4
October forecast1 0.1 0.4 0.5 0.4 0.4 0.4 0.4 0.4 0.3 0.4 0.4 0.3
March forecast2 0.1 0.4 0.6 0.2 0.2 0.3 0.3 0.3 0.3 0.4 0.4 0.4
Change3 0.0 0.0 0.2 -0.2 -0.2 -0.1 0.0 0.0 0.0 0.0 0.0 0.0
3 Changes may not sum due to rounding.
1 Forecast from the third quarter of 2018.2 Forecast from first quarter of 2019.
Percentage change on previous quarter
2018 2019 2020
The medium-term outlook for GDP
3.41 We continue to assume that the negotiations between the UK and the EU lead to an orderly
transition to a new long-term relationship, whatever that relationship might be. In the near
term, we expect uncertainty to continue to weigh on business investment. We also expect
subdued consumption growth, as a further improvement in real earnings growth is offset by
slowing employment growth. A weaker global outlook also means that net trade acts as a
significant drag on growth.
3.42 Taking these factors together, we expect GDP growth to slow to 1.2 per cent in 2019. As
Brexit uncertainty begins to dissipate, and productivity growth gradually improves, we expect
it to pick up to 1.4 per cent in 2020, and remain at 1.6 per cent a year across the rest of
the forecast period (Chart 3.14). The profile for real GDP growth reflects several factors:
• Real household consumption growth is expected to remain relatively subdued in the
near term. We expect it to improve steadily from mid-2019 as real earnings growth
gradually increases, supporting an increase in real household income growth.
• Brexit-related uncertainty is currently weighing on investment, which fell throughout
2018. The gradual dissipation of uncertainty as the post-Brexit regime is clarified is
expected to provide a modest boost to GDP growth later in the forecast. Business
investment is also supported by measures introduced in last October’s Budget.
• We expect world trade and UK export market growth to be weaker than over the past
two years – and weaker than we forecast in October. This implies a lower contribution
from net trade to GDP growth. The Brexit transition period delays the expected
reduction in both export and import intensity, and we assume it has a neutral effect on
net trade (Table 3.4).
• Discretionary fiscal loosening supports growth. Real government consumption growth
steps up in 2019, driven by higher NHS spending announced in June 2018.
41 Economic and fiscal outlook
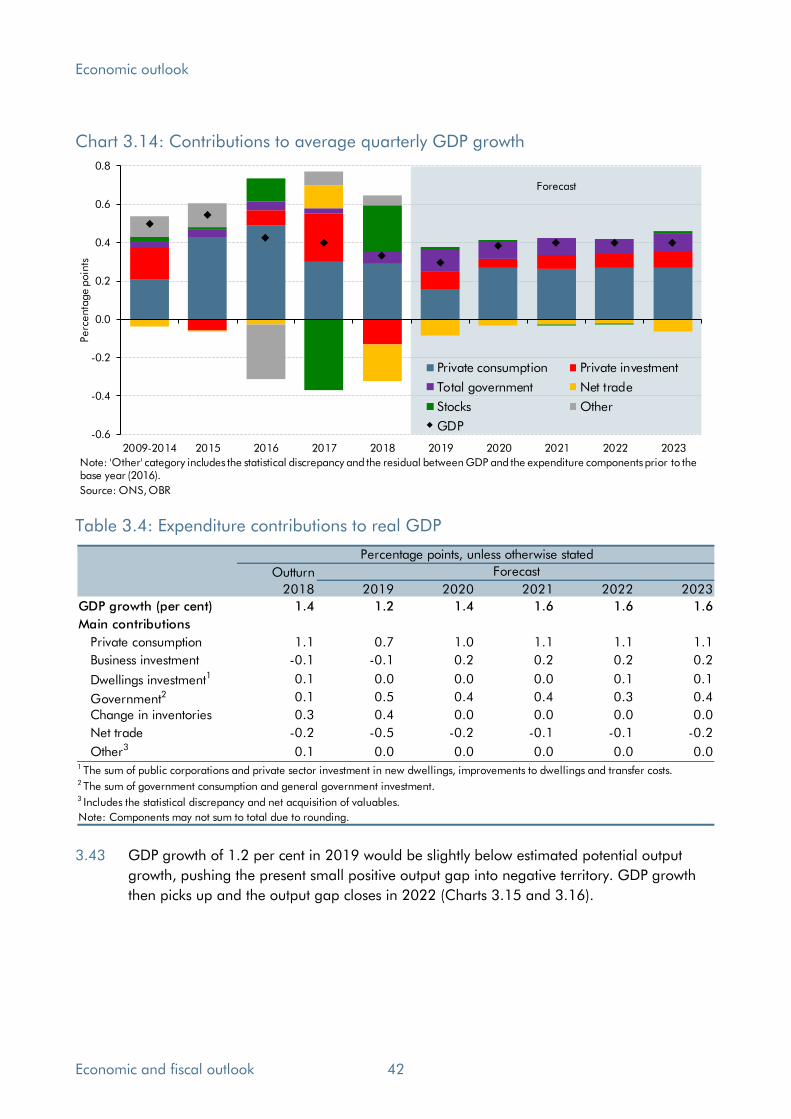
Economic outlook
Chart 3.14: Contributions to average quarterly GDP growth
-0.6
-0.4
-0.2
0.0
0.2
0.4
0.6
0.8
2009-2014 2015 2016 2017 2018 2019 2020 2021 2022 2023
Perc
enta
ge p
oin
ts
Private consumption Private investment
Total government Net trade
Stocks Other
GDP
Note: 'Other' category includes the statistical discrepancy and the residual between GDP and the expenditure components prior to the base year (2016).
Source: ONS, OBR
Forecast
Table 3.4: Expenditure contributions to real GDP
Outturn
2018 2019 2020 2021 2022 2023
GDP growth (per cent) 1.4 1.2 1.4 1.6 1.6 1.6
Main contributions
Private consumption 1.1 0.7 1.0 1.1 1.1 1.1
Business investment -0.1 -0.1 0.2 0.2 0.2 0.2
Dwellings investment1 0.1 0.0 0.0 0.0 0.1 0.1
Government2 0.1 0.5 0.4 0.4 0.3 0.4
Change in inventories 0.3 0.4 0.0 0.0 0.0 0.0
Net trade -0.2 -0.5 -0.2 -0.1 -0.1 -0.2
Other3 0.1 0.0 0.0 0.0 0.0 0.0
Note: Components may not sum to total due to rounding.
Forecast
Percentage points, unless otherwise stated
1 The sum of public corporations and private sector investment in new dwellings, improvements to dwellings and transfer costs.2 The sum of government consumption and general government investment.3 Includes the statistical discrepancy and net acquisition of valuables.
3.43 GDP growth of 1.2 per cent in 2019 would be slightly below estimated potential output
growth, pushing the present small positive output gap into negative territory. GDP growth
then picks up and the output gap closes in 2022 (Charts 3.15 and 3.16).
Economic and fiscal outlook 42

Economic outlook
Chart 3.15: The output gap Chart 3.16: Actual and potential output
-5
-4
-3
-2
-1
0
1
2
3
2003 2006 2009 2012 2015 2018 2021 2024
Per ce
nt
Note: Output gap estimates on a quarterly basis, based on the latest National Accounts data and expressed as actual output less potential output as a percentage of potential output (non-oil basis).
Source: OBR
Forecast
100
105
110
115
120
125
130
135
140
145
150
2003 2006 2009 2012 2015 2018 2021 2024
Act
ual o
utp
ut
2003Q
1=
100
. Potential output
Output (non-oil GVA)
Source: ONS, OBR
Forecast
3.44 Relative to October, we have revised our forecast for GDP growth in 2019 down by 0.4
percentage points. This is in part due to weaker momentum in late 2018 and our
judgement that this will persist into the first part of 2019, offsetting the impact of the
discretionary fiscal loosening announced in the Budget. Growth is also slightly higher in
2021 and 2022 than in October, consistent with the lower path for Bank Rate.
3.45 This analysis relates to our central projection for GDP growth, but there is of course
significant uncertainty around this forecast. Chart 3.17 shows the probability distribution of
different outcomes surrounding the central forecast based purely on past forecast
performance. The solid black line shows our median forecast, with successive pairs of lighter
shaded areas around it representing 20 per cent probability bands. The chart implies a
roughly one-in-five chance of the economy shrinking in calendar year 2020. And a similar
probability of growth exceeding 2.5 per cent – closer to average pre-crisis growth. These
estimates are based on the historical distribution of official forecast errors. They do not
represent a subjective measure of the distribution of risks and uncertainties around our
central forecast. Such risks and uncertainties are discussed at the end of the chapter.
43 Economic and fiscal outlook

Economic outlook
Chart 3.17: Real GDP growth fan chart
-2
-1
0
1
2
3
4
5
2010 2011 2012 2013 2014 2015 2016 2017 2018 2019 2020 2021 2022 2023
Perc
enta
ge c
hange o
n a
year earl
ier
October forecast
March forecast
Source: ONS, OBR
Prospects for inflation
3.46 In assessing the outlook for the economy and the public finances, we are interested in
several different measures of inflation, principally the Consumer Prices Index (CPI) and the
Retail Prices Index (RPI). But we also need to forecast the GDP deflator and its components,
which are required to generate a projection for nominal GDP.
3.47 CPI and RPI inflation affect the public finances in several ways. The Government uses the
CPI to index many allowances and thresholds, and to uprate benefits and public service
pensions. The RPI is no longer a National Statistic, because it falls short of agreed
international statistical standards,13 but the Government still uses it to calculate interest
payments on index-linked gilts, interest charged on student loans and to revalorise excise
duties. The ONS publishes several other inflation measures – most notably CPIH, a variant
of the CPI that includes housing costs. But as these do not currently affect the public
finances, we do not forecast them.
CPI inflation
3.48 CPI inflation was consistently above the 2 per cent target throughout 2018 and averaged
2.3 per cent in the fourth quarter – below our October forecast of 2.6 per cent. In January,
CPI inflation fell further to 1.8 per cent. We expect the fall in oil prices since our October
forecast to reduce CPI inflation in the first quarter of 2019, but the announced increase in
the Ofgem energy price cap in April should increase it in the second. While the
Government’s announced ban on letting fees could lead to an increase in rents to compensate, we expect the effect on CPI inflation to be negligible and so have not adjusted
our forecast. In the medium term, we expect CPI inflation to return to the 2 per cent target.
13 ONS, Shortcomings of the Retail Prices Index as a measure of inflation, March 2018.
Economic and fiscal outlook 44
Economic outlook
3.49 Chart 3.18 shows our latest central CPI inflation forecast within a fan chart produced using
the same methodology that underpins the GDP fan chart (Chart 3.17). It illustrates the
range of possible outcomes one would expect if past official forecast errors were a
reasonable guide to future ones. It shows that the revisions to our forecast since October are
small compared to the historical differences between forecasts and outturns.
Chart 3.18: CPI inflation fan chart
0
1
2
3
4
5
2010 2011 2012 2013 2014 2015 2016 2017 2018 2019 2020 2021 2022 2023
Perc
enta
ge c
hange o
n a
year earl
ier
October forecast
March forecast
Source: ONS, OBR
RPI inflation
3.50 RPI inflation averaged 3.1 per cent in the fourth quarter of 2018, 0.4 percentage points
below our October forecast. We compile our RPI inflation forecast by adding a wedge to our
CPI inflation forecast to account for differences in measurement, coverage and weights. We
have revised down the wedge in 2019 and 2020 since October, largely reflecting weaker
house price inflation (which affects the RPI measure of housing depreciation).
The GDP deflator
3.51 The GDP deflator is a broad measure of prices in the domestic economy. It covers all the
goods and services that comprise GDP, including those relating to private and government
consumption, investment and the relative price of exports to imports – the ‘terms of trade’. In the fourth quarter of 2018, the GDP deflator rose by 1.6 per cent relative to the fourth
quarter of 2017. We expect GDP deflator inflation to increase to 2 per cent in 2019,
followed by a slight dip, and then return to 2 per cent by 2022 (Chart 3.19).
45 Economic and fiscal outlook

Economic outlook
Chart 3.19: GDP deflator
0.0
0.5
1.0
1.5
2.0
2.5
3.0
3.5
2010 2011 2012 2013 2014 2015 2016 2017 2018 2019 2020 2021 2022 2023 2024
Perc
enta
ge c
hange o
n a
year earl
ier
October forecast
March forecast
Source: ONS, OBR
Forecast
Prospects for nominal GDP
3.52 Most public discussion of the economic outlook focuses on real GDP – the volume of goods
and services produced in the economy. But the nominal or cash value – and its composition
by income and expenditure – is more important for the behaviour of the public finances.
Taxes are driven more by nominal than real GDP. So too is the share of GDP devoted to
public spending, as much of that spending is set out in multi-year cash plans (public
services, grants and administration, and capital spending) or linked to measures of inflation
(including benefits, tax credits and interest on index-linked gilts).
3.53 Nominal GDP growth slowed from 4.1 per cent in 2017 to 3.2 per cent in 2018, reflecting
both slower real GDP growth and lower economy-wide inflation. We expect nominal GDP
growth to be similar in 2019 and then pick up across the rest of the forecast as real GDP
growth strengthens (Chart 3.20). Cumulative nominal GDP growth from the fourth quarter
of 2018 to the first quarter of 2024 is 19.8 per cent, up only slightly on the 19.4 per cent in
our October forecast.
Economic and fiscal outlook 46
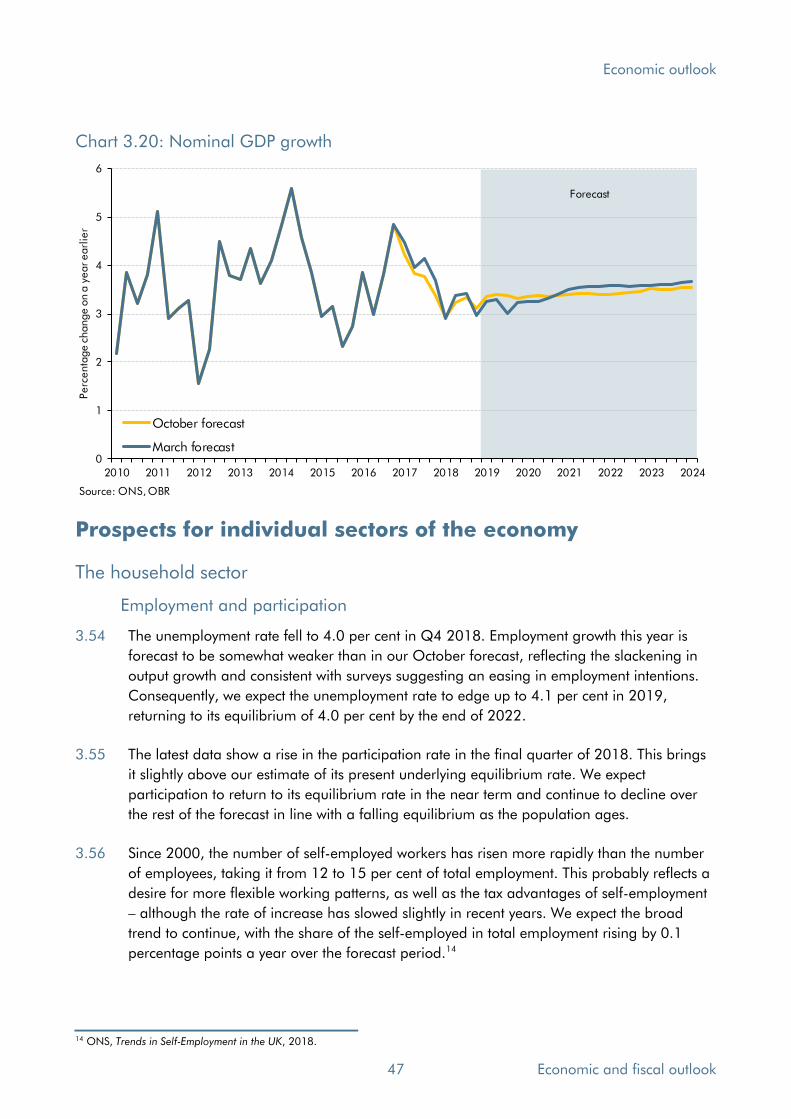
Economic outlook
Chart 3.20: Nominal GDP growth
0
1
2
3
4
5
6
2010 2011 2012 2013 2014 2015 2016 2017 2018 2019 2020 2021 2022 2023 2024
Perc
enta
ge c
hange o
n a
year earl
ier
October forecast
March forecast
Source: ONS, OBR
Forecast
Prospects for individual sectors of the economy
The household sector
Employment and participation
3.54 The unemployment rate fell to 4.0 per cent in Q4 2018. Employment growth this year is
forecast to be somewhat weaker than in our October forecast, reflecting the slackening in
output growth and consistent with surveys suggesting an easing in employment intentions.
Consequently, we expect the unemployment rate to edge up to 4.1 per cent in 2019,
returning to its equilibrium of 4.0 per cent by the end of 2022.
3.55 The latest data show a rise in the participation rate in the final quarter of 2018. This brings
it slightly above our estimate of its present underlying equilibrium rate. We expect
participation to return to its equilibrium rate in the near term and continue to decline over
the rest of the forecast in line with a falling equilibrium as the population ages.
3.56 Since 2000, the number of self-employed workers has risen more rapidly than the number
of employees, taking it from 12 to 15 per cent of total employment. This probably reflects a
desire for more flexible working patterns, as well as the tax advantages of self-employment
– although the rate of increase has slowed slightly in recent years. We expect the broad
trend to continue, with the share of the self-employed in total employment rising by 0.1
percentage points a year over the forecast period.14
14 ONS, Trends in Self-Employment in the UK, 2018.
47 Economic and fiscal outlook

Economic outlook
Average earnings
3.57 We use a measure of average earnings constructed by dividing the National Accounts
measure of wages and salaries by the number of employees, instead of the official ONS
average weekly earnings (AWE) series. This allows us to fit the earnings forecast directly into
the National Accounts framework on which our economy forecast is based – particularly the
measure of wages and salaries that is an important determinant of tax receipts.
3.58 Average earnings growth has been stronger in recent data than we expected in October.
This growth has outstripped the sum of labour productivity growth and whole economy
inflation, resulting in a rise in labour’s share of national income. We assume that some of this momentum in average earnings growth is maintained, with growth of 3.1 per cent in
2019, up from 2.5 per cent in our October forecast. From 2021 onwards, average earnings
grow broadly in line with the sum of our forecasts for labour productivity growth and whole
economy inflation. By 2023 average earnings growth reaches 3.3 per cent, reflecting a
modest increase in productivity growth. Throughout the forecast, average earnings growth
remains below the rates typical before the financial crisis.
Household disposable income
3.59 Full household income data for 2018 are not yet available, but we expect real household
disposable income growth to have picked up to 1.6 per cent in 2018, from 0.5 per cent in
2017. This reflects a modest acceleration in employment and earnings, a fall in CPI inflation
and the unwinding of the effect of higher dividend taxation in 2017. We then expect it to fall
back to 0.7 per cent in 2019 as weaker employment growth offsets the effect of higher real
earnings growth. From 2020, gradual increases in nominal earnings growth support a
modest pick-up. The freeze in most working-age benefits and tax credits weighs on growth
in 2019, while fiscal drag in the income tax system does so in most years (Chart 3.21). Our
forecasts for per capita real earnings and real disposable income growth remain relatively
weak (Table 3.5).
Table 3.5: Real earnings and real incomes
2019 2020 2021 2022 2023
Real disposable income per capita 0.1 0.6 1.1 1.2 1.3
of which:
Labour income1,2 0.6 0.7 0.8 0.7 0.8
Net taxes and benefits2 -0.7 -0.4 -0.1 0.0 0.0
Other non-labour income2 0.3 0.3 0.5 0.5 0.5
Forecast, annual percentage change
1 Employee compensation (including net compensation from abroad) plus mixed income less employer social contributions. 2 Per capita basis, deflated by consumption deflator.
Economic and fiscal outlook 48
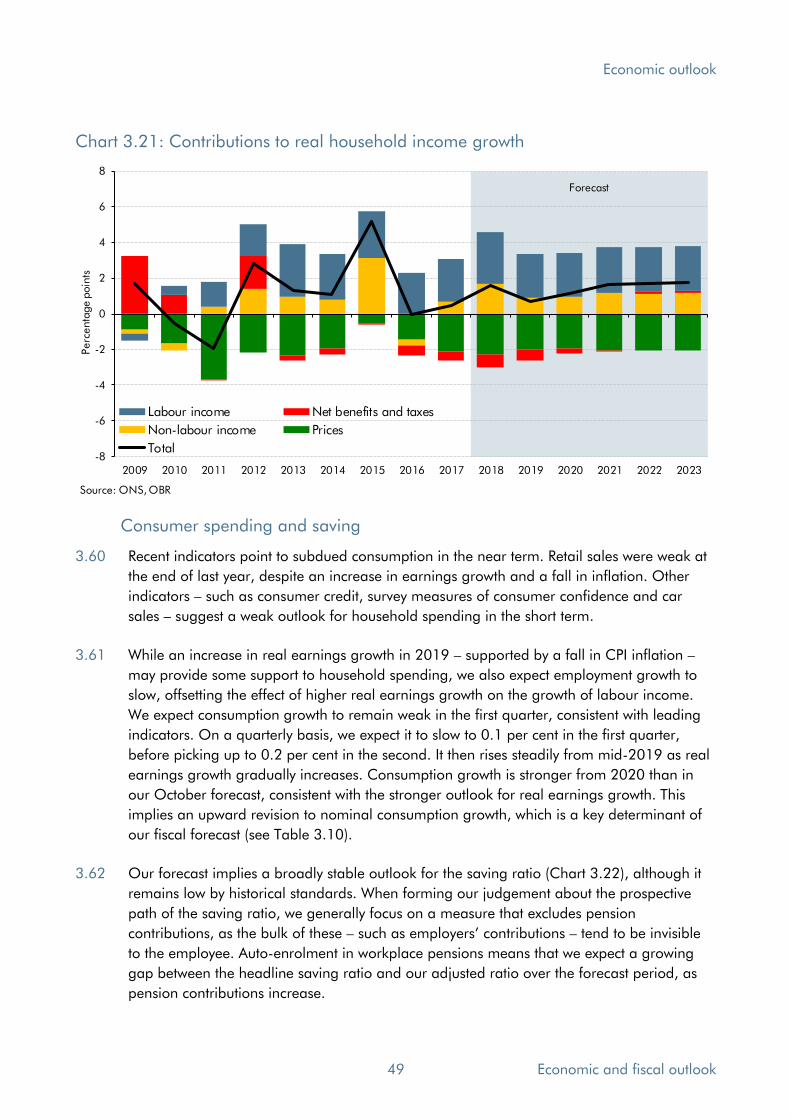
Economic outlook
Chart 3.21: Contributions to real household income growth
-8
-6
-4
-2
0
2
4
6
8
2009 2010 2011 2012 2013 2014 2015 2016 2017 2018 2019 2020 2021 2022 2023
Perc
enta
ge p
oin
ts
Labour income Net benefits and taxes
Non-labour income Prices
Total
Forecast
Source: ONS, OBR
Consumer spending and saving
3.60 Recent indicators point to subdued consumption in the near term. Retail sales were weak at
the end of last year, despite an increase in earnings growth and a fall in inflation. Other
indicators – such as consumer credit, survey measures of consumer confidence and car
sales – suggest a weak outlook for household spending in the short term.
3.61 While an increase in real earnings growth in 2019 – supported by a fall in CPI inflation – may provide some support to household spending, we also expect employment growth to
slow, offsetting the effect of higher real earnings growth on the growth of labour income.
We expect consumption growth to remain weak in the first quarter, consistent with leading
indicators. On a quarterly basis, we expect it to slow to 0.1 per cent in the first quarter,
before picking up to 0.2 per cent in the second. It then rises steadily from mid-2019 as real
earnings growth gradually increases. Consumption growth is stronger from 2020 than in
our October forecast, consistent with the stronger outlook for real earnings growth. This
implies an upward revision to nominal consumption growth, which is a key determinant of
our fiscal forecast (see Table 3.10).
3.62 Our forecast implies a broadly stable outlook for the saving ratio (Chart 3.22), although it
remains low by historical standards. When forming our judgement about the prospective
path of the saving ratio, we generally focus on a measure that excludes pension
contributions, as the bulk of these – such as employers’ contributions – tend to be invisible
to the employee. Auto-enrolment in workplace pensions means that we expect a growing
gap between the headline saving ratio and our adjusted ratio over the forecast period, as
pension contributions increase.
49 Economic and fiscal outlook

Economic outlook
3.63 We expect a somewhat higher path for household saving than in October, particularly when
pension contributions are excluded. This partly reflects the effect of ONS revisions to recent
estimates of household saving,15 but also reflects our judgement that consumer spending
will remain subdued in the near term despite upward revisions to our earnings forecast.
Chart 3.22: The household saving ratio
-2
0
2
4
6
8
10
12
14
16
2000 2002 2004 2006 2008 2010 2012 2014 2016 2018 2020 2022 2024
Per ce
nt (
four-
quart
er m
ovi
ng a
vera
ge)
Headline saving ratio
Saving ratio excluding pension equity adjustment
Note: Both series show four-quarter moving averages. The estimate of the saving ratio excluding the pension equity adjustment is calculated as household disposable income less consumption, as a proportion of household disposable income. Source: ONS, OBR
Forecast
The housing market and residential investment
3.64 House price inflation slowed significantly during 2018 – reaching 2.7 per cent in the fourth
quarter, down from 4.6 per cent in the final quarter of 2017 and significantly below the 7.0
per cent average rate recorded in 2016.
3.65 Indicators of housing market activity and price expectations have deteriorated significantly
since our October forecast and are consistent with a further fall in house price inflation. The
Halifax and Nationwide price indices – which are timelier than the ONS measure used in
our forecast – have generally been consistent with a further slowdown. We expect annual
house price inflation to fall to just below zero towards the end of 2019 (Chart 3.23).
3.66 Beyond the near term, we expect house price inflation to pick up as a result of stronger real
household income growth and continued pressure of demand on supply. We expect house
price inflation to reach around 4 per cent a year by the end of the forecast horizon. Overall,
we expect house prices to rise by almost 17 per cent between the fourth quarter of 2018
and the first quarter of 2024 – close to household income growth over the same period.
That compares with forecast growth of nearly 20 per cent in our October forecast.
15 The tendency for recent estimates of the saving ratio to be revised means it is often more informative to look at the change in the saving ratio over the forecast, rather than the level in isolation. See Box 3.4 of our October 2018 EFO for further discussion.
Economic and fiscal outlook 50
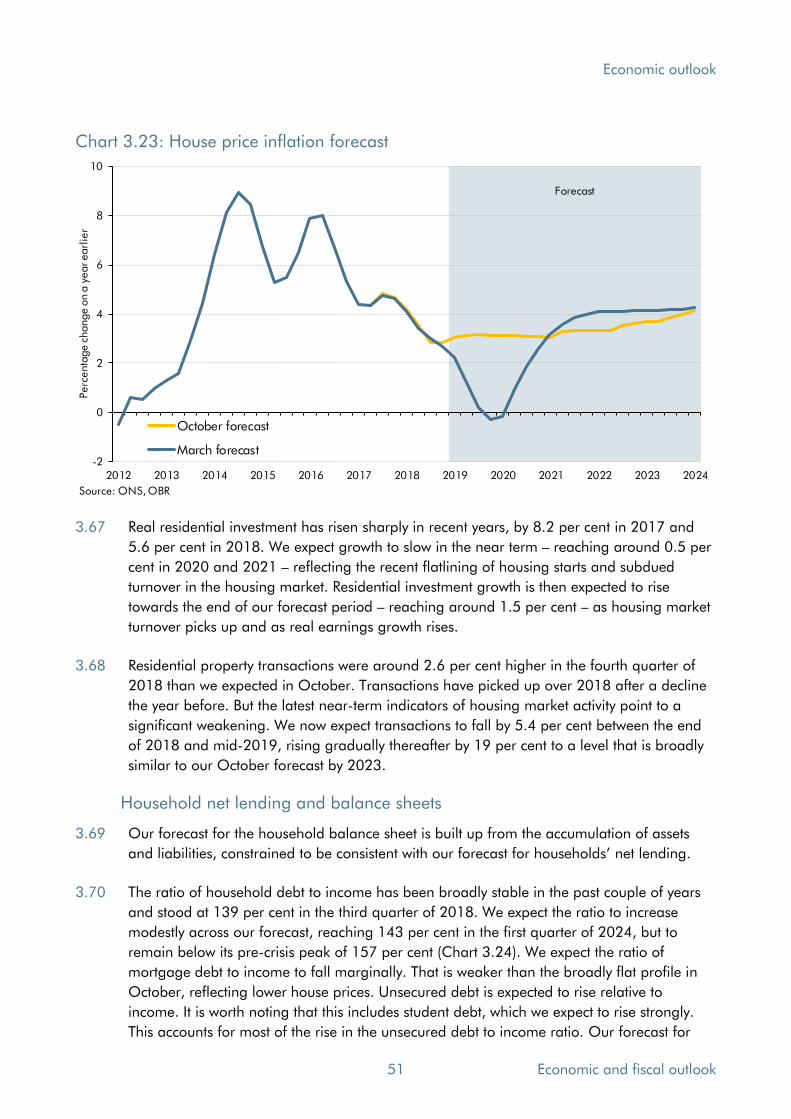
Economic outlook
Chart 3.23: House price inflation forecast
-2
0
2
4
6
8
10
2012 2013 2014 2015 2016 2017 2018 2019 2020 2021 2022 2023 2024
Perc
enta
ge c
hange o
n a
year earl
ier
October forecast
March forecast
Forecast
Source: ONS, OBR
3.67 Real residential investment has risen sharply in recent years, by 8.2 per cent in 2017 and
5.6 per cent in 2018. We expect growth to slow in the near term – reaching around 0.5 per
cent in 2020 and 2021 – reflecting the recent flatlining of housing starts and subdued
turnover in the housing market. Residential investment growth is then expected to rise
towards the end of our forecast period – reaching around 1.5 per cent – as housing market
turnover picks up and as real earnings growth rises.
3.68 Residential property transactions were around 2.6 per cent higher in the fourth quarter of
2018 than we expected in October. Transactions have picked up over 2018 after a decline
the year before. But the latest near-term indicators of housing market activity point to a
significant weakening. We now expect transactions to fall by 5.4 per cent between the end
of 2018 and mid-2019, rising gradually thereafter by 19 per cent to a level that is broadly
similar to our October forecast by 2023.
Household net lending and balance sheets
3.69 Our forecast for the household balance sheet is built up from the accumulation of assets
and liabilities, constrained to be consistent with our forecast for households’ net lending.
3.70 The ratio of household debt to income has been broadly stable in the past couple of years
and stood at 139 per cent in the third quarter of 2018. We expect the ratio to increase
modestly across our forecast, reaching 143 per cent in the first quarter of 2024, but to
remain below its pre-crisis peak of 157 per cent (Chart 3.24). We expect the ratio of
mortgage debt to income to fall marginally. That is weaker than the broadly flat profile in
October, reflecting lower house prices. Unsecured debt is expected to rise relative to
income. It is worth noting that this includes student debt, which we expect to rise strongly.
This accounts for most of the rise in the unsecured debt to income ratio. Our forecast for
51 Economic and fiscal outlook
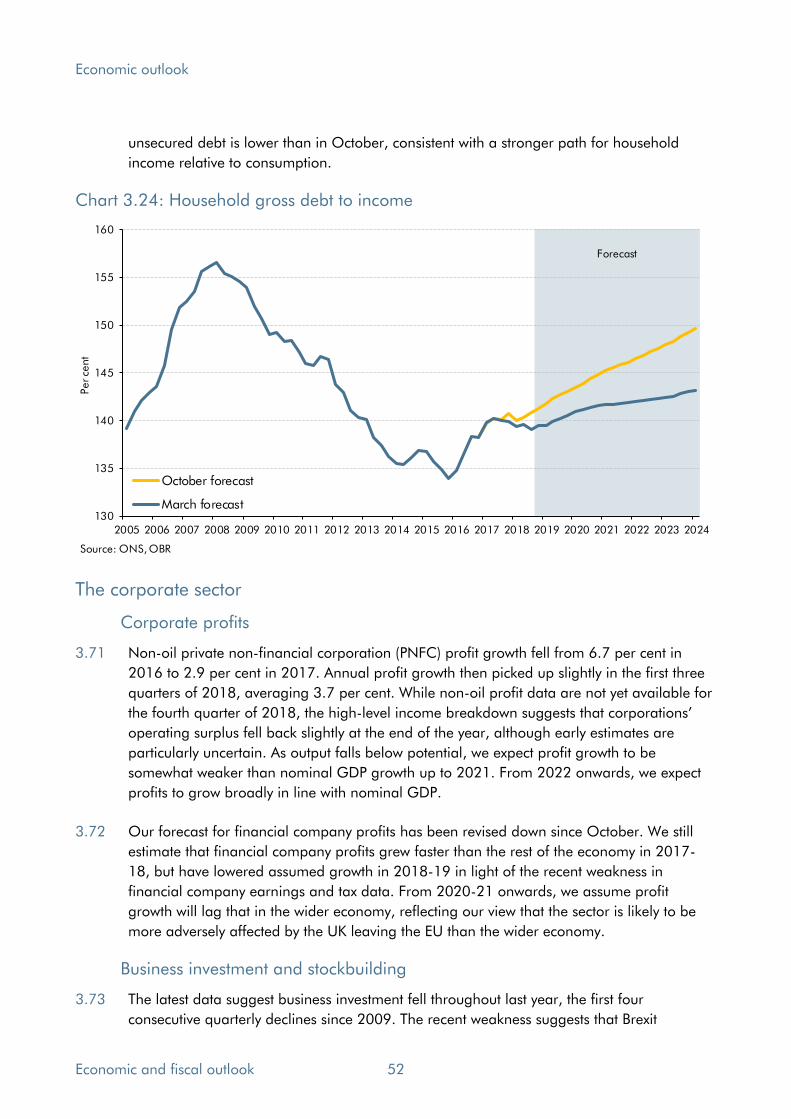
Economic outlook
Chart 3.24: Household gross debt to income
130
135
140
145
150
155
160
2005 2006 2007 2008 2009 2010 2011 2012 2013 2014 2015 2016 2017 2018 2019 2020 2021 2022 2023 2024
Per ce
nt
October forecast
March forecast
Source: ONS, OBR
Forecast
unsecured debt is lower than in October, consistent with a stronger path for household
income relative to consumption.
The corporate sector
Corporate profits
3.71 Non-oil private non-financial corporation (PNFC) profit growth fell from 6.7 per cent in
2016 to 2.9 per cent in 2017. Annual profit growth then picked up slightly in the first three
quarters of 2018, averaging 3.7 per cent. While non-oil profit data are not yet available for
the fourth quarter of 2018, the high-level income breakdown suggests that corporations’
operating surplus fell back slightly at the end of the year, although early estimates are
particularly uncertain. As output falls below potential, we expect profit growth to be
somewhat weaker than nominal GDP growth up to 2021. From 2022 onwards, we expect
profits to grow broadly in line with nominal GDP.
3.72 Our forecast for financial company profits has been revised down since October. We still
estimate that financial company profits grew faster than the rest of the economy in 2017-
18, but have lowered assumed growth in 2018-19 in light of the recent weakness in
financial company earnings and tax data. From 2020-21 onwards, we assume profit
growth will lag that in the wider economy, reflecting our view that the sector is likely to be
more adversely affected by the UK leaving the EU than the wider economy.
Business investment and stockbuilding
3.73 The latest data suggest business investment fell throughout last year, the first four
consecutive quarterly declines since 2009. The recent weakness suggests that Brexit
Economic and fiscal outlook 52
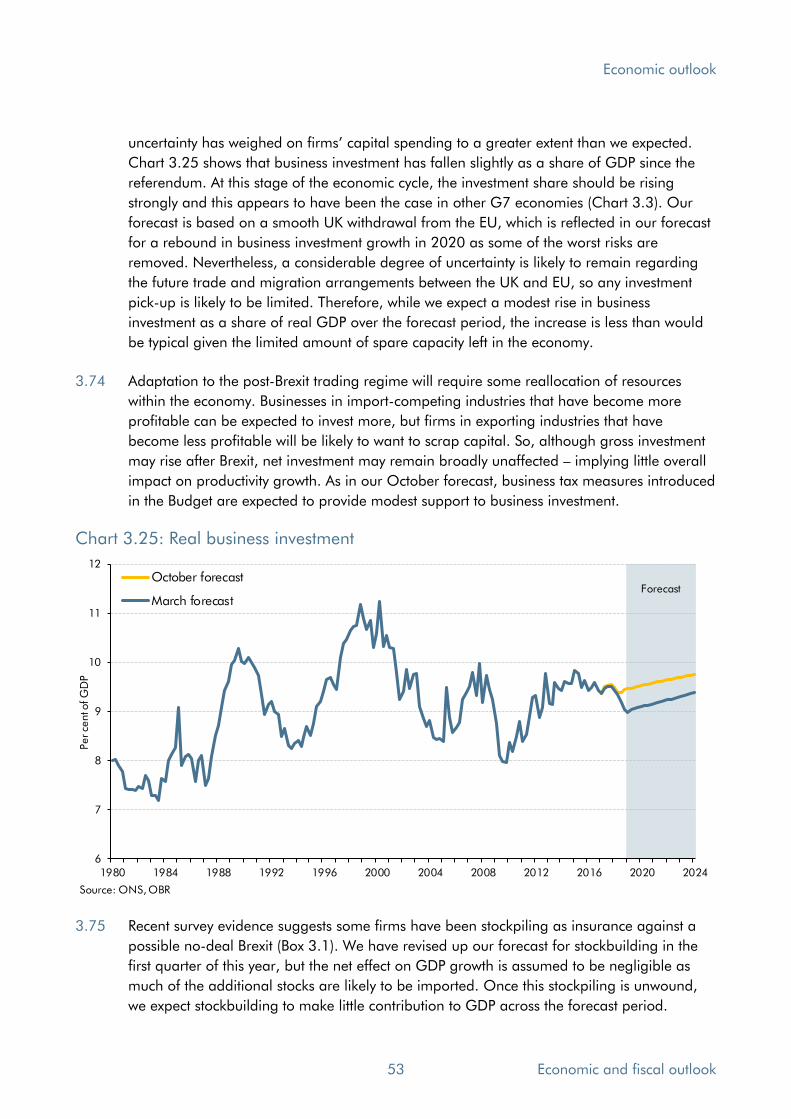
Economic outlook
uncertainty has weighed on firms’ capital spending to a greater extent than we expected.
Chart 3.25 shows that business investment has fallen slightly as a share of GDP since the
referendum. At this stage of the economic cycle, the investment share should be rising
strongly and this appears to have been the case in other G7 economies (Chart 3.3). Our
forecast is based on a smooth UK withdrawal from the EU, which is reflected in our forecast
for a rebound in business investment growth in 2020 as some of the worst risks are
removed. Nevertheless, a considerable degree of uncertainty is likely to remain regarding
the future trade and migration arrangements between the UK and EU, so any investment
pick-up is likely to be limited. Therefore, while we expect a modest rise in business
investment as a share of real GDP over the forecast period, the increase is less than would
be typical given the limited amount of spare capacity left in the economy.
3.74 Adaptation to the post-Brexit trading regime will require some reallocation of resources
within the economy. Businesses in import-competing industries that have become more
profitable can be expected to invest more, but firms in exporting industries that have
become less profitable will be likely to want to scrap capital. So, although gross investment
may rise after Brexit, net investment may remain broadly unaffected – implying little overall
impact on productivity growth. As in our October forecast, business tax measures introduced
in the Budget are expected to provide modest support to business investment.
Chart 3.25: Real business investment
6
7
8
9
10
11
12
1980 1984 1988 1992 1996 2000 2004 2008 2012 2016 2020 2024
Per ce
nt o
f G
DP
October forecast
March forecast
Source: ONS, OBR
Forecast
3.75 Recent survey evidence suggests some firms have been stockpiling as insurance against a
possible no-deal Brexit (Box 3.1). We have revised up our forecast for stockbuilding in the
first quarter of this year, but the net effect on GDP growth is assumed to be negligible as
much of the additional stocks are likely to be imported. Once this stockpiling is unwound,
we expect stockbuilding to make little contribution to GDP across the forecast period.
53 Economic and fiscal outlook
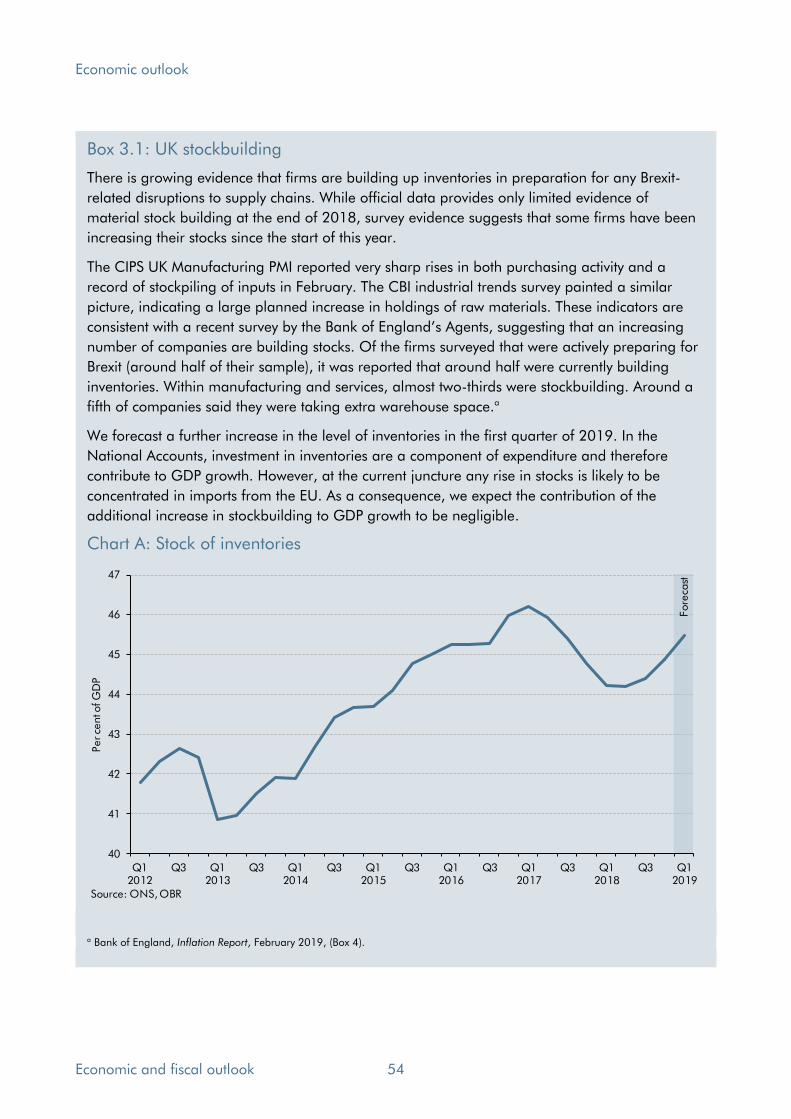
Economic outlook
Box 3.1: UK stockbuilding
There is growing evidence that firms are building up inventories in preparation for any Brexit-
related disruptions to supply chains. While official data provides only limited evidence of
material stock building at the end of 2018, survey evidence suggests that some firms have been
increasing their stocks since the start of this year.
The CIPS UK Manufacturing PMI reported very sharp rises in both purchasing activity and a
record of stockpiling of inputs in February. The CBI industrial trends survey painted a similar
picture, indicating a large planned increase in holdings of raw materials. These indicators are
consistent with a recent survey by the Bank of England’s Agents, suggesting that an increasing
number of companies are building stocks. Of the firms surveyed that were actively preparing for
Brexit (around half of their sample), it was reported that around half were currently building
inventories. Within manufacturing and services, almost two-thirds were stockbuilding. Around a
fifth of companies said they were taking extra warehouse space.a
We forecast a further increase in the level of inventories in the first quarter of 2019. In the
National Accounts, investment in inventories are a component of expenditure and therefore
contribute to GDP growth. However, at the current juncture any rise in stocks is likely to be
concentrated in imports from the EU. As a consequence, we expect the contribution of the
additional increase in stockbuilding to GDP growth to be negligible.
Chart A: Stock of inventories
40
41
42
43
44
45
46
47
Q12012
Q3 Q12013
Q3 Q12014
Q3 Q12015
Q3 Q12016
Q3 Q12017
Q3 Q12018
Q3 Q12019
Per ce
nt o
f G
DP
Source: ONS, OBR
Fore
cast
a Bank of England, Inflation Report, February 2019, (Box 4).
Economic and fiscal outlook 54

Economic outlook
Commercial property
3.76 Commercial property price inflation is expected to recover in 2018-19, after falls in prices in
both 2016-17 and 2017-18. In line with the latest consensus outlook from the IPF,16 prices
are still expected to fall in 2019-20 and 2020-21 before recovering. Our commercial
property transactions forecast is stronger for 2018-19 than it was in October, reflecting the
latest outturn data from HMRC, but it is little changed thereafter.
The government sector
Government consumption
3.77 Nominal government consumption grew by 2.8 per cent in 2018, up from 2.0 per cent in
2017. Outturn data and the Government’s fiscal plans imply growth of more than 3 per
cent a year through the remainder of the forecast, supported by the large increase in NHS
spending growth announced last year.
3.78 Real government consumption grew by 0.2 per cent in 2018, following a fall of 0.2 per cent
in 2017. Taking account of the way the ONS measures government consumption, for any
given forecast for nominal growth we assume that roughly half will be reflected in real
growth and half in the implicit deflator. On this basis, real government consumption is
expected to grow by 2.1 per cent in 2019 and then between 1.6 and 1.8 per cent a year
across the rest of the forecast period.
Government investment
3.79 Nominal government investment grew by 2.9 per cent in 2018, down from 5.7 per cent in
2017. Outturn data and the Government’s fiscal plans imply a sharp pick-up to over 9 per
cent in 2019. The fiscal plans then imply growth slows to 4.1 per cent in 2020 and is then
between 2 and 4 per cent a year over the rest of the forecast. We assume the general
government investment deflator grows broadly in line with its historical average since 1998.
General government employment
3.80 In the absence of specific workforce plans, we project general government employment
based on a few simple assumptions. We begin by assuming that the total paybill will grow
in line with a relevant measure of current government spending. We then forecast
government sector wage growth, taking account of recent data, stated government policy
and private sector earnings growth. We then combine the two to derive an implied
projection for general government employment.
3.81 Following the lifting of the 1 per cent cap on public sector pay rises in 2018-19, we assume
that general government earnings growth will rise so that it broadly matches private sector
average earnings growth in 2020. This implies general government employment will rise by
a cumulative 110,000 between the third quarter of 2018 and the first quarter of 2024. This
rise is similar to our October forecast.
16 Investment property forum UK consensus forecast, Autumn 2018. Since we closed our pre-measures forecast, the IPF released a subsequent consensus forecast covering the winter period. We will incorporate this into our next forecast in the autumn.
55 Economic and fiscal outlook

Economic outlook
The external sector
The impact of the EU referendum result on trade flows
3.82 As explained in paragraph 3.6, the sharp fall in sterling following the referendum appears
to have provided even less support to net trade than the small amount we expected. The
depreciation has resulted in a large rise in sterling export prices which has boosted
exporters’ profitability. But exporters appear to have been reluctant to expand production to
take advantage of this, presumably in part due to uncertainty around the future trading
relationship with the EU and other countries that the EU currently has trade agreements
with. Resolution of this uncertainty could boost exports in the near term, but the effect would
probably be outweighed by the impact of increased barriers to trade with the EU and those
non-EU countries with trading agreements with the EU that are not rolled over.
3.83 We continue to assume that leaving the EU will result in a lower trade intensity of UK
economic activity. But with no meaningful basis on which to predict the eventual trading
relationship with other countries, we have not made any assumptions in respect of the
specific arrangements in place after the transition period ends. Instead, we calibrated the
trade effect of leaving the EU by averaging the results of three major external studies.17 We
assume that the full effect will take a decade to be felt and that it will reduce exports and
imports symmetrically so that the effect on net trade will be broadly neutral.
Net trade
3.84 Export volumes grew by 0.2 per cent in 2018, significantly less than the 5.6 per cent seen
the previous year. The fall was partly due to lower growth in the UK’s export markets. Import
volumes increased by 0.8 per cent in 2018, down from 3.5 per cent in 2017. Net trade is
estimated to have reduced GDP growth by 0.2 percentage points in 2018, having increased
it by 0.5 percentage points the previous year. The trade data are extremely volatile, prone to
substantial revision and currently not accorded National Statistic status, so it is unwise to
place too much weight on any particular vintage of data.
3.85 Following the weakness in 2018, we expect export volumes growth to pick up to around 1.5
per cent in 2019 and 2020. Export growth is expected to slow thereafter, as the transition
period comes to an end and increased trade barriers weigh on the UK’s export market
share. We also expect import growth to pick up to around 3 per cent in 2019. That is mostly
a consequence of the rise in import-weighted domestic demand growth, partly reflecting the
heavy stockbuilding in the first quarter. We then expect import growth to flatten off by the
end of the forecast period as Brexit holds back import penetration.
3.86 Overall, we expect net trade to drag on GDP growth over the forecast period (Chart 3.26).
Relative to October, we have revised down the near-term contribution of net trade to GDP
growth, reflecting weaker prospects in the UK’s main export markets.
17 Specifically, we have taken the average estimated effect from studies by NIESR (The long-term economic impact of leaving the EU, National Institute Economic Review no. 236, May 2016), the OECD (The economic consequences of Brexit: A taxing decision, OECD policy paper no. 16, April 2016) and LSE/CEP (The consequences of Brexit for UK trade and living standards, March 2016). These represent a subset of the many studies that were presented before the referendum.
Economic and fiscal outlook 56

Economic outlook
Chart 3.26: Net trade contributions to GDP
-3
-2
-1
0
1
2
3
4
1998 2000 2002 2004 2006 2008 2010 2012 2014 2016 2018 2020 2022
Perc
enta
ge p
oin
ts
Exports
Imports
Net trade
Source: ONS, OBR
Forecast
The current account
3.87 The latest ONS data suggest that the current account deficit widened to 5 per cent of GDP
in the third quarter of 2018, reflecting an increase in both the trade and income deficits. We
expect the current account deficit to remain at around 5 per cent of GDP until 2020,
narrowing gradually thereafter (Chart 3.27). This forecast reflects several factors:
• The trade deficit is expected to widen in 2019 and 2020 as a slowdown in UK export
market growth implies relatively weak export growth. The trade deficit is then expected
to stabilise from 2021. Our trade deficit forecast is somewhat larger than in October,
reflecting recent outturns and the downward revision to the near-term trade outlook.
• We expect a steady improvement in the net investment income balance. Early
estimates of the income balance can be volatile and subject to revision, and we
assume that some of the additional widening in the deficit in the third quarter unwinds
in the near term. We expect further gradual improvement thereafter as GDP growth in
the rest of the world outpaces that in the UK. Some of the factors behind the recent
deterioration in the balance should prove temporary – for example, the effects of weak
euro-area growth on foreign earnings. As with the trade deficit, our forecast for the
investment income deficit is somewhat larger than in our October forecast.
3.88 Despite a modest improvement from 2021, the current account deficit is expected to remain
large by historical standards, and remains a risk to the forecast (see paragraph 3.91).
57 Economic and fiscal outlook
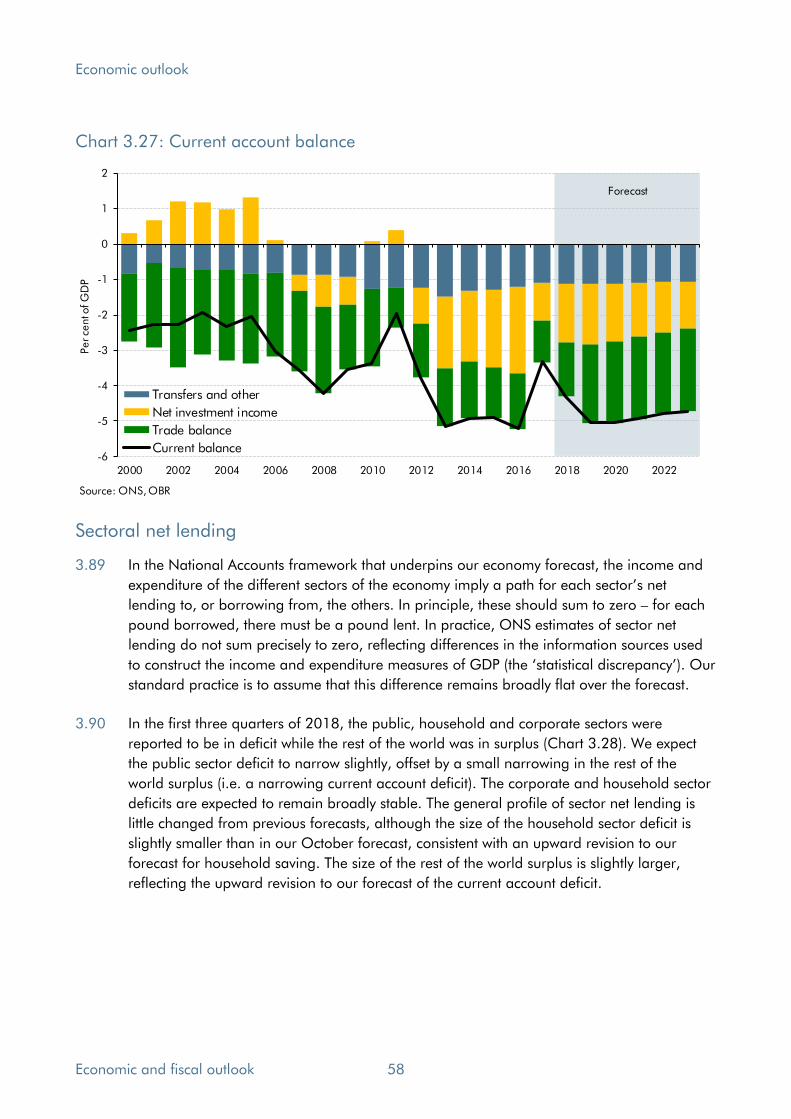
Economic outlook
Chart 3.27: Current account balance
-6
-5
-4
-3
-2
-1
0
1
2
2000 2002 2004 2006 2008 2010 2012 2014 2016 2018 2020 2022
Per ce
nt o
f G
DP
Transfers and other
Net investment income
Trade balance
Current balance
Source: ONS, OBR
Forecast
Sectoral net lending
3.89 In the National Accounts framework that underpins our economy forecast, the income and
expenditure of the different sectors of the economy imply a path for each sector’s net
lending to, or borrowing from, the others. In principle, these should sum to zero – for each
pound borrowed, there must be a pound lent. In practice, ONS estimates of sector net
lending do not sum precisely to zero, reflecting differences in the information sources used
to construct the income and expenditure measures of GDP (the ‘statistical discrepancy’). Our standard practice is to assume that this difference remains broadly flat over the forecast.
3.90 In the first three quarters of 2018, the public, household and corporate sectors were
reported to be in deficit while the rest of the world was in surplus (Chart 3.28). We expect
the public sector deficit to narrow slightly, offset by a small narrowing in the rest of the
world surplus (i.e. a narrowing current account deficit). The corporate and household sector
deficits are expected to remain broadly stable. The general profile of sector net lending is
little changed from previous forecasts, although the size of the household sector deficit is
slightly smaller than in our October forecast, consistent with an upward revision to our
forecast for household saving. The size of the rest of the world surplus is slightly larger,
reflecting the upward revision to our forecast of the current account deficit.
Economic and fiscal outlook 58

Economic outlook
Chart 3.28: Sectoral net lending
-12
-10
-8
-6
-4
-2
0
2
4
6
8
10
2000 2002 2004 2006 2008 2010 2012 2014 2016 2018 2020 2022 2024
Per ce
nt o
f G
DP, r
ollin
g a
nnual ave
rage
Household Public Corporate
Rest of world Discrepancy
Forecast
Source: ONS, OBR
Risks and uncertainties
3.91 As always, we emphasise the many risks and uncertainties surrounding our central forecast.
Some are common to all forecasts: conditioning assumptions may prove invalid; there may
be unexpected shocks; and behavioural relationships may change.
3.92 Specific risks at the present juncture include:
• The outlook for productivity growth remains hugely uncertain. Over the next few years
we still expect some recovery from the weak rates seen since the financial crisis. But
that may not arrive, or may take longer to materialise, so that productivity continues to
disappoint. Alternatively, productivity could surprise to the upside – for example if
business investment rebounds more strongly than we expect.
• Policies and regimes will evolve to supersede those presently associated with EU
membership. These changes and the responses of households and businesses to them
are subject to great uncertainty. Our forecast assumes that the negotiations between
the UK and the EU result in an orderly transition to a new long-term relationship. This
is consistent with the UK and EU implementing the Withdrawal Agreement which would
see the trading relationship between the UK and the EU remains as it is now until the
end of 2020. Leaving the EU without a deal could have severe short-term effects on
demand and supply in the economy. Chapter 5 summarises some relevant previous
scenarios we have produced that highlight the responsiveness of the public finances to
alternative economic assumptions. Meanwhile different trading and migration
relationships could have significant effects on potential output over longer horizons.
Our Brexit discussion paper provided more detail on these issues.18
18 OBR, Brexit and the OBR’s forecasts, 2018.
59 Economic and fiscal outlook
Economic outlook
• We base our forecasts on several assumptions, including a path for interest rates that
follows market expectations. However, market participants are likely to have attached
a non-zero probability to a disorderly Brexit, whereas our central forecast assumes an
orderly transition. If that is the case, interest rate expectations could rise if and when
the possibility of a disorderly Brexit is removed. That would also have consequences for
debt interest costs (discussed in Chapter 4), as well as other asset prices (including
sterling) and thus output and inflation.
• The household saving ratio has fallen over recent years as private consumption growth
has outpaced income growth. We expect the saving ratio to remain low but stable
across the forecast. But an adverse shock could trigger an upwards adjustment as
households increase their precautionary saving in response to expectations of rising
unemployment. This would amplify the effects of the slowdown.
• There may be less labour market slack than we assume, for example if the equilibrium
unemployment rate is higher than our current assumption. In this event, wage growth
may be stronger than we expect.
• Global trade tensions remain high, after the US imposed tariffs on some imports
causing retaliatory measures from several of its trading partners. Further tariff
increases have been delayed but an escalation of trade tensions remains possible if a
resolution cannot be found. In its January WEO update, for instance, the IMF
suggested that the medium-term risks to the global economy were skewed to the
downside, reflecting the ongoing trade tensions, the risk of a deterioration in financial
market sentiment, and high levels of public and private debt.
• The UK’s current account deficit remains large as a share of GDP by historical
standards and is expected to remain so over the forecast period. Overseas investors
are consequently significant net lenders to the UK, which could pose risks if their
confidence in the UK economy were to be damaged by uncertainty regarding the
economic and political outlook – including if there were a disorderly Brexit. That could
lead to a sharp fall in sterling, bringing about a more abrupt demand-led narrowing
of the current account deficit and a subsequent spike in inflation. But while the current
account deficit remains large, it is worth noting that the UK’s net international
investment liabilities are modest as a share of GDP, mitigating this risk somewhat.
• In the 63 years for which the ONS has published consistent quarterly real GDP data,
there have been seven recessions – suggesting that the chance of a recession in any
five-year period is around one in two.19 So, the probability of a cyclical downturn
occurring sometime over our forecast horizon is fairly high.
19 See Chapter 3 our 2017 Fiscal risks report for more details.
Economic and fiscal outlook 60

Economic outlook
Comparison with external forecasters
3.93 In this section, we compare our latest projections with those of selected outside forecasters.
The differences between our forecast and those of external forecasters are generally small
compared with the uncertainty that surrounds any one of them.
Comparison with the Bank of England’s Inflation Report forecast
3.94 Alongside the February 2019 Inflation Report, the Bank of England published additional
information about its forecast that can be compared against our own (Table 3.6). This
included the Bank staff’s forecasts for the expenditure composition of GDP, consistent with the MPC’s central forecasts for GDP, CPI inflation and the unemployment rate.
3.95 The MPC’s modal forecast for GDP growth in 2019 is 1.2 per cent, the same as our central
forecast. This represents a downward revision from their November projection, driven by
softer global demand and the expectation of continued weak business investment in the first
half of this year. In the medium term, the Bank is a little more optimistic than we are
regarding the UK’s economic prospects. The MPC’s real GDP growth forecasts for 2020 and 2021 are 1.5 and 1.9 per cent respectively, 0.1 and 0.3 percentage points higher than
our central forecast. The Bank forecasts a similar unemployment rate but stronger average
earnings growth, despite a more pessimistic outlook for productivity.
3.96 By expenditure composition component, the Bank expects stronger consumption growth in
2019, but weaker business investment growth. It also expects a small negative contribution
from net trade to GDP growth in 2019, mainly due to subdued external demand weighing
on export growth. The Bank also expects a near-term boost to imports from stockbuilding.
61 Economic and fiscal outlook
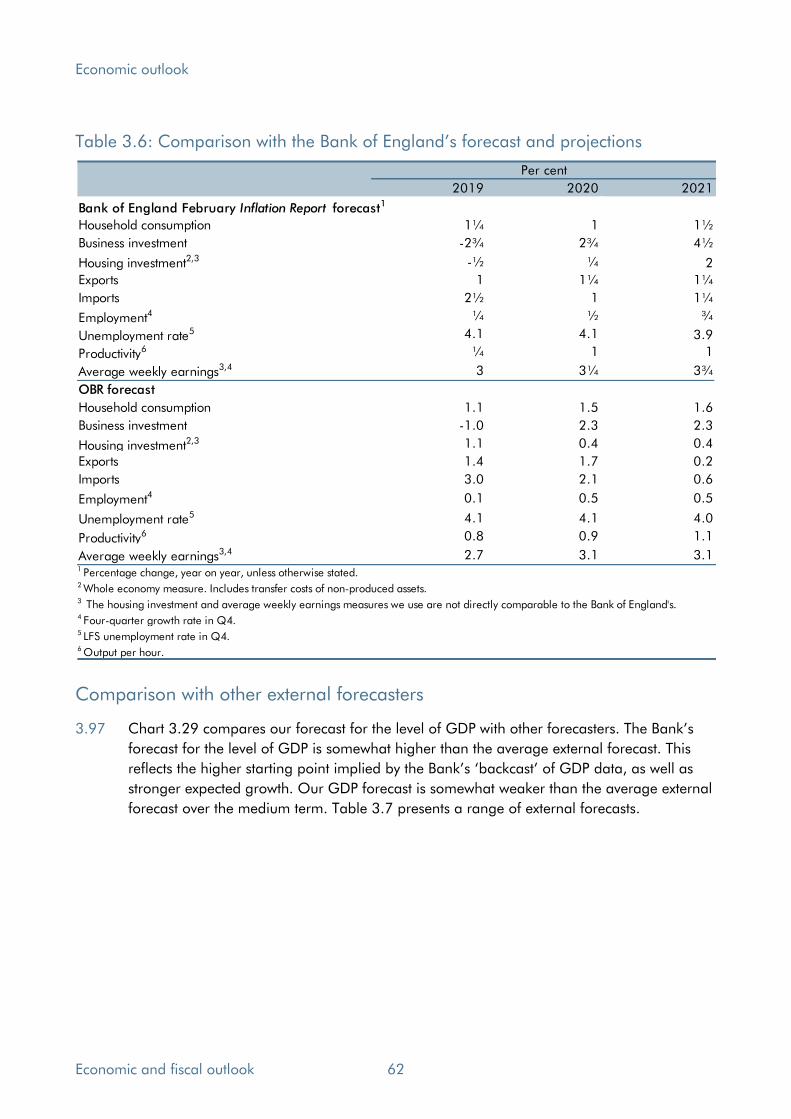
Economic outlook
Table 3.6: Comparison with the Bank of England’s forecast and projections
2019 2020 2021
Bank of England February Inflation Report forecast1
Household consumption 1¼ 1 1½
Business investment -2¾ 2¾ 4½
Housing investment2,3 -½ ¼ 2
Exports 1 1¼ 1¼
Imports 2½ 1 1¼
Employment4 ¼ ½ ¾
Unemployment rate5 4.1 4.1 3.9
Productivity6 ¼ 1 1
Average weekly earnings3,4 3 3¼ 3¾
OBR forecast
Household consumption 1.1 1.5 1.6
Business investment -1.0 2.3 2.3
Housing investment2,3 1.1 0.4 0.4
Exports 1.4 1.7 0.2
Imports 3.0 2.1 0.6
Employment4 0.1 0.5 0.5
Unemployment rate5 4.1 4.1 4.0
Productivity6 0.8 0.9 1.1
Average weekly earnings3,4 2.7 3.1 3.1
Per cent
5 LFS unemployment rate in Q4.6 Output per hour.
1 Percentage change, year on year, unless otherwise stated.2 Whole economy measure. Includes transfer costs of non-produced assets.3 The housing investment and average weekly earnings measures we use are not directly comparable to the Bank of England's.4 Four-quarter growth rate in Q4.
Comparison with other external forecasters
3.97 Chart 3.29 compares our forecast for the level of GDP with other forecasters. The Bank’s forecast for the level of GDP is somewhat higher than the average external forecast. This
reflects the higher starting point implied by the Bank’s ‘backcast’ of GDP data, as well as
stronger expected growth. Our GDP forecast is somewhat weaker than the average external
forecast over the medium term. Table 3.7 presents a range of external forecasts.
Economic and fiscal outlook 62

Economic outlook
Chart 3.29: External forecasters GDP comparison
100
102
104
106
108
110
112
114
116
118
120
122
2013 2014 2015 2016 2017 2018 2019 2020 2021 2022 2023
2013 =
100
Bank of England
Consensus
OBR
Source: Bank of England, HM Treasury, ONS, OBR
Forecast
63 Economic and fiscal outlook
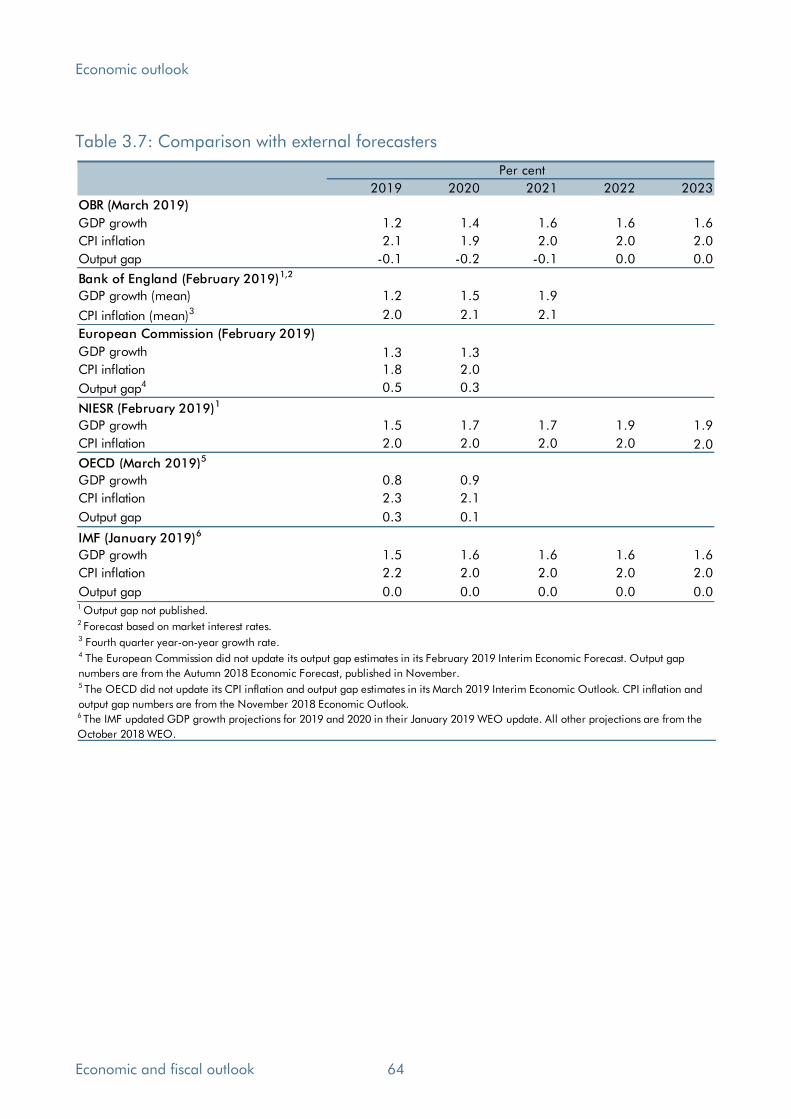
Economic outlook
Table 3.7: Comparison with external forecasters
2019 2020 2021 2022 2023
OBR (March 2019)
GDP growth 1.2 1.4 1.6 1.6 1.6
CPI inflation 2.1 1.9 2.0 2.0 2.0
Output gap -0.1 -0.2 -0.1 0.0 0.0
Bank of England (February 2019)1,2
GDP growth (mean) 1.2 1.5 1.9
CPI inflation (mean)3 2.0 2.1 2.1
European Commission (February 2019)
GDP growth 1.3 1.3
CPI inflation 1.8 2.0
Output gap4 0.5 0.3
NIESR (February 2019)1
GDP growth 1.5 1.7 1.7 1.9 1.9
CPI inflation 2.0 2.0 2.0 2.0 2.0
OECD (March 2019)5
GDP growth 0.8 0.9
CPI inflation 2.3 2.1
Output gap 0.3 0.1
IMF (January 2019)6
GDP growth 1.5 1.6 1.6 1.6 1.6
CPI inflation 2.2 2.0 2.0 2.0 2.0
Output gap 0.0 0.0 0.0 0.0 0.0
6 The IMF updated GDP growth projections for 2019 and 2020 in their January 2019 WEO update. All other projections are from the
October 2018 WEO.
Per cent
2 Forecast based on market interest rates.3 Fourth quarter year-on-year growth rate.4 The European Commission did not update its output gap estimates in its February 2019 Interim Economic Forecast. Output gap
numbers are from the Autumn 2018 Economic Forecast, published in November.
1 Output gap not published.
5 The OECD did not update its CPI inflation and output gap estimates in its March 2019 Interim Economic Outlook. CPI inflation and
output gap numbers are from the November 2018 Economic Outlook.
Economic and fiscal outlook 64
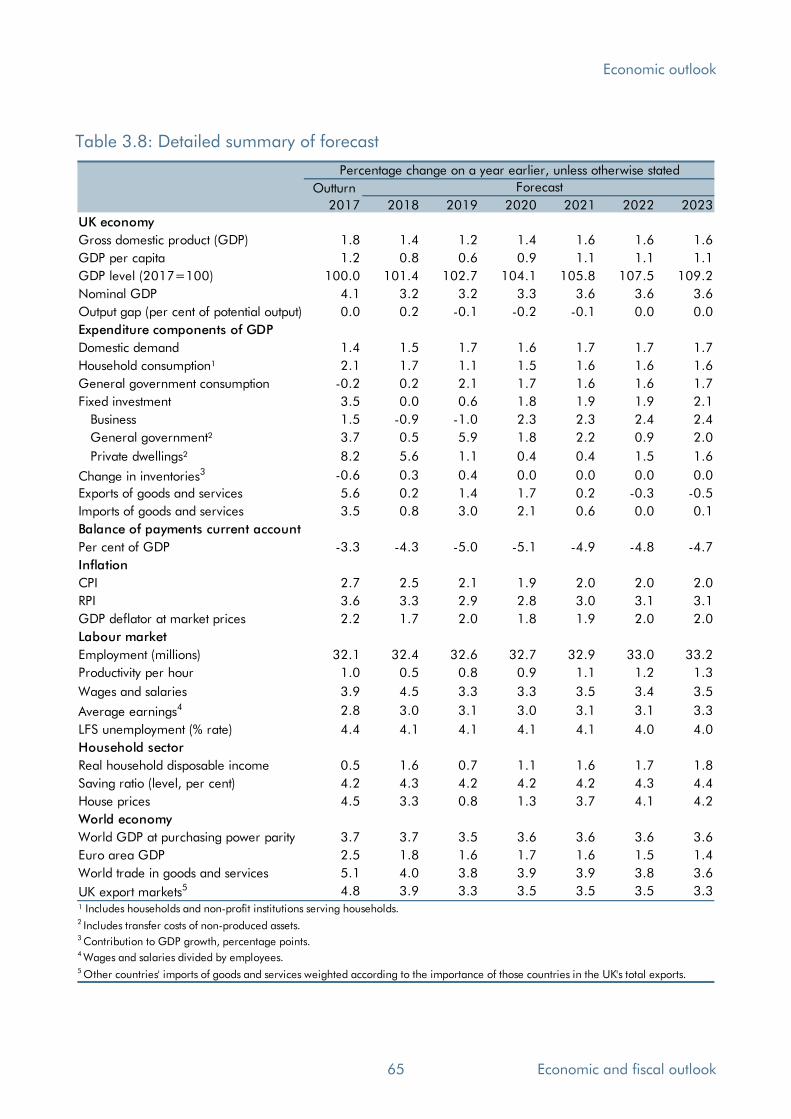
Economic outlook
Table 3.8: Detailed summary of forecast
Outturn
2017 2018 2019 2020 2021 2022 2023
UK economy
Gross domestic product (GDP) 1.8 1.4 1.2 1.4 1.6 1.6 1.6
GDP per capita 1.2 0.8 0.6 0.9 1.1 1.1 1.1
GDP level (2017=100) 100.0 101.4 102.7 104.1 105.8 107.5 109.2
Nominal GDP 4.1 3.2 3.2 3.3 3.6 3.6 3.6
Output gap (per cent of potential output) 0.0 0.2 -0.1 -0.2 -0.1 0.0 0.0
Expenditure components of GDP
Domestic demand 1.4 1.5 1.7 1.6 1.7 1.7 1.7
Household consumption¹ 2.1 1.7 1.1 1.5 1.6 1.6 1.6
General government consumption -0.2 0.2 2.1 1.7 1.6 1.6 1.7
Fixed investment 3.5 0.0 0.6 1.8 1.9 1.9 2.1
Business 1.5 -0.9 -1.0 2.3 2.3 2.4 2.4
General government² 3.7 0.5 5.9 1.8 2.2 0.9 2.0
Private dwellings² 8.2 5.6 1.1 0.4 0.4 1.5 1.6
Change in inventories3 -0.6 0.3 0.4 0.0 0.0 0.0 0.0
Exports of goods and services 5.6 0.2 1.4 1.7 0.2 -0.3 -0.5
Imports of goods and services 3.5 0.8 3.0 2.1 0.6 0.0 0.1
Balance of payments current account
Per cent of GDP -3.3 -4.3 -5.0 -5.1 -4.9 -4.8 -4.7
Inflation
CPI 2.7 2.5 2.1 1.9 2.0 2.0 2.0
RPI 3.6 3.3 2.9 2.8 3.0 3.1 3.1
GDP deflator at market prices 2.2 1.7 2.0 1.8 1.9 2.0 2.0
Labour market
Employment (millions) 32.1 32.4 32.6 32.7 32.9 33.0 33.2
Productivity per hour 1.0 0.5 0.8 0.9 1.1 1.2 1.3
Wages and salaries 3.9 4.5 3.3 3.3 3.5 3.4 3.5
Average earnings4 2.8 3.0 3.1 3.0 3.1 3.1 3.3
LFS unemployment (% rate) 4.4 4.1 4.1 4.1 4.1 4.0 4.0
Household sector
Real household disposable income 0.5 1.6 0.7 1.1 1.6 1.7 1.8
Saving ratio (level, per cent) 4.2 4.3 4.2 4.2 4.2 4.3 4.4
House prices 4.5 3.3 0.8 1.3 3.7 4.1 4.2
World economy
World GDP at purchasing power parity 3.7 3.7 3.5 3.6 3.6 3.6 3.6
Euro area GDP 2.5 1.8 1.6 1.7 1.6 1.5 1.4
World trade in goods and services 5.1 4.0 3.8 3.9 3.9 3.8 3.6
UK export markets5 4.8 3.9 3.3 3.5 3.5 3.5 3.3
4 Wages and salaries divided by employees.5 Other countries' imports of goods and services weighted according to the importance of those countries in the UK's total exports.
Percentage change on a year earlier, unless otherwise stated
¹ Includes households and non-profit institutions serving households.2 Includes transfer costs of non-produced assets.3 Contribution to GDP growth, percentage points.
Forecast
65 Economic and fiscal outlook

Economic outlook
Table 3.9: Detailed summary of changes to the forecast
Outturn
2017 2018 2019 2020 2021 2022 2023
UK economy
Gross domestic product (GDP) 0.1 0.1 -0.4 0.0 0.1 0.1 0.0
GDP per capita 0.1 0.1 -0.4 0.0 0.1 0.1 0.0
GDP level (2017=100)1 0.0 0.1 -0.2 -0.2 -0.1 0.0 0.1
Nominal GDP 0.3 0.0 -0.2 -0.1 0.1 0.1 0.1
Output gap (per cent of potential output) 0.0 0.0 -0.4 -0.4 -0.2 -0.1 -0.1
Expenditure components of GDP
Domestic demand 0.1 0.4 -0.1 0.1 0.3 0.1 0.1
Household consumption2 0.3 0.4 -0.1 0.3 0.3 0.2 0.1
General government consumption -0.1 -0.8 0.0 -0.3 -0.1 0.0 0.1
Fixed investment 0.2 -1.0 -2.3 0.0 0.1 -0.1 0.1
Business -0.2 -1.4 -3.2 0.2 0.3 0.3 0.2
General government3 2.0 0.7 0.3 -1.5 0.4 0.1 0.6
Private dwellings3 0.1 -1.4 -1.9 0.4 -0.4 -0.8 -0.3
Change in inventories4 -0.1 0.5 0.4 0.0 0.1 0.0 0.0
Exports of goods and services -0.1 -1.2 -0.9 -0.4 -0.3 0.0 -0.1
Imports of goods and services 0.3 0.2 0.2 -0.1 0.2 0.1 0.0
Balance of payments current account
Per cent of GDP 0.4 -0.8 -1.3 -1.4 -1.5 -1.5 -1.5
Inflation
CPI 0.0 -0.1 0.0 -0.1 -0.1 -0.1 0.0
RPI 0.0 -0.1 -0.2 -0.3 -0.1 0.0 0.0
GDP deflator at market prices 0.1 -0.1 0.3 -0.1 0.0 0.0 0.1
Labour market
Employment (millions) 0.0 0.0 -0.1 -0.1 -0.1 -0.1 0.0
Productivity per hour 0.2 -0.3 0.0 0.1 0.1 0.1 0.1
Wages and salaries 0.0 0.4 0.1 0.1 0.3 0.1 0.1
Average earnings5 0.0 0.4 0.6 0.2 0.2 0.0 0.0
LFS unemployment (% rate) 0.0 0.1 0.4 0.3 0.2 0.1 0.0
Household sector
Real household disposable income 0.6 0.9 0.1 0.3 0.3 0.3 0.2
Saving ratio (level, per cent) -0.3 0.2 0.2 0.2 0.2 0.3 0.4
House prices 0.0 -0.1 -2.3 -1.8 0.4 0.7 0.4
World economy
World GDP at purchasing power parity 0.0 -0.1 -0.1 -0.1 0.0 0.0 0.0
Euro area GDP 0.0 -0.2 -0.3 0.0 0.0 0.0 0.0
World trade in goods and services 0.1 -0.1 -0.2 -0.2 -0.1 0.0 0.0
UK export markets6 0.3 -0.2 -0.4 -0.4 -0.2 0.0 -0.11 Per cent change since October.2 Includes households and non-profit institutions serving households.3 Includes transfer costs of non-produced assets.4 Contribution to GDP growth, percentage points.5 Wages and salaries divided by employees.
Percentage change on a year earlier, unless otherwise stated
Forecast
6 Other countries' imports of goods and services weighted according to the importance of those countries in the UK's total exports.
Economic and fiscal outlook 66

Economic outlook
Table 3.10: Determinants of the fiscal forecast 195 45 45 45 45 45
Outturn
2017-18 2018-19 2019-20 2020-21 2021-22 2022-23 2023-24
GDP and its components
Real GDP 1.7 1.4 1.2 1.5 1.6 1.6 1.6 9.3
Nominal GDP1 3.9 3.1 3.2 3.4 3.5 3.6 3.6 22.3
Nominal GDP (£ billion)1,2 2067 2131 2200 2275 2355 2440 2529 462
Nominal GDP (centred end-March £bn)1,3 2100 2165 2236 2314 2397 2483 2574 473
Wages and salaries4 4.0 4.1 3.1 3.5 3.5 3.4 3.5 23.2
Non-oil PNFC profits4,5 2.9 2.9 2.2 3.0 3.3 3.6 3.6 20.1
Consumer spending4,5 4.2 3.9 3.2 3.4 3.7 3.7 3.7 23.6
Prices and earnings
GDP deflator 1.9 1.8 2.0 1.8 1.9 2.0 2.0 12.1
RPI 3.7 3.1 2.9 2.8 3.1 3.1 3.1 19.5
CPI 2.8 2.3 2.0 1.9 2.0 2.0 2.0 12.8
Average earnings6 2.7 2.9 3.0 3.1 3.1 3.2 3.3 20.0
'Triple-lock' guarantee (September) 3.0 2.6 3.5 2.9 3.1 3.1 3.2 19.9
Key fiscal determinants
Employment (millions) 32.2 32.5 32.6 32.8 32.9 33.1 33.2 1.0
Output gap (per cent of potential output) 0.1 0.2 -0.1 -0.2 -0.1 0.0 0.0 -0.1
Financial and property sectors
Equity prices (FTSE All-Share index) 4059 4002 3930 4063 4208 4359 4517 459
HMRC financial sector profits1,5,8 10.0 3.2 3.1 1.7 1.8 1.8 1.8 14.1
Residential property prices9 4.5 2.8 0.2 2.2 3.9 4.1 4.2 18.7
Residential property transactions (000s)10 1208 1194 1180 1247 1291 1328 1362 154
Commercial property prices10 -7.0 3.6 -1.6 -0.9 1.9 2.0 2.0 7.1
Commercial property transactions10 -0.8 -1.4 1.2 1.5 1.6 1.6 1.6 6.2
Oil and gas
Oil prices ($ per barrel)5 54.6 71.3 62.1 61.6 62.0 63.3 64.5 9.9
Oil prices (£ per barrel)5 42.4 53.4 47.7 46.5 46.3 46.7 47.1 4.7
Gas prices (p/therm)5 44.9 60.7 50.5 53.1 54.1 55.2 56.3 11.3
Oil production (million tonnes)5 46.6 47.3 48.4 48.4 46.0 43.7 41.5 -5.1
Gas production (billion therms)5 14.2 13.7 13.7 13.3 12.7 12.0 11.4 -2.8
Interest rates and exchange rates
Market short-term interest rates (%)11 0.4 0.8 0.9 1.1 1.2 1.3 1.3 0.9
Market gilt rates (%)12 1.3 1.4 1.3 1.4 1.5 1.6 1.7 0.4
Euro/Sterling exchange rate (€/£) 1.13 1.13 1.13 1.12 1.11 1.09 1.08 -0.051 Non-seasonally adjusted.2 Denominator for receipts, spending and deficit
forecasts as a per cent of GDP. 3 Denominator for net debt as a per cent of GDP.4 Nominal. 5 Calendar year. 11 3-month sterling interbank rate (LIBOR). 6 Wages and salaries divided by employees.
8 HMRC Gross Case 1 trading profits.9 Outturn data from ONS House Price Index. 10 Outturn data from HMRC information on stamp duty land tax.
12 Weighted average interest rate on conventional gilts.
Percentage change on previous year, unless otherwise specified Growth
over
forecast
Forecast
7 Adjusted for timing effects.
67 Economic and fiscal outlook
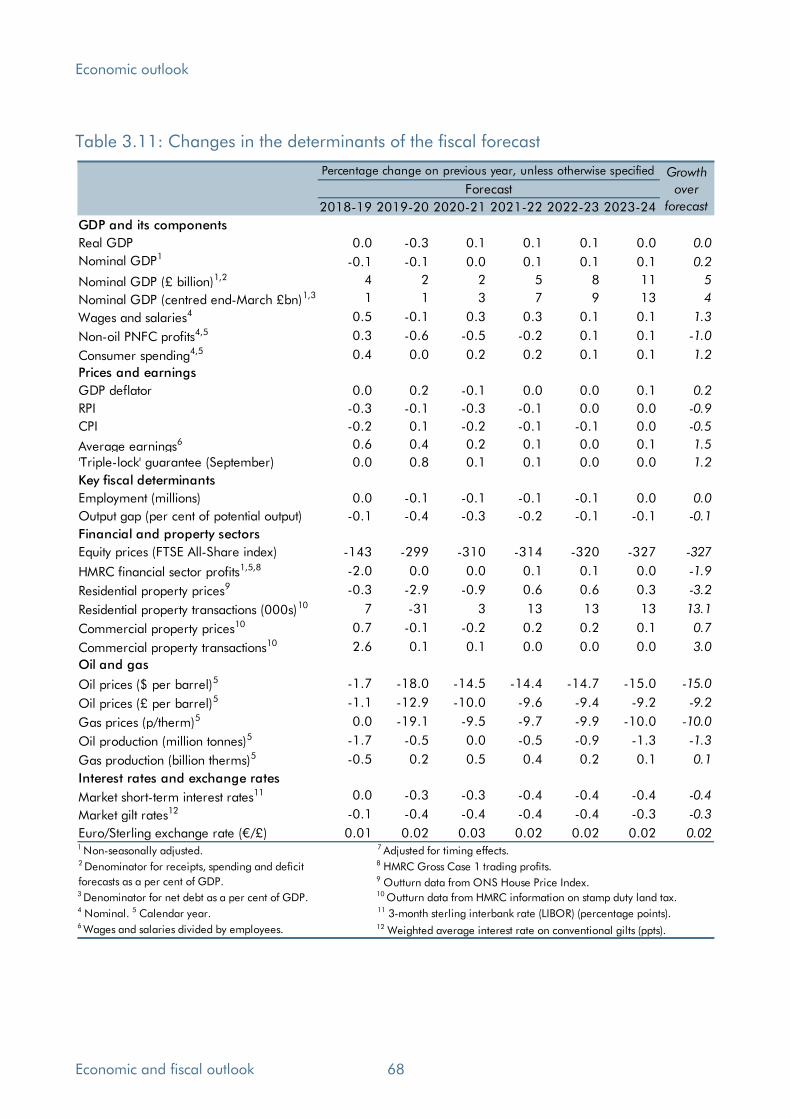
Economic outlook
Table 3.11: Changes in the determinants of the fiscal forecast 2
2018-19 2019-20 2020-21 2021-22 2022-23 2023-24
GDP and its components
Real GDP 0.0 -0.3 0.1 0.1 0.1 0.0 0.0
Nominal GDP1-0.1 -0.1 0.0 0.1 0.1 0.1 0.2
Nominal GDP (£ billion)1,2 4 2 2 5 8 11 5
Nominal GDP (centred end-March £bn)1,3 1 1 3 7 9 13 4
Wages and salaries4 0.5 -0.1 0.3 0.3 0.1 0.1 1.3
Non-oil PNFC profits4,5 0.3 -0.6 -0.5 -0.2 0.1 0.1 -1.0
Consumer spending4,5 0.4 0.0 0.2 0.2 0.1 0.1 1.2
Prices and earnings
GDP deflator 0.0 0.2 -0.1 0.0 0.0 0.1 0.2
RPI -0.3 -0.1 -0.3 -0.1 0.0 0.0 -0.9
CPI -0.2 0.1 -0.2 -0.1 -0.1 0.0 -0.5
Average earnings6 0.6 0.4 0.2 0.1 0.0 0.1 1.5
'Triple-lock' guarantee (September) 0.0 0.8 0.1 0.1 0.0 0.0 1.2
Key fiscal determinants
Employment (millions) 0.0 -0.1 -0.1 -0.1 -0.1 0.0 0.0
Output gap (per cent of potential output) -0.1 -0.4 -0.3 -0.2 -0.1 -0.1 -0.1
Financial and property sectors
Equity prices (FTSE All-Share index) -143 -299 -310 -314 -320 -327 -327
HMRC financial sector profits1,5,8 -2.0 0.0 0.0 0.1 0.1 0.0 -1.9
Residential property prices9 -0.3 -2.9 -0.9 0.6 0.6 0.3 -3.2
Residential property transactions (000s)10 7 -31 3 13 13 13 13.1
Commercial property prices10 0.7 -0.1 -0.2 0.2 0.2 0.1 0.7
Commercial property transactions10 2.6 0.1 0.1 0.0 0.0 0.0 3.0
Oil and gas
Oil prices ($ per barrel)5 -1.7 -18.0 -14.5 -14.4 -14.7 -15.0 -15.0
Oil prices (£ per barrel)5 -1.1 -12.9 -10.0 -9.6 -9.4 -9.2 -9.2
Gas prices (p/therm)5 0.0 -19.1 -9.5 -9.7 -9.9 -10.0 -10.0
Oil production (million tonnes)5 -1.7 -0.5 0.0 -0.5 -0.9 -1.3 -1.3
Gas production (billion therms)5 -0.5 0.2 0.5 0.4 0.2 0.1 0.1
Interest rates and exchange rates
Market short-term interest rates11 0.0 -0.3 -0.3 -0.4 -0.4 -0.4 -0.4
Market gilt rates12 -0.1 -0.4 -0.4 -0.4 -0.4 -0.3 -0.3
Euro/Sterling exchange rate (€/£) 0.01 0.02 0.03 0.02 0.02 0.02 0.021 Non-seasonally adjusted.2 Denominator for receipts, spending and deficit
forecasts as a per cent of GDP. 3 Denominator for net debt as a per cent of GDP.4 Nominal. 5 Calendar year. 11 3-month sterling interbank rate (LIBOR) (percentage points).6 Wages and salaries divided by employees. 12 Weighted average interest rate on conventional gilts (ppts).
Percentage change on previous year, unless otherwise specified Growth
over
forecast
Forecast
7 Adjusted for timing effects.8 HMRC Gross Case 1 trading profits.9 Outturn data from ONS House Price Index.10 Outturn data from HMRC information on stamp duty land tax.
Economic and fiscal outlook 68

4 Fiscal outlook
Introduction
4.1 This chapter:
• specifies the assumptions that we have made in respect of the UK’s forthcoming exit
from the EU (from paragraph 4.4);
• explains the effects of new policies announced since October on the fiscal forecast
(from paragraph 4.7);
• reviews classification issues affecting our forecast (in paragraph 4.14);
• describes the outlook for public sector receipts, including a tax-by-tax analysis
explaining how the forecasts have changed since October (from paragraph 4.15);
• portrays the outlook for public sector expenditure, focusing on spending covered by
departmental expenditure limits and the components of annually managed
expenditure, including those subject to the ‘welfare cap’ (from paragraph 4.60);
• presents the outlook for the key fiscal deficit aggregates, including headline and
structural measures of the budget deficit (from paragraph 4.113);
• describes the outlook for government lending to the private sector and other financial
transactions, including asset sales (from paragraph 4.130);
• shows the outlook for key balance sheet aggregates, such as public sector net debt
(from paragraph 4.155);
• summarises risks and uncertainties, including those embodied in the reporting of
contingent liabilities (paragraph 4.179); and
• compares our forecasts to those of international organisations (in paragraph 4.190).
4.2 Further breakdowns of receipts and expenditure and other details of our forecast are
provided in extensive supplementary tables on our website. The forecasts in this chapter start
from the estimates of 2017-18 outturn data published by the Office for National Statistics
(ONS) on 21 February. We then present an in-year estimate for 2018-19 that makes use of
ONS outturn data for April 2018 to January 2019 and limited administrative tax data for
some of February. Finally, we present forecasts for 2019-20 to 2023-24.
69 Economic and fiscal outlook

Fiscal outlook
4.3 As in previous Economic and fiscal outlooks (EFOs), this fiscal forecast:
• Represents our central view of the path of the public finances, based on the current
policies and policy assumptions of the Government, including some broad-brush
assumptions about future policy settings in respect of the UK’s exit from the EU. On that basis, we believe that, in the absence of future policy or classification changes, the
outturns would be as likely to be above the forecast as below it.
• Is based on announced Government policy on the indexation of rates, thresholds and
allowances for taxes and benefits, and incorporates estimates of the effects of new
policies announced since our previous forecast in October.
• Focuses on official ‘headline’ fiscal aggregates that exclude public sector banks.
Assumptions regarding the UK’s exit from the EU
4.4 The OBR is required by legislation to produce its forecasts based on current government
policy (but not necessarily assuming that particular objectives will be met). With negotiations
over the UK’s exit from the EU still taking place, this is not straightforward. We asked the Government if it wished to provide any additional information on its current policies that
would be relevant to our forecasts. As set out in the Foreword, it directed us to its July 2018
White Paper and the White Paper on immigration published in December 2018.
4.5 Since our previous forecast, the UK Government and the European Union published the
latest draft Withdrawal Agreement and the Political Declaration on the future relationship
between the UK and the EU on 25 November 2018. This set out in further detail the terms
of the financial settlement – the so-called ‘divorce bill’ – to complement the draft
Withdrawal Agreement from 19 March 2018. We have updated our central forecast to
incorporate the latest information on the cost of the financial settlement.
4.6 Given the uncertainty as to how the Government will respond to the choices and trade-offs
facing it during the negotiations, we still have no meaningful basis for predicting a precise
outcome upon which we could then condition our forecast. Moreover, even if the outcome
of the negotiations were predictable, its impact on the economy and the public finances
would still be uncertain. Specifically, as regards this fiscal forecast, we assume that:
• The UK leaves the EU on 29 March 2019 – two years after Article 50 was invoked. A
transition period follows until December 2020.
• Any reduction in expenditure transfers to EU institutions – after factoring in the cost of
the financial settlement – would be recycled fully into substitute spending. This
assumption is fiscally neutral.
• There are no changes to the structure or membership of tax systems for which there
are common EU rules (such as VAT and the EU emissions trading system or the
customs duties that are deemed to be collected on behalf of the EU).
Economic and fiscal outlook 70

Fiscal outlook
Policy announcements
4.7 The Government does not consider this Spring Statement to be a full ‘fiscal event’ and has not produced a ‘scorecard’ of policy measures. But several measures have been announced
since the Budget and departmental spending totals were increased in the Statement itself.
4.8 We consider the effects of all policy announcements that affect the public finances, so long
as they can be quantified with reasonable accuracy and assigned to specific years. We note
as risks to the fiscal forecast any significant policy commitments or ambitions that are not
quantifiable, for example because there is insufficient detail on the policy design or delivery.
4.9 The policy changes that we have incorporated in this forecast are summarised in Table 4.1,
which follows the Treasury convention of showing costs that raise borrowing as negative and
savings that reduce it as positive. Overall, these policy changes amount to a small fiscal
giveaway, driven mainly by higher departmental spending across the forecast period.
4.10 The key features of these measures include:
• Higher health spending to maintain real-terms funding in the face of revisions to GDP
deflator inflation – adding amounts rising to £0.8 billion in 2023-24.
• Higher non-health current departmental spending again to keep spending flat in real
terms despite higher GDP deflator inflation – also adding amounts rising to £0.8
billion in 2023-24.
• Several policy changes to universal credit and disability benefits. Overall, these
changes raise spending by £0.2 billion a year on average from 2020-21 onwards.
• Other policy changes are smaller and their effects are largely offsetting. They include
raising the fees payable for an application for a grant of probate and the doubling of
the ‘immigration health surcharge’, the fiscal effect of which the Government has chosen to offset via changes to the Home Office’s departmental budget.
4.11 These decisions have a partially offsetting indirect effect on borrowing. This reflects the
modest boost net fiscal giveaway gives to the economy and tax receipts and the increase in
public service pension contributions associated with higher departmental current spending.
4.12 The overall effect of policy changes on our forecast is to increase net borrowing by amounts
rising from £0.7 billion in 2019-20 to £2.1 billion in 2023-24.
4.13 We discuss their effect in more detail in Annex A, where we also set out our assessment of
the degree of uncertainty associated with them. Annex A also provides an update on various
previous measures, and the policy commitments and ambitions we treat as policy risks.
71 Economic and fiscal outlook

Fiscal outlook
Table 4.1: Summary of the effect of Government decisions on the budget balance
2018-19 2019-20 2020-21 2021-22 2022-23 2023-24
Total effect of Government decisions -0.3 -0.7 -1.2 -1.2 -1.8 -2.1
of which:
Direct effects -0.3 -1.2 -1.5 -1.6 -2.1 -2.4
Receipts 0.0 0.3 0.7 0.5 0.4 0.4
Welfare spending 0.0 0.1 -0.2 -0.3 -0.1 -0.3
Other AME 0.0 -1.3 -0.7 -1.0 -0.7 -0.8
RDEL 0.6 -1.5 -1.4 -1.4 -1.6 -2.1
CDEL -1.0 1.3 0.0 0.6 -0.1 0.4
Indirect effects 0.0 0.4 0.3 0.4 0.3 0.3
£ billion
Forecast
Note: The full breakdown of this table can be found in Annex A. This table uses the Treasury scorecard convention that a positive
figure means an improvement in PSNB, PSNCR and PSND.
Classification changes
4.14 There have been no major classification or methodology decisions made by the ONS or the
Treasury that have affected our forecast relative to October. But several live issues could
have material effects on future forecasts. By far the largest of these concerns the accounting
treatment for student loans. In December the ONS indicated its intention to change their
methodology, but we do not yet have sufficient certainty about how this will be implemented
to include it in our central forecast. The potential fiscal implications are discussed in Annex
B. Other issues being considered by the ONS include:
• The classification of several policies that we have provisionally recorded as taxes in this
forecast: the digital services tax, probate fees and the immigration health surcharge.
• Whether some or all the cost of visa charges should be considered as tax rather than
the sale of services. Were these charges to be reclassified as taxes the switch would be
deficit-neutral if the Government adjusted the DEL envelope accordingly.
• The sale of railway arches and spectrum licences, which we include as financial
transactions affecting debt immediately with smaller flow effects on the deficit.
• The classification or recording of several organisations that could have sizeable
balance sheet implications but smaller deficit impacts. These include the Pension
Protection Fund and funded public sector pension schemes, Pool Re (a terrorism
reinsurer) and the Nuclear Liabilities Fund. No changes are included in our forecast.
• Following a change to the recording of leases in commercial-based accounting (under
‘IFRS 16’), the ONS is looking at potential impacts on the public finances.
Economic and fiscal outlook 72

Fiscal outlook
Public sector receipts
4.15 Table 4.2 summarises our receipts forecast. On a like-for-like basis (excluding items in our
forecasts that are not yet incorporated into ONS outturns1), receipts rise by 0.6 per cent of
GDP in 2018-19 (mainly due to strong growth in income tax and NICs receipts), but then
drop back in 2019-20 (reflecting measures announced in Budget 2018, including an
above-inflation rise in the income tax personal allowance and higher rate threshold, and a
freeze to some excise duties). Receipts rise again as a share of GDP in 2020-21, despite a
cut in the main rate of onshore corporation tax from 19 to 17 per cent that year. This again
reflects policy changes from last year’s Budget, including reforming rules to increase the income tax and NICs paid by some people who work through their own company (known
as ‘IR35’) and a freeze in income tax allowances and thresholds in that year. Capital taxes
are also boosted in that year by the Budget 2017 measure to bring forward CGT payments
for gains made on residential property. The ratio of receipts-to-GDP rises gently thereafter.
Table 4.2: Major receipts as a share of GDP
Outturn
2017-18 2018-19 2019-20 2020-21 2021-22 2022-23 2023-24
Income tax 8.7 9.0 8.9 9.1 9.2 9.2 9.3
NICs 6.4 6.5 6.5 6.6 6.6 6.6 6.6
Value added tax 6.1 6.2 6.2 6.2 6.2 6.2 6.2
Onshore corporation tax 2.6 2.6 2.6 2.5 2.5 2.5 2.5
Fuel duties 1.3 1.3 1.3 1.3 1.3 1.3 1.3
Business rates 1.5 1.5 1.4 1.4 1.4 1.4 1.4
Council tax 1.6 1.6 1.7 1.6 1.6 1.6 1.6
Alcohol and tobacco duties 1.0 1.0 1.0 1.0 1.0 0.9 0.9
Capital taxes1 1.5 1.5 1.4 1.4 1.4 1.5 1.5
UK oil and gas receipts 0.1 0.0 0.0 0.1 0.1 0.1 0.1
Other taxes 3.2 3.4 3.4 3.4 3.3 3.3 3.3
National Accounts taxes 33.9 34.6 34.4 34.6 34.6 34.6 34.6
Interest and dividend receipts 0.3 0.4 0.5 0.5 0.5 0.6 0.6
Other receipts 2.2 2.0 2.0 2.0 2.0 2.0 2.0
Current receipts 36.4 37.0 36.9 37.1 37.1 37.2 37.2
Memo: Items included in OBR forecast but
not yet incorporated into ONS outturns- 0.1 0.1 0.1 0.1 0.1 0.1
1 Includes capital gains tax, inheritance tax, property transaction taxes and stamp taxes on shares.
Forecast
Per cent of GDP
Sources of changes in the receipts-to-GDP ratio
4.16 Movements in the receipts-to-GDP ratio can arise from two sources:
• changes in the composition of GDP can lead to specific tax bases growing more or
less quickly than GDP as a whole; and
• the effective tax rate paid on each tax base can change due to policy or other factors.
1 See the supplementary tables on our website for more information on these differences, which relate to classification decisions the ONS has taken but has not yet implemented in its statistics.
73 Economic and fiscal outlook
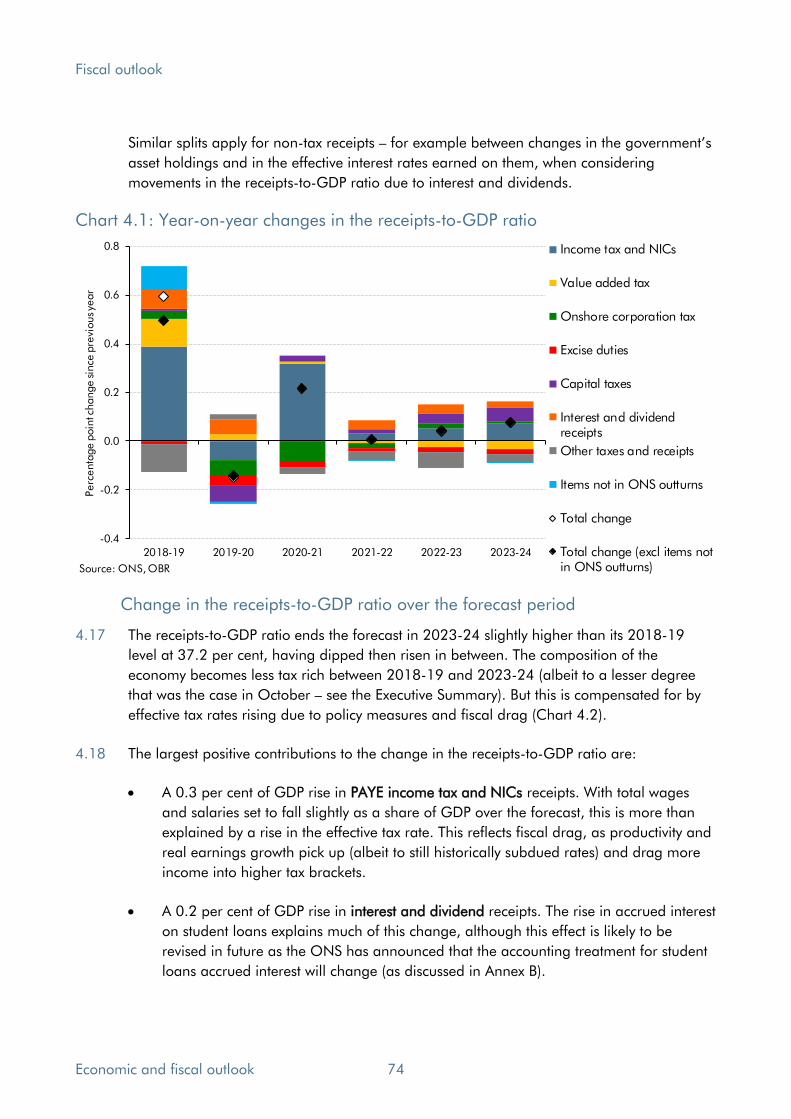
Fiscal outlook
Similar splits apply for non-tax receipts – for example between changes in the government’s asset holdings and in the effective interest rates earned on them, when considering
movements in the receipts-to-GDP ratio due to interest and dividends.
Chart 4.1: Year-on-year changes in the receipts-to-GDP ratio
-0.4
-0.2
0.0
0.2
0.4
0.6
0.8
2018-19 2019-20 2020-21 2021-22 2022-23 2023-24
Perc
enta
ge p
oin
t change sin
ce p
revi
ous ye
ar
Income tax and NICs
Value added tax
Onshore corporation tax
Excise duties
Capital taxes
Interest and dividendreceipts
Other taxes and receipts
Items not in ONS outturns
Total change
Total change (excl items notin ONS outturns)Source: ONS, OBR
Change in the receipts-to-GDP ratio over the forecast period
4.17 The receipts-to-GDP ratio ends the forecast in 2023-24 slightly higher than its 2018-19
level at 37.2 per cent, having dipped then risen in between. The composition of the
economy becomes less tax rich between 2018-19 and 2023-24 (albeit to a lesser degree
that was the case in October – see the Executive Summary). But this is compensated for by
effective tax rates rising due to policy measures and fiscal drag (Chart 4.2).
4.18 The largest positive contributions to the change in the receipts-to-GDP ratio are:
• A 0.3 per cent of GDP rise in PAYE income tax and NICs receipts. With total wages
and salaries set to fall slightly as a share of GDP over the forecast, this is more than
explained by a rise in the effective tax rate. This reflects fiscal drag, as productivity and
real earnings growth pick up (albeit to still historically subdued rates) and drag more
income into higher tax brackets.
• A 0.2 per cent of GDP rise in interest and dividend receipts. The rise in accrued interest
on student loans explains much of this change, although this effect is likely to be
revised in future as the ONS has announced that the accounting treatment for student
loans accrued interest will change (as discussed in Annex B).
Economic and fiscal outlook 74

Fiscal outlook
• A 0.1 per cent of GDP rise in self-assessment (SA) income tax receipts. This is largely
due to a rising tax base, reflecting our assumption that the share of self-employment in
total employment will rise over the forecast, continuing the trend of recent years.
4.19 The largest negative contributions to the change in the ratio are:
• A 0.1 per cent of GDP fall in business rate receipts. Receipts rise in 2021-22 due to the
planned revaluation, but gradually fall away in other forecast years as rateable values
fall in real terms thanks to subsequent appeals.
• A 0.1 per cent of GDP fall in excise duties. This is explained by declining tax bases,
due to falling alcohol and tobacco consumption and the rising fuel efficiency of the
vehicle stock. These are only partly offset by rises in duty rates based on the
Government’s stated duty uprating assumptions, which raise the effective tax rate.
• A 0.1 per cent of GDP fall in onshore corporation tax receipts. This is partly caused by
a fall in the effective tax rate – as the main rate will be cut to 17 per cent in 2020. But
we also assume that profits fall as a share of the economy over the forecast.
Chart 4.2: Sources of changes in the receipts-to-GDP ratio (2018-19 to 2023-24)
-0.6
-0.4
-0.2
0.0
0.2
0.4
0.6
0.8
PAYE ITand NICs
Interestand
dividends
Selfassess-ment
Propertytransact-ion taxes
Oilandgas
Environ-mentallevies
CGT VAT Othertaxes andreceipts
Banklevy
Businessrates
Exciseduties
OnshoreCT
Currentreceipts
Perc
enta
ge p
oin
t change
Change due to tax base
Change due to effective tax rate
Not disaggregated
Total change in share of GDP
Source: OBR
Detailed current receipts forecasts
4.20 Our detailed receipts forecasts and changes since October are presented in Tables 4.3 and
4.4. Further breakdowns are available on our website. Our forecasts for Scottish and Welsh
devolved taxes are discussed in our Devolved tax and spending forecasts publication.
75 Economic and fiscal outlook
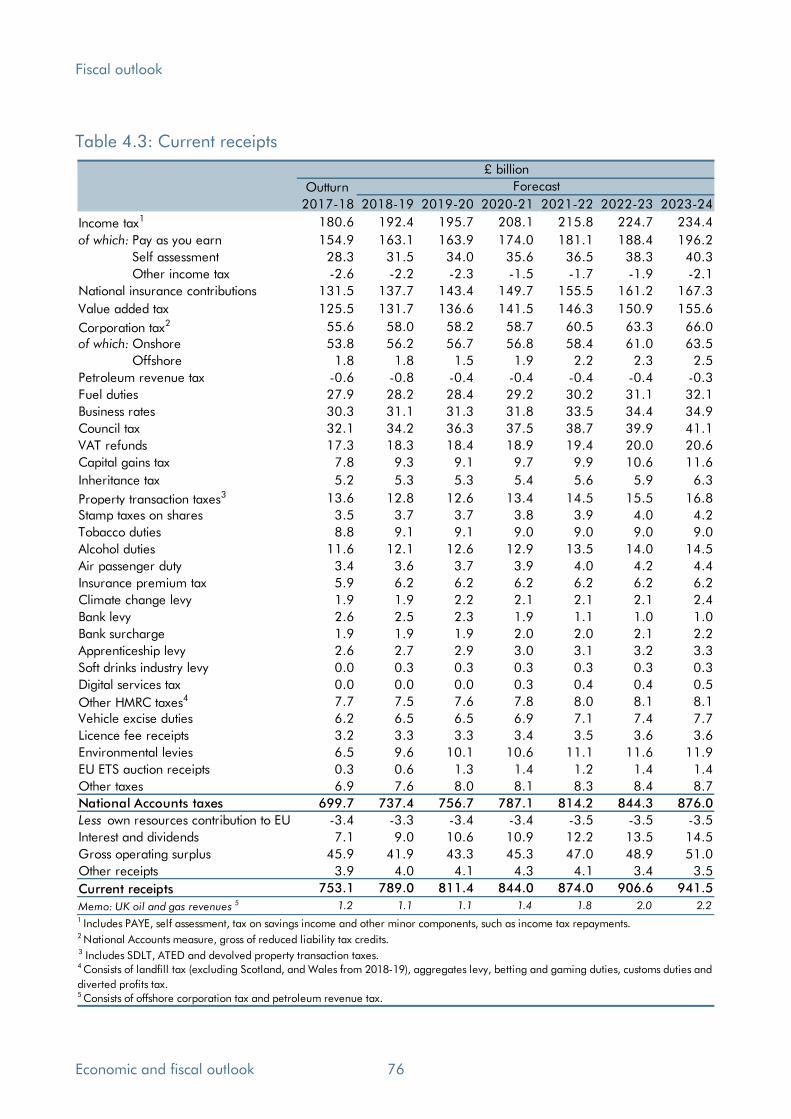
Fiscal outlook
Table 4.3: Current receipts
Outturn
2017-18 2018-19 2019-20 2020-21 2021-22 2022-23 2023-24
Income tax1 180.6 192.4 195.7 208.1 215.8 224.7 234.4
of which: Pay as you earn 154.9 163.1 163.9 174.0 181.1 188.4 196.2
Self assessment 28.3 31.5 34.0 35.6 36.5 38.3 40.3
Other income tax -2.6 -2.2 -2.3 -1.5 -1.7 -1.9 -2.1
National insurance contributions 131.5 137.7 143.4 149.7 155.5 161.2 167.3
Value added tax 125.5 131.7 136.6 141.5 146.3 150.9 155.6
Corporation tax2 55.6 58.0 58.2 58.7 60.5 63.3 66.0
of which: Onshore 53.8 56.2 56.7 56.8 58.4 61.0 63.5
Offshore 1.8 1.8 1.5 1.9 2.2 2.3 2.5
Petroleum revenue tax -0.6 -0.8 -0.4 -0.4 -0.4 -0.4 -0.3
Fuel duties 27.9 28.2 28.4 29.2 30.2 31.1 32.1
Business rates 30.3 31.1 31.3 31.8 33.5 34.4 34.9
Council tax 32.1 34.2 36.3 37.5 38.7 39.9 41.1
VAT refunds 17.3 18.3 18.4 18.9 19.4 20.0 20.6
Capital gains tax 7.8 9.3 9.1 9.7 9.9 10.6 11.6
Inheritance tax 5.2 5.3 5.3 5.4 5.6 5.9 6.3
Property transaction taxes3 13.6 12.8 12.6 13.4 14.5 15.5 16.8
Stamp taxes on shares 3.5 3.7 3.7 3.8 3.9 4.0 4.2
Tobacco duties 8.8 9.1 9.1 9.0 9.0 9.0 9.0
Alcohol duties 11.6 12.1 12.6 12.9 13.5 14.0 14.5
Air passenger duty 3.4 3.6 3.7 3.9 4.0 4.2 4.4
Insurance premium tax 5.9 6.2 6.2 6.2 6.2 6.2 6.2
Climate change levy 1.9 1.9 2.2 2.1 2.1 2.1 2.4
Bank levy 2.6 2.5 2.3 1.9 1.1 1.0 1.0
Bank surcharge 1.9 1.9 1.9 2.0 2.0 2.1 2.2
Apprenticeship levy 2.6 2.7 2.9 3.0 3.1 3.2 3.3
Soft drinks industry levy 0.0 0.3 0.3 0.3 0.3 0.3 0.3
Digital services tax 0.0 0.0 0.0 0.3 0.4 0.4 0.5
Other HMRC taxes4 7.7 7.5 7.6 7.8 8.0 8.1 8.1
Vehicle excise duties 6.2 6.5 6.5 6.9 7.1 7.4 7.7
Licence fee receipts 3.2 3.3 3.3 3.4 3.5 3.6 3.6
Environmental levies 6.5 9.6 10.1 10.6 11.1 11.6 11.9
EU ETS auction receipts 0.3 0.6 1.3 1.4 1.2 1.4 1.4
Other taxes 6.9 7.6 8.0 8.1 8.3 8.4 8.7
National Accounts taxes 699.7 737.4 756.7 787.1 814.2 844.3 876.0
Less own resources contribution to EU -3.4 -3.3 -3.4 -3.4 -3.5 -3.5 -3.5
Interest and dividends 7.1 9.0 10.6 10.9 12.2 13.5 14.5
Gross operating surplus 45.9 41.9 43.3 45.3 47.0 48.9 51.0
Other receipts 3.9 4.0 4.1 4.3 4.1 3.4 3.5
Current receipts 753.1 789.0 811.4 844.0 874.0 906.6 941.5
Memo: UK oil and gas revenues 5 1.2 1.1 1.1 1.4 1.8 2.0 2.2
2 National Accounts measure, gross of reduced liability tax credits.3 Includes SDLT, ATED and devolved property transaction taxes.
5 Consists of offshore corporation tax and petroleum revenue tax.
£ billion
Forecast
1 Includes PAYE, self assessment, tax on savings income and other minor components, such as income tax repayments.
4 Consists of landfill tax (excluding Scotland, and Wales from 2018-19), aggregates levy, betting and gaming duties, customs duties and
diverted profits tax.
Economic and fiscal outlook 76
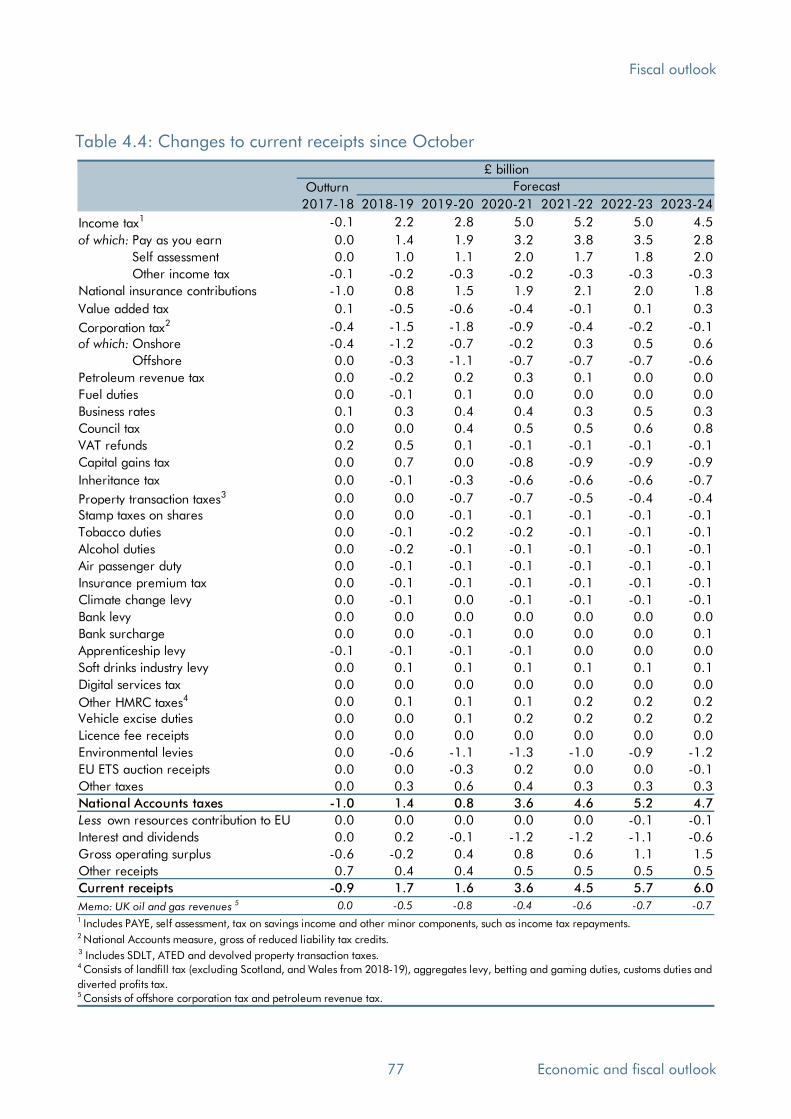
Fiscal outlook
Table 4.4: Changes to current receipts since October
Outturn
2017-18 2018-19 2019-20 2020-21 2021-22 2022-23 2023-24
Income tax1 -0.1 2.2 2.8 5.0 5.2 5.0 4.5
of which: Pay as you earnPay as you earn 0.0 1.4 1.9 3.2 3.8 3.5 2.8
Self assessment 0.0 1.0 1.1 2.0 1.7 1.8 2.0
Other income tax -0.1 -0.2 -0.3 -0.2 -0.3 -0.3 -0.3
National insurance contributions -1.0 0.8 1.5 1.9 2.1 2.0 1.8
Value added tax 0.1 -0.5 -0.6 -0.4 -0.1 0.1 0.3
Corporation tax2 -0.4 -1.5 -1.8 -0.9 -0.4 -0.2 -0.1
of which: Onshore -0.4 -1.2 -0.7 -0.2 0.3 0.5 0.6
Offshore 0.0 -0.3 -1.1 -0.7 -0.7 -0.7 -0.6
Petroleum revenue tax 0.0 -0.2 0.2 0.3 0.1 0.0 0.0
Fuel duties 0.0 -0.1 0.1 0.0 0.0 0.0 0.0
Business rates 0.1 0.3 0.4 0.4 0.3 0.5 0.3
Council tax 0.0 0.0 0.4 0.5 0.5 0.6 0.8
VAT refunds 0.2 0.5 0.1 -0.1 -0.1 -0.1 -0.1
Capital gains tax 0.0 0.7 0.0 -0.8 -0.9 -0.9 -0.9
Inheritance tax 0.0 -0.1 -0.3 -0.6 -0.6 -0.6 -0.7
Property transaction taxes3 0.0 0.0 -0.7 -0.7 -0.5 -0.4 -0.4
Stamp taxes on shares 0.0 0.0 -0.1 -0.1 -0.1 -0.1 -0.1
Tobacco duties 0.0 -0.1 -0.2 -0.2 -0.1 -0.1 -0.1
Alcohol duties 0.0 -0.2 -0.1 -0.1 -0.1 -0.1 -0.1
Air passenger duty 0.0 -0.1 -0.1 -0.1 -0.1 -0.1 -0.1
Insurance premium tax 0.0 -0.1 -0.1 -0.1 -0.1 -0.1 -0.1
Climate change levy 0.0 -0.1 0.0 -0.1 -0.1 -0.1 -0.1
Bank levy 0.0 0.0 0.0 0.0 0.0 0.0 0.0
Bank surcharge 0.0 0.0 -0.1 0.0 0.0 0.0 0.1
Apprenticeship levy -0.1 -0.1 -0.1 -0.1 0.0 0.0 0.0
Soft drinks industry levy 0.0 0.1 0.1 0.1 0.1 0.1 0.1
Digital services tax 0.0 0.0 0.0 0.0 0.0 0.0 0.0
Other HMRC taxes4 0.0 0.1 0.1 0.1 0.2 0.2 0.2
Vehicle excise duties 0.0 0.0 0.1 0.2 0.2 0.2 0.2
Licence fee receipts 0.0 0.0 0.0 0.0 0.0 0.0 0.0
Environmental levies 0.0 -0.6 -1.1 -1.3 -1.0 -0.9 -1.2
EU ETS auction receipts 0.0 0.0 -0.3 0.2 0.0 0.0 -0.1
Other taxes 0.0 0.3 0.6 0.4 0.3 0.3 0.3
National Accounts taxes -1.0 1.4 0.8 3.6 4.6 5.2 4.7
Less own resources contribution to EU 0.0 0.0 0.0 0.0 0.0 -0.1 -0.1
Interest and dividends 0.0 0.2 -0.1 -1.2 -1.2 -1.1 -0.6
Gross operating surplus -0.6 -0.2 0.4 0.8 0.6 1.1 1.5
Other receipts 0.7 0.4 0.4 0.5 0.5 0.5 0.5
Current receipts -0.9 1.7 1.6 3.6 4.5 5.7 6.0
Memo: UK oil and gas revenues 5 0.0 -0.5 -0.8 -0.4 -0.6 -0.7 -0.7
2 National Accounts measure, gross of reduced liability tax credits.3 Includes SDLT, ATED and devolved property transaction taxes.
5 Consists of offshore corporation tax and petroleum revenue tax.
£ billion
Forecast
4 Consists of landfill tax (excluding Scotland, and Wales from 2018-19), aggregates levy, betting and gaming duties, customs duties and
diverted profits tax.
1 Includes PAYE, self assessment, tax on savings income and other minor components, such as income tax repayments.
77 Economic and fiscal outlook

Fiscal outlook
Changes in the receipts forecast since October
4.21 We have revised our pre-measures forecast up in all years compared to October:
• Higher average earnings growth relative to our October forecast boosts receipts by
£2.1 billion in 2018-19 and by progressively larger amounts across the forecast.
• Stronger than expected self-assessment (SA) income tax and capital gains tax (CGT)
receipts in 2018-19 increase receipts by £1.7 billion. On the income tax side,
provisional HMRC analysis suggests that the strength is broadly based across the
various tax streams, so we assume that it largely persists over the forecast. On the
CGT side, around a third of the unexpected strength in January receipts is assumed to
be a timing effect, possibly related to policy changes in recent years. So only some of
the upward revision since October boosts receipts in future years. But this increases
receipts by progressively larger amounts across the forecast as we assume that gains
from financial assets are geared to equity prices rising in line with nominal GDP.
• Higher cumulative consumer spending growth across the forecast boosts VAT and
some other smaller indirect tax receipts by £0.4 billion in 2018-19, and by
increasingly larger amounts from 2019-20 onwards.
4.22 Partly offsetting these upward revisions, the main sources of downward revision include:
• Lower equity prices have reduced receipts by £1.8 billion a year on average from
2019-20 onwards. Our equity price assumption feeds into several tax forecasts, with
our capital gains tax forecast the most sensitive to changes in the assumption.
• Lower oil and gas prices since October have reduced UK oil and gas receipts by an
average of £1.6 billion a year from 2019-20 onwards.
• We have revised down near-term employment growth since October, particularly in
2019-20 due to our expectation that the unemployment rate will increase as output
dips below potential. This reduces income tax and NICs receipts by £1.2 billion in
2019-20, but by diminishing amounts thereafter as this effect unwinds.
• Lower interest rates reduce interest receipts on the government’s assets by around £1 billion a year from 2020-21 onwards.
4.23 The direct effect of Government decisions in this forecast boosts receipts by £0.5 billion a
year on average from 2019-20 onwards. The largest changes reflect increases in the rates
of both probate fees and the immigration health surcharge. The Government has decided
to offset both of these measures by increasing departmental spending limits, so the effects
of the measures are neutral for borrowing overall. Annex A provides more detail.
4.24 The indirect effect of the total policy package boosts earnings growth marginally, raising
income tax and NICs receipts by £0.2 billion a year on average from 2019-20 onwards.
Economic and fiscal outlook 78

Fiscal outlook
Table 4.5: Sources of change to the receipts forecast since October
2018-19 2019-20 2020-21 2021-22 2022-23 2023-24
October forecast 787.3 809.8 840.4 869.6 900.8 935.5
March forecast 789.0 811.4 844.0 874.0 906.6 941.5
Change 1.7 1.6 3.6 4.5 5.7 6.0
Total 1.7 1.0 2.5 3.7 5.0 5.2
of which:
Income and expenditure 2.8 2.0 3.4 4.9 5.7 6.3
Average earnings 2.1 3.4 4.6 5.3 5.5 5.8
Employee numbers 0.0 -1.2 -1.1 -0.8 -0.5 -0.5
Non-financial company profits -0.1 -0.3 -0.5 -0.6 -0.5 -0.5
Consumer expenditure 0.4 0.3 0.6 0.9 1.1 1.2
Self-assessment income streams 0.0 0.1 0.4 0.3 0.4 0.6
Other 0.3 -0.5 -0.6 -0.4 -0.3 -0.2
UK oil and gas 0.3 -1.0 -0.6 -0.7 -0.6 -0.8
Oil and gas prices -0.1 -1.6 -1.5 -1.7 -1.5 -1.5
Production and expenditure 0.4 0.6 0.9 1.0 0.9 0.8
Property markets 0.1 -0.7 -1.0 -0.7 -0.6 -0.5
Market-derived assumptions -0.1 -1.3 -2.4 -2.7 -2.9 -3.0
Oil prices 0.1 0.4 0.4 0.4 0.4 0.4
Equity prices -0.2 -1.0 -1.8 -1.9 -2.1 -2.2
Interest rates 0.0 -0.6 -1.0 -1.1 -1.1 -1.1
Exchange rates 0.0 -0.1 -0.1 -0.1 -0.1 -0.1
Prices -0.1 -0.3 -0.8 -0.7 -0.5 -0.3
Other economic determinants -0.1 0.4 0.4 0.4 0.3 0.4
Other assumptions -1.3 2.0 3.5 3.3 3.5 3.1
Non-SA IT and NICs receipts and modelling -0.1 0.7 1.3 0.8 -0.1 -1.8
January and February receipts SA IT surplus 1.0 1.0 1.6 1.3 1.4 1.5
Corporation tax receipts and modelling -1.1 -0.3 0.4 1.1 1.2 1.3
VAT receipts and modelling -1.0 -1.1 -1.1 -1.2 -1.2 -1.3
Excise receipts and modelling -0.5 -0.2 -0.2 -0.2 -0.1 -0.1
Council tax 0.0 0.3 0.3 0.4 0.4 0.6
Business rates receipts and modelling 0.3 0.4 0.4 0.4 0.6 0.5
Interest and dividend receipts and modelling 0.2 0.2 0.2 0.1 0.2 0.5
CGT outturn and modelling 0.7 0.6 0.7 0.7 0.8 0.9
Other judgements and modelling -0.7 0.5 0.0 -0.1 0.2 0.9
Total 0.0 0.6 1.1 0.7 0.7 0.8
of which:Direct effects 0.0 0.3 0.7 0.5 0.4 0.4
Indirect effects 0.0 0.3 0.3 0.3 0.3 0.4Memo: March pre-measures forecast 789.0 810.8 843.0 873.3 905.8 940.7
Effect of Government decisions
£ billion
Forecast
Underlying forecast changes
79 Economic and fiscal outlook
Fiscal outlook
Tax-by-tax analysis
PAYE income tax and NICs
4.25 PAYE income tax and NICs receipts on employee salaries have been revised up by £2.3
billion in 2018-19 relative to our October forecast. This comes on top of the £3.0 billion
upward revision we made in October. That £5.3 billion boost to 2018-19 receipts relative to
the forecast we made a year ago reflects:
• Unexpectedly strong earnings growth since our October forecast adds around £2.1
billion to receipts since then. This more than offsets the £1.0 billion drag on receipts
from average earnings growth revisions in our October forecast.
• Strong employment growth – particularly in the first half of 2018-19 – boosted our
receipts forecast by just over £2.0 billion in October. This has been only partly offset by
the downward revision to employment growth in this forecast.
• Real-time information (RTI) indicates that earnings growth at the very top of the
employee earnings distribution has been particularly strong. Mean total pay between
April and September for the top 0.1 per cent rose 5.9 per cent on a year earlier,
compared with a 3.7 per cent rise for the whole distribution on this measure. The latest
receipts data suggest that difference may have widened further since then. While this
relates to just 31,000 taxpayers, they accounted for 7.9 per cent of the PAYE income
tax and NIC receipts covered by the RTI system in 2017-18. This top-end strength will
have boosted the effective tax rate. (Earnings growth at the bottom of the distribution
has also been relatively strong, thanks to rises in the National Living Wage, but this
has relatively little effect on tax receipts due to the income tax personal allowance.)
• Higher tax paid on pension flexibility withdrawals and the effect of ‘PAYE refresh’, an
HMRC operational scheme to implement more in-year coding changes when PAYE
taxpayers’ circumstances change. Much of the additional receipts from these sources were incorporated into our October forecast.
4.26 With bonuses in both the financial and non-financial sectors concentrated in the final
months of the fiscal year, receipts for 2018-19 as a whole remain uncertain. We have
assumed that financial sector bonuses will be flat on a year earlier, but at this stage there is
little evidence to inform this judgement. Receipts growth from the sector so far this year has
been modest, while corporation tax receipts from the sector have fallen.
4.27 Growth in PAYE income tax and NIC receipts is expected to slow from 5.0 per cent in 2018-
19 to 2.2 per cent in 2019-20. This reflects the Budget 2018 measures raising the personal
allowance to £12,500 (up 5.5 per cent from 2018-19) and the higher rate threshold to
£50,000 (up 7.9 per cent) from April 2019. Weaker employment growth in 2019-20 also
contributes to slower growth in receipts. We expect growth in the number of employees to
slow from 1.2 per cent in 2018-19 to just 0.2 per cent in 2019-20.
Economic and fiscal outlook 80
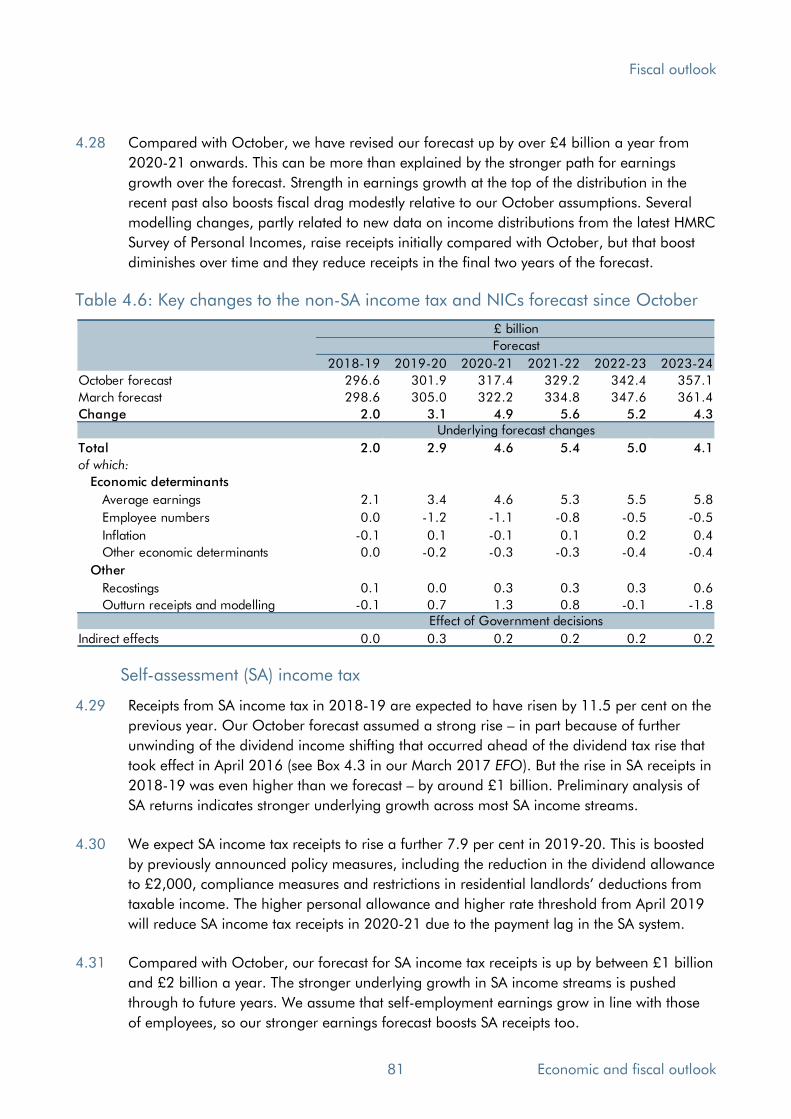
Fiscal outlook
4.28 Compared with October, we have revised our forecast up by over £4 billion a year from
2020-21 onwards. This can be more than explained by the stronger path for earnings
growth over the forecast. Strength in earnings growth at the top of the distribution in the
recent past also boosts fiscal drag modestly relative to our October assumptions. Several
modelling changes, partly related to new data on income distributions from the latest HMRC
Survey of Personal Incomes, raise receipts initially compared with October, but that boost
diminishes over time and they reduce receipts in the final two years of the forecast.
Table 4.6: Key changes to the non-SA income tax and NICs forecast since October
2018-19 2019-20 2020-21 2021-22 2022-23 2023-24
October forecast 296.6 301.9 317.4 329.2 342.4 357.1
March forecast 298.6 305.0 322.2 334.8 347.6 361.4
Change 2.0 3.1 4.9 5.6 5.2 4.3
Total 2.0 2.9 4.6 5.4 5.0 4.1
of which:
Economic determinants
Average earnings 2.1 3.4 4.6 5.3 5.5 5.8
Employee numbers 0.0 -1.2 -1.1 -0.8 -0.5 -0.5
Inflation -0.1 0.1 -0.1 0.1 0.2 0.4
Other economic determinants 0.0 -0.2 -0.3 -0.3 -0.4 -0.4
Other
Recostings 0.1 0.0 0.3 0.3 0.3 0.6
Outturn receipts and modelling -0.1 0.7 1.3 0.8 -0.1 -1.8
Indirect effects 0.0 0.3 0.2 0.2 0.2 0.2
Effect of Government decisions
£ billion
Forecast
Underlying forecast changes
Self-assessment (SA) income tax
4.29 Receipts from SA income tax in 2018-19 are expected to have risen by 11.5 per cent on the
previous year. Our October forecast assumed a strong rise – in part because of further
unwinding of the dividend income shifting that occurred ahead of the dividend tax rise that
took effect in April 2016 (see Box 4.3 in our March 2017 EFO). But the rise in SA receipts in
2018-19 was even higher than we forecast – by around £1 billion. Preliminary analysis of
SA returns indicates stronger underlying growth across most SA income streams.
4.30 We expect SA income tax receipts to rise a further 7.9 per cent in 2019-20. This is boosted
by previously announced policy measures, including the reduction in the dividend allowance
to £2,000, compliance measures and restrictions in residential landlords’ deductions from
taxable income. The higher personal allowance and higher rate threshold from April 2019
will reduce SA income tax receipts in 2020-21 due to the payment lag in the SA system.
4.31 Compared with October, our forecast for SA income tax receipts is up by between £1 billion
and £2 billion a year. The stronger underlying growth in SA income streams is pushed
through to future years. We assume that self-employment earnings grow in line with those
of employees, so our stronger earnings forecast boosts SA receipts too.
81 Economic and fiscal outlook
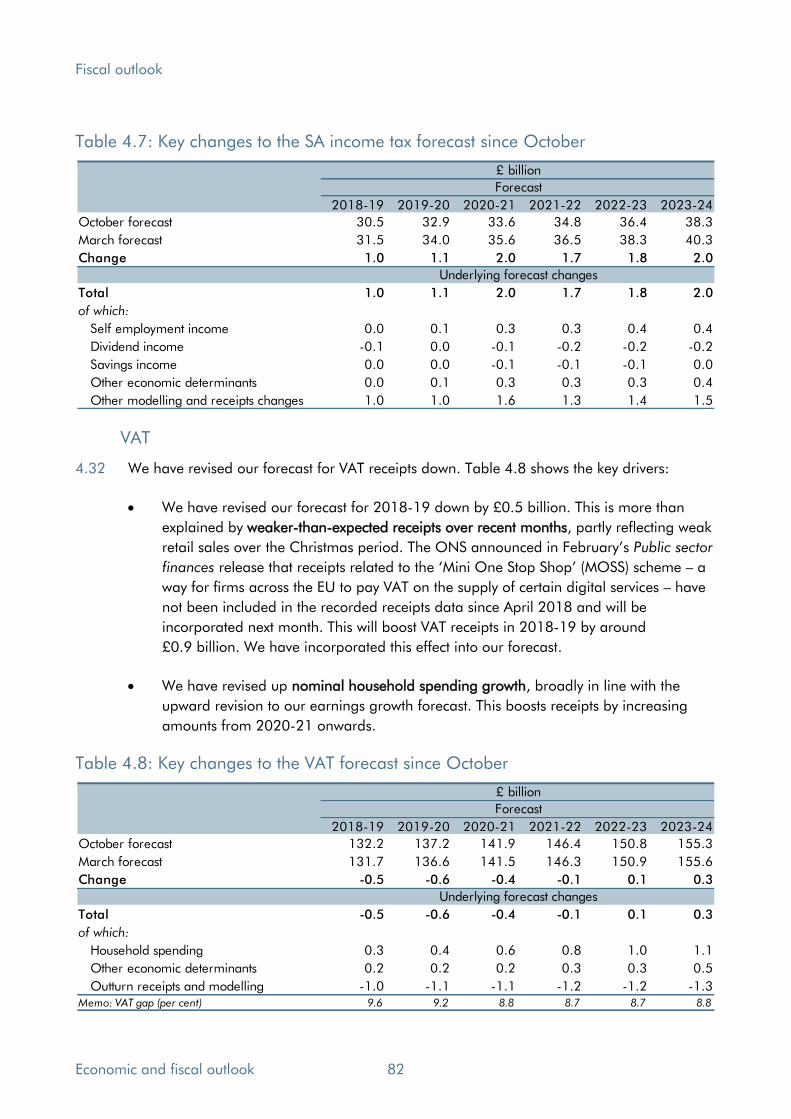
Fiscal outlook
Table 4.7: Key changes to the SA income tax forecast since October
2018-19 2019-20 2020-21 2021-22 2022-23 2023-24
October forecast 30.5 32.9 33.6 34.8 36.4 38.3
March forecast 31.5 34.0 35.6 36.5 38.3 40.3
Change 1.0 1.1 2.0 1.7 1.8 2.0
Total 1.0 1.1 2.0 1.7 1.8 2.0
of which:
Self employment income 0.0 0.1 0.3 0.3 0.4 0.4
Dividend income -0.1 0.0 -0.1 -0.2 -0.2 -0.2
Savings income 0.0 0.0 -0.1 -0.1 -0.1 0.0
Other economic determinants 0.0 0.1 0.3 0.3 0.3 0.4
Other modelling and receipts changes 1.0 1.0 1.6 1.3 1.4 1.5
£ billion
Forecast
Underlying forecast changes
VAT
4.32 We have revised our forecast for VAT receipts down. Table 4.8 shows the key drivers:
• We have revised our forecast for 2018-19 down by £0.5 billion. This is more than
explained by weaker-than-expected receipts over recent months, partly reflecting weak
retail sales over the Christmas period. The ONS announced in February’s Public sector
finances release that receipts related to the ‘Mini One Stop Shop’ (MOSS) scheme – a
way for firms across the EU to pay VAT on the supply of certain digital services – have
not been included in the recorded receipts data since April 2018 and will be
incorporated next month. This will boost VAT receipts in 2018-19 by around
£0.9 billion. We have incorporated this effect into our forecast.
• We have revised up nominal household spending growth, broadly in line with the
upward revision to our earnings growth forecast. This boosts receipts by increasing
amounts from 2020-21 onwards.
Table 4.8: Key changes to the VAT forecast since October
2018-19 2019-20 2020-21 2021-22 2022-23 2023-24
October forecast 132.2 137.2 141.9 146.4 150.8 155.3
March forecast 131.7 136.6 141.5 146.3 150.9 155.6
Change -0.5 -0.6 -0.4 -0.1 0.1 0.3
Total -0.5 -0.6 -0.4 -0.1 0.1 0.3
of which:
Household spending 0.3 0.4 0.6 0.8 1.0 1.1
Other economic determinants 0.2 0.2 0.2 0.3 0.3 0.5
Outturn receipts and modelling -1.0 -1.1 -1.1 -1.2 -1.2 -1.3Memo: VAT gap (per cent) 9.6 9.2 8.8 8.7 8.7 8.8
Forecast
£ billion
Underlying forecast changes
Economic and fiscal outlook 82

Fiscal outlook
4.33 The ‘implied VAT gap’ shown in Table 4.8 is the difference between a modelled theoretical
total VAT receipts and actual VAT receipts. It is adjusted for timing factors where they can be
estimated. Changes in this estimate may reflect real-world changes in non-compliance or
measurement errors in estimating the theoretical total. We assume that the VAT gap in
2018-19 is marginally lower than a year earlier, before falling slowly over the forecast – reflecting previously announced compliance measures.
4.34 As set out at the start of this chapter, we do not assume any changes to the structure or
membership of tax systems for which there are common EU rules, including VAT. In a
discussion paper last year we described these issues and our Brexit assumptions.2
Onshore corporation tax
4.35 We expect onshore corporation tax receipts to have risen by 4.5 per cent in 2018-19. Solid
growth in receipts from industrial and commercial companies has offset falls in receipts
from both the financial and life assurance sectors.
4.36 Growth in onshore corporation tax is expected to slow further to less than 1 per cent in both
2019-20 and 2020-21. This primarily reflects:
• Weak profit growth: Profits for non-oil, non-financial companies are expected to grow
more slowly than nominal GDP over the next two years, reflecting the cyclical
weakness in GDP growth. We also assume that financial sector profit growth will lag
behind nominal GDP growth from 2020-21 onwards, since the sector is likely to be
disproportionately affected by the UK’s exit from the EU.
• Previously announced policy measures: The temporary rise in the annual investment
allowance to £1 million for two years will weigh on receipts in both 2019-20 and
2020-21. The reduction in the main rate of corporation tax from 19 to 17 per cent in
April 2020 will affect accrued receipts from 2020-21. By 2023-24, this rate cut is
expected to reduce receipts by £5.4 billion a year.
4.37 Relative to October, onshore corporation tax on a National Accounts accruals basis is £1.2
billion lower in 2018-19, but is £0.6 billion higher by 2023-24. This reflects the downward
revision to non-oil, non-financial profits taking around £0.5 billion off receipts in the latter
years of the forecast and several modelling changes:
• Modelling the time-shifting of cash receipts to be consistent with the National Accounts
accruals treatment involves generating a monthly profile for cash receipts. Updating
our assumptions has led to a smaller proportion of receipts falling in early 2019-20
(accruing back to 2018-19). This reduces 2018-19 accrued receipts by over £1 billion.
• Capital allowances modelling. We have reviewed the assumptions underlying our
capital allowances deduction forecast, which appear to have driven some of our recent
under-forecasting of corporation tax receipts. Revising down assumed growth in use of
2 OBR, Discussion paper No.3: Brexit and the OBR’s forecasts, October 2018.
83 Economic and fiscal outlook
Fiscal outlook
capital allowances adds progressively larger amounts to receipts, reaching around £1
billion a year by the end of the forecast.
4.38 For accounting periods starting in or after April 2019, companies with profits of over £20
million a year will have to make their quarterly instalment payments four months earlier
than under the current regime. Firms will start making payments three months (rather than
seven) after the start of their accounting period. This will provide a largely one-off boost to
cash receipts, particularly in 2019-20 and to a lesser extent in 2020-21, without changing
underlying tax liabilities. The ONS will change how cash receipts are time-shifted to proxy
accrued receipts to ensure as best it can that this change does not affect the path of accrued
receipts recorded in the National Accounts.
4.39 We have revised down our estimate for the effect of bringing forward instalment payments
on cash receipts by £2.4 billion in 2019-20 and by £1.7 billion in 2020-21. Most of this
revision is explained by changes to two key assumptions:
• The share of tax paid by quarterly instalment payers that will be subject to the new
regime has been revised down from around two-thirds to around a half. This reflects
HMRC’s latest analysis of companies’ corporation tax returns. This accounts for around
two-thirds of the total revision across the two years.
• The share of all corporation tax receipts paid by quarterly instalment payers is likely to
be revised down, as HMRC has identified an issue in the algorithm that splits its
monthly administrative data on cash payments and repayments between larger
quarterly payers and smaller annual payers. The size of this reallocation is uncertain,
but HMRC’s initial analysis suggests around £3 billion to £4 billion (around 5 to 7 per
cent of onshore corporation tax) could be shifted from quarterly to annual payers. This
assumption accounts for around a third of the downward revision.
4.40 We have only included the effect from this allocation issue in the costing for the instalment
regime change in this forecast. HMRC is currently carrying out further quality assurance of
its latest methodology for identifying different types of payments before it can be reflected in
the ONS public sector finances data. While total cash receipts will not change, the different
accruals methods for quarterly and annual payers will result in changes to both ONS
outturns and our forecasts on a National Accounts basis. All else equal, a greater share of
cash receipts coming from annual payers, where the payment lag is greater, will generate a
larger difference between cash and accrued receipts. But corporation tax modelling is
necessarily complex – reflecting the tax system being modelled – so the eventual effect of
any change is very uncertain. We will reflect the full implications of these changes in our
next forecast.
Economic and fiscal outlook 84
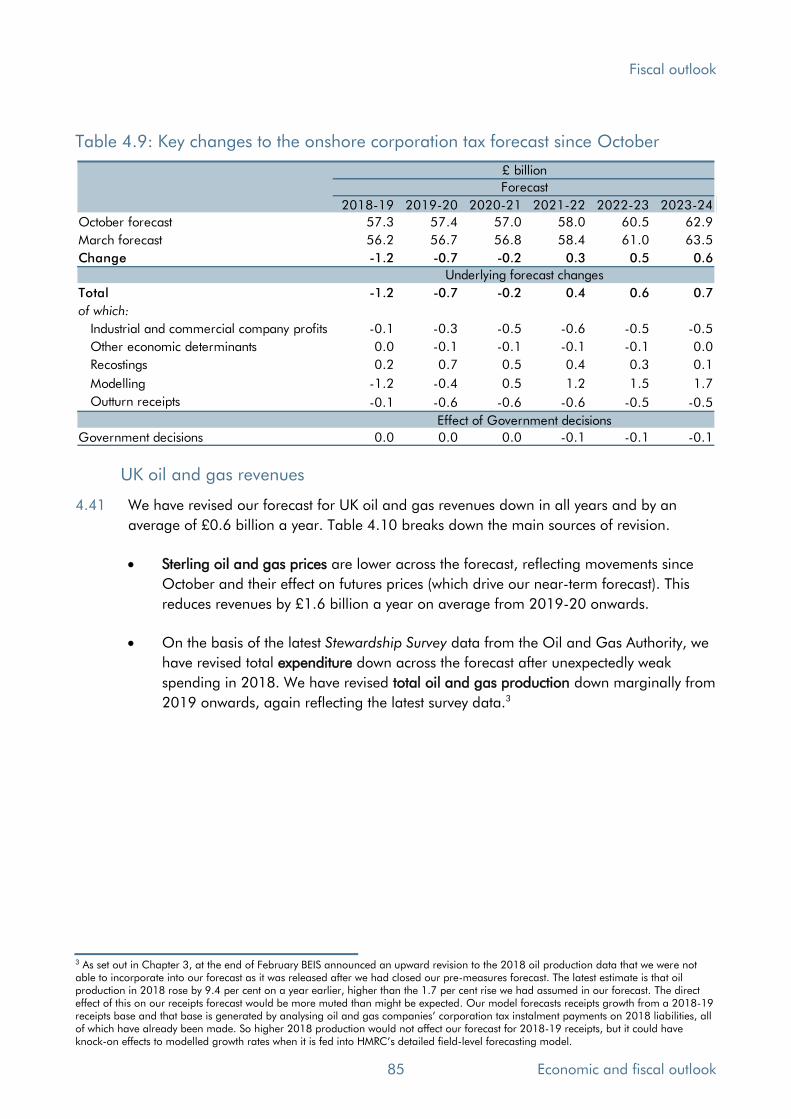
Fiscal outlook
Table 4.9: Key changes to the onshore corporation tax forecast since October
2018-19 2019-20 2020-21 2021-22 2022-23 2023-24
October forecast 57.3 57.4 57.0 58.0 60.5 62.9
March forecast 56.2 56.7 56.8 58.4 61.0 63.5
Change -1.2 -0.7 -0.2 0.3 0.5 0.6
Total -1.2 -0.7 -0.2 0.4 0.6 0.7
of which:
Industrial and commercial company profits -0.1 -0.3 -0.5 -0.6 -0.5 -0.5
Other economic determinants 0.0 -0.1 -0.1 -0.1 -0.1 0.0
Recostings 0.2 0.7 0.5 0.4 0.3 0.1
Modelling -1.2 -0.4 0.5 1.2 1.5 1.7
Outturn receipts -0.1 -0.6 -0.6 -0.6 -0.5 -0.5
Government decisions 0.0 0.0 0.0 -0.1 -0.1 -0.1
Effect of Government decisions
Underlying forecast changes
£ billion
Forecast
UK oil and gas revenues
4.41 We have revised our forecast for UK oil and gas revenues down in all years and by an
average of £0.6 billion a year. Table 4.10 breaks down the main sources of revision.
• Sterling oil and gas prices are lower across the forecast, reflecting movements since
October and their effect on futures prices (which drive our near-term forecast). This
reduces revenues by £1.6 billion a year on average from 2019-20 onwards.
• On the basis of the latest Stewardship Survey data from the Oil and Gas Authority, we
have revised total expenditure down across the forecast after unexpectedly weak
spending in 2018. We have revised total oil and gas production down marginally from
2019 onwards, again reflecting the latest survey data.3
3 As set out in Chapter 3, at the end of February BEIS announced an upward revision to the 2018 oil production data that we were not able to incorporate into our forecast as it was released after we had closed our pre-measures forecast. The latest estimate is that oil production in 2018 rose by 9.4 per cent on a year earlier, higher than the 1.7 per cent rise we had assumed in our forecast. The direct effect of this on our receipts forecast would be more muted than might be expected. Our model forecasts receipts growth from a 2018-19 receipts base and that base is generated by analysing oil and gas companies’ corporation tax instalment payments on 2018 liabilities, all of which have already been made. So higher 2018 production would not affect our forecast for 2018-19 receipts, but it could have knock-on effects to modelled growth rates when it is fed into HMRC’s detailed field-level forecasting model.
85 Economic and fiscal outlook
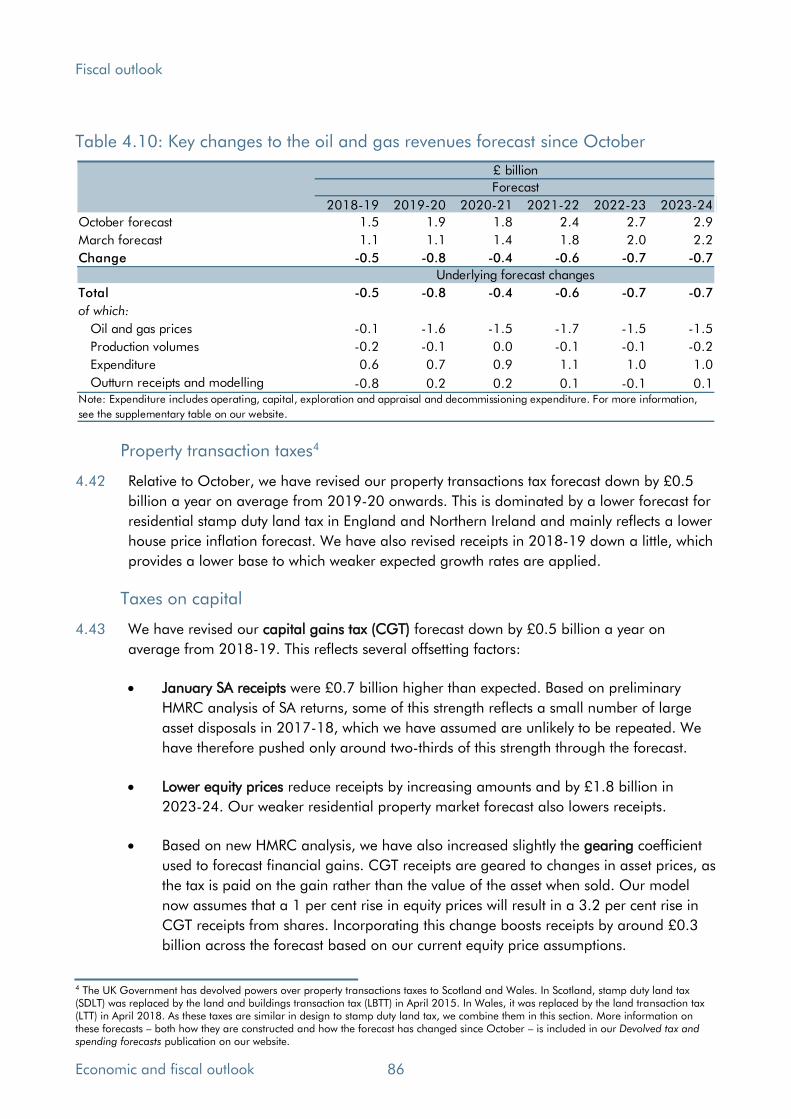
Fiscal outlook
Table 4.10: Key changes to the oil and gas revenues forecast since October
2018-19 2019-20 2020-21 2021-22 2022-23 2023-24
October forecast 1.5 1.9 1.8 2.4 2.7 2.9
March forecast 1.1 1.1 1.4 1.8 2.0 2.2
Change -0.5 -0.8 -0.4 -0.6 -0.7 -0.7
Total -0.5 -0.8 -0.4 -0.6 -0.7 -0.7
of which:
Oil and gas prices -0.1 -1.6 -1.5 -1.7 -1.5 -1.5
Production volumes -0.2 -0.1 0.0 -0.1 -0.1 -0.2
Expenditure 0.6 0.7 0.9 1.1 1.0 1.0
Outturn receipts and modelling -0.8 0.2 0.2 0.1 -0.1 0.1
Underlying forecast changes
Forecast
£ billion
Note: Expenditure includes operating, capital, exploration and appraisal and decommissioning expenditure. For more information,
see the supplementary table on our website.
Property transaction taxes4
4.42 Relative to October, we have revised our property transactions tax forecast down by £0.5
billion a year on average from 2019-20 onwards. This is dominated by a lower forecast for
residential stamp duty land tax in England and Northern Ireland and mainly reflects a lower
house price inflation forecast. We have also revised receipts in 2018-19 down a little, which
provides a lower base to which weaker expected growth rates are applied.
Taxes on capital
4.43 We have revised our capital gains tax (CGT) forecast down by £0.5 billion a year on
average from 2018-19. This reflects several offsetting factors:
• January SA receipts were £0.7 billion higher than expected. Based on preliminary
HMRC analysis of SA returns, some of this strength reflects a small number of large
asset disposals in 2017-18, which we have assumed are unlikely to be repeated. We
have therefore pushed only around two-thirds of this strength through the forecast.
• Lower equity prices reduce receipts by increasing amounts and by £1.8 billion in
2023-24. Our weaker residential property market forecast also lowers receipts.
• Based on new HMRC analysis, we have also increased slightly the gearing coefficient
used to forecast financial gains. CGT receipts are geared to changes in asset prices, as
the tax is paid on the gain rather than the value of the asset when sold. Our model
now assumes that a 1 per cent rise in equity prices will result in a 3.2 per cent rise in
CGT receipts from shares. Incorporating this change boosts receipts by around £0.3
billion across the forecast based on our current equity price assumptions.
4 The UK Government has devolved powers over property transactions taxes to Scotland and Wales. In Scotland, stamp duty land tax (SDLT) was replaced by the land and buildings transaction tax (LBTT) in April 2015. In Wales, it was replaced by the land transaction tax (LTT) in April 2018. As these taxes are similar in design to stamp duty land tax, we combine them in this section. More information on these forecasts – both how they are constructed and how the forecast has changed since October – is included in our Devolved tax and spending forecasts publication on our website.
Economic and fiscal outlook 86
Fiscal outlook
4.44 We have revised inheritance tax receipts down by £0.6 billion a year on average relative to
October. This largely reflects weaker equity and house prices, although receipts in 2018-19
have also come in slightly lower than expected. Since inheritance tax is typically received by
HMRC with a long lag, this is likely to reflect lower liabilities from previous years.
4.45 Having reviewed its initial plans, the Government has altered its proposed schedule of fees
payable for an application for a grant of probate. The new rates come into effect in April
and range between £250 and £6,000, depending on the value of the estate. Given the
structure of the fees, the Treasury expects the ONS to classify them as a tax on capital rather
than a payment for a service (which is treated as negative spending and had been factored
into the Ministry of Justice’s RDEL budget). This will add to receipts and spending equally,
because the new tax is offset by the removal of the negative spending from RDEL.
4.46 The new fee structure is expected to raise around £155 million a year. We have reduced our
inheritance tax forecast by around £5 million a year to reflect the incentive for individuals
with estates worth close to the new probate fee thresholds to reduce the value of their
estates to pay a lower fee. This effect is expected to be small, since the inheritance tax
liability itself already provides a significant incentive to reduce the value of estates.
Excise duties
4.47 Our fuel duties forecast is little changed since October. Receipts have been a little weaker
over the past few months, so we have revised down our 2018-19 estimate by just under
£0.1 billion – we assume that this effect persists. Offsetting that, lower oil prices reduce the
cost of driving, boosting revenues by £0.2 billion a year on average from 2019-20
onwards. Lower RPI inflation lowers the assumed duty path from 2020-21 onwards. As we
note in each forecast, these assumed duty rises have not been implemented for many years.
4.48 Alcohol duties are lower by £0.1 billion a year on average over the forecast period. This is
almost entirely explained by weaker-than-expected wine receipts over recent months. Since
changes to the duty uprating timetable in Autumn Budget 2017, the effect of forestalling
ahead of potential duty rate changes (which are now scheduled to take place in February
rather than April) has been more challenging to predict.
4.49 We have revised tobacco duties down by £0.1 billion a year on average relative to our
October forecast, reflecting weaker clearances in recent months. Monthly receipts have
been more volatile than usual in the past two years, again reflecting the new timetable of
duty uprating announced in Autumn Budget 2017. This generates significant uncertainty
around our forecast, although we expect this volatility to subside once the new uprating
timetable beds in. We have also made some minor changes to the specification of our
forecasting models, which together increase the forecast by £0.1 billion a year.
Business rates
4.50 Business rates are calculated by multiplying the rateable value of non-domestic property by
the ‘multiplier’, which is uprated by inflation, minus any reliefs. Since October, we have
revised our forecast up by an average of £0.4 billion a year. This reflects:
87 Economic and fiscal outlook
Fiscal outlook
• Lower CPI inflation reduces the multiplier later in the forecast, reducing receipts by an
average of £0.1 billion a year from 2021-22 onwards.
• We have incorporated the latest provisional information from local authorities about
expected yield in 2019-20. This suggests local authorities will raise more than
previously expected in future years, adding £0.2 billion a year on average.
• We have also removed an adjustment accounting for local authorities’ historical over-
forecasting of gross rates yield, based on provisional MHCLG analysis that suggests
this has fallen in recent years. This increases receipts by £0.3 billion a year.
Other taxes
4.51 Council tax receipts have been revised up by £0.6 billion a year on average from 2019-20
onwards. This reflects both policy measures and increases in our pre-measures forecast,
discussed in the local authority spending section of this chapter.
4.52 The revisions to our forecast for VAT refunds are uneven across years. Receipts have been
revised up in the near term, reflecting a higher path for government procurement and
investment, but have been revised down in the medium term as the growth in procurement
spending slows. The modest boost to RDEL announced in the Spring Statement generates a
slightly higher path for VAT refunds than would otherwise have been the case.
4.53 Environmental levies include levy-funded spending policies such as the renewables
obligation (RO), contracts for difference (CfD), feed-in tariffs, the capacity market scheme
and the warm home discount. We also include receipts from the ‘CRC energy efficiency scheme’ until its abolition from the 2018-19 compliance year.
4.54 The capacity markets scheme (that focuses on the security of electricity supply) has been
suspended following a European Court of Justice ruling that removed state aid approval of
the scheme. As such, payments cannot be made to those with capacity agreements until
state aid approval has been reinstated. The Government is working with the European
Commission to achieve this and its intention is to honour all outstanding capacity
agreement payments from all auctions held to date. When the scheme will achieve state aid
approval and resume is uncertain, so we have included only the payments made in 2018-
19 prior to the suspension of the scheme. Given the treatment of this scheme in the public
finances, this is neutral for net borrowing with an equal reduction in both tax and spending.
4.55 At the end of December, the European Commission announced that the UK would in effect
be suspended from issuing carbon allowances under the EU emissions trading system (ETS)
(with effect from 1 January 2019). This suspension will be lifted “on the day following the
one on which the ratification instruments concerning the Withdrawal Agreement are
deposited”.5 In response to this, the Government has not auctioned EU ETS allowances so
far in 2019. The Government will auction the 2019 allowances across the remainder of the
5 European Commission, Notice to stakeholders, Withdrawal of the United Kingdom and the EU Emissions Trading System (ETS), 19 December 2018.
Economic and fiscal outlook 88

Fiscal outlook
calendar year, which we have reflected in our forecast as a policy change. The status of the
UK’s membership of the EU ETS post-Brexit remains an area of policy uncertainty. This is
also one area where the Government has described its contingency plans for a ‘no deal’ Brexit, which would see the EU ETS replaced with a ‘carbon emissions tax’.
Other receipts
4.56 Interest and dividend receipts include interest income on the government’s financial assets, among them student loans and bank deposits held by the Debt Management Office and
local authorities. Receipts have been revised up by £0.2 billion in 2018-19, but down by an
average of around £1 billion a year from 2020-21 onwards. Market-derived expectations of
short-term interest rates are between 0.3 and 0.4 percentage points lower than in our
October forecast. This lowers the return on the Government’s bank deposits and the older tranche of student loans. Our lower forecast for RPI inflation between 2018-19 and 2020-
21 also reduces accrued interest on more recently issued student loans.
4.57 Following RBS’s announcement that it would pay a special dividend on its 2018 profits, we have revised up the amount received on the Government’s shareholding to £1.0 billion in 2019-20, up £0.6 billion on our October forecast. Thereafter, our RBS dividend receipts
forecast is little changed. We forecast dividends per share based on market analysts’ expectations, and multiply that by the number of RBS shares owned by the Government,
which falls over time given its policy of selling all its shares by 2023-24.
4.58 Interest and dividend receipts more than double over the forecast, from £7.1 billion in
2017-18 to £14.5 billion in 2023-24. Accrued interest on student loans accounts for
around £5.0 billion of that £7.4 billion rise. This reflects a ‘fiscal illusion’ in how student
loan interest is currently treated in the public finances, since much of it is likely to be written
off rather than ever being received. Annex B looks at the issues around the scoring of
student loans in the National Accounts and changes the ONS has proposed.
4.59 We have revised our public sector gross operating surplus (GOS) forecast up by £0.9 billion
a year on average from 2019-20 onwards. stronger in-year Transport for London (TfL)
revenues and our aligning to TfL’s latest business plan. Partially offsetting this is a lower
forecast for general government depreciation, which is down by £0.3 billion a year on
average from 2018-19 onwards, reflecting lower R&D outturns.
Public sector expenditure
Definitions and approach
4.60 This section explains our forecast for public sector expenditure, which is based on the
National Accounts aggregates for public sector current expenditure (PSCE), public sector
gross investment (PSGI) and total managed expenditure (TME) – the sum of PSCE and PSGI.
In our forecast, we combine these National Accounts aggregates with the two administrative
aggregates used by the Treasury to manage public spending:
89 Economic and fiscal outlook
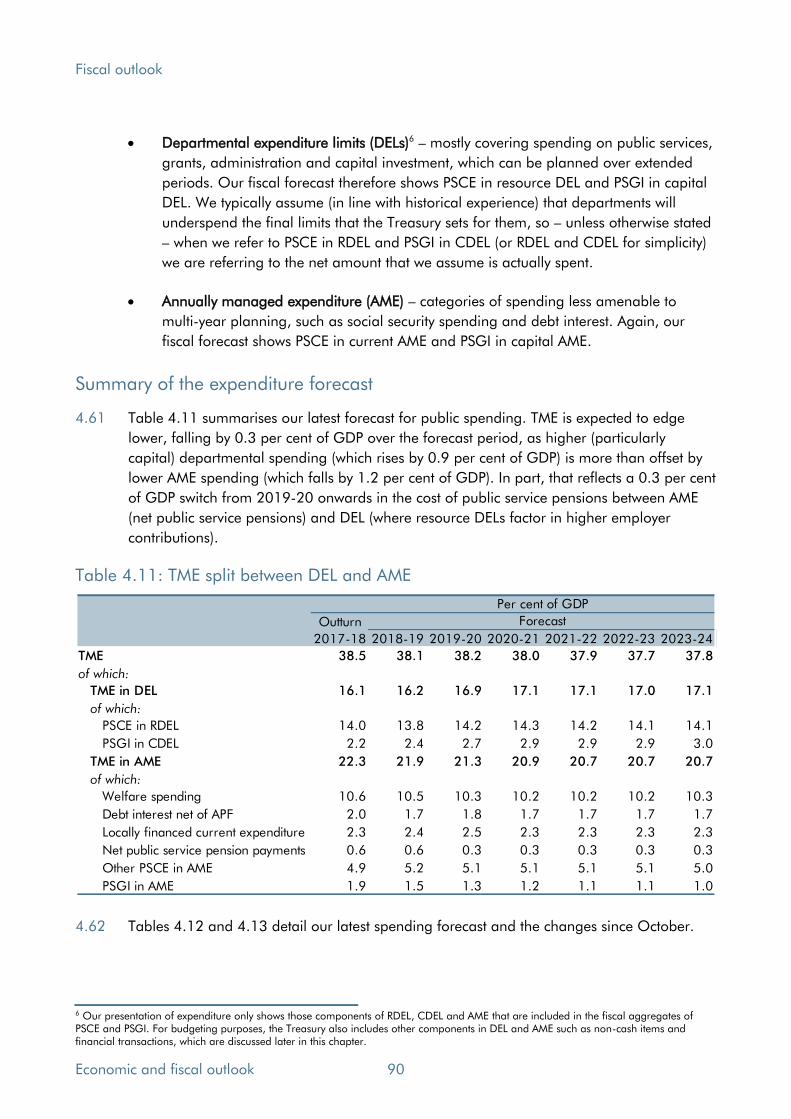
Fiscal outlook
• Departmental expenditure limits (DELs)6 – mostly covering spending on public services,
grants, administration and capital investment, which can be planned over extended
periods. Our fiscal forecast therefore shows PSCE in resource DEL and PSGI in capital
DEL. We typically assume (in line with historical experience) that departments will
underspend the final limits that the Treasury sets for them, so – unless otherwise stated
– when we refer to PSCE in RDEL and PSGI in CDEL (or RDEL and CDEL for simplicity)
we are referring to the net amount that we assume is actually spent.
• Annually managed expenditure (AME) – categories of spending less amenable to
multi-year planning, such as social security spending and debt interest. Again, our
fiscal forecast shows PSCE in current AME and PSGI in capital AME.
Summary of the expenditure forecast
4.61 Table 4.11 summarises our latest forecast for public spending. TME is expected to edge
lower, falling by 0.3 per cent of GDP over the forecast period, as higher (particularly
capital) departmental spending (which rises by 0.9 per cent of GDP) is more than offset by
lower AME spending (which falls by 1.2 per cent of GDP). In part, that reflects a 0.3 per cent
of GDP switch from 2019-20 onwards in the cost of public service pensions between AME
(net public service pensions) and DEL (where resource DELs factor in higher employer
contributions).
Table 4.11: TME split between DEL and AME
Outturn
2017-18 2018-19 2019-20 2020-21 2021-22 2022-23 2023-24
TME 38.5 38.1 38.2 38.0 37.9 37.7 37.8
of which:
TME in DEL 16.1 16.2 16.9 17.1 17.1 17.0 17.1
of which:
PSCE in RDEL 14.0 13.8 14.2 14.3 14.2 14.1 14.1
PSGI in CDEL 2.2 2.4 2.7 2.9 2.9 2.9 3.0
TME in AME 22.3 21.9 21.3 20.9 20.7 20.7 20.7
of which:
Welfare spending 10.6 10.5 10.3 10.2 10.2 10.2 10.3
Debt interest net of APF 2.0 1.7 1.8 1.7 1.7 1.7 1.7
Locally financed current expenditure 2.3 2.4 2.5 2.3 2.3 2.3 2.3
Net public service pension payments 0.6 0.6 0.3 0.3 0.3 0.3 0.3
Other PSCE in AME 4.9 5.2 5.1 5.1 5.1 5.1 5.0
PSGI in AME 1.9 1.5 1.3 1.2 1.1 1.1 1.0
Per cent of GDP
Forecast
4.62 Tables 4.12 and 4.13 detail our latest spending forecast and the changes since October.
6 Our presentation of expenditure only shows those components of RDEL, CDEL and AME that are included in the fiscal aggregates of PSCE and PSGI. For budgeting purposes, the Treasury also includes other components in DEL and AME such as non-cash items and financial transactions, which are discussed later in this chapter.
Economic and fiscal outlook 90

Fiscal outlook
Table 4.12: Total managed expenditure
Outturn2017-18 2018-19 2019-20 2020-21 2021-22 2022-23 2023-24
Public sector current expenditure (PSCE)
PSCE in RDEL 288.6 294.1 312.2 324.6 334.3 344.6 356.8
PSCE in AME 422.5 434.2 440.4 447.6 462.9 479.3 496.9
of which:
Welfare spending 218.8 223.0 227.3 232.2 240.0 249.5 260.5
of which:
Inside welfare cap 118.2 119.3 121.4 123.2 126.0 129.5 133.7
Outside welfare cap 100.6 103.7 105.9 109.0 114.1 120.0 126.8
Locally financed current expenditure 48.6 51.8 54.2 53.1 55.1 56.9 58.6
Central government debt interest, net of APF1 41.5 37.0 40.2 38.9 40.3 41.5 42.3
Scottish Government's current expenditure 26.5 27.6 28.0 29.7 30.7 31.8 33.0
Expenditure transfers to EU institutions2 9.5 12.2 12.7 10.5 10.4 7.7 4.1
Assumed spending in lieu of EU transfers2 - - - 3.0 3.0 5.6 9.3
Net public service pension payments 11.8 12.6 6.7 6.4 7.3 7.9 8.2
Company and other tax credits 3.6 5.1 5.1 5.1 5.3 5.4 5.6
BBC current expenditure 3.7 3.9 3.8 3.8 3.7 3.8 3.9
National lottery current grants 1.2 1.3 1.3 1.2 1.2 1.2 1.2
General government imputed pensions 1.3 1.3 1.3 1.3 1.3 1.3 1.3
Public corporations' debt interest 2.6 0.5 0.4 0.4 0.5 0.5 0.5
Network Rail other current expenditure3 1.1 0.7 - - - - -
General government depreciation 30.5 31.0 32.0 33.4 34.8 36.3 37.8
Current VAT refunds 15.2 16.0 16.2 16.9 17.3 17.8 18.4
Environmental levies 6.8 9.9 10.6 11.6 12.3 12.7 13.1
Other PSCE items in departmental AME 1.5 1.0 0.8 0.7 0.8 0.8 0.8
Other National Accounts adjustments -1.9 -0.7 -0.5 -0.7 -1.0 -1.3 -1.7
Total public sector current expenditure 711.2 728.4 752.6 772.1 797.2 824.0 853.7
Public sector gross investment (PSGI)
PSGI in CDEL 44.8 51.2 60.3 65.5 68.8 71.2 75.4
PSGI in AME 39.0 32.3 27.8 27.5 25.7 25.8 25.8
of which:
Locally financed capital expenditure 13.6 14.1 12.3 10.1 9.8 9.6 8.9
Public corporations' capital expenditure 15.8 9.6 9.6 9.7 9.5 9.5 9.8
Network Rail capital expenditure 6.7 5.3 - - - - -
Scottish Government's capital expenditure 3.0 3.4 4.2 4.5 5.0 5.1 5.2
Tax litigation 0.0 0.0 1.3 2.4 0.4 0.4 0.4
Other PSGI items in departmental AME 0.8 0.8 0.9 1.3 1.4 1.5 1.5
Other National Accounts adjustments -0.8 -1.0 -0.5 -0.4 -0.4 -0.2 0.1
Total public sector gross investment 83.9 83.5 88.1 93.0 94.5 97.0 101.2
Less public sector depreciation -41.1 -40.2 -41.1 -42.6 -44.2 -45.8 -47.5
Public sector net investment 42.8 43.2 47.0 50.5 50.3 51.2 53.8
Total managed expenditure 795.0 811.8 840.7 865.2 891.7 921.0 954.9
2 From 2019-20 onwards, the expenditure transfers to EU institutions reflect the estimated cost of the financial settlement that the UK
will pay the EU after Brexit. For further detail, see Table 4.20.
Forecast
£ billion
3 Other than debt interest and depreciation, which are included in totals shown separately in this table.
1 Includes reductions in debt interest payments due to the APF. For further detail, see Table 4.26.
91 Economic and fiscal outlook

Fiscal outlook
Table 4.13: Changes to total managed expenditure since October
Outturn2017-18 2018-19 2019-20 2020-21 2021-22 2022-23 2023-24
Public sector current expenditure (PSCE)
PSCE in RDEL 0.0 -1.5 0.6 1.4 1.4 1.6 2.1
PSCE in AME -0.4 -1.7 0.1 -2.9 -2.4 -2.0 -1.5
of which:
Welfare spending 0.0 0.0 -0.1 0.6 0.9 1.3 2.1
of which:
Inside welfare cap 0.0 -0.3 -0.3 -0.4 -0.1 0.2 1.0
Outside welfare cap 0.0 0.3 0.2 1.0 1.0 1.1 1.1
Locally financed current expenditure -0.1 0.8 3.6 1.3 1.3 1.4 1.6
Central government debt interest, net of APF1 0.0 -2.8 -1.9 -4.1 -4.1 -4.2 -4.5
Scottish Government's current expenditure 0.0 0.0 -0.1 0.4 0.5 0.7 0.8
Expenditure transfers to EU institutions2 0.0 0.5 -0.8 0.0 -0.4 -0.2 -0.1
Assumed spending in lieu of EU transfers2 - - - 0.0 0.2 0.0 -0.1
Net public service pension payments 0.0 0.0 0.0 -0.3 -0.4 -0.9 -1.0
Company and other tax credits 0.0 0.5 0.6 0.5 0.5 0.6 0.6
BBC current expenditure 0.0 0.0 0.0 0.0 0.0 -0.1 -0.1
National lottery current grants 0.0 0.0 0.0 0.0 0.0 0.0 0.0
General government imputed pensions 0.0 0.0 0.0 0.0 0.0 0.0 0.0
Public corporations' debt interest 0.0 0.0 0.0 0.0 0.0 0.0 0.0
Network Rail other current expenditure3 0.0 -0.1 - - - - -
General government depreciation 0.0 -0.1 -0.2 -0.3 -0.3 -0.3 -0.2
Current VAT refunds 0.0 0.3 0.0 -0.1 -0.1 -0.2 -0.1
Environmental levies 0.0 -0.6 -1.1 -1.3 -1.0 -0.9 -1.1
Other PSCE items in departmental AME 0.0 0.1 0.0 0.0 0.0 0.0 0.0
Other National Accounts adjustments -0.3 -0.2 0.1 0.5 0.4 0.7 0.6
Total public sector current expenditure -0.4 -3.1 0.7 -1.5 -1.0 -0.4 0.7
Public sector gross investment (PSGI)
PSGI in CDEL 0.5 1.0 -1.3 0.0 -0.6 0.1 -0.4
PSGI in AME 1.1 1.2 -0.3 -0.4 -0.1 -0.3 -0.5
of which:
Locally financed capital expenditure 1.2 2.6 0.7 0.1 0.2 -0.1 -0.9
Public corporations' capital expenditure -1.4 -1.3 -1.2 -0.6 -0.7 -1.1 -1.0
Network Rail capital expenditure 0.0 0.1 - - - - -
Scottish Government's capital expenditure 0.0 0.0 0.0 0.0 0.6 0.7 0.9
Tax litigation 0.0 0.0 0.0 0.0 0.0 0.0 0.0
Other PSGI items in departmental AME 0.0 0.1 -0.1 -0.1 -0.2 -0.1 -0.2
Other National Accounts adjustments 1.3 -0.3 0.3 0.2 0.0 0.4 0.6
Total public sector gross investment 1.6 2.2 -1.6 -0.4 -0.7 -0.2 -1.0
Less public sector depreciation 0.0 -0.2 0.2 0.3 0.3 0.2 0.2
Public sector net investment 1.6 2.0 -1.3 -0.1 -0.4 0.0 -0.7
Total managed expenditure 1.2 -0.9 -0.9 -1.9 -1.7 -0.7 -0.3
Forecast
£ billion
1 Includes reductions in debt interest payments due to the APF. For further detail, see Table 4.26.2 From 2019-20 onwards, the expenditure transfers to EU institutions reflect the estimated cost of the financial settlement that the UK
will pay the EU after Brexit. For further detail, see Table 4.20.3 Other than debt interest and depreciation, which are included in totals shown separately in this table.
Economic and fiscal outlook 92

Fiscal outlook
4.63 Table 4.14 summarises the sources of changes to our forecast since October:
• Economy forecast changes have a mixed impact. Lower RPI inflation reduces debt
interest payments in 2018-19 by £2.8 billion. From 2019-20 onwards the net
(downward) effects are more modest, averaging £0.4 billion, reflecting temporarily
higher unemployment, and a more persistent downward revision to inflation and
upward one to earnings.
• Market-derived interest rate assumptions cut spending by increasing amounts through
the forecast, reaching £4.1 billion by 2023-24.
• DEL forecast changes reduce spending in 2018-19 and 2019-20 reflecting greater
expected underspends against RDEL budgets.
• Upward revisions to welfare spending forecast rise steadily to reach £1.5 billion in
2023-24, primarily driven by higher spending on disability benefits.
• Expenditure transfers to the EU are up in 2018-19 and down in 2019-20. This largely
reflects £0.4 billion of spending in calendar year 2019 shifting from 2019-20 into
2018-19. The 2019-20 surcharge is £0.3 billion lower than we assumed in October.
• Local authority self-financed current spending is higher by an average of £1.3 billion a
year. Abstracting from a spending-neutral current-to-capital switch, the rise mainly
reflects higher forecasts for council tax and retained business rates. The jump in 2019-
20 is due to a £1.2 billion increase in our forecast of authorities’ use of reserves.
• Locally financed capital expenditure and public corporations’ capital expenditure is down by an average of £0.5 billion a year, although the profile of revisions is uneven.
Abstracting from the current-to-capital switch, this reflects the latest in-year data, the
implications of the latest 2017-18 outturns and TfL’s latest business plan.
• The main Government decisions affecting this forecast include higher departmental
current and capital spending (RDEL and CDEL respectively). The Government has
added amounts rising to £1.7 billion a year by the end of the forecast. Other spending
measures relate to the Treasury’s Scottish block grant assumptions, welfare spending
measures and higher council tax boosting local authority spending. These add £1.1
billion a year on average from 2019-20 onwards.
93 Economic and fiscal outlook
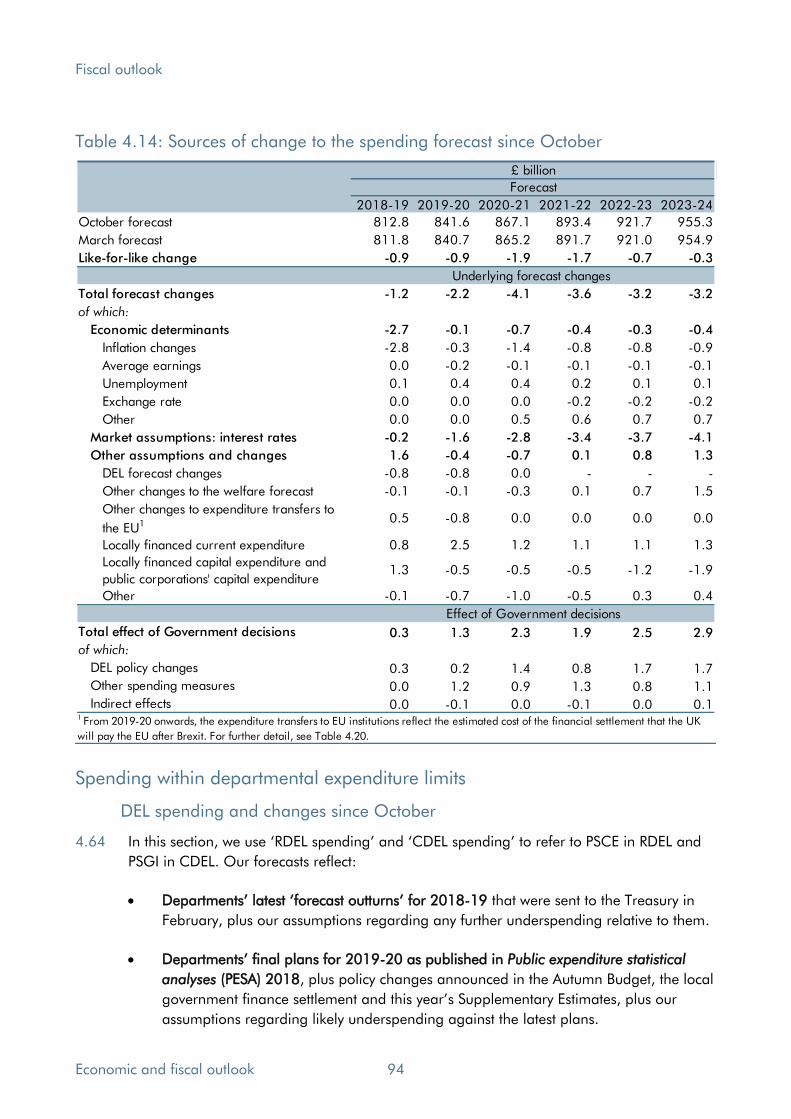
Fiscal outlook
Table 4.14: Sources of change to the spending forecast since October
2018-19 2019-20 2020-21 2021-22 2022-23 2023-24
October forecast 812.8 841.6 867.1 893.4 921.7 955.3
March forecast 811.8 840.7 865.2 891.7 921.0 954.9
Like-for-like change -0.9 -0.9 -1.9 -1.7 -0.7 -0.3
Total forecast changes -1.2 -2.2 -4.1 -3.6 -3.2 -3.2
of which:
Economic determinants -2.7 -0.1 -0.7 -0.4 -0.3 -0.4
Inflation changes -2.8 -0.3 -1.4 -0.8 -0.8 -0.9
Average earnings 0.0 -0.2 -0.1 -0.1 -0.1 -0.1
Unemployment 0.1 0.4 0.4 0.2 0.1 0.1
Exchange rate 0.0 0.0 0.0 -0.2 -0.2 -0.2
Other 0.0 0.0 0.5 0.6 0.7 0.7
Market assumptions: interest rates -0.2 -1.6 -2.8 -3.4 -3.7 -4.1
Other assumptions and changes 1.6 -0.4 -0.7 0.1 0.8 1.3
DEL forecast changes -0.8 -0.8 0.0 - - -
Other changes to the welfare forecast -0.1 -0.1 -0.3 0.1 0.7 1.5
Other changes to expenditure transfers to
the EU1 0.5 -0.8 0.0 0.0 0.0 0.0
Locally financed current expenditure 0.8 2.5 1.2 1.1 1.1 1.3
Locally financed capital expenditure and
public corporations' capital expenditure1.3 -0.5 -0.5 -0.5 -1.2 -1.9
Other -0.1 -0.7 -1.0 -0.5 0.3 0.4
Total effect of Government decisions 0.3 1.3 2.3 1.9 2.5 2.9
of which:
DEL policy changes 0.3 0.2 1.4 0.8 1.7 1.7
Other spending measures 0.0 1.2 0.9 1.3 0.8 1.1
Indirect effects 0.0 -0.1 0.0 -0.1 0.0 0.11 From 2019-20 onwards, the expenditure transfers to EU institutions reflect the estimated cost of the financial settlement that the UK
will pay the EU after Brexit. For further detail, see Table 4.20.
Forecast
£ billion
Effect of Government decisions
Underlying forecast changes
Spending within departmental expenditure limits
DEL spending and changes since October
4.64 In this section, we use ‘RDEL spending’ and ‘CDEL spending’ to refer to PSCE in RDEL and PSGI in CDEL. Our forecasts reflect:
• Departments’ latest ‘forecast outturns’ for 2018-19 that were sent to the Treasury in
February, plus our assumptions regarding any further underspending relative to them.
• Departments’ final plans for 2019-20 as published in Public expenditure statistical
analyses (PESA) 2018, plus policy changes announced in the Autumn Budget, the local
government finance settlement and this year’s Supplementary Estimates, plus our
assumptions regarding likely underspending against the latest plans.
Economic and fiscal outlook 94

Fiscal outlook
• The Government’s latest provisional total DELs for 2020-21 to 2023-24, in which it
has raised RDEL and lowered CDEL relative to the Budget totals. The departmental
allocation of these DELs will not be finalised until the 2019 Spending Review, with
some exceptions, notably the increased NHS England RDEL budget up to 2023-24 that
was set out by the Prime Minister last summer and was raised again in January.7
4.65 Table 4.15 shows our forecasts for resource (RDEL) and capital (CDEL) spending and overall
changes relative to our October forecast. It shows that:
• Actual resource spending has been revised up in each year from 2019-20 onwards, by
rising amounts, with extra spending reaching £2.1 billion in 2023-24.
• Actual capital spending has been revised down by £0.4 billion a year on average over
the same period, but with an uneven profile of revisions across years, primarily
reflecting offsetting changes in the Scottish Government spending profile.
4.66 In Table 4.15 we present plans, expected underspends and actual spending in every year.
For years covered by the Spending Review, plans have been set by the Treasury and our
forecasts for actual spending are generated by subtracting expected underspends. For
subsequent years, we ask the Government to set out its policy on actual RDEL and CDEL
spending and show the implied plans and underspends that we think would be consistent
with that (the shaded years in the table). The next Spending Review is due in 2019.
4.67 Table 4.15 also shows the changes in our forecasts for actual spending since October,
broken down into our underlying forecast judgements and the consequences of Government
policy decisions. Our only underlying forecast changes relate to RDEL underspending in
2018-19 and 2019-20, which we have revised up by £0.8 billion in each year. This reflects
the latest departmental forecasts for this year and the surprisingly large RDEL underspend in
2017-18, relative to the PESA plans for that year.
4.68 As regards policy decisions, the Chancellor has increased RDEL plans since October, on top
of the large increases announced then. There are two parts to the latest increase:
• The first raises non-NHS RDEL spending in cash terms sufficiently to hold spending flat
in real terms relative to our latest GDP deflator forecast and from a 2019-20 base that
reflects our latest underspend assumptions. This adds £0.5 billion a year on average
from 2019-20 onwards, rising to £0.8 billion in 2023-24.
• The second reflects further additional funding for the NHS to maintain the real terms
rise agreed between the Government and the NHS in June 2018 given our October
GDP deflator forecast. (In part, we revised our deflator forecast up due to the expected
effect of higher health spending on whole economy inflation) This addition rises to
£0.8 billion in 2023-24. The Treasury has told us that this now confirms the final RDEL
7 See ‘Prime Minister sets out 5-year NHS funding plan’, 18 June 2018, on the original boost to NHS funding, and ‘Secretary of State’s oral statement on the NHS long-term plan’, 7 January 2019, on the further boost relative to the figures set out by the Prime Minister.
95 Economic and fiscal outlook

Fiscal outlook
(excluding depreciation) cash settlement for the NHS until 2023-24, although
experience suggests that further top-ups remain a policy risk. The Department for
Health and Social Care has also been allowed to switch £0.5 billion from CDEL to
RDEL in 2018-19 – the third successive year that such a switch has been approved.
We have not adjusted our underspend assumptions further for these policy decisions.
Table 4.15: RDEL and CDEL spending and changes since October
2018-19 2019-20 2020-21 2021-22 2022-23 2023-24
PSCE in RDEL
October forecast
Limits1 297.8 313.2 324.8 334.5 344.7 356.3
Assumed underspend -2.2 -1.7 -1.7 -1.7 -1.7 -1.7
Actual spending 295.6 311.5 323.2 332.9 343.1 354.7
March forecast
Limits1 297.1 314.7 327.1 336.8 347.1 359.3
Assumed underspend -3.0 -2.5 -2.5 -2.5 -2.5 -2.5
Actual spending 294.1 312.2 324.6 334.3 344.6 356.8
Changes in actual spending -1.5 0.6 1.4 1.4 1.6 2.1
of which:
Underspend forecast changes -0.8 -0.8 - - - -
Effect of UK Government decisions -0.6 1.5 1.4 1.4 1.6 2.1
PSGI in CDEL
October forecast
Limits1 52.4 64.3 68.0 73.4 75.1 79.8
Assumed underspend -2.2 -2.7 -2.5 -4.0 -4.0 -4.0
Actual spending 50.2 61.6 65.5 69.4 71.1 75.8
March forecast
Limits1 53.4 63.0 68.0 72.8 75.2 79.4
Assumed underspend -2.2 -2.7 -2.5 -4.0 -4.0 -4.0
Actual spending 51.2 60.3 65.5 68.8 71.2 75.4
Changes in actual spending 1.0 -1.3 0.0 -0.6 0.1 -0.4
of which:
Underspend forecast changes 0.0 0.0 0.0 - - -
Effect of UK Government decisions 1.0 -1.3 0.0 -0.6 0.1 -0.4
PSCE in RDEL (actual spending)
October forecast 13.9 14.2 14.2 14.2 14.1 14.1
March forecast 13.8 14.2 14.3 14.2 14.1 14.1
Change -0.1 0.0 0.0 0.0 0.0 0.0
PSGI in CDEL (actual spending)
October forecast 2.4 2.8 2.9 3.0 2.9 3.0
March forecast 2.4 2.7 2.9 2.9 2.9 3.0
Change 0.0 -0.1 0.0 0.0 0.0 0.0
Per cent of GDP
£ billion
Forecast
Implied, post-Spending Review
Implied, post-Spending Review
1 In the years covered by the Spending Review, limits reflect the Departmental spending allocations agreed with HM Treasury at the
latest Spending Review, adjusted for policy changes and classification changes since. In years beyond the Spending Review this
reflects the implied limits consistent with what HM Treasury intends to spend and our view on underspends.
Economic and fiscal outlook 96
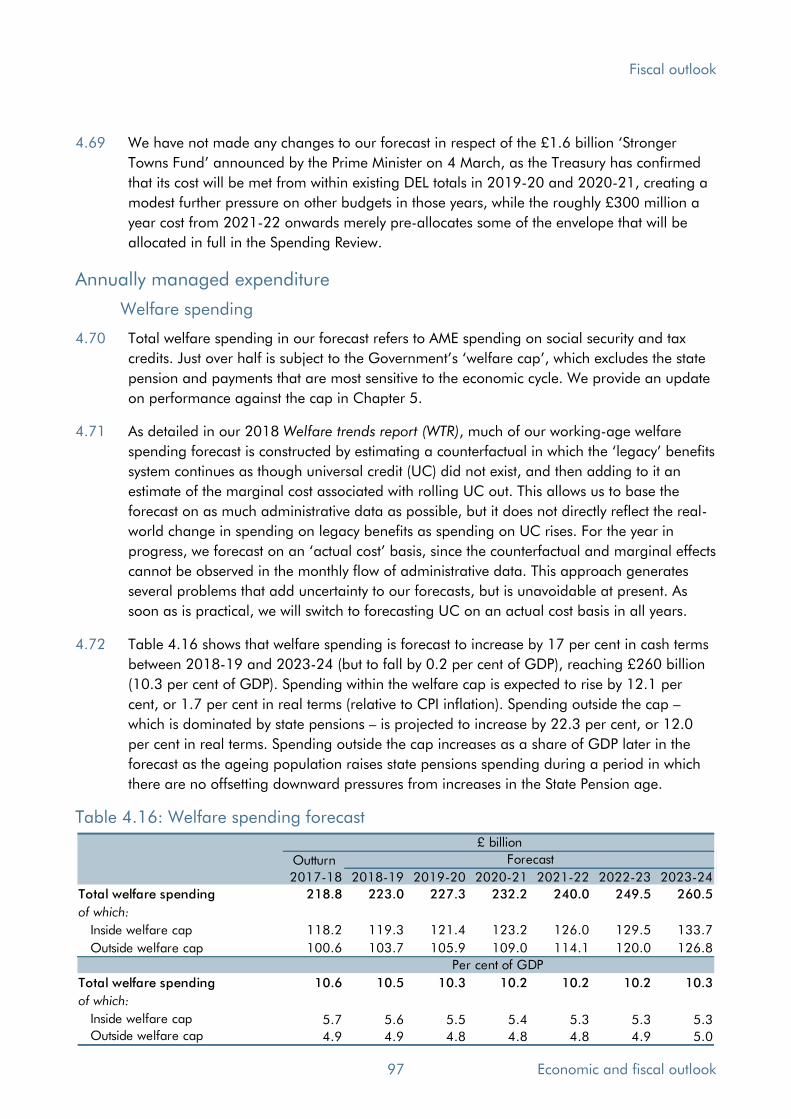
Fiscal outlook
4.69 We have not made any changes to our forecast in respect of the £1.6 billion ‘Stronger Towns Fund’ announced by the Prime Minister on 4 March, as the Treasury has confirmed
that its cost will be met from within existing DEL totals in 2019-20 and 2020-21, creating a
modest further pressure on other budgets in those years, while the roughly £300 million a
year cost from 2021-22 onwards merely pre-allocates some of the envelope that will be
allocated in full in the Spending Review.
Annually managed expenditure
Welfare spending
4.70 Total welfare spending in our forecast refers to AME spending on social security and tax
credits. Just over half is subject to the Government’s ‘welfare cap’, which excludes the state pension and payments that are most sensitive to the economic cycle. We provide an update
on performance against the cap in Chapter 5.
4.71 As detailed in our 2018 Welfare trends report (WTR), much of our working-age welfare
spending forecast is constructed by estimating a counterfactual in which the ‘legacy’ benefits system continues as though universal credit (UC) did not exist, and then adding to it an
estimate of the marginal cost associated with rolling UC out. This allows us to base the
forecast on as much administrative data as possible, but it does not directly reflect the real-
world change in spending on legacy benefits as spending on UC rises. For the year in
progress, we forecast on an ‘actual cost’ basis, since the counterfactual and marginal effects
cannot be observed in the monthly flow of administrative data. This approach generates
several problems that add uncertainty to our forecasts, but is unavoidable at present. As
soon as is practical, we will switch to forecasting UC on an actual cost basis in all years.
4.72 Table 4.16 shows that welfare spending is forecast to increase by 17 per cent in cash terms
between 2018-19 and 2023-24 (but to fall by 0.2 per cent of GDP), reaching £260 billion
(10.3 per cent of GDP). Spending within the welfare cap is expected to rise by 12.1 per
cent, or 1.7 per cent in real terms (relative to CPI inflation). Spending outside the cap – which is dominated by state pensions – is projected to increase by 22.3 per cent, or 12.0
per cent in real terms. Spending outside the cap increases as a share of GDP later in the
forecast as the ageing population raises state pensions spending during a period in which
there are no offsetting downward pressures from increases in the State Pension age.
Table 4.16: Welfare spending forecast
Outturn
2017-18 2018-19 2019-20 2020-21 2021-22 2022-23 2023-24
Total welfare spending 218.8 223.0 227.3 232.2 240.0 249.5 260.5
of which:
Inside welfare cap 118.2 119.3 121.4 123.2 126.0 129.5 133.7
Outside welfare cap 100.6 103.7 105.9 109.0 114.1 120.0 126.8
Total welfare spending 10.6 10.5 10.3 10.2 10.2 10.2 10.3
of which:
Inside welfare cap 5.7 5.6 5.5 5.4 5.3 5.3 5.3Outside welfare cap 4.9 4.9 4.8 4.8 4.8 4.9 5.0
£ billion
Forecast
Per cent of GDP
97 Economic and fiscal outlook

Fiscal outlook
4.73 Table 4.17 sets out our detailed welfare spending forecasts and Table 4.18 sets out the
changes since October. We have revised total spending up from 2020-21 onwards by
progressively larger amounts, with spending subject to the cap revised down in most years,
but spending outside the cap revised up in all years by more.
4.74 Our revised economy forecast has increased welfare spending modestly, with largely
offsetting effects on spending inside and outside the cap. The combination of lower CPI
inflation and higher average earnings growth lowers spending on child and working-age
items due to lower uprating and reduced eligibility for means-tested benefits. But higher
average earnings growth boosts state pensions spending via triple lock uprating, while
higher near-term unemployment raises the cost of jobseeker’s allowance and associated housing benefit caseloads in the legacy counterfactual forecast (and UC in the real world).
4.75 The largest revisions since October relate to disability benefits, where spending has been
revised up by progressively larger amounts (reaching £1.7 billion in 2023-24), due to policy
changes and revised caseload assumptions. The latter include both higher inflows and lower
outflows, while policy changes relate to the Government’s decision to slow the managed migration of remaining working-age disability living allowance cases to personal
independence payment – a process it calls ‘full PIP rollout’ (FPR). Despite this delay, it has had to reduce the number of other PIP award reviews carried out to complete FPR.
4.76 Our October forecast assumed FPR would complete in early 2020. In December 2018,
DWP announced that the rollout would be pushed back to enable more resources to be
diverted to the identification and payment of arrears arising from legal rulings.8 It has since
informed us that it also faces longer-term capacity constraints in simultaneously delivering
FPR, scheduled award reviews and the processing of new claims. DWP has confirmed that
December’s announcement prioritises completion of FPR over processing scheduled award
reviews for some claimants. The Secretary of State subsequently announced that reviews
would cease for all claimants above the State Pension age, unless they request one.9
4.77 DWP now expects FPR to be completed in October 2020. But given the repeated delays and
evidence of pressure on operational capacity in DWP and its providers, we have assumed
that the process will not be completed until February 2021. The FPR process itself has
relatively small effects on spending – some DLA claimants do not receive a PIP award after
an FPR assessment, but those that do tend to receive a higher amount on PIP than on DLA.
So delaying FPR generates a relatively modest short-term saving relative to our October
assumptions. More significantly, the large number of existing awards that will not be
reviewed in order to make space for completing FPR are expected to raise spending.
4.78 At the time of closing our forecast, we still had queries about the analysis and modelling
that underpinned the estimates of both elements of this policy change. We would therefore
stress the significant uncertainty around these estimates – they will need to be revisited to
resolve our outstanding questions. Taken together, these changes are estimated to save
£0.1 billion in 2019-20, but to cost £0.2 billion a year on average from 2020-21 onwards.
8 See House of Commons written statement HCWS1224, ‘Personal Independence Payment’, DWP, 20 December 2018. 9 See House of Commons written statement HCWS1376, ‘Health and Disability Announcement’, Department for Work and Pensions, 5 March 2019. Claimants still have the right to seek a review, but DWP will not initiate one.
Economic and fiscal outlook 98
Fiscal outlook
4.79 The Secretary of State for Work and Pensions has also announced several other changes to
the delivery of PIP assessments from 2021. This includes testing the integration of the
services providing PIP and ESA/UC work capability assessments, and the feasibility of
combining the two into a single assessment. To enable this, DWP will develop a new digital
platform. This announcement lacks sufficient detail for us to consider any possible effects for
this forecast, but if they were implemented such changes could represent a risk to our
forecast. It is likely that combining the two assessment services – and the assessments
themselves – would increase take-up of both benefits as more people become aware that
they may be entitled to both rather than one. In practice this would depend on delivery of
the underlying digital platform. Past experience demonstrates that this sort of IT project often
suffers delays and teething difficulties that can have unintended consequences for spending.
4.80 UC-related changes are described in the next section. The other main changes relate to:
• Tax credits. Spending has been revised up marginally in 2018-19 but down by £0.4
billion on average from 2019-20 onwards. Fewer tax credits claimants have migrated
to UC in 2018-19 than we assumed in October and the claimants that have migrated
over also appear to have had lower tax credits awards. Altogether, this has resulted in
higher tax credits spending. Despite this, it appears that our October assumption for
counterfactual tax credits spending – the cost of tax credits were UC not to exist – was
too high, with lower-than-expected caseloads one driver of this. We have therefore
revised spending down over the remaining years of the forecast. As this revision relates
to something that cannot be observed directly, it is particularly uncertain.
• Incapacity benefits. Spending has been revised up by £0.4 billion in 2019-20. This
principally relates to data and modelling updates, while the remainder concerns our
assumptions on the payment of arrears and higher awards to claimants migrated from
incapacity benefit to employment and support allowance. Fewer payments are now
assumed to take place in 2018-19 and more in 2019-20. Spending in 2019-20 is
also boosted by the extension of the underpayments exercise to cover further cases
migrated from previous incapacity benefits to ESA from 2015 onwards.10 But the
average amounts paid out have been lower than expected, which more than offsets
these caseload and timing effects, leaving the cost of overall arrears and higher award
payments around £0.2 billion lower in total across the forecast at £1.5 billion.
10 For an update on the latest status of the underpayment exercise, see ‘February 2019: ESA underpayments: forecast numbers affected, forecast expenditure and progress on checking’, DWP (2019).
99 Economic and fiscal outlook

Fiscal outlook
Table 4.17: Welfare spending
Outturn
2017-18 2018-19 2019-20 2020-21 2021-22 2022-23 2023-24
Welfare cap
DWP social security 77.5 80.9 81.0 82.0 84.1 86.9 90.3of which:
Housing benefit (not on JSA)1 20.3 19.1 20.7 20.9 21.5 22.1 22.8Disability living allowance and personal
independence payment17.5 18.8 20.5 21.3 22.4 23.6 25.0
Incapacity benefits2 15.0 15.0 16.0 15.6 15.7 15.7 15.9
Attendance allowance 5.5 5.7 5.9 6.1 6.3 6.5 6.8
Pension credit 5.4 5.1 4.9 4.8 4.6 4.5 4.5
Carer's allowance3 2.8 2.9 3.0 3.2 3.4 3.7 4.0
Statutory maternity pay 2.5 2.6 2.6 2.7 2.8 2.9 3.0
Income support (non-incapacity) 2.2 1.9 2.2 2.2 2.2 2.3 2.3
Winter fuel payments 2.0 2.0 2.0 1.9 2.0 2.0 2.0
Universal credit4 1.9 5.8 0.9 1.0 1.0 1.2 1.6
Other DWP in welfare cap 2.3 2.2 2.3 2.3 2.3 2.3 2.3
Personal tax credits 25.9 22.8 24.8 24.8 24.9 25.1 25.3
Child benefit 11.6 11.6 11.6 11.9 12.1 12.4 12.7
Tax free childcare 0.0 0.1 0.3 0.4 0.6 0.8 1.0
NI social security in welfare cap 3.5 3.8 3.7 3.8 3.9 4.0 4.1
Paternity and parental pay 0.1 0.1 0.1 0.1 0.1 0.1 0.1
Effects of Government decisions 0.0 0.0 -0.1 0.2 0.3 0.1 0.3
Total welfare inside the welfare cap5 118.2 119.3 121.4 123.2 126.0 129.5 133.7
Welfare spending outside the welfare cap
DWP social security 98.2 101.2 103.3 106.3 111.2 116.9 123.5
of which:
State pension 93.8 96.7 98.9 101.5 106.3 111.9 118.4
Jobseeker's allowance 1.7 1.3 2.4 2.5 2.6 2.6 2.7
Housing benefit (on JSA) 1.4 1.1 2.1 2.2 2.3 2.4 2.5
Universal credit4 1.3 2.2
NI social security outside welfare cap 2.4 2.4 2.6 2.7 2.8 3.0 3.2
Effects of Government decisions 0.0 0.0 0.0 0.1 0.1 0.1 0.1
Total welfare outside the welfare cap5 100.6 103.7 105.9 109.0 114.1 120.0 126.8
Total welfare5 218.8 223.0 227.3 232.2 240.0 249.5 260.5
Memo: spending inside the welfare cap as a
proportion of total welfare spending54.0 53.5 53.4 53.1 52.5 51.9 51.3
Forecast
£ billion
1 Housing benefit (not on jobseeker's allowance) is made up of a number of claimant groups. The main claimant groups are
pensioners, those on incapacity benefits, lone parents, and housing benefit only claimants.2 Incapacity benefits includes incapacity benefit, employment and support allowance, severe disablement allowance and income
support (incapacity part).
4 Universal credit actual spending for 2017-18 and 2018-19. Spending from 2019-20 onwards represents universal credit additional
costs not already included against other benefits (i.e. UC payments that do not exist under current benefit structure).5 Total welfare outturn inside and outside of the welfare cap in 2017-18 is sourced from OSCAR, consistent with PESA 2018. For 2017-
18 only, the components reflect departments’ own outturns, which may not be on a consistent basis to OSCAR. For this year the
components may not sum to the total for this reason.
3 Carer's allowance for England and Wales only from September 2018. The UK Government devolved Scottish carer's allowance (CA)
to the Scottish government from this date onwards. Spending on CA in Scotland is included under ‘Scottish Government AME’.
Economic and fiscal outlook 100

Fiscal outlook
Table 4.18: Sources of change to welfare spending since October
Outturn
2017-18 2018-19 2019-20 2020-21 2021-22 2022-23 2023-24
Total welfare spending
October forecast 218.8 223.0 227.4 231.6 239.1 248.2 258.4
March forecast 218.8 223.0 227.3 232.2 240.0 249.5 260.5
Change 0.0 0.0 -0.1 0.6 0.9 1.3 2.1
Welfare spending inside the welfare cap
October forecast 118.2 119.6 121.7 123.6 126.1 129.3 132.7
March forecast 118.2 119.3 121.4 123.2 126.0 129.5 133.7
Change 0.0 -0.3 -0.3 -0.4 -0.1 0.2 1.0
of which:
Economic determinants 0.0 -0.1 -0.3 -0.2 -0.4 -0.5 -0.6
Estimating/modelling changes 0.0 -0.3 0.1 -0.4 -0.1 0.5 1.3
Personal tax credits 0.0 0.1 -0.4 -0.4 -0.4 -0.4 -0.4
Universal credit 0.0 -0.6 -0.2 -0.2 -0.2 -0.3 -0.3
Housing benefit 0.0 0.1 0.1 -0.2 -0.1 0.1 0.3
Incapacity benefits1 0.0 0.0 0.4 0.0 0.0 0.0 0.1
Disability benefits2 0.0 0.1 0.4 0.7 0.9 1.2 1.5
Child benefit -0.1 -0.1 -0.1 -0.1 -0.1 -0.1 -0.1
Carer's allowance 0.0 0.0 0.0 0.0 0.0 0.1 0.3
Other 0.1 0.0 -0.1 -0.2 -0.1 0.0 0.0
Effects of Government decisions 0.0 0.0 -0.1 0.2 0.3 0.1 0.3
Other 0.0 0.0 0.0 0.0 0.0 0.0 0.0
Welfare spending outside the welfare cap
October forecast 100.6 103.4 105.7 108.0 113.0 118.9 125.7
March forecast 100.6 103.7 105.9 109.0 114.1 120.0 126.8
Change 0.0 0.3 0.2 1.0 1.0 1.1 1.1
of which:
Economic determinants 0.0 0.1 0.4 0.9 0.8 0.8 0.8
CPI inflation 0.0 0.0 -0.1 0.0 -0.1 -0.1 -0.1
Unemployment 0.0 0.1 0.4 0.4 0.2 0.1 0.1
Triple lock 0.0 0.0 0.0 0.6 0.7 0.9 0.9
Other 0.0 0.0 0.0 0.0 -0.1 -0.1 -0.1
Estimating/modelling changes 0.0 0.2 -0.2 0.0 0.1 0.2 0.2
State pension 0.0 0.0 0.0 0.1 0.2 0.2 0.2
Jobseeker's allowance 0.0 -0.1 0.0 0.0 0.1 0.1 0.1
Housing benefit 0.0 -0.1 -0.2 -0.1 -0.1 -0.1 -0.1
Other 0.0 0.4 0.0 0.0 0.0 0.0 0.0
Effects of Government decisions 0.0 0.0 0.0 0.1 0.1 0.1 0.1
Other 0.1 0.0 0.0 0.0 0.0 0.0 0.0
Forecast
£ billion
1 Incapacity benefits includes incapacity benefit, employment and support allowance, severe disablement allowance and income
support (incapacity part).2 Disability benefits refers to disability living allowance and personal independence payment.
Universal credit
4.81 Large revisions to actual spending on UC inside and outside the welfare cap partially offset
to give a small downward revision to total UC spending in 2018-19 of £0.2 billion. UC
cases that would have received tax credits or ESA under the legacy system have been lower
than expected, but those that would have received jobseeker’s allowance have been higher.
101 Economic and fiscal outlook

Fiscal outlook
4.82 From 2019-20 onwards – the period in which UC is forecast on a marginal cost basis
relative to the legacy system – spending has been revised down by £0.2 billion on average.
Around half of this relates to data and modelling updates, with the remainder due to revised
costings of the Autumn Budget 2018 UC package, discussed in Annex A.
4.83 Following the Secretary of State for Work and Pensions’ 11 January speech on UC, we have incorporated the effect of two UC policies into this forecast. The first reverses the part of the
policy limiting child-related UC awards for particular claims where all the family’s three or
more children were born before 6 April 2017 (along with some exceptions after that date).
As this would only have applied to new claims from families that had not claimed benefits in
the preceding six months, the cost of not implementing it is relatively modest: £0.3 billion in
total over the forecast period. In the long term this has no cost because ultimately all
children in the UC caseload will have been born after April 2017 and will therefore be
subject to the two-child limit policy that applies to children born after that date.
4.84 The Government has then reshaped the UC managed migration profile in a way that lowers
the cost of UC by £0.2 billion over the next five years – broadly offsetting the cost of the
reversal on the two child-limit policy. This includes the effect of the Secretary of State’s January announcement that, rather than beginning managed migration in earnest in July
2019, it will commence with a 12-month pilot limited to just 10,000 claimants. Parliament
will then vote on further regulations before it is extended to more claimants. DWP then plans
to migrate more slowly initially than in October, before ramping up activity to complete the
migration by December 2023.
4.85 In our October forecast, we added a six-month contingency to the start and end of DWP’s extant rollout plan. We still assume that the managed migration will end six months later
than DWP intends, spreading out the final 12-month high-volume phase in DWP’s plan over a more achievable 18-month period. That said, we now see less risk that the pilot phase will
be delayed and have greater confidence that the gradual build-up in volumes that follows
can be delivered. In part, this is because the Government has reduced volumes to well
below DWP’s operational capacity in order to reduce the costs associated with transitional
protection for claimants who would otherwise lose out relative to their legacy benefit claim
and those associated with claimants who would gain from UC relative to legacy benefits but
are only expected to move to UC via managed migration. We have therefore removed the
six-month contingency from all but the final phase of DWP’s rollout plan, assuming that it
ends in June 2024 (Chart 4.3).
4.86 The main outstanding risks to the managed migration timetable are the Parliamentary
hurdle to be cleared after the pilot phase and the ramp-up in volumes between 2021-22
and 2022-23, where past experience indicates that when sharp rises in delivery volumes are
planned they are often revised to be more gradual when the time comes to deliver them.
4.87 More generally, UC has been an area where Government policy has changed frequently,
often reflecting pressure from Parliament to modify particular elements that are less
generous than in the legacy system. Despite UC now being expected to cost more overall
than the legacy system, there are still individual elements of it that are expected to save
Economic and fiscal outlook 102
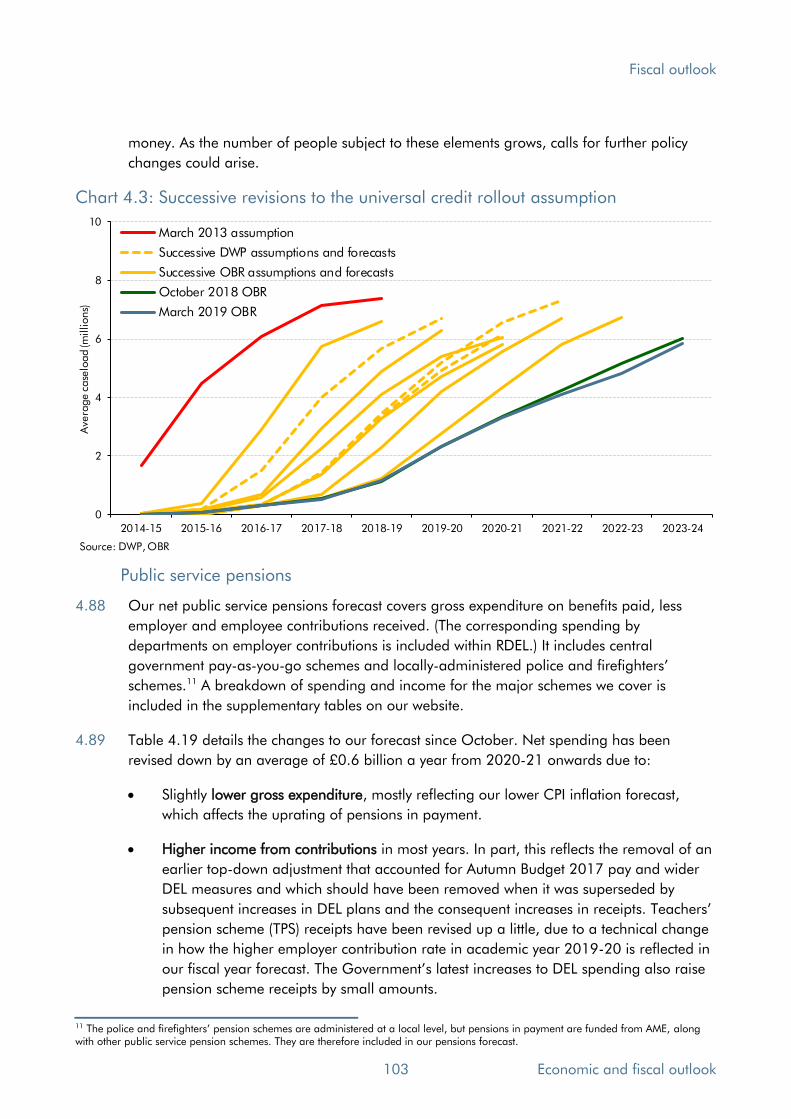
Fiscal outlook
money. As the number of people subject to these elements grows, calls for further policy
changes could arise.
Chart 4.3: Successive revisions to the universal credit rollout assumption
0
2
4
6
8
10
2014-15 2015-16 2016-17 2017-18 2018-19 2019-20 2020-21 2021-22 2022-23 2023-24
Ave
rage c
ase
load (m
illions)
March 2013 assumption
Successive DWP assumptions and forecasts
Successive OBR assumptions and forecasts
October 2018 OBR
March 2019 OBR
Source: DWP, OBR
Public service pensions
4.88 Our net public service pensions forecast covers gross expenditure on benefits paid, less
employer and employee contributions received. (The corresponding spending by
departments on employer contributions is included within RDEL.) It includes central
government pay-as-you-go schemes and locally-administered police and firefighters’
schemes.11 A breakdown of spending and income for the major schemes we cover is
included in the supplementary tables on our website.
4.89 Table 4.19 details the changes to our forecast since October. Net spending has been
revised down by an average of £0.6 billion a year from 2020-21 onwards due to:
• Slightly lower gross expenditure, mostly reflecting our lower CPI inflation forecast,
which affects the uprating of pensions in payment.
• Higher income from contributions in most years. In part, this reflects the removal of an
earlier top-down adjustment that accounted for Autumn Budget 2017 pay and wider
DEL measures and which should have been removed when it was superseded by
subsequent increases in DEL plans and the consequent increases in receipts. Teachers’
pension scheme (TPS) receipts have been revised up a little, due to a technical change
in how the higher employer contribution rate in academic year 2019-20 is reflected in
our fiscal year forecast. The Government’s latest increases to DEL spending also raise pension scheme receipts by small amounts.
11 The police and firefighters’ pension schemes are administered at a local level, but pensions in payment are funded from AME, along with other public service pension schemes. They are therefore included in our pensions forecast.
103 Economic and fiscal outlook
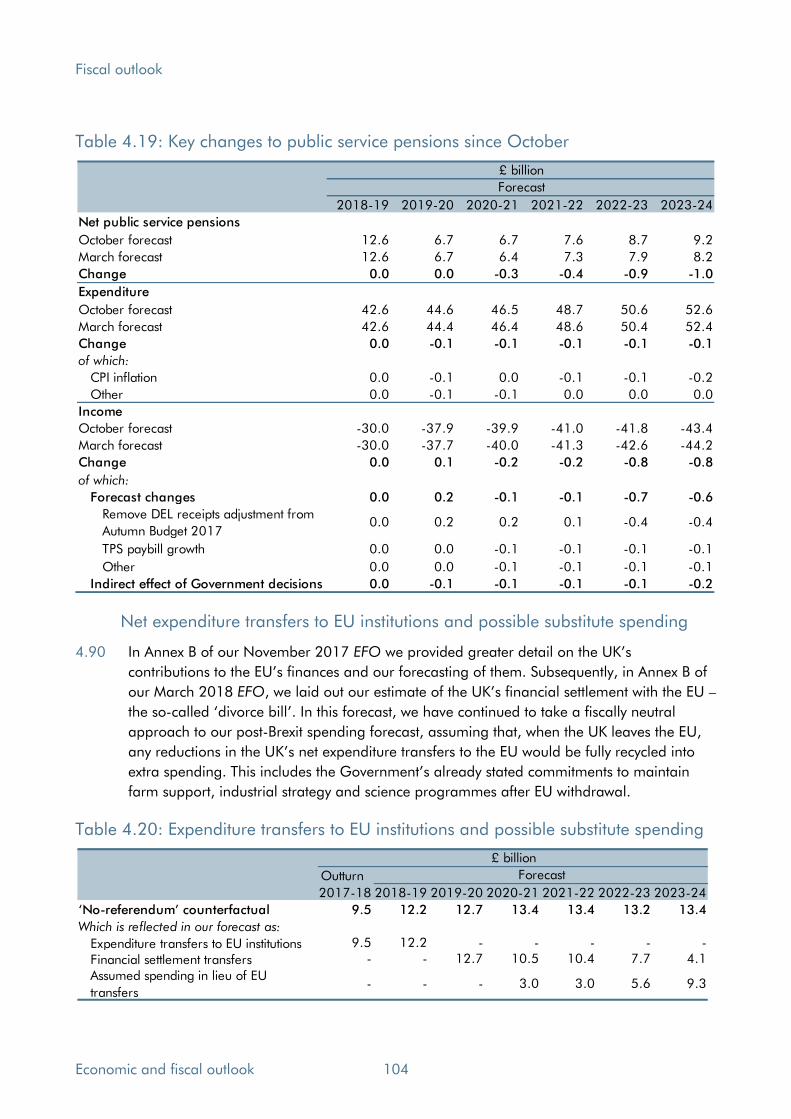
Fiscal outlook
Table 4.19: Key changes to public service pensions since October
2018-19 2019-20 2020-21 2021-22 2022-23 2023-24
Net public service pensions
October forecast 12.6 6.7 6.7 7.6 8.7 9.2
March forecast 12.6 6.7 6.4 7.3 7.9 8.2
Change 0.0 0.0 -0.3 -0.4 -0.9 -1.0
Expenditure
October forecast 42.6 44.6 46.5 48.7 50.6 52.6
March forecast 42.6 44.4 46.4 48.6 50.4 52.4
Change 0.0 -0.1 -0.1 -0.1 -0.1 -0.1
of which:
CPI inflation 0.0 -0.1 0.0 -0.1 -0.1 -0.2
Other 0.0 -0.1 -0.1 0.0 0.0 0.0
Income
October forecast -30.0 -37.9 -39.9 -41.0 -41.8 -43.4
March forecast -30.0 -37.7 -40.0 -41.3 -42.6 -44.2
Change 0.0 0.1 -0.2 -0.2 -0.8 -0.8
of which:
Forecast changes 0.0 0.2 -0.1 -0.1 -0.7 -0.6
Remove DEL receipts adjustment from
Autumn Budget 20170.0 0.2 0.2 0.1 -0.4 -0.4
TPS paybill growth 0.0 0.0 -0.1 -0.1 -0.1 -0.1
Other 0.0 0.0 -0.1 -0.1 -0.1 -0.1
Indirect effect of Government decisions 0.0 -0.1 -0.1 -0.1 -0.1 -0.2
£ billion
Forecast
Net expenditure transfers to EU institutions and possible substitute spending
4.90 In Annex B of our November 2017 EFO we provided greater detail on the UK’s contributions to the EU’s finances and our forecasting of them. Subsequently, in Annex B of
our March 2018 EFO, we laid out our estimate of the UK’s financial settlement with the EU – the so-called ‘divorce bill’. In this forecast, we have continued to take a fiscally neutral
approach to our post-Brexit spending forecast, assuming that, when the UK leaves the EU,
any reductions in the UK’s net expenditure transfers to the EU would be fully recycled into extra spending. This includes the Government’s already stated commitments to maintain
farm support, industrial strategy and science programmes after EU withdrawal.
Table 4.20: Expenditure transfers to EU institutions and possible substitute spending
Outturn
2017-18 2018-19 2019-20 2020-21 2021-22 2022-23 2023-24
‘No-referendum’ counterfactual 9.5 12.2 12.7 13.4 13.4 13.2 13.4
Which is reflected in our forecast as:
Expenditure transfers to EU institutions 9.5 12.2 - - - - -
Financial settlement transfers - - 12.7 10.5 10.4 7.7 4.1
Assumed spending in lieu of EU
transfers- - - 3.0 3.0 5.6 9.3
Forecast
£ billion
Economic and fiscal outlook 104

Fiscal outlook
4.91 Table 4.21 summarises the main changes to our forecast since October, which include:
• A stronger sterling-euro exchange rate reduces the sterling value of euro-denominated
contributions by more than it increases the UK’s share in the euro-denominated bases
used to calculate those contributions, thereby reducing spending by a small amount in
the near term and by £0.2 billion a year from 2021-22 onwards.
• The draw-forward in 2019 – the amount the Commission requests from Member
States in the first quarter of the calendar year – was confirmed as 4.7 months of
contributions, slightly higher than the 4.35 months we had assumed. Relative to our
October forecast this shifts £0.4 billion of spending from 2019-20 into 2018-19.
• There have been substantial revisions to the surcharge for historical revisions to the
UK’s gross national income. In our October forecast, we assumed that the UK would
pay an extra £245 million in respect of Blue Book 2018 revisions. Once the effect of
other Member States’ revisions – about which we had no information in October – were factored in, the outturn surcharge was in effect -£27 million.
• EU budget implementation assumptions have an uneven effect. The draft amending
budget passed in late 2018 retrospectively increased implementation and therefore UK
contributions relating to calendar year 2018 by £845 million. However, it also revised
growth forecasts for the UK and other Member States’ own resources contributions,
which reduced UK contributions by £665 million. The reduction in contributions from
growth revisions was implemented in January 2019, and therefore it affects both the
2018-19 and 2019-20 fiscal years.
• Other factors, including revisions to growth in the UK and other Member States and
forecasts for own resources contributions, reduce our forecast by small amounts.
Table 4.21: Key changes to expenditure transfers to EU institutions on a ‘no referendum’ counterfactual basis since October
2018-19 2019-20 2020-21 2021-22 2022-23 2023-24
October forecast 11.7 13.5 13.5 13.6 13.5 13.6
March forecast 12.2 12.7 13.4 13.4 13.2 13.4
Change 0.5 -0.8 -0.1 -0.2 -0.2 -0.2
of which:
Sterling-euro exchange rate 0.0 0.0 0.0 -0.2 -0.2 -0.2
Draw-forward in 2019 0.4 -0.4 0.0 0.0 0.0 0.0
Surcharge from historical UK national
income revisions0.0 -0.3 0.0 0.0 0.0 0.0
EU budget implementation 0.2 -0.1 0.0 0.0 0.0 0.0
£ billion
Forecast
Note: The supplementary fiscal tables on our website show details of our latest forecasts for our GNI and VAT payments and the
rebate, and the various annual adjustments to those transactions that are assumed within our forecast. They also include a table that
shows our assumptions about the EU annual budgets, and the adjustments to budget ceilings under the various flexibilities allowed in
the 2014-2020 Multiannual Financial Framework, and our assumptions about implementation rates against the adjusted ceilings.
105 Economic and fiscal outlook
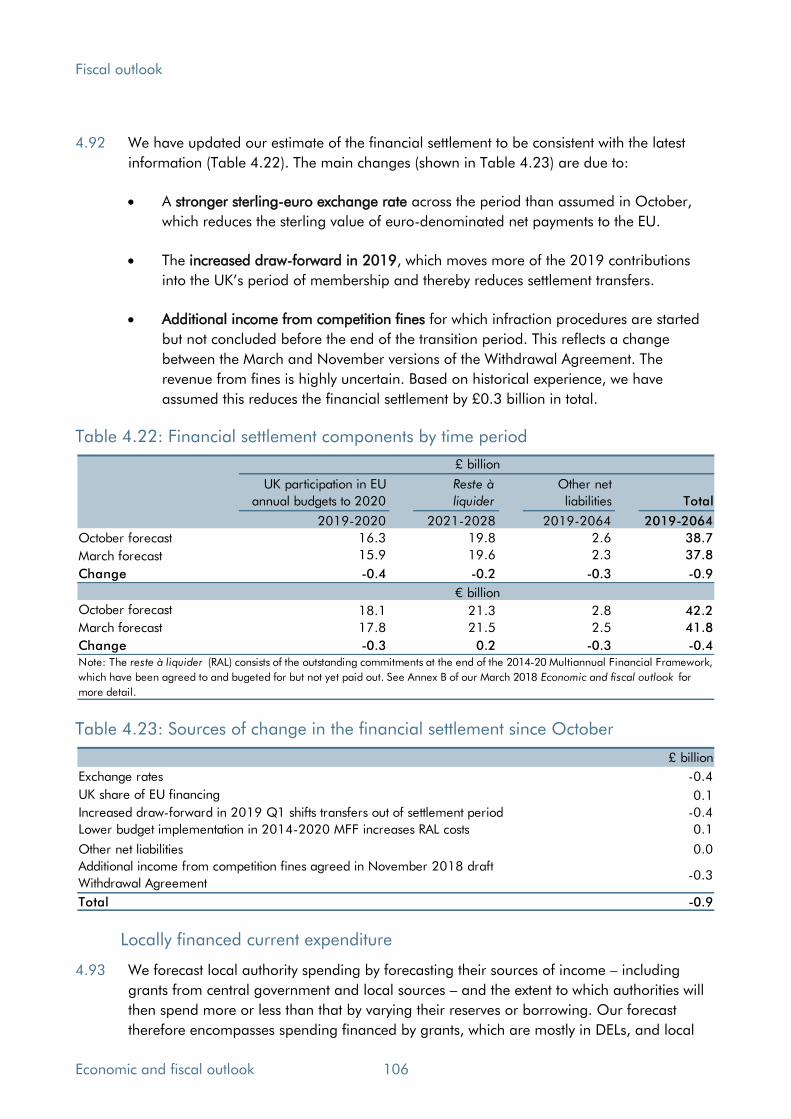
Fiscal outlook
4.92 We have updated our estimate of the financial settlement to be consistent with the latest
information (Table 4.22). The main changes (shown in Table 4.23) are due to:
• A stronger sterling-euro exchange rate across the period than assumed in October,
which reduces the sterling value of euro-denominated net payments to the EU.
• The increased draw-forward in 2019, which moves more of the 2019 contributions
into the UK’s period of membership and thereby reduces settlement transfers.
• Additional income from competition fines for which infraction procedures are started
but not concluded before the end of the transition period. This reflects a change
between the March and November versions of the Withdrawal Agreement. The
revenue from fines is highly uncertain. Based on historical experience, we have
assumed this reduces the financial settlement by £0.3 billion in total.
Table 4.22: Financial settlement components by time period
UK participation in EU
annual budgets to 2020
Reste à
liquider
Other net
liabilities Total
2019-2020 2021-2028 2019-2064 2019-2064
October forecast 16.3 19.8 2.6 38.7
March forecast 15.9 19.6 2.3 37.8
Change -0.4 -0.2 -0.3 -0.9
October forecast 18.1 21.3 2.8 42.2
March forecast 17.8 21.5 2.5 41.8
Change -0.3 0.2 -0.3 -0.4
£ billion
€ billion
Note: The reste à liquider (RAL) consists of the outstanding commitments at the end of the 2014-20 Multiannual Financial Framework,
which have been agreed to and bugeted for but not yet paid out. See Annex B of our March 2018 Economic and fiscal outlook for
more detail.
Table 4.23: Sources of change in the financial settlement since October
£ billion
Exchange rates -0.4
UK share of EU financing 0.1
Increased draw-forward in 2019 Q1 shifts transfers out of settlement period -0.4
Lower budget implementation in 2014-2020 MFF increases RAL costs 0.1
Other net liabilities 0.0
Additional income from competition fines agreed in November 2018 draft
Withdrawal Agreement-0.3
Total -0.9
Locally financed current expenditure
4.93 We forecast local authority spending by forecasting their sources of income – including
grants from central government and local sources – and the extent to which authorities will
then spend more or less than that by varying their reserves or borrowing. Our forecast
therefore encompasses spending financed by grants, which are mostly in DELs, and local
Economic and fiscal outlook 106
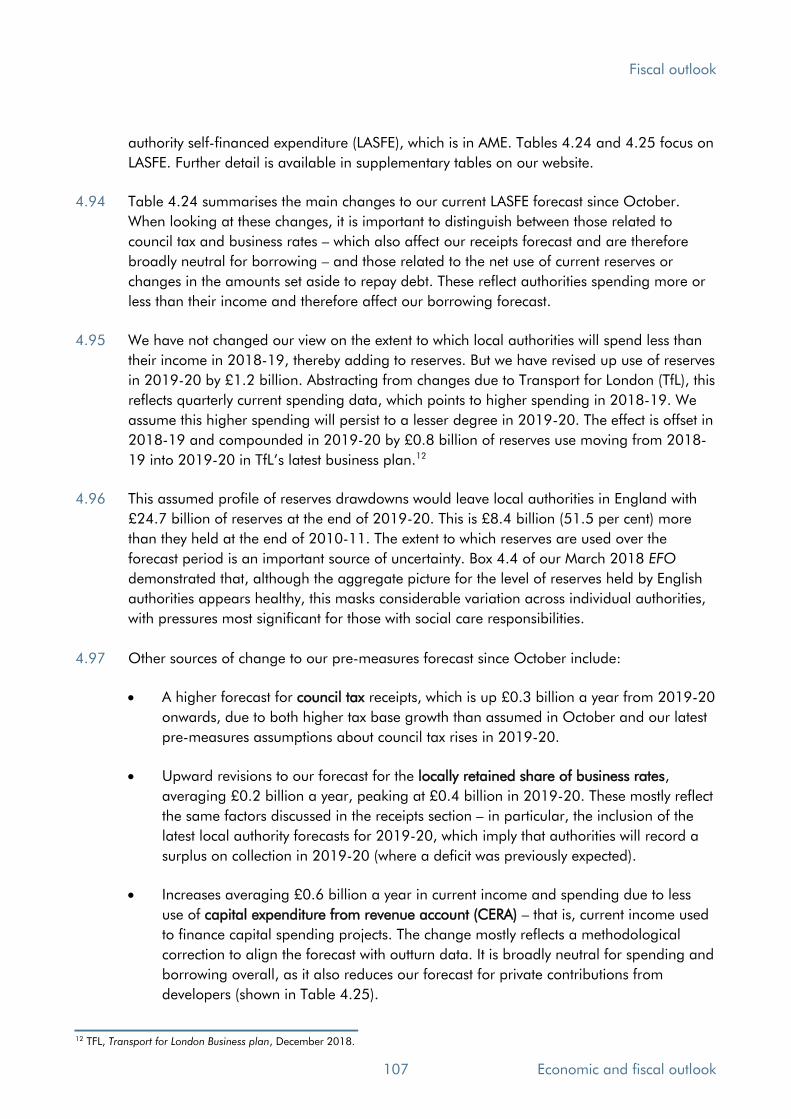
Fiscal outlook
authority self-financed expenditure (LASFE), which is in AME. Tables 4.24 and 4.25 focus on
LASFE. Further detail is available in supplementary tables on our website.
4.94 Table 4.24 summarises the main changes to our current LASFE forecast since October.
When looking at these changes, it is important to distinguish between those related to
council tax and business rates – which also affect our receipts forecast and are therefore
broadly neutral for borrowing – and those related to the net use of current reserves or
changes in the amounts set aside to repay debt. These reflect authorities spending more or
less than their income and therefore affect our borrowing forecast.
4.95 We have not changed our view on the extent to which local authorities will spend less than
their income in 2018-19, thereby adding to reserves. But we have revised up use of reserves
in 2019-20 by £1.2 billion. Abstracting from changes due to Transport for London (TfL), this
reflects quarterly current spending data, which points to higher spending in 2018-19. We
assume this higher spending will persist to a lesser degree in 2019-20. The effect is offset in
2018-19 and compounded in 2019-20 by £0.8 billion of reserves use moving from 2018-
19 into 2019-20 in TfL’s latest business plan.12
4.96 This assumed profile of reserves drawdowns would leave local authorities in England with
£24.7 billion of reserves at the end of 2019-20. This is £8.4 billion (51.5 per cent) more
than they held at the end of 2010-11. The extent to which reserves are used over the
forecast period is an important source of uncertainty. Box 4.4 of our March 2018 EFO
demonstrated that, although the aggregate picture for the level of reserves held by English
authorities appears healthy, this masks considerable variation across individual authorities,
with pressures most significant for those with social care responsibilities.
4.97 Other sources of change to our pre-measures forecast since October include:
• A higher forecast for council tax receipts, which is up £0.3 billion a year from 2019-20
onwards, due to both higher tax base growth than assumed in October and our latest
pre-measures assumptions about council tax rises in 2019-20.
• Upward revisions to our forecast for the locally retained share of business rates,
averaging £0.2 billion a year, peaking at £0.4 billion in 2019-20. These mostly reflect
the same factors discussed in the receipts section – in particular, the inclusion of the
latest local authority forecasts for 2019-20, which imply that authorities will record a
surplus on collection in 2019-20 (where a deficit was previously expected).
• Increases averaging £0.6 billion a year in current income and spending due to less
use of capital expenditure from revenue account (CERA) – that is, current income used
to finance capital spending projects. The change mostly reflects a methodological
correction to align the forecast with outturn data. It is broadly neutral for spending and
borrowing overall, as it also reduces our forecast for private contributions from
developers (shown in Table 4.25).
12 TFL, Transport for London Business plan, December 2018.
107 Economic and fiscal outlook
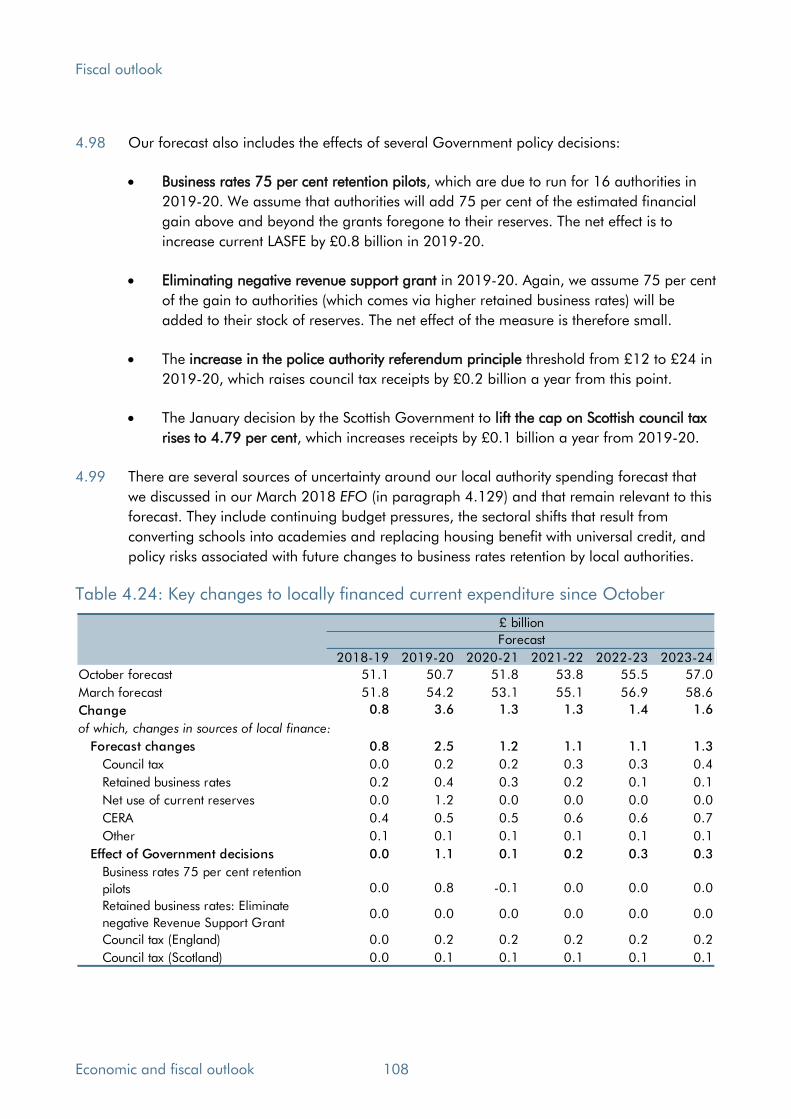
Fiscal outlook
4.98 Our forecast also includes the effects of several Government policy decisions:
• Business rates 75 per cent retention pilots, which are due to run for 16 authorities in
2019-20. We assume that authorities will add 75 per cent of the estimated financial
gain above and beyond the grants foregone to their reserves. The net effect is to
increase current LASFE by £0.8 billion in 2019-20.
• Eliminating negative revenue support grant in 2019-20. Again, we assume 75 per cent
of the gain to authorities (which comes via higher retained business rates) will be
added to their stock of reserves. The net effect of the measure is therefore small.
• The increase in the police authority referendum principle threshold from £12 to £24 in
2019-20, which raises council tax receipts by £0.2 billion a year from this point.
• The January decision by the Scottish Government to lift the cap on Scottish council tax
rises to 4.79 per cent, which increases receipts by £0.1 billion a year from 2019-20.
4.99 There are several sources of uncertainty around our local authority spending forecast that
we discussed in our March 2018 EFO (in paragraph 4.129) and that remain relevant to this
forecast. They include continuing budget pressures, the sectoral shifts that result from
converting schools into academies and replacing housing benefit with universal credit, and
policy risks associated with future changes to business rates retention by local authorities.
Table 4.24: Key changes to locally financed current expenditure since October
2018-19 2019-20 2020-21 2021-22 2022-23 2023-24
October forecast 51.1 50.7 51.8 53.8 55.5 57.0
March forecast 51.8 54.2 53.1 55.1 56.9 58.6
Change 0.8 3.6 1.3 1.3 1.4 1.6
of which, changes in sources of local finance:
Forecast changes 0.8 2.5 1.2 1.1 1.1 1.3
Council tax 0.0 0.2 0.2 0.3 0.3 0.4
Retained business rates 0.2 0.4 0.3 0.2 0.1 0.1
Net use of current reserves 0.0 1.2 0.0 0.0 0.0 0.0
CERA 0.4 0.5 0.5 0.6 0.6 0.7
Other 0.1 0.1 0.1 0.1 0.1 0.1
Effect of Government decisions 0.0 1.1 0.1 0.2 0.3 0.3
Business rates 75 per cent retention
pilots 0.0 0.8 -0.1 0.0 0.0 0.0
Retained business rates: Eliminate
negative Revenue Support Grant0.0 0.0 0.0 0.0 0.0 0.0
Council tax (England) 0.0 0.2 0.2 0.2 0.2 0.2
Council tax (Scotland) 0.0 0.1 0.1 0.1 0.1 0.1
Forecast
£ billion
Economic and fiscal outlook 108

Fiscal outlook
Locally financed and public corporations’ capital expenditure
4.100 Our latest forecasts for locally financed capital expenditure (capital LASFE) and public
corporations’ capital spending are shown in Table 4.25. These are net of asset sales,
forecasts for which are shown in supplementary tables on our website. Capital LASFE is
measured net of capital spending by local authorities’ Housing Revenue Accounts (HRAs)
and the Transport for London (TfL) subsidiaries that are treated as public corporations in the
National Accounts.13 We switch these items from capital LASFE to public corporations’
capital expenditure in our forecast to ensure it is consistent with the National Accounts.
4.101 We present changes to capital LASFE and public corporations’ capital spending together so that any switches between them net out and do not obscure the changes that affect TME.
Spending has mostly been revised down by uneven amounts across the forecast period.
4.102 The main changes relative to October relate to our forecasts of TfL spending, which are
shown in the TfL capital spending and capital grants from local authorities to public
corporations lines in Table 4.25. This reflects TfL’s latest business plan, which includes its
view of the impact of the delay to finishing Crossrail on fare income and capital spending,
as well as the Government’s December 2018 decision to offer a £1.3 billion loan to the Greater London Authority from the Department for Transport. This loan is passed on to TfL
as a capital grant, financing higher capital spending on Crossrail in 2018-19 and 2019-20.
We have also aligned other parts of our forecast to TfL’s business plan – having aimed off
the previous edition – as we believe that it represents a central view of the effects of
Crossrail changes and other pressures on fare income. Removing the adjustments that we
previously made leads to an uneven yearly profile of small changes relative to October.
4.103 The other main changes to our forecast since October reflect:
• Relatively small revisions to our (non-TfL) prudential borrowing forecast. The upward
revisions to 2018-19 are based on an analysis of three quarters of English authority
net capital spending outturn data for the year to date. The upward revision is assumed
to persist in 2019-20, but diminish in 2020-21. These upward revisions are partly
offset in those years by downward revisions to the use of prudential borrowing to
finance capital spending by Welsh authorities. The downward revision related to Welsh
authorities then dominates in 2022-23 and 2023-24.
• Income from asset sales has been revised down by £0.9 billion in 2018-19, thus
increasing capital spending net of asset sales by that amount. This change more than
reverses judgements in our October forecast, where strong quarterly asset sales data
at the time led us to revise up our 2018-19 forecast by £0.5 billion. This initial in-year
strength has since subsided. The change also smooths the profile of asset sales
between outturn and forecast years and over the forecast period.
13 These TfL transport subsidiaries trade under the company name ‘Transport Trading Ltd’ (TTL). The ONS currently classifies all the large TTL subsidiaries as public corporations apart from Crossrail, which is classified as part of the local authority sector.
109 Economic and fiscal outlook

Fiscal outlook
• Downward revisions averaging £0.5 billion a year to private contributions from
developers, largely reflecting the CERA changes discussed in the preceding section.
• Decreases in other spending, averaging £0.3 billion a year, mostly as a result of
revised 2017-18 outturn data, which reduces our future year forecasts.
Table 4.25: Key changes to locally financed capital expenditure and public corporations’ capital expenditure since October
2018-19 2019-20 2020-21 2021-22 2022-23 2023-24
October forecast 22.4 22.4 20.3 19.8 20.3 20.5
March forecast 23.7 21.9 19.8 19.3 19.1 18.6
Change 1.3 -0.5 -0.5 -0.5 -1.2 -1.9
of which:
TfL capital spending 0.6 -0.4 0.2 0.4 -0.4 -0.5
Capital grants from local authorities to
public corporations0.6 0.5 0.0 0.0 0.2 -0.3
Prudential borrowing (non-TfL) 0.2 0.3 0.1 0.0 -0.1 -0.1
Less asset sales 0.9 0.0 0.0 0.0 0.0 0.0
Private contributions from developers -0.5 -0.5 -0.5 -0.5 -0.6 -0.6
Other -0.5 -0.2 -0.3 -0.3 -0.4 -0.4
£ billionForecast
Public sector debt interest
4.104 Debt interest payments are forecast by applying appropriate interest rates to the stocks of
conventional and index-linked gilts outstanding at different maturities and to other debt,
such as NS&I products and Treasury bills.14 The assumptions we use to forecast the levels of
debt instruments are described later in this chapter. Financial market expectations are used
to derive relevant interest rates (for example, coupons on newly issued conventional gilts),
while our inflation forecast is used for index-linked gilts and other index-linked debt. Flows
associated with the Bank of England’s Asset Purchase Facility (APF) and its own balance
sheet similarly apply appropriate market-derived interest rates to the APF’s loan liability and
to the stocks of gilt, corporate bond and loan assets.15
4.105 Debt interest payments are expected to fall in 2018-19, thanks to lower RPI inflation this
year than in 2017-18. Central government interest payments are fairly stable across the
forecast as the gently rising cost of financing new borrowing is offset by the saving
associated with rolling over previously issued debt at lower interest rates than those that
prevailed when it was issued. The APF continues to reduce public sector debt interest over
the forecast, but by decreasing amounts each year as the gap between the average interest
rate earned on its assets and that paid on its liabilities (Bank Rate) narrows.
14 Our forecasting approach was explained in Box 4.4 of our March 2015 EFO and is discussed in the ‘in depth’ section of our website. A supplementary fiscal table on our website presents the different stocks, flows and effective interest rates that make up this forecast. 15 Since our October forecast, assets and liabilities associated with the Term Funding Scheme have been moved from the balance sheet of the APF to the main Bank of England accounts. This accounting change has no impact on the public finances.
Economic and fiscal outlook 110

Fiscal outlook
4.106 Table 4.26 shows the main changes to our forecast since October:
• The downward revision to our forecast for RPI inflation reduces spending by substantial
amounts in 2018-19 and 2020-21 and more modestly in other years.
• Market-derived gilt rate expectations have fallen, reducing the costs of financing newly
issued debt. This effect builds up over the forecast as more new debt is issued.
• Market-derived Bank Rate expectations have also fallen since October, increasing the
debt interest saving associated with the APF. In October, Bank Rate expectations
moved above 1.5 per cent in 2023-24, so we assumed (in line with MPC guidance)
that the Bank would begin to run down the APF’s assets at that point, reducing the
associated debt interest saving. But as Bank Rate no longer exceeds 1.5 per cent within
the forecast period, we do not assume any asset reductions in this forecast.
Table 4.26: Key changes to debt interest since October
2018-19 2019-20 2020-21 2021-22 2022-23 2023-24
Public sector debt interest
October forecast 41.2 43.5 44.4 45.8 47.2 48.3
March forecast 38.4 41.6 40.3 41.7 43.0 43.8
Change -2.8 -1.9 -4.1 -4.1 -4.2 -4.5
Central government debt interest
October forecast 51.6 52.0 51.4 52.0 52.0 52.9
March forecast 48.9 51.1 48.7 49.3 49.2 49.7
Change -2.7 -0.9 -2.7 -2.7 -2.8 -3.1
of which:
Forecast changes -2.7 -0.8 -2.7 -2.6 -2.8 -3.2
Interest rates -0.1 -0.6 -1.4 -2.0 -2.4 -2.7
Inflation -2.8 -0.1 -1.3 -0.6 -0.3 -0.3
Financing 0.0 0.0 0.0 0.0 -0.2 -0.3
Other factors (including outturn) 0.2 -0.1 0.0 0.1 0.1 0.1
Effect of Government decisions 0.0 0.0 0.0 -0.1 0.0 0.1
Asset Purchase Facility
October forecast -11.8 -9.8 -8.4 -7.5 -6.3 -6.1
March forecast -11.9 -10.9 -9.7 -9.0 -7.7 -7.5
Change -0.1 -1.0 -1.4 -1.5 -1.4 -1.4
of which:
Forecast changes -0.1 -1.0 -1.4 -1.5 -1.4 -1.4
Interest rates -0.1 -1.0 -1.4 -1.5 -1.4 -1.3
Other changes 0.0 0.0 0.0 0.0 0.0 -0.1
Local authority and public corporation debt interestOctober forecast 1.4 1.3 1.4 1.4 1.5 1.5
March forecast 1.4 1.3 1.4 1.4 1.4 1.5
Change 0.0 0.0 0.0 0.0 0.0 0.0
Forecast
£ billion
111 Economic and fiscal outlook

Fiscal outlook
4.107 It is likely that the market-derived interest rates on which we base this forecast include
different implicit assumptions about the nature of Brexit than those underpinning the rest of
our forecast. Specifically, markets appear to be placing some weight on the possibility of a
‘no deal’ Brexit accompanied by some monetary policy easing. These different underlying
assumptions mean that debt interest spending on a fully consistent interest rate path would
probably be higher, but there is no reliable way to calibrate by how much.
4.108 One indication is given by recent movements in the interest-rate expectations of market
participants relative to those used in our forecast, which are based on the average of the 10
days to 14 February. Market participants interpreted the Prime Minister’s announcement on
26 February of a sequence of Brexit votes in Parliament in mid-March as substantially
reducing the likelihood of a ‘no deal’ outcome and prompted a corresponding rise in
market interest rates – over the four days to 1 March, Bank Rate expectations rose by an
average of 8 basis points and gilt rate expectations by 9 basis points (at 20-year maturities).
The effect of using these rates on our debt interest payments forecast would be to raise it by
£0.4 billion in 2019-20, rising to £0.7 billion by 2023-24, although that would unwind less
than a fifth of the downward revision since October.
Scottish Government AME
4.109 In October 2018 Scottish Government expenditure was reclassified from central government
DEL to AME, ostensibly because an increasing proportion of expenditure is self-financed
from taxation and thus falls outside Treasury control. There are three main sources of
funding for Scottish Government expenditure. First, the majority is funded from a (residual)
block grant tightly linked to central government DELs via the Barnett formula. Second,
around 45 per cent of resource expenditure is self-financed from taxation, though income
tax funding is subject to potentially large reconciliations as outturn liabilities are only known
after a long lag.16 Finally, under the fiscal framework agreed between the Scottish and UK
Governments, smaller amounts can be funded from Scottish reserves and borrowing.
4.110 The Scottish Government announced its latest spending plans in December 2018. We have
used these as the starting point to update our forecast, but have then adjusted each of the
funding sources in line with our latest forecasts. First, we have increased expenditure funded
from the residual block grant. DELs from 2020-21 onwards are outside the Spending
Review period, so we have used the Treasury’s policy assumptions (in the same way we do
for overall DEL spending). These show the Scottish residual block grant rising in line with
overall DEL. They generate the largest change in our forecast since October. Further
changes made in the Supplementary Estimates process have also increased our forecast.
These include the Treasury granting flexibility to carry forward some of the additional
funding into 2019-20 outside the normal operation of the Scotland Reserve, akin to the
Budget Exchange process normally only used for spending managed under DEL budgets.
16 For more information on the self-financed tax components of Scottish Government expenditure see our Devolved tax and spending forecasts publication.
Economic and fiscal outlook 112

Fiscal outlook
4.111 We have updated our self-financed expenditure forecast by applying the Scottish Fiscal
Commission’s (SFC) 2019-20 income tax forecast, as this was used by the Scottish
Government in its December budgeting plans. (The SFC’s forecast was more pessimistic than ours, which in effect reduced the Scottish Government’s planned expenditure in that
year.) Over the Spending Review period we then have updated our Scottish tax forecasts,
increasing them largely due to stronger than expected income tax receipts. This has
increased our forecast of expenditure in these years. Finally, we have reduced expenditure
funded from the drawdown of the Scottish Government’s reserves by £200 million in 2018-
19 and assumed a net addition to reserves of £50 million in 2019-20. We have made no
changes to our Scottish Government borrowing forecasts.
Other AME
4.112 The main changes to other AME spending items include:
• Spending on company tax credits has been revised up by an average of £0.6 billion a
year over the forecast, reflecting higher than expected outturns.
• Small downward revisions to our general government depreciation forecast, reducing
current spending but increasing net investment spending. This largely reflects lower
R&D depreciation outturns, which are assumed to continue in future years.
• Other PSGI in AME is lower in most years, mainly reflecting continued shortfalls in
assumed provider and consumer take-up of the Lifetime ISA.
• Some elements of our spending forecast are mostly neutral for borrowing, because
they are directly offset in receipts. Changes since October for these forecasts are
explained in the corresponding receipts sections. These include environmental levies
and VAT refunds to central and local government.
• Our AME forecast includes several National Accounts adjustments that are included in
the definitions of PSCE and PSGI.17 Table 4.13 shows that we have revised up the
PSCE-related adjustments by £0.3 billion a year on average across the forecast period,
and the PSGI-related adjustments by £0.2 billion a year on average. The former
mostly reflects a higher forecast for the imputed subsidy for equity injection into the
HRA, which is up by an average of £0.4 billion a year (largely as a result of the
measure lifting the HRA borrowing cap that was announced in Budget 2018). This
increases our forecast of local authority current spending, but is offset in our public
corporations’ gross operating surplus forecast. It brings the sectoral effects of the measure into line with how they will affect the National Accounts, but does not change
the overall effect of the measure on PSNB from that assumed in October. PSGI-related
revisions are mainly due to removing the latest estimates of local authority spending
that score as financial transactions, mostly reflecting TfL’s updated business plan.
17 Further details of our forecasts for all our National Accounts adjustments are included in the supplementary spending tables on our website. Explanations and the background to National Accounts adjustments are given in Annex D to PESA 2018.
113 Economic and fiscal outlook

Fiscal outlook
Deficit aggregates
4.113 Our central forecast for the key measures of the budget deficit incorporates the forecasts for
receipts and expenditure set out earlier in this chapter. In this section we explain the
changes in our forecasts for the following aggregate measures of the deficit:
• Public sector net borrowing: the difference between total public sector receipts and
expenditure on an accrued basis each year. As the widest measure of borrowing, PSNB
is a key indicator of the fiscal position and we focus on it when explaining changes
since our previous forecast. It was also the target measure used for the fiscal mandate
early in the last Parliament.
• Cyclically adjusted net borrowing: public sector net borrowing adjusted to remove the
estimated impact of the economic cycle. This is an estimate of underlying or ‘structural’ net borrowing, in other words the borrowing we would expect to see if the economy
were operating at potential. It is the current target measure for the fiscal mandate.
• The current budget deficit: the difference between receipts and public sector current
expenditure each year. In effect, this is public sector net borrowing excluding
borrowing to finance investment that boosts the public sector capital stock. This was
the target measure from 1997 to 2008 under the Labour Government’s ‘golden rule’.
• The cyclically adjusted current budget deficit: the current budget deficit adjusted to
reflect the estimated impact of the economic cycle. This was the target measure for the
Coalition Government’s fiscal mandate between 2010 and 2015.
Public sector net borrowing
Summary of changes since October
4.114 As in October, we have revised down our pre-measures forecast for borrowing in every year
– but by only about half as much as in that forecast. This is driven by the relatively unusual
combination of an upward revision to receipts and a downward revision to debt interest
spending – only the fifth time that revisions to receipts and debt interest spending have
pushed borrowing in the same direction in the 19 forecast revisions since June 2010.
4.115 The drivers of these revisions reflect two key factors:
• Despite little change in our forecast for nominal GDP growth, the tax-to-GDP ratio has
been revised up. This largely reflects near-term momentum in earnings growth and a
buoyant effective tax rate on labour income due to particularly strong earnings growth
among the highest earners. Both have boosted income tax and NICs receipts.
• Market-derived expectations of future interest rates are lower than in October,
reducing our forecast for debt interest payments. This is, however, likely to reflect the
market pricing in some probability of a ‘no deal’ Brexit and an associated monetary
Economic and fiscal outlook 114
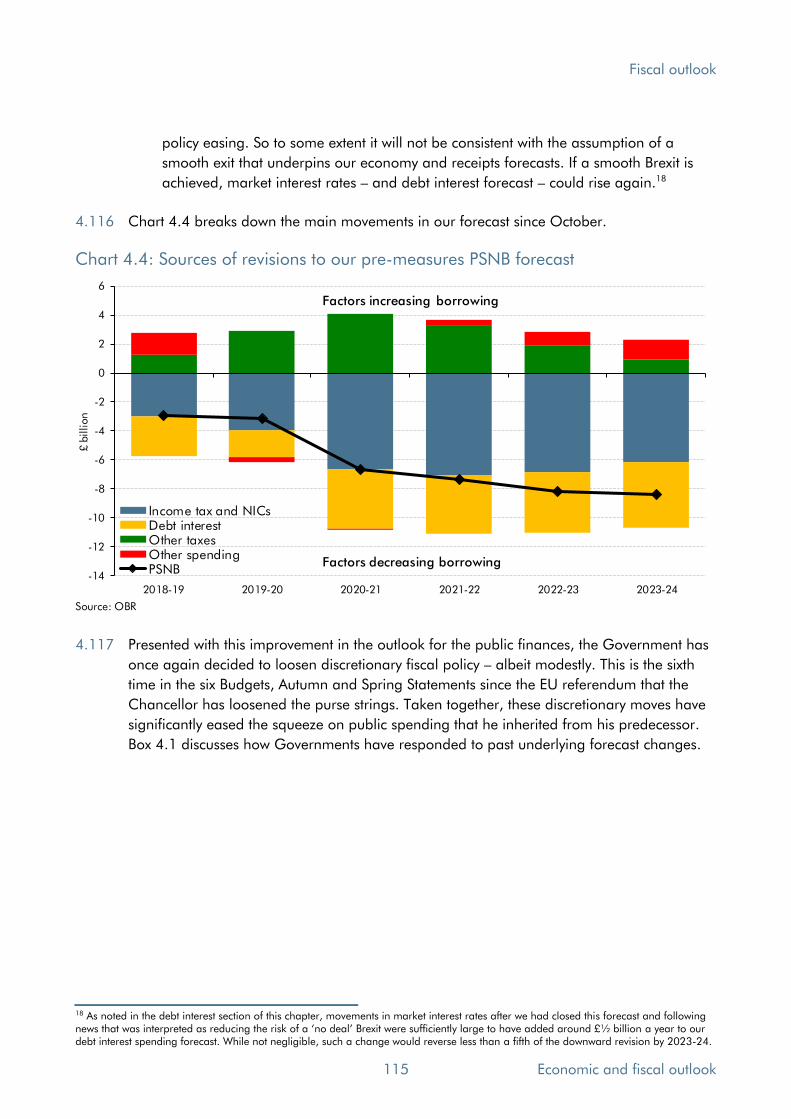
Fiscal outlook
policy easing. So to some extent it will not be consistent with the assumption of a
smooth exit that underpins our economy and receipts forecasts. If a smooth Brexit is
achieved, market interest rates – and debt interest forecast – could rise again.18
4.116 Chart 4.4 breaks down the main movements in our forecast since October.
Chart 4.4: Sources of revisions to our pre-measures PSNB forecast
-14
-12
-10
-8
-6
-4
-2
0
2
4
6
2018-19 2019-20 2020-21 2021-22 2022-23 2023-24
£ b
illion
Income tax and NICsDebt interestOther taxesOther spendingPSNB
Source: OBR
Factors increasing borrowing
Factors decreasing borrowing
4.117 Presented with this improvement in the outlook for the public finances, the Government has
once again decided to loosen discretionary fiscal policy – albeit modestly. This is the sixth
time in the six Budgets, Autumn and Spring Statements since the EU referendum that the
Chancellor has loosened the purse strings. Taken together, these discretionary moves have
significantly eased the squeeze on public spending that he inherited from his predecessor.
Box 4.1 discusses how Governments have responded to past underlying forecast changes.
18 As noted in the debt interest section of this chapter, movements in market interest rates after we had closed this forecast and following news that was interpreted as reducing the risk of a ‘no deal’ Brexit were sufficiently large to have added around £½ billion a year to our debt interest spending forecast. While not negligible, such a change would reverse less than a fifth of the downward revision by 2023-24.
115 Economic and fiscal outlook
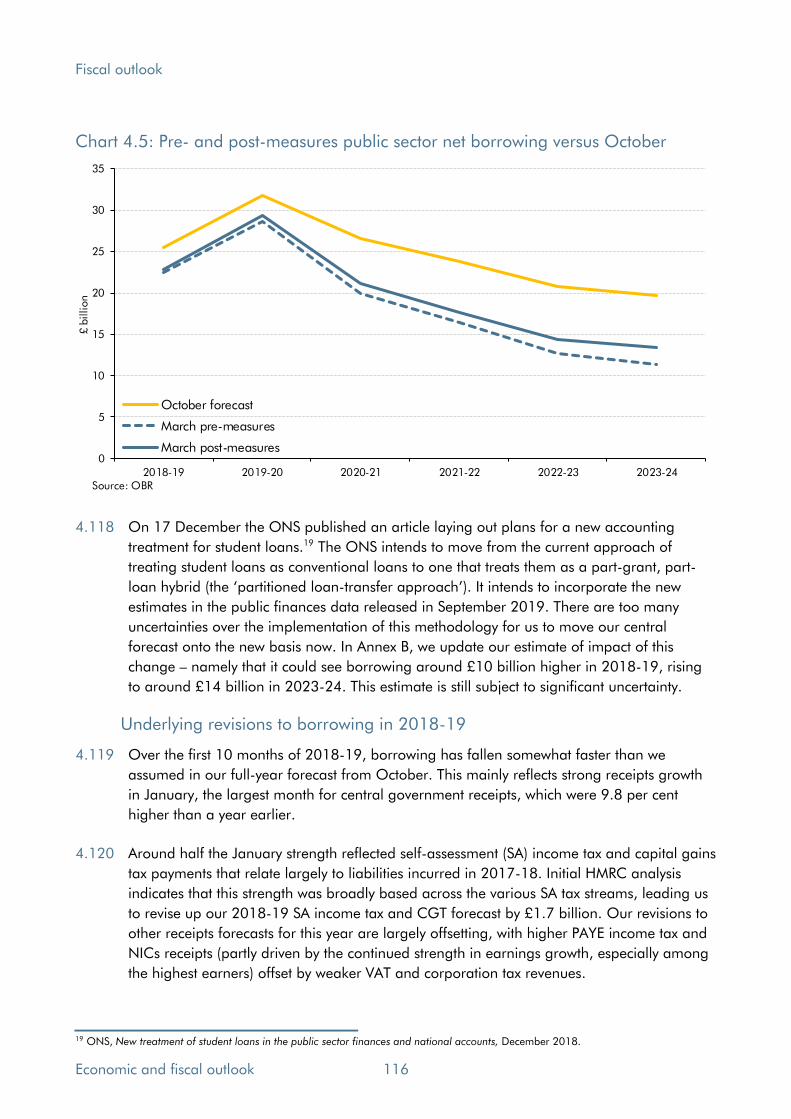
Fiscal outlook
Chart 4.5: Pre- and post-measures public sector net borrowing versus October
0
5
10
15
20
25
30
35
2018-19 2019-20 2020-21 2021-22 2022-23 2023-24
£ b
illion
October forecast
March pre-measures
March post-measures
Source: OBR
4.118 On 17 December the ONS published an article laying out plans for a new accounting
treatment for student loans.19 The ONS intends to move from the current approach of
treating student loans as conventional loans to one that treats them as a part-grant, part-
loan hybrid (the ‘partitioned loan-transfer approach’). It intends to incorporate the new estimates in the public finances data released in September 2019. There are too many
uncertainties over the implementation of this methodology for us to move our central
forecast onto the new basis now. In Annex B, we update our estimate of impact of this
change – namely that it could see borrowing around £10 billion higher in 2018-19, rising
to around £14 billion in 2023-24. This estimate is still subject to significant uncertainty.
Underlying revisions to borrowing in 2018-19
4.119 Over the first 10 months of 2018-19, borrowing has fallen somewhat faster than we
assumed in our full-year forecast from October. This mainly reflects strong receipts growth
in January, the largest month for central government receipts, which were 9.8 per cent
higher than a year earlier.
4.120 Around half the January strength reflected self-assessment (SA) income tax and capital gains
tax payments that relate largely to liabilities incurred in 2017-18. Initial HMRC analysis
indicates that this strength was broadly based across the various SA tax streams, leading us
to revise up our 2018-19 SA income tax and CGT forecast by £1.7 billion. Our revisions to
other receipts forecasts for this year are largely offsetting, with higher PAYE income tax and
NICs receipts (partly driven by the continued strength in earnings growth, especially among
the highest earners) offset by weaker VAT and corporation tax revenues.
19 ONS, New treatment of student loans in the public sector finances and national accounts, December 2018.
Economic and fiscal outlook 116
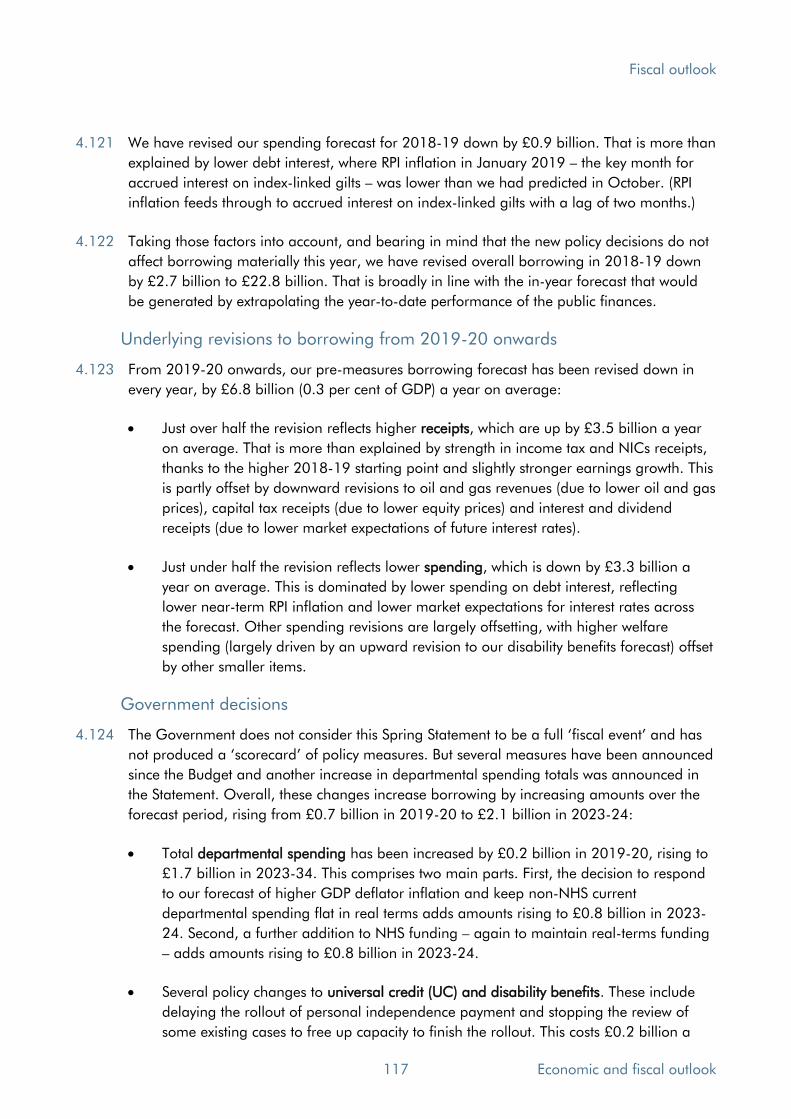
Fiscal outlook
4.121 We have revised our spending forecast for 2018-19 down by £0.9 billion. That is more than
explained by lower debt interest, where RPI inflation in January 2019 – the key month for
accrued interest on index-linked gilts – was lower than we had predicted in October. (RPI
inflation feeds through to accrued interest on index-linked gilts with a lag of two months.)
4.122 Taking those factors into account, and bearing in mind that the new policy decisions do not
affect borrowing materially this year, we have revised overall borrowing in 2018-19 down
by £2.7 billion to £22.8 billion. That is broadly in line with the in-year forecast that would
be generated by extrapolating the year-to-date performance of the public finances.
Underlying revisions to borrowing from 2019-20 onwards
4.123 From 2019-20 onwards, our pre-measures borrowing forecast has been revised down in
every year, by £6.8 billion (0.3 per cent of GDP) a year on average:
• Just over half the revision reflects higher receipts, which are up by £3.5 billion a year
on average. That is more than explained by strength in income tax and NICs receipts,
thanks to the higher 2018-19 starting point and slightly stronger earnings growth. This
is partly offset by downward revisions to oil and gas revenues (due to lower oil and gas
prices), capital tax receipts (due to lower equity prices) and interest and dividend
receipts (due to lower market expectations of future interest rates).
• Just under half the revision reflects lower spending, which is down by £3.3 billion a
year on average. This is dominated by lower spending on debt interest, reflecting
lower near-term RPI inflation and lower market expectations for interest rates across
the forecast. Other spending revisions are largely offsetting, with higher welfare
spending (largely driven by an upward revision to our disability benefits forecast) offset
by other smaller items.
Government decisions
4.124 The Government does not consider this Spring Statement to be a full ‘fiscal event’ and has not produced a ‘scorecard’ of policy measures. But several measures have been announced since the Budget and another increase in departmental spending totals was announced in
the Statement. Overall, these changes increase borrowing by increasing amounts over the
forecast period, rising from £0.7 billion in 2019-20 to £2.1 billion in 2023-24:
• Total departmental spending has been increased by £0.2 billion in 2019-20, rising to
£1.7 billion in 2023-34. This comprises two main parts. First, the decision to respond
to our forecast of higher GDP deflator inflation and keep non-NHS current
departmental spending flat in real terms adds amounts rising to £0.8 billion in 2023-
24. Second, a further addition to NHS funding – again to maintain real-terms funding
– adds amounts rising to £0.8 billion in 2023-24.
• Several policy changes to universal credit (UC) and disability benefits. These include
delaying the rollout of personal independence payment and stopping the review of
some existing cases to free up capacity to finish the rollout. This costs £0.2 billion a
117 Economic and fiscal outlook
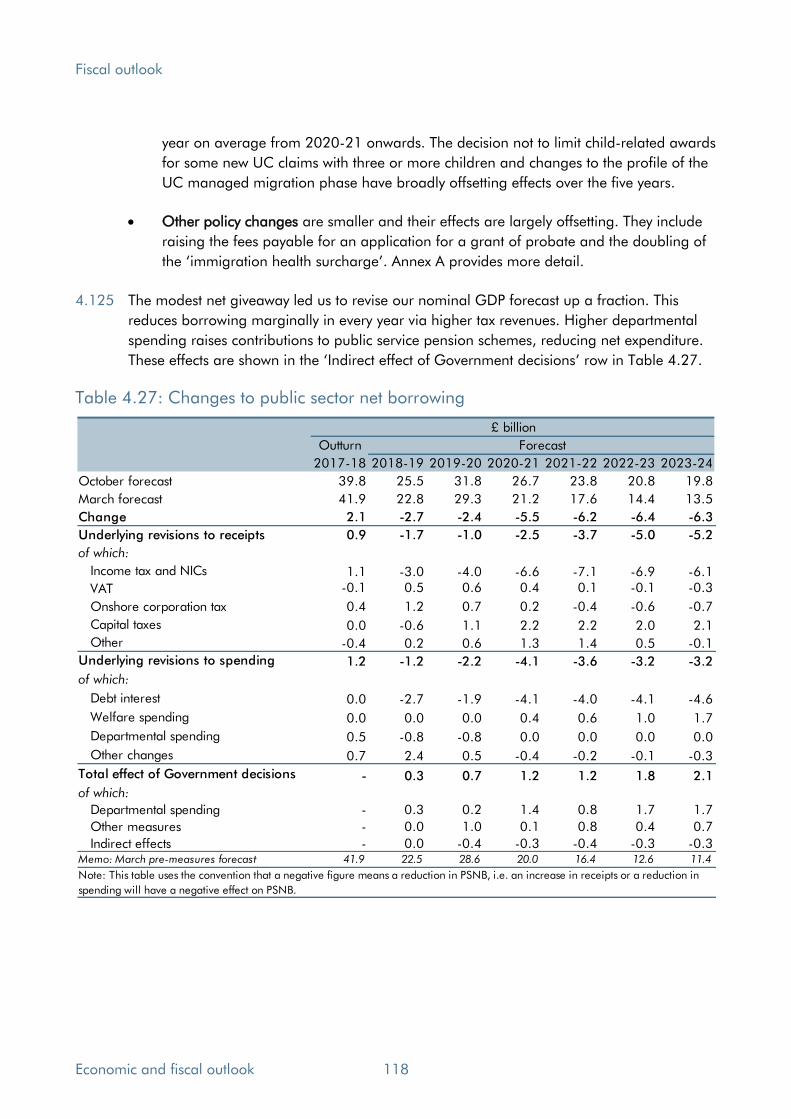
Fiscal outlook
year on average from 2020-21 onwards. The decision not to limit child-related awards
for some new UC claims with three or more children and changes to the profile of the
UC managed migration phase have broadly offsetting effects over the five years.
• Other policy changes are smaller and their effects are largely offsetting. They include
raising the fees payable for an application for a grant of probate and the doubling of
the ‘immigration health surcharge’. Annex A provides more detail.
4.125 The modest net giveaway led us to revise our nominal GDP forecast up a fraction. This
reduces borrowing marginally in every year via higher tax revenues. Higher departmental
spending raises contributions to public service pension schemes, reducing net expenditure.
These effects are shown in the ‘Indirect effect of Government decisions’ row in Table 4.27.
Table 4.27: Changes to public sector net borrowing 230
Outturn
2017-18 2018-19 2019-20 2020-21 2021-22 2022-23 2023-24
October forecast 39.8 25.5 31.8 26.7 23.8 20.8 19.8
March forecast 41.9 22.8 29.3 21.2 17.6 14.4 13.5
Change 2.1 -2.7 -2.4 -5.5 -6.2 -6.4 -6.3
Underlying revisions to receipts 0.9 -1.7 -1.0 -2.5 -3.7 -5.0 -5.2
of which:
Income tax and NICs 1.1 -3.0 -4.0 -6.6 -7.1 -6.9 -6.1
VAT -0.1 0.5 0.6 0.4 0.1 -0.1 -0.3
Onshore corporation tax 0.4 1.2 0.7 0.2 -0.4 -0.6 -0.7
Capital taxes 0.0 -0.6 1.1 2.2 2.2 2.0 2.1
Other -0.4 0.2 0.6 1.3 1.4 0.5 -0.1
Underlying revisions to spending 1.2 -1.2 -2.2 -4.1 -3.6 -3.2 -3.2
of which:
Debt interest 0.0 -2.7 -1.9 -4.1 -4.0 -4.1 -4.6
Welfare spending 0.0 0.0 0.0 0.4 0.6 1.0 1.7
Departmental spending 0.5 -0.8 -0.8 0.0 0.0 0.0 0.0
Other changes 0.7 2.4 0.5 -0.4 -0.2 -0.1 -0.3
Total effect of Government decisions - 0.3 0.7 1.2 1.2 1.8 2.1
of which:
Departmental spending - 0.3 0.2 1.4 0.8 1.7 1.7
Other measures - 0.0 1.0 0.1 0.8 0.4 0.7
Indirect effects - 0.0 -0.4 -0.3 -0.4 -0.3 -0.3Memo: March pre-measures forecast 41.9 22.5 28.6 20.0 16.4 12.6 11.4
Note: This table uses the convention that a negative figure means a reduction in PSNB, i.e. an increase in receipts or a reduction in
spending will have a negative effect on PSNB.
£ billion
Forecast
Economic and fiscal outlook 118

Fiscal outlook
Box 4.1: How do governments respond to good and bad news in our forecasts?
Our pre-measures fiscal forecasts provide the baseline against which governments make the tax
and spending policy decisions that determine our post-measures forecasts. Whether a
government chooses to ease or tighten fiscal policy with an overall policy package will be guided
by its legislated fiscal targets and any other fiscal objectives. Its choices will also be influenced by
the nature of the changes to our pre-measures forecasts (for example, whether they are judged
to be cyclical or structural). We maintain a database of fiscal forecast revisions that splits them
into pre-measures, policy and classification factors, which allows us to look for any patterns in
the way governments respond to good or bad news in our underlying forecast revisions.
Chart 4.A shows policy responses to our pre-measures revisions since November 2010. The
cumulative effect of policy decisions across each forecast period are shown on the vertical axis
and are measured as the total cash effect on borrowing over the five-year period, as a share of
total nominal GDP over the same period. This expresses the typical ‘£ billion’ effect of giveaways or takeaways in units that do not rise over time simply because the cash size of the economy is
growing. Our pre-measures forecast changes are shown on the horizontal axis using the same
metric. The effect of major classification changes has been stripped out. The chart shows that:
• When we deliver good news about the pre-measures outlook for the public finances,
governments have tended to loosen fiscal policy. They have typically done this by easing
the squeeze on public spending that had previously been the stated policy intent. On
some occasions, this has involved raising plans in Spending Review years, but often it has
been achieved by changing policy assumptions for departmental spending beyond the
years for which plans have been set. (These assumptions have sometimes implied large
real terms cuts that have been revised away before plans were set – for example the
December 2014 assumptions that were raised in March 2015 and again in July 2015,
ahead of the Spending Review in November 2015.) The only exception was in December
2013, when the Government ‘banked’ the good news in our borrowing forecast and
added to it by squeezing medium-term spending even more tightly. Otherwise, downward
revisions to pre-measures borrowing have always been met with a net policy giveaway.
On average, these have offset the forecast improvement roughly one-for-one.
• When we deliver bad news about the pre-measures outlook, the average policy response
has been more varied. In two-thirds of cases, the Government has responded by partly
offsetting the deterioration, usually by squeezing spending further in the medium term.
On average, this offset is much less than one-for-one. In the other third of cases, the
Government responded by loosening fiscal policy. On two occasions this has happened
alongside a change in the terms of the ‘fiscal mandate’ (including in November 2016).
• Since the Brexit referendum, fiscal policy has been loosened at every Budget, Autumn and
Spring Statement, regardless of whether we have delivered good or bad news in our pre-
measures borrowing forecast. The bulk of the cumulative net giveaway across these six
fiscal statements has come via boosting public spending. In March 2016, our post-
measures forecast showed public spending falling by 2.9 per cent of GDP between 2016-
17 and 2020-21 – largely thanks to policy measures squeezing departmental and welfare
spending. In this forecast, after successive policy giveaways – notably the boost to NHS
119 Economic and fiscal outlook
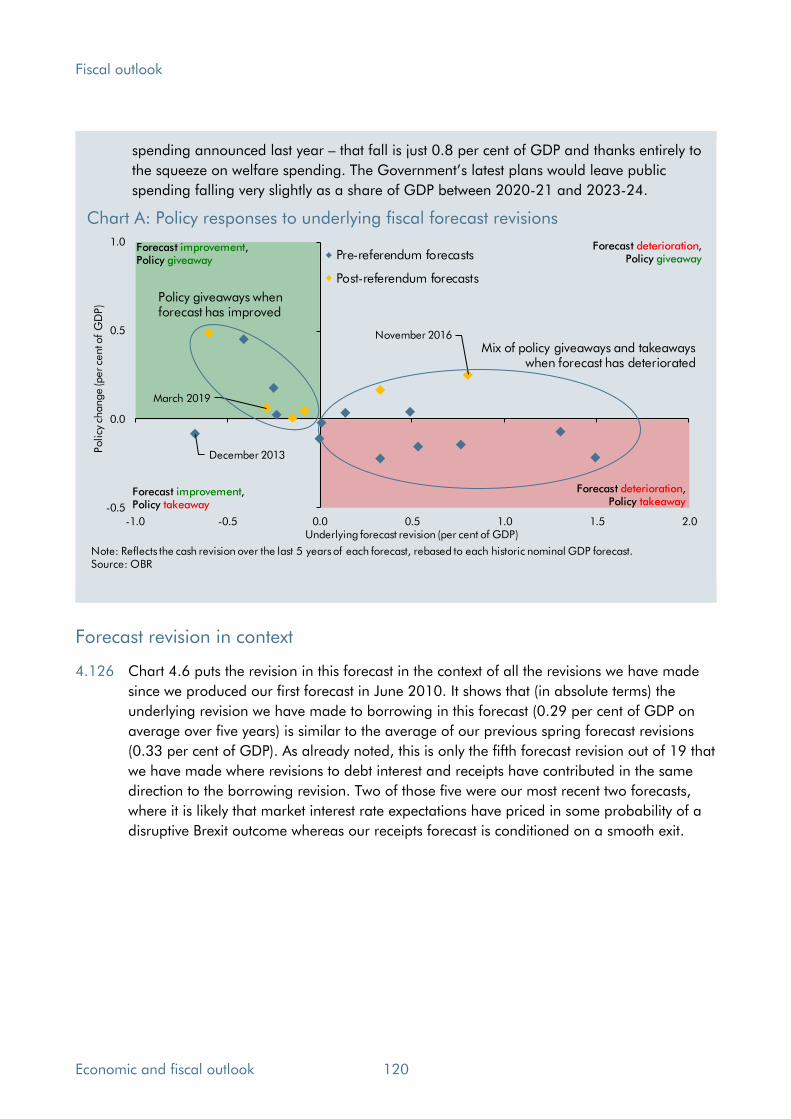
Fiscal outlook
spending announced last year – that fall is just 0.8 per cent of GDP and thanks entirely to
the squeeze on welfare spending. The Government’s latest plans would leave public
spending falling very slightly as a share of GDP between 2020-21 and 2023-24.
Chart A: Policy responses to underlying fiscal forecast revisions
December 2013
November 2016
March 2019
-0.5
0.0
0.5
1.0
-1.0 -0.5 0.0 0.5 1.0 1.5 2.0
Policy
change (p
er ce
nt o
f G
DP)
Underlying forecast revision (per cent of GDP)
Pre-referendum forecasts
Post-referendum forecasts
Note: Reflects the cash revision over the last 5 years of each forecast, rebased to each historic nominal GDP forecast.Source: OBR
Forecast improvement,Policy giveaway
Forecast deterioration,Policy giveaway
Forecast improvement,Policy takeaway
Forecast deterioration,Policy takeaway
Policy giveaways when forecast has improved
Mix of policy giveaways and takeaways when forecast has deteriorated
Forecast revision in context
4.126 Chart 4.6 puts the revision in this forecast in the context of all the revisions we have made
since we produced our first forecast in June 2010. It shows that (in absolute terms) the
underlying revision we have made to borrowing in this forecast (0.29 per cent of GDP on
average over five years) is similar to the average of our previous spring forecast revisions
(0.33 per cent of GDP). As already noted, this is only the fifth forecast revision out of 19 that
we have made where revisions to debt interest and receipts have contributed in the same
direction to the borrowing revision. Two of those five were our most recent two forecasts,
where it is likely that market interest rate expectations have priced in some probability of a
disruptive Brexit outcome whereas our receipts forecast is conditioned on a smooth exit.
Economic and fiscal outlook 120
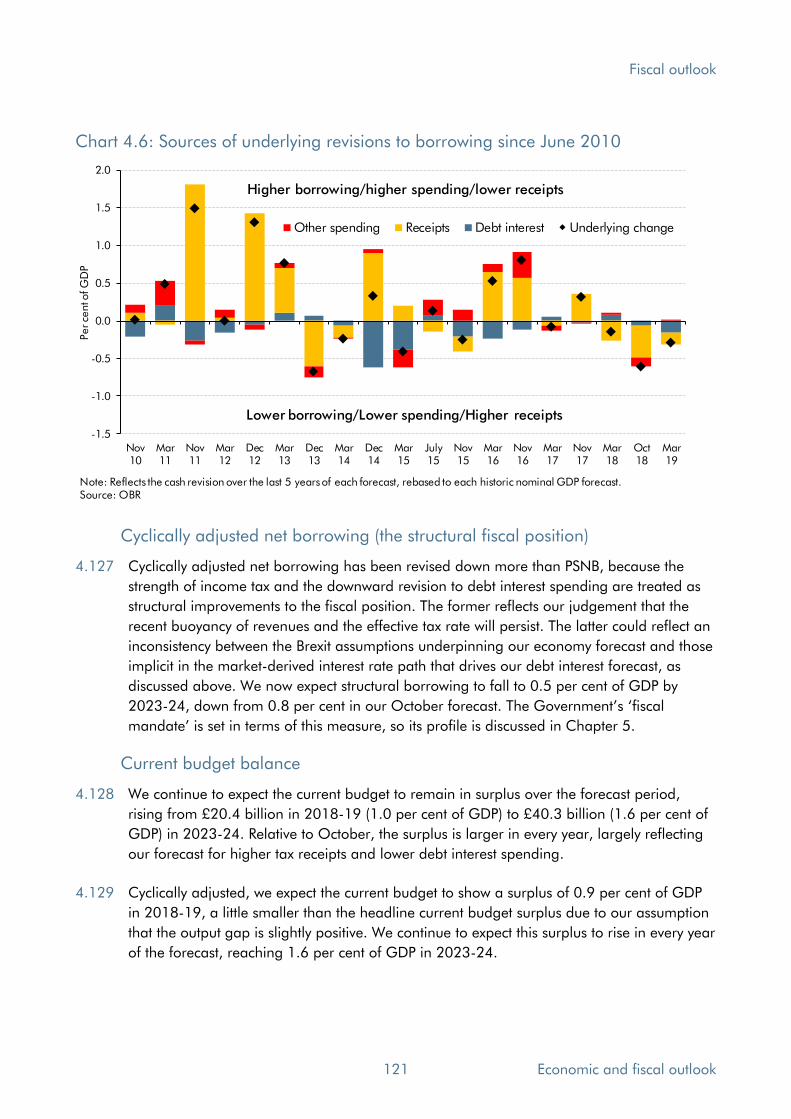
Fiscal outlook
Chart 4.6: Sources of underlying revisions to borrowing since June 2010
-1.5
-1.0
-0.5
0.0
0.5
1.0
1.5
2.0
Nov10
Mar11
Nov11
Mar12
Dec12
Mar13
Dec13
Mar14
Dec14
Mar15
July15
Nov15
Mar16
Nov16
Mar17
Nov17
Mar18
Oct18
Mar19
Per ce
nt o
f G
DP
Other spending Receipts Debt interest Underlying change
Note: Reflects the cash revision over the last 5 years of each forecast, rebased to each historic nominal GDP forecast.Source: OBR
Higher borrowing/higher spending/lower receipts
Lower borrowing/Lower spending/Higher receipts
Cyclically adjusted net borrowing (the structural fiscal position)
4.127 Cyclically adjusted net borrowing has been revised down more than PSNB, because the
strength of income tax and the downward revision to debt interest spending are treated as
structural improvements to the fiscal position. The former reflects our judgement that the
recent buoyancy of revenues and the effective tax rate will persist. The latter could reflect an
inconsistency between the Brexit assumptions underpinning our economy forecast and those
implicit in the market-derived interest rate path that drives our debt interest forecast, as
discussed above. We now expect structural borrowing to fall to 0.5 per cent of GDP by
2023-24, down from 0.8 per cent in our October forecast. The Government’s ‘fiscal
mandate’ is set in terms of this measure, so its profile is discussed in Chapter 5.
Current budget balance
4.128 We continue to expect the current budget to remain in surplus over the forecast period,
rising from £20.4 billion in 2018-19 (1.0 per cent of GDP) to £40.3 billion (1.6 per cent of
GDP) in 2023-24. Relative to October, the surplus is larger in every year, largely reflecting
our forecast for higher tax receipts and lower debt interest spending.
4.129 Cyclically adjusted, we expect the current budget to show a surplus of 0.9 per cent of GDP
in 2018-19, a little smaller than the headline current budget surplus due to our assumption
that the output gap is slightly positive. We continue to expect this surplus to rise in every year
of the forecast, reaching 1.6 per cent of GDP in 2023-24.
121 Economic and fiscal outlook
Fiscal outlook
Financial transactions and cash borrowing
4.130 Public sector net borrowing (PSNB) is the difference between total public sector receipts and
expenditure each year, measured on an accrued basis. But the public sector’s fiscal position
also depends on the flow of financial transactions, such as loans and repayments between
government and the private sector or the sale of financial assets to the private sector. These
do not affect PSNB directly, but they do affect the Government’s cash position and its stock of debt and assets. This affects interest paid and received, which do affect PSNB.
4.131 The public sector net cash requirement (PSNCR) is the most complete measure of the public
sector’s cash flow position in each year.20 It drives our forecast of public sector net debt
(PSND), which is also largely a cash measure. From our estimate of the PSNCR we derive an
estimate of the central government net cash requirement (CGNCR), which in turn largely
determines the Government’s financing requirement – the amount it needs to raise from
debt instruments including Treasury bills, gilt issues and NS&I products.
4.132 Differences between the PSNCR and PSNB can be split into the following categories:
• Loans and repayments: loans that the public sector makes to the private sector do not
affect PSNB directly, but the cash flows affect the PSNCR. In Table 4.28 we divide net
lending into programmes that the Government manages within DEL and others.
• Sales or purchases of financial assets: the public sector may acquire or sell financial
assets such as loans, equity or corporate bonds. When it sells an asset for cash, the
initial transaction does not affect PSNB, whereas the cash received will reduce the
PSNCR. But both PSNB and the PSNCR will be higher in future years if the Government
foregoes an income stream that flowed from the asset sold.
• Bank of England schemes: some Bank of England actions involve loans and
repayments or the purchase of financial assets that affect the PSNCR. We describe the
effects of these schemes, such as the Term Funding Scheme, separately from
transactions involving other public sector loans and financial assets.
• Timing effects: PSNB is an accruals measure of borrowing in which, where possible,
spending and receipts are attributed to the year of the activity to which they relate. In
contrast, PSNCR is a cash measure in which spending and receipts are attributed to the
year in which the cash flow takes place. These timing differences must be adjusted for.
20 Consistent with the measures of debt and deficit used in this forecast, PSNCR excludes the public sector banks.
Economic and fiscal outlook 122

Fiscal outlook
Table 4.28: Reconciliation of PSNB and PSNCR
2018-19 2019-20 2020-21 2021-22 2022-23 2023-24
Public sector net borrowing 22.8 29.3 21.2 17.6 14.4 13.5
Financial transactions 5.8 0.3 -25.4 -51.5 26.0 21.3
of which:
DEL net lending 5.4 6.0 6.5 5.9 6.4 2.3
Help to Buy outlays 3.7 4.0 4.3 3.2 3.7 -
Other housing schemes 0.5 0.5 0.6 - - -
Devolved administrations 0.2 0.5 0.5 - - -
Other DEL 1.1 1.3 1.4 - - -
Post Spending Review DEL assumption - - - 3.3 3.4 2.9
Allowance for shortfall -0.1 -0.3 -0.3 -0.6 -0.6 -0.6
Other government net lending 17.7 16.7 17.6 19.0 18.4 17.8
Student loan outlays 18.1 19.2 20.2 21.0 21.8 22.6
Student loan repayments1 -2.4 -2.3 -2.3 -2.4 -2.6 -2.9
Loan to Ireland 0.0 -1.6 -1.6 - - -
Scottish Government 0.7 0.6 0.7 0.4 0.5 0.1
UK Export Finance 0.5 0.5 1.0 0.8 0.2 0.1
Other AME 1.7 1.4 1.1 1.1 0.9 0.6
Help to Buy repayments -0.8 -1.1 -1.5 -1.9 -2.4 -2.7
Sales or purchases of financial assets -13.3 -16.4 -5.2 -6.6 -7.6 -5.9
Student loans -1.9 -2.7 -2.8 -2.9 -3.0 0.0
RBS shares -2.5 -3.6 -2.4 -3.7 -4.6 -5.9
UKAR asset sales and rundown -7.4 -9.6 - - - -
Other sales -1.5 -0.6 -0.1 0.0 0.0 0.0
Bank of England schemes -5.6 0.0 -51.1 -70.3 0.0 0.0
Cash flow timing effects 1.5 -6.0 7.0 0.6 8.8 7.2
Student loan interest1 4.5 5.0 5.5 6.3 7.4 8.4
Corporation tax 0.9 -4.6 -2.7 1.8 1.7 1.7
Other receipts 4.6 4.6 5.7 4.8 4.4 4.7
Index-linked gilt uplift2 -10.7 -12.6 -2.6 -14.3 -7.4 -10.3
Other gilt accruals 4.3 4.1 4.1 3.9 4.4 4.7
Other expenditure -2.2 -2.5 -3.0 -1.9 -1.6 -1.9
Public sector net cash requirement 28.6 29.6 -4.2 -33.8 40.5 34.8
2 This reconciliation to the public sector net cash requirement does not affect public sector net debt.
£ billion
Forecast
1 Cash payments of interest on student loans are included within 'Student loan repayments', as we cannot easily separate them from
repayments of principal. To prevent double counting, the 'student loan interest' timing effect removes all accrued interest.
123 Economic and fiscal outlook

Fiscal outlook
Table 4.29: Changes in the reconciliation of PSNB and PSNCR
2018-19 2019-20 2020-21 2021-22 2022-23 2023-24
Public sector net borrowing -2.7 -2.4 -5.5 -6.2 -6.4 -6.3
Financial transactions 0.2 -3.6 4.7 4.3 0.7 6.6
of which:
DEL net lending -0.6 -1.0 -0.8 0.0 0.0 0.0
Help to Buy outlays -0.1 -0.4 -0.5 -0.2 -0.2 -
Other housing schemes -0.1 -0.6 -0.5 - - -
Devolved administrations -0.2 0.0 0.0 - - -
Other DEL -0.2 -0.4 -0.2 - - -
Post Spending Review DEL assumption - - - 0.2 0.2 0.0
Allowance for shortfall 0.0 0.3 0.3 0.0 0.0 0.0
Other government net lending -0.1 -0.1 -0.3 0.4 0.4 0.3
Student loan outlays 0.1 0.0 0.0 0.1 0.1 0.1
Student loan repayments1 0.0 0.0 0.1 0.1 0.1 0.4
Loan to Ireland 0.0 0.0 0.0
Scottish Government 0.0 0.0 0.0 0.0 0.0 0.0
UK Export Finance -0.2 -0.2 -0.4 -0.2 0.2 0.1
Other AME 0.0 0.0 -0.1 0.2 -0.2 -0.5
Help to Buy repayments 0.0 0.0 0.1 0.2 0.2 0.3
Sales or purchases of financial assets 4.4 -4.6 0.0 0.1 0.1 0.1
Student loans 0.0 0.0 0.0 0.0 0.0 0.0
RBS shares 0.0 0.0 0.1 0.1 0.1 0.1
UKAR asset sales and rundown 4.4 -4.6 - - - -
Other sales 0.0 0.0 0.0 0.0 0.0 0.0
Bank of England schemes -5.0 0.0 2.1 2.9 0.0 0.7
Cash flow timing effects 1.6 2.2 3.7 1.0 0.2 5.4
Student loan interest1 0.0 -0.5 -0.6 -0.6 -0.4 0.0
Corporation tax -1.5 2.5 2.2 0.3 0.1 0.3
Other receipts 0.5 0.2 0.7 0.5 0.2 -0.3
Index-linked gilt uplift2 2.8 -0.2 1.1 0.4 0.0 5.1
Other gilt accruals -0.2 0.2 0.3 0.3 0.3 0.3
Other expenditure 0.0 0.0 0.0 0.0 0.0 0.0
Public sector net cash requirement -2.5 -6.0 -0.8 -1.9 -5.7 0.3
£ billion
1 Cash payments of interest on student loans are included within 'Student loan repayments', as we cannot easily separate them from
repayments of principal. To prevent double counting, the 'student loan interest' timing effect removes all accrued interest.2 This reconciliation to the public sector net cash requirement does not affect public sector net debt.
Forecast
Economic and fiscal outlook 124
Fiscal outlook
Loans and repayments
Departmental programmes within DEL
4.133 DEL lending programmes are set department by department and subject to multi-year
spending (or lending) limits. The largest of these by far is the Help to Buy: Equity Loan (HtB)
scheme, which is managed within DEL even though it is entirely demand driven. The path of
HtB outlays reflects how the scheme is set to change in future years. In 2021-22 and 2022-
23, eligibility will be more restricted than currently – in particular, only first-time buyers will
be eligible in those years. The Government plans to close the scheme to new loans in 2023-
24. Outlays have been revised down a little since October thanks to lower house prices.
4.134 DEL lending across the main lending departments (BEIS and MHCLG) and the devolved
administrations has also been revised down. We had anticipated such revisions in our
‘allowance for shortfall’ assumption (which relates to the extent to which departments will
lend less than they plan to), so have revised that down in light of these latest plans.
4.135 The Government’s post-Spending Review DEL policy assumption is unchanged from
October – slightly lower Help to Buy outlays therefore create space for higher lending
elsewhere. We have not changed our allowance for shortfall assumption in this period.
Student loans
4.136 Net outlays on student loans raise the net cash requirement relative to net borrowing in
each year of our forecast. Other than policy changes, revisions to the number of new
full-time undergraduate entrants to higher education institutions are generally one of the
biggest drivers of change in our outlays forecast. We continue to expect student entrants to
fall slightly in the 2018-19 academic year, but by less than we assumed in October. This
reflects more entrants than expected in the latest Higher Education Statistics Agency (HESA)
outturn for 2017-18; unexpectedly high acceptance rates by higher education institutions in
the latest UCAS data for 2018-19; and more UCAS applicants by the January 2019
deadline (by which time most undergraduate applications have been made) than would
have been consistent with our October forecast. This generates a modest rise in England
domiciled student entrants in 2019-20, after which trends in the number of 18-year olds in
the population cause entrants to decline again in 2020-21 before growing slowly thereafter.
4.137 In July 2018, the Government announced that EU students entering English universities in
the 2019-20 academic year would “be charged the same tuition fees as UK students” and
able to access financial support “on the same basis as is available today”.21 In the absence
of a stated policy for beyond 2019-20, we assume flat EU student entrants thereafter.
4.138 Net outlays on student loans rise from £15.7 billion in 2018-19 to £19.8 billion in 2023-
24. This is up slightly since October, thanks to the upward revision to student numbers. A
correction to the profile of repayments foregone as a result of the Government’s sales of tranches of the student loan book, and revisions to our economic forecast that affect
repayment levels and fees uprating, also increase net outlays relative to October.
21 HM Government, Further financial support for UK and EU students, July 2018.
125 Economic and fiscal outlook

Fiscal outlook
4.139 In February 2018, the Government announced a review of post-18 education and funding – the ‘Augar review’. Among other things, this will cover “the level, terms and duration” of students’ financial contribution to their post-18 education. After several delays, the review is
now expected to be completed later this year. Any policy changes in response to the review’s recommendations could have significant implications for our student loans forecast.
4.140 Following the ONS’s announcement that it intends to change the accounting treatment of
student loans, we explore the potential impact of its ‘partitioned loan transfer approach’ in
Annex B. This would not change how the cashflows described in this section are accounted
for, but would have significant implications for how and when they are accrued.
Other net lending
4.141 Other net lending includes the phased repayment of a £3.2 billion loan extended to the
Irish Government during the euro area crisis, loan programmes of the Scottish Government
(including Help to Buy (Scotland)), lending by local authorities and UK Export Finance loan
schemes. Additionally, while outlays under Help to Buy in England are recorded within DEL,
the repayments are not so we record them separately here.
4.142 Changes in other lending since October are generally small. The largest are the downward
revision to Help to Buy repayments, due to lower house price inflation, and downward
revisions to the initial years of our UK Export Finance lending forecast, in light of lower-
than-expected lending in the year-to-date and its own slower lending plans.
Sales and purchases of financial assets
4.143 The Government plans to sell several financial assets across the forecast period, raising a
total of £55.2 billion. We only include the proceeds from financial asset sales in our
forecasts when firm details are available that allow the effects to be quantified with
reasonable accuracy and allocated to a specific year. There are several planned sales that
currently meet these criteria (see Chart 4.7). All are subject to uncertainty. We have
assumed that there will be sufficient private-sector demand for the sales to take place and at
a sufficiently attractive price for the transaction to pass the Government’s value for money
criteria and go ahead. Several sales were delayed after the EU referendum vote in 2016.
There is clearly a risk at present that unexpected events could lead to further delays.
4.144 Selling most financial assets will produce an upfront benefit to PSND (and a smaller one to
PSNB via lower interest payments), but reduce future income, lowering interest or dividend
receipts (affecting both PSNB and PSND). Their effect on the broader balance sheet measure
PSNFL, which includes all financial assets not just ‘liquid’ ones, tends to be closer to neutral, since the sales in effect swap one asset for another (e.g. shares for cash). However, in the
case of student loans, and reflecting in part the subsidy element, the sales are at a steep
discount to the face value recorded in PSNFL. Sales therefore swap loan assets for a smaller
sum of cash, increasing PSNFL. The ONS’s proposed student loan accounting changes,
discussed in Annex B, would reduce the extent of these discounts.
Economic and fiscal outlook 126

Fiscal outlook
4.145 In terms of the largest financial asset sales included in our current forecast:
• The Government intends to divest itself of the remaining loan assets held within UK
Asset Resolution (UKAR)22 during 2019-20. A sale that in October we had expected to
complete at the end of 2018-19 is now expected to complete in early 2019-20,
altering the profile of receipts but not materially affecting the overall size.
• We continue to assume that sales of RBS shares recommence in 2019-20 and then
continue across the forecast. Overall proceeds have been revised up £0.3 billion
relative to our October forecast, reflecting share price movements in the interim.
• The Government raised £1.9 billion from sales of Plan 1 student loans in December
2018 as part of its plan to raise £15 billion up to 2022-23. As the December proceeds
were close to the estimate in our October forecast, there is little change to the future
years of the forecast. Details on the next sale are expected later in the year.
Chart 4.7: Proceeds from financial asset sales
0
2
4
6
8
10
12
14
16
18
2018-19 2019-20 2020-21 2021-22 2022-23 2023-24
£ b
illion
RBS shares
Student loans
UKAR asset sales and rundown
Other sales
Source: HM Treasury, OBR
Bank of England schemes
4.146 Since March 2009, the Bank of England’s Monetary Policy Committee (MPC) has deployed unconventional forms of monetary policy to support the economy. The purchase of gilts by
the Asset Purchase Facility (APF) affects PSND, but does not affect the flow measures of
borrowing or the cash requirement. The flows of interest associated with those gilts have a
relatively large effect on public sector debt interest spending and therefore borrowing.
4.147 In our October forecast, market-derived expectations of Bank Rate exceeded 1.5 per cent by
the end of the forecast. Consequently, in line with MPC guidance, we assumed that the APF
22 UK Asset Resolution holds the assets and liabilities of the former Northern Rock Asset Management and Bradford and Bingley.
127 Economic and fiscal outlook
Fiscal outlook
would begin to sell its assets in 2023-24. In this forecast, Bank Rate remains below 1.5 per
cent throughout, so we do not assume any change in asset holdings within the forecast
period. This increases the cash requirement in 2023-24 relative to our October assumption.
4.148 The Bank’s Term Funding Scheme (TFS) remains the largest source of year-to-year
fluctuations in our PSNCR forecast. The scheme extended £127 billion of loans to
commercial banks. Since our October forecast £5.0 billion of them have been repaid early
rather than at the end of their 4-year terms in 2020-21 and 2021-22 – reflecting one large
repayment and one very small one. We have therefore reduced the expected redemptions in
those years by an equivalent amount. In line with the terms and conditions of the scheme
there could be further repayments between now and the term of the remaining loans.
However, since at this stage there is insufficient information to forecast either the size or
timing of any future early repayments, we have treated the 2018 repayments as one-offs
and assumed remaining loans are repaid at their original maturity date.
Timing effects
4.149 To move from PSNB to PSNCR, it is necessary to adjust for expected timing differences
between cash flows and accruals. For example, as taxes are generally paid in arrears, and if
receipts are forecast to rise over time, the cash received each year will generally be lower
than the accrued receipts. The timing difference is large for smaller firms’ corporation tax.
4.150 The largest receipts timing adjustment relates to interest on student loans. This is included in
the accrued measure of public sector current receipts from the point at which the loan is
issued, but cash repayments do not begin until the former students’ income rises above a specific threshold. Much of the accrued interest will eventually be written off rather than
received as cash payments – a ‘fiscal illusion’ within the public sector net borrowing calculation that is due to be addressed later this year (see Annex B). We have revised down
our forecast of this part of the receipts accruals adjustment slightly relative to October.
4.151 Similar timing adjustments are made for spending. The largest relates to index-linked gilts.
This is very sensitive to RPI inflation, as well as to the uneven profile of redemptions from
year to year. Positive RPI inflation raises the amount that governments will have to pay on
index-linked gilts when they are redeemed. This commitment is recognised in PSNB as
accrued debt interest spending each year, but the actual cash payments do not occur until
redemption, which can be decades into the future. This adjustment has a larger negative
impact in most years than it did in our October forecast reflecting changes to our inflation
forecast, partly offset by a reduction in planned index-linked gilt issuance.
4.152 The largest change in our forecast since October relates to corporation tax. The timetable
for larger firms’ corporation tax payments will be brought forward for accounting periods starting from April 2019 onwards, resulting in some companies making five quarterly cash
instalment payments in a single fiscal year. These effects are spread across 2019-20 and
2020-21, reflecting the different accounting periods of the affected firms. These boosts to
cash receipts do not reflect changes in the underlying liabilities that determine the accrued
tax receipts used for PSNB estimates, so they are associated with large negative accruals
Economic and fiscal outlook 128
Fiscal outlook
adjustments in 2019-20 and 2020-21. Relative to our October forecast, the boost to cash
receipts in those two years – and therefore the accruals adjustment – has been revised down
by an average of over £2 billion a year. This reflects large downward revisions to the
proportion of firms assumed to pay corporation tax quarterly and the proportion of those
assumed to be large enough to be affected by the measure (see paragraph 4.35).
Central government net cash requirement
4.153 The central government net cash requirement (CGNCR) is a primary determinant of
government’s net financing requirement. Table 4.30 reconciles CGNCR with PSNCR and
Table 4.31 sets out the changes in this reconciliation since October. The reconciliation
removes transactions associated with local authorities and public corporations from the
PSNCR. Relative to October, the biggest change relates to our revised assumptions
regarding the Bank of England’s monetary policy operations, which affect public corporations’ net cash requirement at the start and middle of the forecast period.
4.154 The classification of Bradford & Bingley (B&B), Northern Rock Asset Management (NRAM)
and Network Rail in the central government sector means that the CGNCR is not simply a
measure of the cash required by the Exchequer to fund its operations, which forms the basis
for the Government’s net financing requirement.23 This has three effects:
• The banks’ own cash requirements are included in the headline CGNCR. Running
down the banks’ loan books (including through asset sales) reduces the CGNCR by £7.4 billion in 2018-19, falling to zero by 2020-21, but this does not directly affect the
Exchequer (this forecast is shown in Table 4.28).
• Interactions between the Exchequer and these bodies net off within the headline
measure. The B&B and NRAM adjustment shows the difference between net cash
received by UKAR and that transferred to central government.
• The Treasury finances Network Rail’s new and maturing debt for a fee. Refinancing needs are estimated at £4.2 billion over the forecast.
23 The Government is publishing revised financing arithmetic for 2018-19 and setting the financing remit for 2019-20 alongside this Spring Statement. The OBR provides the Government with the forecast of the CGNCR for this purpose, but plays no further role in the derivation of the net financing requirement.
129 Economic and fiscal outlook

Fiscal outlook
Table 4.30: Reconciliation of PSNCR and CGNCR
2018-19 2019-20 2020-21 2021-22 2022-23 2023-24
Public sector net cash requirement (NCR) 28.6 29.6 -4.2 -33.8 40.5 34.8
of which:
Local authorities and public corporations NCR 1.8 9.0 -46.5 -70.5 4.3 4.2
Central government (CG) NCR own account 26.8 20.6 42.3 36.7 36.2 30.6
CGNCR own account 26.8 20.6 42.3 36.7 36.2 30.6
Net lending within the public sector 7.3 4.3 4.5 4.7 5.0 5.2
CG net cash requirement 34.0 24.9 46.8 41.4 41.2 35.8
B&B and NRAM adjustment -0.8 -0.5 0.0 0.0 0.0 0.0
Network Rail adjustment 0.8 -0.6 0.4 -0.3 -0.5 0.7CGNCR ex. B&B, NRAM and Network Rail 34.0 23.7 47.2 41.2 40.7 36.6
£ billion
Forecast
Table 4.31: Changes in the reconciliation of PSNCR and CGNCR
2018-19 2019-20 2020-21 2021-22 2022-23 2023-24
Public sector net cash requirement (NCR) -2.5 -6.0 -0.8 -1.9 -5.7 0.3
of which:
Local authorities and public corporations NCR -4.7 1.8 2.8 2.5 -1.1 -1.2
Central government (CG) NCR own account 2.3 -7.8 -3.6 -4.4 -4.6 1.5
CGNCR own account 2.3 -7.8 -3.6 -4.4 -4.6 1.5
Net lending within the public sector 3.0 1.4 1.7 1.9 2.1 2.4
CG net cash requirement 5.3 -6.4 -1.9 -2.5 -2.4 3.9
B&B and NRAM adjustment -2.5 2.5 0.0 0.0 0.0 0.0
Network Rail adjustment 0.0 0.0 0.0 0.0 0.0 0.0
CGNCR ex. B&B, NRAM and Network Rail 2.9 -3.9 -1.9 -2.5 -2.4 3.9
Forecast
£ billion
Balance sheet aggregates
4.155 Our central forecast for public sector balance sheet aggregates incorporates the forecasts
for PSNB and financial transactions set out earlier in this chapter. In this section we explain
the changes in several balance sheet aggregates:
• Public sector net debt: a stock measure of public sector indebtedness defined as its
gross liabilities minus its liquid financial assets, measured on a cash basis. It is the
stock equivalent of the PSNCR, so depends on both our PSNB and financial
transactions forecasts. It is used for the Government’s supplementary fiscal target.
• Public sector net debt excluding the Bank of England: by removing the Bank’s balance sheet from the headline measure, this abstracts from the uneven effect across years of
the Bank’s post-referendum package of monetary policy measures.
• Public sector net financial liabilities: a broader balance sheet measure that includes all
financial assets and liabilities recorded in the National Accounts. For the most part, it is
the stock equivalent of PSNB.
Economic and fiscal outlook 130
Fiscal outlook
Public sector net debt
4.156 Table 4.32 shows the sources of year-on-year changes in PSND between 2018-19 and
2023-24. In addition to PSNB and financial transactions, the level of debt can be affected
by changes in the valuation of existing assets and liabilities that make up PSND or in the
classification of bodies into or out of the public sector. The main effects in our forecast are:
• The large gilt premia associated with low gilt yields (including negative real yields)
relative to the coupons paid on the gilts. This is particularly pronounced for index-
linked gilts. As PSND rises by the nominal value of gilts issued, rather than their market
value, selling at a premium reduces the recorded impact on debt.
• Index-linked gilts are recorded at their uplifted nominal value in PSND, so positive RPI
inflation adds to PSND each year but does not affect the PSNCR until the gilts redeem.
• Differences between the nominal and purchase value of gilts held by the Bank of
England’s Asset Purchase Facility (APF) add to net debt. This changes little in most
years, but is material in 2021-22 when several gilts that the APF holds are due to
redeem. We assume they will be rolled over for gilts of higher nominal value.
• A weaker pound increases the value of the unhedged component of the international
reserves that are netted off PSND in 2018-19.
• The reclassification of Scottish and Welsh housing associations causes a step change
down in 2018-19. In later years the reclassification affects PSNCR and PSND equally.
4.157 Cash borrowing as measured by the PSNCR adds to the stock of debt at the start and the
end of the forecast, but reduces it in 2020-21 and 2021-22 when there is a cash surplus
generated by the redemption of the Bank of England’s Term Funding Scheme (TFS) loans.
TFS loans are the prime driver of the uneven path of PSND over the forecast.
4.158 Valuation changes also have an uneven profile – in particular as regards the inflation uplift
in the value of index-linked gilts.
131 Economic and fiscal outlook
Fiscal outlook
Table 4.32: Year-on-year change in public sector net debt
2018-19 2019-20 2020-21 2021-22 2022-23 2023-24
Level of PSND 1803 1838 1828 1796 1838 1878
Year-on-year change in PSND 24.5 34.8 -10.3 -32.0 42.3 39.9
of which:
Due to public sector net cash requirement 28.6 29.6 -4.2 -33.8 40.5 34.8
Public sector net borrowing 22.8 29.3 21.2 17.6 14.4 13.5
Financial transactions 5.8 0.3 -25.4 -51.5 26.0 21.3
Due to valuation changes 1.9 5.2 -6.1 1.9 1.9 5.1
Gilt premia -5.8 -8.1 -9.3 -7.2 -6.3 -5.6
Asset Purchase Facility gilt premia 1.1 0.3 0.5 -5.4 0.7 0.3
Index-linked gilts uplift 10.7 12.6 2.6 14.3 7.4 10.3
International reserves -4.0 0.5 0.2 0.1 0.1 0.1
Due to classification changes -6.0 0.0 0.0 0.0 0.0 0.0
£ billion
Forecast
Changes to public sector net debt
4.159 Our latest PSND forecast has been revised down in all years relative to our October
forecast, by steadily increasing amounts that reach 1.1 per cent of GDP in 2023-24.
4.160 We have revised down our pre-measures forecast due to:
• Modestly higher nominal GDP, which reduces the debt-to-GDP ratio slightly from
2020-21 onwards.
• The downward revisions to our pre-measures forecast for public sector net borrowing
reduce cash debt and the debt-to-GDP ratio by progressively larger amounts. This is
the largest source of change to our debt forecast since October.
• Upward revisions to our pre-measures financial transactions forecast, mainly due to
changes related to the timing of onshore corporation tax payments.
• Early redemptions in the Term Funding Scheme reduce debt at the start of the forecast
but this unwinds by 2021-22. Higher gilt prices and the assumption that the APF no
longer sells any assets within the forecast period increasingly add to debt.
4.161 As regards Government policy decisions, a short delay to a large UK Asset Resolution
(UKAR) asset sale increases debt in 2018-19 but this unwinds in 2019-20, after which the
effects of lower departmental spending dominate.
Economic and fiscal outlook 132
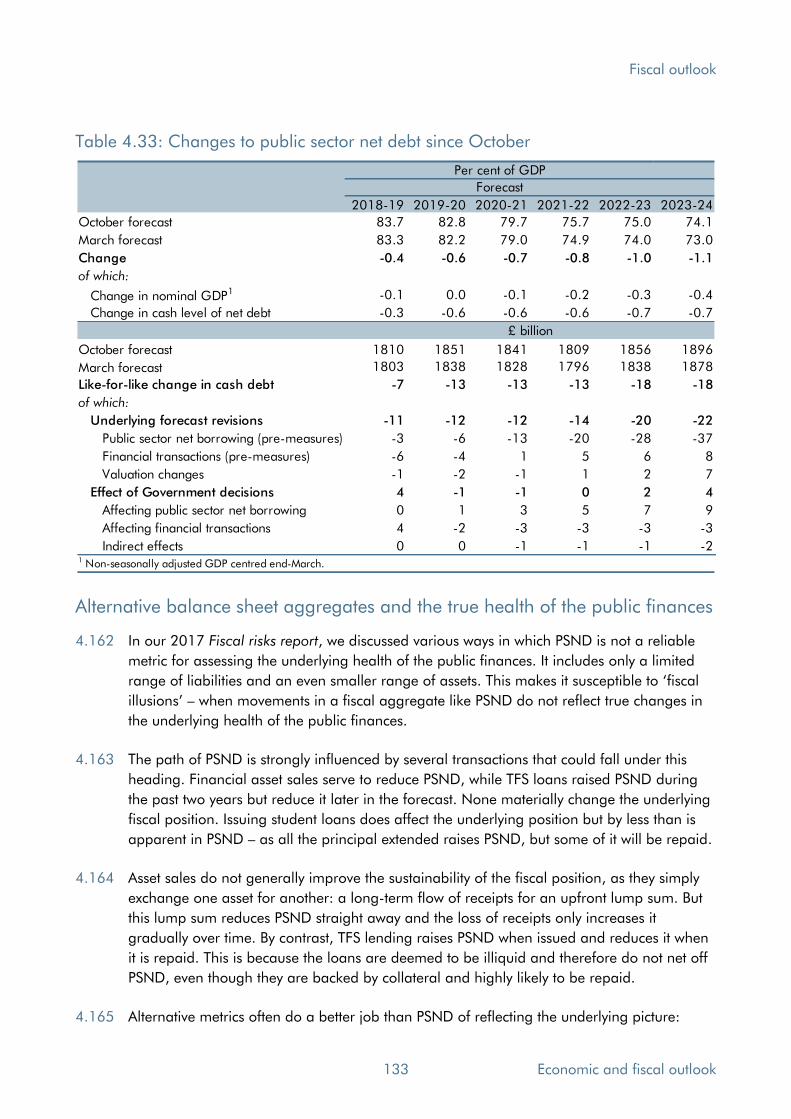
Fiscal outlook
Table 4.33: Changes to public sector net debt since October
2018-19 2019-20 2020-21 2021-22 2022-23 2023-24
October forecast 83.7 82.8 79.7 75.7 75.0 74.1
March forecast 83.3 82.2 79.0 74.9 74.0 73.0
Change -0.4 -0.6 -0.7 -0.8 -1.0 -1.1
of which:
Change in nominal GDP1 -0.1 0.0 -0.1 -0.2 -0.3 -0.4
Change in cash level of net debt -0.3 -0.6 -0.6 -0.6 -0.7 -0.7
October forecast 1810 1851 1841 1809 1856 1896
March forecast 1803 1838 1828 1796 1838 1878
Like-for-like change in cash debt -7 -13 -13 -13 -18 -18
of which:
Underlying forecast revisions -11 -12 -12 -14 -20 -22
Public sector net borrowing (pre-measures) -3 -6 -13 -20 -28 -37
Financial transactions (pre-measures) -6 -4 1 5 6 8
Valuation changes -1 -2 -1 1 2 7
Effect of Government decisions 4 -1 -1 0 2 4
Affecting public sector net borrowing 0 1 3 5 7 9
Affecting financial transactions 4 -2 -3 -3 -3 -3
Indirect effects 0 0 -1 -1 -1 -21 Non-seasonally adjusted GDP centred end-March.
Per cent of GDP
Forecast
£ billion
Alternative balance sheet aggregates and the true health of the public finances
4.162 In our 2017 Fiscal risks report, we discussed various ways in which PSND is not a reliable
metric for assessing the underlying health of the public finances. It includes only a limited
range of liabilities and an even smaller range of assets. This makes it susceptible to ‘fiscal
illusions’ – when movements in a fiscal aggregate like PSND do not reflect true changes in
the underlying health of the public finances.
4.163 The path of PSND is strongly influenced by several transactions that could fall under this
heading. Financial asset sales serve to reduce PSND, while TFS loans raised PSND during
the past two years but reduce it later in the forecast. None materially change the underlying
fiscal position. Issuing student loans does affect the underlying position but by less than is
apparent in PSND – as all the principal extended raises PSND, but some of it will be repaid.
4.164 Asset sales do not generally improve the sustainability of the fiscal position, as they simply
exchange one asset for another: a long-term flow of receipts for an upfront lump sum. But
this lump sum reduces PSND straight away and the loss of receipts only increases it
gradually over time. By contrast, TFS lending raises PSND when issued and reduces it when
it is repaid. This is because the loans are deemed to be illiquid and therefore do not net off
PSND, even though they are backed by collateral and highly likely to be repaid.
4.165 Alternative metrics often do a better job than PSND of reflecting the underlying picture:
133 Economic and fiscal outlook
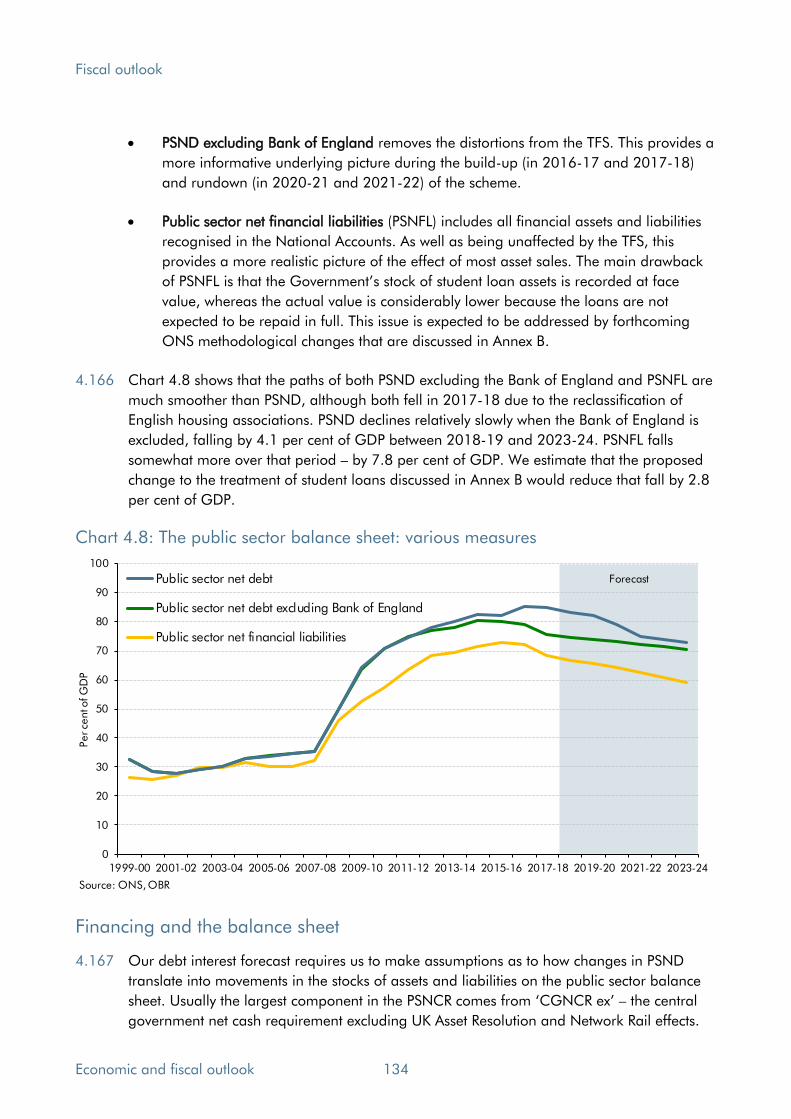
Fiscal outlook
• PSND excluding Bank of England removes the distortions from the TFS. This provides a
more informative underlying picture during the build-up (in 2016-17 and 2017-18)
and rundown (in 2020-21 and 2021-22) of the scheme.
• Public sector net financial liabilities (PSNFL) includes all financial assets and liabilities
recognised in the National Accounts. As well as being unaffected by the TFS, this
provides a more realistic picture of the effect of most asset sales. The main drawback
of PSNFL is that the Government’s stock of student loan assets is recorded at face
value, whereas the actual value is considerably lower because the loans are not
expected to be repaid in full. This issue is expected to be addressed by forthcoming
ONS methodological changes that are discussed in Annex B.
4.166 Chart 4.8 shows that the paths of both PSND excluding the Bank of England and PSNFL are
much smoother than PSND, although both fell in 2017-18 due to the reclassification of
English housing associations. PSND declines relatively slowly when the Bank of England is
excluded, falling by 4.1 per cent of GDP between 2018-19 and 2023-24. PSNFL falls
somewhat more over that period – by 7.8 per cent of GDP. We estimate that the proposed
change to the treatment of student loans discussed in Annex B would reduce that fall by 2.8
per cent of GDP.
Chart 4.8: The public sector balance sheet: various measures
Forecast
0
10
20
30
40
50
60
70
80
90
100
1999-00 2001-02 2003-04 2005-06 2007-08 2009-10 2011-12 2013-14 2015-16 2017-18 2019-20 2021-22 2023-24
Per ce
nt o
f G
DP
Public sector net debt
Public sector net debt excluding Bank of England
Public sector net financial liabilities
Source: ONS, OBR
Financing and the balance sheet
4.167 Our debt interest forecast requires us to make assumptions as to how changes in PSND
translate into movements in the stocks of assets and liabilities on the public sector balance
sheet. Usually the largest component in the PSNCR comes from ‘CGNCR ex’ – the central
government net cash requirement excluding UK Asset Resolution and Network Rail effects.
Economic and fiscal outlook 134

Fiscal outlook
4.168 At each Budget and Spring Statement, the Government specifies how it intends to finance
CGNCR ex in the ‘financing remit’.24 Alongside this Spring Statement the Government has
published revised financing arithmetic for 2018-19 and initial plans for the financing remit
for 2019-20. It also reports the level of gilts redeeming and any plans for additional
financing of the foreign exchange reserves. After adjusting for any under or over-financing
from the previous year, this determines the gross financing requirement.
4.169 The Government usually meets most of its gross financing requirement by issuing gilts.25 The
rest is met via changes to the stock of Treasury bills, from NS&I products (such as premium
bonds) or from other sources (such as the DMO’s cash position).
4.170 As Table 4.34 shows, 93 per cent of the 2018-19 gross financing requirement is expected
to be met by issuing gilts – 72 per cent from conventional gilts and 22 per cent from index-
linked gilts. The share of index-linked gilts falls to 18 per cent in 2019-20, in line with the
Government’s latest stated plans. We have based our forecast on a 1.5 percentage point a
year decline thereafter, reaching 14.7 per cent of all gilt issuance in 2023-24.
Table 4.34: Total gross financing
2018-19 2019-20 2020-21 2021-22 2022-23 2023-24
Central government net cash requirement1 34.0 23.7 47.2 41.2 40.7 36.6
Gilt redemptions 66.7 98.9 97.6 79.3 73.3 71.8
Financing for the reserves 6.0 6.0 0.0 0.0 0.0 0.0
Change in DMO cash position2 -1.4 0.5 0.0 0.0 0.0 0.0
Total gross financing 105.4 129.2 144.8 120.5 114.0 108.3
of which:
Conventional gilts 76.4 90.5 109.8 91.8 88.2 84.9
Index-linked gilts 21.5 23.6 26.1 19.7 17.0 14.6
Treasury bills -4.0 4.0 0.0 0.0 0.0 0.0
NS&I 11.0 11.0 9.0 9.0 9.0 9.0
Other central government 0.0 0.0 -0.1 -0.1 -0.2 -0.21 Excluding Northern Rock, Bradford and Bingley, and Network Rail.2 Change in Debt Management Office cash position.
£ billion
Forecast
4.171 Table 4.35 shows how we expect the public sector’s debt liabilities and liquid financial
assets to evolve over the forecast.26 The table is presented in line with that used by the ONS
in the monthly public sector finances release: general government and non-financial public
corporations are presented gross, but the Bank of England is shown only on a net basis.
4.172 We forecast public sector gross debt liabilities to fall by 5.4 per cent of GDP over the
forecast. In terms of financing instrument, the largest contributor to this decline is the 4.2
per cent of GDP reduction in the stock of index-linked gilts, reflecting the Government’s announcement in last year’s Budget that it would reduce their share in total issuance.
24 HM Treasury, Debt management report 2018-19, 2019. 25 The financing remit does not allocate all gilt issuance (leaving the DMO with some flexibility through the year), so we assume that the unallocated portion will ultimately be allocated in proportion to announced sales. We also assume that changes in the DMO’s net cash position are met entirely by reductions in its assets. 26 A similar table for PSNFL assets and liabilities is presented in the supplementary fiscal tables accompanying this forecast.
135 Economic and fiscal outlook

Fiscal outlook
4.173 The Government has increased its gross stock of foreign exchange reserves significantly
over the fiscal year to date, from £115.5 billion in March 2018 to £134.7 billion in January
2019 and we expect this to rise further to £140.9 billion by the end of the year. Some of this
increase in assets has come from exchange rate movements or from retained income and
reduces net debt. But the Government will have had to finance the remaining increase, so
this portion of the gross rise will be matched by a gross rise in liabilities and will therefore
not affect net debt. Some £6 billion of this reflects borrowing via the financing remit (and
therefore mainly increases gilt liabilities in Table 4.35) in line with stated Government policy
in recent years. The remainder has been financed via the reserves account (included in
‘other government liabilities’ in the table). As this is in excess of the Government’s stated plans we assume this portion is temporary and reverses in 2019-20.
4.174 The Bank of England’s net contribution to debt falls sharply between 2019-20 and 2021-22
as loans issued under the TFS are assumed to be repaid.
Table 4.35: The composition of public sector net debt
2018-19 2019-20 2020-21 2021-22 2022-23 2023-24
Public sector debt liabilities2 (a) 84.3 82.6 81.6 80.9 79.8 78.7
of which:
Conventional gilts 48.4 46.8 46.1 45.0 44.6 44.1
Index-linked gilts 19.8 20.1 19.9 20.4 19.8 19.3
T-bills 2.8 2.9 2.8 2.7 2.6 2.5
NS&I 7.7 8.0 8.1 8.2 8.3 8.3
Other central government 4.4 3.6 3.4 3.3 3.2 3.1
Local government3 1.1 1.1 1.1 1.2 1.2 1.3
Non-financial public corporations4 (b) 0.1 0.1 0.1 0.1 0.1 0.1
Public sector liquid assets2 (c) 9.5 8.7 8.4 8.5 8.2 8.1
of which:
Reserves 6.5 5.9 5.7 5.5 5.4 5.2
Other central government 1.5 1.4 1.3 1.2 1.2 1.1
Local government3 1.2 1.0 0.9 1.0 1.0 1.1
Non-financial public corporations4 0.4 0.4 0.4 0.7 0.7 0.6
Bank of England net contribution (d) 8.5 8.3 5.8 2.5 2.4 2.3
Public sector net debt (PSND) (a-c+d) 83.3 82.2 79.0 74.9 74.0 73.0Memo: PSND excluding Bank of England (a-c) 74.8 73.9 73.2 72.4 71.6 70.7
Memo: general government gross debt (a-b) 84.2 82.5 81.4 80.7 79.7 78.61 Non-seasonally adjusted GDP centred end-March.2 Excluding the Bank of England.3 Net of debt liabilities / liquid assets held by central government.4 Net of debt liabilities / liquid assets held by central and local government.
Per cent of GDP1
5 Largely reserves issued to fund TFS loans and the APF's corporate bond purchases, plus premia on the APF's conventional gilt
holdings.
Forecast
Economic and fiscal outlook 136
Fiscal outlook
Financial sector interventions
4.175 Table 4.36 updates our estimate of the net direct effect on the public finances of the
Government’s interventions in the financial sector during the financial crisis and subsequent
recession. This is not an attempt to quantify their overall effect on the public finances relative
to a counterfactual where the Government had not intervened as the crisis unfolded. The
costs of the crisis would almost certainly have been much greater in the absence of direct
interventions to restore the financial system to stability.27
4.176 In total, £136.6 billion was disbursed by the Treasury during and following the crisis. By
mid-February 2019, principal repayments had amounted to £95.0 billion, up slightly
relative to October, reflecting ongoing repayments from UKAR. This has fed through to a
smaller net cash shortfall of £19.4 billion.
4.177 As of mid-February, the Treasury was still owed £2.3 billion from loans (almost entirely by
UKAR). The value of its RBS shares had fallen to £18.2 billion,28 from the £20.3 billion
recorded in our October EFO, while the Treasury’s holdings in UKAR had an equity book value of around £8.5 billion. If the Treasury were to receive all loan payments in full, and to
sell its remaining shares at their mid-February values, it would realise an overall cash
surplus of £9.7 billion.
4.178 The cash surplus estimate excludes, however, the costs to the Treasury of financing these
interventions. If all interventions are assumed to have been financed through gilts, at the
then prevailing market rates, the Treasury estimates that the additional debt interest costs
would have amounted to £37.0 billion by February, mainly due to the costs associated with
RBS and UKAR.29 This is slightly higher than our October estimate, partly reflecting four
more months servicing debt on interventions yet to be repaid or sold. Together this implies
an overall cost of £27.3 billion to the Government (1.7 per cent of 2008-09 GDP), £2.8
billion higher than we estimated in October.
27 We discussed the fiscal implications of financial crises in Chapter 4 of our 2017 Fiscal risks report. 28 The RBS share price is an average over the 10 days to 14 February, consistent with other market-derived assumptions in our forecast. 29 The debt interest costs (or savings) associated with interventions that yield an overall deficit (or surplus) continue beyond the point the intervention itself has been wound up. This is the ‘Exchequer financing’ metric recorded in Table 4.36. In response to user requests, we now also report the split between financing costs up to the close of the intervention and those subsequently in a footnote to the table.
137 Economic and fiscal outlook

Fiscal outlook
Table 4.36: Gross and net cash flows of financial sector interventions
Lloyds RBS UKAR1 FSCS1 CGS1 SLS1 Other TotalChange since
October2
Cash outlays -20.5 -45.8 -44.1 -20.9 0.0 0.0 -5.3 -136.6 0.0
Principal repayments 21.1 6.3 41.4 20.9 0.0 0.0 5.3 95.0 1.8
Other fees received3 3.2 4.3 4.4 3.5 4.3 2.3 0.3 22.2 0.3
Net cash position 3.8 -35.2 1.8 3.5 4.3 2.3 0.2 -19.4 2.0
Outstanding payments 0.0 0.0 2.3 0.0 0.0 0.0 0.1 2.3 -1.8
Market value4 0.0 18.2 8.5 0.0 0.0 0.0 0.0 26.8 -2.1
Implied balance 3.8 -17.0 12.6 3.5 4.3 2.3 0.3 9.7 -1.8
Exchequer financing5 -4.0 -14.0 -12.1 -7.7 1.1 0.3 -0.5 -37.0 -1.0
Overall balance -0.2 -31.0 0.4 -4.2 5.4 2.6 -0.2 -27.3 -2.8Memo: changes in overall
balance since October 2 -0.1 -2.4 -0.3 -0.1 0.0 0.0 0.0 -2.8
2 October EFO figures were consistent with end-September data.3 Fees relating to the asset protection scheme and contingent capital facility are included within the RBS figures.4 UKAR is book value of equity, derived from its accounts published 31 March 2018 (value up to date 26 February 2019).
While open -3.7 -14.0 -12.1 -7.6 0.3 0.0 -0.5 -37.6
After close -0.3 -0.1 0.8 0.3 0.6
1 These are UK Asset Resolution (UKAR), which manages holdings in Bradford & Bingley and Northern Rock Asset Management plc.,
the Financial services compensation scheme (FSCS), Credit Guarantee Scheme (CGS), and Special Liquidity Scheme (SLS).
5 This can be split into financing while the intervention was open and after it closed (or after the final payment was received): Lloyds
closed in May 2017, FSCS closed in October 2018, CGS closed in November 2012, and SLS closed in April 2012.
£ billion
Economic and fiscal outlook 138
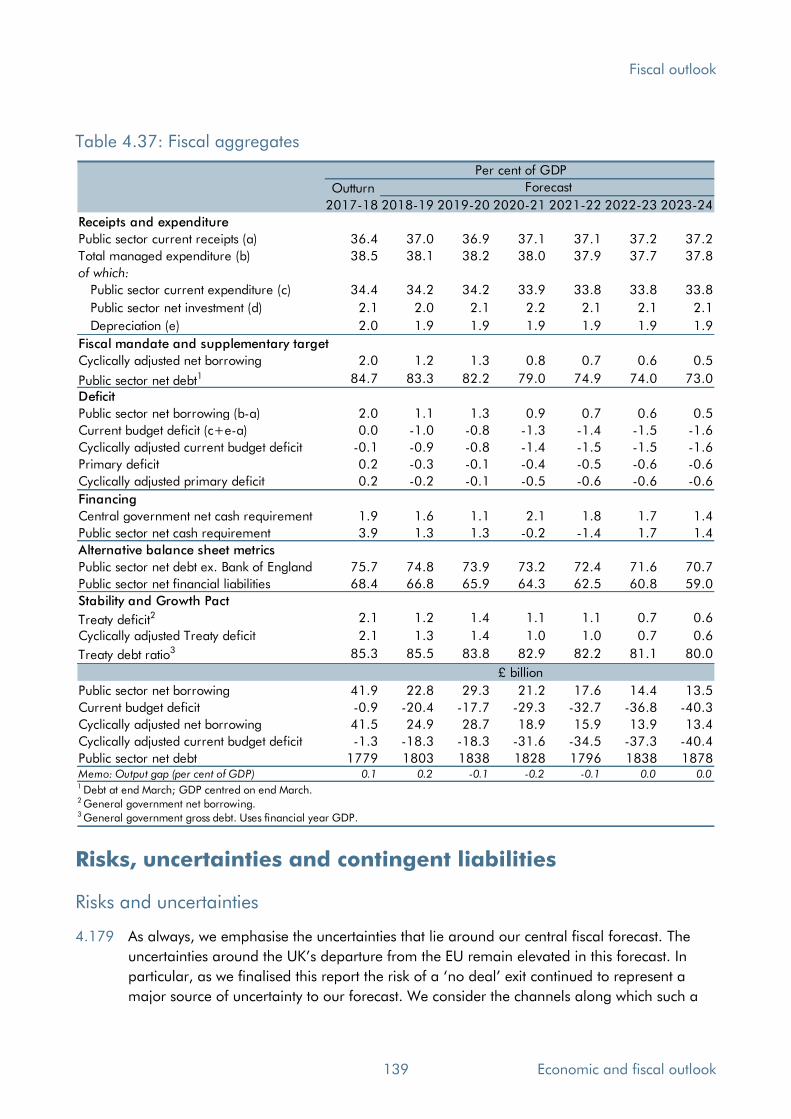
Fiscal outlook
Table 4.37: Fiscal aggregates
Outturn
2017-18 2018-19 2019-20 2020-21 2021-22 2022-23 2023-24
Receipts and expenditure
Public sector current receipts (a) 36.4 37.0 36.9 37.1 37.1 37.2 37.2
Total managed expenditure (b) 38.5 38.1 38.2 38.0 37.9 37.7 37.8
of which:
Public sector current expenditure (c) 34.4 34.2 34.2 33.9 33.8 33.8 33.8
Public sector net investment (d) 2.1 2.0 2.1 2.2 2.1 2.1 2.1
Depreciation (e) 2.0 1.9 1.9 1.9 1.9 1.9 1.9
Fiscal mandate and supplementary target
Cyclically adjusted net borrowing 2.0 1.2 1.3 0.8 0.7 0.6 0.5
Public sector net debt1 84.7 83.3 82.2 79.0 74.9 74.0 73.0
Deficit
Public sector net borrowing (b-a) 2.0 1.1 1.3 0.9 0.7 0.6 0.5
Current budget deficit (c+e-a) 0.0 -1.0 -0.8 -1.3 -1.4 -1.5 -1.6
Cyclically adjusted current budget deficit -0.1 -0.9 -0.8 -1.4 -1.5 -1.5 -1.6
Primary deficit 0.2 -0.3 -0.1 -0.4 -0.5 -0.6 -0.6
Cyclically adjusted primary deficit 0.2 -0.2 -0.1 -0.5 -0.6 -0.6 -0.6
Financing
Central government net cash requirement 1.9 1.6 1.1 2.1 1.8 1.7 1.4
Public sector net cash requirement 3.9 1.3 1.3 -0.2 -1.4 1.7 1.4
Alternative balance sheet metrics
Public sector net debt ex. Bank of England 75.7 74.8 73.9 73.2 72.4 71.6 70.7
Public sector net financial liabilities 68.4 66.8 65.9 64.3 62.5 60.8 59.0
Stability and Growth Pact
Treaty deficit2 2.1 1.2 1.4 1.1 1.1 0.7 0.6
Cyclically adjusted Treaty deficit 2.1 1.3 1.4 1.0 1.0 0.7 0.6
Treaty debt ratio3 85.3 85.5 83.8 82.9 82.2 81.1 80.0
Public sector net borrowing 41.9 22.8 29.3 21.2 17.6 14.4 13.5
Current budget deficit -0.9 -20.4 -17.7 -29.3 -32.7 -36.8 -40.3
Cyclically adjusted net borrowing 41.5 24.9 28.7 18.9 15.9 13.9 13.4
Cyclically adjusted current budget deficit -1.3 -18.3 -18.3 -31.6 -34.5 -37.3 -40.4
Public sector net debt 1779 1803 1838 1828 1796 1838 1878Memo: Output gap (per cent of GDP) 0.1 0.2 -0.1 -0.2 -0.1 0.0 0.01 Debt at end March; GDP centred on end March.2 General government net borrowing.3 General government gross debt. Uses financial year GDP.
Per cent of GDP
Forecast
£ billion
Risks, uncertainties and contingent liabilities
Risks and uncertainties
4.179 As always, we emphasise the uncertainties that lie around our central fiscal forecast. The
uncertainties around the UK’s departure from the EU remain elevated in this forecast. In
particular, as we finalised this report the risk of a ‘no deal’ exit continued to represent a
major source of uncertainty to our forecast. We consider the channels along which such a
139 Economic and fiscal outlook
Fiscal outlook
scenario might affect the public finances in Chapter 5 and provided a broader discussion of
how Brexit-related risks might affect our forecast in a recent discussion paper.30
4.180 We expose our judgements to various sensitivities in Chapter 5. Several of the risks we
highlighted in our 2017 FRR remain key sources of uncertainty around our central forecast:
• Macroeconomic risks: such as risks to potential output growth from productivity and
migratory flows and the risks from shocks, such as the pound falling sharply given the
large current account deficit or as a result of a disorderly Brexit.
• Financial sector risks: the UK remains home to one of the world’s largest financial
sectors, both in absolute terms and relative to the size of the economy. The fiscal risks
that can be associated with this have been illustrated clearly over the past decade.
• Revenue-specific risks: our FRR highlighted potential pressures on the sustainability of
various tax bases. One issue we considered was the concentration of some receipts
streams on a small proportion of the tax base. Part of the reason for revising up
income tax and NICs receipts in this forecast relates to earnings growth among the
small number of taxpayers at the very top of the earnings distribution. This relative
strength could be reversed or repeated at some point in the future.
• Primary spending risks (i.e. spending on everything other than debt interest): in the
FRR, we noted how pressures can build and the risk of higher borrowing if they are
accommodated. The Government addressed some of these pressures via a multi-
billion pound settlement for the NHS in October, but has already chosen to top that up
in light of higher inflation. The risk of further such policy changes remains.
• Balance sheet risks: these can relate to real-world events or statistical changes. The
ONS review of the recording of public sector pension funds remains a potential source
of risk to the measured balance sheet aggregates in this forecast.
• Debt interest risks: in the FRR we flagged how greater index-linked gilts issuance had
increased the sensitivity of debt interest spending to inflation shocks. The Government’s initial financing plans for 2019-20 further reduce the share of borrowing financed via
index-linked gilts to 18 per cent (down from 26 per cent in 2017-18).
• Policy delays and reversals: in recent years, several tax rises and welfare spending cuts
have subsequently been reversed or delayed. In Annex A, we summarise those that
have affected this forecast.
4.181 Two legal processes initiated by the European Commission represent sources of risk to our
fiscal forecast. The first relates to the Commission’s contention that it has lost around €2 billion of customs revenue, after deducting notional collection costs (but before adding on
any potential late payment interest costs), as a result of the UK failing to enforce checks
30 OBR, Discussion paper No. 3: Brexit and the OBR's forecasts, October 2018.
Economic and fiscal outlook 140
Fiscal outlook
against customs fraud. If the Commission is not satisfied with the UK’s response it may seek
court proceedings against the UK. The second regards the UK’s application of a zero rate of VAT to certain derivative transactions. On this issue, the Commission has now referred the
UK to the European Court of Justice.
Contingent liabilities
Regular update
4.182 We have as usual asked the Treasury to identify any changes to future contingent liabilities
since our October forecast. Its dedicated reporting system noted 11 were entered into over
that period or soon to be entered into, with a total maximum exposure of £5.5 billion for
those that can be quantified. We have reviewed these and do not consider any to represent
a material increase in the fiscal risk to which the public sector is exposed.
4.183 The Treasury’s 2017-18 departmental accounts disclose an unquantifiable remote
contingent liability in respect of the UK’s decision to leave the European Union and the
Article 50 process. The Treasury has informed us that this has not changed.
4.184 On 20 December 2018, the Court of Appeal ruled that the Government’s transitional
pension arrangements offered to some judges and firefighters amounted to unlawful
discrimination. The Chief Secretary to the Treasury announced this could cost around £4
billion a year if extended to all applicable public service pension schemes.31 The
Government has challenged the Court of Appeal’s decision. We asked the Treasury whether this was being treated as a contingent liability. It explained that schemes have made
provisions of £29.5 billion in respect of a potential increase in liabilities. If the Government
were to lose its appeal, the Treasury would not expect that to affect scheme contribution
rates until beyond the period to 2023 for which they are currently in the process of being
set. As such, this case represents a longer-term fiscal risk rather than one that would be
likely to affect the public finances within our current forecast horizon.
Assurances provided to Nissan in 2016 and recently reversed
4.185 Ahead of our November 2016 EFO, we asked the Treasury “What if any new contingent
liabilities have been created in respect of Government assurances provided to Nissan? If new
contingent liabilities have been created, which department’s accounts do you expect them to be reported in and how?”. The Treasury declined to address the substance of our question
and told us “There is a standard process for departments to report to Parliament as and
when they incur contingent liabilities. Any commitments incurring costs will be managed
within existing overall DEL totals.”
4.186 On 4 February 2019, the Secretary of State for Business, Energy and Industrial Strategy
(BEIS) published a letter addressed to Nissan and dated 21 October 2016.32 It referenced a
package of support of up to £80 million that was described as being subject to business
31 Chief Secretary to the Treasury, Pensions: Written statement - HCWS1286, January 2019. 32 Department for Business, Energy & Industrial Strategy, Nissan’s investment in the UK, February 2019.
141 Economic and fiscal outlook

Fiscal outlook
cases being developed and also “contingent… on a positive decision by the Nissan Board” to allocate the production of two of Nissan’s vehicle types at its Sunderland plant. We have
since asked the Treasury how its response to us in November 2016 was consistent with the
Secretary of State’s letter to Nissan and the OBR’s right of access to information under the Budget Responsibility and National Audit Act 2011.
4.187 The Treasury told us that “The decision as to whether government assurances regarding
Nissan are classified as a contingent liability is the responsibility of the BEIS accounting
officer.”
4.188 We followed this up with BEIS, who told us that “The BEIS accounting officer is responsible
for assessing whether contingent liabilities are created by the department. This assessment is
done with reference to standards in ‘Managing Public Money’ and International Accounting
Standard 37 (Provisions, Contingent Liabilities and Contingent Assets). Observing these
standards, the accounting officer judged that the department’s letter to Nissan dated 21
October 2016 did not create a contingent liability because no present obligation was
created by the letter. The accounting officer’s judgement on this matter was reviewed and
endorsed by the National Audit Office in December 2016, and subsequently in its external
audit of the BEIS Annual Report and Accounts 2016-17.”
4.189 This appears consistent with the view stated by the Comptroller and Auditor General in
2016 when he was asked by the Treasury Select Committee to review these assurances,
which at the time were not in the public domain. This seems to be an artefact of the
Treasury’s Managing Public Money guidance to which BEIS refer, since an offer to make a
payment that is contingent on a specific decision might reasonably be considered a
‘contingent liability’ in a broader sense.
International comparisons
4.190 International organisations, such as the European Commission and the International
Monetary Fund (IMF), produce forecasts of deficit and debt levels of different countries on a
comparable basis. These are based on the narrower general government definitions of debt
and borrowing than the public sector definition that we focus on. They are also presented
on a calendar year basis. To facilitate comparisons, Tables 4.38 and 4.39 convert our UK
forecasts to a basis that is comparable with that used by these international organisations.
With both modelling and reporting of much tax and expenditure in the UK carried out
primarily on a fiscal year basis, the calendar year forecasts are illustrative and have been
derived by simply weighting our fiscal year forecasts.
Economic and fiscal outlook 142
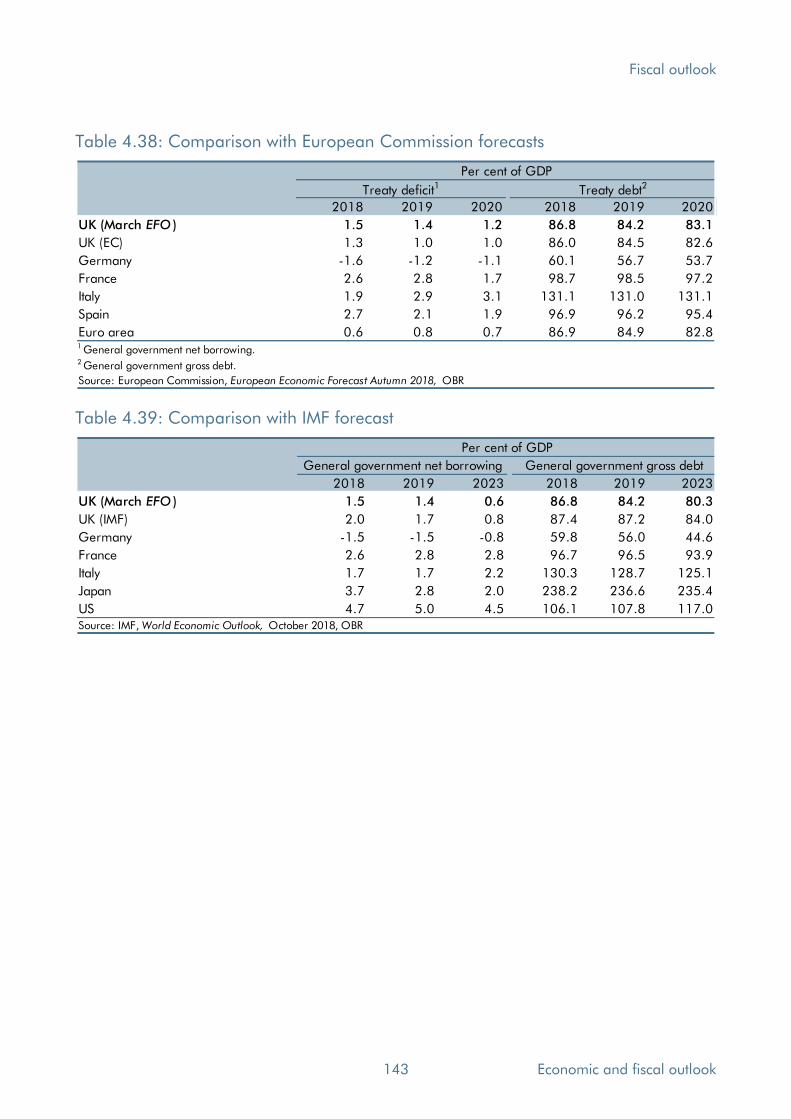
Fiscal outlook
Table 4.38: Comparison with European Commission forecasts
2018 2019 2020 2018 2019 2020
UK (March EFO ) 1.5 1.4 1.2 86.8 84.2 83.1
UK (EC) 1.3 1.0 1.0 86.0 84.5 82.6
Germany -1.6 -1.2 -1.1 60.1 56.7 53.7
France 2.6 2.8 1.7 98.7 98.5 97.2
Italy 1.9 2.9 3.1 131.1 131.0 131.1
Spain 2.7 2.1 1.9 96.9 96.2 95.4
Euro area 0.6 0.8 0.7 86.9 84.9 82.81 General government net borrowing.2 General government gross debt.
Source: European Commission, European Economic Forecast Autumn 2018, OBR
Per cent of GDP
Treaty deficit1 Treaty debt2
Table 4.39: Comparison with IMF forecast 6
2018 2019 2023 2018 2019 2023
UK (March EFO ) 1.5 1.4 0.6 86.8 84.2 80.3
UK (IMF) 2.0 1.7 0.8 87.4 87.2 84.0
Germany -1.5 -1.5 -0.8 59.8 56.0 44.6
France 2.6 2.8 2.8 96.7 96.5 93.9
Italy 1.7 1.7 2.2 130.3 128.7 125.1
Japan 3.7 2.8 2.0 238.2 236.6 235.4
US 4.7 5.0 4.5 106.1 107.8 117.0
Per cent of GDP
General government net borrowing General government gross debt
Source: IMF, World Economic Outlook, October 2018, OBR
143 Economic and fiscal outlook

Economic and fiscal outlook 144

5 Performance against the Government’s fiscal targets
Introduction
5.1 This chapter:
• sets out the Government’s medium-term fiscal targets (from paragraph 5.2);
• examines whether the Government has a better than 50 per cent chance of meeting
them on current policy, given our central forecast (from paragraph 5.6); and
• assesses how robust these judgements are to the uncertainties inherent in any fiscal
forecast, by looking at past differences between forecast and outturn, sensitivity to key
parameters of the forecast and alternative economic scenarios (from paragraph 5.27).
The Government’s fiscal targets
5.2 The Charter for Budget Responsibility requires the OBR to judge whether the Government
has a greater than 50 per cent chance of meeting its fiscal targets under current policy. The
Charter has been updated several times in recent years as governments have revised their
fiscal targets. The latest version was approved by Parliament in January 2017.1
5.3 The Charter states that the Government’s objective for fiscal policy is to “return the public
finances to balance at the earliest possible date in the next Parliament”. At the time that it
was drawn up, ‘the next Parliament’ was expected to run from 2020 to 2025.
5.4 The Charter also sets out targets for borrowing, debt and welfare spending that require:
• The structural deficit (cyclically adjusted public sector net borrowing) to lie below 2 per
cent of GDP by 2020-21 (the ‘fiscal mandate’).
• Public sector net debt to fall relative to GDP in 2020-21 (the ‘supplementary target’).
• Welfare spending (excluding the state pension and payments closely linked to the
economic cycle) to lie below a ‘welfare cap’. The latest version of the cap was initially set in November 2017, to apply in 2022-23. A non-binding pathway was also
specified for the years leading up to the cap year. The Government set the effective
cap 3 per cent above our November 2017 forecast for 2022-23 at £135 billion, with
1 The latest and previous versions are available on the ‘Legislation and related material’ page of our website.
145 Economic and fiscal outlook
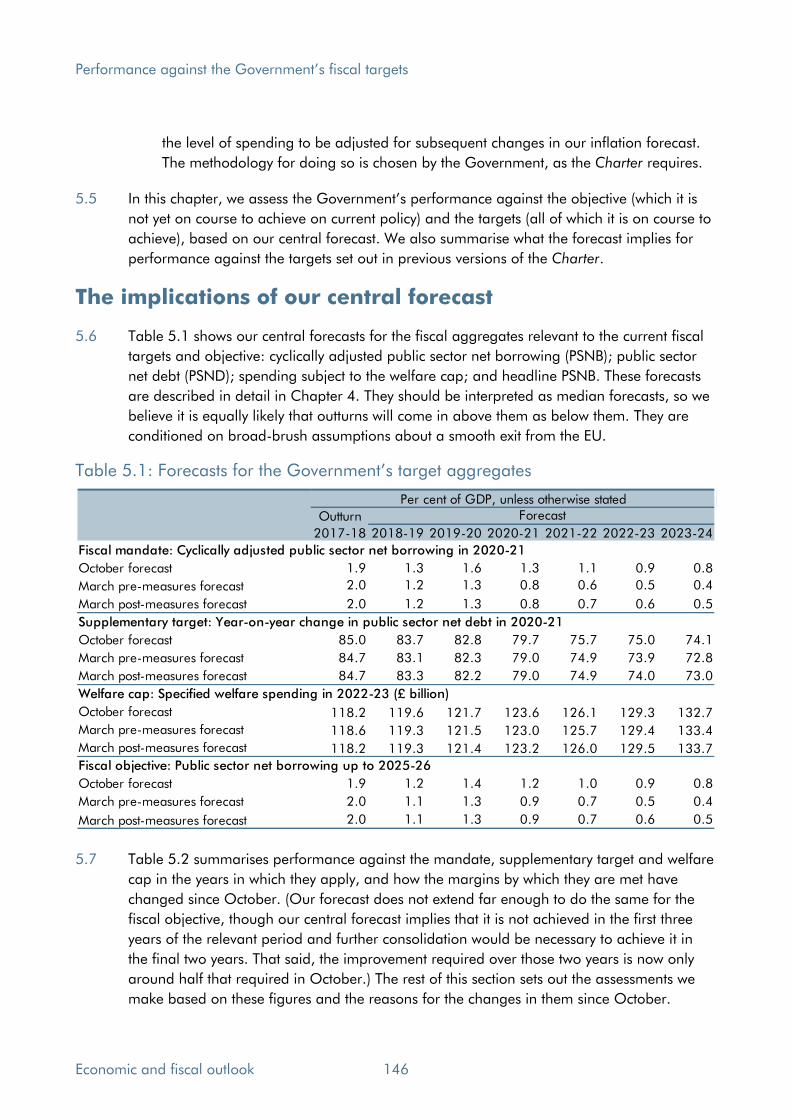
Performance against the Government’s fiscal targets
the level of spending to be adjusted for subsequent changes in our inflation forecast.
The methodology for doing so is chosen by the Government, as the Charter requires.
5.5 In this chapter, we assess the Government’s performance against the objective (which it is
not yet on course to achieve on current policy) and the targets (all of which it is on course to
achieve), based on our central forecast. We also summarise what the forecast implies for
performance against the targets set out in previous versions of the Charter.
The implications of our central forecast
5.6 Table 5.1 shows our central forecasts for the fiscal aggregates relevant to the current fiscal
targets and objective: cyclically adjusted public sector net borrowing (PSNB); public sector
net debt (PSND); spending subject to the welfare cap; and headline PSNB. These forecasts
are described in detail in Chapter 4. They should be interpreted as median forecasts, so we
believe it is equally likely that outturns will come in above them as below them. They are
conditioned on broad-brush assumptions about a smooth exit from the EU.
Table 5.1: Forecasts for the Government’s target aggregates
Outturn
2017-18 2018-19 2019-20 2020-21 2021-22 2022-23 2023-24
Fiscal mandate: Cyclically adjusted public sector net borrowing in 2020-21
October forecast 1.9 1.3 1.6 1.3 1.1 0.9 0.8
March pre-measures forecast 2.0 1.2 1.3 0.8 0.6 0.5 0.4
March post-measures forecast 2.0 1.2 1.3 0.8 0.7 0.6 0.5
Supplementary target: Year-on-year change in public sector net debt in 2020-21
October forecast 85.0 83.7 82.8 79.7 75.7 75.0 74.1
March pre-measures forecast 84.7 83.1 82.3 79.0 74.9 73.9 72.8
March post-measures forecast 84.7 83.3 82.2 79.0 74.9 74.0 73.0
Welfare cap: Specified welfare spending in 2022-23 (£ billion)
October forecast 118.2 119.6 121.7 123.6 126.1 129.3 132.7
March pre-measures forecast 118.6 119.3 121.5 123.0 125.7 129.4 133.4
March post-measures forecast 118.2 119.3 121.4 123.2 126.0 129.5 133.7
Fiscal objective: Public sector net borrowing up to 2025-26
October forecast 1.9 1.2 1.4 1.2 1.0 0.9 0.8
March pre-measures forecast 2.0 1.1 1.3 0.9 0.7 0.5 0.4
March post-measures forecast 2.0 1.1 1.3 0.9 0.7 0.6 0.5
Per cent of GDP, unless otherwise statedForecast
5.7 Table 5.2 summarises performance against the mandate, supplementary target and welfare
cap in the years in which they apply, and how the margins by which they are met have
changed since October. (Our forecast does not extend far enough to do the same for the
fiscal objective, though our central forecast implies that it is not achieved in the first three
years of the relevant period and further consolidation would be necessary to achieve it in
the final two years. That said, the improvement required over those two years is now only
around half that required in October.) The rest of this section sets out the assessments we
make based on these figures and the reasons for the changes in them since October.
Economic and fiscal outlook 146
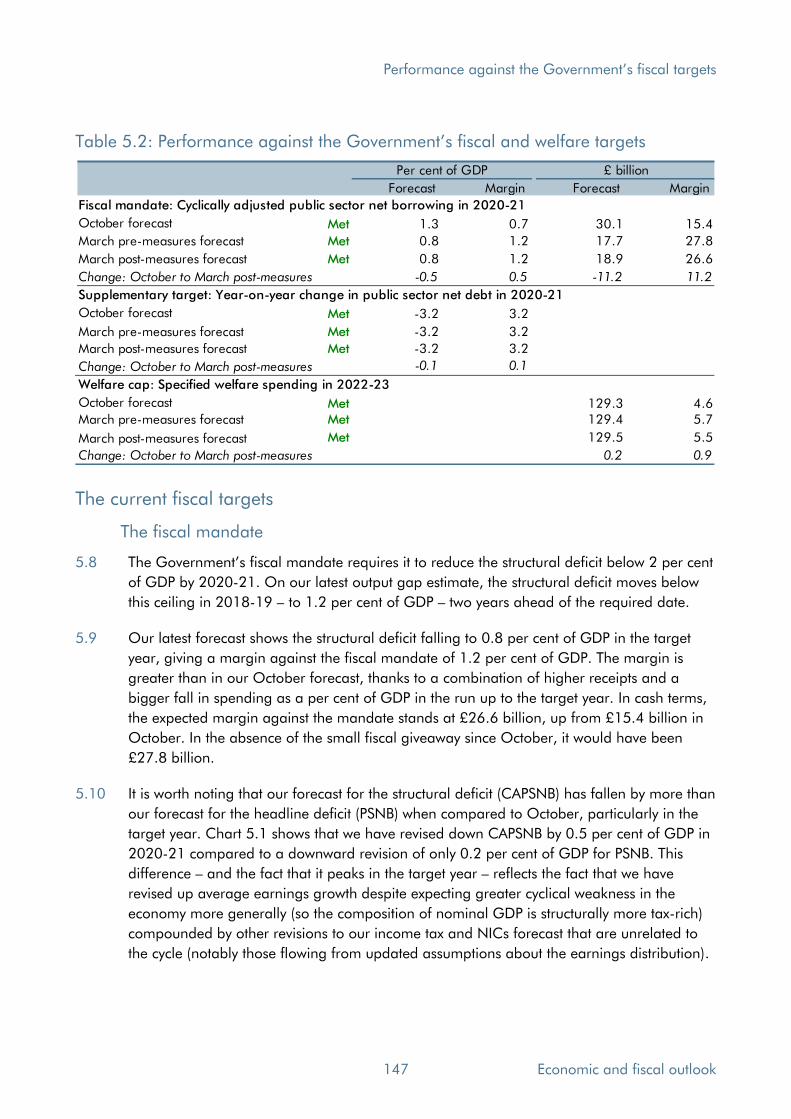
Performance against the Government’s fiscal targets
Table 5.2: Performance against the Government’s fiscal and welfare targets
Forecast Margin Forecast Margin
Fiscal mandate: Cyclically adjusted public sector net borrowing in 2020-21
October forecast Met 1.3 0.7 30.1 15.4
March pre-measures forecast Met 0.8 1.2 17.7 27.8
March post-measures forecast Met 0.8 1.2 18.9 26.6
Change: October to March post-measures -0.5 0.5 -11.2 11.2
Supplementary target: Year-on-year change in public sector net debt in 2020-21
October forecast Met -3.2 3.2
March pre-measures forecast Met -3.2 3.2
March post-measures forecast Met -3.2 3.2
Change: October to March post-measures -0.1 0.1
Welfare cap: Specified welfare spending in 2022-23
October forecast Met 129.3 4.6March pre-measures forecast Met 129.4 5.7
March post-measures forecast Met 129.5 5.5
Change: October to March post-measures 0.2 0.9
Per cent of GDP £ billion
The current fiscal targets
The fiscal mandate
5.8 The Government’s fiscal mandate requires it to reduce the structural deficit below 2 per cent
of GDP by 2020-21. On our latest output gap estimate, the structural deficit moves below
this ceiling in 2018-19 – to 1.2 per cent of GDP – two years ahead of the required date.
5.9 Our latest forecast shows the structural deficit falling to 0.8 per cent of GDP in the target
year, giving a margin against the fiscal mandate of 1.2 per cent of GDP. The margin is
greater than in our October forecast, thanks to a combination of higher receipts and a
bigger fall in spending as a per cent of GDP in the run up to the target year. In cash terms,
the expected margin against the mandate stands at £26.6 billion, up from £15.4 billion in
October. In the absence of the small fiscal giveaway since October, it would have been
£27.8 billion.
5.10 It is worth noting that our forecast for the structural deficit (CAPSNB) has fallen by more than
our forecast for the headline deficit (PSNB) when compared to October, particularly in the
target year. Chart 5.1 shows that we have revised down CAPSNB by 0.5 per cent of GDP in
2020-21 compared to a downward revision of only 0.2 per cent of GDP for PSNB. This
difference – and the fact that it peaks in the target year – reflects the fact that we have
revised up average earnings growth despite expecting greater cyclical weakness in the
economy more generally (so the composition of nominal GDP is structurally more tax-rich)
compounded by other revisions to our income tax and NICs forecast that are unrelated to
the cycle (notably those flowing from updated assumptions about the earnings distribution).
147 Economic and fiscal outlook
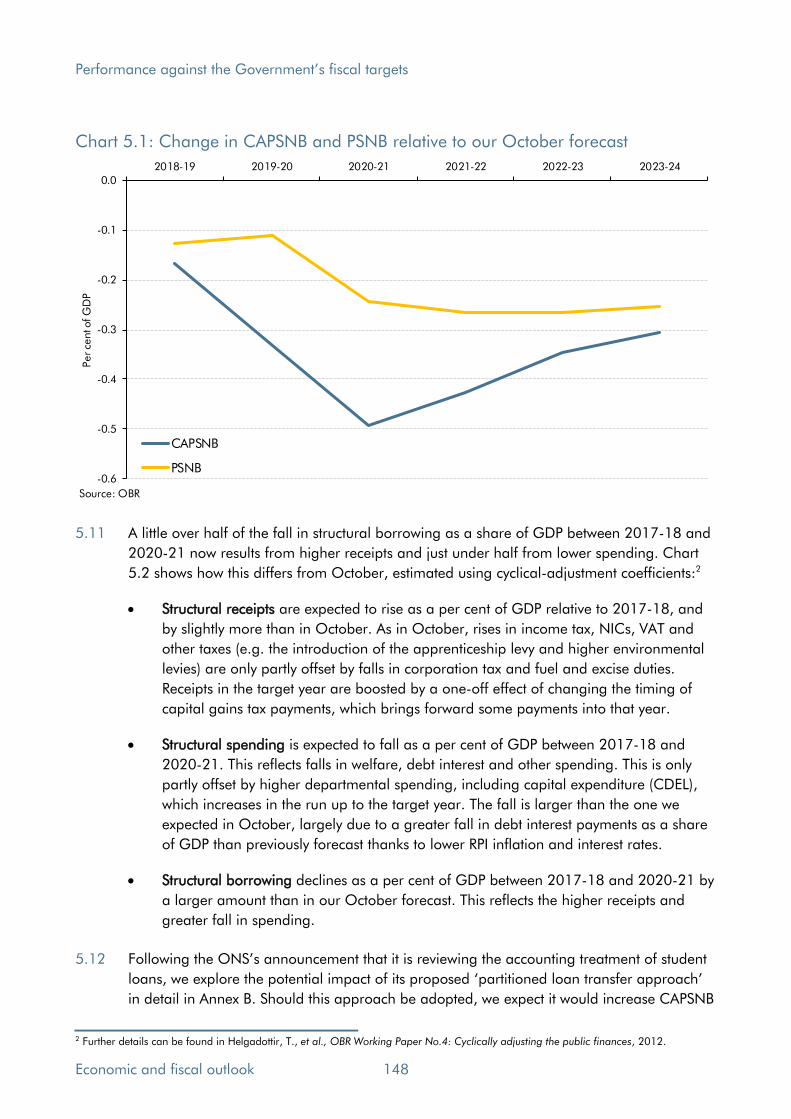
Performance against the Government’s fiscal targets
Chart 5.1: Change in CAPSNB and PSNB relative to our October forecast
-0.6
-0.5
-0.4
-0.3
-0.2
-0.1
0.0
2018-19 2019-20 2020-21 2021-22 2022-23 2023-24
Per ce
nt o
f G
DP
CAPSNB
PSNB
Source: OBR
5.11 A little over half of the fall in structural borrowing as a share of GDP between 2017-18 and
2020-21 now results from higher receipts and just under half from lower spending. Chart
5.2 shows how this differs from October, estimated using cyclical-adjustment coefficients:2
• Structural receipts are expected to rise as a per cent of GDP relative to 2017-18, and
by slightly more than in October. As in October, rises in income tax, NICs, VAT and
other taxes (e.g. the introduction of the apprenticeship levy and higher environmental
levies) are only partly offset by falls in corporation tax and fuel and excise duties.
Receipts in the target year are boosted by a one-off effect of changing the timing of
capital gains tax payments, which brings forward some payments into that year.
• Structural spending is expected to fall as a per cent of GDP between 2017-18 and
2020-21. This reflects falls in welfare, debt interest and other spending. This is only
partly offset by higher departmental spending, including capital expenditure (CDEL),
which increases in the run up to the target year. The fall is larger than the one we
expected in October, largely due to a greater fall in debt interest payments as a share
of GDP than previously forecast thanks to lower RPI inflation and interest rates.
• Structural borrowing declines as a per cent of GDP between 2017-18 and 2020-21 by
a larger amount than in our October forecast. This reflects the higher receipts and
greater fall in spending.
5.12 Following the ONS’s announcement that it is reviewing the accounting treatment of student
loans, we explore the potential impact of its proposed ‘partitioned loan transfer approach’ in detail in Annex B. Should this approach be adopted, we expect it would increase CAPSNB
2 Further details can be found in Helgadottir, T., et al., OBR Working Paper No.4: Cyclically adjusting the public finances, 2012.
Economic and fiscal outlook 148

Performance against the Government’s fiscal targets
by around £12 billion or 0.5 per cent of GDP in 2020-21, absorbing almost half the
Government’s current headroom relative to its fiscal mandate.
Chart 5.2: Cumulative changes in the structural deficit from 2017-18 to 2020-21
-2.0
-1.5
-1.0
-0.5
0.0
0.5
1.0
Per ce
nt o
f G
DP
RDEL
Welfare
Debt interest
CDEL
Other
Total spending
-2.0
-1.5
-1.0
-0.5
0.0
0.5
1.0
October forecast March forecast
Per ce
nt o
f G
DP
Total receipts
Total spending
PSNB
-2.0
-1.5
-1.0
-0.5
0.0
0.5
1.0
Per ce
nt o
f G
DP
Income tax & NICs
Onshore CT
VAT
Fuel & excise duties
Capital taxes
Other
Total receipts
Source: OBR
Cyclically adjusted spending
Cyclically adjusted receipts
Cyclically adjusted public sector borrowing
The supplementary debt target
5.13 The supplementary debt target requires PSND to fall as a percentage of GDP in 2020-21.
PSND was broadly stable on this basis between 2016-17 and 2017-18. We now expect it to
fall in each year of the forecast, with a large drop of 3.2 per cent of GDP in the target year
(unchanged from October). The Government is therefore comfortably on course to meet this
target.
149 Economic and fiscal outlook

Performance against the Government’s fiscal targets
5.14 Chart 5.3 decomposes year-on-year changes in the PSND-to-GDP ratio over the forecast
period, to show the different drivers of the decline we expect. It shows that:
• The Bank of England’s August 2016 monetary policy package continues to have a
material effect on the path of net debt. This reflects lending to commercial banks
under the Term Funding Scheme (TFS). (Lending through the TFS is treated as the
acquisition of an illiquid asset, which is therefore not netted off PSND. But it is secured
against high-quality collateral and thus most unlikely to generate losses for the public
sector.) The repayment of TFS loans after four years reduces the debt ratio significantly
in the target year of 2020-21 (accounting for the majority of the decline as a per cent
of GDP in that year) as well as an even larger impact in 2021-22. Excluding the TFS
effect, the path of changes in the PSND as a share of GDP would be smoother.
• The primary balance – net borrowing excluding net debt interest spending – is in
surplus every year of the forecast, lowering debt in 2020-21.
• Nominal GDP growth is expected to exceed nominal gilt rates throughout the forecast,
reducing debt as a share of GDP by relatively large amounts each year. This
‘growth-corrected interest rate’ is a key driver of public sector debt dynamics,
especially over longer timeframes. We explored this in our 2017 Fiscal risks report.
• Net lending to the non-bank private sector – mainly through student loans, plus other
lending schemes such as Help to Buy – increases debt as a share of GDP in every year
including the target year 2020-21. As a financial transaction, this lending only affects
the deficit indirectly, via interest income, write-off expenses and debt interest costs. We
discuss future changes to the accounting treatment of student loans in Annex B. 3
• Financial asset sales – including the active sale and rundown of UK Asset Resolution
(UKAR) assets and the sale of student loans and RBS shares – reduce debt by large
amounts in 2018-19 and 2019-20 before smaller amounts in subsequent years.
Financial asset sales usually leave the underlying fiscal position largely unaffected, as
they typically bring forward cash that would otherwise have been received in later
years as revenue, in the shape of mortgage repayments or dividends. So they only
reduce debt temporarily.
• Valuation changes – largely relating to auction premia from Government sales of gilts
and from changes to gilt holdings in the APF – reduce debt as a share of GDP in every
year of the forecast, including the target year 2020-21.
• The reclassification of Scottish and Welsh housing associations from the public to the
private sector reduces measured debt in 2018-19.
• Other factors increase net debt in every year of the forecast, including the target year
2020-21, chiefly because accrued receipts exceed cash receipts over the medium term.
Some receipts, including interest on student loans, are collected with a long lag.
3 We explored this issue in more detail in Ebdon, J. and Waite, R., OBR Working Paper No.12: Student loans and fiscal illusions, 2018.
Economic and fiscal outlook 150

Performance against the Government’s fiscal targets
5.15 Abstracting from the effect of Bank of England schemes (largely the TFS), net debt is on a
steady downward trajectory over the whole forecast period, falling by an average of 1.1 per
cent of GDP a year. The target is met by a margin of 3.2 percentage points, and would still
be met with a 1.0 per cent of GDP margin without the TFS repayments.
Chart 5.3: Year-on-year changes to the debt-to-GDP ratio
-6
-4
-2
0
2
4
2018-19 2019-20 2020-21 2021-22 2022-23 2023-24
Per ce
nt o
f G
DP
Bank of England
Other factors
Growth-correctedinterest rate
Reclassifications
Asset sales
Valuation changes
Net lending
Primary balance
Total change
Total change excludingBank of England
Source: OBR
Debttargetyear
5.16 Table 5.3 shows how and why the year-on-year changes in net debt shown in Chart 5.3
have changed since our October forecast. The revision to the change in the target year is
small because, even though net debt as a per cent of GDP is lower in 2020-21 than it was
in our October forecast, it is also lower in 2019-20 by a similar amount.
5.17 The new treatment of student loans does not affect PSND – a cash-based measure of the
balance sheet – and will not therefore affect performance against the supplementary target.
Table 5.3: Changes in the profile of net debt since October
2018-19 2019-20 2020-21 2021-22 2022-23 2023-24
October forecast -1.4 -0.8 -3.2 -4.0 -0.6 -1.0
March forecast -1.4 -1.1 -3.2 -4.1 -0.9 -1.0
Change 0.0 -0.3 -0.1 -0.1 -0.3 -0.1
of which:
Nominal GDP1 0.3 0.0 -0.1 -0.1 -0.1 -0.1
Pre-measures net borrowing -0.1 -0.1 -0.3 -0.3 -0.3 -0.3
Other pre-measures forecast changes -0.4 0.1 0.3 0.3 0.1 0.2
Government decisions 0.2 -0.2 0.0 0.1 0.1 0.11 GDP is centred end-March.
Change in net debt as per cent of GDP on previous year
Forecast
151 Economic and fiscal outlook
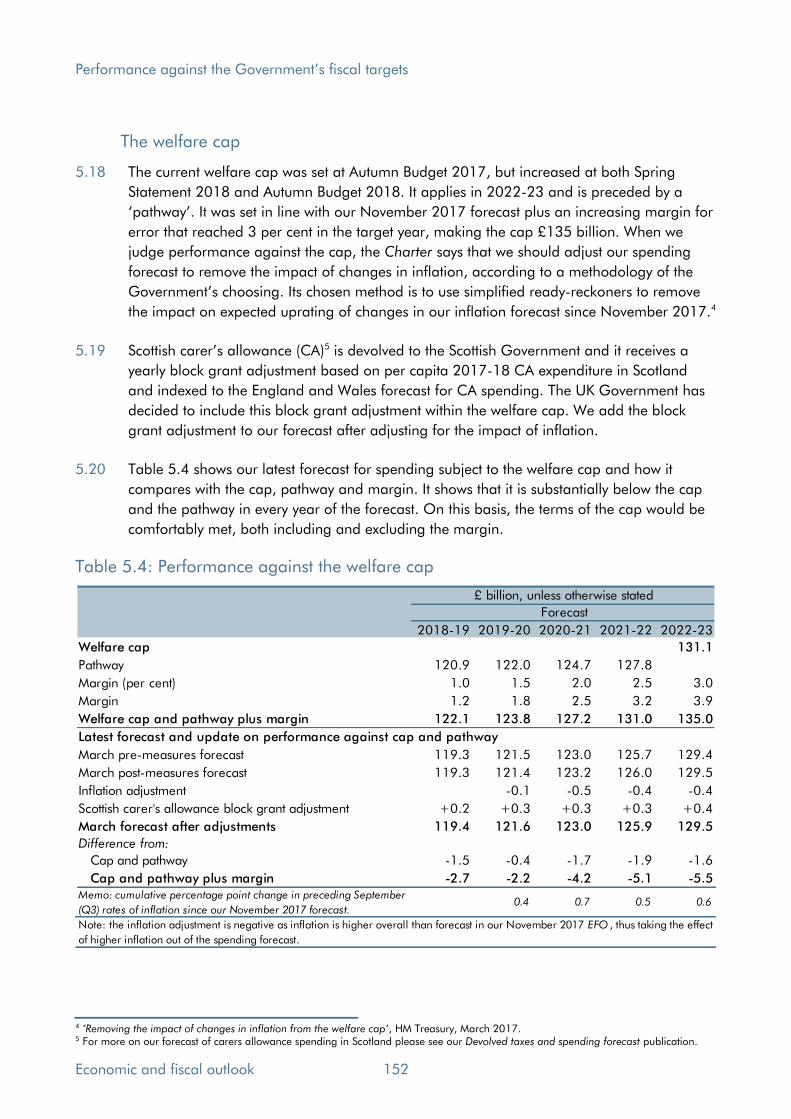
Performance against the Government’s fiscal targets
The welfare cap
5.18 The current welfare cap was set at Autumn Budget 2017, but increased at both Spring
Statement 2018 and Autumn Budget 2018. It applies in 2022-23 and is preceded by a
‘pathway’. It was set in line with our November 2017 forecast plus an increasing margin for error that reached 3 per cent in the target year, making the cap £135 billion. When we
judge performance against the cap, the Charter says that we should adjust our spending
forecast to remove the impact of changes in inflation, according to a methodology of the
Government’s choosing. Its chosen method is to use simplified ready-reckoners to remove
the impact on expected uprating of changes in our inflation forecast since November 2017.4
5.19 Scottish carer’s allowance (CA)5 is devolved to the Scottish Government and it receives a
yearly block grant adjustment based on per capita 2017-18 CA expenditure in Scotland
and indexed to the England and Wales forecast for CA spending. The UK Government has
decided to include this block grant adjustment within the welfare cap. We add the block
grant adjustment to our forecast after adjusting for the impact of inflation.
5.20 Table 5.4 shows our latest forecast for spending subject to the welfare cap and how it
compares with the cap, pathway and margin. It shows that it is substantially below the cap
and the pathway in every year of the forecast. On this basis, the terms of the cap would be
comfortably met, both including and excluding the margin.
Table 5.4: Performance against the welfare cap
2018-19 2019-20 2020-21 2021-22 2022-23
Welfare cap 131.1
Pathway 120.9 122.0 124.7 127.8
Margin (per cent) 1.0 1.5 2.0 2.5 3.0
Margin 1.2 1.8 2.5 3.2 3.9
Welfare cap and pathway plus margin 122.1 123.8 127.2 131.0 135.0
Latest forecast and update on performance against cap and pathway
March pre-measures forecast 119.3 121.5 123.0 125.7 129.4
March post-measures forecast 119.3 121.4 123.2 126.0 129.5
Inflation adjustment -0.1 -0.5 -0.4 -0.4
Scottish carer's allowance block grant adjustment +0.2 +0.3 +0.3 +0.3 +0.4
March forecast after adjustments 119.4 121.6 123.0 125.9 129.5
Difference from:
Cap and pathway -1.5 -0.4 -1.7 -1.9 -1.6
Cap and pathway plus margin -2.7 -2.2 -4.2 -5.1 -5.5Memo: cumulative percentage point change in preceding September
(Q3) rates of inflation since our November 2017 forecast.0.4 0.7 0.5 0.6
Forecast
£ billion, unless otherwise stated
Note: the inflation adjustment is negative as inflation is higher overall than forecast in our November 2017 EFO , thus taking the effect
of higher inflation out of the spending forecast.
4 ‘Removing the impact of changes in inflation from the welfare cap’, HM Treasury, March 2017. 5 For more on our forecast of carers allowance spending in Scotland please see our Devolved taxes and spending forecast publication.
Economic and fiscal outlook 152
Performance against the Government’s fiscal targets
Fiscal objective for the next Parliament
5.21 According to the Charter for Budget Responsibility, the Government’s fiscal objective is to “return the public finances to balance at the earliest possible date in the next Parliament”.
When this objective was set, the ‘next Parliament’ was expected to run to May 2025, so the ‘earliest possible date’ could have been anywhere up to 2025-26. The Conservative Party’s 2017 manifesto similarly committed to “a balanced budget by the middle of the next
decade”. Our forecast horizon extends to 2023-24, so we cannot assess performance
against this objective definitively using a central forecast for 2025-26.
5.22 That said, if the deficit evolves in line with the forecast in this EFO, achieving the fiscal
objective appears challenging from a variety of perspectives. For example:
• Our 2018 Fiscal sustainability report (FSR) was produced on the basis of our March
2018 forecast. In the baseline projection, spending rose to accommodate the
pressures of an ageing population and other non-demographic pressures on health
spending. But we also showed that this could be partly offset if receipts and annually
managed expenditure were projected forward in line with the approach taken in our
medium-term forecast. This would mean that tax thresholds are uprated with inflation
rather than earnings. This causes a greater proportion of income to be taxable given
that earnings are projected to rise faster than inflation. Likewise, working-age benefits
would also be uprated with inflation therefore becoming a lower share of the national
income. The deficit then fell by 0.2 per cent of GDP over the three years to 2025-26.
The fiscal tightening in this scenario raised the receipts-to-GDP ratio by a further 0.4
per cent of GDP in the three years to 2025-26 and reduced average working-age
welfare payments by a further 5 per cent relative to earnings.
• Using our baseline FSR projection, the challenge looks even greater. Under that
methodology, we assume that tax thresholds and working-age benefit awards move
with earnings rather than inflation. This prevents receipts from rising continually
relative to GDP and the incomes of working-age benefit recipients declining
continually relative to those of the rest of the population. Adding in the pressures on
spending from an ageing population, non-demographic pressures specific to health
spending and the cost of the triple lock on the uprating of state pensions, would put
the deficit on a rising path. In our 2018 FSR, the deficit rose by 0.5 per cent of GDP in
the three years to 2025-26.
• Following the ONS’s announcement that it is reviewing the accounting treatment of
student loans, the adoption of its ‘partition loan transfer approach’ would increase PSNB in every year of the forecast by a sizable amount. This would make achieving the
objective even more difficult compared to our current forecast which reflects the
existing accounting treatment. We explore this issue in Annex B.
5.23 All this being said, the chances of the Government balancing the budget by 2025-26 look
greater than they did in October and by no means remote. As shown in Chart 5.4 below,
the probability of balancing the (cyclically adjusted) budget as early as 2023-24 (based on
153 Economic and fiscal outlook
Performance against the Government’s fiscal targets
past forecast performance), is now around 40 per cent, up from around 35 per cent in
October.
Previous fiscal targets
5.24 Since the OBR was established by the Coalition Government in 2010, we have assessed
performance against three previous fiscal mandates, three previous supplementary debt
targets and three previous welfare caps:
• Successive fiscal mandates have targeted different measures of the deficit at different
horizons. In the 2010-2015 Parliament, the mandate specified a surplus on the
cyclically adjusted current budget balance (i.e. PSNB excluding net investment
spending) by the end of the rolling, 5-year forecast period. In December 2014, this
was changed to the end of the third year. At the start of the 2015-2017 Parliament,
the mandate prescribed a surplus on headline PSNB by the end of 2019-20.
• The supplementary debt target has always referred to year-on-year changes in the
ratio of PSND to GDP, but the reference year has changed. In the 2010-2015
Parliament, the Coalition Government started by targeting a year-on-year fall in the
fixed year of 2015-16. In December 2014, that was moved back to 2016-17. At the
start of the last Parliament, the target was changed to year-on-year falls in every year
from 2015-16 onwards.
• The welfare cap has always referred to the same subset of welfare spending, but its
level has been changed frequently. Abstracting from movements relating to
classification changes, there have been three previous caps. In March 2014, the
Coalition Government set the cap in line with our latest forecast at the time. During the
2015-2017 Parliament, the Conservative Government first lowered the cap in line with
our July 2015 forecast, including the effects of the welfare cuts announced in the
post-election Summer Budget. It then set a new higher cap in line with our November
2016 forecast, which included a rising margin and the new inflation adjustment.
5.25 The October 2015 version of the Charter also stated that: ”These targets apply unless and
until the Office for Budget Responsibility (OBR) assess, as part of their economic and fiscal
forecast, that there is a significant negative shock to the UK. A significant negative shock is
defined as real GDP growth of less than 1% on a rolling 4 quarter-on-4 quarter basis.” On
our latest forecast, that escape clause would not be triggered. The current Charter maintains
an escape clause set in terms of a ‘significant negative shock’, but has shifted the responsibility for assessing that to the Treasury and no longer specifies what such a shock
would look like in terms of 4-quarter-on-4-quarter real GDP growth. This aligns the escape
clause with the approach that the Government took after the referendum in 2016.
5.26 Table 5.5 shows performance against the previous fiscal targets. The latest outturn data and
our current central forecast imply that all but the first Conservative Government fiscal
mandate would be met, only the first Coalition Government supplementary target would be
met, and only the second Conservative Government welfare cap would be met.
Economic and fiscal outlook 154
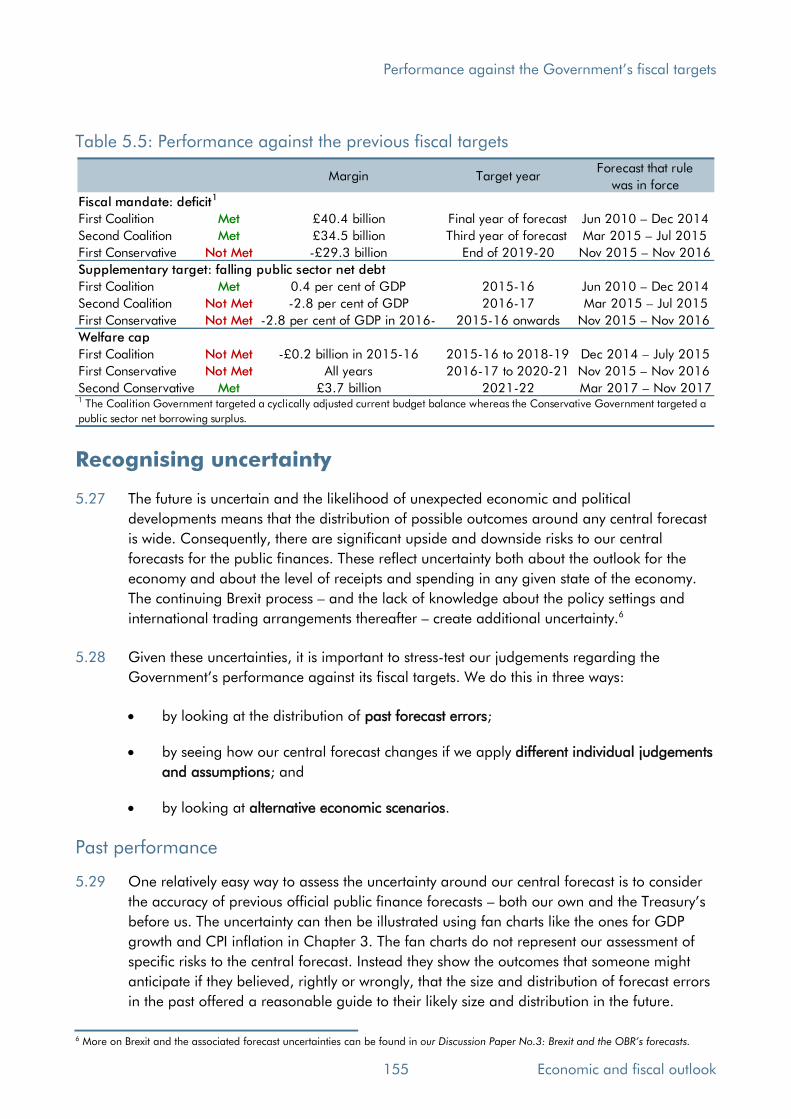
Performance against the Government’s fiscal targets
Table 5.5: Performance against the previous fiscal targets
Margin Target yearForecast that rule
was in force
Fiscal mandate: deficit1
First Coalition Met £40.4 billion Final year of forecast Jun 2010 – Dec 2014
Second Coalition Met £34.5 billion Third year of forecast Mar 2015 – Jul 2015
First Conservative Not Met -£29.3 billion End of 2019-20 Nov 2015 – Nov 2016
Supplementary target: falling public sector net debt
First Coalition Met 0.4 per cent of GDP 2015-16 Jun 2010 – Dec 2014
Second Coalition Not Met -2.8 per cent of GDP 2016-17 Mar 2015 – Jul 2015
First Conservative Not Met -2.8 per cent of GDP in 2016- 2015-16 onwards Nov 2015 – Nov 2016
Welfare cap
First Coalition Not Met -£0.2 billion in 2015-16 2015-16 to 2018-19 Dec 2014 – July 2015
First Conservative Not Met All years 2016-17 to 2020-21 Nov 2015 – Nov 2016
Second Conservative Met £3.7 billion 2021-22 Mar 2017 – Nov 20171 The Coalition Government targeted a cyclically adjusted current budget balance whereas the Conservative Government targeted a
public sector net borrowing surplus.
Recognising uncertainty
5.27 The future is uncertain and the likelihood of unexpected economic and political
developments means that the distribution of possible outcomes around any central forecast
is wide. Consequently, there are significant upside and downside risks to our central
forecasts for the public finances. These reflect uncertainty both about the outlook for the
economy and about the level of receipts and spending in any given state of the economy.
The continuing Brexit process – and the lack of knowledge about the policy settings and
international trading arrangements thereafter – create additional uncertainty.6
5.28 Given these uncertainties, it is important to stress-test our judgements regarding the
Government’s performance against its fiscal targets. We do this in three ways:
• by looking at the distribution of past forecast errors;
• by seeing how our central forecast changes if we apply different individual judgements
and assumptions; and
• by looking at alternative economic scenarios.
Past performance
5.29 One relatively easy way to assess the uncertainty around our central forecast is to consider
the accuracy of previous official public finance forecasts – both our own and the Treasury’s before us. The uncertainty can then be illustrated using fan charts like the ones for GDP
growth and CPI inflation in Chapter 3. The fan charts do not represent our assessment of
specific risks to the central forecast. Instead they show the outcomes that someone might
anticipate if they believed, rightly or wrongly, that the size and distribution of forecast errors
in the past offered a reasonable guide to their likely size and distribution in the future.
6 More on Brexit and the associated forecast uncertainties can be found in our Discussion Paper No.3: Brexit and the OBR’s forecasts.
155 Economic and fiscal outlook
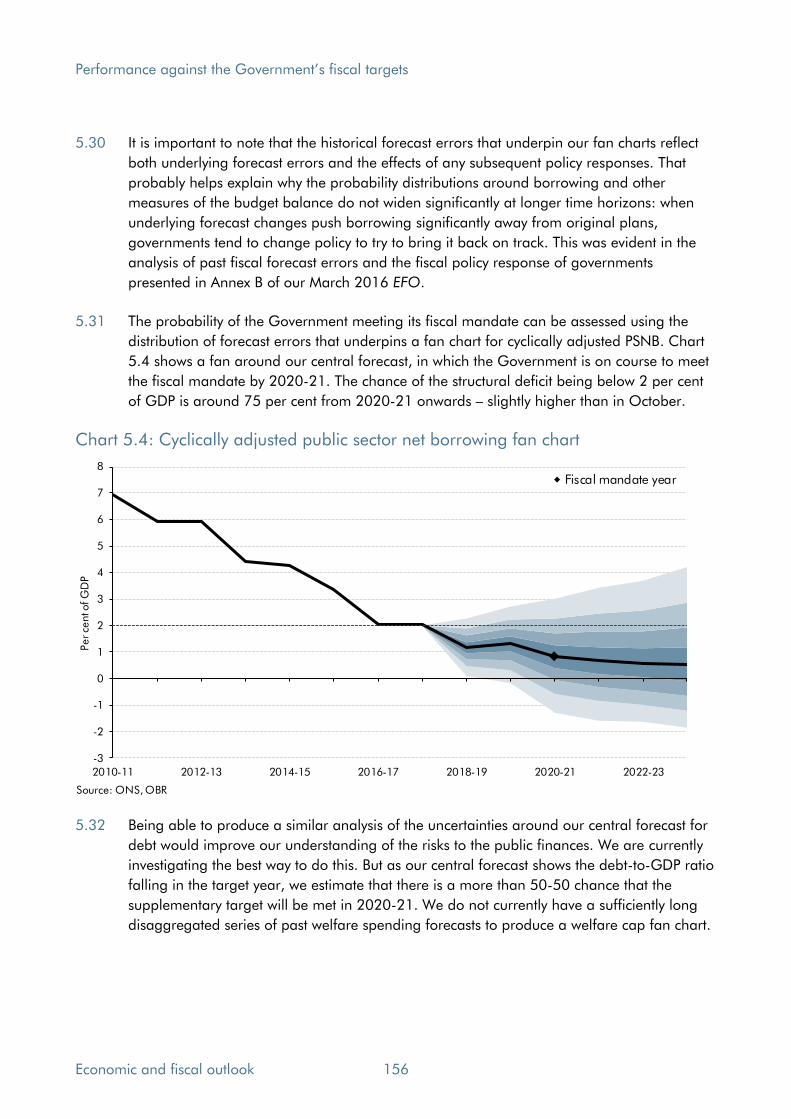
Performance against the Government’s fiscal targets
5.30 It is important to note that the historical forecast errors that underpin our fan charts reflect
both underlying forecast errors and the effects of any subsequent policy responses. That
probably helps explain why the probability distributions around borrowing and other
measures of the budget balance do not widen significantly at longer time horizons: when
underlying forecast changes push borrowing significantly away from original plans,
governments tend to change policy to try to bring it back on track. This was evident in the
analysis of past fiscal forecast errors and the fiscal policy response of governments
presented in Annex B of our March 2016 EFO.
5.31 The probability of the Government meeting its fiscal mandate can be assessed using the
distribution of forecast errors that underpins a fan chart for cyclically adjusted PSNB. Chart
5.4 shows a fan around our central forecast, in which the Government is on course to meet
the fiscal mandate by 2020-21. The chance of the structural deficit being below 2 per cent
of GDP is around 75 per cent from 2020-21 onwards – slightly higher than in October.
Chart 5.4: Cyclically adjusted public sector net borrowing fan chart
-3
-2
-1
0
1
2
3
4
5
6
7
8
2010-11 2012-13 2014-15 2016-17 2018-19 2020-21 2022-23
Per ce
nt o
f G
DP
Fiscal mandate year
Source: ONS, OBR
5.32 Being able to produce a similar analysis of the uncertainties around our central forecast for
debt would improve our understanding of the risks to the public finances. We are currently
investigating the best way to do this. But as our central forecast shows the debt-to-GDP ratio
falling in the target year, we estimate that there is a more than 50-50 chance that the
supplementary target will be met in 2020-21. We do not currently have a sufficiently long
disaggregated series of past welfare spending forecasts to produce a welfare cap fan chart.
Economic and fiscal outlook 156
Performance against the Government’s fiscal targets
Sensitivity analysis
5.33 It is next to impossible to produce a full unconditional probability distribution for the
Government’s target fiscal variables because they are affected by so many determinants – both economic and non-economic – many of which are also interrelated in complex ways.
But we can go further than using evidence from past forecast errors by illustrating how
sensitive the central forecast is to changes in individual parameters and judgements.
5.34 In thinking about the evolution of the public finances over the medium term, there are
several parameters that have an important bearing on the forecast. Here we focus on:
• the sensitivity of the fiscal mandate to changes to the level of potential GDP, inflation,
interest rates and the effective tax rate;
• the sensitivity of the supplementary debt target to differences in the level of debt or the
growth rate of the economy, which both affect how debt changes from year to year as
a percentage of GDP; and
• some of the circumstances in which the supplementary target could be missed while
still meeting the fiscal mandate.
The fiscal mandate
5.35 As Chart 5.4 illustrated, on the basis of past forecast errors, we estimate that there is a
roughly 25 per cent chance that the structural budget deficit will exceed 2 per cent of GDP
in 2020-21. There are many reasons why this might happen. For example, the evolution of
potential output could be less favourable than forecast or receipts or spending could turn
out differently for a given state of the economy. And while our forecasts are conditioned on
current Government policy, that is also likely to change, especially in respect of the policy
settings that will apply once the UK has left the EU.
5.36 On our website we publish ready-reckoners that show how elements of the public finances
could be affected by changes in some of the determinants of our fiscal forecast. It is
important to stress that these are stylised exercises that reflect the typical impact of changes
in variables on receipts and spending as embodied in our forecast models. The actual
impact in any given case is likely to depend on the state of the economy at the time and the
reaction of other policymakers, such as the MPC. The ready-reckoners are also subject to
significant uncertainty. But bearing those caveats in mind, we can use them to calibrate
several possible adverse surprises relative to our central forecast that would be sufficient to
push the structural deficit above 2 per cent of GDP in 2020-21.
5.37 This analysis shows that the 1.2 per cent of GDP margin relative to the 2 per cent target
could fall to zero if:
• Potential output were 2.4 per cent lower. This is small relative to the cumulative
downward revisions made since the financial crisis, but is quite large given the
relatively short period between now and the mandate year of 2020-21.
157 Economic and fiscal outlook

Performance against the Government’s fiscal targets
• The effective tax rate – as measured by the tax-to-GDP ratio – were 1.2 percentage
points lower and the difference was a consequence of structural factors (e.g. if the
distribution of income shifts towards the less highly paid). Chart 5.5 presents a fan
chart for the receipts-to-GDP ratio, reflecting both cyclical and structural drivers of past
errors. It suggests there is around a 15 per cent chance that receipts could be 1.2 per
cent of GDP lower than forecast.
• Effective interest rates on central government gross debt were 1.4 percentage points
higher (relative to our central projection of 2.1 per cent). The fact that £372 billion of
conventional gilts held in the APF are currently in effect financed at Bank Rate reduces
the effective interest rate by 0.5 percentage points.
• Higher RPI inflation could increase accrued interest on index-linked gilts. Taken in
isolation, if RPI inflation were 5.9 percentage points higher than expected in 2020-21,
that alone would add 1.2 per cent of GDP to debt interest costs. Based on past
forecast errors, the chance of that happening is small, but in the years immediately
following the 2008 financial crisis CPI inflation peaked around 3.0 percentage points
above the Bank’s target. A similar inflationary shock is therefore not impossible. And
of course, this sort of shock to inflation would be likely to have other material effects
on the public finances.
Chart 5.5: Receipts fan chart
34
35
36
37
38
39
2010-11 2012-13 2014-15 2016-17 2018-19 2020-21 2022-23
Per ce
nt o
f G
DP
Source: ONS, OBR
The supplementary debt target
5.38 The supplementary debt target is focused on year-on-year changes in the debt-to-GDP ratio
in 2020-21. Table 5.6 shows how our central forecast for a 3.2 per cent of GDP fall in
PSND in that year would be affected by two sources of sensitivity: differences in the level of
debt in the preceding year and differences in growth in 2020-21. We use cyclical
Economic and fiscal outlook 158
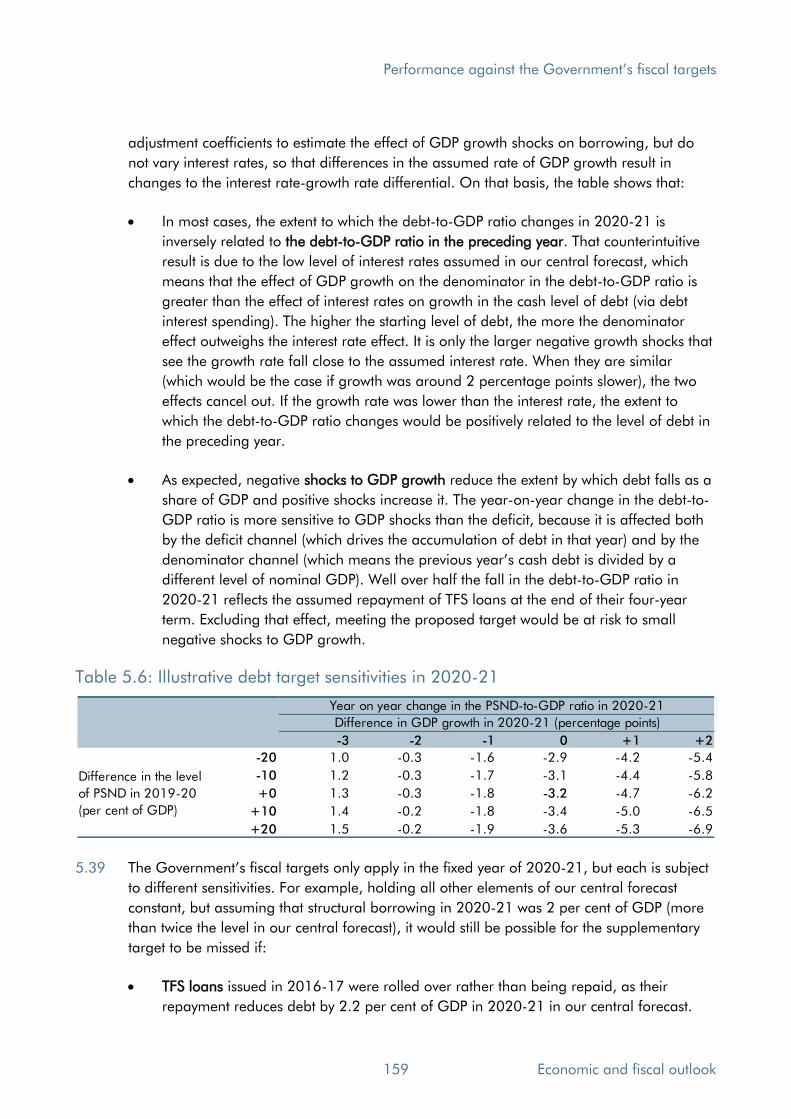
Performance against the Government’s fiscal targets
adjustment coefficients to estimate the effect of GDP growth shocks on borrowing, but do
not vary interest rates, so that differences in the assumed rate of GDP growth result in
changes to the interest rate-growth rate differential. On that basis, the table shows that:
• In most cases, the extent to which the debt-to-GDP ratio changes in 2020-21 is
inversely related to the debt-to-GDP ratio in the preceding year. That counterintuitive
result is due to the low level of interest rates assumed in our central forecast, which
means that the effect of GDP growth on the denominator in the debt-to-GDP ratio is
greater than the effect of interest rates on growth in the cash level of debt (via debt
interest spending). The higher the starting level of debt, the more the denominator
effect outweighs the interest rate effect. It is only the larger negative growth shocks that
see the growth rate fall close to the assumed interest rate. When they are similar
(which would be the case if growth was around 2 percentage points slower), the two
effects cancel out. If the growth rate was lower than the interest rate, the extent to
which the debt-to-GDP ratio changes would be positively related to the level of debt in
the preceding year.
• As expected, negative shocks to GDP growth reduce the extent by which debt falls as a
share of GDP and positive shocks increase it. The year-on-year change in the debt-to-
GDP ratio is more sensitive to GDP shocks than the deficit, because it is affected both
by the deficit channel (which drives the accumulation of debt in that year) and by the
denominator channel (which means the previous year’s cash debt is divided by a different level of nominal GDP). Well over half the fall in the debt-to-GDP ratio in
2020-21 reflects the assumed repayment of TFS loans at the end of their four-year
term. Excluding that effect, meeting the proposed target would be at risk to small
negative shocks to GDP growth.
Table 5.6: Illustrative debt target sensitivities in 2020-21
-3 -2 -1 0 +1 +2
-20 1.0 -0.3 -1.6 -2.9 -4.2 -5.4
-10 1.2 -0.3 -1.7 -3.1 -4.4 -5.8
+0 1.3 -0.3 -1.8 -3.2 -4.7 -6.2
+10 1.4 -0.2 -1.8 -3.4 -5.0 -6.5
+20 1.5 -0.2 -1.9 -3.6 -5.3 -6.9
Difference in the level
of PSND in 2019-20
(per cent of GDP)
Year on year change in the PSND-to-GDP ratio in 2020-21
Difference in GDP growth in 2020-21 (percentage points)
5.39 The Government’s fiscal targets only apply in the fixed year of 2020-21, but each is subject
to different sensitivities. For example, holding all other elements of our central forecast
constant, but assuming that structural borrowing in 2020-21 was 2 per cent of GDP (more
than twice the level in our central forecast), it would still be possible for the supplementary
target to be missed if:
• TFS loans issued in 2016-17 were rolled over rather than being repaid, as their
repayment reduces debt by 2.2 per cent of GDP in 2020-21 in our central forecast.
159 Economic and fiscal outlook
Performance against the Government’s fiscal targets
• Cyclical borrowing caused the primary balance to deteriorate by more than 2.1 per
cent of GDP. (It is near zero in our central forecast).
• Financial transactions pushed cash borrowing up relative to PSNB by 2.1 per cent of
GDP more than in our central forecast. That could happen if the Bank of England
decided that a monetary policy stimulus of the type that was announced in August
2016 was necessary in that year.
• Nominal GDP growth was 2.1 per cent (or lower) in the year centred on end-March
2021 that is the denominator for the debt-to-GDP ratio in 2020-21 (relative to 3.5 per
cent in our central forecast).
Scenario analysis
5.40 In this section of each previous EFO, we have produced alternative scenarios that help us to
examine how the effects of a specific risk to our economy forecast could affect the public
finances. Over the past nine years, we have produced 42 such scenarios on a wide range of
topical issues. The current primary risks of interest are those relating to a ‘no deal’ Brexit.
5.41 A ‘no deal’ Brexit would involve – at least in the first instance – an immediate reversion to
the UK trading largely under World Trade Organization rules. Our recent Brexit Discussion
Paper discussed the consequences of the resulting increase in trade barriers for UK trade,
investment and productivity. There we noted that outside studies had yielded a range of
estimates of both the long-run impact and the speed of transition. In addition, there is
uncertainty as to how UK government policies will be adjusted to take advantage of the
extra freedoms conferred by leaving the EU.
5.42 Our recent Brexit Discussion Paper also noted that an abrupt, disorderly exit could have a
severe short-term impact on the economy. Elevated uncertainty would continue to depress
demand and an abrupt exit would also be likely to raise inflation, with a weaker pound – alongside the direct impact of higher tariffs – pushing up import prices. In addition, a
disorderly exit might well result in temporary disruption to the supply of some imported
products and domestic goods containing imported components. It is, though, likely that the
UK and EU authorities would in due course take action to mitigate some of the worst
disruption, while businesses would gradually adjust to the new constraints. Hence, such a
period of dislocation should prove largely transitory.
5.43 The Bank of England recently published an assessment of two potential ‘no deal’ outcomes.7
But as the Bank emphasised at the time, these were intended as stress tests – appropriate to
meeting the Bank’s financial stability mandate – rather than central forecasts. Moreover, as
the Governor has recently noted, supportive policy measures could potentially mitigate
some – though not all – of the adverse consequences. 8
7 Bank of England, EU withdrawal scenarios and monetary and financial stability: a response to the House of Commons Treasury Committee, November 2018. The Bank also examine scenarios in which there is reversion to WTO rules after an orderly transition period. 8 Carney, M., Annual Report to the Treasury Committee, February 2019.
Economic and fiscal outlook 160

Performance against the Government’s fiscal targets
5.44 Given the substantial uncertainty about both the short- and long-run consequences of a ‘no deal’ Brexit, we have not posited a specific alternative scenario. But we draw on our library of past scenarios to illustrate the indirect fiscal consequences of the types of disturbance to
the outlook that are characteristic of a ‘no deal’ Brexit. We cannot incorporate the direct
fiscal effects of policies accompanying a ‘no deal’ Brexit (such as the customs revenue from
the introduction of new tariff rates) as these are presently unknown.
5.45 None of our past scenarios provide a direct correspondence to the combination of shocks
that are likely to characterise a ‘no-deal’ Brexit. These include: a short-term disruption to
supply, possibly accompanied by hoarding by consumers and businesses; a more persistent
but temporary weakness in demand; an adverse long-run impact on potential output via
productivity and migration; and a further real depreciation of sterling. But some of our past
scenarios do illustrate parts of the story. Three (sets of) scenarios are particularly relevant:
shocks to the economy’s growth potential via productivity and migration; cyclical weakness in aggregate demand; and inflationary shocks.
5.46 Taking each in turn:
• One consistent theme of past scenarios is that adverse shocks to potential output have
the greatest medium-term fiscal costs. Drawing on our previous simulations we can
generate rough ‘ready reckoners’ of the impact of weaker productivity growth and
lower net inward migration. For every 1 percentage point off potential productivity at
the forecast horizon (i.e. around 0.2 percentage points a year off growth), structural
borrowing would be around 0.5 per cent of GDP higher. For every 50,000 a year
reduction in net inward migration, the population by the end of the forecast would be
0.4 per cent smaller and employment 0.5 per cent lower, leaving structural borrowing
around 0.2 per cent of GDP higher. The effects are reasonably linear and additive,
although any change in the mix of inward migrants’ average pay would have further modest fiscal consequences.
• By contrast, cyclical shocks can cause large short-term rises in the deficit but – so long
as they do not have a lasting effect on potential output – the deficit will ultimately fall
back to roughly where it would have been. This was illustrated in our ‘consumer bust’
simulation in March 2017, which saw GDP fall 2.2 per cent below our central forecast
at its weakest point, but return to the central forecast by the forecast horizon. The
deficit returned to around ½ per cent of GDP above the levels in our central forecast
by the end of the period, but debt was over 4 per cent of GDP higher thanks to the
extra cyclical borrowing induced by the shock.
• The effect of higher inflation on the public finances is more complex and harder to
provide a ready reckoner for. It has a large and almost immediate effect on the cost of
servicing index-linked gilts. Taxes are affected via the uprating of thresholds (where
higher inflation reduces revenue) and revalorisation of rates (where it raises revenue).
Departmental spending rises if the Government chooses to increase budgets to
maintain real spending power, as do other items of public spending (including benefits
and public service pensions, most of which are uprated in line with inflation). The
161 Economic and fiscal outlook
Performance against the Government’s fiscal targets
balance of these effects will depend crucially on the source of the higher inflation. If it
results from strong demand and higher wage growth, it tends to be positive; if it results
from an exchange rate or import price shock, lowering real wages, it tends to be
negative. The latter case is probably more applicable in a ‘no deal’ Brexit (though
there would be some offset from any tariffs introduced on imports from the EU).
5.47 As mentioned above, alongside these ‘indirect’ effects, there would be several ‘direct’
impacts on the public finances. For instance, the end to full UK contributions to the EU
budget would reduce public spending – but this might be tempered by the costs of any
financial settlement and offset by domestic commitments. On the tax side, there would be
direct revenue consequences from any changes in tariff policy: if the UK left the customs
union, it would retain customs revenues instead of remitting them to the EU. And the
Government would be faced with other policy choices, such as whether to incur the costs of
setting up new IT systems, and whether to use fiscal policy to offset temporary disruption.
5.48 Taking all this together, what can we usefully say about the fiscal implications of a ‘no deal’ Brexit, were it to happen? First, the range of possible outcomes is clearly large, given the
uncertainty both around the economic impact and around the nature and effectiveness of
any policy response. Second, while the short-term shock to the economy would no doubt
have fiscal costs, the more significant channels would probably be via its impact on
potential output. Third, the direct fiscal effects of any policy response would also affect the
final path of the deficit, though this is presently unknowable.
Economic and fiscal outlook 162

A Policy measures announced since October
Overview
A.1 Our Economic and fiscal outlook (EFO) forecasts incorporate the expected impact of the
policy decisions announced since our previous forecast. In full ‘fiscal events’, like a Budget,
the Government provides us with draft estimates of the Exchequer cost or gain from each
policy measure it is considering. We discuss these with the relevant experts and then suggest
amendments as necessary. This is an iterative process where individual measures can go
through several stages of scrutiny. For this Spring Statement, almost all the policy measures
we have factored in were announced between the Budget and now.
A.2 We choose whether to certify costings as ‘reasonable and central’, and whether to include them – or alternative costings of our own – in our forecast. We do not scrutinise individual
changes to spending within departmental expenditure limits (DELs), but rather make a
judgement on the extent to which the Government’s overall resource and capital spending limits will be over- or underspent. We are also responsible for assessing any indirect effects
of policy measures on our economy forecast, such as excise duty changes affecting inflation.
A.3 The Government has announced 20 new policies since the Budget (Table A.2). The process
for scrutinising these costings worked reasonably efficiently, and most information was
provided in a timely manner. Our main concern was around the estimated effects on
disability benefits spending of the changes associated with completing the transition of
working-age claimants from disability living allowance to personal independence payment.
A.4 At Budget 2018 there was a package of costings relating to universal credit that we were
unable to certify on the basis of the information provided at the time. Ahead of this forecast
we asked DWP analysts to provide us with updated and additional material on these
measures. After scrutinising this additional material, some corrections proved necessary – as
we suspected – although thankfully these were relatively small (see paragraph A.22).
Government policy decisions
A.5 Table A.1 presents the aggregate direct and indirect effects of all new policy
announcements, while Table A.2 presents the measure-by-measure breakdown. The overall
direct effect is a small giveaway in all years, driven by higher spending.
163 Economic and fiscal outlook
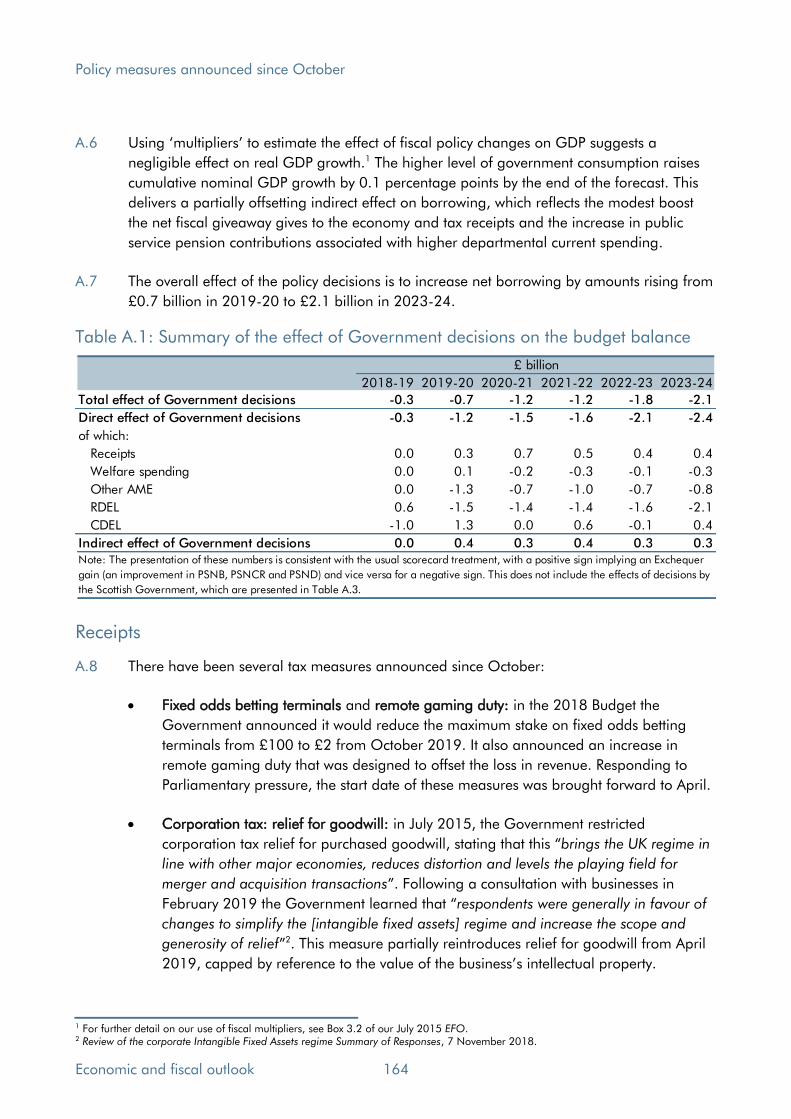
Policy measures announced since October
A.6 Using ‘multipliers’ to estimate the effect of fiscal policy changes on GDP suggests a
negligible effect on real GDP growth.1 The higher level of government consumption raises
cumulative nominal GDP growth by 0.1 percentage points by the end of the forecast. This
delivers a partially offsetting indirect effect on borrowing, which reflects the modest boost
the net fiscal giveaway gives to the economy and tax receipts and the increase in public
service pension contributions associated with higher departmental current spending.
A.7 The overall effect of the policy decisions is to increase net borrowing by amounts rising from
£0.7 billion in 2019-20 to £2.1 billion in 2023-24.
Table A.1: Summary of the effect of Government decisions on the budget balance
2018-19 2019-20 2020-21 2021-22 2022-23 2023-24
Total effect of Government decisions -0.3 -0.7 -1.2 -1.2 -1.8 -2.1
Direct effect of Government decisions -0.3 -1.2 -1.5 -1.6 -2.1 -2.4
of which:
Receipts 0.0 0.3 0.7 0.5 0.4 0.4
Welfare spending 0.0 0.1 -0.2 -0.3 -0.1 -0.3
Other AME 0.0 -1.3 -0.7 -1.0 -0.7 -0.8
RDEL 0.6 -1.5 -1.4 -1.4 -1.6 -2.1
CDEL -1.0 1.3 0.0 0.6 -0.1 0.4
Indirect effect of Government decisions 0.0 0.4 0.3 0.4 0.3 0.3
£ billion
Note: The presentation of these numbers is consistent with the usual scorecard treatment, with a positive sign implying an Exchequer
gain (an improvement in PSNB, PSNCR and PSND) and vice versa for a negative sign. This does not include the effects of decisions by
the Scottish Government, which are presented in Table A.3.
Receipts
A.8 There have been several tax measures announced since October:
• Fixed odds betting terminals and remote gaming duty: in the 2018 Budget the
Government announced it would reduce the maximum stake on fixed odds betting
terminals from £100 to £2 from October 2019. It also announced an increase in
remote gaming duty that was designed to offset the loss in revenue. Responding to
Parliamentary pressure, the start date of these measures was brought forward to April.
• Corporation tax: relief for goodwill: in July 2015, the Government restricted
corporation tax relief for purchased goodwill, stating that this “brings the UK regime in
line with other major economies, reduces distortion and levels the playing field for
merger and acquisition transactions”. Following a consultation with businesses in
February 2019 the Government learned that “respondents were generally in favour of
changes to simplify the [intangible fixed assets] regime and increase the scope and
generosity of relief”2. This measure partially reintroduces relief for goodwill from April
2019, capped by reference to the value of the business’s intellectual property.
1 For further detail on our use of fiscal multipliers, see Box 3.2 of our July 2015 EFO. 2 Review of the corporate Intangible Fixed Assets regime Summary of Responses, 7 November 2018.
Economic and fiscal outlook 164

Policy measures announced since October
• Disguised remuneration loan charge: extension of time limit: this measure introduces a
seven-year payment arrangement for individual users of disguised remuneration
schemes with current incomes below £30,000. Disguised remuneration schemes
involve an individual being paid via a loan, often through an offshore trust or an
employee benefit trust, rather than a salary. This arrangement allowed them to avoid
income tax and National Insurance contributions, while the terms of the loan meant it
was not paid back in practice. In Budget 2016 the Government sought to address this
by imposing a charge, due to begin in April 2019, on outstanding loan balances,
some of which dated back to 1999. The initial measure targeted employees, but the
loan charge was extended to the self-employed in a subsequent measure in Autumn
Statement 2016. In 2018 HMRC introduced a five-year payment arrangement for
those affected individuals with current incomes below £50,000. HMRC estimates that
the loan charge will affect up to 50,000 individuals, largely in the ‘business services’
sector. This change affects a relatively small number of prospective loan charge payers
by relatively small amounts, so is expected to cost under £5 million a year on average.
• Immigration health surcharge: this charge was brought in by the Coalition in 2015
and is payable upfront by individuals coming to live in the UK for longer than six
months. It was initially set as an annual payment of £200 per person and this measure
doubles that to £400.3 The increase came into effect from January and is due to raise
around £0.2 billion a year. We have been advised by the Treasury that the ONS is
likely to reclassify the surcharge as a tax rather than a service payment, so the charge
in full raises our tax receipts forecast by £0.4 billion a year from 2019-20 onwards.
The Government has decided to offset the effect of this on borrowing by removing the
same amount in ‘negative spending’ from RDEL, where the revenues were previously recorded.4 The Home Office has confirmed that, after deducting costs, the full amount
raised from the surcharge has been transferred to the NHS.5
• Probate fees: the Government has confirmed its plans to change the fees payable for
an application for a grant of probate. The new rates range between £250 and £6,000
depending on the value of the estate, and come into effect in April. The Treasury
expects the ONS to classify the new structure – with its 2,700 per cent increase in cost
for estates valued over £2 million – as a tax in the National Accounts. The new probate
fee structure is expected to generate £155 million a year in additional tax receipts.
There will be a small knock-on effect to inheritance tax receipts due to the incentive for
individuals with estates worth close to thresholds in the new probate fee structure to
reduce the value of their estates (through genuine or contrived means) to pay a lower
fee. This effect is expected to be relatively small (around £5 million a year), since the
inheritance tax liability itself already provides a significant incentive to reduce the value
3 This is £300 per year for a student or Tier 5 (Youth Mobility Scheme) visa, up from the £150 initially set. 4 The £0.2 billion offset in DEL associated with this new measure is shown in the ‘Immigration health surcharge’ line in Table A.2, while the remaining £0.2 billion offset – from the amount that would have been raised in the absence of this measure – is contained within the ‘Other RDEL changes’ line. 5 The transferred funds are divided between NHS England, NHS Wales, NHS Scotland and HSC in Northern Ireland, according to the Barnett formula.
165 Economic and fiscal outlook
Policy measures announced since October
of estates. The Government has decided to offset the expected yield from probate fees
by removing the same amount in ‘negative spending’ from RDEL.6
• EU emissions trading system (ETS): rescheduling of auctions: on 19 December 2018,
the European Commission announced that, from 1 January 2019, it was suspending
the issuance and surrender of UK allowances from the ETS, pending ratification of the
Withdrawal Agreement. In response, the Government decided to hold no auctions
during the first three months of 2019, and instead to auction 12 months’ worth of permits across the remaining months of 2019. The costing mostly reflects this timing
change – shifting some cash payments from 2018-19 to 2019-20, resulting in a shift
in revenue from 2019-20 to 2020-21 under the National Accounts accruals treatment.
Annually managed expenditure
A.9 The Government announced several policy changes relating to universal credit (UC) and
personal independence payment (PIP). These include:
• Restricting benefits for mixed age couples: delay: the Government has announced a
delay to this policy – originally announced in 2012 – that restricts access to pension
credit and pensioner housing benefit for couples where only one partner is above the
State Pension age. The original start date was 1 February 2019. It is now 15 May
2019. The delay will cost around £100 million across the forecast period.
• Universal credit: removing the two-child limit: this measure reverses the Summer
Budget 2015 announcement limiting the number of child elements that can be paid to
a family newly claiming UC but that has not claimed benefits in the preceding six
months and where all children were born before 6 April 2017 (along with some
exceptions after that date). This has a modest medium-term cost, but no long-term cost
since ultimately all children in the UC caseload will have been born after April 2017
and will therefore be subject to the existing two-child limit policy.
• Universal credit: savings from reprofiling: the Government has reshaped the UC
managed migration profile in a way that lowers the cost of UC by £0.2 billion over the
next five years – a broadly equivalent amount to the cost of the child-limiting policy
reversal. We discuss these two measures more fully in Chapter 4.
• Personal independence payment: delay full PIP rollout and reduce scheduled award
reviews: this measure has two elements. The ‘full PIP rollout’ has been delayed and we now assume that it will not be completed until February 2021 (rather than early 2020).
DWP has also announced that award reviews will cease for all those above State
pension age, unless requested by claimants. To deliver the rollout end date, DWP will
need to reduce other scheduled award reviews for working-age claimants due to
limited capacity to deliver all disability benefits assessments. We discuss this measure
in more detail in Chapter 4 too. Its impact is subject to high uncertainty.
6 Probate fees were due to raise around £50 million a year in the absence of this measure. The Government has decided to offset this too, and this amount is contained within the ‘Other RDEL changes’ line in Table A.2
Economic and fiscal outlook 166
Policy measures announced since October
A.10 Several measures were announced in the 2019-20 local government finance settlement:
• Eliminating negative revenue support grant in 2019-20: revenue support grant (RSG)
is a central government grant that local authorities can use to finance revenue
expenditure on any service. Negative RSG redistributes retained business rates revenue
from authorities that do not receive any RSG to other authorities. The Government has
announced it intends to eliminate negative RSG for affected authorities in 2019-20,
which in effect increases their retained business rates. We assume 75 per cent of this
gain to authorities will be added to their stock of reserves and the rest used to finance
local spending.
• Business rates retention: 75 per cent pilots: the Government has been piloting full
business rates retention since 2017-18. This measure launches 16 further pilots to run
in 2019-20 with a 75 per cent retention rate. As local authorities retain growth in
business rates revenues beyond a specified baseline, this boosts local authorities’ self-
financed spending beyond the amount forgone in central government grants.
• Council tax: police authority referendum principle threshold increase: this measure
raises the amount by which English police and crime commissioner authorities can
increase council tax without necessitating the calling of a local referendum (from £12
to £24 a year). We expect it to generate an average of just under £200 million a year
in additional council tax receipts that local authorities will spend.
A.11 Other Scottish Government AME: In October 2018 Scottish Government expenditure was
moved from central government DEL to AME, ostensibly because an increasing proportion
of expenditure is self-financed from taxation and thus falls outside Treasury control.
Changes in Scottish Government AME reported in Table A.2 largely relate to changes in the
Treasury’s block grant assumptions for the period beyond the current Spending Review.
They therefore refer to years in which actual block grant allocations have yet to be made.
Spending within departmental expenditure limits
A.12 Table A.1 shows that the aggregate effect of new policy announcements is to increase total
departmental spending in each year of the forecast, rising to £1.7 billion by 2023-24. Table
A.2 presents the measure-by-measure breakdown, including:
• Non-NHS RDEL spending: the Government has raised this in cash terms sufficiently to
hold spending flat in real terms relative to our latest GDP deflator forecast and from a
2019-20 base that reflects our latest underspend assumptions. This adds £0.5 billion a
year on average from 2019-20 onwards, rising to £0.8 billion in 2023-24.
• Additional NHS spending: the Government has maintained the real terms increase
agreed between the Government and the NHS in June 2018 given our October GDP
deflator forecast. This also adds amounts that rise to £0.8 billion in 2023-24.
• Other RDEL and CDEL changes: these are discussed in Chapter 4.
167 Economic and fiscal outlook
Policy measures announced since October
Financial transactions
A.13 Two policy changes affect our financial transactions forecast:
• UK Asset Resolution: since our October forecast, the Government has pushed back
completion of the sale of loan assets held within UK Asset Resolution from late 2018-
19 into early 2019-20. This delay changes the profile of expected proceeds, but does
not materially affect their overall size.
• Accelerated degrees: the Government has announced an increase in the annual fee
caps and maximum fee loans applying to accelerated degrees. Despite the 20 per cent
annual increase relative to standard full-time courses, with the maximum rising from
£9,250 to £11,100 a year, a student would still pay less in total on tuition fees for a
two-year course than a three-year equivalent. The costing assumes a significant rise in
the number of students on these courses, with the majority switching from standard
full-time courses. The net cost of the measure reflects the minority of new students who
would not otherwise have studied at degree level, plus the higher average fees for
students already planning to enrol on an accelerated course, slightly offset by lower
total outlays to students switching from three- to two-year courses. This increases the
public sector net cash requirement (and PSND) by around £10 million a year, but has
a negligible impact on PSNB due to changes in interest and write-offs.
Economic and fiscal outlook 168

Policy measures announced since October
Table A.2: Costings for Government policy decisions 3
Head 2018-19 2019-20 2020-21 2021-22 2022-23 2023-24
Total 0 -115 0 0 0 0
Receipts 0 -115 0 0 0 0
Total 0 +115 -5 0 0 0
Receipts 0 +115 -5 0 0 0
Corporation tax: relief for goodwill Total -5 -20 -50 -75 -100 -125
Receipts -5 -20 -50 -75 -100 -125
Total -5 -5 -5 neg neg neg
Receipts -5 -5 neg neg neg neg
AME neg neg neg neg neg neg
Probate fees Total 0 neg -5 -5 -5 -5
Receipts 0 +130 +145 +150 +155 +165
RDEL 0 -135 -150 -160 -165 -170
Immigration health surcharge Total 0 0 0 0 0 0
Receipts +30 +220 +205 +195 +190 +185
RDEL -30 -220 -205 -195 -190 -185
Total 0 -250 +270 0 0 0
Receipts 0 -250 +270 0 0 0
Total -10 -20 -20 -20 -20 -20
AME -10 -20 -20 -20 -20 -20
Total neg -45 -60 -65 -55 -55
AME neg -45 -60 -65 -55 -55
Total 0 neg -10 +15 +190 -20
AME 0 neg -10 +15 +190 -20
Total +10 +115 -70 -215 -255 -220
AME +10 +115 -70 -215 -255 -220
Total 0 -65 0 0 0 0
AME 0 -55 0 0 0 0
RDEL 0 -15 0 0 0 0
Total 0 -155 +140 0 0 0
AME 0 -910 +140 0 0 0
RDEL 0 +755 0 0 0 0
Total 0 0 0 0 0 0
Receipts 0 +175 +185 +190 +195 +200
AME 0 -175 -185 -190 -195 -200
Other Scottish Government AME Total -25 -125 -660 -775 -465 -515
AME -25 -125 -660 -775 -465 -515
Non-NHS RDEL spending Total 0 0 -290 -230 -660 -845
RDEL 0 0 -290 -230 -660 -845
Additional NHS spending Total 0 -45 -115 -165 -195 -840
RDEL 0 -45 -105 -150 -180 -770
AME 0 -5 -10 -15 -15 -70
Additional police funding Total 0 -100 0 0 0 0
RDEL 0 -95 0 0 0 0
AME 0 -10 0 0 0 0
Other RDEL changes Total +680 -1715 -640 -645 -400 -175
RDEL +680 -1715 -640 -645 -400 -175
Capital DEL reprofiling Total -965 +1285 +15 +610 -90 +415
CDEL -965 +1285 +15 +610 -90 +415
-325 -1155 -1505 -1575 -2055 -2405
Business rates retention: 75 per
cent pilots
Disguised remuneration loan
charge: extension of time limit
Restricting benefits for mixed age
couples: delay
Universal credit: removing the two-
child limit
PIP: delay full PIP rollout and
reduce scheduled award reviews
N/A
£ million
Direct effect of Government decisions
Note: The presentation of these numbers is consistent with the usual scorecard treatment, with negative signs implying an Exchequer
loss and a positive an Exchequer gain.
Universal credit: savings from
reprofiling
Eliminating negative revenue
support grant in 2019-20
Council tax: police authority
referendum principle increase
EU emissions trading system:
rescheduling of auctions
Fixed odds betting terminals: bring
forward start date
Remote gaming duty: bring
forward start date
Medium-low
Medium-low
High
Medium-low
Medium-low
Low
Uncertainty
Medium
N/A
N/A
N/A
High
Medium-low
Medium
Medium
Low
Medium
Medium-low
Medium
N/A
169 Economic and fiscal outlook

Policy measures announced since October
Scottish Government decisions since October
A.14 Our UK public finances forecasts are also affected by decisions taken by the devolved
administrations. These can affect UK-wide taxes, such as income tax and NICs, or those that
have been fully devolved such as the Scottish land and buildings transactions tax (LBTT).
Since October the Scottish Government has announced several new measures, the expected
costs and yields for which are presented in Table A.3:7
• Income tax: freeze the higher rate threshold: the higher rate threshold for Scottish
income tax payers will remain at £43,430 in 2019-20, further widening the gap
relative to taxpayers in the rest of the UK, where it rises to £50,000 in April 2019.
• LBTT: increase the additional dwelling supplement: this supplement – chargeable, for
example, on purchases of second homes and buy-to-let properties in Scotland – was
increased from 3 to 4 per cent, with effect from 25 January 2019. The yield from this
is less uncertain than the yield from introducing the supplement was in April 2016, but
nevertheless the behavioural response to the rise is uncertain.
• LBTT: commercial property rates and thresholds: the rates and thresholds for LBTT due
on purchases of commercial property will change. A lower rate of 1 per cent
(previously 3 per cent) will apply to transactions between £150,000 and £250,000
(previously the up to £350,000). The upper rate – applying to transactions above
£250,000 – will rise from 4.5 to 5 per cent.
• Scottish non-domestic rates: the Scottish Government announced several giveaways for
non-domestic ratepayers. The largest sets a rate for 2019-20 of 49 pence, lower than
would have prevailed if it had risen in line with RPI inflation as previously assumed.
• Scottish landfill tax: banning biodegradable municipal waste: in 2012 the Scottish
Parliament passed legislation banning the landfilling of biodegradable municipal
waste in Scotland from January 2021. We now have sufficient information to include
the year-by-year effects of this policy in our forecast. It is expected to reduce Scottish
landfill tax receipts significantly, but mostly to the benefit of UK landfill tax receipts by
diverting waste to England. The scale of this behavioural response is highly uncertain.
• Council tax: lifting the cap in Scotland: Scottish local authorities will be allowed to
raise council tax by up to 4.79 per cent in 2019-20 – more than previously assumed.
We assume that Scottish local authorities will spend this additional revenue.
7 For more detailed information on the costings for the devolved taxes see our Devolved taxes and spending forecasts publication produced alongside this EFO and available on our website. Costings that relate to the devolved taxes should be considered alongside the fiscal consequences set out in the Treasury’s fiscal framework agreements with the Scottish and Welsh Governments respectively.
Economic and fiscal outlook 170
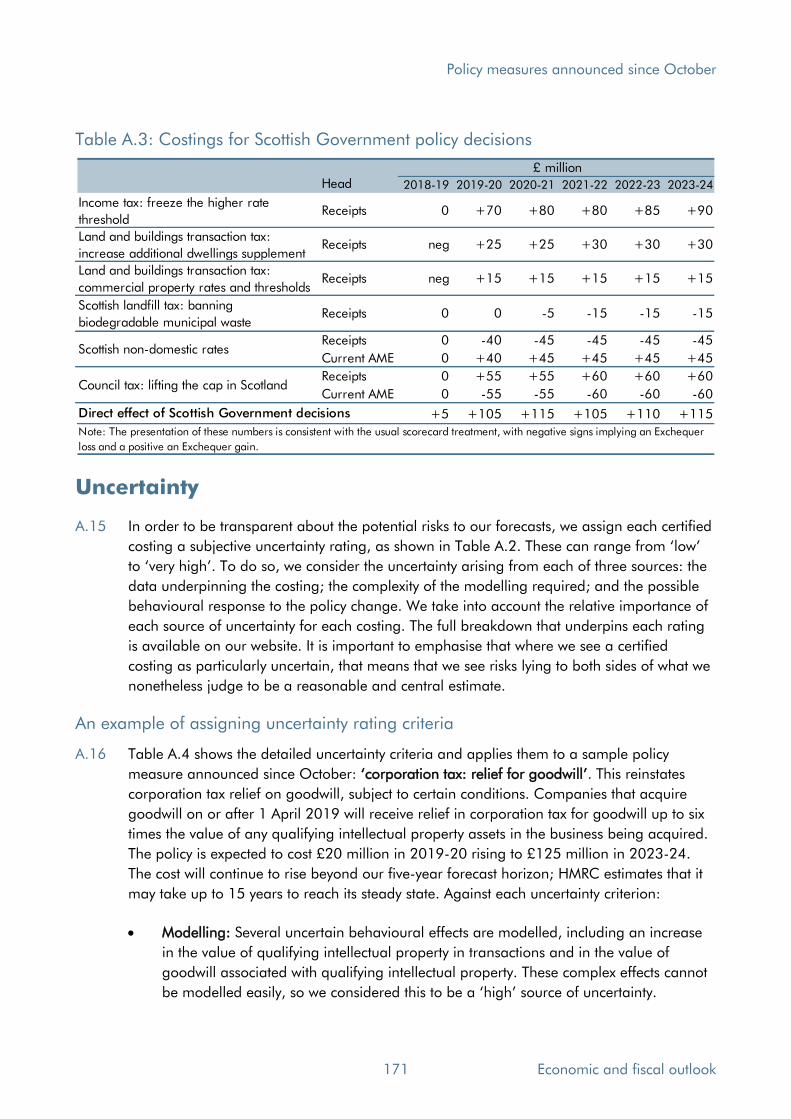
Policy measures announced since October
Table A.3: Costings for Scottish Government policy decisions 3
Head 2018-19 2019-20 2020-21 2021-22 2022-23 2023-24
Income tax: freeze the higher rate
thresholdReceipts 0 +70 +80 +80 +85 +90
Land and buildings transaction tax:
increase additional dwellings supplementReceipts neg +25 +25 +30 +30 +30
Land and buildings transaction tax:
commercial property rates and thresholdsReceipts neg +15 +15 +15 +15 +15
Scottish landfill tax: banning
biodegradable municipal wasteReceipts 0 0 -5 -15 -15 -15
Receipts 0 -40 -45 -45 -45 -45
Current AME 0 +40 +45 +45 +45 +45
Receipts 0 +55 +55 +60 +60 +60
Current AME 0 -55 -55 -60 -60 -60
+5 +105 +115 +105 +110 +115
£ million
Direct effect of Scottish Government decisions
Note: The presentation of these numbers is consistent with the usual scorecard treatment, with negative signs implying an Exchequer
loss and a positive an Exchequer gain.
Council tax: lifting the cap in Scotland
Scottish non-domestic rates
Uncertainty
A.15 In order to be transparent about the potential risks to our forecasts, we assign each certified
costing a subjective uncertainty rating, as shown in Table A.2. These can range from ‘low’
to ‘very high’. To do so, we consider the uncertainty arising from each of three sources: the
data underpinning the costing; the complexity of the modelling required; and the possible
behavioural response to the policy change. We take into account the relative importance of
each source of uncertainty for each costing. The full breakdown that underpins each rating
is available on our website. It is important to emphasise that where we see a certified
costing as particularly uncertain, that means that we see risks lying to both sides of what we
nonetheless judge to be a reasonable and central estimate.
An example of assigning uncertainty rating criteria
A.16 Table A.4 shows the detailed uncertainty criteria and applies them to a sample policy
measure announced since October: ‘corporation tax: relief for goodwill’. This reinstates
corporation tax relief on goodwill, subject to certain conditions. Companies that acquire
goodwill on or after 1 April 2019 will receive relief in corporation tax for goodwill up to six
times the value of any qualifying intellectual property assets in the business being acquired.
The policy is expected to cost £20 million in 2019-20 rising to £125 million in 2023-24.
The cost will continue to rise beyond our five-year forecast horizon; HMRC estimates that it
may take up to 15 years to reach its steady state. Against each uncertainty criterion:
• Modelling: Several uncertain behavioural effects are modelled, including an increase
in the value of qualifying intellectual property in transactions and in the value of
goodwill associated with qualifying intellectual property. These complex effects cannot
be modelled easily, so we considered this to be a ‘high’ source of uncertainty.
171 Economic and fiscal outlook

Policy measures announced since October
• Data: This is the most important source of uncertainty in this costing. The data used
are from 2016-17 company accounts, with subsequent examination of the top 100
cases of goodwill determining the relationship between goodwill and intellectual
property that would qualify for relief were the new relief to be in place. While broadly
reliable, the data are subject to two key potential issues. First, the share of goodwill
estimated to be intellectual property qualifying for relief is uneven across time. Second,
the top 100 cases cover less than half the net book value of goodwill in 2016-17. As
such, there is uncertainty around how well the results from the data analysed will
represent the whole population of goodwill purchases potentially affected. We
considered this to be a ‘high’ source of uncertainty too.
• Behaviour: Several behavioural effects are considered in this costing, including firms
waiting until 2019-20 to complete acquisitions and companies being induced to bring
further goodwill into the scope of the relief. The extent of these behavioural effects is
largely based on judgement from relevant compliance officials in HMRC. We
considered this to be a ‘medium’ source of uncertainty.
Taking all these into account, we gave the costing an overall rating of ‘High’.
Table A.4: Assigning uncertainty rating criteria to ‘Corporation tax: relief for goodwill’
3Rating Modelling Data Behaviour
Significant modelling challenges
Poor quality
Significant modelling challenges
Much of it poor quality
Some modelling challenges Basic data
May be from external sources
Assumptions cannot be
readily checked
Some modelling challenges Incomplete data
High quality external sources
Verifiable assumptions
Straightforward modelling
Few sensitive assumptions
required
Low
Straightforward modelling of
new parameters for existing
policy with few or no sensitive
assumptions
High quality dataWell established, stable and
predictable behaviour
Importance Medium High Low
Overall High
Medium-Low High quality data Behaviour fairly predictable
Medium-HighSignificant policy for which
behaviour is hard to predict
Difficulty in generating an
up-to-date baseline and
sensitivity to particular underlying
assumptions
Medium
Considerable behavioural
changes or dependent on
factors outside the system
Difficulty in generating an
up-to-date baseline
Very High
Very little dataNo information on potential
behaviourMultiple stages and/or high
sensitivity on a range of
unverifiable assumptions
High
Little dataBehaviour is volatile or very
dependent on factors outside
the tax/benefit system
Multiple stages and/or high
sensitivity on a range of
unverifiable assumptions
Economic and fiscal outlook 172

Policy measures announced since October
Other highly uncertain measures
A.17 There is only one other measure factored into this forecast to which we have assigned a
‘high’ uncertainty rating: ‘personal independence payment (PIP): delay full PIP rollout and
reduce scheduled award reviews’. This costing reflects announcements from DWP Ministers
in December (delaying the managed migration of DLA cases to PIP – the ‘full PIP rollout’) and March (to stop scheduled award reviews for claimants over the State Pension age,
unless they request one). It assumes the removal of some other award reviews for younger
claimants in order to deliver the full PIP rollout to the timetable set by Ministers.
A.18 Modelling is the most important source of uncertainty. Delaying ‘full PIP rollout’ affects
spending on DLA and PIP, and both forecast models were used in the costing. But ensuring
consistency of assumptions across the cases affected was challenging. The award review
modelling relies on proxies for the caseload and the likelihood of having an award review,
as well as the effect of a maturing caseload on the baseline number of scheduled award
reviews that would have taken place for claimants over the State Pension age. We consider
modelling to be a ‘high’ source of uncertainty. The behavioural response to removing scheduled award reviews is also uncertain. We consider behaviour to be a ‘medium-high’ source of uncertainty. Overall, we assign this costing a ‘high’ uncertainty rating.
Update on previous measures
A.19 We cannot review and re-cost all previous measures each time we produce a new forecast
(the volume of them being simply too great), but we do look at any for which the original (or
revised) costings are under- or over-performing, and at costings that we have previously
identified as subject to particular uncertainty, including in respect of operational delivery.
Policy reversals
A.20 Two of the Government’s new measures – ‘corporation tax: relief for goodwill’ and
‘universal credit: removing the two-child limit’ – reverse ones that were announced in 2015.
Indeed, the latter continues the steady process of dropping parts of the Summer Budget
2015 package of welfare cuts that were announced by the then Chancellor with the aim of
cutting £12 billion a year from working-age welfare spending by 2019-20. That started with
the decision later in 2015 not to go ahead with large cuts to tax credit entitlement, the
equivalent of which in universal credit have been largely reversed via subsequent increases
in the generosity of the income taper (in the 2016 Autumn Statement) and the work
allowances (in the 2018 Budget). Two further new policies – those relating to fixed odds
betting terminals and remote gaming duty – were announced in the 2018 Budget, but just
over a fortnight later the Government bowed to pressure to bring forward their start dates
from October to April 2019. Table A.2 sets out the costing for these four measures.
173 Economic and fiscal outlook

Policy measures announced since October
Policy delays
A.21 In order to certify costings as central, we need to estimate when – as well as by how much – measures will affect the public finances. As we have set out in previous EFOs, many
announced policy measures do not follow the timetable factored into the original costings – even where we have required greater contingency margins to be assumed before certifying
the measure. This continues to pose a risk to our forecast. The policy delays we have been
notified about for this forecast include:
• Personal independence payment: full PIP rollout: as described above.
• Restricting benefits for mixed age couples: delay: also described above.
• Dynamic coding out of debt: this measure, announced in Autumn Budget 2017, will
enable HMRC to bring forward collection of self-assessment income tax debts by
coding out closer to real-time, rather than waiting until the subsequent fiscal year. IT
problems have seen the start date pushed back from April 2019 to October 2019.
• Tax credits debt: enhanced collection: this measure, also announced in Autumn
Budget 2017, and due to begin in April 2018, was designed to facilitate the smooth
transfer of certain tax credits debt from HMRC to DWP. In March 2018, HMRC told us
that IT problems meant a delay to October 2018, before that timetable slipped again
to March 2019. Now, after further delays, this time in testing the IT solution, it is
planned to go live in May 2019. The original costing expected the measure to yield
£60 million in 2018-19 and £180 million in 2019-20. This has been revised down to
nil and £75 million respectively. HMRC is confident the revised timetable will be met,
though past evidence compels us to note it as a continuing risk.
• Extending landfill tax to illegal waste sites: this measure made waste disposals at sites
without an environmental permit liable for landfill tax. It was announced in the 2017
Autumn Budget and was due to begin in April 2018. The original costing was
predicated on HMRC recruiting the necessary compliance staff ahead of that date,
which it did. But it did not allow for a delay in putting the relevant health and safety
procedures in place to safeguard those staff. This delay means compliance activity only
began in September 2018, reducing the expected yield in 2018-19.
Other policy updates
A.22 We have incorporated updates to several other measures in this forecast. First, we have
revisited the Budget 2018 package of universal credit measures that we were unable to
certify as ‘reasonable and central’ at the time. We noted in October that “Experience warns
that mistakes are inevitable when such changes are estimated in haste late in a Budget
process”. This has proved to be the case, although thankfully the issues that were revealed
in the recosting process were relatively minor. First, DWP analysts were not aware of the
Budget income tax personal allowance measures. These affect universal credit because
awards are tapered with post-tax income. Factoring this in reduces the cost of the package
Economic and fiscal outlook 174

Policy measures announced since October
modestly. Second, errors were identified in the modelling of certain elements where
incorrect baselines had been used and there was insufficient time for quality assurance
processes to pick that up. These were the kinds of issues that we had in mind when
choosing not to certify the package in October. This updated costing lowers the overall cost
by around £100 million a year, so that it now reaches £2.0 billion in 2023-24.
A.23 Other updates include:
• Corporation tax reliefs: in October, we reported on the rising cost of corporation tax
reliefs, including R&D tax credits and ‘creative’ sector reliefs. Company tax credits were
expected to cost £5 billion a year by 2023-24. This has been revised up by around 12
per cent a year in this forecast, with increases across both categories. Our latest
forecast for 2023-24 is £5.6 billion, continuing the substantial increase in cost since
2015-16. We will work with HMRC to examine the reasons for the continuing growth
in the costs of these and other tax reliefs and will return to the issue in a future report.
• Corporation tax: bank compensation payments: this was announced at Summer
Budget 2015 to prevent banks from obtaining corporation tax (CT) deductions for
provisions they had set aside to compensate customers, mainly relating to payment
protection insurance (PPI). In March 2017, the Financial Conduct Authority announced
a 29 August 2019 deadline for PPI claims, which prompted an increase in claims. This
avoided the loss of around £0.3 billion of revenue in 2017-18, £0.1 billion more than
originally forecast, as banks responded by increasing provisions but these were not
deductible for CT purposes. HMRC believes that additional PPI-related provisions are
unlikely, and that the existing stock will probably unwind by the end of 2019-20. This
has lowered our CT forecast by an average of £0.1 billion in 2018-19 and 2019-20.
• Alcohol wholesaler registration scheme: in December 2013 a mandatory registration
scheme for alcohol wholesalers was announced. Licenses would only be issued to
operators passing a ‘fit and proper’ test. It took effect in January 2016, and initial
outturn data suggested fewer, but higher value, cases than originally expected. In
November 2017 we revised the average value of a case from £50,000 to £254,000.
The average yield has since fallen to £142,000, prompting us to lower the expected
yield from this measure by around £100 million a year. This remains uncertain. The
mix of traders registering has also changed relative to what was originally expected,
with small breweries and distilleries accounting for most new applications in the past
two years, reflecting the rising popularity of craft beers and gins.
• Soft drinks industry levy: this measure came into effect (on time) in April 2018, two
years after it was announced in the 2016 Budget. It was originally expected to raise
over £500 million a year, but this estimate was subsequently revised down as
manufacturers appeared to be lowering the sugar content of their drinks by more than
originally thought. Revised data also suggested the tax base had been significantly
overestimated. Our October forecast was for receipts of £250 million a year. We now
have outturn data for the first three quarters of the levy’s operation, which have prompted us to revise that up to around £340 million a year. Several factors could
175 Economic and fiscal outlook

Policy measures announced since October
explain the unexpected strength in receipts relative to our October forecast: consumers
may be less price sensitive than previously thought; the tax base could be larger;
reformulation could be taking place more slowly; or the assumed tax gap could be
smaller than previously assumed.
• Help to Buy ISA and Lifetime ISA: these are savings products providing a regular top-
up from the Government. We have previously reported that initial take-up for both – which we highlighted as highly uncertain at the time of the original costings – has
fallen short of expectations. We have revised down top-up related spending on both
further in this forecast. The Help to Buy ISA was announced in the 2015 Budget and
launched in December that year. We expect spending to average £170 million over
the current forecast period, down 13 per cent on our October forecast. The 2015
Budget costing expected spending to rise to £835 million in 2019-20 – our latest
estimate for that year is £150 million, a shortfall of 82 per cent. The Lifetime ISA was
announced in the 2016 Budget and took effect in April 2017. Further weakness in
outturns since our October forecast have led us to revise spending down by around 20
per cent a year. The original costing expected it to reach £845 million in 2020-21 – our current forecast is £420 million, a shortfall of 50 per cent.
• Help to Save: in the 2016 Budget, the Government announced the introduction of a
regular savings account for certain low-income recipients of tax credits and universal
credit. Savers can save up to £50 a month and receive a 50 per cent top-up from the
Government after two years, with an option to continue saving for a further two years.
After a six-month delay, Help to Save was launched in September 2018. Take-up was
always expected to be low as the target population is not one that typically has money
spare for regular savings. Year-to-date outturns suggest the number of new accounts
has been lower than we expected. Our October forecast assumed 195,000 accounts
would be opened by the end of 2018-19, but by the end of January there were only
90,450 live accounts. We have therefore lowered our forecast for spending on top-ups
by around 50 per cent from 2020-21 onwards, when the first accounts mature.
• Making tax digital: since our October forecast, HMRC reports that progress has been
made with its making tax digital programme, ahead of the full launch in April. At the
time of writing, 37,000 VAT businesses had signed up 8 and by the end of April this is
due to rise to around 300,000. We will revisit this in future forecasts.
• Common reporting standard and worldwide disclosure facility: This Budget 2015
announcement gave UK taxpayers the opportunity to disclose their tax affairs
voluntarily – via the ‘worldwide disclosure facility’ (WDF) – before HMRC received
details about offshore financial accounts as part of an international exchange of
information – the common reporting standard (CRS). In October, we revised down the
expected WDF yield in 2018-19 from £235 million to £195 million, to reflect an
assumed change in the settlement pattern. HMRC has informed us that, by end of
8 This includes all businesses and clients (signed up by their agents). It includes a mixture of customers above and below the VAT threshold.
Economic and fiscal outlook 176

Policy measures announced since October
January, around £120 million had been disclosed directly through the WDF.9 HMRC
has also told us that it has now had two successful CRS data exchanges – 1.5 million
accounts in September 2017 and a further 5 million in September 2018. HMRC is
conducting compliance activity based on the first exchange, while the second remains
at the data-processing stage. We have asked HMRC to report on both the WDF and
the CRS ahead of our autumn forecast.
• Customs declaration service: HMRC’s customs declaration service (CDS) – built to
handle 300 million import and export declarations a year – will be rolled out at a
slower pace than we reported in October. It had been scheduled to be fully rolled out
in March 2019 but, at the time of writing, CDS has only processed 500 declarations
from four traders.10 Instead, HMRC has prioritised the upgrading of its existing
‘customs handling of import and export freight’ (CHIEF) system and remains confident
that its existing operations will not be affected. The risk posed by the smooth operation
of these systems to our forecasts for VAT and customs duties would be greater in
scenarios in which customs duties were levied on imports from the EU – which is not a
feature of the broad-brush Brexit assumptions that underpin our central forecast.
HMRC agrees there are revenue risks from running a sub-optimal customs model,
such as in a ‘no deal’ Brexit, and that these largely arise from a potential lack of
readiness from businesses submitting customs declarations, rather than its systems.
• Support for mortgage interest: in Summer Budget 2015, the Government announced
that, from April 2018, support for mortgage interest (SMI) would switch from being a
non-repayable benefit payment to an interest-bearing loan, secured against a
mortgaged property and due to be repaid upon death or the sale of the property. This
measure was originally due to reduce welfare spending by £270 million in 2018-19
and to increase lending (which affects debt but not the deficit) by a broadly equivalent
amount. While the effect on spending has happened, far fewer people than expected
have taken up the loan instead. As a result we have made successive downward
revisions to SMI-related lending (see Chart A.1). We now expect just 24,000 claimants
to take-up the loan in 2018-19, compared to 98,000 expected originally, a shortfall of
76 per cent. We have revised down take-up in future years too. But we have revised
down lending by less than the number of recipients, because the average loan size
among those fewer-than-expected recipients has been larger than assumed.
9 Some of this amount has not yet been finalised. 10 HMRC evidence to the Public Accounts Committee, 4 March 2019, and National Audit Office report on The UK border: preparedness for EU exit update, 27 February 2019.
177 Economic and fiscal outlook
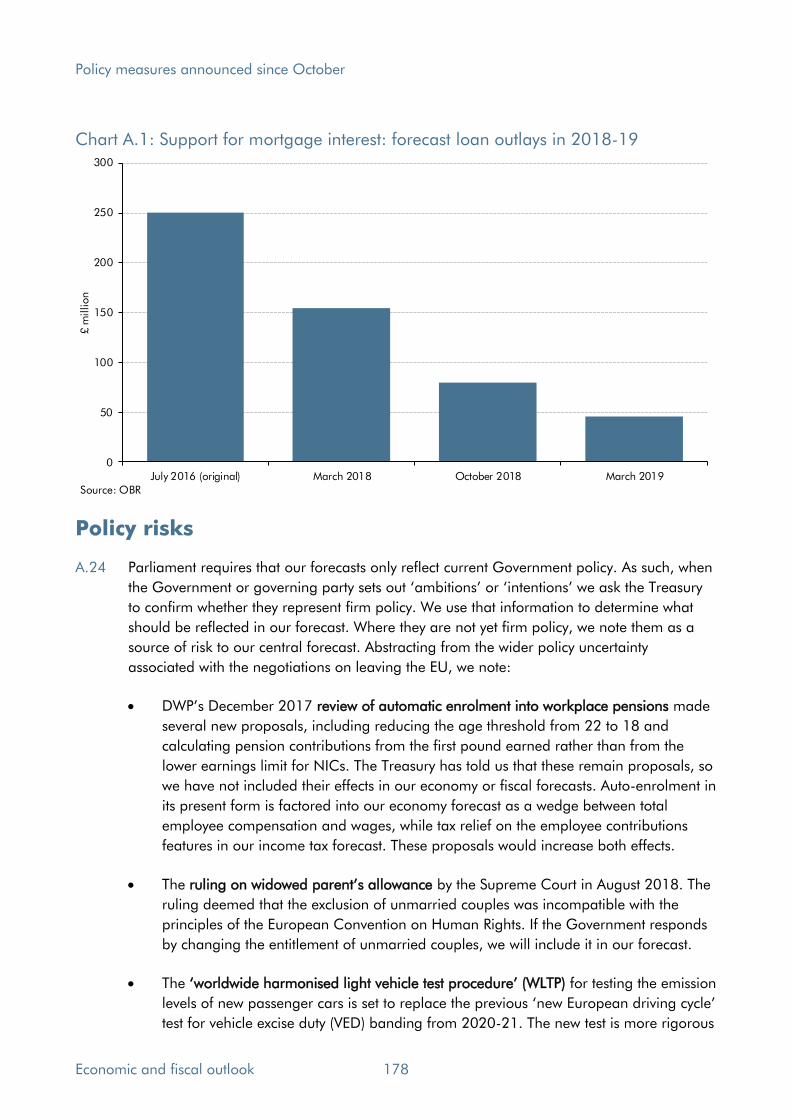
Policy measures announced since October
Chart A.1: Support for mortgage interest: forecast loan outlays in 2018-19
0
50
100
150
200
250
300
July 2016 (original) March 2018 October 2018 March 2019
£ m
illion
Source: OBR
Policy risks
A.24 Parliament requires that our forecasts only reflect current Government policy. As such, when
the Government or governing party sets out ‘ambitions’ or ‘intentions’ we ask the Treasury to confirm whether they represent firm policy. We use that information to determine what
should be reflected in our forecast. Where they are not yet firm policy, we note them as a
source of risk to our central forecast. Abstracting from the wider policy uncertainty
associated with the negotiations on leaving the EU, we note:
• DWP’s December 2017 review of automatic enrolment into workplace pensions made
several new proposals, including reducing the age threshold from 22 to 18 and
calculating pension contributions from the first pound earned rather than from the
lower earnings limit for NICs. The Treasury has told us that these remain proposals, so
we have not included their effects in our economy or fiscal forecasts. Auto-enrolment in
its present form is factored into our economy forecast as a wedge between total
employee compensation and wages, while tax relief on the employee contributions
features in our income tax forecast. These proposals would increase both effects.
• The ruling on widowed parent’s allowance by the Supreme Court in August 2018. The
ruling deemed that the exclusion of unmarried couples was incompatible with the
principles of the European Convention on Human Rights. If the Government responds
by changing the entitlement of unmarried couples, we will include it in our forecast.
• The ‘worldwide harmonised light vehicle test procedure’ (WLTP) for testing the emission
levels of new passenger cars is set to replace the previous ‘new European driving cycle’
test for vehicle excise duty (VED) banding from 2020-21. The new test is more rigorous
Economic and fiscal outlook 178
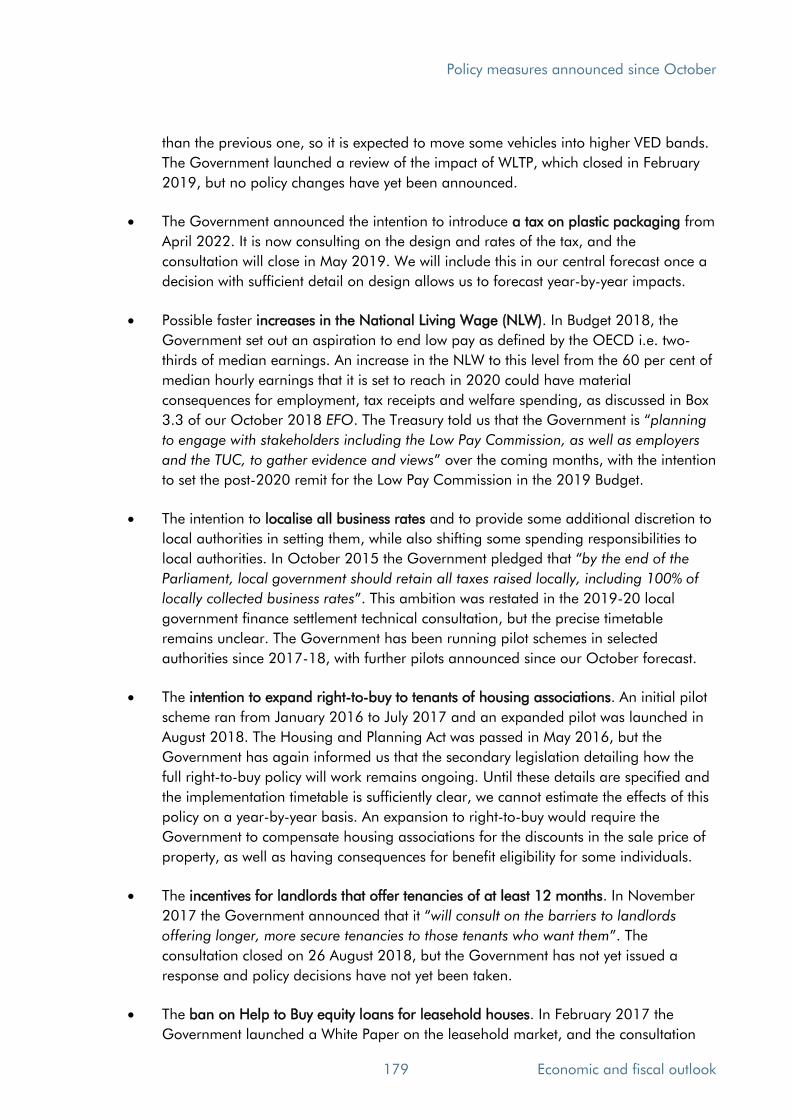
Policy measures announced since October
than the previous one, so it is expected to move some vehicles into higher VED bands.
The Government launched a review of the impact of WLTP, which closed in February
2019, but no policy changes have yet been announced.
• The Government announced the intention to introduce a tax on plastic packaging from
April 2022. It is now consulting on the design and rates of the tax, and the
consultation will close in May 2019. We will include this in our central forecast once a
decision with sufficient detail on design allows us to forecast year-by-year impacts.
• Possible faster increases in the National Living Wage (NLW). In Budget 2018, the
Government set out an aspiration to end low pay as defined by the OECD i.e. two-
thirds of median earnings. An increase in the NLW to this level from the 60 per cent of
median hourly earnings that it is set to reach in 2020 could have material
consequences for employment, tax receipts and welfare spending, as discussed in Box
3.3 of our October 2018 EFO. The Treasury told us that the Government is “planning
to engage with stakeholders including the Low Pay Commission, as well as employers
and the TUC, to gather evidence and views” over the coming months, with the intention
to set the post-2020 remit for the Low Pay Commission in the 2019 Budget.
• The intention to localise all business rates and to provide some additional discretion to
local authorities in setting them, while also shifting some spending responsibilities to
local authorities. In October 2015 the Government pledged that “by the end of the
Parliament, local government should retain all taxes raised locally, including 100% of
locally collected business rates”. This ambition was restated in the 2019-20 local
government finance settlement technical consultation, but the precise timetable
remains unclear. The Government has been running pilot schemes in selected
authorities since 2017-18, with further pilots announced since our October forecast.
• The intention to expand right-to-buy to tenants of housing associations. An initial pilot
scheme ran from January 2016 to July 2017 and an expanded pilot was launched in
August 2018. The Housing and Planning Act was passed in May 2016, but the
Government has again informed us that the secondary legislation detailing how the
full right-to-buy policy will work remains ongoing. Until these details are specified and
the implementation timetable is sufficiently clear, we cannot estimate the effects of this
policy on a year-by-year basis. An expansion to right-to-buy would require the
Government to compensate housing associations for the discounts in the sale price of
property, as well as having consequences for benefit eligibility for some individuals.
• The incentives for landlords that offer tenancies of at least 12 months. In November
2017 the Government announced that it “will consult on the barriers to landlords
offering longer, more secure tenancies to those tenants who want them”. The
consultation closed on 26 August 2018, but the Government has not yet issued a
response and policy decisions have not yet been taken.
• The ban on Help to Buy equity loans for leasehold houses. In February 2017 the
Government launched a White Paper on the leasehold market, and the consultation
179 Economic and fiscal outlook

Policy measures announced since October
on it closed in December 2017, with the Government subsequently announcing it
intended to bring forward “legislation to ban future leasehold house sales”. In July
2018, the Government announced it would in future stop Help to Buy funds being
used for “unjustified new leasehold houses”, but gave no timeframe for implementing
this. We have been told that the Government has not yet decided when it will do so.
• The consultation on the surcharge on stamp duty land tax for non-resident buyers
acquiring residential property in England and Northern Ireland was launched in
February 2019 and will close in May 2019. The design and implementation of this
policy remain subject to the outcome of the consultation.
• Prospective reforms to adult social care. Having postponed implementation of reforms
underpinned by the 2011 ‘Dilnot Commission’, the Government announced in
December 2017 that it would publish a green paper on the future of adult social care
in the summer of 2018. This too has been delayed, and a new date has yet to be set.
• The ‘Augur’ review of post-18 education funding was launched in February 2018 but
its publication date has yet to be announced. It covers the level, terms and duration of
students’ financial contribution to their post-18 education. Given the scale of outlays
on student loans, any ensuing policy changes could have material effects on our
forecast. These would also depend on the accounting changes discussed in Annex B.
• The Government announced the structures and buildings allowance at Budget 2018
saying it would “addresses a significant gap in the UK’s current capital allowances regime, and will improve the international competitiveness of the UK’s tax system”. On
the same day, HMRC published a technical report that set out how much of the benefit
gained from the allowance may eventually be clawed back through future increases in
capital gains tax liability. How this mechanism will work has yet to be finalised.
• The provision of a centrally funded clinical negligence scheme for general
practitioners. The Department of Health and Social Care has announced it wants to
“protect the general practice workforce against rising indemnity costs”, and will
therefore replace the current insurance system with a Government-run scheme from
April 2019. It has not yet detailed how this will operate and how it might affect the
Government’s contingent liabilities or the way in which GPs pay is determined.
A.25 Several policy risks relate to the devolution of fiscal powers:
• The devolution of corporation tax to Northern Ireland. The Corporation Tax (Northern
Ireland) Act received Royal Assent in March 2015, with devolution originally due to
have begun in April 2018. The Northern Ireland Executive has previously announced
its intention to set a 12.5 per cent rate to match that of the Republic of Ireland. While
primary legislation has been passed, final devolution is subject to agreement between
the UK Government and the Northern Ireland Executive. This has yet to be reached, as
the Executive is currently suspended, so the effect of the proposed tax cut has not been
included in our central forecast.
Economic and fiscal outlook 180

Policy measures announced since October
• The devolution of air passenger duty (APD) to the Scottish Parliament. The Scotland Act
2016 included provisions for the devolution of APD and the Scottish Government
initially announced this would be replaced by an air departure tax (ADT) from April
2018. But devolution has been delayed pending clarity over the Highlands and Islands
exemption. Both the UK and Scottish Governments have confirmed that devolution
remains on hold. The Scottish Government has previously said it intends to set ADT
rates at half the level of APD rates. As the timing of APD devolution is still uncertain,
we have not included it, or the effect of the proposed tax cut, in our central forecast.
• Further devolution of social security benefits to Scotland. The Scotland Act also allows
for the devolution of several benefits to the Scottish Parliament, including carer’s allowance and disability benefits. The Scottish Government set up a new executive
agency, Social Security Scotland, in April 2018, and started making carer’s allowance supplement payments in September 2018. The Scottish Government will take on legal
responsibility for disability benefits (worth around £2.5 billion a year) from 1 April
2020. It has published a consultation on their replacement. Devolution is unlikely to
affect spending materially, but as the details of the replacement system are yet to be
settled, we have not included that in our central forecast.
• The devolution of aggregates levy to Scotland and Wales. The Scotland Act 2016 also
provides for the devolution of aggregates levy to Scotland, and the UK Government
has announced its intention to devolve this tax to Wales as well. Devolution was
delayed pending completion of a court case regarding state aid, but legal proceedings
were dropped in February 2019, clearing the way for devolution to be implemented.
But the timeline for devolution has not been confirmed yet.
• The Scottish Government is considering the introduction of a ‘transient visitor levy’ (TVL) – the so-called ‘tourist tax’ – announced in the Scottish Budget in December
2018. The introduction and administration of the TVL would be left to local authorities;
the Scottish Government has said it has “no plans to implement such a tax” at a
Scotland level, but has launched a Scotland-wide consultation on the potential
legislation for powers to introduce it. The City of Edinburgh Council recently
announced that it intends to pursue a TVL, subject to Scottish Parliament legislation.
A.26 There are many policy uncertainties regarding Brexit that are discussed throughout this
document. We also reviewed the uncertainties around possible substitute spending once the
UK’s contributions to the EU budget end in Annex B of our March 2017 EFO. There are also
several policy risks to specific to individual lines of our fiscal forecasts:
• The UK’s participation in the EU emissions trading system (ETS) beyond 2020. The
draft Withdrawal Agreement between the UK Government and the EU sets out that the
UK will remain in the scheme until the end of the transition period, but no decision has
been made on the details of what will happen beyond 2020, other than that the UK
will implement a system of carbon pricing of at least the same effectiveness and scope
as the EU ETS. The political declaration on the future relationship between the UK and
the EU states that the UK will consider linking a future carbon pricing system with the
181 Economic and fiscal outlook

Policy measures announced since October
EU ETS. The Government has also legislated for the introduction of a carbon emissions
tax from April 2019 if the UK were to leave the EU without a deal.
• The access to funding for higher education for EU students beyond 2020. The draft
Withdrawal Agreement provides for EU students to retain access to funding during the
transition period, but no decision has been made on what will happen beyond 2020.
• The support scheme for traders facing import VAT on goods imported from the EU.
The Government has announced it will introduce deferred accounting for import VAT
on goods from the EU in the event of a ‘no deal’ Brexit. But it has not decided on what
support scheme would be put in place after the transition period.
Economic and fiscal outlook 182

B Accounting for student loans
Introduction
B.1 The stock of student loans in the UK has been rising rapidly in recent years, thanks to the
larger size of the loans offered to English students since 2012 and the relatively high rate at
which interest accrues on outstanding balances. Student loans therefore play an important
role in our assessment of the sustainability of the public finances and the Government’s performance against its fiscal targets.
B.2 Unfortunately, the current National Accounts treatment is bedevilled by ‘fiscal illusions’ – as
we described in a working paper last year.1 This has been recognised by committees of both
Houses of Parliament.2 The subsidy cost of student loans is understated for decades while
their beneficial effect on revenue is overstated for decades, so they flatter the headline
budget deficit measure. And their value as government assets is ignored in the headline net
debt measure, but overstated in the broader net financial liabilities measure.
B.3 The Office for National Statistics (ONS) has a difficult job addressing these problems,
because existing international statistical guidance did not envisage governments issuing
loans with high expected write-offs, with repayments that look more like income tax than
debt service, and that accrue interest at relatively high rates but that is not expected to be
paid in full. In July 2018 the ONS published an article outlining potential improvements to
the recording of income-contingent student loans.3 Our working paper described the
deficiencies of the current approach and illustrated the fiscal impacts of different potential
methodologies. We updated them in our October 2018 Economic and fiscal outlook (EFO).
B.4 On 17 December the ONS published a follow-up article laying out its plans and Eurostat
published bilateral advice on the recording of such loans.4,5 The ONS intends to move from
the current approach of treating student loans as conventional loans to one that treats them
as a part-grant, part-loan hybrid (which it calls the ‘partitioned loan-transfer approach’). It
intends to publish provisional estimates under the new treatment in the June 2019 public
finances release, before incorporating final estimates from September 2019.
B.5 As discussed in Chapter 4, there are too many uncertainties over the implementation of this
methodology for us to move our central forecast onto the new basis now. But clearly, once
1 Office for Budget Responsibility, Working paper No. 12: Student loans and fiscal illusions, July 2018. 2 House of Commons Treasury Committee, Student Loans Seventh Report of Session 2017-19, February 2018 and House of Lords Economic Affairs Committee, Treating Students Fairly: The Economics of Post-School Education Second Report of Session 2017-19, June 2018. 3 ONS, Looking ahead: developments in public sector finance statistics, July 2018. 4 ONS, New treatment of student loans in the public sector finances and national accounts, December 2018. 5 Eurostat, Ex ante advice on the recording of the UK student loans in Government Finance Statistics, December 2018.
183 Economic and fiscal outlook

Accounting for student loans
implemented, this change will have a material effect on the measured health of the public
finances – bringing the data closer to the true underlying picture. So in this annex we:
• set out the deficiencies of the current approach and the fiscal illusions caused;
• discuss the key attributes of the ONS’s proposed approach;
• present updated estimates of the impact of changing the methodology and how this
differs from the illustrative methodology we have used previously;
• discuss the key economic and policy determinants in the student loans forecast; and
• consider the potential for revisions to outturns and forecasts.
Fiscal illusions from student loans
B.6 Our working paper discussed the ‘fiscal illusions’ arising from the current treatment of student loans. Fiscal illusions occur where the accounting treatment of a transaction does
not reflect its economic reality well, either by over- or under-valuing transactions or by
recording them at a very different point in time from when the underlying activity took place.
B.7 Student loans are subject to both types of illusion under current National Accounts rules:
• the large subsidy element is only recognised when unpaid loans are written off several
decades in the future and beyond any government’s normal planning horizon;
• much more interest is recorded than will actually be paid, which flatters the deficit in
the medium term while increasing the amount that is then written off much later;
• by selling loans the Government can avoid ever recognising a spending element and
the associated impact on borrowing, creating perverse incentives;
• the loans are held on the balance sheet at their face value, which is considerably
higher than their true worth, flattering public sector net financial liabilities; but
• the loans are not counted as assets in public sector net debt (PSND), overstating their
actual detrimental impact on the sustainability of the public finances.
B.8 The ‘missing asset’ treatment in net debt reflects the standard definition of ‘liquid assets’ that are netted off this measure, so this fiscal illusion is created in respect of all loans, not
just student loans. The other illusions arise from the accounting treatment of student loans
specifically and it is these that the ONS’s revised treatment seeks to address.
B.9 This annex looks first at the flow issues (delayed recognition of spending and recording too
much interest income) and how the revised treatment by ONS will seek to address these,
before turning to asset sales and public sector net financial liabilities (PSNFL).
Economic and fiscal outlook 184
Accounting for student loans
B.10 Chart B.1 shows the cash and accrued flows associated with our latest forecast for the
cohort of students who are mostly taking out their first full-time Plan 2 student loan in
England in the 2018 academic year:6
• In the first few years, relatively large sums of money are handed to the borrowers, a
cash flow from the public to the private sector. Over the next several decades, the
borrowers make smaller cash repayments, returning cash from the private to the public
sector. (These cashflows determine the effect of student loans on the central
government net cash requirement (CGNCR) and PSND. They will not be affected by
the proposed ONS methodological changes.)
• The accruals treatment of these cashflows records no expenditure element when the
cash outlays take place, but accrues interest income that is capitalised onto the loan
balance for several decades. The mismatch between the cash and accrued flows is
resolved at the term of the loans, more than 30 years into the future, when any
outstanding balances are written off.
B.11 For this cohort the total cash balance is £16.2 billion of outlays minus £17.4 billion of
repayments or a £1.2 billion net gain to the Exchequer. (As we showed in last year’s working paper, this small net gain becomes a £13.2 billion net loss when the associated
financing costs are taken into account.) The public finances accrue no initial spending but
do accrue £29.3 billion in capitalised interest income over the lifetime of the loans. The
£28.1 billion difference between the accrued gain and the much smaller cash gain is
recorded as write-offs at the term of the loans.
Chart B.1: Current National Accounts treatment: the 2018 cohort
-30
-25
-20
-15
-10
-5
0
5
10
15
20
2018 2023 2028 2033 2038 2043 2048 2053
£ b
illion
Cash outlays
Cash repayments
Cumulative cash
Source: ONS, OBR
Cash treatment
-30
-25
-20
-15
-10
-5
0
5
10
15
20
2018 2023 2028 2033 2038 2043 2048 2053
£ b
illion
Write offs
Capitalised interest
Cumlative accruals
Accruals treatment
6 ‘Plan 2’ loans are the larger loans that have been in place since the funding reforms that took effect in 2012. For a fuller discussion of the different types of loans outstanding, see Chapter 2 of our July 2018 working paper. English Plan 2 loans dominate student loan outlays and are becoming increasingly dominant in the overall stock of outstanding student debt. On our latest forecast, 88 per cent of outstanding loans in 2023-24 will be English Plan 2 loans. This includes the effect of capitalised interest.
185 Economic and fiscal outlook
Accounting for student loans
B.12 In our working paper we concluded that a better treatment would record more spending as
the loans are extended, to reflect their subsidy element, and would reduce recorded interest
income sufficiently so that there is no need to write off any balances at the end of the life of
the loans. This would mean that upfront spending minus interest recorded would equal the
cash balance (for the 2018 cohort this would equal -£1.2 billion).
B.13 As we noted, there are many ways this could arithmetically be achieved. In our ‘hybrid’
illustration we took the simple approach of using the same scaling factor for both interest
and spending. For the 2018 cohort in our illustration, 62 per cent of the total amount
charged to borrowers is expected to be written off: because £17.4 billion of repayments are
expected to be made against £45.5 billion of loan balances ultimately outstanding (£16.2
billion of outlays plus £29.3 billion of capitalised interest). Recording 62 per cent of outlays
(£10.0 billion) as upfront expenditure would leave the remaining 38 per cent to be treated
as ‘genuine’ loans for which principal and interest will be repaid, and so 38 per cent of
capitalised interest (£11.2 billion) would be recorded as income. The effect of this illustrative
approach, relative to the current and proposed ones, is shown in Chart B.2 below.
The proposed ONS approach: part grant, part loan
B.14 The ONS and Eurostat have concluded that the accounting treatment should indeed change
and the ONS’s preferred approach is to treat the part of the cash outlay that the student is
expected to repay with interest as a loan and the part that s/he is not expected to repay as a
grant – its ‘partitioned loan-transfer approach’. Conceptually this is the same as the ‘hybrid’ approach in our working paper and will therefore involve recording more expenditure
upfront and less interest income thereafter, with the aim of having no write-offs at maturity.
The precise effects in any given year will be different to those in our working paper, in part
because the ONS intends to take a different approach to adjusting expenditure and income.
B.15 The ONS starts by noting that if there are to be no write-offs at the term of the loans, the
loan balance at maturity must be zero. Using estimates of the interest rate charged and the
cash amounts repaid in the final year allows the corresponding balance at the end of the
preceding year to be calculated. This can then be repeated for each preceding year to
reveal an opening loan balance and the proportion of the total initial outlay that is in effect
granted to the student. This is recorded as spending. Based on changes in the estimated
loan balances and the relevant interest rates, interest income can then be recalculated.
B.16 The other key difference is that the ONS intends to apply this approach at a more
disaggregated level than at the cohort level we have illustrated previously. The Department
for Education (DfE) has been developing its microsimulation model to be able to deliver this
methodology and has made significant progress for most loan types.7 We use the same
model when producing our medium-term forecasts and long-term projections, so once the
ONS methodology has been settled we will be able to replicate it in our forecasts.
7 For more details of the model see Department for Education, Student loan forecasts, England: 2017-18. Quality and methodology information, June 2018.
Economic and fiscal outlook 186
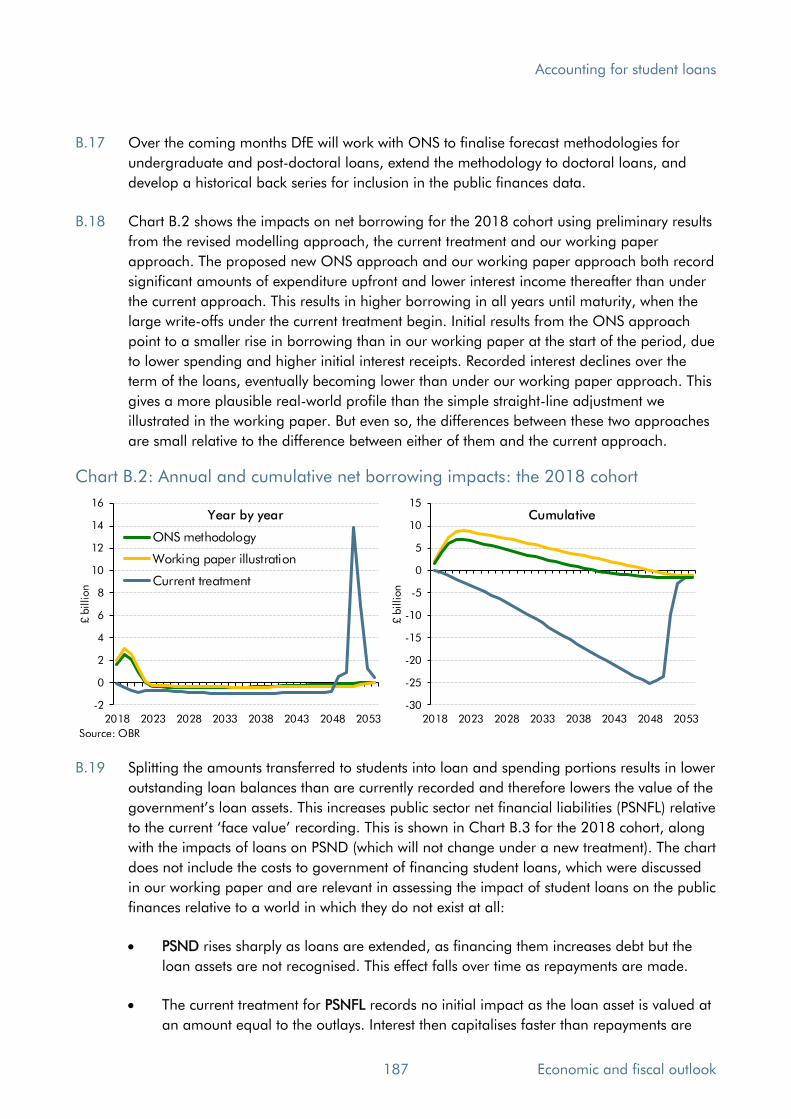
Accounting for student loans
B.17 Over the coming months DfE will work with ONS to finalise forecast methodologies for
undergraduate and post-doctoral loans, extend the methodology to doctoral loans, and
develop a historical back series for inclusion in the public finances data.
B.18 Chart B.2 shows the impacts on net borrowing for the 2018 cohort using preliminary results
from the revised modelling approach, the current treatment and our working paper
approach. The proposed new ONS approach and our working paper approach both record
significant amounts of expenditure upfront and lower interest income thereafter than under
the current approach. This results in higher borrowing in all years until maturity, when the
large write-offs under the current treatment begin. Initial results from the ONS approach
point to a smaller rise in borrowing than in our working paper at the start of the period, due
to lower spending and higher initial interest receipts. Recorded interest declines over the
term of the loans, eventually becoming lower than under our working paper approach. This
gives a more plausible real-world profile than the simple straight-line adjustment we
illustrated in the working paper. But even so, the differences between these two approaches
are small relative to the difference between either of them and the current approach.
Chart B.2: Annual and cumulative net borrowing impacts: the 2018 cohort
-2
0
2
4
6
8
10
12
14
16
2018 2023 2028 2033 2038 2043 2048 2053
£ b
illion
ONS methodology
Working paper illustration
Current treatment
Source: OBR
Year by year
-30
-25
-20
-15
-10
-5
0
5
10
15
2018 2023 2028 2033 2038 2043 2048 2053
£ b
illion
Cumulative
B.19 Splitting the amounts transferred to students into loan and spending portions results in lower
outstanding loan balances than are currently recorded and therefore lowers the value of the
government’s loan assets. This increases public sector net financial liabilities (PSNFL) relative
to the current ‘face value’ recording. This is shown in Chart B.3 for the 2018 cohort, along
with the impacts of loans on PSND (which will not change under a new treatment). The chart
does not include the costs to government of financing student loans, which were discussed
in our working paper and are relevant in assessing the impact of student loans on the public
finances relative to a world in which they do not exist at all:
• PSND rises sharply as loans are extended, as financing them increases debt but the
loan assets are not recognised. This effect falls over time as repayments are made.
• The current treatment for PSNFL records no initial impact as the loan asset is valued at
an amount equal to the outlays. Interest then capitalises faster than repayments are
187 Economic and fiscal outlook
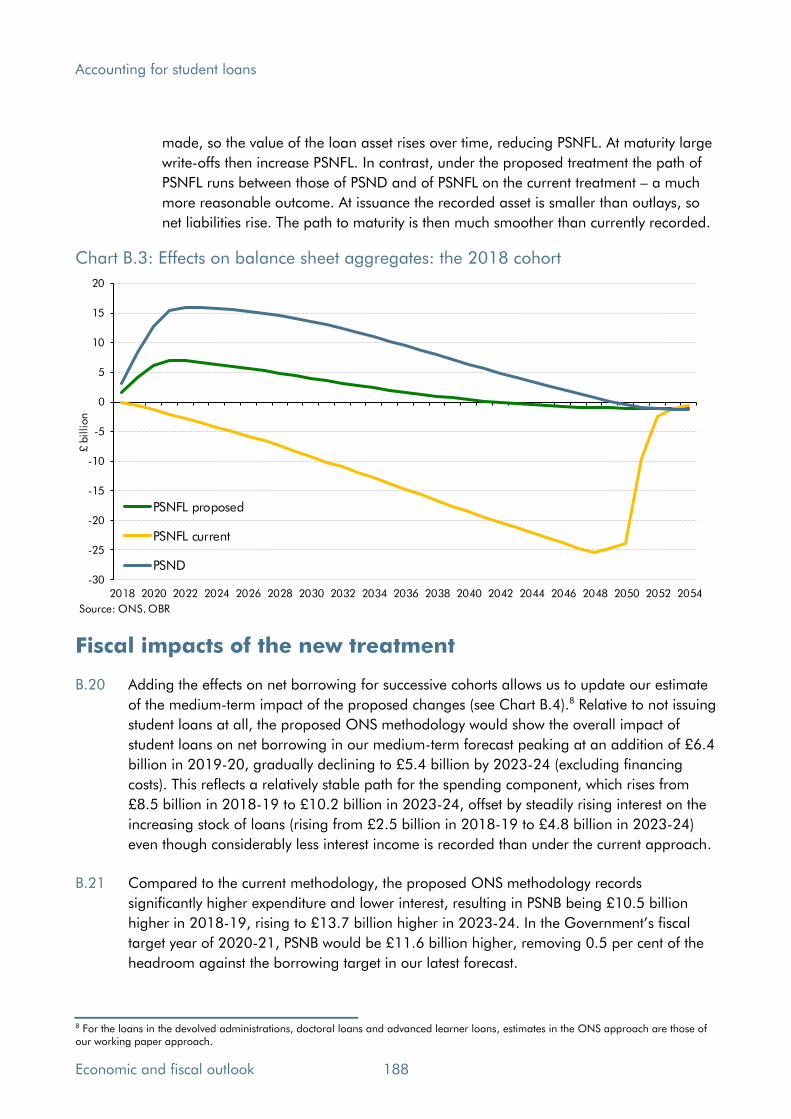
Accounting for student loans
made, so the value of the loan asset rises over time, reducing PSNFL. At maturity large
write-offs then increase PSNFL. In contrast, under the proposed treatment the path of
PSNFL runs between those of PSND and of PSNFL on the current treatment – a much
more reasonable outcome. At issuance the recorded asset is smaller than outlays, so
net liabilities rise. The path to maturity is then much smoother than currently recorded.
Chart B.3: Effects on balance sheet aggregates: the 2018 cohort
-30
-25
-20
-15
-10
-5
0
5
10
15
20
2018 2020 2022 2024 2026 2028 2030 2032 2034 2036 2038 2040 2042 2044 2046 2048 2050 2052 2054
£ b
illion
PSNFL proposed
PSNFL current
PSND
Source: ONS, OBR
Fiscal impacts of the new treatment
B.20 Adding the effects on net borrowing for successive cohorts allows us to update our estimate
of the medium-term impact of the proposed changes (see Chart B.4).8 Relative to not issuing
student loans at all, the proposed ONS methodology would show the overall impact of
student loans on net borrowing in our medium-term forecast peaking at an addition of £6.4
billion in 2019-20, gradually declining to £5.4 billion by 2023-24 (excluding financing
costs). This reflects a relatively stable path for the spending component, which rises from
£8.5 billion in 2018-19 to £10.2 billion in 2023-24, offset by steadily rising interest on the
increasing stock of loans (rising from £2.5 billion in 2018-19 to £4.8 billion in 2023-24)
even though considerably less interest income is recorded than under the current approach.
B.21 Compared to the current methodology, the proposed ONS methodology records
significantly higher expenditure and lower interest, resulting in PSNB being £10.5 billion
higher in 2018-19, rising to £13.7 billion higher in 2023-24. In the Government’s fiscal
target year of 2020-21, PSNB would be £11.6 billion higher, removing 0.5 per cent of the
headroom against the borrowing target in our latest forecast.
8 For the loans in the devolved administrations, doctoral loans and advanced learner loans, estimates in the ONS approach are those of our working paper approach.
Economic and fiscal outlook 188

Accounting for student loans
B.22 These impacts are smaller than the illustrative estimates we presented last year, as the
proposed ONS methodology results in somewhat higher interest income at the start of the
loan term and (thanks to lower interest income in the longer term) lower upfront spending.
There remains considerably uncertainty around the precise methodology the ONS will
adopt, so these implications for borrowing should still be treated as approximate.
Chart B.4: Effects on public sector net borrowing: all cohorts
-10
-8
-6
-4
-2
0
2
4
6
8
10
12
2018-19 2019-20 2020-21 2021-22 2022-23 2023-24
£ b
illion
Current treatment Working paper illustration ONS methodology
Source: ONS, OBR
Difference: £10.5 billion Difference: £13.6 billion
B.23 Under the ONS approach the size of the loan asset recorded in PSNFL is much smaller than
at present, because the initial loan element is smaller (some has been recorded as
spending) and the capitalised interest is therefore smaller too. Each year the difference
between the asset levels in the two methods will increase by the PSNB difference.
Cumulatively this means that PSNFL falls by 5.4 per cent of GDP from 2018-19 to 2023-24
under the ONS approach compared to 7.8 per cent currently. We cannot yet say what the
value of the stock of loans in 2018-19 would be under the proposed methodology.
Determinants of student loans estimates
B.24 The proposed ONS methodology will better align the public finance statistics with economic
reality. But many variables can affect the initial outlay ultimately recovered from students – thanks to the income-contingent repayments and interest rates, plus the 30-year term after
which outstanding balances are simply written off. So changes in these variables could
change the picture of the public finances painted in the official statistics.
B.25 The DfE-operated models that we use to produce our student loans forecasts and long-term
projections – and that the ONS will use to generate outturn estimates for the public finances
statistics – rely on several medium and long-term assumptions about borrowers’ incomes and the wider economy, and the terms and conditions of the loans.
189 Economic and fiscal outlook

Accounting for student loans
B.26 For new outlays each year, the key variables are:
• the number of borrowers – determined by factors such as demographics, application
rates and continuation rates, as well as government policy on eligibility; and
• the average size of loans – determined by the maximum fee set by government and
take-up rates by students, since not all students take up the maximum offered.
B.27 For repayments, the key determinants are:
• each borrower’s earnings relative to the repayment threshold above which repayments
are calculated – determined by assumptions about whole economy earnings growth
and how an individual graduate’s earnings can be expected to vary relative to that;
• the repayment rate applied to earnings above the threshold – set by government; and
• the duration of the loans before outstanding balances are written off – also determined
by government.
B.28 The level of capitalised interest is driven by:
• the level of outstanding balances – determined by the level of outlays, repayments and
the accumulated capitalised interest; and
• the interest rates charged – determined by government policy (currently varying from
the level of RPI inflation to RPI plus 3 per cent dependant on income) and assumptions
about inputs into the interest rate calculation (RPI inflation and borrowers’ incomes).
B.29 Projections for all these input assumptions over many decades determine the extent to which
an individual loan is expected to be repaid, and therefore the extent of distant future write-
offs under the current treatment and of initial spending under the proposed approach.
B.30 We can consider three general types of student loan recipient to illustrate these issues:
• Full payer: This borrower earns sufficient money to repay their entire loan balance – the initial outlay plus the interest charged. For this borrower the student loan is indeed
a loan and so all outlays are recorded as loans and all interest charged as interest.
• Zero payer: This borrower does not earn enough in any period to repay any of their
outstanding loan balance. All the loan should therefore be recorded as a transfer – i.e.
as government spending. None of the interest charged should be recorded as income.
• Partial payer: This borrower falls somewhere in between. They repay some but not all
of their loan, and so the original outlay and interest charged should be treated as a
hybrid product that is part loan (accruing interest) and part grant (recorded upfront).
Economic and fiscal outlook 190

Accounting for student loans
B.31 The IFS estimates that on current policy settings only 17 per cent of plan 2 borrowers will
repay in full.9 Most of the remainder will be partial payers.
B.32 In contrast to the current treatment, under the proposed ONS approach income and
expenditure should move more intuitively with changes in the overall cash position. More or
fewer borrowers will be associated with more or less spending, for example. But changes in
the other determinants will affect the different categories of borrowers differently, and could
alter the composition of the student population – thereby increasing or decreasing the sizes
of the groups. Table B.1 summarises the expected impact of such changes on the estimates
of upfront spending, interest income and net borrowing. In practice the response could be
more complex, depending on the final methodology the ONS settles on. In the medium
term, effects on spending will dominate effects on interest in terms of the overall impact on
net borrowing. The main effects are:
• Increasing the loan size for a full payer increases the cash returns to government. It
does not affect accrued spending (as all outlays are recorded as loans), but would
result in larger balances and therefore more interest charged and a longer payment
period. This increased income for government would reduce borrowing. For other
types of payer there would be larger unpaid balances and so more spending to record
upfront but no more cash income or interest. This would increase borrowing. There
would be more partial payers and fewer full payers, but no effect on zero payers.
• Higher interest rates due to higher RPI inflation (or Bank Rate for Plan 1 borrowers) or
due to increases to the variable interest portion will increase cash repayments from full
payers and so increase interest receipts and reduce the deficit. For partial payers (all
else equal) there would be no cash consequences, but the formula proposed by the
ONS would assign a greater portion of repayments to interest (increasing receipts) and
so a lower portion to the loan principal (increasing accrued spending). Again, there
would be more partial payers and fewer full payers, but no effect on zero payers.
• Higher earnings among borrowers (either relative to the whole economy average or
because all earnings were rising faster than previously assumed) or a lower repayment
threshold would lead to full payers repaying more quickly, so less interest would
accrue leading to lower cumulative receipts. Some partial payers would become full
payers and some zero payers would become partial payers. A partial payer would
repay more of their balance, leading to higher recorded interest and lower upfront
spending. The fiscal effects of the change in size of the partial payer population, and
the average speed and extent of repayment within the partial payer population overall,
would depend on the relative flows to full and from zero payers.
• A higher repayment rate would act in the same way as higher earnings, except that it
would not affect the population of zero payers.
9 Institute for Fiscal Studies, Higher Education finance reform: Raising the repayment threshold to £25,000 and freezing the fee cap at £9,250
191 Economic and fiscal outlook

Accounting for student loans
• A longer loan duration before write-off would not affect a full payer, but would
increase the number of such payers. It would not affect a zero payer, but would reduce
the number of them. Partial payers would repay larger amounts, increasing recorded
interest receipts and reducing spending.
Table B.1: Impact on the deficit of determinant changes under the new treatment
Medium-term
Variable Full payer Partial payer Zero payer deficit impact
Loan size larger
Cash position Repayments up
Accrued spending None
Accrued interest More interest None None
Composition Fewer More None
Interest rates higher
Cash position Repayments up None None
Accrued spending None Spending up None
Accrued interest More interest More interest None
Composition Fewer More None
Earnings higher / Repayment threshold lower
Cash position Repayments down Repayments up None
Accrued spending None Spending down None
Accrued interest Less interest More interest None
Composition More More or Fewer Fewer
Repayment rate higher
Cash position Repayments down Repayments up None
Accrued spending None Spending down None
Accrued interest Less interest More interest None
Composition More Fewer None
Loan duration longer
Cash position None Repayments up None
Accrued spending None Spending down None
Accrued interest None More interest None
Composition More More or Fewer Fewer
Impact of change
Unpaid balances higher
Spending up
Revisions to outturns and forecasts
B.33 Many uncertainties regarding the new treatment remain to be resolved before it can be
implemented in the official statistics. The proposed treatment will need to go through the
ONS’s own internal methodology review processes and Eurostat will, at some point,
produce more detailed accounting guidance. When a final methodology is agreed upon,
there will also be some uncertainty in how DfE will be able to operationalise it for use both
in the public finances outturn data and in our forecasts.
Economic and fiscal outlook 192

Accounting for student loans
B.34 The student loans system is complex, with multiple types of loans across the UK and
revisions could affect multiple cohorts. The DfE model is also very detailed (covering
thousands of estimated loan paths) and the ONS methodology relatively complex. Together
these mean that it will not be practical to update estimates exhaustively and so it is likely that
some practical way of simplifying the process will need to be found.
B.35 As new information arises (either as outturn, as changes to future economic expectations or
due to changes in policy terms and conditions) the model can be updated to incorporate
this information and so revise expected future flows. But under the ‘partitioned loan-transfer
approach’, accounting estimates of outturn income and expenditure also depend on the
forecasts of decades of payments, repayments and interest charges. Consequently, changes
to the forecasts will alter estimates of how the initial outlays should have been partitioned
into loans and spending and/or to the amounts of interest recorded. The ONS would face
several choices about how to incorporate this new information into the data:
• Revise the entire time series. The ONS usually prefers to revise an entire time series to
take account of latest information, so that it is all on a consistent basis. But for student
loans this would eventually mean making revisions 30-plus years into the past, which it
may not be comfortable with and may not be appropriate where those revisions were
the result of subsequent policy decisions.
• Record a one-off lump sum. The revision could be recorded as a lump sum in the year
in which it was made, but given the potentially large size of such revisions this could
mean that changes in long-term expectations had a distorting effect on the year-to-
year path of the deficit that would make it less meaningful and less suitable as a target
aggregate for policy. This problem is already evident in the Whole of Government
Accounts, when the budget deficit measure can be distorted significantly year to year
by valuation changes resulting from changes to the discount rates used.
• Smooth the revision over future years. A practical solution that avoids distorting the
year-to-year path of the deficit could be to smooth revisions over the remaining years
of the loans. But this would be something of a backwards step, as getting away from
recording spending decisions made today several decades in the future is the primary
driver of the desire to change the current accounting treatment.
• Change the stock level with no deficit flow. Revisions could alter the value of the stock
of student loans (and thus the level of PSNFL), but with no corresponding flow that hits
the deficit. This would be analogous to the current treatment of financial assets, where
changes in the market value affect PSNFL but not PSNB. But this would mean that over
the life of the loans the cumulative cash impact would not equal the cumulative deficit
impact, generating a risk of creating future fiscal illusions.
B.36 No approach to revisions will be without drawbacks, leaving the ONS with a difficult choice
to make. It could choose different approaches for different types of revision. Eurostat’s letter states that “further capital transfers should be recorded in case of… significant changes of
193 Economic and fiscal outlook
Accounting for student loans
law”, suggesting that changes in policy should be recorded as one-off lump sums. Purely
economic changes could be recorded differently, perhaps with no associated deficit flow.
B.37 The ONS could face the question of how to deal with revisions due to policy changes
relatively soon. The ‘Augar’ review of post-18 education funding was launched by the
Government in February 2018, but its publication has been delayed with no date yet
announced. The review is considering the level, terms and duration of students’ financial
contribution to their post-18 education. Were the Government to change the terms of
student loans on the back of its recommendations, expected future cashflows and so
accrued spending and interest under the proposed methodology would change too.
B.38 A further uncertainty surrounds what to record when student loans are sold. At present these
sales have no impact on the deficit, which means that write-offs associated with that portion
of the loan book are never recorded in the public finances. Current sales of student loan
tranches are achieving around 50 pence for each pound of face value and so have very
large discounts relative to their holding value under the current treatment – much of which
represents this write-off element. The ONS is considering how to treat sales under the new
accounting treatment, but – as the new treatment involves recording the value of the loans
at a significantly lower level than the current one – discounts would be much smaller.
Economic and fiscal outlook 194

Index of charts and tables
Chapter 1 Executive summary
Chart 1.1: Public sector net borrowing: March versus October..........................................6
Chart 1.2: Revisions to cumulative labour income and nominal GDP growth ...................10
Table 1.3: Changes to public sector net borrowing since October...................................15
Chart 1.3: Real GDP growth fan chart...........................................................................10
Table 1.1: Overview of the economy forecast ................................................................11
Table 1.2: Overview of the fiscal forecast ......................................................................12
Chart 1.4: Sources of revisions to our pre-measures PSNB forecast.................................13
Table 1.4: Changes to public sector net debt since October ...........................................16
Chapter 2 Developments since the last forecast
Table 2.1: Contributions to real GDP growth from 2016Q4 to 2018Q2 .........................19
Table 2.2: Contributions to real GDP growth from 2018Q2 to 2018Q4 .........................20
Table 2.3: Contributions to GDP deflator inflation from 2018Q2 to 2018Q4..................20
Table 2.4: Contributions to nominal GDP growth from 2018Q2 to 2018Q4...................20
Table 2.5: Conditioning assumptions in 2019Q1 ..........................................................21
Table 2.6: Labour market indicators from 2018Q2 to 2018Q4......................................21
Chart 2.1: Forecasts for real GDP growth in 2019 .........................................................23
Chart 2.2: Forecasts for CPI inflation in 2019Q4...........................................................23
Chart 2.3: Forecasts for unemployment in 2019Q4 .......................................................24
Chapter 3 Economic outlook
Chart 3.1: Contributions to forecast errors for cumulative real GDP growth in
November 2016 forecast ..................................................................................27
Chart 3.2: Contributions to real earnings growth ...........................................................28
Chart 3.3: G7 non-dwellings investment .......................................................................28
Chart 3.4: Survey-based and univariate-filter output gap estimates.................................30
Chart 3.5: Multivariate-filter estimates of the output gap ................................................30
Chart 3.6: Range of output gap estimates .....................................................................31
Chart 3.7: Output gap estimates: 2018.........................................................................31
Chart 3.8: Output gap estimates: 2019.........................................................................31
Table 3.1: Potential output growth forecast ....................................................................33
195 Economic and fiscal outlook
Chart 3.9: Bank Rate....................................................................................................35
Chart 3.10: Global bond yields ....................................................................................35
Chart 3.11: Sterling effective exchange rate...................................................................36
Chart 3.12: Oil price....................................................................................................37
Table 3.2: Global GDP and trade growth......................................................................38
Chart 3.13: Contributions to quarterly output growth .....................................................40
Table 3.3: The quarterly GDP profile.............................................................................41
Chart 3.14: Contributions to average quarterly GDP growth...........................................42
Table 3.4: Expenditure contributions to real GDP ...........................................................42
Chart 3.15: The output gap..........................................................................................43
Chart 3.16: Actual and potential output ........................................................................43
Chart 3.17: Real GDP growth fan chart.........................................................................44
Chart 3.18: CPI inflation fan chart ................................................................................45
Chart 3.19: GDP deflator .............................................................................................46
Chart 3.20: Nominal GDP growth ................................................................................47
Table 3.5: Real earnings and real incomes ....................................................................48
Chart 3.21: Contributions to real household income growth...........................................49
Chart 3.22: The household saving ratio ........................................................................50
Chart 3.23: House price inflation forecast .....................................................................51
Chart 3.24: Household gross debt to income.................................................................52
Chart 3.25: Real business investment ............................................................................53
Chart A: Stock of inventories.........................................................................................54
Chart 3.26: Net trade contributions to GDP...................................................................57
Chart 3.27: Current account balance............................................................................58
Chart 3.28: Sectoral net lending ...................................................................................59
Table 3.6: Comparison with the Bank of England’s forecast and projections....................62
Chart 3.29: External forecasters GDP comparison .........................................................63
Table 3.7: Comparison with external forecasters............................................................64
Table 3.8: Detailed summary of forecast .......................................................................65
Table 3.9: Detailed summary of changes to the forecast.................................................66
Table 3.10: Determinants of the fiscal forecast ..............................................................67
Table 3.11: Changes in the determinants of the fiscal forecast .......................................68
Economic and fiscal outlook 196
Chapter 4 Fiscal outlook
Table 4.1: Summary of the effect of Government decisions on the budget balance ..........72
Table 4.4: Changes to current receipts since October.....................................................77
Table 4.5: Sources of change to the receipts forecast since October................................79
Table 4.6: Key changes to the non-SA income tax and NICs forecast since October.........81
Table 4.7: Key changes to the SA income tax forecast since October...............................82
Table 4.8: Key changes to the VAT forecast since October..............................................82
Table 4.15: RDEL and CDEL spending and changes since October .................................96
Table 4.18: Sources of change to welfare spending since October................................101
Table 4.19: Key changes to public service pensions since October................................104
Table 4.21: Key changes to expenditure transfers to EU institutions on a
Table 4.2: Major receipts as a share of GDP .................................................................73
Chart 4.1: Year-on-year changes in the receipts-to-GDP ratio ........................................74
Chart 4.2: Sources of changes in the receipts-to-GDP ratio (2018-19 to 2023-24) ..........75
Table 4.3: Current receipts ...........................................................................................76
Table 4.9: Key changes to the onshore corporation tax forecast since October ................85
Table 4.10: Key changes to the oil and gas revenues forecast since October ...................86
Table 4.11: TME split between DEL and AME.................................................................90
Table 4.12: Total managed expenditure........................................................................91
Table 4.13: Changes to total managed expenditure since October .................................92
Table 4.14: Sources of change to the spending forecast since October ...........................94
Table 4.16: Welfare spending forecast ..........................................................................97
Table 4.17: Welfare spending.....................................................................................100
Chart 4.3: Successive revisions to the universal credit rollout assumption.......................103
Table 4.20: Expenditure transfers to EU institutions and possible substitute spending .....104
‘no referendum’ counterfactual basis since October..........................................105
Table 4.22: Financial settlement components by time period ........................................106
Table 4.23: Sources of change in the financial settlement since October
Table 4.25: Key changes to locally financed capital expenditure and public corporations’
.......................106
Table 4.24: Key changes to locally financed current expenditure since October .............108
capital expenditure since October....................................................................110
Table 4.26: Key changes to debt interest since October................................................111
Chart 4.4: Sources of revisions to our pre-measures PSNB forecast...............................115
Chart 4.5: Pre- and post-measures public sector net borrowing versus October.............116
Table 4.27: Changes to public sector net borrowing ....................................................118
197 Economic and fiscal outlook

Chart A: Policy responses to underlying fiscal forecast revisions ....................................120
Chart 4.6: Sources of underlying revisions to borrowing since June 2010......................121
Table 4.28: Reconciliation of PSNB and PSNCR ...........................................................123
Table 4.29: Changes in the reconciliation of PSNB and PSNCR ....................................124
Chart 4.7: Proceeds from financial asset sales .............................................................127
Table 4.30: Reconciliation of PSNCR and CGNCR .......................................................130
Table 4.31: Changes in the reconciliation of PSNCR and CGNCR ................................130
Table 4.32: Year-on-year change in public sector net debt ...........................................132
Table 4.33: Changes to public sector net debt since October .......................................133
Chart 4.8: The public sector balance sheet: various measures ......................................134
Table 4.34: Total gross financing................................................................................135
Table 4.35: The composition of public sector net debt..................................................136
Table 4.36: Gross and net cash flows of financial sector interventions...........................138
Table 4.37: Fiscal aggregates.....................................................................................139
Table 4.38: Comparison with European Commission forecasts.....................................143
Table 4.39: Comparison with IMF forecast ..................................................................143
Chapter 5 Performance against the Government’s fiscal targets
Table 5.1: Forecasts for the Government’s target aggregates .......................................146
Table 5.2: Performance against the Government’s fiscal and welfare targets .................147
Chart 5.1: Change in CAPSNB and PSNB relative to our October forecast ....................148
Chart 5.2: Cumulative changes in the structural deficit from 2017-18 to 2020-21.........149
Chart 5.3: Year-on-year changes to the debt-to-GDP ratio...........................................151
Table 5.3: Changes in the profile of net debt since October .........................................151
Table 5.4: Performance against the welfare cap ..........................................................152
Table 5.5: Performance against the previous fiscal targets............................................155
Chart 5.4: Cyclically adjusted public sector net borrowing fan chart..............................156
Chart 5.5: Receipts fan chart ......................................................................................158
Table 5.6: Illustrative debt target sensitivities in 2020-21..............................................159
Annex A Policy measures announced since October
Table A.1: Summary of the effect of Government decisions on the budget balance ........164
Table A.2: Costings for Government policy decisions ...................................................169
Table A.3: Costings for Scottish Government policy decisions .......................................171
Economic and fiscal outlook 198

Table A.4: Assigning uncertainty rating criteria to ‘Corporation tax: relief for goodwill’ ..172
Chart A.1: Support for mortgage interest: forecast loan outlays in 2018-19 ..................178
Annex B Accounting for student loans
Chart B.1: Current National Accounts treatment: the 2018 cohort ................................185
Chart B.2: Annual and cumulative net borrowing impacts: the 2018 cohort ..................187
Chart B.3: Effects on balance sheet aggregates: the 2018 cohort .................................188
Chart B.4: Effects on public sector net borrowing: all cohorts........................................189
Table B.1: Impact on the deficit of determinant changes under the new treatment .........192
199 Economic and fiscal outlook

CCS0319708842 978-1-5286-1090-2