Embed Size (px)
Citation preview

Offering MeMOranduM
4637 N. Ashland Avenue // Chicago IL, 60640
OFFERED BY:
ARI TOPPER, CFA Managing Director / Broker 312.275.3113 [email protected]
TYLER DECHTER Associate / Broker 312.275.3132 [email protected]
DAVID BROWN President - Harrington Brown LLC 773.525.8222 [email protected]
BAUM REALTY GROUP, LLC 1030 W. Chicago Avenue, Suite 200 Chicago, IL 60642 www.baumrealty.com

2 // Offering MeMOr anduM
executive Overview // 4 637 n. aSHL and aVenue // CHiCagO, iL
Offering Summary PROPERTY HIGHLIGHTS
Î 3-story concrete and masonry constructed building with
basement
Î Configured as a ±30 room convent building, formerly a convent
for Our Lady of Lourdes parish
Î Located on the border of Chicago’s Ravenswood and Uptown
neighborhoods
Î Convenient access to public transit, located 0.3 miles to
Ravenswood Metra station and 0.6 miles to CTA 'L' Montrose
Brown Line Station
Î Potential for abundant on-site parking
Î Attractive demographics with over 78,133 residents earning more
than $93,600 annually within 1-mile radius
ASKING PRICE: Subject to Offer

3 // Offering MeMOr anduM
executive Overview // 4 637 n. aSHL and aVenue // CHiCagO, iL
Property DescriptionADDRESS: 4637 N. Ashland Avenue
Chicago, IL 60640
COUNTY: Cook County
NEIGHBORHOOD(S): Ravenswood / Uptown
TOTAL BUILDING AREA: ±12,500 square feet*
TOTAL LAND AREA: ±12,000 square feet*
ZONING: RT-4
2018 TAXES: N/A (Exempt)
FRONTAGE: Approximately 75’ along
Ashland Avenue
* All square footages referenced herein are estimates based on available public data and satellite imagery. No survey of the Property is available yet.

4 // Offering MeMOr anduM
executive Overview // 4 637 n. aSHL and aVenue // CHiCagO, iL
SURVEY

5 // Offering MeMOr anduM
executive Overview // 4 637 n. aSHL and aVenue // CHiCagO, iL
Property SummaryLocated at the southeast quadrant of
Ashland & Leland, 4637 N. Ashland Avenue
is a former convent, configured as a 30
room convent building with a full kitchen
and laundry on the ground floor, shared
bathrooms on the 2nd and 3rd floors and a
2-story high chapel on floors 2-3.
The building is mostly vacant with the
exception of a short-term, flexible lease
with children’s speech therapy office.
Although it is not striped, there is a paved
hardscape area behind the building that
can accommodate approximately 10-15
parking spaces.

6 // Offering MeMOr anduM
executive Overview // 4 637 n. aSHL and aVenue // CHiCagO, iL
7 // Offering MeMOr anduM
executive Overview // 4 637 n. aSHL and aVenue // CHiCagO, iL
8 // Offering MeMOr anduM
the Market // 4 637 n. aSHL and aVenue // CHiCagO, iL
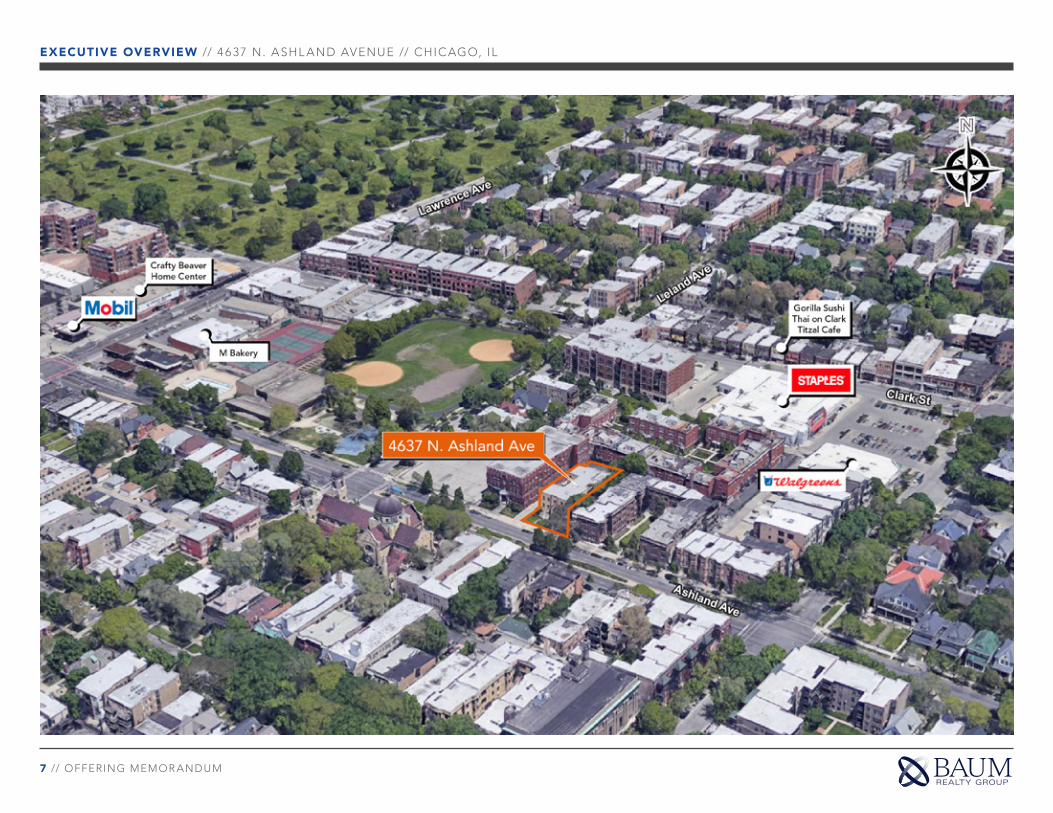
Uptown
Uptown is a neighborhood in Chicago, Illinois in Cook County and is
one of the best places to live in Illinois.
Living in Uptown offers residents a dense urban feel and most
residents rent their homes. In Uptown there are a lot of bars,
restaurants, coffee shops, and parks. Many young professionals live
in Uptown and residents tend to be liberal.
BES T PL ACES IN C HIC AGO A CC E S S & T R A N S P O R TAT I O N
Uptown has excellent public transportation and
about 14 bus routes and three CTA Red Line stations
(Wilson, Lawrence, and Argyle).
Lake Shore Drive provides easy access to Downtown
Chicago and Evanston.
Uptown is the 13th most walkable neighborhood in
Chicago with a Walk Score of 91.
O’Hare International Airport 26 min drive
Midway International Airport 32 min drive
The Loop 15 min drive
Most Diverse Neighborhoods
#10 of 92921 10
Best Neighborhoods for Young Professionals
#20 of 92921 20
Best Neighborhoods to Live
#25 of 92921 25
R E P O R T C A R D
A OVERALL GRADE
Public Schools Crime & Safety I N CO M E & H O U S I N G Median HHI
$57,064Housing NightlifeOWN - 70%
RENT - 30%
RENT VS. OWN
Good for Families Diversity Median Home Value
$283,103A R E A F E E L
Dense UrbanJobs Weather
Cost of Living Health & Fitness Median Rent
$1,021Outdoor Activities Commute
Sources: City of Chicago, Walkscore.com & Niche.com. Niche ranks thousands of places to live based on key statistics from the U.S. Census and expert insights.

9 // Offering MeMOr anduM
the Market // 4 637 n. aSHL and aVenue // CHiCagO, iL
Ravenswood (Lincoln Square)Ravenswood is a submarket of the Lincoln Square neighborhood in
Chicago, Illinois in Cook County.
The area offers residents an urban suburban mix feel with a dense
industrial / creative office corridor along Ravenswood Avenue. Most
residents rent their homes and there are many bars, restaurants,
coffee shops, and parks. Many young professionals live in
Ravenswood / Lincoln Square and residents tend to be liberal.
B E S T PL AC E S IN IL L IN O IS A CC E S S & T R A N S P O R TAT I O N
Ravenswood has good public transportation with
three CTA Brown Line Stations (Western, Montrose
and Rockwell) and multiple bus routes.
The Ravenswood Metra station serves the UP/North
Line providing easy access to Downtown Chicago
and suburbs as far north as Kenosha, WI.
O’Hare International Airport 24 min drive
Midway International Airport 35 min drive
The Loop 21 min drive
Best Neighborhoods to Raise a Family
#18 of 92921 18
Most Diverse Neighborhoods
#20 of 92921 20
Best Neighborhoods to Live
#20 of 92921 20
R E P O R T C A R D
A OVERALL GRADE
Public Schools Crime & Safety I N CO M E & H O U S I N G Median Household
$76,109Housing NightlifeOWN - 62%
RENT - 38%
RENT VS. OWN
Good for Families Diversity Median Home Value
$379,712A R E A F E E L
Urban Suburban MixJobs Weather
Cost of Living Health & Fitness Median Rent
$1,265Outdoor Activities Commute
Sources: City of Chicago, Walkscore.com & Niche.com. Niche ranks thousands of places to live based on key statistics from the U.S. Census and expert insights.

10 // Offering MeMOr anduM
the Market // 4 637 n. aSHL and aVenue // CHiCagO, iL

11 // Offering MeMOr anduM
the Market // 4 637 n. aSHL and aVenue // CHiCagO, iL

12 // Offering MeMOr anduM
the Market // 4 637 n. aSHL and aVenue // CHiCagO, iL
Chicago Economic OverviewChicago Economic Overview3rd LargeSt MSa in the u.S.
The Chicago MSA is home to approximately
9.5 million residents, making it the third most
populous region in the country, encompass-
ing 16 counties across three states: Illinois,
Indiana, and Wisconsin. The city of Chicago
is the economic and cultural capital of the
Midwest, featuring a vibrant downtown dis-
trict that is filled with world class businesses,
restaurants, retail, residences, and enter-
tainment. The strong economic base, skilled
labor pool and diverse background make this
24-hour metropolis one of the most import-
ant and influential in the world.
Source: world population review
grOwing urBan cOre
Chicago's urban core and surrounding
neighborhoods has become noticeably
more dense. In the last several years,
according to a report by The New York
Times, between 2010 and 2016, Chicago’s
density has increased by 1.2%.
The report suggests that the city’s popula-
tion is shifting and refocusing with an influx
of younger, more affluent residents moving
into areas like the Loop, West Loop, and
Wicker Park.
10 SAN JOSE
5 PHOENIX
9 DALLAS
4 HOUSTON7 SAN ANTONIO
6 PHILADELPHIA1 NEW YORK3 CHICAGO
2 LOS ANGELES
8 SAN DIEGO
Chan
ge In
Den
sity
Change In Population
ChicagoNew York D.C.
Seattle
Tampa
Okalhoma City
San Antionio
Houston
Dallas
Nashville
Raleigh
Austin
0%
-4%
-2%
0%
2%
+5% +10% +15% +20%
Less Dense
More DenseCharlotte
POPuLatiOn denSitY change in u.S. MetrO areaS (2010-2016)
RANK CITY 2019 POPULATION
1 New York 8,601,186
2 Los Angeles 4,057,841
3 Chicago 2,679,044
4 Houston 2,359,480
5 Phoenix 1,711,356
6 Philadelphia 1,576,596
7 San Antonio 1,565,929
8 San Diego 1,453,775
9 Dallas 1,379,735
10 San Jose 1,033,519
rank & POPuLatiOn BY u.S. citY

13 // Offering MeMOr anduM
the Market // 4 637 n. aSHL and aVenue // CHiCagO, iL
#1 fOr cOrPOrate reLOcatiOn & inveStMent
Chicago remains the #1 ranked metro area for Corporate Relocation and Investment
in the US in Site Selection Magazine, a title it has held for six consecutive years, and
Chicago leads all major cities in the Americas except for New York for Foreign Direct
Investment (FDI) Strategy according to fDi Magazine. Since Q1 2018, Canada-based
BMO Financial Group, Italy-based Ferrara Candy, Germany-based navigation com-
pany HERE, and UK-based digital agency AmazeRealise have all announced plans
to establish headquarters in Chicago. Additionally, more than 30 corporations
have moved their operations from surrounding suburbs since 2015, to the Chicago
metro area. Most recently, McDonald's moved their global headquarters from
Oak Brook to a new $250M building in the West Loop.
Start uP and tech huB
Chicago is home to tech industry giants and is a hotbed for privately held startups
in the Midwest. Chicago has one of the largest venture capital ecosystems in the
US and was ranked the #1 US city for venture capital returns in 2019 by PitchBook,
a leading source for venture capital and private equity data research. In 2018, Chicago
saw $1.86 billion in venture capital investments. Facebook expanded their operations
in Chicago, leasing 263,000 SF downtown and Google signed a lease for over 200,000
SF at 210 N. Carpenter Street in the West Loop, just down the street from their Midwest
HQ at 1K Fulton. Salesforce, a global leader in CRM, announced that they will occupy
500,000 SF in the new 60-story Salesforce Tower Chicago, in a move that will signifi-
cantly expand Salesforce's regional HQ and add 1,000 new tech jobs over the next five
years. Salesforce employees will start moving into the Salesforce Tower Chicago upon
completion, which is slated for 2023.
" Reflecting a melding of corporate and entrepreneurial cultures, Chicago has more than 100 startup incubators and accelerators and more than 300 corporate R&D centers."
Site Selection Magazine
Salesforce Tower rendering

14 // Offering MeMOr anduM
the Market // 4 637 n. aSHL and aVenue // CHiCagO, iL
gLOBaL citY
Chicago ranks 8th for the second year in a row on the A.T. Kearney 2019 Global Cities Index,
which examines cities’ performance-based metrics spanning five dimensions: business activ-
ity, human capital, information exchange, cultural experience, and political engagement.
Chicago ranks 6th on fDi's American Cities of the Future 2019/20 report, which benchmarks
cities based on five categories: Economic Potential, Business Friendliness, Human Capital
and Lifestyle, Cost Effectiveness and Connectivity. Chicago had the biggest movement in
this year’s top 10, rising nine places to 6th. In 2018, Chicago attracted 49 FDI projects, its
highest such figures since FDI Markets records began in 2003. Most FDI investments were
in sales, marketing and support, business services and headquarters activities (together
accounting for more than three-quarters of Chicago’s inward FDI).
wOrLd cLaSS educatiOn
The Chicago MSA is home to several world class higher education universities that provide
the area with a constant supply of top job talent and disposable income. On average there
are 145,000 annual graduates from 138 degree-granting colleges and universities.
Top universities in the area include Northwestern University, The University of Chicago,
Illinois Institute of Technology, Loyola University Chicago, DePaul University, Columbia
College Chicago, and University of Illinois at Chicago.
The Global Cities Index examines the current performance of 130 cities based on 27 metrics spanning five dimensions: business activity, human capital, information exchange, cultural experience, and political engagement. The Index provides insights into the global reach, performance, and level of development of the world’s largest cities. Source: A.T. Kearney Global Cities 2019.
218 locations were analyzed for the study under five categories: Economic Potential, Business Friendliness, Human Capital and Lifestyle, Cost Effectiveness and Connectivity, which were weighted by importance to the FDI decision-making process in order to compile both subcategory rankings and the overall ‘American Cities of the Future 2019/20’ ranking.Source: fDi Magazine. Research and data by fDi Intelligence division of the Financial Times, 2019.
"The Windy City, the Second City, the Dark City – call it what you will, Chicago is the economic and cultural capital of the Midwest."Wired Magazine
Global Cities Index American Cites of the Future
Top 10 Global Cities 2019 Top 10 Overall American Cities of the Future 2019/20
CITY RANK CITY RANK
New York 1 New York 1
London 2 San Francisco 2
Paris 3 Toronto 3
Tokyo 4 Montreal 4
Hong Kong 5 Houston 5
Singapore 6 Chicago 6
Los Angeles 7 Boston 7
Chicago 8 Los Angeles 8
Beijing 9 Palo Alto 9
Washington DC 10 Seattle 10

15 // Offering MeMOr anduM
the Market // 4 637 n. aSHL and aVenue // CHiCagO, iL
StrOng, diverSe ecOnOMY
Chicago MSA has the 3rd largest Gross Domestic
Product in the US, after New York City and Los
Angeles, at $737.3 billion. Chicago also ranks 8th
in the world in terms of cities with the highest Gross
Product. Additionally, Chicago is the most diversified
economy in the US, with no single industry employ-
ing more than 14% of the workforce. Chicago’s pri-
mary industries include Financial Services, Business &
Professional Services, Manufacturing, Health Services,
and Transportation and Warehousing.
As one of the largest financial centers in North
America, the Chicago MSA is home to more
than 400 major corporate headquarters, includ-
ing Walgreens Boots Alliance, Boeing, United
Continental Holdings, McDonald’s, Discover
Financial and Abbott Laboratories, among oth-
ers. The city is also home to the largest futures
exchanges in the US, the CME Group.
Fortune 500 Companies With Headquarters In the Chicago MSA
COMPANY RANK REVENUES ($M) Location
Walgreens Boots Alliance 17 $ 131,537 Deerfield
Boeing 28 $ 101,127 Chicago
State Farm Insurance 36 $ 81,732.2 Bloomington
Archer Daniels Midland 49 $ 64,341 Chicago
Caterpillar 58 $ 54,722 Deerfield
United Continental Holdings 78 $ 41,303 Chicago
Allstate 82 $ 39,815 Northbrook
Exelon 93 $ 35,985 Chicago
AbbVie 96 $ 32,753 North Chicago
Abbott Laboratories 103 $ 30,578 Abbott Park
Mondelez International 116 $ 25,938 Deerfield
US Foods Holding 125 $ 24,175 Rosemont
McDonald’s 149 $ 21,025.2 Chicago
Jones Lang LaSalle 189 $ 16,318.4 Chicago
CDW 191 $ 16,240.5 Lincolnshire
Illinois Tool Works 214 $ 14,768 Glenview
Discover Financial Services 253 $ 12,848 Riverwoods
LKQ 262 $ 11,876.7 Chicago
Tenneco 267 $ 11,763 Lake Forest
W.W. Grainger 282 $ 11,221 Lake Forest
Baxter International 286 $ 11,127 Deerfield
Univar 353 $ 8,632.5 Downers Grove
Anixter International 364 $ 8,400.2 Glenview
Conagra Brands 386 $ 7,938.3 Chicago
Dover 412 $ 7,395.8 Downers Grove
Motorola Solutions 416 $ 7,343 Chicago
Packaging Corp. of America 432 $ 7,014.6 Lake Forest
Arthur J. Gallagher 435 $ 6,934 Rolling Meadows
R.R. Donnelley & Sons 445 $ 6,800.2 Chicago
Ulta Beauty 449 $ 6,716.6 Bolingbrook
Northern Trust 453 $ 6,658.9 Chicago
Old Republic International 481 $ 6,021.8 Chicago
Ingredion 486 $ 5,841 Westchester
TreeHouse Foods 489 $ 5,812.1 Oak Brook
Source: Fortune Magazine, June 2019
Atla
nta
Hous
ton
Chic
ago
Phila
delp
hia
Los
Ange
les
Bost
on
San
Fran
cisc
o
New
Yor
k
95.1 97
.6
98.3
99.8 100.
8
104.
5
104.
5
104.
7
cOSt Of dOing BuSineSS BY MetrO area
Chicago is home to over 400 major corporate headquarters, including 36 Fortune 500 companies

16 // Offering MeMOr anduM
the Market // 4 637 n. aSHL and aVenue // CHiCagO, iL
internatiOnaL traveL deStinatiOn
Chicago’s tourism totals have consistently been on the rise in recent years, growth in 2018
was more substantial than normal. A record 57.6 million people visited chicago in 2018,
nearly a 4.3% increase over 2017's record of 55.2 million. The largest percentage of growth
was domestic travel with a 4.4% increase over 2017. International visitor numbers also
increased 2.9% over 2017.
The record-setting numbers were due, in part, to several initiatives that boosted leisure
travel as well as word-of-mouth and high-profile kudos. Condé Nast Traveler readers voted
Chicago the number 1 big city in the US two years in a row, Bon Appétit magazine named
Chicago “restaurant city of the year” in 2017, and the Financial Times called Chicago “the
most architecturally aware city on earth.” Part of the boost also came from the city's aggres-
sive pursuit of big-tourist draws including the NFL Draft, the James Beard Foundation
Awards and the Laver Cup. The city also bolstered tourism-friendly offerings with attractions
like the Riverwalk and, more recently, Art on the Mart. Business travel also contributed to the
bump, with an 3.5% in 2018. 59 new major conventions have committed to meet in Chicago
in future years.
duaL-huB airPOrt SYSteM
O’Hare International Airport and Midway International Airport,
the only “dual-hub” airport system in North America, handled
105 million passengers in 2018. Both airports have direct rail access
to Downtown Chicago and modernization projects are happening at
both O’Hare and Midway. Most notably O’Hare’s $8.5 billion plan to
expand over the next decade which includes a new airfield, terminal,
gates, and passenger perks. Midway’s improvements are budgeted
at $400 million and include restaurants, upgraded passenger screen-
ing, and updated parking infrastructure.
O'Hare is the busiest airport in the world for flight operations and is
among the few airports worldwide that rank in the top 20 for both
passenger volume and cargo tonnage - two leading indicators of an
airport's connectivity and economic strength.
57.6 million tOtaL viSitOrS in 2018
4.4% Increasein viSitOrS 2007-2018
“Dual-hub” airport system with O'Hare International Airport and Midway
International Airport combining for more than 105 million annual passengers.
In the US
MostForeign Direct
Investment(FDI) 2017
BestRestaurant
City
BestConnected
Airport
BestBig City
BestDowntown
among US big cities
MostDiversifedEconomy

17 // Offering MeMOr anduM
the Market // 4 637 n. aSHL and aVenue // CHiCagO, iL
DEMOGRAPHIC SUMMARY2000-2010 Census, 2019 Estimates with 2024 Projections
.25 mile .50 miles 1 mile
Popu
latio
n
2019 Estimated Population 4,400 17,271 78,133
2024 Projected Population 4,433 17,235 78,836
2010 Population (U.S. Census) 4,295 16,921 77,905
2000 Population (U.S. Census) 4,851 18,948 85,525
% Projected Growth 2019-2024 0.80% -0.20% 0.90%
% Historical Growth 2000-2019 -9.30% -8.90% -8.60%
2019 Median Age 33.7 34.6 35.9
Hous
ehol
ds
2019 Estimated Households 2,407 9,562 40,147
2024 Projected Households 2,429 9,552 40,533
2010 Total Households (U.S. Census) 2,320 9,282 39,781
2000 Total Households (U.S. Census) 2,366 9,305 40,986
% HH Projected Growth 2019-2024 0.90% -0.10% 1.00%
% HH Historical Growth 2000-2019 1.70% 2.80% -2.00%
Inco
me 2019 Average Household Income $89,554 $92,488 $93,628
2019 Median Household Income $61,779 $63,126 $60,389
2019 Per Capita Income $49,936 $51,207 $48,047
Busi
ness 2019 Total Businesses 173 686 2,906
2019 Total Employees 1,373 5,598 24,267
2019 Estimated Daytime Population 2,855 11,695 54,042
Educ
atio
n (A
ge 2
5+)
2019 Adult Population (Ages 25+) 3,515 13,437 60,219
2019 Elementary (Grade Level 0 to 8) 2.50% 2.00% 3.30%
2019 Some High School (Grade Level 9 to 11) 4.50% 3.90% 4.40%
2019 High School Diploma 10.30% 11.00% 11.40%
2019 Some College/No Degree 8.10% 11.40% 12.50%
2019 Associate Degree 4.10% 4.40% 4.50%
2019 Bachelor Degree 45.90% 41.00% 38.90%
2019 Graduate Degree 24.10% 25.70% 23.30%
% Any College 82.20% 82.40% 79.30%
Race
& E
thni
city
2019 White Population 69.20% 67.10% 63.20%
2019 Black/African American Population 9.20% 10.50% 12.40%
2019 Asian Population 7.10% 7.70% 12.30%
2019 American Indian/Alaska Native Population 0.60% 0.50% 0.50%
2019 Pacific Islander Population 0.10% 0.10% 0.00%
2019 Other Race 9.90% 10.00% 7.90%
2019 Population of Two or More Races 4.00% 4.20% 3.80%
2019 Hispanic Population 47.80% 44.60% 46.50%
Source: Esri, Esri and Infogroup, U.S. Census
deMOgraPhicS
.25 MilesEstimated Population: 4,400
Daytime Population: 2,855
Estimated Households: 2,407
Average Household Income: $89,554
.50 MileEstimated Population: 17,271
Daytime Population: 11,695
Estimated Households: 9,562
Average Household Income: $92,488
1 MileEstimated Population: 78,133
Daytime Population: 54,042
Estimated Households: 40,147
Average Household Income: $93,628

Offering MeMOranduM
4637 N. Ashland Avenue // Chicago IL, 60640
OFFERED BY:
ARI TOPPER, CFA Managing Director / Broker 312.275.3113 [email protected]
TYLER DECHTER Associate / Broker 312.275.3132 [email protected]
DAVID BROWN President - Harrington Brown LLC 773.525.8222 [email protected]
BAUM REALTY GROUP, LLC 1030 W. Chicago Avenue, Suite 200 Chicago, IL 60642 www.baumrealty.com