Embed Size (px)
DESCRIPTION
articol
Citation preview
ORIGINAL ARTICLE
Off-line motion correction methods for multi-framePET data
Jurgen E. M. Mourik & Mark Lubberink &
Floris H. P. van Velden & Adriaan A. Lammertsma &
Ronald Boellaard
Received: 10 March 2009 /Accepted: 8 June 2009 /Published online: 8 July 2009# The Author(s) 2009. This article is published with open access at Springerlink.com
AbstractPurpose Patient motion during PET acquisition may affectmeasured time-activity curves, thereby reducing accuracyof tracer kinetic analyses. The aim of the present study wasto evaluate different off-line frame-by-frame methods tocorrect patient motion, which is of particular interest whenno optical motion tracking system is available or whenolder data sets have to be reanalysed.Methods Four different motion correction methods wereevaluated. In the first method attenuation-corrected frameswere realigned with the summed image of the first 3 min.The second method was identical, except that non-attenuation-corrected images were used. In the third andfourth methods non-attenuation-corrected images wererealigned with standard and cupped transmission images,respectively. Two simulation studies were performed, basedon [11C]flumazenil and (R)-[11C]PK11195 data sets, re-spectively. For both simulation studies different types(rotational, translational) and degrees of motion wereadded. Simulated PET scans were corrected for motionusing all correction methods. The optimal method derivedfrom these simulation studies was used to evaluate two (onewith and one without visible movement) clinical data setsof [11C]flumazenil, (R)-[11C]PK11195 and [11C]PIB. Forthese clinical data sets, the volume of distribution (VT) was
derived using Logan analysis and values were comparedbefore and after motion correction.Results For both [11C]flumazenil and (R)-[11C]PK11195simulation studies, optimal results were obtained whenrealignment was based on non-attenuation-corrected images.For the clinical data sets motion disappeared visually aftermotion correction. Regional differences of up to 433% in VT
before and after motion correction were found for scans withvisible movement. On the other hand, when no visual motionwas present in the original data set, overall differences in VT
before and after motion correction were <1.5±1.3%.Conclusion Frame-by-frame motion correction using non-attenuation-corrected images improves the accuracy of tracerkinetic analysis compared to non-motion-corrected data.
Keywords PET.Motion correction . Kinetic modelling .
Volume of distribution
Introduction
Positron emission tomography (PET) is a medical imagingtechnique that allows for measurements of tissue functionby following the time course of a tracer labelled with apositron emitter. Most dynamic brain scans require anacquisition time of 60–90 min and, for accurate results, thesubject should remain in exactly the same position. Inpractice, however, subject motion is not uncommon, espe-cially not for specific patient groups such as, for example,patients suffering from Alzheimer’s or Parkinson’s disease.
Full utilisation of improvements in intrinsic spatialresolution of new PET scanners is increasingly hamperedby patient motion [1]. Patient motion during a PET scanmay reduce effective spatial resolution [2]. More impor-tantly, patient motion may alter measured time-activity
Electronic supplementary material The online version of this article(doi:10.1007/s00259-009-1193-y) contains supplementary material,which is available to authorised users.
J. E. M. Mourik (*) :M. Lubberink : F. H. P. van Velden :A. A. Lammertsma : R. BoellaardDepartment of Nuclear Medicine & PET Research,VU University Medical Center,P.O. Box 7057, 1007 MB Amsterdam, The Netherlandse-mail: [email protected]
Eur J Nucl Med Mol Imaging (2009) 36:2002–2013DOI 10.1007/s00259-009-1193-y
curves (TAC), especially for small regions of interests (ROI),thereby directly affecting the outcome of tracer kinetic analysis.
The simplest method to reduce patient motion duringscanning is the use of head restraints. To date, a number ofhead restraints are available for reducing motion (e.g. [2,3]). As these head restraints do not eliminate all move-ments, even more restrictive head restraints exist that fix theskull completely [3]. These restrictive head restraints,however, are very uncomfortable and therefore they arenot used frequently. In addition, many patients (e.g.traumatic brain injury, obsessive-compulsive disorder) donot tolerate rigid head fixation.
An alternative is to register motion during scanningusing an optical online motion tracking system. Most recentoptical motion tracking systems [4–6] enable onlinecorrection for motion that occurs within frames (in-framepatient motion). Online motion tracking systems have twomain advantages. Firstly, when using a motion trackingsystem, there is no mismatch between emission andtransmission scans, as emission data are realigned to theposition of the head during the transmission scan. This isvery important, because a mismatch between emission andtransmission scans leads to erroneous attenuation correc-tion. Secondly, it is possible to correct for in-frame motion,as realignment may take place several times per second.However, motion tracking systems also have some dis-advantages. Firstly, older data sets, acquired prior toinstallation of a motion tracking system, cannot becorrected for patient motion. Secondly, most optical onlinemotion tracking systems require PET data to be acquired inlist mode, which is not possible on older PET scanners.Thirdly, online (continuous) motion correction duringreconstruction is not trivial and some difficulties withnormalisation and attenuation correction still need to beinvestigated further [7]. Finally, the use of optical (online)tracking systems is not always possible when the view ofthe patient in the gantry is limited. This is, for example, thecase when scanning patients with traumatic brain injury,where the view within the gantry is partly blocked byauxiliary equipment, such as that needed for administeringanaesthetics. In those patients, however, motion is observedfrequently.
Frame-by-frame motion correction methods correctimage data post hoc. Existing frame-by-frame methodsuse correlation coefficient [8], cross-correlation [9, 10],mutual information [9, 11], standard deviation of the ratioof two images [10, 12], sum of absolute differences [10,12], mean square difference [10], stochastic sign change[10] or (scaled) least-square difference images [13, 14].Although, frame-by-frame motion correction methods donot have the same advantages and performance character-istics as online (optical) motion tracking systems [11], theyare very useful when no list-mode data are available, when
older data have to be reanalysed or when optical tracking isnot possible because of a limited view into the PET gantry.
The purpose of this study was to evaluate four differentoff-line frame-by-frame motion correction methods, previ-ously introduced by Perruchot et al. [9]. Two of thesemotion correction methods in theory also correct formismatches between transmission and emission scans.Methods were evaluated extensively using both simulationstudies and several clinical data sets, covering both tracerswith low and high cerebral uptake.
Materials and methods
Motion correction strategies
This section describes four different motion correctionstrategies for multi-frame PET data. These methods differin the way realignment parameters were derived.
Method A: AC-on-AC
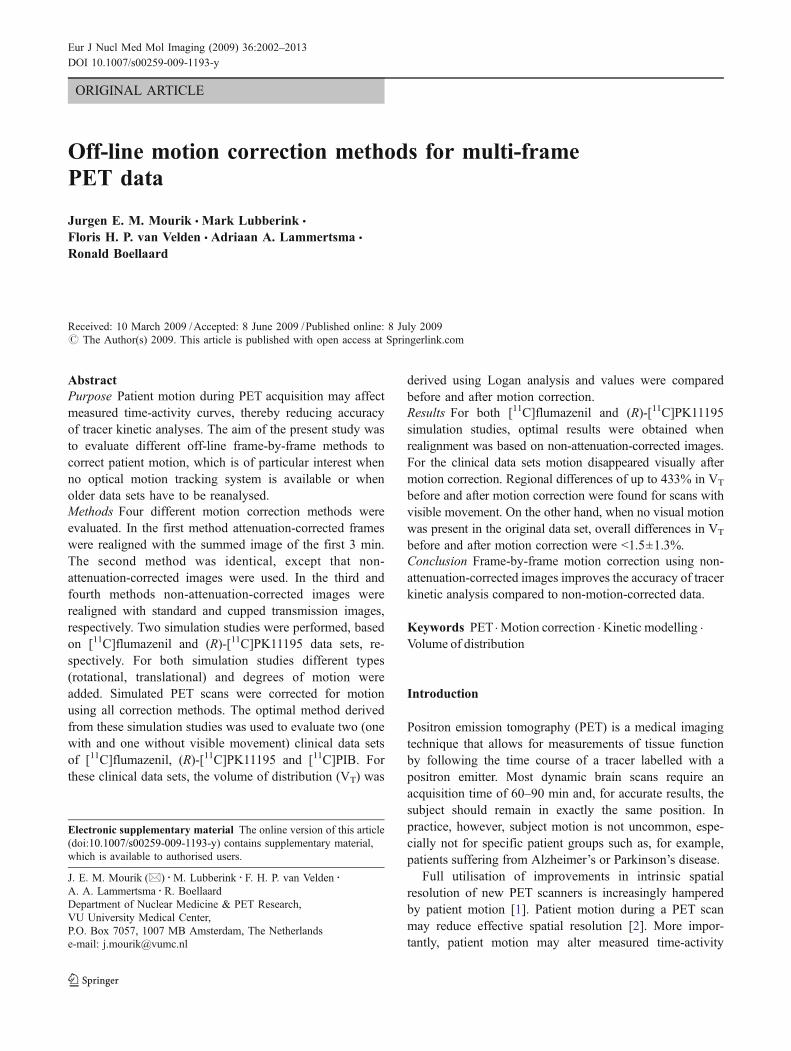
The simplest motion correction method is based on therealignment of attenuation-corrected (AC) (standard) PETimages. It is assumed that the first x frames of the AC PETscan contain no patient motion and therefore the sum of thefirst x frames is used as a reference. Frames x+1...N, with Nbeing the number of frames, are then realigned to thissummed image (Fig. 1a). Using this method, however,mismatches between emission and transmission scansremain.
Method B: NAC-on-NAC
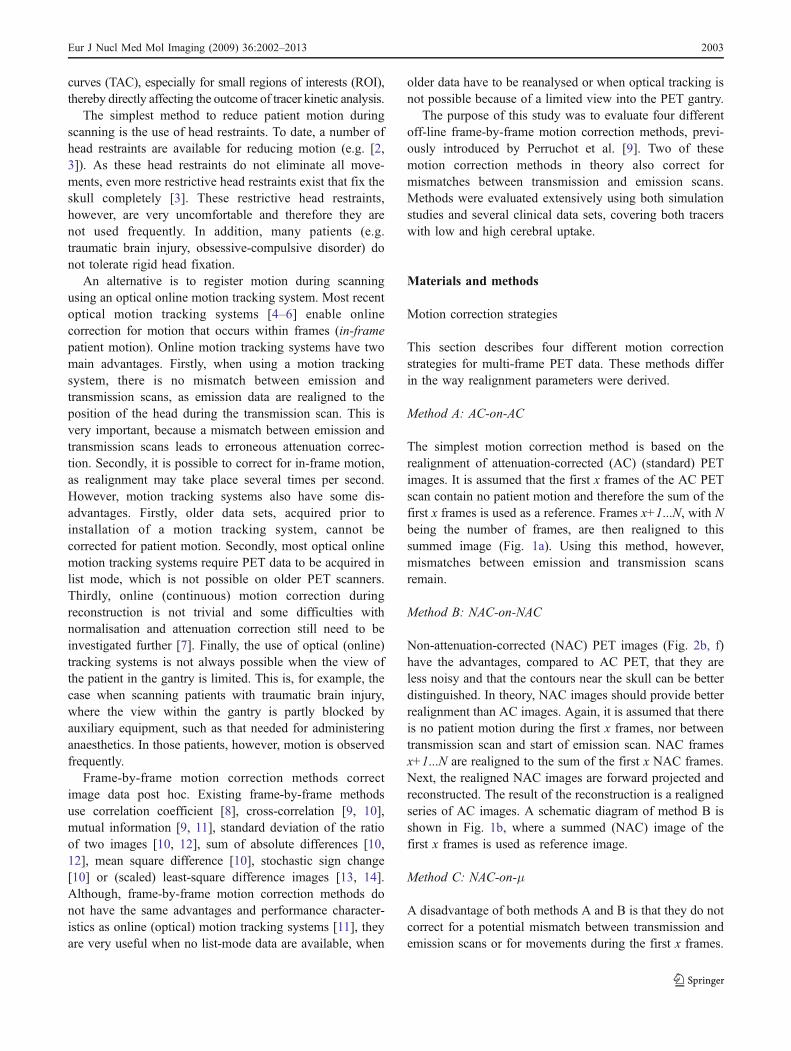
Non-attenuation-corrected (NAC) PET images (Fig. 2b, f)have the advantages, compared to AC PET, that they areless noisy and that the contours near the skull can be betterdistinguished. In theory, NAC images should provide betterrealignment than AC images. Again, it is assumed that thereis no patient motion during the first x frames, nor betweentransmission scan and start of emission scan. NAC framesx+1...N are realigned to the sum of the first x NAC frames.Next, the realigned NAC images are forward projected andreconstructed. The result of the reconstruction is a realignedseries of AC images. A schematic diagram of method B isshown in Fig. 1b, where a summed (NAC) image of thefirst x frames is used as reference image.
Method C: NAC-on-μ
A disadvantage of both methods A and B is that they do notcorrect for a potential mismatch between transmission andemission scans or for movements during the first x frames.
Eur J Nucl Med Mol Imaging (2009) 36:2002–2013 2003
This drawback can be circumvented by using the attenua-tion map (μ-map or μ-image, Fig. 2c, g), reconstructedfrom the set of measured attenuation correction factors(ACF), as reference for realignment. All NAC frames arethen realigned to the μ-map and reconstructed using thesame μ-map for attenuation correction (Fig. 1b, referenceimage = μ-image).
Method D: NAC-on-cμ
It has been proposed that a variation of the μ-image, thecupped μ-image (cμ) [9], is better suited for realigning NACimages, as it has more corresponding contours (Fig. 2d, h).
The cupping effect is obtained as:
mcupped ¼ OSEM ACF�eACF
� �
All NAC frames are then realigned to the cupped μ-mapand reconstructed using the standard (non-cupped) μ-mapfor attenuation correction (Fig. 1b, reference image =cupped μ-image).
Simulation studies
Simulation studies were used to find optimal settings for themotion correction strategies. Kind of motion, motioncorrection method and definition of reference image werevaried.
Simulated PET scans
Two dynamic PET scans were simulated, each withdifferent tracer uptake. The first had high cortical tracer
Fig. 1 Overview of the variousmotion correction strategies.a AC-on-AC. b Depending onreference image: NAC-on-NAC,NAC-on-μ or NAC-on-cμ. Seetext for details
Fig. 2 Examples of a, e attenuation-corrected, b, f non-attenuation-corrected, c, g μ and d, h cupped μ-images for [11C]flumazenil (a–d) and (R)-[11C]PK11195 (e–h) scans
2004 Eur J Nucl Med Mol Imaging (2009) 36:2002–2013
uptake, simulating a tracer like [11C]flumazenil (SIMFMZ).In contrast, the second had low tracer uptake, simulating atracer like (R)-[11C]PK11195 (SIMPK). Due to its loweruptake, the latter scan should be more challenging for themotion correction process. Both simulated PET scans werebased on a grey-white matter segmented MRI scan. ForSIMFMZ, a typical [11C]flumazenil grey and white matterTAC was allocated to the grey and white matter segmentsof the MRI scan, respectively. SIMPK was generated in thesame way using typical (R)-[11C]PK11195 grey and whitematter TAC. Simulation scans were noise free andsmoothed with a Gaussian kernel of ∼8 mm full-width athalf-maximum (FWHM) to obtain a spatial resolution compa-rable to that of regular PET images. SIMFMZ and SIMPK
consisted of 16 and 23 time frames, respectively, identical tothe in-house protocols for clinical studies using these tracers.
Simulated motion
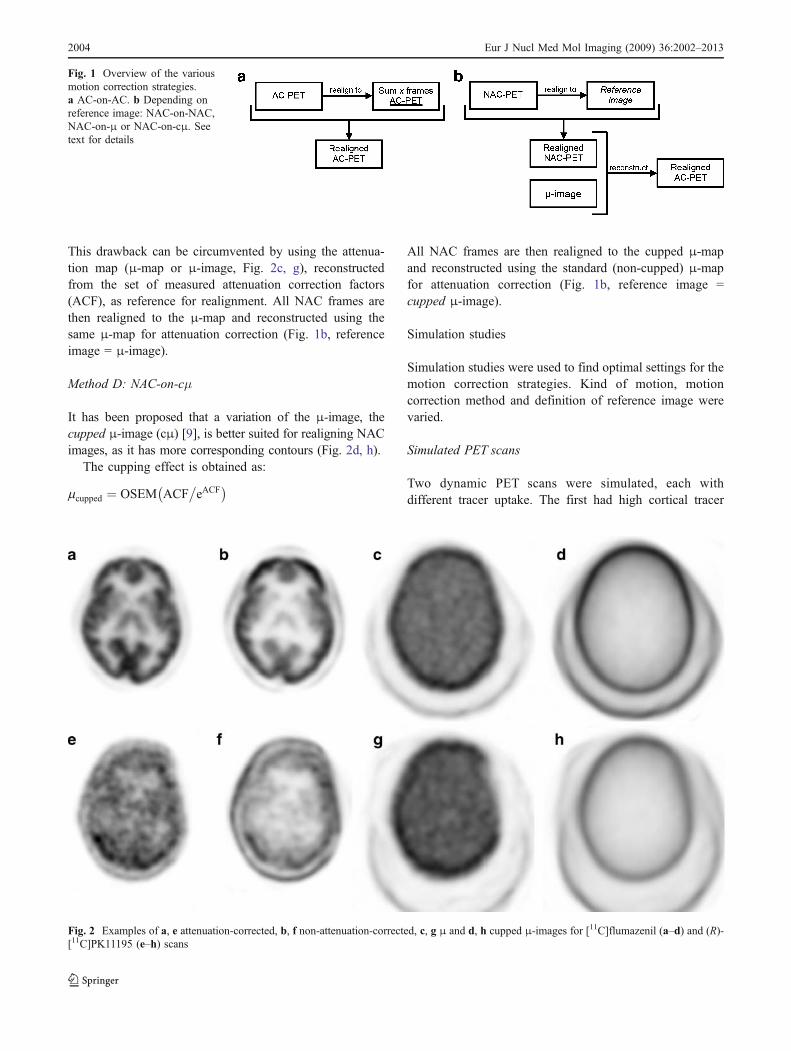
Two types of motion were added to both simulated PETscans.First, different rotations (3, 4, 5 and 6°, Fig. 3, top row) wereapplied, simulating the ‘napping effect’ at the end of a scan.These rotational movements correspond to movements ofmaximum 6.8, 8.2, 9.6 and 11 mm, respectively. The secondtype of motion simulated axial movements (2, 4, 6, 10 and20 mm, Fig. 3, bottom row) of a subject. This movement isseen most frequently in clinical practice when subjects arefixed using a head holder. Motion was added using Vincisoftware (Max Planck Institute for Neurological Research,Cologne, Germany, http://www.mpifnf.de/vinci/). Both rota-tions and translations were simulated as gradual motionstowards the end of the scans, reaching maximum movementsin the final frames.
To assess the effect of motion correction when nomotion is present, an additional simulation study was
performed. This simulation study consisted of 100motion-free [11C]flumazenil dynamic PET scans. Randomnoise (∼ 8% per pixel) was added to all simulated PETscans to determine the effect of applying motion correctionon motion-free data on accuracy and precision of VT.
Motion correction
Automated Image Registration (AIR, version 5.1.5; [15])was used to realign the simulated PET images. For thepresent simulation, the 3-D rigid body model using sixparameters was used. Prior to the motion correctionsimulation all (original) images were generated with aclinically relevant spatial resolution of about 8 mm FWHM,as mentioned before. Both the reference image and theimages to be aligned were additionally smoothed with aGaussian kernel of 5 mm FWHM to suppress noise and tospeed up realignment (default AIR settings for moderatelynoisy images). This additional smoothing was appliedduring the realignment process only in order to obtain therealignment matrix. The realignment matrix was thenapplied to the original image data (at the clinical imageresolution). Thresholds of reference and to be alignedimages were varied. Three different cost functions [16]were used, namely (1) standard deviation of ratio image, (2)least squares and (3) least squares with intensity rescaling(adding an intensity scaling term to the model).
Reference image
A reference image was used for motion correction strategiesA and B. These reference images are based on the sum ofthe first x frames of AC PET (method A) or NAC PET(method B). To find optimal settings for the referenceimage, x was varied from 3 to 10, corresponding to a
Fig. 3 Different types of motion added to the original simulated [11C]flumazenil PET images (a). The top row (b–e) shows rotationalmovements of 3, 4, 5 and 6°, respectively, and the lower row (f–j)
axial translational movements of 2, 4, 6 10 and 20 mm, respectively.The light grey contour on top of each image corresponds to theoriginal image (a)
Eur J Nucl Med Mol Imaging (2009) 36:2002–2013 2005
summation of the first 45 s to 10 min for SIMFLU and of thefirst 30 s to 5 min for SIMPK.
Clinical data
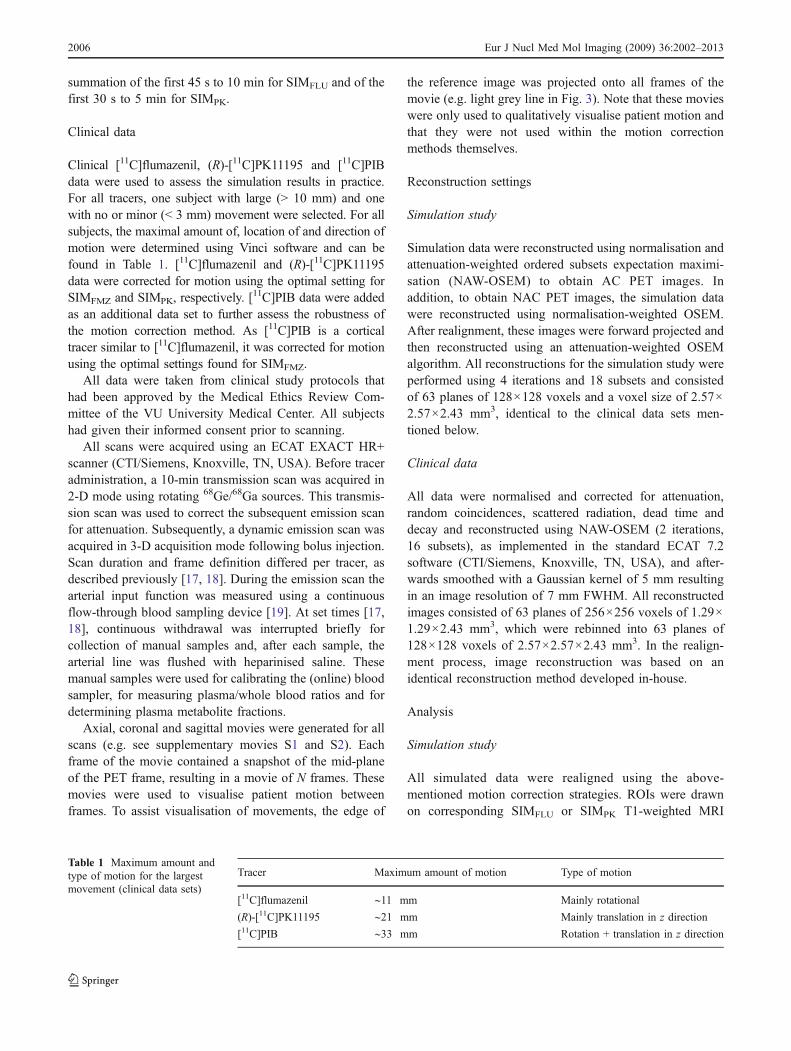
Clinical [11C]flumazenil, (R)-[11C]PK11195 and [11C]PIBdata were used to assess the simulation results in practice.For all tracers, one subject with large (> 10 mm) and onewith no or minor (< 3 mm) movement were selected. For allsubjects, the maximal amount of, location of and direction ofmotion were determined using Vinci software and can befound in Table 1. [11C]flumazenil and (R)-[11C]PK11195data were corrected for motion using the optimal setting forSIMFMZ and SIMPK, respectively. [
11C]PIB data were addedas an additional data set to further assess the robustness ofthe motion correction method. As [11C]PIB is a corticaltracer similar to [11C]flumazenil, it was corrected for motionusing the optimal settings found for SIMFMZ.
All data were taken from clinical study protocols thathad been approved by the Medical Ethics Review Com-mittee of the VU University Medical Center. All subjectshad given their informed consent prior to scanning.
All scans were acquired using an ECAT EXACT HR+scanner (CTI/Siemens, Knoxville, TN, USA). Before traceradministration, a 10-min transmission scan was acquired in2-D mode using rotating 68Ge/68Ga sources. This transmis-sion scan was used to correct the subsequent emission scanfor attenuation. Subsequently, a dynamic emission scan wasacquired in 3-D acquisition mode following bolus injection.Scan duration and frame definition differed per tracer, asdescribed previously [17, 18]. During the emission scan thearterial input function was measured using a continuousflow-through blood sampling device [19]. At set times [17,18], continuous withdrawal was interrupted briefly forcollection of manual samples and, after each sample, thearterial line was flushed with heparinised saline. Thesemanual samples were used for calibrating the (online) bloodsampler, for measuring plasma/whole blood ratios and fordetermining plasma metabolite fractions.
Axial, coronal and sagittal movies were generated for allscans (e.g. see supplementary movies S1 and S2). Eachframe of the movie contained a snapshot of the mid-planeof the PET frame, resulting in a movie of N frames. Thesemovies were used to visualise patient motion betweenframes. To assist visualisation of movements, the edge of
the reference image was projected onto all frames of themovie (e.g. light grey line in Fig. 3). Note that these movieswere only used to qualitatively visualise patient motion andthat they were not used within the motion correctionmethods themselves.
Reconstruction settings
Simulation study
Simulation data were reconstructed using normalisation andattenuation-weighted ordered subsets expectation maximi-sation (NAW-OSEM) to obtain AC PET images. Inaddition, to obtain NAC PET images, the simulation datawere reconstructed using normalisation-weighted OSEM.After realignment, these images were forward projected andthen reconstructed using an attenuation-weighted OSEMalgorithm. All reconstructions for the simulation study wereperformed using 4 iterations and 18 subsets and consistedof 63 planes of 128×128 voxels and a voxel size of 2.57×2.57×2.43 mm3, identical to the clinical data sets men-tioned below.
Clinical data
All data were normalised and corrected for attenuation,random coincidences, scattered radiation, dead time anddecay and reconstructed using NAW-OSEM (2 iterations,16 subsets), as implemented in the standard ECAT 7.2software (CTI/Siemens, Knoxville, TN, USA), and after-wards smoothed with a Gaussian kernel of 5 mm resultingin an image resolution of 7 mm FWHM. All reconstructedimages consisted of 63 planes of 256×256 voxels of 1.29×1.29×2.43 mm3, which were rebinned into 63 planes of128×128 voxels of 2.57×2.57×2.43 mm3. In the realign-ment process, image reconstruction was based on anidentical reconstruction method developed in-house.
Analysis
Simulation study
All simulated data were realigned using the above-mentioned motion correction strategies. ROIs were drawnon corresponding SIMFLU or SIMPK T1-weighted MRI
Tracer Maximum amount of motion Type of motion
[11C]flumazenil ∼11 mm Mainly rotational
(R)-[11C]PK11195 ∼21 mm Mainly translation in z direction
[11C]PIB ∼33 mm Rotation + translation in z direction
Table 1 Maximum amount andtype of motion for the largestmovement (clinical data sets)
2006 Eur J Nucl Med Mol Imaging (2009) 36:2002–2013
images over different anatomical regions (frontal lobe, pre-frontal lobe, parietal lobe, thalamus, temporal, occipital,thalamus, pons, cerebellum, caudate and putamen) usingDISPLAY software (Montreal Neurological Institute, http://www.bic.mni.mcgill.ca/software/Display/Display.html).ROIs were projected onto all frames of the simulated PETscans and TACs were generated as the time sequences ofaverage ROI values. For all anatomical regions, TACs ofrealigned simulated PET scans were compared with theoriginal (no motion) simulated PET scans. Optimal settingsfor the simulation study were determined by finding thebest combination (method, cost function, reference imagegeneration, etc.) for which differences between regionalactivity concentrations after motion correction and the true(simulated) activity concentrations were minimal.
Parametric volume of distribution (VT) images werecalculated for all (corrected) simulated PET scans usingLogan analysis [20]. Mean VT values for the variousanatomical regions (see above) were calculated andcompared with the corresponding original VT values.
To determine the effect of motion correction on accuracyand precision of VT with no actual motion present in thedata, 100 motion-free simulated PET scans with addednoise were analysed both with and without motioncorrection. Parametric VT images and mean VT values forvarious anatomical regions (see above) were calculated. Inaddition, per anatomical region, the coefficient of variation(COV, precision) and bias (accuracy) was calculated. TheCOV (%) was calculated as the standard deviation dividedby the mean times 100%. The bias was calculated as thepercentage of change in regional VT values betweenmotion-free simulated PET scans, which were correctedfor motion, and the original motion-free simulated PETscans.
Clinical data
All clinical data were realigned using the optimalsettings from the simulation study. The result of eachrealignment was evaluated visually by generating threemovies (axial, coronal and sagittal), as described above.VT images were calculated for both motion-corrected anduncorrected PET images. Ratio images were generated bydividing the VT image of the motion-corrected data set bythe VT image of the original (uncorrected) data set. Usingthe software package DISPLAY, a total of 15 ROIs weredrawn manually on individually co-registered T1-weighted MRI images in the same anatomical regions asspecified above. MRI scans were co-registered to summedimages of the first 3 min of the dynamic PET scans. ROIswere projected onto VT images and mean regional VT
values of uncorrected and motion-corrected TACs werecompared.
Results
Simulations
Effect of motion on TAC
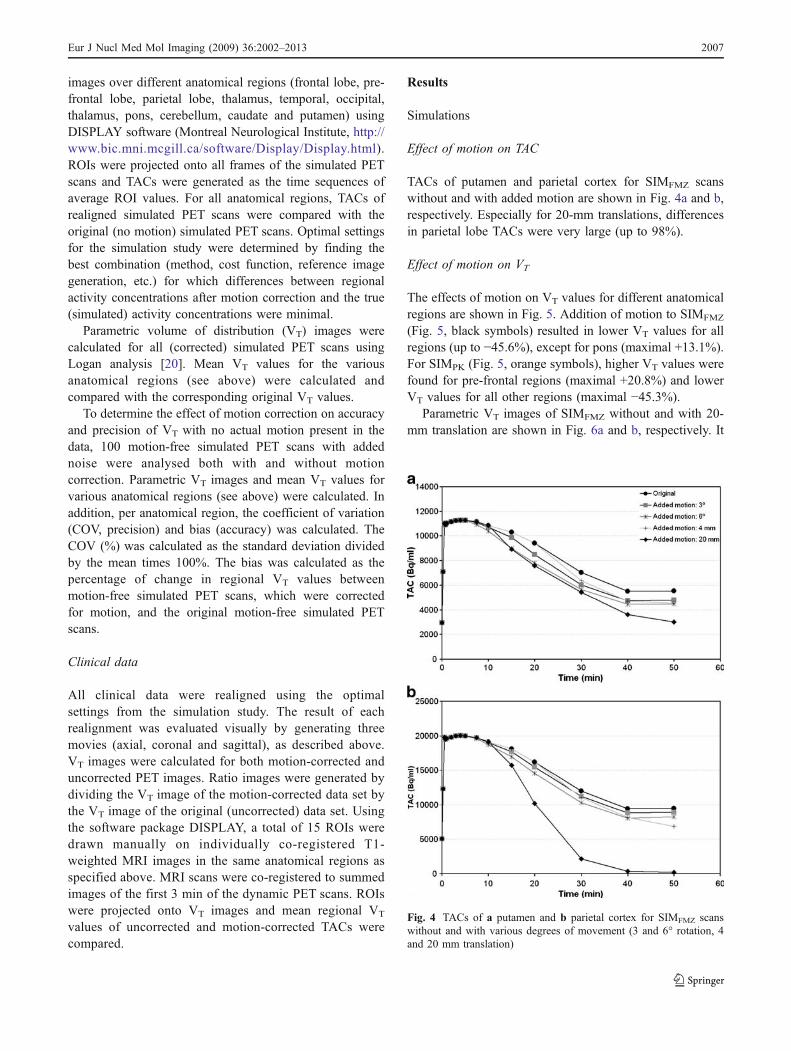
TACs of putamen and parietal cortex for SIMFMZ scanswithout and with added motion are shown in Fig. 4a and b,respectively. Especially for 20-mm translations, differencesin parietal lobe TACs were very large (up to 98%).
Effect of motion on VT
The effects of motion on VT values for different anatomicalregions are shown in Fig. 5. Addition of motion to SIMFMZ
(Fig. 5, black symbols) resulted in lower VT values for allregions (up to −45.6%), except for pons (maximal +13.1%).For SIMPK (Fig. 5, orange symbols), higher VT values werefound for pre-frontal regions (maximal +20.8%) and lowerVT values for all other regions (maximal −45.3%).
Parametric VT images of SIMFMZ without and with 20-mm translation are shown in Fig. 6a and b, respectively. It
Fig. 4 TACs of a putamen and b parietal cortex for SIMFMZ scanswithout and with various degrees of movement (3 and 6° rotation, 4and 20 mm translation)
Eur J Nucl Med Mol Imaging (2009) 36:2002–2013 2007
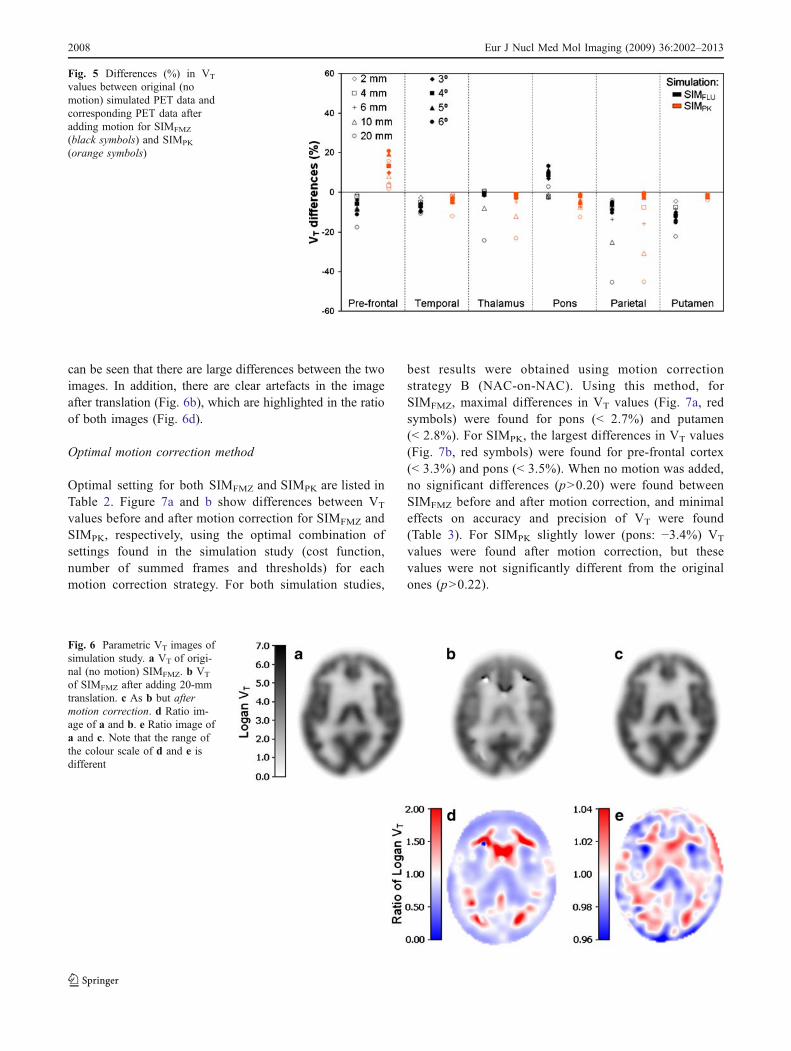
can be seen that there are large differences between the twoimages. In addition, there are clear artefacts in the imageafter translation (Fig. 6b), which are highlighted in the ratioof both images (Fig. 6d).
Optimal motion correction method
Optimal setting for both SIMFMZ and SIMPK are listed inTable 2. Figure 7a and b show differences between VT
values before and after motion correction for SIMFMZ andSIMPK, respectively, using the optimal combination ofsettings found in the simulation study (cost function,number of summed frames and thresholds) for eachmotion correction strategy. For both simulation studies,
best results were obtained using motion correctionstrategy B (NAC-on-NAC). Using this method, forSIMFMZ, maximal differences in VT values (Fig. 7a, redsymbols) were found for pons (< 2.7%) and putamen(< 2.8%). For SIMPK, the largest differences in VT values(Fig. 7b, red symbols) were found for pre-frontal cortex(< 3.3%) and pons (< 3.5%). When no motion was added,no significant differences (p>0.20) were found betweenSIMFMZ before and after motion correction, and minimaleffects on accuracy and precision of VT were found(Table 3). For SIMPK slightly lower (pons: −3.4%) VT
values were found after motion correction, but thesevalues were not significantly different from the originalones (p>0.22).
Fig. 5 Differences (%) in VT
values between original (nomotion) simulated PET data andcorresponding PET data afteradding motion for SIMFMZ
(black symbols) and SIMPK
(orange symbols)
Fig. 6 Parametric VT images ofsimulation study. a VT of origi-nal (no motion) SIMFMZ. b VT
of SIMFMZ after adding 20-mmtranslation. c As b but aftermotion correction. d Ratio im-age of a and b. e Ratio image ofa and c. Note that the range ofthe colour scale of d and e isdifferent
2008 Eur J Nucl Med Mol Imaging (2009) 36:2002–2013
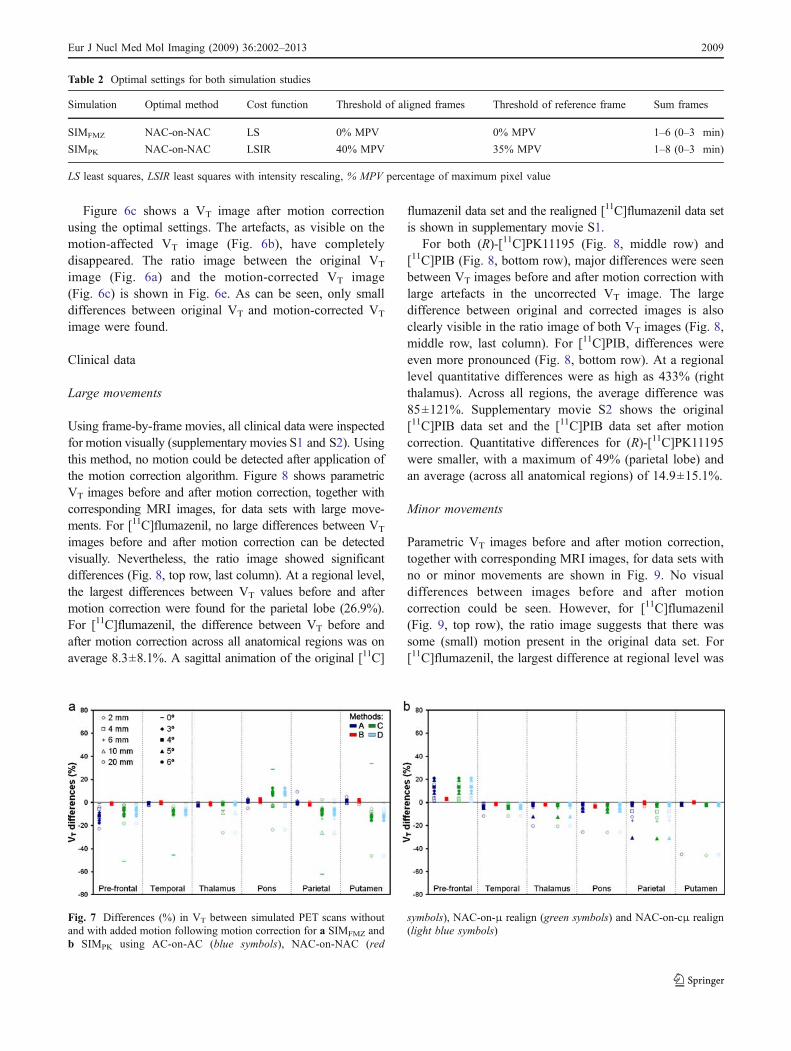
Figure 6c shows a VT image after motion correctionusing the optimal settings. The artefacts, as visible on themotion-affected VT image (Fig. 6b), have completelydisappeared. The ratio image between the original VT
image (Fig. 6a) and the motion-corrected VT image(Fig. 6c) is shown in Fig. 6e. As can be seen, only smalldifferences between original VT and motion-corrected VT
image were found.
Clinical data
Large movements
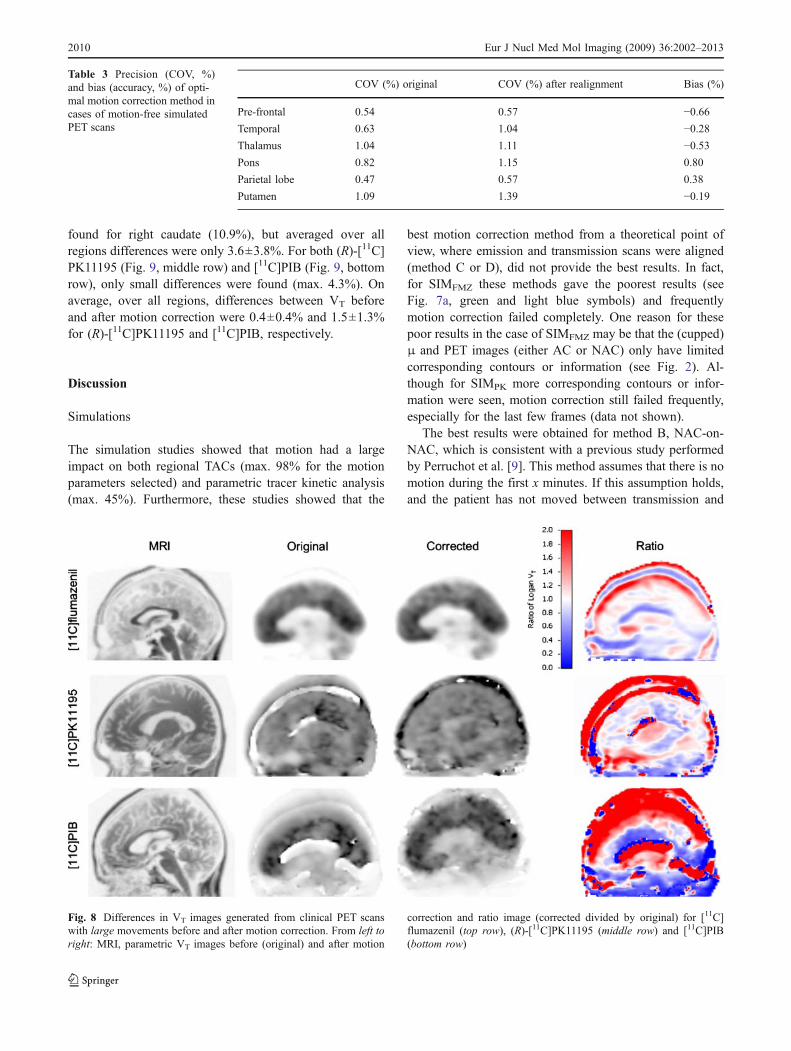
Using frame-by-frame movies, all clinical data were inspectedfor motion visually (supplementary movies S1 and S2). Usingthis method, no motion could be detected after application ofthe motion correction algorithm. Figure 8 shows parametricVT images before and after motion correction, together withcorresponding MRI images, for data sets with large move-ments. For [11C]flumazenil, no large differences between VT
images before and after motion correction can be detectedvisually. Nevertheless, the ratio image showed significantdifferences (Fig. 8, top row, last column). At a regional level,the largest differences between VT values before and aftermotion correction were found for the parietal lobe (26.9%).For [11C]flumazenil, the difference between VT before andafter motion correction across all anatomical regions was onaverage 8.3±8.1%. A sagittal animation of the original [11C]
flumazenil data set and the realigned [11C]flumazenil data setis shown in supplementary movie S1.
For both (R)-[11C]PK11195 (Fig. 8, middle row) and[11C]PIB (Fig. 8, bottom row), major differences were seenbetween VT images before and after motion correction withlarge artefacts in the uncorrected VT image. The largedifference between original and corrected images is alsoclearly visible in the ratio image of both VT images (Fig. 8,middle row, last column). For [11C]PIB, differences wereeven more pronounced (Fig. 8, bottom row). At a regionallevel quantitative differences were as high as 433% (rightthalamus). Across all regions, the average difference was85±121%. Supplementary movie S2 shows the original[11C]PIB data set and the [11C]PIB data set after motioncorrection. Quantitative differences for (R)-[11C]PK11195were smaller, with a maximum of 49% (parietal lobe) andan average (across all anatomical regions) of 14.9±15.1%.
Minor movements
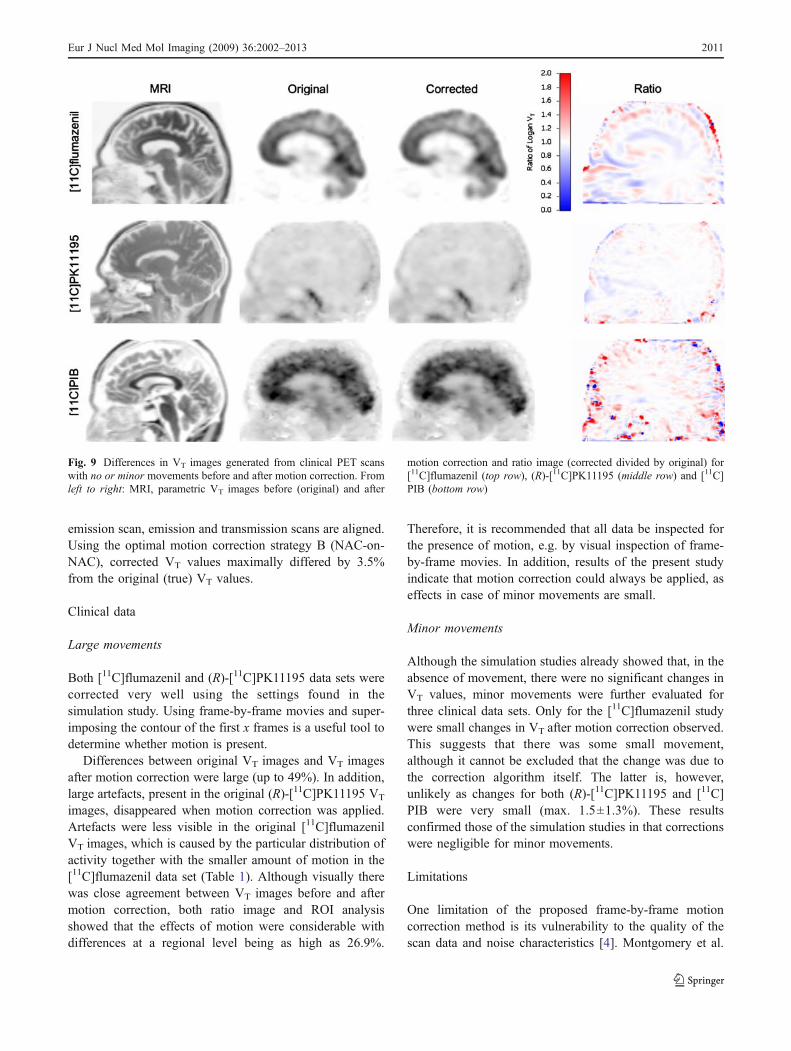
Parametric VT images before and after motion correction,together with corresponding MRI images, for data sets withno or minor movements are shown in Fig. 9. No visualdifferences between images before and after motioncorrection could be seen. However, for [11C]flumazenil(Fig. 9, top row), the ratio image suggests that there wassome (small) motion present in the original data set. For[11C]flumazenil, the largest difference at regional level was
Table 2 Optimal settings for both simulation studies
Simulation Optimal method Cost function Threshold of aligned frames Threshold of reference frame Sum frames
SIMFMZ NAC-on-NAC LS 0% MPV 0% MPV 1–6 (0–3 min)
SIMPK NAC-on-NAC LSIR 40% MPV 35% MPV 1–8 (0–3 min)
LS least squares, LSIR least squares with intensity rescaling, % MPV percentage of maximum pixel value
Fig. 7 Differences (%) in VT between simulated PET scans withoutand with added motion following motion correction for a SIMFMZ andb SIMPK using AC-on-AC (blue symbols), NAC-on-NAC (red
symbols), NAC-on-μ realign (green symbols) and NAC-on-cμ realign(light blue symbols)
Eur J Nucl Med Mol Imaging (2009) 36:2002–2013 2009
found for right caudate (10.9%), but averaged over allregions differences were only 3.6±3.8%. For both (R)-[11C]PK11195 (Fig. 9, middle row) and [11C]PIB (Fig. 9, bottomrow), only small differences were found (max. 4.3%). Onaverage, over all regions, differences between VT beforeand after motion correction were 0.4±0.4% and 1.5±1.3%for (R)-[11C]PK11195 and [11C]PIB, respectively.
Discussion
Simulations
The simulation studies showed that motion had a largeimpact on both regional TACs (max. 98% for the motionparameters selected) and parametric tracer kinetic analysis(max. 45%). Furthermore, these studies showed that the
best motion correction method from a theoretical point ofview, where emission and transmission scans were aligned(method C or D), did not provide the best results. In fact,for SIMFMZ these methods gave the poorest results (seeFig. 7a, green and light blue symbols) and frequentlymotion correction failed completely. One reason for thesepoor results in the case of SIMFMZ may be that the (cupped)μ and PET images (either AC or NAC) only have limitedcorresponding contours or information (see Fig. 2). Al-though for SIMPK more corresponding contours or infor-mation were seen, motion correction still failed frequently,especially for the last few frames (data not shown).
The best results were obtained for method B, NAC-on-NAC, which is consistent with a previous study performedby Perruchot et al. [9]. This method assumes that there is nomotion during the first x minutes. If this assumption holds,and the patient has not moved between transmission and
COV (%) original COV (%) after realignment Bias (%)
Pre-frontal 0.54 0.57 −0.66Temporal 0.63 1.04 −0.28Thalamus 1.04 1.11 −0.53Pons 0.82 1.15 0.80
Parietal lobe 0.47 0.57 0.38
Putamen 1.09 1.39 −0.19
Table 3 Precision (COV, %)and bias (accuracy, %) of opti-mal motion correction method incases of motion-free simulatedPET scans
Fig. 8 Differences in VT images generated from clinical PET scanswith large movements before and after motion correction. From left toright: MRI, parametric VT images before (original) and after motion
correction and ratio image (corrected divided by original) for [11C]flumazenil (top row), (R)-[11C]PK11195 (middle row) and [11C]PIB(bottom row)
2010 Eur J Nucl Med Mol Imaging (2009) 36:2002–2013
emission scan, emission and transmission scans are aligned.Using the optimal motion correction strategy B (NAC-on-NAC), corrected VT values maximally differed by 3.5%from the original (true) VT values.
Clinical data
Large movements
Both [11C]flumazenil and (R)-[11C]PK11195 data sets werecorrected very well using the settings found in thesimulation study. Using frame-by-frame movies and super-imposing the contour of the first x frames is a useful tool todetermine whether motion is present.
Differences between original VT images and VT imagesafter motion correction were large (up to 49%). In addition,large artefacts, present in the original (R)-[11C]PK11195 VT
images, disappeared when motion correction was applied.Artefacts were less visible in the original [11C]flumazenilVT images, which is caused by the particular distribution ofactivity together with the smaller amount of motion in the[11C]flumazenil data set (Table 1). Although visually therewas close agreement between VT images before and aftermotion correction, both ratio image and ROI analysisshowed that the effects of motion were considerable withdifferences at a regional level being as high as 26.9%.
Therefore, it is recommended that all data be inspected forthe presence of motion, e.g. by visual inspection of frame-by-frame movies. In addition, results of the present studyindicate that motion correction could always be applied, aseffects in case of minor movements are small.
Minor movements
Although the simulation studies already showed that, in theabsence of movement, there were no significant changes inVT values, minor movements were further evaluated forthree clinical data sets. Only for the [11C]flumazenil studywere small changes in VT after motion correction observed.This suggests that there was some small movement,although it cannot be excluded that the change was due tothe correction algorithm itself. The latter is, however,unlikely as changes for both (R)-[11C]PK11195 and [11C]PIB were very small (max. 1.5±1.3%). These resultsconfirmed those of the simulation studies in that correctionswere negligible for minor movements.
Limitations
One limitation of the proposed frame-by-frame motioncorrection method is its vulnerability to the quality of thescan data and noise characteristics [4]. Montgomery et al.
Fig. 9 Differences in VT images generated from clinical PET scanswith no or minor movements before and after motion correction. Fromleft to right: MRI, parametric VT images before (original) and after
motion correction and ratio image (corrected divided by original) for[11C]flumazenil (top row), (R)-[11C]PK11195 (middle row) and [11C]PIB (bottom row)
Eur J Nucl Med Mol Imaging (2009) 36:2002–2013 2011
[11] claimed that problems may occur within the last frameof the PET scan because of poor statistics. This mayespecially be the case for older data sets acquired on lowersensitivity scanners. In the present study, effects of noisewere reduced as much as possible by reconstructing datasets with OSEM, which provides images with less noisethen filtered back projection. In addition, images weresmoothed (only) during the motion correction process,which was not only helpful for the motion correctionoptimisation process, but also for reducing the level ofnoise. Problems with the last frame, as reported byMontgomery et al. [11], were not observed in the presentstudy. Although it is possible that the motion correctionalgorithm might fail due to low image quality, this does notseem to be likely given the positive results with the lowuptake ligand (R)-[11C]PK11195 in the present study.
Another limitation of the frame-by-frame motion correc-tion method is the underlying assumption that there is nosignificant change in activity distribution within andbetween frames [4]. This assumption can only be true forthe last frames. In fact, the activity distribution variesrapidly in the first frames. For the optimal motioncorrection method B, the summed reference image hastherefore another activity distribution compared to the laterframes. However, for the present study, this did not causeany problems during the motion correction process.
The optimal motion correction method derived from thepresent study assumes that there is no mismatch betweenthe transmission scan and the first x frames of the emissionscan. This is a reasonable assumption, because most patientmotion appears at later time points of the scan (>10 min)(data not shown). It is, however, recommended that correctalignment of transmission and early (in this case 0–3 minpost-injection) emission scans be verified. Nevertheless, ifmotion appears between transmission and emission scan orwithin the first 3 min of the emission scan, the mismatchbetween transmission and emission scans remains. Al-though motion correction methods C and D correct foremission and transmission mismatch, no satisfactory resultswere obtained in this study. The use of different costfunctions might improve the performance of these methodsand therefore have to be investigated. However, for sometracers, like [11C]flumazenil with high cortical uptake,methods C and D will probably always fail because thereis too little commonality between the emission (NAC) andµ-images. Even if a mismatch between emission andtransmission scans would exist, results of the present studyshow that a frame-by-frame correction method provides amajor improvement in accuracy of pharmacokinetic analy-ses over non-motion-corrected data.
As mentioned before, the final method derived from thepresent study does not correct for in-frame motion andtherefore motion could still be present within a frame.
However, the present method may be suited to identifysuspicious frames and exclude those frames in thefollowing analysis. An easy way to do this is to make aframe-by-frame movie of a data set and identify in whichframe the motion starts. Subsequently, the frames beforeand after the initial motion-affected frame should bevisually inspected for any unexpected blurring. A highlyblurred frame indicates that there is considerable patientmotion during the frame and therefore that frame should beexcluded in further analysis.
The AIR package was chosen because it is freelyavailable, easily adjustable and fast. However, it has thedisadvantage that only three different cost functions areavailable. In some applications other cost functions, such asthose based on mutual information, may be more appropri-ate. In those cases, however, it will be necessary to againdetermine optimal settings for that specific registrationalgorithm.
Clinical applicability
The present study shows that it is possible to performan accurate off-line motion correction for dynamic brainstudies. In theory, this method should also be applicableto other organs, provided observed motions are rigid.The latter requirement, however, will limit use of theproposed method for non-brain studies. Even whenthe method would be applicable, optimal settings forthe motion correction algorithm need to be re-evaluatedfor such an application.
For older data sets, no raw data may be available. Theoptimal method presented here does not require sinogramor list-mode data, but only reconstructed PET and µ-images. Therefore, this method can also be used foraccurate motion correction of older data sets.
In clinical practice, subjects are fixed using a headholder. The movements that are most frequently observedare rotations around the x-axis and axial translations.Therefore, only these kinds of movements were includedin the simulation study. Clearly, other types of motion (e.g.rotations around the z-axis) may also occur. It should benoted, however, that these types of motion will also becorrected for using the method presented, as all rotationaland translational movements are obtained during theregistration process.
Conclusion
If no optical tracking system is available or when older datasets need to be reanalysed, a frame-by-frame motioncorrection method, based on non-attenuation-correctedimages, provides major improvements in accuracy ofpharmacokinetic analyses over non-motion-corrected data.
2012 Eur J Nucl Med Mol Imaging (2009) 36:2002–2013

Acknowledgements This work was financially supported by theNetherlands Organisation for Scientific Research (NWO, VIDI Grant016.066.309). The authors would like to thank Anthonin Reilhac forhis useful comments, Bart N.M. van Berckel, Hedy Folkersma, ReinaW. Kloet, Ursula M. Klumpers, Nelleke Tolboom and Alie Schuite-maker for providing the clinical data, and the radiochemistry andtechnologists staff of the Department of Nuclear Medicine & PETResearch for production of isotopes and acquisition of data.
Open Access This article is distributed under the terms of theCreative Commons Attribution Noncommercial License which per-mits any noncommercial use, distribution, and reproduction in anymedium, provided the original author(s) and source are credited.
References
1. Mourik JEM, van Velden FHP, Lubberink M, Kloet RW,Berckel BNM, Lammertsma AA, et al. Image derived inputfunctions for dynamic high resolution research tomographPET brain studies. Neuroimage 2008;43:676–86. doi:10.1016/j.neuroimage.2008.07.035.
2. Green MV, Seidel J, Stein SD, Tedder TE, Kempner KM,Kertzman C, et al. Head movement in normal subjects duringsimulated PET brain imaging with and without head restraint. JNucl Med 1994;35:1538–46.
3. Beyer T, Tellmann L, Nickel I, Pietrzyk U. On the use ofpositioning aids to reduce misregistration in the head and neck inwhole-body PET/CT studies. J Nucl Med 2005;46:596–602.
4. Rahmim A. Advanced motion correction methods in PET. Iran JNucl Med 2005;13:1–17
5. Bloomfield PM, Spinks TJ, Reed J, Schnorr L, Westrip AM,Livieratos L, et al. The design and implementation of a motioncorrection scheme for neurological PET. Phys Med Biol2003;48:959–78. doi:10.1088/0031-9155/48/8/301.
6. Goldstein SR, Daube-Witherspoon ME, Green MV, Eidsath A. Ahead motion measurement system suitable for emission computedtomography. IEEE Trans Med Imaging 1997;16:17–27.doi:10.1109/42.552052.
7. Rahmim A, Rousset OG, Zaidi H. Strategies for motion trackingand correction in PET. PET Clin 2007;2:251–66. doi:10.1016/j.cpet.2007.08.002.
8. Andersson JL. A rapid and accurate method to realign PET scansutilizing image edge information. J Nucl Med 1995;36:657–69.
9. Perruchot F, Reilhac A, Grova C, Evans AC, Dagher A. Motioncorrection of multi-frame PET data. IEEE Nucl Sci Symp ConfRec 2004;5:3186–90.
10. Lin KP, Huang SC, Yu DC, Melega W, Barrio JR, Phelps ME.Automated image registration for FDOPA PET studies. Phys MedBiol 1996;41:2775–88. doi:10.1088/0031-9155/41/12/014.
11. Montgomery AJ, Thielemans K, Mehta MA, Turkheimer F,Mustafovic S, Grasby PM. Correction of head movement on PETstudies: comparison of methods. J Nucl Med 2006;47:1936–44.
12. Andersson JL. How to obtain high-accuracy image registration:application to movement correction of dynamic positron emissiontomography data. Eur J Nucl Med 1998;25:575–86. doi:10.1007/s002590050258.
13. Woods RP, Grafton ST, Holmes CJ, Cherry SR, Mazziotta JC.Automated image registration: I. General methods and intra-subject, intramodality validation. J Comput Assist Tomogr1998;22:139–52. doi:10.1097/00004728-199801000-00027.
14. Woods RP, Grafton ST, Watson JD, Sicotte NL, Mazziotta JC.Automated image registration: II. Intersubject validation of linearand nonlinear models. J Comput Assist Tomogr 1998;22:153–65.doi:10.1097/00004728-199801000-00028.
15. Woods RP, Cherry SR, Mazziotta JC. Rapid automated algorithmfor aligning and reslicing PET images. J Comput Assist Tomogr1992;16:620–33. doi:10.1097/00004728-199207000-00024.
16. Zamburlini M, Camborde M, de la Fuente-Fernandez R, StoesslAJ, Ruth TJ, Sossi V. Impact of the spatial normalization templateand realignment procedure on the SPM analysis of [11C]raclopride PET studies. IEEE Trans Nucl Sci 2004;51:205–11.doi:10.1109/TNS.2003.823030.
17. Mourik JEM, Lubberink M, Klumpers UMH, Lammertsma AA,Boellaard R. Partial volume corrected image derived inputfunctions for dynamic brain studies: methodology and validationfor [11C]flumazenil. Neuroimage 2008;39:1041–50. doi:10.1016/j.neuroimage.2007.10.022.
18. Mourik JEM, Lubberink M, Schuitemaker A, Tolboom N, vanBerckel BN, Lammertsma AA, et al. Image-derived inputfunctions for PET brain studies. Eur J Nucl Med Mol Imaging2009;36:463–71. doi:10.1007/s00259-008-0986-8.
19. Boellaard R, van Lingen A, van Balen SC, Hoving BG, LammertsmaAA. Characteristics of a new fully programmable blood samplingdevice for monitoring blood radioactivity during PET. Eur J NuclMed 2001;28:81–9. doi:10.1007/s002590000405.
20. Logan J. Graphical analysis of PET data applied to reversible andirreversible tracers. Nucl Med Biol 2000;27:661–70. doi:10.1016/S0969-8051(00)00137-2.
Eur J Nucl Med Mol Imaging (2009) 36:2002–2013 2013


![Motion Correction of Y Dose Maps with PET/MR Imaging · 2017. 1. 30. · accuracy [3]. Clinical SPECT and PET scanners are currently integrated with CT systems to enable localiza-tion](https://img.pdfslide.us/doc/110x75/5ffc5567cc1ce707e669ff8c/motion-correction-of-y-dose-maps-with-petmr-imaging-2017-1-30-accuracy-3.jpg)