Embed Size (px)
Citation preview

_ DEPARTMENT OF TRANSPORTATIONUNITED STATES COAST GUARD
Off ice ofRESEARCH & DEVELOPMENT
Project 723262
HAZARDS OF MARINE TRANSPORTATION-
OF LIQUID CHLORINE
U. S. Department of the InteriorBureau of Mines A
Pittsburgh, Pennsylvania
0 Final Report
Rwd•cdby e March 1970NATIONAL TECHNICALINFORMATION SERVICE
U S [)Vw 'et f CncecceS 'g.dVA 22351
Document is available to the public through the NationalTechnical Information Service, Springfield, Virginia 22151
Prepared for: COMMANDANT ( GDS1 'IU.S. COAST GUARD HEADQUARTERSWASHINGTON, D.C., 20590
A

IN t7 mr__
Date 4SEP
This report has been submitt2d in fulfillment of contractD0T-CG-MIPR No. Z-70099-9-93754 and is promulgated subject to thefollowing qualifications:
The contents of this report reflect the views of the Bureauof Mines, Department of the Interior, which is responsible for thefacts and the accuracy of the data presented herein. The contentsdo not necessarily reflect the official views or policy of theCoast Guard. This report does not constitute a standard, specifi-cation, or regulation.
c 1
Captain, U. S. Coast GuardChief, Marine Safety Technology DivisionOffice of Research and DevelopmentU.S. Coast Guard HeadquartersWashington, D. C. 20590
1,

Unclassified
DOCUMENT CONTROL DATA-R&D• I -t f% . of•• .. l.l I 'll . 1-11 l .. .. 1 .011l~f... t . I .. IIdl' l: f#i be.. .'wt • I . " Il. d "h,., fl...Is -11 -~P wll I a .•% |€.)
"I -'JA A,'N( 1 • iV I• I ,( fd.n .lfothort Is. kLi'O" I 5i.Cuk-It I CLArh ICA 10O.%
U. S. Department of the Interior Unclassifi'edBureau of Mines b Gkoup
ofLqud13/10Pittsburgh, Pennsylvania 07/01 130
R! Hazards of .Marine Transportation of Liquid Chlorine
A LS F,iF- I 'I Vt CNOTIF %(n'.pe of reporft nd mch-ve d.oo*ate%j
Final Report April 1969 - December 1969
J. N. Murphy H. Lang W. B. SlomskiD. S. Burgess R. Mattes W. AlbaughM. E. Harris H. Grainger
I O(k I D1A rt.1 0 A OL I 5 hN 00:RF
March 1970 - 1707a Czý: .C ! O GPA-.T NO qbNIIN O SoEPORI NJV'LR(5I
MIPR No. Z-70099-9-93754ki A • 0o PMSRC Report No. S-4158723262
W, 0.ER RLPORI 3S An, tfhe-I .rmbn, ,. thisf t tr,,e.st ettho. repo.t)
d None"I ' -SlooaUTION 5 TATEMENT
Unlimited
ý- IL C ?A 1 .O CS12 5PO.JSC-.G. nY l. A'- 71 41
TOffice of Research and DevelopmentNone U. S. Coast Guard__ Washington, D. C. 20590
The Bureau of Mines has carried out a program of tests in which liquidchlorine was spilled onto a water surface and gaseous and liquid chlorinewere released underwater. The scale of experiments ranged up to a 10-gallon(130 lb.) spill and to a 72 lb/hr leak rate under 15 feet of water. Ratesof chlorine evaporation were observed photographically and the atmosphericdispersion of the toxic gas was followed by gas sampling. A concurrentlaboratory-scale investigation was made of the rates of solution of gaseouschlorine in tap water, cold tap water, and brine. The enlargement of apinhole during the underwater leakage of chlorine was also observed.
this doc-; be better
D, , UnclaskifledS/N 0101-807-6801 Secu-•u cla-sf

Unclassified%rt urit% C14.%ulieation
9Y WOROS LiLNK A LI K U LINK CROL•�*T ROLE wr ROLE WT
Chlorine Spills on WaterEvaporaticin-ChlorineDispersion in AtmosphereGaseous ChlorineToxic GasUnderwater ReleaseRate of SolutionPoison GasMarine Transport of ChlorineChlorine CorrosionChlorine Leak RateRate of VaporizationAir PollutionHeavy Gas Layering A
DD 'N'ov 1473 ACK)Unclassifi(PArE- 2) U ca sf ed
E2)SecL-,ty Classification
/-.--•-

FINAL REPORT
WHA.ARDS OF MARINE TRANSPORTATION OF LIQUID CHIORINE
March 1970
Prepared by:
J. N. MurphyN. E. HarrisD. Burgess
PMSRC Report No. S-4158
oI
APPROVED:
Robert U. VaniDolahResearch DirectorFittsburgh Mining andSafety Research Center
U. S. Department of the InteriorBureau of Mines
Pittsburgh, Pennsylvania
[a

TABLE OF CONTENTSIPageAFOREWORD . . . . . .ABSTRACTo . . . . . . . . . . . . . . . . . . . . . 2I. LNTRODUCTION . . . . . . . . . . . . . . . . . . . . . .*. 2
II. ACK4OWLEDGEMENTS ..................... . 3
III. RE-VIEW OF SOMEPERTINENT LITERATURE . . . . . . ..... 4IV. EXPERIHEN.TL PROCEDURES . ......... ...... 10
A. Procedures with Gaseous Chlorine ........... 101. The Rate of Solution of Gaseous Chlorine
in Water (Laboratory Tests) . . . . . . . . . .. 102. Atmospheric Dispersion Tests of Gaseous
Chlorine and Butane (Bruceton Pond) ....... 12B. Spillage of Liquid Chlorine ............. 13C. Corrosion Test~s ................... 14
V. EXPERIHE•ITAL RESULTS. . . . . . . . . . . . . . . . . . . 14A. Solution of Gaseous Chlorine in Water and Brine . . . 14B. Corrosion Tests ................... 16C. Atmospheric Dispersion of Chlorine and Butane
Over Water . . . . . . . . . . ........... 18)D. Underwater Release of Liquid Chlorine ........ 24
SVI. DISCUSSION . . . . . . . . . . . . . . . . . . . . . . . . 28A. Rate of Vapor Generation on Spillage . . . . . . . . . 28B. Dispersion of an Instantaneously-generated
Cloud of Gas . . . . . . . . . . . 29C. Calculation of Gas Concentrations from Steady
Sources ....................... 31D. The Importance of the Area Covered by a
Chlorine Spill .................... 32E. Calculatinu of Gas Concentrations from
Instantaneous Release of Gas...... . . . . . . . 34F. Effectiveness of Water in Alleviating
Chlorine Releases .................. 35I. Estimation of Hazard .::::. . * . 0 36
=• VII. CONCLUSIONS ....................... 37
=LLSTRATIO[I$
Filt. No.
la Release rates of (a) liquid and (b) gaseous chlorinethrough an 0.34-inch orifice from a one-ton cylinderat an Iuitial temperature of 130" F.
lb Release rates of (a) vapor discharge through (1) a1-1/8-inch safety valve, and (2) an 18-inch manhole;(b) simltaneous vapor and liquid discharge throughtwo 0.5-inch diameter liquid valves, two 0.5-inchdiameter vapor valves, and a 1-1/8-Inch diameter safetyvapor valve.
lc Vapor discharge from a 300-ton tank through a 4-ihAchdiameter safety valve with an initial temperature of150" F.
2 Ground level dispersion of chlorine,
3 Percentage of liquid flashed vs Initial container -tempersture.
4 Downwind dispersal of an Instantaneous release ofg8deoaS chlorine.
5 Schematic diagram of laboratory apparatus.
6 Terminal velocity of gas bubbles In water as a functionof bubble sise,
7 Arrangment of test site for large-scale experiments.
8 Typical pressure and volume rates of sasnle intoevacuated bottles through hypodermic-type needles.
9 Spillage of 10 gallons of liquid chlorine onto water.Time between pictures is approximately 7 seconds.
10 Recults of 5 gallons of liquid chlorine relesed under4 feet of water; time between scenes is about 10 seconds.
11 Schematic of lake showing spill apparatus and samplingstations.
12 Schematic of ASTH A516 Grade 70 steel block used incorrosion tests.
iii
-- - - -

Fist., No. A
13 Percent chlorine dissolved in water at room temperature,7e C, and in brine for underwater depths of 4.5, 2.0,and 1.0 foot.
14 Instantaneous transfer coefficients as a function of time
or bubble age.
15 Comparison of integrated mass transfer coefficients forvarious gases.
16 Effect of gaseous chlorine at 10 psig flowing througha 0.030" diameter x 0.625" long hole in ASTM A-516 steelcontained in an aqueous environment.
17 Effect of gaseous chlorine at 90 psig flowing through a0.U30" diameter x 0.625" long hole in ASYM A-516 steelcontained in an aqueous environment.
18 Block of steel used for corrosion tests (left) beforeexperiment and (right) after gaseous chlorine at 90 psigwas flowed for 2 hours.
19 Effect of liquid chlorine at 90 psig flowing through a0.030" diameter x 0.625" long hole in ASTM A-516 steelS~contained In an aqueous environment.
23 Wind speed and standard deviation of direction.
21 Elapsed times for gas cloud evolution in several experimentsand computed tines that a person would be exposed to 50 or500 ppm chlorine in the same size spill.
22 Nominal distribution oi chlorine concentration around saobservation point downwind of an instantaneous releaseof gas.
23 Nomograph pertaining to concentrations from a steady sourceunder stable atmospheric conditions.
24 Nomograph pertaining to concentrations from a steady source
under unstable atmospheric conditions.
25 Nomograph pertaining to concentrations from an instantaneousrelease of gas under stable atmospheric conditions.
iii
-g~-

'M Sip
Fig. No.
26 Noinogranh pler? iii Ing to concentrations from an instantaneousrelease of gaz, nider unstable conditions.
27 Tracing of (a) 10 cc and (b) 30 cc chlorine bubble.
TABLES
Page
1 Pliysoi~ogiz-l effects of eiyosure to chlorine:n air . . . * * * * * * * . * *. * . * 5
2 Some rep.;:.s,ýcr ,.tive atmosphv':ic conditions 7
3 Effect oi. L:, exposure of ASDfl A-516 steel to -L
t:hlorine in an aqueous environmnt~ 17
4 Se--.~' ed properties of butane and chlorine . . . . . . 19
5 Disperslo:! of 0.526 lbs butane per minute over~Bruceton pond (Test #1) *. . . . ... 21
6 Dispersion of 0.625 lbs butane per minute and of0.40 lbs chlorine per minute over Bruceton pond(Test #2) . . . . . . . . . . 22
7 Dispersion of 0.338 lbs butane per minute and0.45 lbs chlorine per minute over Bruceton pond(Test #3) . . . . . . . . . ........ * 23
8 Chlorine dosages following underwater release of
9 Chlorine dosages following underwater release of
1lgallon liquid (Test #5) .. 0.. . .. . 27
10 Calculated peak concentrations in Test #4 . . . . .. 300
11 Concentrations, ppi downwind of a point sourceJ1of chlorine gas (unbracketed) and downwind ofa distributed aource (bracketed) o . a . . a 0 33
IVI

M7-y ~ ~ -
SYMBOLS USED REPETITIVELY
Par&sv ,ars in the atmospheric dispersion equation (p. 6)
C - concentration of chlorine dizlmnsik.Aless
Q-release rate of gaseous chlorine, ft3/Isec
U - mean wind speed, fttfcnL
x - doikvindd distance, feet
y - crosswin distance, feet
z - vertical distance, feetz
a-standard deviationI
CFq 7y a -standard deviation as measured from a plot ofconcentration vs distance, ft
00 - standard deviation of wind direction, degrees
A, B2, B1, C, D -gustiness classifications defined by Table 2. -
Vi

HAZARDS OF MARINE TRANSPORTATION OF LIQUID CHLORINE
FOREWORD
This report was prepared by the Pittsburgh Mining and SafetyResearch Center of the U. S. Bureau of Hines as the concluding itemof a supporting investigation for the Hazardous Hateriale Division ofthe U. S. Coast Guard. Experimental work was conducted from Aprilthrough December 1969. Six monthly letter reports were submitted anda briefing was performed at Coast Guard Headquarters on December 9,1969.
The work was performed under the cognizance of W. E. McConnaugheyof the Hazardous Materials Division and was administered at Pittsburghby R. W. Van Dolah. Participating investigators were D. S. Burgess,J. N. Murphy, H1. E. Harris, 11. Lang, R. Mattes, H. Grainger, W. B.Slomski, and W. Albaugh.
This report was submitted on March U1, 1970, and has been reviewedand approved.
.........

HAZARDS OF MARINE TRANSPORTATION OF LIQUID CHLORINE
Final Report
ABSTRACT
The Bureau of Mines has carried out a program of tests inwhich liquid chlorine was spilled onto a water surface and gaseousand liquid chlorine were released underwater. The scale of exper-i ~ ~iments ranged up to a 10-gallon (130 lb) spill and to a 72 lb/hr ,*
leak rate under 15 feet of water. Rates of chlorine evaporation: were observed photographically and the atmospheric disrersion ofthe toxic gas was followed by gas sampling. A concurrunt laboratory-
scale investigation was made of the rates of solution of gaseouschlorine in tap water, cold tap water, and brine. The enlargementof a pinhole during the underwater leakage of chlorine was alsoobserved.'
Major conclusions follow:
1. The rate of vaporization of chlorine is very fast; noevidence was found of a rate-limiting heat transfer across a gasfilm.
2. Contact with water removes a significant fraction cf thechlorine in slow leakage or in small spills; it could hardly be afactor iv catastrophic accidents.
3. The leak rate of gaseous chlorine through a hole (underwater)in ASTM A-516 Grade 70 steel is markedly accelerated by corrosion.
4. Toxic cloud concentrations downwind of a chlorine releaseare predictable by existing air pollution equations if one makesappropriate correction for heavy gas layering.
1. ITRODUCTION
The Bureau of Mines has conducted a supporting investigationfor the U. S. Coast Guard of the hazards of marine transportationof liquid chlorine. This project was prompted by an applicationto license for entry into Axrican waterways an ocean-going shipdesigned to carry several 3,000-ton chlorine tanks.
2

The program was expected to id to a published review of toxichazards by the Chlorine Institute- by paying particular attention tothe spillage or leakagi of chlorine into water. Some specific questionswere raised in advance-1 of the experimenta undertaking: What is thevapor generation rate on spillage of liquid chlorine into water; towhat extent is chlorin' dissolved on bubbling through water; how isthe chlorine leak rate from a submerged tank affected by corrosion; Iis the toxic cloud concentration reduced significantly on passageover an extended water surface; how does g9s layering affect theapplicability of micrometeorological equation for cloud dispersion.
The Bureau's work consisted of exploratory txperiments whichwere begun in May 1969 and concluded in December 1969. The scaleof tests ranged up to the spillage of 10 gallons of liquid chlorineon a water surface and to the instantaneous release underwater of5 gallons of chlorine. As the program developed, several of theobjectives were found to be of rather academic interest and wereaccordingly modified; thus, the rate of chlorine vapor evolutionwas found to be effectively instantaneous when liquid was spilledinto water and attempts to measure this rate was therefore discon-tinued. The greatest part of the experimental effort was relatedto the downwind dispersion of chlorine concentration. This isreflected in the emphasis given to dispersion phenomena in thesections that follow.
II. ACKNOWLEDGEMENTS
Many persons took a helpful interest in this work and suppliedinformation that would otherwise have been difficult to obtain. Weare particularly grateful to Messrs. H. H. Fawcett of the National -Research Council, R. Mitchell of the Chlorine. institute, J. A.Ulapperton and A. E. Howerton of PPG Industeies, W. J. Lawson ofAllied Chemical Corporation, G. £. Heym of Mundo Gas, and J. B. Diggoryof ICI Limited.
Our larger tests were made possible by courtesy of the WeirtonIce and Coal Company who permitted our use of an isolated lake ontheir strip mine site near Florence, Pennsylvania.
I/ A. E. io'erton, "Estimating Area Affected by Chlorine Release,"Preprint 27B, Symposium on Loss Prevention in the Process Industries AIII, Sixty-fourth National Meeting, AIChE, New Orleans, La.,March 16-20, 1969. Also, v. 3, Loss Prevention, pp 48-53, aChemical Engineering Progress Technical Manual, AIChE.
2/ Letter of February 20, 1968, from R. W. Van Dolah to Commandant,U. S. Coast Guard, Attn.: Mr. W. E. McConnaughey.
3

-
I
III. REVIEW OF SOME PERTINENT LITERATURE
The literature on toxic gases, and particularly on chlorine,
is voluminous. The few references which are cited below do notconstitute an exhaustive review but were chosen to introduce theproblem areas on which our work has some bearing.
The critical concentrations of chlorine for various physiologicaleffects are derived largely from some very old literature-3/. most ofit related to gas exposures in World War I. The exposure limits fromthree sourceaii 5 '1/ are listed in Table 1. It is apparent that criticalconcentrations should increase with decreasing time of exposure, but nojustification could be found for assuming that the dosage (concentrationx time) is constant for any level of injury. This poses a certain dif-ficulty in that the readily calculable result of a catastrophic accidentis likely to be the dosage, rather than the concentration, of chlorine.
A convenient calculation of toxic gas concentration downwind ofa steady ground level source is based on the Gaussian plume model as
described by Gifford-7/ and Cramer./. The concentration is
C(x,y,z)- exp - y + (1)(XY. o y UZU 2 a 2
y z
3/ A. C. Fieldner, S. H. Katz, and S. P. Kinney, "Gas Masks forGases Met in Fighting Fires," U. S. BuMines Technical Paper 248,1921.
4/ Dow Chlorine Handbook (1966).T/ Tech. & Eng. Service Bull. 7, Ind. Chem. Div., Allied ChemicalCorp.
6/ F. A. Patty, editor, "Industrial Hygiene and Toxicology," Vol. II,Interscience Publishers (1963).
7/ F. A. Gifford, Jr., "Use of Routine Meteorological Observationsfor Estimating Atmospheric Dispersion," Nuclear Safety, v. 2, 47-51(1961). Also D. Bruce Turner "Workbook of Atmospheric DispersionEstimates," Public Health Service Publication No. 999-AP-26 (1969).
8/ H. E. Cramer, "Engineering Estimates of Atmospheric DispersionCapacity," Industrial Hygiene Journal, 183-9, June 1959.
41 AnJ

TABLE 1.- Physiological.Effects of Exposure to Chlorine in AirI
Chlorige, ppmw Effect
4Q 5/ 6/.
Detectable odor 3.5 3.0 to 3.5-Throat irritation 15.1 10 to 15 3 to 6Coughing 30.2 30-Dangerous,l1/2 hour 40 to 60 40 to 60 I14 to 21U~nbearable, 1 minute - -100
F0at nuesl - 650 (dogs)
30 minutes -1000 300 (cats)10 minutes -1800 -
few deep breaths 1000 - 1000(large animals)
5

C - concentration of pollutant, mole fraction
Q." release rate, ft3/sec
a - standard deviation as derived from a plot of concentrationvs distance, ft
- mean wind speed, ft/sec
Sx - 4ý-:wvnd distance, ft
= -rosswind distance, ft
z vertical distance, ft
Equation (1) is fulfilled whenaver the distribution of chlorine concen-tration in the y and z directions is Gaussian, with standard deviationsCTy and a., respectively. We have made frequent use of tabulations of
SOay and a. compiled at the Brookhaven National Laboratory..!/ Table 2i comprises some representative. information; note that most atmospheric
conditions can be approximated by using one set of a values for theiBl (unstable) condition and another set of a values for the 1) (stable)
condition. The maximum concentration as found at ground level on thecenter•ine of air flow (y - z - o) is given simply by
C -s---- (la)
In experimental work, one can hold Q very si .dy over such a timeinterval as 10 minutes during which the statistical quantities cy anda. approach the values given in Table 2. Since the denominator ofequation- (Ia), , OyOzU, has the units of ft 3 /sec and Q represents asteady flow in ft 3 /sec, C is ptoperly dimensionless, as for example,parts per million, ppm. But in real accident stinations, the chlorineis likely to be evolved as a "burst," ae from an exploding reservoir;then Q has: the dimensions of ft 3 and C has the dimensions of dosage,fox example, ppm sec. Equations (1) and (la) remain valid if one stillhas a Gaussian distrl.bution of concentrations (see p. 37 of "Workhookof Atmospheric Dispersion Estimates.7/). However, two new problemsappear:
97 I. A. Singer and M'. Smith, "Atmospheric Dispersion at• BrookhavenNational Laboratories," Air and Water Pollution International
Journal, 1966, v. 10, pp 125-135.M. E. Smith and I. A. Singer, "An Improved Method of EstimatingConcentrations and Related Phenomena from a Point Source Emission"Journal Applied Meteorology, v. 5, pp 630-9 (1966).
6

TABLE 2. - Some Representative Atmospheric Conditions*
(Custiness Frequency Average Wind Plume Dimensions, ft.Classification of Occurrence (fps) a a
y -
unstable 40B2 unstable 3 12 0.45 x 0,1 0.46 x 09
B1 unstable 42 23 0.42 x 0.86 0.39 x 0.86
SCneutral 14 35 0.42 x 0.8 0.29 x 07SD stable 40 - 0.44 x 0.71 0.087 x0"71
*As observed at the Brookhaven National Laboratory.
i7 1
-- •" ~ ~- -- " -" • -;' •--------' • " -"•'- - •_-_- -=,--- •; . . ' ,- •lI

-. . . . . . .
(a) As the chlorine moves downwind in an expanding "puff"of diminishing concentration, it is free to dispersein the x (longitudinal) directior. as well as in thecrosswind and vertical directions. Equation (1) givesthe dosage of chlorine received at some location down-wind but the concentration of chlorine is not simplythe dosage divided by its duration of release. Thismatter is discussed in Section VI e, below.
(b) The values of a and oz which pert-ain to the expandingpuff are not necessarily those given in table 2. Fortime intervalk less than 10 minutes, one may use anapproximation-9/
a i rm) (01 ra(2
Over a duration t, of 20 seconds, oy has a value about half as largeas that given in table 2. One must be careful te recognize that tis not the duration of chlorine release but the duration of dispersion,x/U. With a 6 mph (9 ft/sec) wind, t is less than 10 minutes fordistances, x, up to a mile.
Values of Q to be used in equation (1) have been calculated bythe Chlorine Institute task force./ and are accepted here as authori-tative. Figures 1-4 have been reproduced by permission. Figures la,b, and c show representative liquid and vapor discharge rate-3 resultingfrom various modes of tank failure. Note that 1, 5, and 10 p•unds/sec aor 5, 25, and 50 ft 3 (STP) of gaseous chlorine per second are repre-sentative. Based on these values of Q, rtference 2 shows the calculateddimensions of toxic gas zone in a 5 mph wiad (see figure 2 in whichthe outer curves enclose 35 ppm concentrations). The effect of heavygas layering on the dispersion of the toxic cloud was apparently not
"t considered.
In the event of a catastrophic accident, a tank may rupture-xposing its contents immediately to atmospheric pressure. Some'iart of the chlorine iwist kiash-vaporize, coo1 ing the remainder tothe boiling point. From canaidei.ticn .f the beat ,apaci"v of liqu4 fdchlorine and its heat of vaporization (as given, for example,in reference 4), one calculates the fraction of the t.ank's contentsthat is immediately evolved (flashed) as a function of its initialtemperature (see figure 3). It is pertinent to note that no assumptionas to heat transfer is involved in figure 3. The heat of vaporizationfor the evolved gas is supplied by cooling tne residual liquid fromits initiai temperature to its boiling point. The figure bears on
M
8 A

the relative safety of transporting chlorine in refrigerated tankage.At ai initial temperature of 100" F, about 22.5 percent of the chlorineis flashed. Thus, in a 55-ton tank at 100" F, Q is about 25,000 pouudsor 125,000 ft 3 of chlorine. Figure 4 shows the downwind dispersal ofthis burst of gas; note that times are well in excess of 10 minutes sothat equation (1) may be used legitimately; reference 1 does not makeclear how the dosagea that derive from equation (1) were convertedto concentrations.
With refinements derived from our present experiments withchlorine-water interactions, we think the above information willsuffice zo calculate the hazardous zone downwind of an accident. Itdoes not answer the larger question "what level of accident probabilityis sefe enoufi?" The literature on this subject is uniformly inter-estin 10 1U 2 but only one 4uthor that we know of has suggestedquantitative relationships 1.01 His conclusions follow: (1) Peoplewill accept a risk voluntarily if it does noL seem to them to be muchgreater than their •isk of natural death by disease, that in, aboutone fatality per 10 man-hours of exposure. (2) The same people rejecta risk which is imposed on them by their environment and which seems tothem to be worsn than about 1/1000 of the above, that is, more than onefatality per 10 man-hours of exposure. (3) People will accept voluntaryrisks proportional to the third power of derived benefits; thus, workmenmight accept eight-fold greater risk by reason of a doubled pay scale;on the other hand, halving a risk is not likely to appease the personexposed.
The case histories of accidents have not been very informative forus, either because the meteorological conditions or terrain were'inspecified or because the population of the environment was notstated. Thus one paper13/ describes the tankage failures rel.asing:
10/ Chauncey Starr "Social Benefit versus Technological Risk"Science 165, 1232-8 (1969).
l1/ J. M. Brown, "Probing the Law and Beyond: A Quest for Public"Protection from Hazardous Product Catastrophes." Staff DiscussionPaper 402, Program of Policy Studies in Science & Technology,The George Washington University, Washington, D.C., July 1969.
1.2/ Pau! Ki-ng "A ,yz"ems Approach to Transportation of ilazardous-hterials" pp 17-22 of "A Study of Transportation of HazardousMaterials." Contract No. DOT-08-A9-106. National Acad. Sciences--National Research Council.
13/ H. Hennig "Behavior of Gas Clouds in Case of Accidents" Chemiker-Teitung 76, 256-9 (1952).
9

15 tens of liquid chlorine (7 dead, 200 "poisoned"); 12 tons ofphosgene (11 dead within 2,000 meters, 130 non-fatally injuredbeyond 2,000 meters); and 15 tons of ammonia, accompanied byignition (15 dead, 20 injured). In each case we have failed todetermine how equation (1) could be applied to this experience.The paper's chief conclusion is that persons near a potentialgas release should be better educated: To stay inside buildings,closing doors and windows; to flee crosswind rather than downwindto minimize exposure.
Finally, the Bureau's recent study of LNG spillage on waterl4/!has suggested some factors which should be added to the treatmentof reference 1:
1. A liquid like chlorine, which forms a hydrate with heat
release should vaporize much faster when spilled intowater than when spilled into a diked confinement on land.
2. Since evaporating LNG (density about 1.4 relative to air)produces a heavy surface layer with little vertical mixing,evaporating chlorine with a density at least 2.5 relativeto air should also give significant layering.
3. Since peak concentrations downwind of LNG spills were asmuch as 20 times higher than time-average concentrationgiven by equation (1), similar peak concentrations areto be expected with chlorine,
IV. EXPERIMENTAL PROCEDURES
A. Procedures with Gaseous Chlorine
1. The Rate of Solution of Gaseous Chlorine in Water(Laboratory Tests)
The experiments used to obtain mass transfer coefficients wereconducted in a 1-foot diameter by 5-foot tall glass tank (figure 5).Chlorine gas was bubbled through 1/4-inch stainless steel tubing thatextended below the water surface to depths of 4.5, 2.0, and 1.0 foot.A glass wool flowmeter, calibrated with a soap film meter, was usedto obtain flowrates of chlorine between 25 pid 300 cc/mmn. The tank wasfilled with 26 gallons of non-chlorinated water at room temperature orat 7* C, or vlth 2.3 percent brine. Abo~e the water interface was4 a he:adspace of about 4,000 cc through which air flowed at a controlled rate of
14/ D. S. Burgess, J. N. Murphy, and M. G. Zabetakis, "HazardsAssociated with the Spillage of Liquefied Natural Gas on Water"Bureau of Mines R.I. 7448, November 1970, 27 pp.
10

1,000 cc/min. A 1/4-inch stainless steel sample outlet was positionedabout 1/4 inch above the water surface and was connected to a glasssample train containing eight petticoat bubblers. The solution ineach bubbrbr consisted of 5 cc of starch indicating solution, increasingamounts of 0.025N or IN sodium thiosulfate solution, and enough 2 percentor 5 percent potassium iodide solution to make a total volume of 50 cc.
Chlorine was initially bubbled through the water at a flow rateof 30 to 50 cc/min and the undissolved chlorine which emerged from thewater was swept into the first bubbler. The color change of the bub-bler solution to blue was timed and then the sample flow was ventedinto the hood. The flow of chlorine into the water was increased andthe air stream was passed into the second bubbler until a color changewas observed and timed. This process of venting, increasing flow rate,and timing of color change was repeated for the eight bubblers. Sodiumthiosulfate solution was added to each bubbler until the solution turnedcolorless. The volume of chlorine gas absorbed in each bubbler wasdetermined by the fact that 1 ml oL 0.025N sodium thiosulfate solutionis equivalent to 0.31 cc of chlorine at laboratory temperature andatmospheric pressure of chlorine.
In each test the rise time of a bubble was determined by stopwatchor by motion picture photography. Still photographs gave the numberof consecutive bubbles in the tank at each flow rate, thus the numberof bubbles per minute of chlorine gas. Combining the number of bubblesper minute with the measured chlorine flow rate gave the volume ofchlorine per bubble and the equivalent radius.
The c rve in figure 6 shows the rise rate o air bubbles indistilled water as a function of bubble radiusi-l2i the shape of the
curve is apparently quite typical. Small bubbles, up to about0.1 cm radius, at the left of the figure, are spherical and,therfore, most easily studied but probably of no great practicalimportance in this program; chlorine bubbles of this size shoulddissolve within a short distance of their formation. Bubbles ofabout 0.1-0.5 cm radius are generally oblate spheroids and haveone favorable characteristic that their rise rates are not changed
very much as the gas dissolves and the size of the bubble decreases.T 1-e continuous bubbling of chlorine at 4.5, 2.0, and 1.0 feet pro-duced bubbles of this shape and equivalent rudius. Our meawsredrise rates are in good agreement with the curve in figure 6.
Bubbles of greater than about 0.3-0.5 cm (equivalent) radiusare usually described as "spherical caps." This was the type that
15/ Haberman, W. L., and R. K. Morton. An Experimeutal Investigationof the Drag and Shape of Air Bubbles Rising In Various Liquids.David Taylor Hodel Basin, Report 802, NS 715-102, Sept. 1953.

occurred when the apparatus was modified to generate single bubblesof about 10, 30, and 50 cc initial volumes. A 50 cc glass beakerwas inverted above the bubbler aZ a depth of 2 feet by a flexible
cable drive which enabled the beaker to be rotated through 180degrees. Chlorine gas was bubbled into the inverted beaker to displacewater to the volume desired and then released as a single bubble byrotating the beaker to an upright position.
Spherical cap bubbles are difficult to study because of theirfluctuating shapes and surface/volume ratios but they do have theinteresting characteristic that their rise rate is strictly a func-tion of size, being independent of fluid properties. For aii inmany liquids
Rise rate, U - 1.02 Vg re (3)
where g is the gravitational constant and re the equivalent radius.Our measured rise rates of spherical cap bubbles are given in fairapproximation by figure 6 or equation 3.
2. Atmospheric Dispersion Tests of Gaseous Chlorine andButane (Bruceton pond)
Butane was used as a reference gas because it is nearly as denseas chlorine and sparingly soluble in water. Its flow was controlled AJin the liquid phase by a Kates regulator after which it was allowed tovaporize in copper tubing. Chlorine flow was controlled in the liquidphase with a stainless steel needle valve and the supply cylinder wassupported on a balance for periodic reading of weight loss. The twogas outlet lines were suspended about 3 inches above the water surfaceand 3 feet apart so that considerable dilution with air had occurredbefore the gas streams mixed.
in order to determine the atmospheric dispersion of thechlorine and butane, an array of eleven sampling systems was locatedon the pond and on the shore line downwind of the steady gas sources(figure 7). A floating rig formed a 1020 arc of a 50-foot radiuscircle with the gas sources located at its center. Six bubblers werelocated on the rig, four along a horizontal and two in a verticalarray of one and five feet above the water. Five bubblers were locatedon the shore line at an average distance of 135 feet from the gas source.A wind speed and direction transducer was located on a barge downwindof the bubblers.
12

Each bubbler was ccnnectvtd to a 10-liter evacuated sample Abottle with an irifice inlet requiring 20 minutes or more to bleedto atmospheric pressure. Curves of sa-pling rate for the fastestand slowest orifices of the eleven used are shown in figure 8.The curves are linear for prassures to one-half atmosphere asexpected if sonic velocity was obtained in the orifices used.Indeed, during the 10-minute duration of a dispersion test thecurves are essentially linear.
The chlorine plus butane-air samples were pulled through theLbubblers where chlorine was removed from the sample by reactionwith the potassium iodide solution and the remaining sample of
"& butane was collected in the 10-liter sample bottles. Butane concen-trat.ous were obtained by a gas chromatographic-flame Ionizationprocedure and the chlorine contents of the bubblers were determined aspreviously described.
B. Spillage of Liquid Chlorine
In order to obtain an order of magnitude observation of thevaporization rate of liquid chlorine spilled onto water and toobserve the penetration of the dense liquid chlorine ( p = 1.47)under the water, several spills were conducted in which 0.75 gallonof chlorine was rapidly poured Into a one-foot diameter by 4-footdeep glass pipe filled with water. The event was observed with a64 frame/sec movie camera. The event lasted less than a secondduring which time the chlorine was flash-vaporized leaving aconsiderable quantity of chloriue hydrate on the water surface. The
Ek- penetration of the water by the chlorine was only 8 or 10 inches. Dueto the rapidity of gas evolution it was impossible to measure vapori-zation rate as originally planned.
Several large-.cale spills (up to 10 gallons of liquid chlorine)were conducted on open water at the strip mine lake. The chlorineVS was contained in an open-mouth polyethylene-lined and insulated con-tainer; the container was suspended one foot above the water and
P_ remotely emptied by using explosive-activaw.ed cable cutters permitting 'Athe container to rapidl7 invert in about one second. The experiments
Zia were observed with 128 and 24 frame/sec cameras. (See figure 9.)
The underwater release of liquid chlorine was accomplishedas follows:
The chlorine -as coutvItod in 1- :;r'd 5-gall'o glass bottleswhich were insulated with a 1-inch layer of polyutrethane foam; theinsulated bottle was then covered with a 5-mil polyethylene bag to
13 N
-~ -IN

exclude water; a vent hose was provided to avoid pressure buildup;the filled containers were suspended by a cable over the center ofthe lake, submerged, and then ruptured with two number 8 electricblasting caps which shattered the glass container but minimized thedispersion of .iquid chlorine. The emergence of the chlorine gasbubbles on the surface was observed with high-speed motion pictures(figure 10) and the concentration of the chlorine-air cloud downwindwas monitored along the shore line at 50-foot intervals with sixof the bubblers and evacuated sample bottles discussed above. Aschematic of the lake and location of the sampling stations isshown in figure 11. The distances from the release to the shoreline was 100 to 270 feet.
Several experiments were conducted to determine the effect ofcorrosion on a chlorine leak in a steel tank underwater. Using thesteel that chlorine tanks are fabricated from (AST!! A-516) a pinholeleak in a 5/8-inch thick steel container was simulated by a 0.030-inch diameter hole as shown in figure 12. Liquid or gaseous chlorinewas flowed through the hole ani the mass flow rate of chlorine wasobserved to determine if the leak was enlarging. The block wassubmerged under about 15 feet of water and positioned so that themajor axis of the hole was horizontal. Gaseous chlorine was releasedthrough the hole at 10 or 90 psig back pressure for up to four hoursand liquid chlorine at its own vapor pressure for two hours. Theblocks were subsequently examined for increase in the diameter andvolume of the orifice.
V. EXPERIHENTAL RESULTS
A. Solution of Gaseous Chlorine in Water and Brine
The percentages of chlorine dissolved in water at room tempera-ture and at 7 *C, and in brine with 2.3 percent sodium chloride aregiven in figure 13 as function of flow rate and of liquid depth. Asexpected, the percentage of chlorine dissolved is higher in coldwater than in water at room temperature and lower in brine than inwater. At a depth of 4.5 feet of water almost all the chlorine wasremoved before the bubbles reached the surface. Visually it was notedthat the oblate spheroid bubbles of 0.3-0.4 cm equivalent radiusformed at the 4.5-foot depth did not vanish but tended to become orespherical in shape as they rose and by the time the surface wasreached were very small. The volume of a gas bubble which consistsof a gas solusble in water, such as chlorine, will decrease consider-ably but not vanish completey while floating up because r'ie diffu-sion of air from the water into the bubble takes place simultaneouslywith diffusion of chlorine into the water.
14

The standard equation for the mass transfer rate per unit surfacearea is
dN - KL A (C* - CL) (4)" dt •
where the mass transfer coefficient, KL, is the quantity of interest Ifor generalizing laboratory data to situations of practical import-
ance. By typical transformations as detailed In reference 13, oneobtains
fro a... - f (5)L HRTdt AZ +Z t
Equation (5) showe that the mass transfer coefficient may be calculatedfrom values of bubble volume, V, bubble area, A, and liquid head, Z,as functions of time.
When KL was derived from the experimental data of figure 13and equation (5) the values were in quite good agreement withreported values in reference 12 for CO2 (see figure 14). Thus, byequation (4), the rates of solution of chlorine and CO2 ate indirect proportion to their equilibrium solubilities which differby a factor of 3.
The "aging" of bubbles by which KL decreases with increasinglength of path is apparent from figure 14. The ingenious theoriesto account for this effect are not pertinent here but a relatedempirical observation is useful.16/
fKL dt0_ _ -71/3 (6)
tLZ
where . ii the average transfer coefficient throughout the lifetimeof the rubble and Z the height of water column. Figure 15 siows thestraight line on a logarithmic scale for air bubbles from reference 13along with points for CO2 from reference 12 and our points for chlorine.
In reconsideration of the above work, it was decided that furtherstudy of solution rates would not be rewarding. To have shown that KLwas near. -•--he same for chlorine as for CO2 and air is equivalent to
16/ Eckenfelder, W. Wesley, Jr., and Edfln L. Barnhart. The Effectof Organic Substances on the Transfer of Oxygen from Air Bubbles
in Water. AIChE Jour., v 7, No. 4, pp 631-34.
15

proof that the hydrolysis of chlorine and subsequent ionization aresecond-order effects; also that the common ion effect of dissolvedsodium chloride should have little effect on rates of solution (comparefigure 13). The key question as to olubility is the flow rate atwhich bubbles coalesce and a "channel" forms by which chlorineescapes upward through the water; this is discussed in Section VI,F, below.
B. Corrosion Tests
The effect of gaseous chlorine at 10 psig flowing through a0.030-inch diameter x 0.625-inch long hole in a block of ASTK A-516Grade 70 steel submerged under water, is shown in figure 16. Themass flow rate as a function of time as shown in the figure remainedconstant for approximately three hours, then there was an abruptfour-fold increase in the rate and after another hour there was anadditional increase in the flow. A similar phenomena was observedin another experiment with 90 psig gaseous chlorine except for thehigher initial flow rate and the reduced time interval between flow
changes as shown in figure 17. Subsequent examination of each holeafter the experiment indicated that the original opening was enlargedinitially from the outside and the opening had the form of a trun-cated cone. 4
In figurg 18 the original block and the results after the experi-ment with gaseous chlorine described in figure 17 are shown. In eachcase the hole was enlarged to approximate the shape of a truncated conewith a limiting orifice near the inside of the hole. When the corro-sion removed the orifice the flow increased as shown in figures 16 and17.
An additional experiment was conducted in which liquid chlorineat 90 psig was discharged through an orifice under water. The resultsare shown in figure 19. For several minutes the flow was rather high(about 70 lbihr) but rapidly decreased and held at 3.4 lb/hr forapproximately 45 minutes. When the flow again increased to 72 lb/hrnumerous large ice or hydrate floes periodically came to the surfaceof the water; when the flow rate decreased no ice was observed.There was no appreciable corrosion of this particular orifice. Theresults of the experiments are summarized in table 3 where the re-sults are expressed as the change in volume of the hole since theirregular shape of the. corroded holes prevent accurate descriptionof the dimensions.
16

M'S: 3.7 Effect of the :;osure of &STH A-516 steel
to chlorine in an aqueous environmente
Hole Volume (cc) Time
Chlorine Pressure (psig) Initial Final (howas)
Ga-ieous 10 7.25 x 10⁻³ 7.9 x 10⁻²Gaseous 90 7.25 x 1(,"3 23.7 x 10"2.tquid 90 7.25 x 1U4- 9.0 x 10⁻³ .. '5
itt
I A
17

In the case where the liquid chlorine did not appreciably affectthe steel, it appears as though the vaporizing chlorine at the ori-'ice freezes the water and the ice retards the flow; eventually, theice breaks away and the flow is momentarily increased.
No attempr was made to investigate the corrosion effect ofchlorine on other materials such as valves and fittings.
C. Atmospheric Dispersion of Chlorine and Butane Over Water
Much consideration went into the choice of a reference gaswhich would have about the same density as chlorine and which mightbe used for shaking down the experimental procedures. It was desir-able that this gas be sparingly soluble in water so that a comparisonbetween atmospheric concentrations of chlorine and concentrations ofthe reference gas would indicate any alleviation of chlorine concen-tration by its solubility in water. Finally, it was necessary thatthe reference gas be susceptible to analysis in the range of tenthsof a part per million. The best choice appeared to be butane, thepertinent characteristics of which are given in table 4.
Test #1
The objective of this experiment was to test the dispersionof a heavy gas for comparison with our recent results using LNG.Measured concentrations were to be compared with prediction byequation (1)
-Y2 Z2
(x,y,z) NYOy7zU 2 y2 2
for which definitions are given in Section III. In particular,we had found with LNG that heavy gas layering could be accountedfor by assigning ao a value of 0.2 0ye
A steady flow of 0.526 pounds butane per minute was establishedover an 11.4 minute interval. The average wind velocity as measured18 inches above the water surface was 2.76 mph and the standarddeviation of wind direction, ae, was 47.0. Taking
Oy - x tan o0 (7)
which was well established in the LNG program and aasuming
oz -0.2 x tan a (8)
18

.h
TABLE 4. - Selected properties of butane and chlorine
Chlorine Butane
Molecular veight 70.91 58.12Dansity at 25 OC (air-i) 2.45 2.00
Soilol-g Point, *C -35 .0Solubility In water, m./100 g 310 at 10 "C 15 at 17 "C
Meho o Aalsi titration flameeaionization
Nominal sensi1tvity of analysis, ppm 0.1 0.1
13 ,
I,
19
I

the maximum concentration of butane is calculated at 50 foot distance(x) to be 8 ppm and at 150 feet to be 1 ppm. Table 5 shows experi-mental and 'calculated concentrations at the 11 sampling positions.
One experimental concentration, l1 ppm at station 5, was con-siderably out of line; when this same station gave another high resulton the following test, we decided that the sample bottle must havebeen contaminated in previous usage. For this reason, this oneconcentration was omitted from the overall average. The experimentalaverage of 7.7 ppm at 50 feet compares favorably with a calculatedaverage of 6.8 ppm; likewise the experimental 0.8 ppm at 135-150 feetis comparable- to the calculated 0.9 ppm. Concentrations at individualstations were not so well predicted but this would be asking too much N
of a test of such short duration.
Test #2
Butane :and chlorine were released simultaneously. The chlorineflow was about half that of the butane so that any appreciable re-action between them should show particularly in the chlorine con-centrations. Wind direction was unusually variable during thisitest (00 = 54.0*) and predicted concentrations were accordinglylower than in Test #1. Both c-.orine and butane averaged abouttwo-thirds their predicted lev .s at 50 feet downwind (Table 6).&At longer distances (110-120 feet), there was one irregularity,an unexpectedly high chlorine concentration ar sampling station #9.
A detectable odor of chlorine is associated with 3.0-3.5 ppm(Table 1); two obse.-ers reported chlorine odors, presumably the:result of peak concentrations, at distances up to 200 feet downwindwhere the time-averaged level should have been no more than a fewtenths of a part per million.
Test #3
Chlorine and butane uere released at about the same rate. Windvelocity.was somewhat higher than in the previous tests and thestandard deviation of wind direction was only 27.7. Both gaseswere found in concentrations quite similar to predicted values(Table 7). As one might expect with a steadier wind, concentrationsat the individual stations were also quitc close to prediction.
20
JE

7 1
pe2
TABLE 5. - Dispersion of 0.526 lbs Butane per Hinute Over MBrucaton Pond (Test #M)
, U o, x, y, z, Butane concentration, ppm
mph ft/sec degrees feet feet feet Eqn. (1) Experimental
2.76 4.06 47.0 50 -45 0 5.5 8.850 -15 0 7.5 5.650 15 0 7.5 6.350 45 0 5.5 9.250 0 1 7.9 (17.0)50 0 5 7.1 8.8
Average 6.8 7.7
150 -70 0 0.8 .4150 -35 0 0.9 J.6135 0 0 1.1 1.2140 35 0 1.0 >0.0 -;15M 70 0 0.8 0. 1
Average 0.9 0.&;
• -N
21
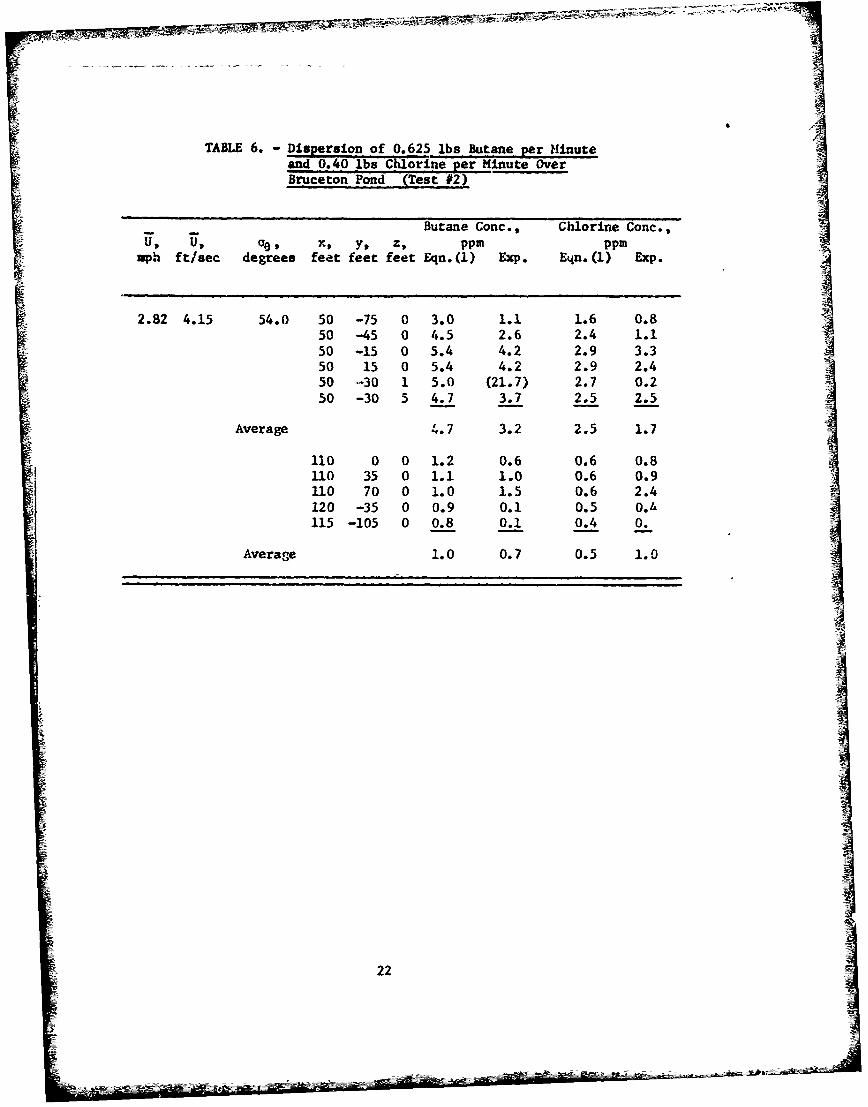
TABLE 6. - Dsperson of 0.625 lbs Butane per Minuteand 0.40 Wbs Chlorine per Minute OverBruceton Pond (Test #2)
Butane Conc., Chlorine Conc.,U, U, %, TX, y, z, ppm ppm
mph ft/sec degrees feet feet feet Eqn.(1) Exp. Eqn.(1) Exp.
2.82 4.15 54.0 50 -75 0 3.0 1.1 1.6 0.850 -45 0 4.5 2.6 2.4 1.150 -15 0 5.4 4.2 2.9 3.350 15 0 5.4 4.2 2.9 2.450 -30 1 5.0 (21.7) 2.7 0.250 -30 5 4.7 3.7 2.5 2.5
Average 4.7 3.2 2.5 1.7
110 0 0 1.2 0.6 0.6 0.8110 35 0 1.1 1.0 0.6 0.9110 70 0 1.0 1.5 0.6 2.4120 -35 0 0.9 0.1 0.5 0./4115 -105 0 0.8 0.1 o.4 0.
Average 1.0 o.7 0.5 1.0
22

TABLE 7.- Diapersion of 0.338 lbs Butane per Minuteand 0.45 lbs Chlorine per Minute OverBruceton Pond (Test f3)
Butane Conc., Chlorine Conc.,UV. U, Ce FO y z, ppM pp=ph ft/sec degrees feet feet feet Eqn.(l) Exp. Eqn.(l) Exp.
3.87 5.69 27.7 50 -75 0 0.3 0.0 2.8 0.550 -45 0 3.4 4.2 3.8 4.350 -15 0 12.6 13.3 14.0 14.5
50 15 0 12.6 14.1 14.0 11.050 -30 1 9.9 6.8 8.4 6.750 -30 5 4.9 3.5 5.4 5.1
Average 7.3 8.4 d.1 7.0
150 -175 0 0.1 0.0 0.2 0.2150 -105 0 0.7 0.4 0.8 0.7135 -70 0 1.3 0.7 1.4 1.0140 -35 0 1.7 1.3 1.9 1.4150 35 0 1.5 1.8 3.7 2.3
Average 1.1 1.1 1.2 1.1
23

Following tests fl, #2, and #3 it was apparent that steady Clown
of both chlorine and butane were dispersed in accordance with the AGaussian plum model in which the vertical standard deviation, Oz,as8 given approximately by 0.2 a., Since this result conforms toour earlier finding with LNG, no further tests over the present range 4
of distances were considered necessary. Since butane and chlorine cgave so nearly the sat result, ne could find no reason to argue that
chlorine was being absorbed significantly at the water surface.
D. Underwater Release of Liquid Chlorine
Test #
In this experiment, five gallons of liquid chlorine were released
underwater by shattering a glass carboy with blasting caps. The primaryobjective van to observe the phenomenon photographically for such infor-mation as the rate of evaporation and evidence of chlorine hydrate.Following the successful results of tests #2 and #3, sampling stationswere installed along the shoreline of the lake (figure 11) to observewhether an appreciable fraction of the chlorine had been lost in thewater. As It turned out, the gas sampling was more interesting inconnection with the use of equation (1) to predict dosages from instan-taneous chlorine releases.
D The sampling bubblers were set into operation, after which theexperimenters vacated the area, the chlorine bottle was lowered under- Awater and shattered, the gaseous chlorine was dispersed downwind, andfinally the experimenters reentered the area to retrieve thebubblers. Thus the sampling continued over a 15-16 minute periodwhich included a short interval of appreciable chlorine concen-tration.
Titration of the bubbler solutions gave th't total amount ofchlorine dissolved. From the pressure drop in the 10-liter samplebottles, one knows the volume of chlorine-air flow (see figure 8);
= therefore the average chlorine concentration over the total 15-16minute period. This establishes the chlorine dosage (ppm see)at each station (see table 8).
Since the lake was confined within high, steep banks with avery narrow "beach," wind measurements were not very satisfactory.The wind velocity, 7.3 ft/sec, was judged from motion pictures ofthe movement of the chlorine cloud. The angular standard devi. -ion,33, was obtained by interpolation of figure 20, which comprises ourpaired measurements of U and ag at the Bruceton facility (points)and Brookhaven National Laboratory measurements (solid line) at an
elevation of 100 meters. Table 8 shows that calculated dosagesusing oe - 33* are conspicuously low.
24
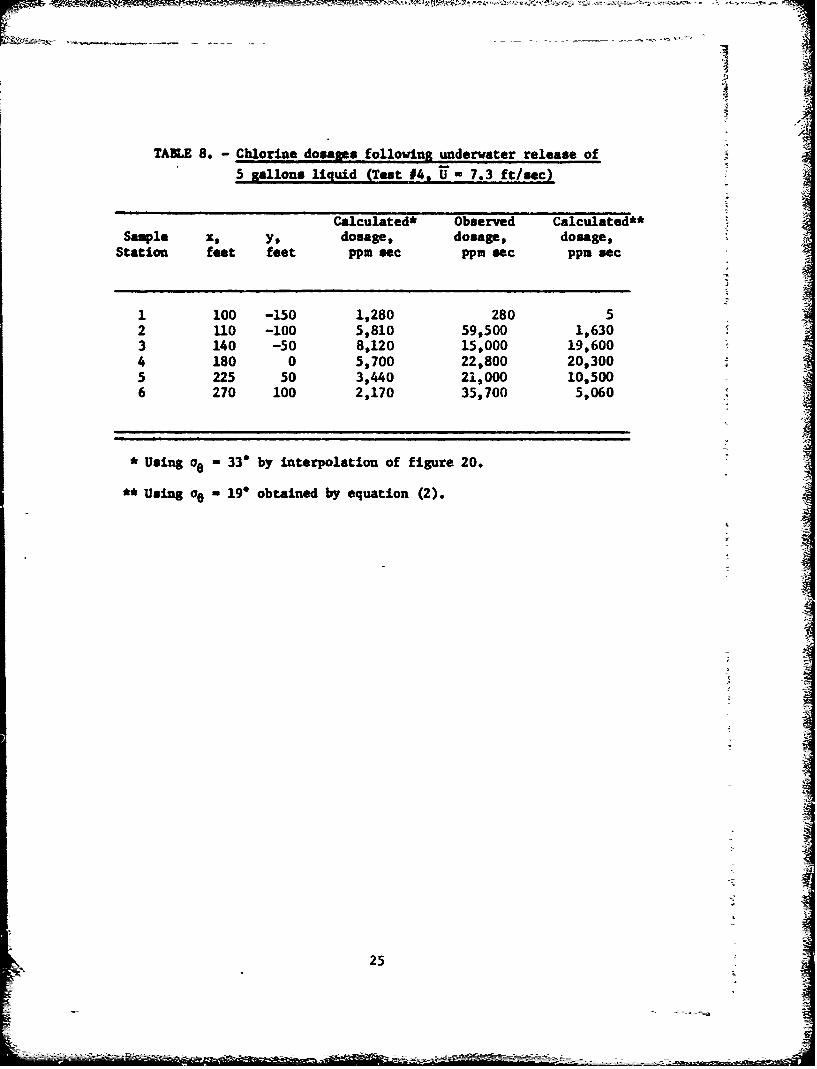
TABLE 8. - Chlorine dosages following underwater release of
5 gallons liquid (Test A.4 U- 7.3 ft/sec)
Calculated* Observed Calculated**Sample x, y, dosage, dosage, dosage,
Station feet feet ppm sec ppm sec ppm sec
1 100 -150 1,280 280 52 110 -100 5,810 59,500 1,6303 140 -50 8,120 15,000 19,6004 180 0 5,700 22,800 20,3005 225 50 3,440 21,000 10,5006 270 100 2,170 35,700 5,060
* Using oe - 330 by interpolation of figure 20.
** Using ae - 190 obtained by equation (2).
25

The obvious shortcoming of the calculation is that a and aoin equation (1) relate to time intervals such as 10-60 minuteswhile the total dispersion time was of the order of x/U or about14-37 seconds or an average of 0.4 min. An equivalent statement isthat the chlorine cloud constituted a vapor "trail" rather than a"plume." From equation (2) we judged that o0 for this time intervalshould be about 19. Using this value a second calculation was madeas shown in the final column of Table 8; predicted values are infair agreement with experimental dosages at sample positions 3, 4,and 5, which spanned the centerline of airflow as judged from motionpictures of the test. The very high dosage at sample position 2derived from a separate trail of chlorine which was ejected fromthe release area in the direction of the sampler.
It is obviously impossible to judge from table 8 whether anychlcriqe has been lost through its solubility in water. The expected325 ft• (STP) of gaseous chlorine should have occupied an initialbubble of 8.5-foot diameter; this could not be confirmed within Aany tolerable limits from the photographic coverage. As the yellowcloud moved away from the release area, a white patch remained onthe water which had an apprcximate diameter of 22 feet- this residualfilm broke up and disappeared within about 30 seconds; it presumablycontained some chlorine hydrate.
We conclude from Test #4 that most of the chlorine is vaporized"instantaneously" from the release of 65 pounds of liquid under 4feet of water and that its atmospheric dispersion is contained withina relatively small angle as implied by equation (2).
Test #5
The quantity of liquid chlorine released was 1 gallon (13 pounds)initially contained in a glass jug which was shattered by blastingcaps under 10 feet of water. From photographs we estimate that thediameter of the residual white film on the water was 21 feet; thus,a, relatively larger fraction of the chlorine must have been tied upas hydrate. Table 9 shows the dosages at the sample positions aresignificantly lower than in the previous 5-gallon release, even whenallowance is made for the 5:1 ratio of quantities released. Ruaghlyspeaking, experimental dosages are about an order of magnitude lowerthan predictions based on the same 19* ae usel in Test #4. We con-elude that a major fraction of the chlorine was lost, either byhydrate formation or by solution as the cloud was traversing thewater surface.
26

TAULE 9.- Chlorine dosags folloviijg undervater releaseof 1 gallon liquid (Test 05. ' - 6.1 ft/le)"
Calculated* Observed Calculated**Sample x, y, dosage, dosage, dosage,
Station feet feet ppm sec ppm sec pp. sac
1 100 -200 155 0 0 Z
2 110 -150 587 207 5r 3 140 -100 947 0 974
4 180 -50 783 180 3,5205 225 0 526 588 3,1306 270 50 358 0 1,870
* Using 08 = 40* by interpolatcion of figure 20.
SUsing 0e - 19" as in Test #4.
27I
4
-
II 7}

-I-
VI. DISCUSSION
A. Rate of Vapor Generation on Spillage
The motion pictures of liquid chlorine spillage have destroyedseveral of our preconceived notions of how liquid chlorine shouldbehave in water. First, we see no evidence that chlorine sinks inwater when spilled in quantities up to 10 gallons; it seems ratherto be strongly buoyed up by the evolving gas. On the other hand, we
see no evidence of a gas film separating chlorine and water to makeheat transfer a rate-limiting process.
In every experiment there was some obvious formation of a whitesolid; this solid retained its identity in a stoppered bottle butmalted with chlorine release when the bottle was unstoppered; itwas assumed to be chlorine hydrate. According to a recent revieul.,
chlorine hydrate is a non-stoichiometric compound of cage-like structurecomprising up to 8 chlorine molecules in a lattice formed by 46 watermolecules. At maximum chlorine occupancy, the heat of formation isabout -6.5 kcal/mole of chlorine, somewhat more than enough to vaporizeanother sole of chlorine (4.9 kcal/mole). We do not know its densitybut it is presumably closer to that of ice than to that of liquidchlorine. As best we can judge from photographs, the liquid chlorine-water interaction leads to a turbulent mixture of chlorine, water,hydrate, and gas which is sufficiently buoyant that hydrate isejected into the atmosphere along with gas and possibly dropletsof liquid chlorine. In any case, it is a very fast process.
Figure 21 compares the elapsed times for gas cloud evolutionin several experiments (points) with computed elapsed times over whicha person would be subject to 50 or 500 pim chlorine in the same sizeof spill (solid lines). JAs long as the time of evolution is much lessthan the subject's exposure time, we can speak of the gas generationas being instantaneous. The derivation of the lines in figure 21 is
described in the following section.
17/ W. C. Child, Jr., "'olacular Interaction in Clathrates; aComparison with Other Condensed Phases." Quarterly Review18, 321-46 (1964).
28

- -
-A
B. Dispersion of an Instantaneously-generated Cloud of Gas
As one follows the cloud of chlorine downwind, the concentration
decreases as the boundaries of the cloud increase, as shown infigure 4. The crosswind distribution of concentrations at ground levelis shown schematically in figure 22. The measure of cloud dimension is Iay which is given for typical wiad conditions by Table 2. Now it is a
fairly good assumption that turbulence is isotropic in a horizontal plane,that is, that the cloud is symmetrical in this plane as assumed infigure 4. In other words, the standard deviation of downwind concen-tration distribution, ox, is equal to a . The area under the concen-tration vs distance (x) curve is unity If distance is expressed inunits of ax and the peak concentration is given the normalized valueof 0.399. The same area is contained under a rectangular distribution(dashed lines) which is 2.5 ax long and 0.399 high.
But the observer in a chlorine-air mixture is not concernedwith cloud dimensions in feet but with the cloud duration inseconds. So we define at - ax/-U as the standard deviation of aconcentration vs time curve. The area under this c trve (dosage) Ais equal to the area under a rectangular pulse at peak chlorine
FEE concentration lasting for 2.5 at seconds.
dosage, ppm sec Cmax (ppm) x 2.5 at (sec) (9)
As an exercise in the use of equation (9) we have calculatedpeak concentrations in the underwater release of Test #4 (tableI: 10). Since distances were short, we approximate a or a by x tan19* and divide these numbers by the wind speed of T.3 ft/sec to getat. The peak concenttration is given by the observed dosage dividedby 2.5 at. If the experimenters had not vacated the sampling zonethey would have encountered a chlorine concentration of the orderof 1,000 ppm or higher for an equivalent duration, 2.5 at, of 12.5to 34 seconds which is probably ample for the "few deep breaths"leading to lethality (table 1).
The reference lines in figure 21 represent 2.5 at at distanceswhere the chlorine concentration is 50 ppm and 500 ppm downwind fromvarious amounts of instantaneous gas release.
Concerning the use of equation (1) to calculate dosages down-wind of an instantaneous gas source, Q, we have already shown(table 8) that the usual approximations for ay and oz are too highwhen Q is small and the pertinent distances are short. From our
. RE
A-A
29

TABLE 10. - Calculated peak concentrations in Test #4
x tan ae
t _ Obsurved CalculatedSeple x, y ox - x tan oe U dosage peak conc., I
station feet feet sec ppm sec ppm
1 100 36.4 5.0 280 222 110 40.0 5.5 59,500 4,3003 140 50.9 7.0 15,000 8604 180 65.5 9.0 22,800 1,0005 225 82.0 11.2 21,000 7806 270 98.3 13.5 35,700 1,100
30
MA

experience, a and az behave like proper statistical quantitieswhen the obseWvation time is 10 minutes or longer. Thus, if windspeed is 10 ft/stc, the equation should become approximately valid
at x - 6,000 ft. In most "catastrophic" situations, the affecteddistance will he greater than 6,000 feet.
C. Calculation of Gas Concentrations from Steady Sources
Nomographs have been prepared for maximum chlorine concentra-tions under representative stable and unstable atmospheric conditions.For stable conditions we have used ay and oa as given for D gustinessin table 2. Substituting these values into equation (1) the groundlevel, centerline concentration (y - z o) becomes
C 8.3 x 10⁶ ppm (10)
x1.42 •
The procedure in using this nomograph (figure 23) is to draw astraight line from the pertinent wind speed, U, to the pertinentdistance, x, intersecting the a-scale; draw a second line fromthe a-intersection to the peitinent gas release rate, Q, crossingthe concentration scale, C, at the resultant parts per millionof chlorine. Since C and Q are linearly proportional in equation(10), concentrations may also be estimated for gas release racesthat are off-scale in figure 23.
Alternately, one may draw through a known Q and a critical Cto a value on the a-scale and then through this intersection Valueand known U to the distance, x. at which the concentration will befound.
For unstable atmospheric conditions we have used ay from theB1 line of table 2 and taken account of layering by settingaz - 0 2 a Thus the ratio of horizontal and vertical diffusionis assumedto be the same under stable and unstable conditions.Substituting into equation (1), the ground level, centerline con-centration for unstable conditions is given by
C W 9.0 x 10⁶ (11)1.72 !lppin
x 1.72
A novograph based on equation (11) is given in figure 24.
To illustrate its use, consider the representative leaks of
5. 25, and 50 ft 3 /sec suggested by figures la, b, and c.Drawing from these Q values through a concentration of 35 ppm
31
iV

to the a-scale and connecting the a-intersections with U - 7.5ft/sec, one finds distances of 1100, 2800, and 4200 feet, respec-tively. On comparing these distances with the outlines of 35 ppmconcentration in Figure 2 (unstable conditions), we find that ourprediction is far more conserva ive than the one given by theChlorine Institute task force1 Much of the difference arises 3because we have assumed layering (az - 0.2 y). Without layering !
we would have had 430, 1100, and 1650 feet extensions of the zonecontaining 35 ppm chlorine. This brings us within an approximatefactor of 2 of the predictions in figure 2. 15
D. The Imortance of the Area Covered by a Chlorine Spill
Strictly speaking, equation (1) and other derived equationsapply only to a point source of pollutant, such as a smokestack.If a given source of pollutant (equal 9) is spread over anextended area, the resultant plume is somewhat shorter in the V(downwind) x-direction and wider in the (crosswind) y-direction.A straight-forward way to calculate the plume from an area sourceis to divide the area into a number of small subareas and treateach subarea as an independent source; by modern computationalmethods this is not a formidable problem.
However, it is far simpler to ignore the area of the spilland this section seeks to Justify the consideration of chlorinespills in water as point sources of evolved gas.
Let us assume the steady releasl and evaporation of 10 lbs/secof chlorine, generating a Q of 50 ft /sec of chlorine gas. Usingfigure 24 with an assumed wind speed of 10 ft/sec one obtains thecenterline chlorine concentrations at various downwind distancesas given in the second column of table 11. To obtain off-centerlineconcentrations, one must know ay assumed to be 0.43 x 0.86 asgiven in the final column of the table. Equation (1) now permitsthe calculation of concentrations 50 and 100 feet off-centerlinewhich are given in the third and fourth columns of Table 11.
Now assume that the chlorine flow is divided into four equalflows which are spilled at the corners of a square which is 100 feeton a side (this is a fair approximation to the distribution of liquidchlorine over an acre of water surface). The coordinates (x, y) ofthe four small spills are now (50,50), (50,-50), (-50, -50), and(-50,50) feet. The chlorine concentrations resultinrg from each ofthe four small spills were calculated and added together givingthe bracketed numbers in table 11.
321
/• -••- ••| I I • •A• °• 1 l k , •

TABLE 11. - Concentrations, Rpm. dcumnind of a point sourceof chlorine sam (umbracketed) and domwind. ofi ~ ~~a dis8tributed .source. (brack~eted•):
SDownwind Concentration at y
S~Distance,X, ft. 0 50 100 ft
S1500 1025 865 520. 86(876) (782) (537)
I 1000 311 295 253 156
(296) (283) (245)
2000 95 94 89 282 1(93) (92) (87.6)
4000 27 27 27 513(27) (27) (27)
i1 I
1II
4
33

-AlOnOe sees that there is soae difference in the bracketed andunbracketed values at 500 feet, a difference that is large relative
Sto the errors of reading a nomograph or a slide rule, but smallrelative to the uncertainties of wind gustiness classification.At all distances beyond 1,000 feet, the bracketed and unbrackecedvalues are identical within the reading errors of a nomograph suchas figure 24.
In general, the dimensions of the spill area are importantwhen these dimensions are large relative to ay, as they are in theillustrative example at 500 feet from the assumed spill. Therefore,If chlorine Is spilled on land and is caught within a Siked areafrom which it evaporates very slowly, the downwnd distance atwhich one observes significant concentration is short and the dimen-sions of the ipoundment area should be considered. But when chlorineis spilled Into water, gas evolution Is so faet x and a becone verylarge and the source area is insignificant. In test #4, for example,the apparent area from which chlorine was liberated was a circle of22-foot diameter while av at C - 1,000 ppm was 40-100 feet. (Seetable 10)
E. Calculation of Gas Concentrations from InstantaneousRelease of Gas
In this problem, the C given by equation (10) or (il) is adosage, ppm set, and is related to peak concentration Sax. byequation (9). Under stable atmospheric conditions, a - 0.44ex .71 and 2.5 Ut e s.t x M. Substituting this in o equations (9)and (10), one obtains
CC -- 7.54 x 10 6 p
x 2.13 ppm (12)- with Q expressed as ft 3 chlorine. The nomograph, figure 25, Issimpler than those of the previous figures because concentrationis ludependent of wind opeed.
, The coparabliequation for unstable conditions employsax d= y - 0.43 x from table 2; therefore, 2.5 at 1.08andS8.3,3 x 106_-i Crax (13)--3x '2.58 ,ppm (13)
The corresponding nomograph appears in figure 26.
34
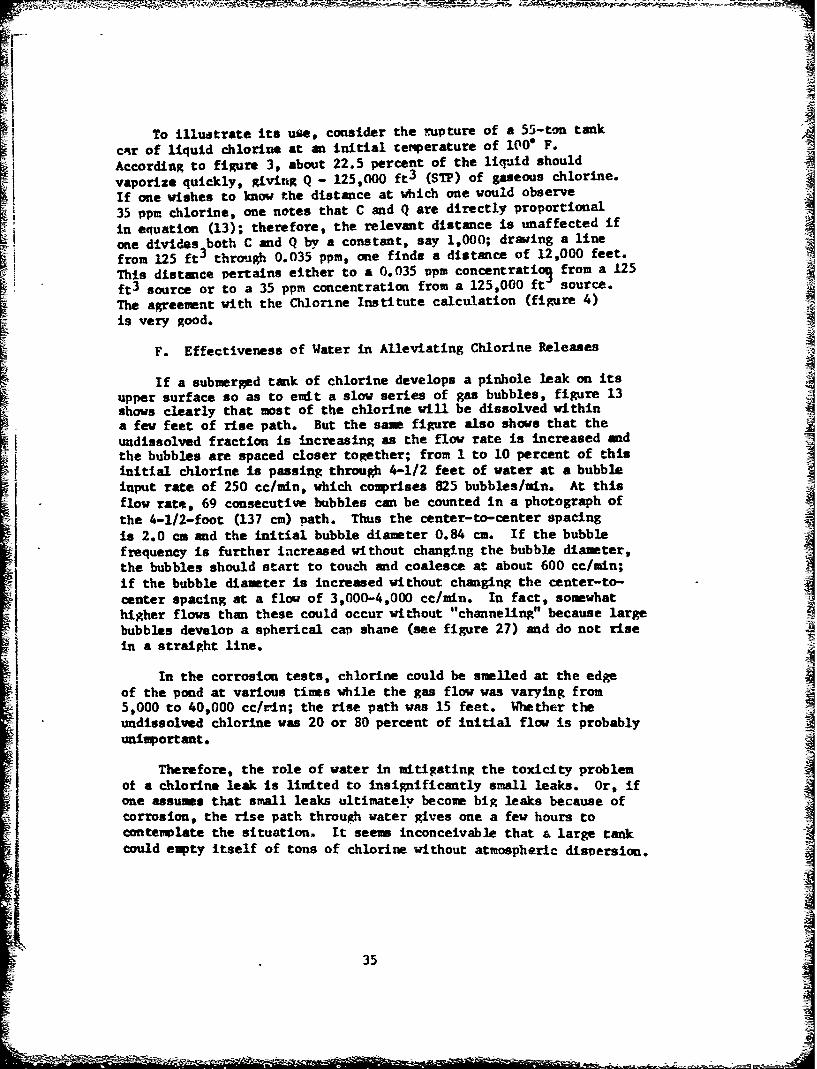
To illustrate its use, consider the rupture of a 55-ton tank
cnr of liquid chlorine at an initial cemperature of 100" F.
According to figure 3, about 22.5 percent of the liquid should
vaporize quickly, giving Q - 125,000 ft 3 (STP) of gaseous chlorine.
If one wishes to know the distance at which one would observe
35 ppm chlorine, one notes that C and Q are directly proportional
in equation (13); therefore, the relevant distance is unaffected if
one divides both C and Q by a constant, say 1,000; drawing a linefrom 125 ft through 0.035 ppm, one finds a distance of 12,000 feet.
This distance pertains either to a 0.035 ppm concentratio from a 125ft 3 source or to a 35 ppm concentration from a 125,000 ft source.
The agreement with the Chlorine Institute calculation (figure 4)
is very good.
F. Effectiveness of Water in Alleviating Chlorine Releases
If a submerged tank of chlorine develops a pinhole leak on itsupper surface so as to emit a slow series of gas bubbles, figure 13shows clearly that most of the chlorine will be dissolved withina few feet of rise path. But the sam figure also shows that the
undissolved fraction is increasing as the flow rate is increased andthe bubbles are spaced closer together; from I to 10 percent of thisinitial chlorine is passing through 4-1/2 feet of water at a bubbleinput rate of 250 cc/min, which comprises 825 bubbles/min. At this
flow rate, 69 consecutive bubbles can be counted in a photograph of
the 4-1/2-foot (137 cm) path. Thus the center-to-center spacing
is 2.0 cm and the initial bubble diameter 0.84 cm. If the bubblefrequency is further increased without changing the bubble diamter,the bubbles should st.art to touch and coalesce at about 600 cc/min;
if the bubble diameter is increased without changing the center-to-
center spacing at a flow of 3,000-4,000 cc/min. In fact, somewhathigher flows than these could occur without "channeling" because largebubbles develop a spherical cap shane (see figure 27) and do not rise
In the corrosion tests, chlorine could be smelled at the edgeof the pond at various times while the gas flow was varying from5,000 to 40,000 cc/r-n; the rise path was 15 feet. Whether theundissolved chlorine was 20 or 80 percent of initial flow is probably
Therefore, the role of water in mitigating the toxicity problemot a chlorine leak Is limited to insignificantly small leaks. Or, if
one assumes that small leaks ultimately become big leaks because ofcorrosion, the rise path through water gives one a few hours tocontemplate the situation. It seems inconceivable that a large tankcould empty itself of tons of chlorine without atmospheric dispersion.
35
z-~. =2 .
As for the underwater release of liquid chlorine, we havenothing to offer beyond the results of tests #4 and #5. There wassome obvious chlorine loss, perhaps 90 percent, when one gallon o'.liquid was released under 10 feet of water; there was no measurableloss when 5 gallons cf liquid was released under 4 feet of water.
In tests #2 and #3, the chlorine released over water was wellaccounted for at the downwind sampling stations. However, the dis-tances were admittedly too short to prove that solubility would notbe a major factor In a large-scale incident.
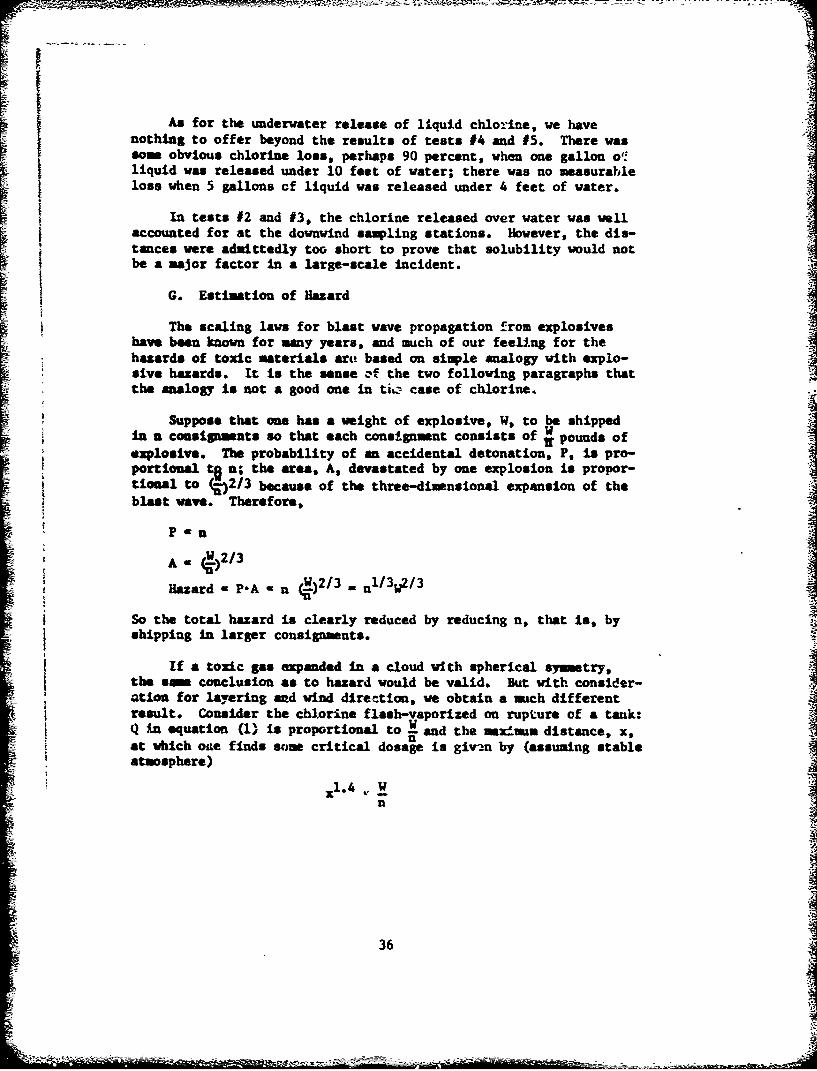
G. Estimation of Hazard
The scaling laws for blast wave propagation from explosiveshave been known for many years, and much of our feeling for thehazards of toxic materials aru based on simple analogy with explo-sive hazards. It is the sense -'* the two following paragraphs thatthe analogy is not a good one in tia case of chlorine.
Suppose that one has a weight of explosive, W, to be shippedin a consignments so that each consignment consists of W pounds ofexplosive. The probability of an accidental detonation, P, is pro-portional to a; the area, A, devastated by one explosion is propor-tional to (-;)2/3 because of the three-dimensional expansion of theblast wave. Therefore,
P~u
A W )2/3W / nl/3W2/3
HazardPAu()I a n-A aiZ/
So the total hazard is clearly reduced by reducing n, that is, byshipping in larger consignments.
If a toxic gas expanded in a cloud with spherical symetry,the sma conclusion as to hazard would be valid. But with consider-ation for layering and wind dire--tion, we obtain a much differentresult. Consider the chlorine flash-vaporized on rupture of a tank:Q in equation (1) is proportional to H and the msxdum distance, x,at which oi~e finds some critical dosage is giv--n by (assuming stableatmosphere)
X1. 4 Wn
36

t4
1.7.
The area so covered is nearly proportional to x ay or to x
T e e - 0.2 . Quite clearly, the
total hazard is reduced by increasing the number of consignments,that is, by staying with small individual shipments.
VII. CONCLUSIONS
Experiments that were directed at specific questions concerningchlorine release in water have given these results:
1. The rate of vaporization of chlorine is very fast; noevidence was found of a rate-limiting heat transfer across a gasf lm.
2. Contact with water removes a significant fraction of thechlorine in slow leakage or in small spills; it could hardly be afactor in catastrophic accidents.
3. The leak rate of gaseous chlorine through a hole in AST.I 'A-516 Grade 70 steel is markedly accelerated by corrosion.
its 4. Toxic cloud concentrations downwind of a chlorine releaseare predictable by existing air pollution equations if one makesappropriate correction for heavy gas layering.
3I
373
S37 , .

osS/ql '3.LVHi MOIA SSMf
0j
00
In0 C ol
3 cn~
,a L 0 0
U4
01
0 0ZCU -f
qi~~~ w0 ~UfA~NI9II~8SW
w 3A
~0 'CPO

OOS/qj '31VMI 398VHOSIO SSVWJ10 IC) 0 -
tc) CL
a >n
_ _~~ 1 ). 04W U ),
CL~ 0 0 000t
E~~ 0 t u.x0 I
$4 -4Wq.~ ~ ~ ~ ~~~- 2CI)NV-N NIIW8 SY 4 :>
0 w~~ (Uu 0 0 0~'
a to 0 - a W 1N=4>In0
0 0 0r-4> C0L
0 t- ~-9

|I.A-
IISI 600"'
im
z
z50--50 _
' (,n
S400 < _
• 50
40ILl
5-30-W
320
Cl . Rote.311
0 0
TIME, min
10611-7ozo6
Figure Ic. - Vapor discharge from a 300-ton tank through a 4-inch diametersafety valve with an initial temperature of 1500 F.
-. IN

InICL*~
0
.0-
CO .W
40 4 0c c 0 c
000
70 0
0(0- d0
S.A

1 ~-40 1
II -20
0-
60I 170
-so-
120-
140-
16010 5 10 15 20 25 30 35
LIQUID FLASHED, pctl~,94- 7c'20.5-
Figure 3. -Percentage of liquid flashed vs init-.I. container temperature.

10 0
E€.
0))
0E N0
CL,
0 00
0 1*00.- 00 o
•.o-
_
I z z
00 0.0.r
o- " 0 - NN O- -H
0
0- 0.0 C4-
4- 4
10'

V 00
(D 00
0 U,,
0 . - IU_ A!l,4A4
0 cm
000
-
C

r 0
39'& ol'
= 0~w-
0 To I
0
0 b
2 0
ow
0
r-4o
0 0 0 0 oc (
cv )0s/w3 'A.L13013A 1lVNIV4831

II..-.....
11.
(10
CL .)
to
0-0i
_o -O"0
)0OD.

8i
i7-
7 -.1
I 'I
E 6
E
Cn KEY
L 0 0 Orifice 70 Orifice 9
S0
9-
0 -
4-
2-
0 5 10 1520 25;3035 4045 5055 6065.TIME, min
Figure 8. - Typical pressure and volume rates of sainmle into evacuatedbottles through hypodermic-type needles.
- ----~ ~_4

'4 1
to
ri 0
_ m0 a)
Co 4
0J-
E3-4
.- 10

E JE
A
Figure 10. -Results of 5 gallons of liquid chl,.* - Leleased under
4 feet of water; time between scenc is about 10 seconds.

IVI0
oc
to0
cn 1 -4-

(D 0
L-.4-
-41 q
rJ 02
00
'-40
Ur4

re:0.32-0.43
12
re=0.3 1-O. 4 1U
CL
w0 Woter,21.00C r=.804
S80- 0 Brine, 21.5C re=0.2 7 -O.5O0U, IOf
ci, a Water, 20.50 CA Brine, 22.010
z
0
'070) re= 0.33-0.49
re=0.33-0.49
ItOO010 200 300
V ~CHLORINE FLOW, cc/min
,0Oew- 7020/
Figure 13. -Percent chlorine dissolved in water at room temperature,7* C, and in brine for underwater depths of 4.5. 2.0,and 1.0 foot.
~ ~ - A

I E
*
0.08
u KEYS., 0.06 - CQ2, Deindoerfer and HumphreySu• o Cl2 , I00 cc/min flowrote
Z x C12 , 200 cc/min flowrate
z0.04 x
0 I 2 3 4 5 6 7TIME, t, s'3c
Figure 14. - Instantaneous transfer ccefficients as a function oftire or bubble age.

- ~KL a ZTotOI 3.06
w 0
EE
tZ
w .02 -Air, Eckenfelder and Barnhart 0
9 C02, Deindoerfer and Humphreyo C' 1 :00 cc/min flowratex C, 2 , ?00 cc/min flowrate
.01 I I !, l"" 0 20 40 60 80 100 200
ZTotaI, COLUMN HEIGHT, cm N
IVEFigure 15. - Comparison of integrated mass transfer coefficients for
various gases.

10
S8
-j
6-W
4-
2
S0 0.5 1 1.5 2 2.5 3 3.5 4 4.5STIM E, hr
SFigure 16. ý-EffecE of gaseous chlorine at 10 psig flowing throughS~a 0.030" diameter x 0.625" long hole in AST".! A-516~steel contained in an aqueous environment.
10

26 11
24-•
22--
181lb/hrj
18
6
4
12i
5.25 lb/hr
I0 I 3
T!ME, hr
Figure 17. - Effect of gaseous chlorine at 90 psig flowing through a0.030" diameter x 0.625" long hole in ASTM A-516 steelcontained in an aqueous environment.

4J4
0Q
00fi
0W~ $4
04
'-0
4-Ic)
0
u0)
0~ 0. j
bo
o -' 'A

24
2220
1• 8 1-7 Ib/hr10
31: 46
2
0.S0 0.5 1.0 1.5 2.0
TIME, hr
Figure 19. - Effect of liquid chlorine at 90 psig flowing through a0o030" diameter x 0.625" long hole in ASTM A-5.16 steel._....contained in an aqueous environment.

311
100 AZ50o x l ' II ' 'I ' ''•
x Measured during test 150- \ -
NX• x
"-Ax xxx'~xx% X-
X'• XX
20-
Singer and Smith, Brookhaven
10-
5 -
2-
I , i , I ,, = I 1' ! ,,2 5 10 20 50 100
WIND SPEED, mph
/1611- 7/9?Z
Figure 20. - Wind speed and standard deviation of direction.

XX*~ x
x Measured during test50-
xx
'xx'x x%% XXX \x Xx
20-
* Singer and Smith, Brookhaven
10- o
5
2-
I 2 5 10 20 50 100WIND SPEED, mph
Figure 20. - Wind speed and standard deviation of direction.

IfI
a) 0
014
0 *0)
0 A-~0 (n
o0
$4O
w~ 41
CL cr~_ 44 -m00 0J
wr'.
cu 0 r 0
'-4
N0
30S 'es. -

Concentration
,. _ ,iElapsdtm
I Oay
a~t
Crosswind distanceDownwind distan~ceElapsed time
Figure 22. - Nominal distribution of chlorine concentration aroundan observation point downwind of an instantaneousrelease of gas.

OFD Gustiness classification (Stable: Temperature inversion)
Step I: u-a-X; Step 2; Q-C-aQ u, C, 1.42 X
ft /sec ft/sec ppm a=X u 1,000 ft"100 0005 100-80 .o-8
.802
2 -60 .03 -60
4 -"40 .2.3 -4
6-""1.0
10-I 2-I20 320
5
10S~20-- 20 20
300 • ;5020. -- 8 1
80- 300 6200
10 1,0_• -6 r300
280" 500 -6or)-0 - 1,000
"3,000200 5,000
2x10⁴
•! " 2 •'LxlOq
400 2- -2
'800" ±-2x IO-8 xxlOl6,00" - 105 -
&, ~8-3 xlO6Q mChlorine concentration -C= XL42
P&.A.' 7/
Figure 23. - Nomograph pertaining to concentrationsfrom a steady source under stableatmospheric conditions.
- - - - '- ~ --

B, Gustiness condition (Unstable atmosphere)
[Step I: u-c-xj Step 2: O-C-ct ]Q. U C, X
(ft3/sec) (ft/sec) ppm a=X1 (I,00Oft)
0.0001000.0004.J60 .0006 80• .0012 -60 .002 60
.004.006
4 40 .01 406 .02
.04
8..06
10 20.2 20
.4200.620-- 1.0
-240 10 04 I0
40 88 6
60- 20660 140 -680--60
100 100
200 4.-400
200 6001,0002,000
400--2 4,000 26,00060G -104
6002xlO4800 -i
1,000 6x 10⁴
8x10 4
9.0 x •OeQChlorine concentration=(C= -X . PPM
X 1.721 pp21Z
Figure 24. - Nomograph pertaining to concentrations from
a steady source under unstable atmosphericconditions.

Cm, x0 pPM 1,000 ftft, -0.0001
I.0002 -80•.0004.0006
2.0oo8 -0.001.002
4 .004 -40 -0.006
.0108 .02
.04
.06 -20 ..082 - .2
.410 .00.06 -I20 )
.08
2
6o 4 6
eo. 6 --1.8
100 1020 4
S~4060
80i -80--- 100
S400' 400600
08o00600-- 1,000800- 2,000
1,000-O 4,000
7.54xil oSChlorine ccncentration = Cm 213 ,pP
Figure 25. -Nomograph pertaining t) concentrationsfrom an instantaneous release of gasunder stable atmospheric conditions. I

ft Cm, 1,000 ftotoo-80
2- I x I0-5 -60
-2 x 10-54- -4 x I0-5
_6x10- 5 408 x 10-5
6 "I x10--2x10-48 :4xi10-4
10 6X10-48x10-4 -200.001.002
20" .004 f
-10 Z40- .02
60--8 .0460--68-
-.6 4.8
1.0.426 -- 4
4 -8 21.0
0 --20
600. 40S-60
800- 80
1,00 102O00
Chlorine concentrotion =Cm=X. Ppm
Figure 26. - Nomograph pertaining to concentration froman instantaneous release of gas underunstable conditions.
- 44;
ar

_6 I I I I ' I I
4 -
r • 12
g. L--
" ~8
aI
-4
2- s
4p
82 4 6 8 0 12 145
SCALE, cmu 27 Tlori- b
SFigure 27. - Tracing of (a) 10 cc and (b) 30 cc chlorine bubble.


![Gaseous exchange [all]](https://img.pdfslide.us/doc/110x75/54bdd34f4a79592e1a8b463d/gaseous-exchange-all.jpg)