Embed Size (px)
Citation preview

““State of the Aviation IndustryState of the Aviation Industry””Presentation to the ACI Airport Economics & Finance10th – 11th February
London, United Kingdom
Laurie N. Price
Director of Aviation Strategy
Mott MacDonald Aviation

Current Crisis
Before Credit Crisis Ongoing Credit Crisis

Agenda
• Introduction to Mott MacDonald/Aviation Services
• Key Issues facing the industry
• Examples in the UK and Europe
• Demand
• Congestion
• Low Cost Carrier growth
• Environment
• Summary
• Conclusions
• Questions

Mott MacDonald Aviation Services
Policy &Development
Forecasting &Economics
ProjectManagement
Supervision &monitoring
TechnicalAdvisor
Transport &FacilitiesPlanning
Cost planningOperations &Performance
EngineeringDesign
Strategy
Environmental

Some Key Issues Facing theAir Transport Industry
• Economic Turbulence
• Fuel Prices
• Competition
• Security
• Environmental impact
• Taxation (APD vs ADT)
• Capacity – Runway/ATC
• Congestion
• Slots – Allocation/Availability
• Access to hub airports
• Pricing
• Demand – Maturity
• (De) Regulation
• EU / US Open Skies
• Market distortions
• Consolidation
• Financial performance
• Investment
• Returns
• GATT
• Labour and training
• Distribution – internet
• Frequency and capacity – aircraft size
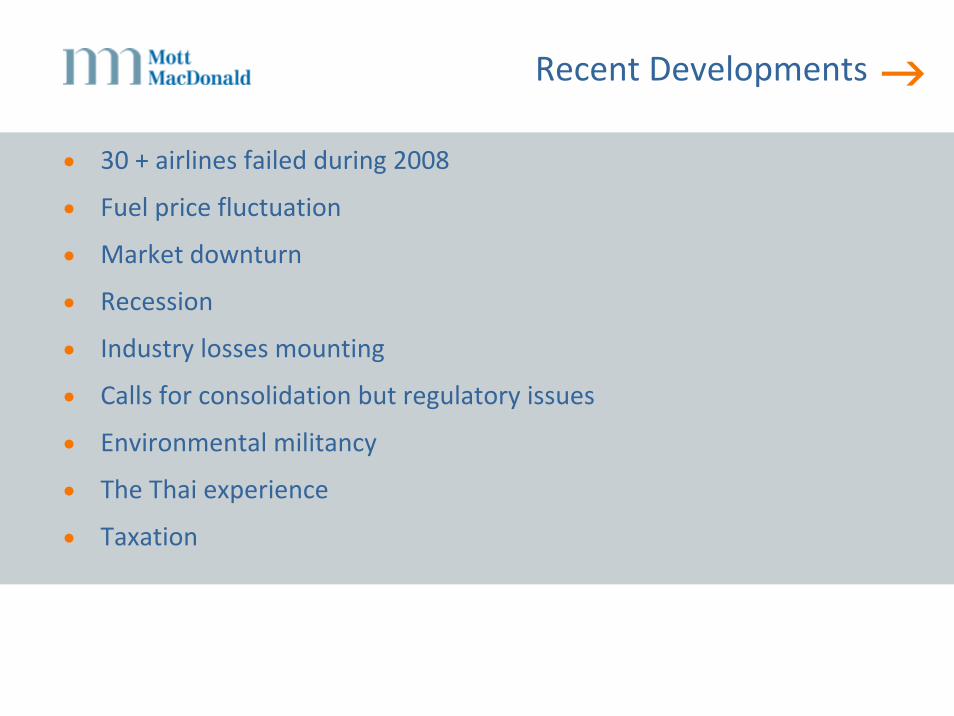
Recent Developments
• 30 + airlines failed during 2008
• Fuel price fluctuation
• Market downturn
• Recession
• Industry losses mounting
• Calls for consolidation but regulatory issues
• Environmental militancy
• The Thai experience
• Taxation

Current Crisis

High Fuel Prices Have Caused Losses Forecast at USD5 billion for 2008
Net post‐tax profits, US$ billion
‐5.0
Globaltotal
Otherairlines
Asia Pacific airlines
US airlines European airlines
‐3.9 ‐0.1 ‐0.5‐0.5
Source: IATA

‐10%‐8%‐6%‐4%‐2%0%2%4%6%8%10%12%
Jul‐05
Oct‐05
Jan‐06
Apr‐06
Jul‐06
Oct‐06
Jan‐07
Apr‐07
Jul‐07
Oct‐07
Jan‐08
Apr‐08
Jul‐08
Oct‐08
% cha
nge ov
er year
Air freight FTKs
Passenger RPKsInternational RPKs and FTKs
Recession Reducing Business and Consumer Confidence has hit the Aviation Markets Hard
Source: IATA

Oil Prices
Source: RBS
Brent Oil Price, US$ per Barrel
0
20
40
60
80
100
120
140
Jan‐
03Ju
l‐03
Jan‐
04Ju
l‐04
Jan‐
05Ju
l‐05
Jan‐
06Ju
l‐06
Jan‐
07Ju
l‐07
Jan‐
08Ju
l‐08
Jan‐
09Ju
l‐09
Jan‐
10
Futures curve end August
Futures curve end NovemberSpot price
end November

High Level of Aircraft Grounding
‐40
20
80
140
200
260
2006
2007
Apr‐0
8
May
‐08
Jun‐
08
Jul‐0
8
Aug‐0
8
Sep‐
08
Oct‐0
8Aircraft p
er m
onth
Deliveries Retirements Parked (net)
Monthly Average
Source: Ascend

Source: SRS Analyser
Growth in planned scheduled ASKs
‐15
‐10
‐5
0
5
10
Feb‐
07Ap
r‐07
Jun‐
07Au
g‐07
Oct‐0
7De
c‐07
Feb‐
08Ap
r‐08
Jun‐
08Au
g‐08
Oct‐0
8De
c‐08
Feb‐
09
% cha
nge ov
er year
WithinAsia Pacific
Within US
Global capacity
Cut Backs in Capacity, Particularly in US

Passenger Markets Likely to Fall 3% in 2009
‐4
0
4
8
12
16
1971
1975
1979
1983
1987
1991
1995
1999
2003
200720
0920
11
% cha
nge ov
er year
0
1
2
3
4
5
6
7
8
% cha
nge ov
er year
Global passenger kilometres flown(left scale)
World GDP (right scale)
Source: EIU/IATA

CO2 Emissions From Aviation Will FallDue to Recession and Fleet Changes
200
300
400
500
600
700
1995 1997 1999 2001 2003 2005 2007 2009 2011
Billion
s tonn
ekilometres
450
500
550
600
650
700
750
800
850
900
Million tonn
esCO
2
CO2 emissions(right scale)
Traffic volume (left scale)

Worst ever 2‐year Revenue Outlook
Airline revenue growth, adjusted for inflation
‐15
‐10
‐5
0
5
10
15
20
1974 1977 1980 1983 1986 1989 1992 1995 1998 2001 2004 2007 2010
% cha
nge ov
er year
Source: EIU/IATA
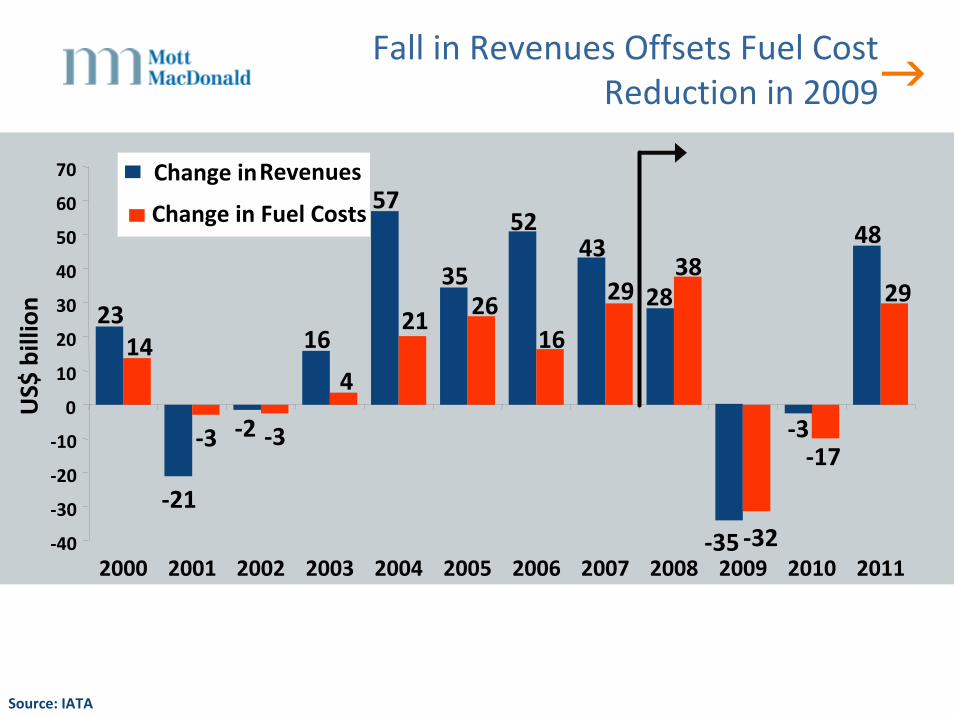
23
‐21
‐2
16
57
35
5243
28
‐35
‐3
48
144
21 2616
2938
29
‐17‐3 ‐3
‐32‐40
‐30
‐20
‐10
0
10
20
30
40
50
60
70
2000 2001 2002 2003 2004 2005 2006 2007 2008 2009 2010 2011
US$
billion
Change inRevenues
Change in Fuel Costs
Fall in Revenues Offsets Fuel Cost Reduction in 2009
Source: IATA

Losses Likely to Worsen in 2009 in All Regions, Except the US
Source: IATA
Net profit margins by region
‐5
‐4
‐3
‐2
‐1
0
1
2
3
4
2005 2006 2007 2008F 2009F
% of reven
ues
US
AsiaPacific
Europe
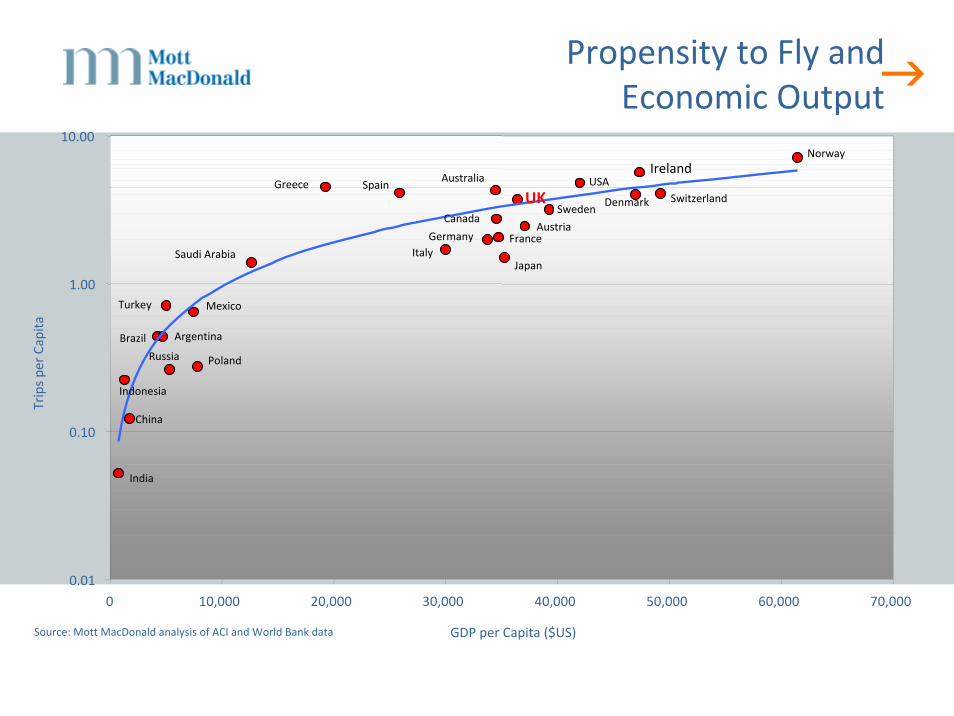
Propensity to Fly and Economic Output
0.01
0.10
1.00
10.00
0 10,000 20,000 30,000 40,000 50,000 60,000 70,000
GDP per Capita ($US)
Trips pe
r Capita
NorwayIreland
USAGreece AustraliaSpain
SwitzerlandDenmarkUKSweden
CanadaAustria
FranceGermanyItaly
JapanSaudi Arabia
Turkey Mexico
ArgentinaBrazil
PolandRussia
Indonesia
China
India
Source: Mott MacDonald analysis of ACI and World Bank data

20‐year Forecast: Strong Long‐Term Growth
Source: Boeing current market outlook 2007

Terminal Passengers at UK Airports Annual Growth Rates
Source: CAA Airport Statistics , OPEC
-10.00%
-5.00%
0.00%
5.00%
10.00%
15.00%
20.00%
25.00%
30.00%19
73
1978
1983
1988
1993
1998
2003P
asse
nger
Ann
ual G
row
th R
ates
(%)
-100.00%
-50.00%
0.00%
50.00%
100.00%
150.00%
200.00%
250.00%
300.00%
Cru
de O
il Pric
e An
nual
Gro
wth
Rat
es (%
)
1974 Fuel Crisis
1977 Bermuda II
1979 US Deregulation
1982 Falklands War
1983 Europe Deregulation
1985/86 Libya/Chernobyl
1991 Gulf War
1995 Introduction of Low‐Cost Airlines
1981 Fuel Crisis + Recession
1988 Lockerbie
2001 Terrorist Attacks
2003 Iraq War / SARS
Note: Historic oil price shown in US$ and the exchange rates between USD and GBP were not considered

Capacity and Demand Forecast in SE England(Assuming no new Runways)
The unmet demand by 2035/36 is in the region of 1.2 million slots– almost as big as the capacity of the 5 London airports today.
Source: CAA, Future of Air Transport White Paper and supporting documents
LHR LHR LHR LHR LHR
LGW LGW LGW LGW LGW
STN STN STN STN STN
LTN LTN LTN LTN LTN
LCY LCY LCY LCY LCY
Unmet
Unmet
Unmet
Unmet
0
400
800
1200
1600
2000
2400
2800
2007/08 2014/15 2021/22 2028/29 2035/36
Year
Air Transport Movem
ents Capacity
Demand for Slots

Capacity and Demand Forecast in SE England(Assuming new Runways at LHR, STN and LGW)
Even with new runways at Heathrow, Stansted and Gatwick,there is unmet demand of 540,000 slots by 2035/36.
LHR LHRLHR LHR LHR
LGW LGW
LGW
LGW LGWSTN STN
STN
STN STN
LTN LTN
LTN
LTN LTN
LCY LCY
LCY
LCY LCYUnmet
Unmet
Unmet
0
400
800
1200
1600
2000
2400
2800
2007/08 2014/15 2021/22 2028/29 2035/36
Year
Air Transport M
ovem
ents Capacity
Demand for Slots
Source: CAA, Future of Air Transport White Paper and supporting documents

Change in the Market Impacts Infrastructure Requirements
Regional airline growth
– Smaller aircraft
– Lower Pax per ATM
– More ATMs
Low cost carriers
– Increased utilisation
– Lower costs
– More slot demand
2. Each new LCC based aircraft requires up to 2500 slots

EU Low Cost Market Share

Airport Congestion in Europe
• EC Study found:
– Air traffic forecast to grow by 2.3 times between 2003 and 2025
– More than 60 EC airports will be congested by 2025
– Top 20 saturated for 10 hours a day
– Planned capacity increases will notmeet forecast demand
• Situation in the UK is already critical in the South East of England

Aviation Environment
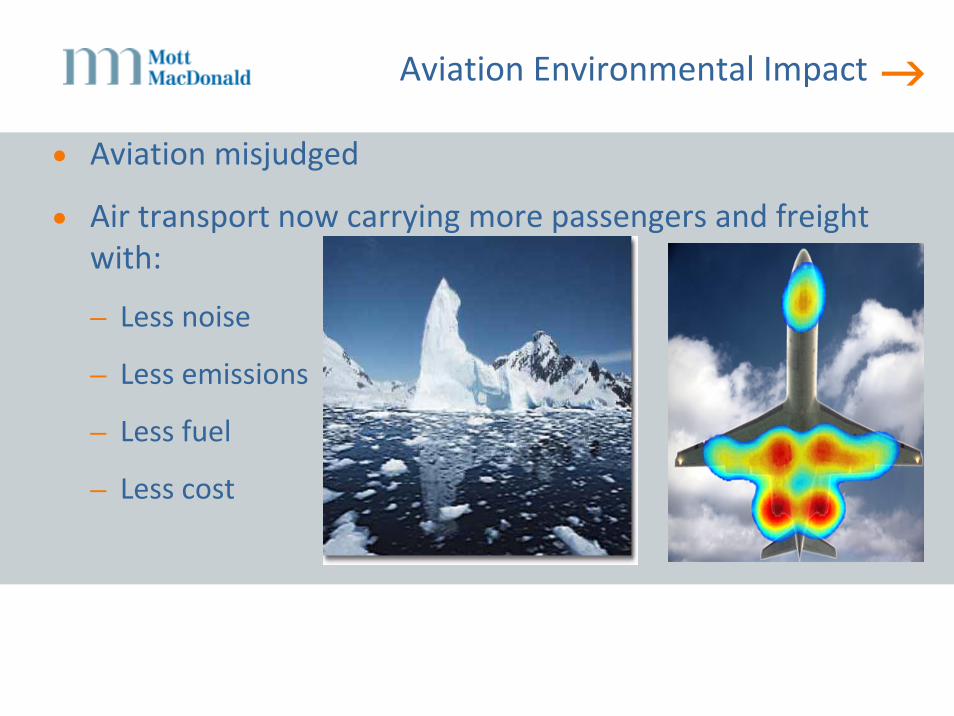
Aviation Environmental Impact
• Aviation misjudged
• Air transport now carrying more passengers and freight with:
– Less noise
– Less emissions
– Less fuel
– Less cost

Air Travel Increasingly Fuel Efficient
Source: Airbus Global Market Forecast 2006‐2025

0.0
5.0
10.0
15.0
20.0
25.0
(1) E
nerg
y Ind
(2) R
d Tra
ns(3
) Oth
ener
gy(4
) Con
sum
er fu
el(5
) Man
ufac
t(6
) Indu
stry
(7) B
io m
ass
(8) M
arine
Tra
ns
(9) A
viatio
n
%
26%
2%
18%
EU CO2 Emissions Aviation Just 2%!!!
Source: European Environment Agency

Noise Improvements
Source: Boeing

Summary
• Demand will return
• Increasing segmentation
• Increasing consolidation
• Increasing congestion
• Regulators not keeping pace
• Poor record in promoting aviation positive record on environmental impact
• Infrastructure investment remains key – runway, ATM, surface access

Any Questions?


Thank you
www.mottmac.com