Embed Size (px)
Citation preview
The Good, the Bad & the Uglyof the Australian Accounting Profession®2014
BENCHMARKING REPORT & PRACTICE IMPROVEMENT GUIDE FOR AUSTRALIAN ACCOUNTING FIRMS
Developed & produced by Supported by
The Good, the Bad & the Ugly of the Australian Accounting Profession® 2014 Edition
Copyright notice© 2001 – 2014 Business Fitness Pty Ltd
This publication is copyright. Other than for the purposes of and subject to the conditions prescribed under the Copyright Act, no part of it may in any form or by any means (electronic, mechanical, microcopying, photocopying, recording or otherwise) be reproduced, stored in a retrieval system or transmitted without prior written permission. Inquiries should be addressed to Business Fitness Pty Ltd.
Liability noticeBusiness Fitness Pty Ltd shall not accept responsibility for any injury, loss or damage occasioned by any person acting or refraining from action as a result of material in this publication, whether or not such an injury, loss or damage is in any way due to any negligent act or omission or default on behalf of Business Fitness Pty Ltd. No person, persons or organisations should take any action solely on the basis of the material contained herein, but instead should satisfy themselves independently of the appropriateness of such action.
Trademarks noticeGood Bad Ugly, The Good, the Bad & the Ugly, and Business Fitness are registered trademarks of Business Fitness Pty Ltd.
CONTENTS | GBU 2014 | 3
4 | GBU 2014 | FOREWORD
By the time you agree it’s time to change, it’s already too late. The time to change is before it seems necessary. Before the storm hits. Before the rest of the world has already caught on.
It’s no secret that the accounting industry is in the midst of an unsettling revolution. Familiarity and security is in the past; the future doesn’t hold this. And yet the uncertainty that inevitably accompanies change is not unique to our current circumstances; the world has been in improvement mode since the dawn of man, and the digital revolution is a revolution like any other.
A revolution is defined as the overthrowing of a social order in favour of a new system. A new system. A new way of working, communicating, living. It’s a revolution that requires the accounting profession to adapt quickly – it’s a new game with a new set of rules.
Move costs down, cut time out – this, indeed, is nothing new – we’ve always been pushing for more efficient and cost-effective ways of working. Now though, it’s a little more of a dilemma. Though the global marketplace has provided unlimited opportunities to the business world and its inhabitants, so too has it posed a new breed of threats to these same people. The same changes that allow a global client base and an international workforce also open the gates for global competition – to the extent that you may no longer be able to afford to offer the same kinds of services (particularly of the compliance kind) that you have offered to date.
And globalisation is not the only game-changer. The access to information that your clients have in this age of unparalleled content availability could make or break your firm. As the accountant-client relationship balances out, clients are more and more likely to do their own accounting and financial research and come to you armed with Internet-sourced knowledge. The challenge will become one of how to use and expand their new knowledge to service them in ways that you and they may not have previously considered.
Faster and cheaper aren’t the only options. They might be the way you choose to go, but there’s also better. (It will be a major achievement to combine the three.) If at a macro-level we feel the responsibility of moving the world forward, then better would appear to be the way to go.
The question now is how will firms do this? How do we be better in a future not even ‘experts’ can predict? We will need to be a lot more open to learning and adapting experiences from other industries to achieve longevity and sustainable business models.
Now in our fourteenth year of operation, Business Fitness is clearly seeing the demands of change beginning to impact on our clients’ mindsets and approach to their future business needs. With the privilege of being able to closely monitor trends and changes in the industry, we are well positioned to guide our clients as they navigate their many challenges in addressing their firm of the future objectives. We are excited to be working through the new age with our clients – as we believe you should be in working with yours.
The opportunities are limitless.
Welcome to the 2014 edition of The Good, the Bad and the Ugly of the Australian Accounting Profession.
Stuart A Spalding CAChief Executive Officer, Business Fitness
SO LET’S MOVE “FOREWORD”...
6 | GBU 2014 | CONTENTS
How to use this report 7
How to derive value from this report 8
Executive summary 9
Structuring and managing your practice as a business 14Introduction 15Structuring your Business for a New and Profitable Era 17Succession Planning for a Stress-Free Exit 21Firm Profile: The Times They Are A-Changin’ 24Maximise the Opportunities of an Evolving Industry 27Strategic Planning: Is it Still Relevant? 32Firm Profile: A New Business Model 36The True Value of Accelerated Cash Flow 39Risk Management and Responsibility for Accountants 41
Key client servicing and relationship management 44Introduction 45Reconstructing Client Engagement from the Ground Up 47 Firm Profile: Relationships are Twofold 51How to Educate your Clients to Work with You in a New Era 55Firm Profile: Happy Team, Happy Clients 59Connection 2.0: The Portal 62
Delivering relevant services (new era) 65Introduction 66The Future of SMSF 69Firm Profile: 2014 Most Efficient Accounting Firm 72Bridging the Value-Add Chasm 74Change, Challenges and Consequences: The 7 C’s of Technical Disruption 80
Achieving efficiency gains through technology and systems 84Introduction 85The Cost of Cloud Services 87True Document Management 90Firm Profile: Keeping it Simple 94New Era Working Papers: Flexible and Integrated 97Firm Profile: Tech, Tools and Tips 101Cloud Technology: What it Means for Accountants 104Special Purpose Financial Reporting 106
Engaging a flexible workforce 110Introduction 111Future Shock: The Global Nomadic Accountant 115Firm Profile: The Frontline and the Back Office 119Being Outsource Ready 123The Modern Workforce How-To 126
Appendix - Data tables 129
TABLE OF CONTENTS
EXECUTIVE SUMMARY | GBU 2014 | 9
The leading publication of its kindThe Good, the Bad and the Ugly of the Australian Accounting Profession (The Good Bad Ugly) is the longest running publication of its kind in Australia, with this 2014 edition being the publication’s twelfth edition. These twelve years have earned the Good Bad Ugly a reputation as the most established, credible and reliable benchmarking report available to Australian accountants.
This report has been prepared on the basis of the data provided by the firms that participated in the Good Bad Ugly survey this year. This selection of firms is a cross-section of city, suburban and regional firms of all sizes, ranging from sole practitioner firms through to large multi-office, multi-partner firms. The data provided is based on the financial year ended 30 June 2014. Whilst we do not audit the data, we review each data set as it is provided and, where any data appears unusual or to be an outlier, the firm is contacted to verify the data in question.
Value of the reportThe value of this report is twofold. Firstly, it is a benchmarking study analysing the financial performance of work practices within and management trends across Australian accounting practices. Secondly, it is an improvement guide for firms, with valuable ‘how to’ strategies for any practice to excel.
The context for this year’s resultsThe amount of talk that change and digital disruption is generating is surely an indication of the impact it has already had and has yet to have on the accounting industry. Firms are now accepting that the key to surviving as a professional service firm is to become flexible, agile, and embrace whatever form of change heads this way.
With clients suddenly armed with Internet-sourced knowledge, compliance work being completed overseas at a fraction of the price, and clients demanding more from their accountants but at a lower price, the danger of falling behind or becoming extinct as an accounting firm is real.
But with the help of this report and a positive and future-minded attitude, you can use the hurdles of the digital age as a call to action; as motivation to excel. Don’t wait until the true impact of digital disruption hits us.
EXECUTIVE SUMMARY
10 | GBU 2014 | EXECUTIVE SUMMARY
2014 results
Size of firm (by partners/revenue)
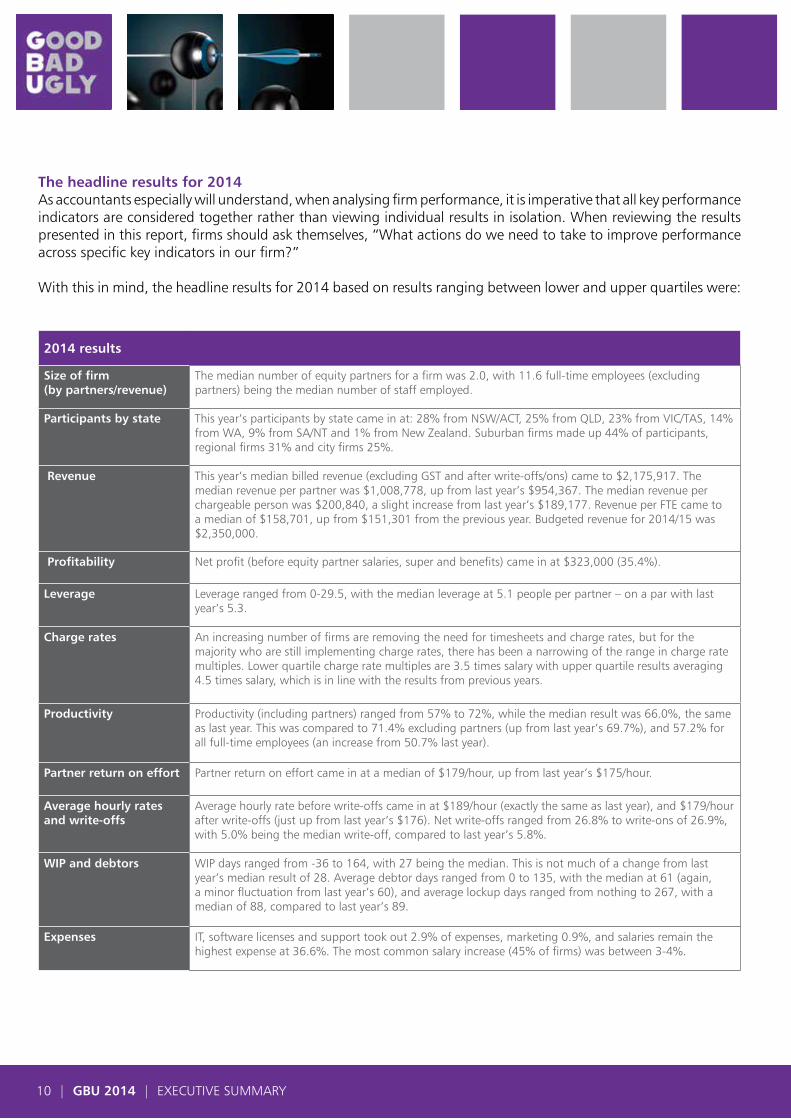
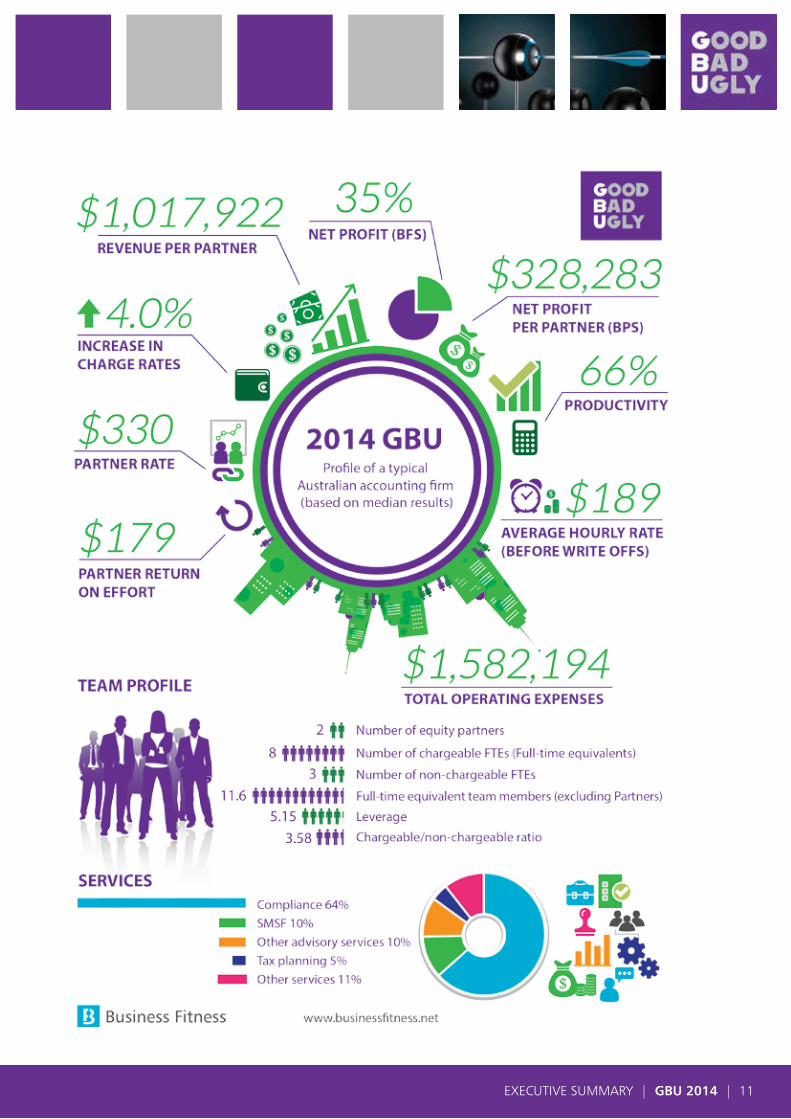
The median number of equity partners for a firm was 2.0, with 11.6 full-time employees (excluding partners) being the median number of staff employed.
Participants by state This year’s participants by state came in at: 28% from NSW/ACT, 25% from QLD, 23% from VIC/TAS, 14% from WA, 9% from SA/NT and 1% from New Zealand. Suburban firms made up 44% of participants, regional firms 31% and city firms 25%.
Revenue This year’s median billed revenue (excluding GST and after write-offs/ons) came to $2,175,917. The median revenue per partner was $1,008,778, up from last year’s $954,367. The median revenue per chargeable person was $200,840, a slight increase from last year’s $189,177. Revenue per FTE came to a median of $158,701, up from $151,301 from the previous year. Budgeted revenue for 2014/15 was $2,350,000.
Profitability Net profit (before equity partner salaries, super and benefits) came in at $323,000 (35.4%).
Leverage Leverage ranged from 0-29.5, with the median leverage at 5.1 people per partner – on a par with last year’s 5.3.
Charge rates An increasing number of firms are removing the need for timesheets and charge rates, but for the majority who are still implementing charge rates, there has been a narrowing of the range in charge rate multiples. Lower quartile charge rate multiples are 3.5 times salary with upper quartile results averaging 4.5 times salary, which is in line with the results from previous years.
Productivity Productivity (including partners) ranged from 57% to 72%, while the median result was 66.0%, the same as last year. This was compared to 71.4% excluding partners (up from last year’s 69.7%), and 57.2% for all full-time employees (an increase from 50.7% last year).
Partner return on effort Partner return on effort came in at a median of $179/hour, up from last year’s $175/hour.
Average hourly rates and write-offs
Average hourly rate before write-offs came in at $189/hour (exactly the same as last year), and $179/hour after write-offs (just up from last year’s $176). Net write-offs ranged from 26.8% to write-ons of 26.9%, with 5.0% being the median write-off, compared to last year’s 5.8%.
WIP and debtors WIP days ranged from -36 to 164, with 27 being the median. This is not much of a change from last year’s median result of 28. Average debtor days ranged from 0 to 135, with the median at 61 (again, a minor fluctuation from last year’s 60), and average lockup days ranged from nothing to 267, with a median of 88, compared to last year’s 89.
Expenses IT, software licenses and support took out 2.9% of expenses, marketing 0.9%, and salaries remain the highest expense at 36.6%. The most common salary increase (45% of firms) was between 3-4%.
The headline results for 2014As accountants especially will understand, when analysing firm performance, it is imperative that all key performance indicators are considered together rather than viewing individual results in isolation. When reviewing the results presented in this report, firms should ask themselves, “What actions do we need to take to improve performance across specific key indicators in our firm?”
With this in mind, the headline results for 2014 based on results ranging between lower and upper quartiles were:
EXECUTIVE SUMMARY | GBU 2014 | 11
12 | GBU 2014 | EXECUTIVE SUMMARY
Summary of results across firms of different sizes and locationsWhilst revenue per partner and net profit per partner were their highest in city firms, location does not appear to influence results across key performance indicators. This allows us to conclude that, regardless of location, the fundamentals of an accounting business are essentially the same.
Sole practitioner firms have once again proven to be the most profitable. Three partner firms were the least profitable sized firms.
Substantial room for improvement in systems and processesThe two major reasons firms implement procedures and systems are to improve efficiency (43%) and to improve QA and risk (33%). 29% of firms, however, have not been successful in achieving the above purpose for implementing systems. Though there is no shortage in technology, it seems the real problem may be the way this technology is used by a firm.
Less than one third of firms (31%) have more than 80% of their procedures formally documented, indicating that there is substantial room for improvement by the majority of the firms in this area.
Despite all the available knowledge about document and email management, 28% of firms still have their staff members keeping emails in Outlook. Clearly, there is a lack of industry awareness in this area of practice management.
One quarter of firms are not confident that their standard documents and workpaper templates represent best practice and are all up-to-date – from a risk management perspective (not to mention a process efficiency perspective), these numbers indicate that there is significant room for improvement in this area for a lot of firms, although this figure is lower than in previous years.
OutsourcingOnly 30% of firms are engaging in outsourcing, and within this group, organisations that perform the outsourced work in Australia were slightly more popular (14%) as opposed to overseas organisations (13%). More firms (42%) claimed they would not be looking to commence or continuing to rely on outsourcing in the next 12 months, than those who said they would be (39%). The most common kinds of work outsourced were SMSF audits (15%) and SMSF compliance (16%).
The use of cloud-based software and applicationsThere has been a significant rise in the use of cloud-based software and applications. Only 30.2% of firms are not using any kind of cloud-based software and applications – this is a major difference to the 64% from 2011. Of the firms that are experimenting with the cloud, it seems that the majority are using it for their own internal accounts. Very few firms are relying on cloud-based software and applications for fundamental processes such as document and practice management.
Compliance-based work: slowly diminishingThis year’s results reveal that 61% per cent of revenue is still being generated from compliance-based tax and accounting work. Though this figure may still seem high considering all the talk of commoditisation of compliance work, this is a dramatic reduction compared to the results from five years ago.
EXECUTIVE SUMMARY | GBU 2014 | 13
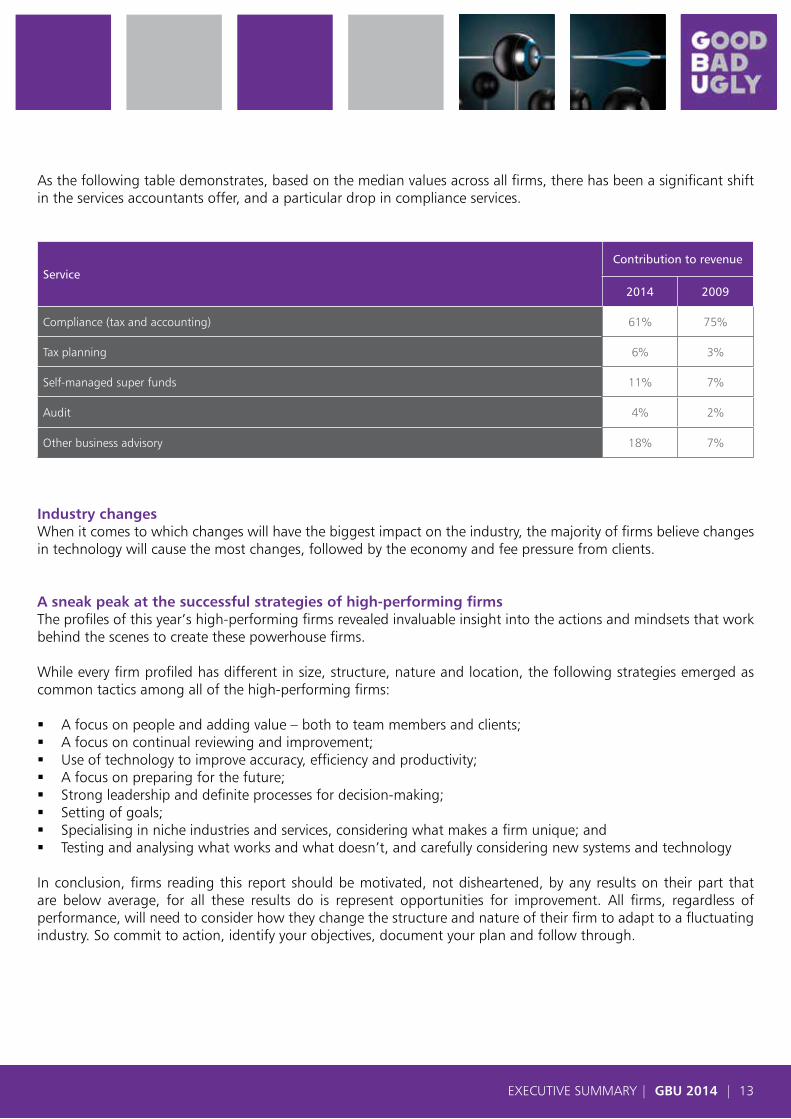
As the following table demonstrates, based on the median values across all firms, there has been a significant shift in the services accountants offer, and a particular drop in compliance services.
Industry changesWhen it comes to which changes will have the biggest impact on the industry, the majority of firms believe changes in technology will cause the most changes, followed by the economy and fee pressure from clients.
A sneak peak at the successful strategies of high-performing firmsThe profiles of this year’s high-performing firms revealed invaluable insight into the actions and mindsets that work behind the scenes to create these powerhouse firms.
While every firm profiled has different in size, structure, nature and location, the following strategies emerged as common tactics among all of the high-performing firms:
� A focus on people and adding value – both to team members and clients; � A focus on continual reviewing and improvement; � Use of technology to improve accuracy, efficiency and productivity; � A focus on preparing for the future; � Strong leadership and definite processes for decision-making; � Setting of goals; � Specialising in niche industries and services, considering what makes a firm unique; and � Testing and analysing what works and what doesn’t, and carefully considering new systems and technology
In conclusion, firms reading this report should be motivated, not disheartened, by any results on their part that are below average, for all these results do is represent opportunities for improvement. All firms, regardless of performance, will need to consider how they change the structure and nature of their firm to adapt to a fluctuating industry. So commit to action, identify your objectives, document your plan and follow through.
ServiceContribution to revenue
2014 2009
Compliance (tax and accounting) 61% 75%
Tax planning 6% 3%
Self-managed super funds 11% 7%
Audit 4% 2%
Other business advisory 18% 7%
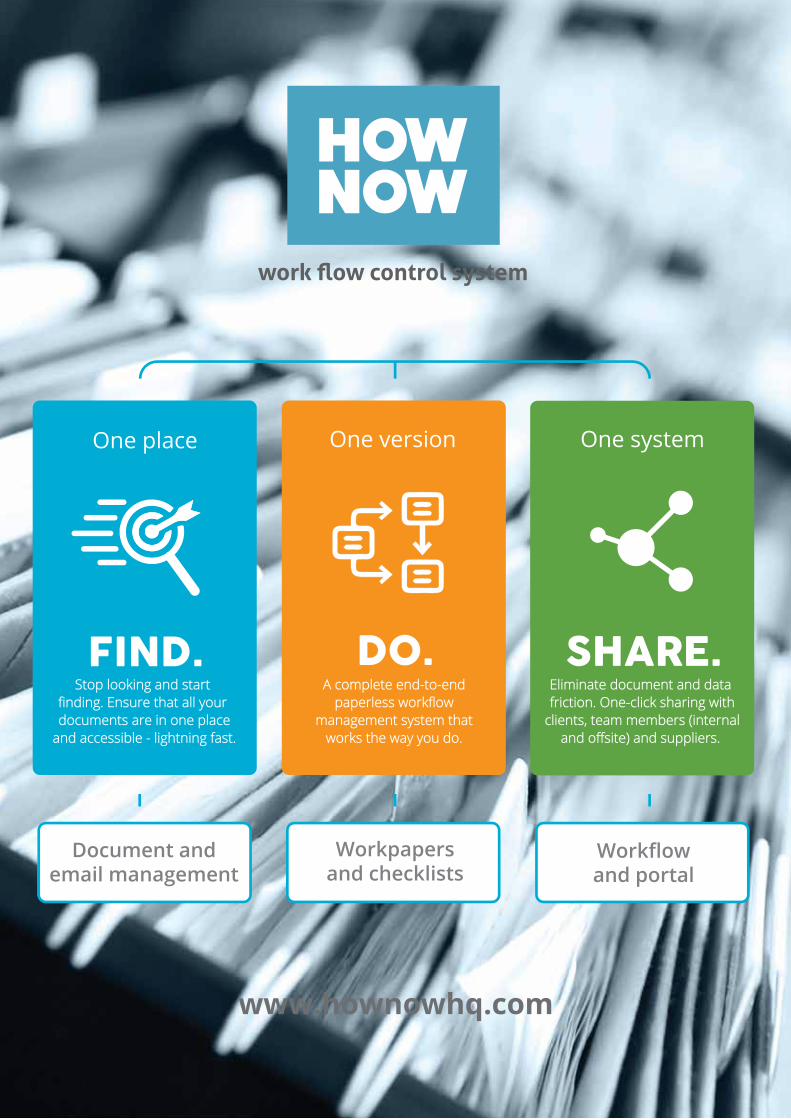
work flow control system
About Business Fitness
Business Fitness is about more than just the Good Bad Ugly.
We are a leading provider of best practice systems, tools and strategic advice to help accountants streamline
processes, improve efficiency, reduce risk and grow profit.
1300 333 424
www.businessfitness.net
The Good, the Bad & the Uglyof the Australian Accounting Profession®2014
BENCHMARKING REPORT & PRACTICE IMPROVEMENT GUIDE FOR AUSTRALIAN ACCOUNTING FIRMS
Developed & produced by Supported by
businessfitness.net1300 333 424
macquarie.com.au/accounting1800 206 479