Embed Size (px)
Citation preview
AD-A05 132 AIR FORCE INST OF TECH WRIGHT-PATTERSON AFB OH SCHOOL--ETC F/G 15/5ANALYSIS OF A PROPOSED MATERIAL HANDLING SYSTEM USING A COMPUTE--ETCIU)JUN 81 D D HARP
UNCLASSIFIED AFIT-LSSR-32-18 NL
U1 uuuuuOuuhuIEEEIIIIEEEIIIEIIIIIEEEIIIIEEIIEIIIEIIIEEIIIIIEEIIIIIllllllllllllluImI Imh1hhhhmhml1
4L4
UNITEOSTATES AIR FORCE ~ L~I:AIR UNIVERSITY
AIR FORCE INSTITUTE OF TECHNOLOG AWright-Patterson Air Force Sas*,Ohio
8110 6 18*
ANALYSIS OF A PROPOSED MATERIALHANDLING SYSTEM USING A COMPUTER
SIMULATION MODEL
Darwin D. Harp, GS-11
LSSR 32-81
The contents of the document are tech=ially accurate, andno sensitive items, detrimental ideas, or deleteriousinformation are contained therein. Furthermore, the viewsexpressed in the documen t are those of the author(s) and donot necessarily reflect the views of the School of Systemsand Logistics, the Air University, the Air Training Comand,the United States Air Force, or the Department of Defense.
4.;
! ~
AFIT Control Number LSSR 32-81
AFIT RESEARCH ASSESSMENT
The purpose of this questionnaire is to determine the potential for currentand future applications of AFIT thesis research. Please return completedquestionnaires to: AFIT/LSH, Wright-Patterson APB, Ohio 45433.
1. Did this research contribute to a current Air Force project?
a. Yes b. No
2. Do you believe this research topic is significant enough that it wouldhave been researched (or contracted) by your organization or another agencyif AFIT had not researched it?
a. Yes b. No
3. The benefits of AFIT research can often be expressed by the equivalentvalue that your agency received by virtue of AFIT performing the research.Can you estimate what this research would have cost if it had beenaccomplished under contract or if it had been done in-house in terms ofmanpower and/or dollars?
a. Man-years $ (Contract).
b. Man-years $ (In-house).
4. Often it is not possible to attach equivalent dollar values to research,although the results of the research may, in fact, be important. Whetheror not you were able to establish an equivalent value for this research(3 above), what is your estimate of its significance?
a. Highly b. Significant c. Slightly d. Of NoSignificant Significant Significance
5. Comments:
7.
Name and Grade Position
Organization Location
TOLD DW ON OUTSIDE SEAL WITH TAPE
4 APITI LSH10111m104nwa m aN 44n 11111RAG
OFFICIAL _____ IISUIIIIIT P~s VW.,I om IN THE
UNITID STATE
IBUSINESS REPLY MAIL I_____POSVAI WUl U PAO SY AIUS
Wdiat-Fut.. AM OH 4543M_____
SECURITY CLASSIFICATION OF THIS PAGE (Wheni Domtonted) __________________
1..~ REPORT NUMBER 2 DTAESIN00 -RCPETCTLGNME
LsS--- ------- -. S. OF REPORT & PERIODCOED
.ATHOR(*)
Darwin D./Harp, GS-11
9.7 otrFoRMING ORGANIZATION NAME AND ADDRELSS 10. PROGRAM ELEMENT. PROACT. TASK
School of Systems and Logistics AE OKUI UUR
Air Force Institute of Technology, WPAFB OH %
1__._CONTROLLINGOFFICENAMEANDADDRESS______________
UNCLASSIFIEDIS&. DECLASMSIFrICATION/oowNGRAOIN4G
SCEDUL9
14. OISTRIGUTION STATEMENT (of this Report)
Approved for public release; distribution unlimited
17. DISTRIBUTION STATEMENT (of the ab4IrAct entered In Block 20, it d11101102 &GI Report)
IAUG 98Air Force Institute of Technaolgy (ATQ1ftght-Pattrson AF8. ONl 4M433
IS. SUPPLEMENTARY NOTES
APPOVED FOR PUBLIC RELEASE APR 190.17
It. K(EY WORDS (C41014 19100O reverseAideIt R09080107 and Identify, by ;ock Maib.)
Q-GERTSIMULATIONMECHANI ZED MATERIAL HANDLINGWAREHOUSING
20.ABSTRACT (Contimu an vmers dd t weo~wdaddnify by Wck :;r, us)
DO I JA 7 143 EDIToom OF I NOV 111 IS OBSOLETE U aASFE
SECURITY CLASSIFICATION Of THIS PAmZI (OWho Date Sno~.
UNCLASS IFIEDSCCU01TV CLASSICATION OF THIS PA~G(3bdn Data Sawgreod
/
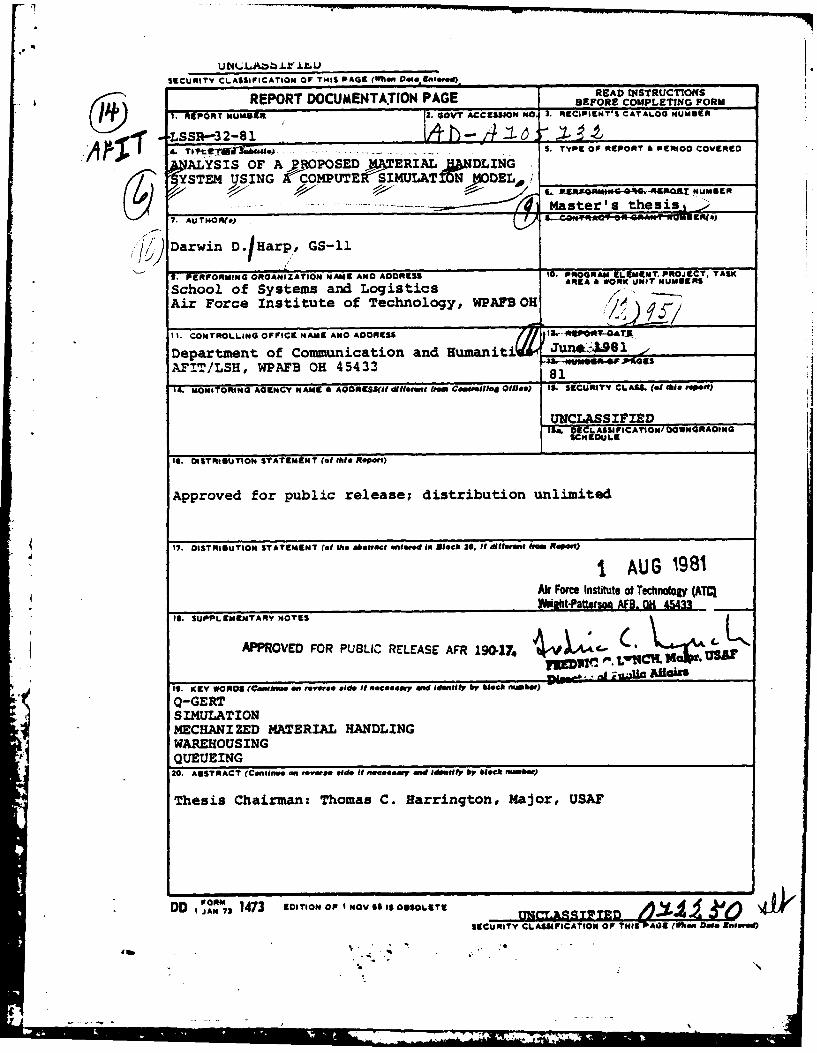
;A new mechanized material handling system (MMHS) will beinstalled in the supply warehouse at Newark Air Force Station,Ohio, in Fiscal Year 1982. The purpose of this research wasto analyze the proposed system's behavior under simulatedoperating conditions prior to system installation. A Q-GERTsimulation model was developed to study the various server andqueue configurations associated with the MMHS. The analysisrevealed that under simulated normal operating conditions theproposed system will perform as designed, and that a 25 percent
I surge in operating conditions will have significant effects onthe system. Problem areas discovered in the proposed MMHS wereidentified to assist the managers of the system in implementationand future planning.
* 4
UNCLASSIFIEDSRCUllTY CLASSIPICATION OF TWO PAG[fWtenm Dme gatd)
LSSR 32-81
ANALYSIS OF A PROPOSED MATERIAL HANDLING SYSTEM
USING A COMPUTER SIMULATION MODEL
A Thesis
Presented to the Faculty of the School of Systems and Logistics
of the Air Force Institute of Technology
Air University
In Partial Fulfillment of the Requirements for the
Degree of Master of Science in Logistics Management
By
Darwin D. Harp, BSIE
GS-11.
June 1981
Approved for public release;distribution unlimited
This thesis, written by
Mr. Darwin D. Harp
has been accepted by the undersigned on behalf of thefaculty of the School of Systems and Logistics in partialfulfillment of the requirements for the degree of
MASTER OF SCIENCE IN LOGISTICS MANAGEMENT
DATE: 17 June 1981
((COMMITECARN
ii
67-
B I
ACKNOWLEDGEMENTS
I would like to extend sincere appreciation to the
personnel in the Supply Division and the Plans and Studies
Division at Newark Air Force Station for their assistance
in this research. I, also, would like to gratefully acknowl-
edge Major Tom Harrington for his advice, assistance, and
professional guidance.
I would like to give a special thanks to my wife,
Helen, for her understanding and support during the course
of my studies.
iii
TABLE OF CONTENTS
Page
ACKNOWLEDGEMENTS ......... ................... iii
LIST OF TABLES ........ .................... vii
LIST OF FIGURES ......... .................... viii
Chapter
I. INTRODUCTION ........ .................. 1
Background ......... ................. 1
Problem Statement ...... .............. 5
Research Objectives ...... ............. 6
Scoperch Ques n................... ............ 13
Assumptions ..... ................ . 15
Limitations ..... ................ . 15
Justification ................ 16
Definitions ...... ................. . 17
Literature Review ..... .............. 17
II. METHODOLOGY ...... .................. . 20
Overview ....... ................... . 20
Modeling and Simulation ... ........... . 21
System Definition ..... ............... 23
Model Formulation ..... .............. 24
Data Identification ..... ............ 25
Data Collection ..... ............... . 27
iv
Chapter Page
Data Analysis..................29
Model Translation ............... 30
Model Manipulation. .............. 31
Model Analysis. ................ 34
Summary.....................35
III. DATA COLLECTION AND ANALYSIS. ........... 36
Overview ..................... 36
Arrival Rates ................. 36
Server Rates. ................. 40
Sumimary.....................43
IV. MODEL FORMULATION AND MANIPULATION. ........ 44
Validation .................... 44
Model Manipulation. .............. 45
V. RESULTS AND CONCLUSION. ............. 52
Analysis Overview ............... 52
Normal and Surge Operating Conditions . 52
Queue Analysis. ................ 56
Server utilization Analysis ........... 61
Conclusion. .................. 61
APPENDICES.......................63
jA. GLOSSARY OF TERMS ................ 64
B. Q-GERT NETWORK. ................. 66
C. Q-GERT SIMULATION PROGRAM LISTING ......... 74
v
Page
SELECTEDEBIBLIOGRAPHY.........................79
A. REFERENCES CITED......................80
B. RELATED SOURCES........................81
vi
,Bq
LIST OF TABLES
Table Page
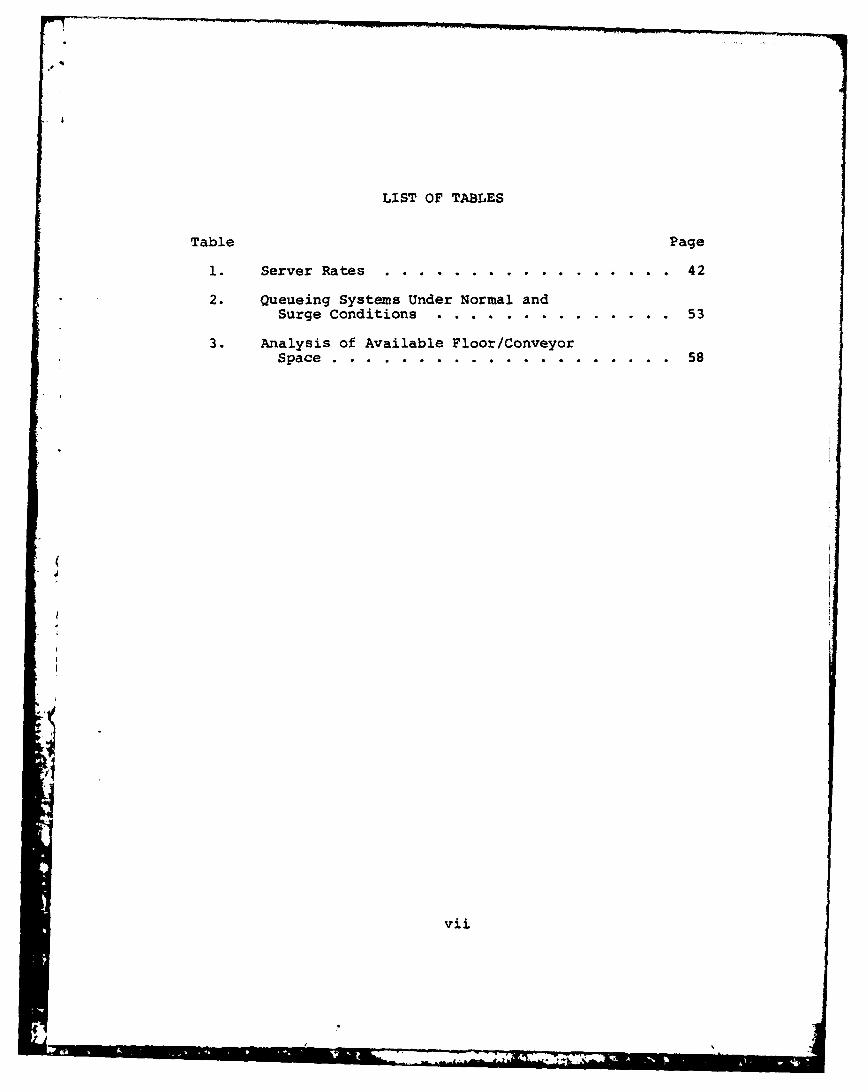
1. Server Rates ................ 42
2. Queueing Systems Under Normal andSurge Conditions ..... .............. 53
3. Analysis of Available Floor/ConveyorSpace ........ .................... . 58
vii
LIST OF FIGURES
Figure Page
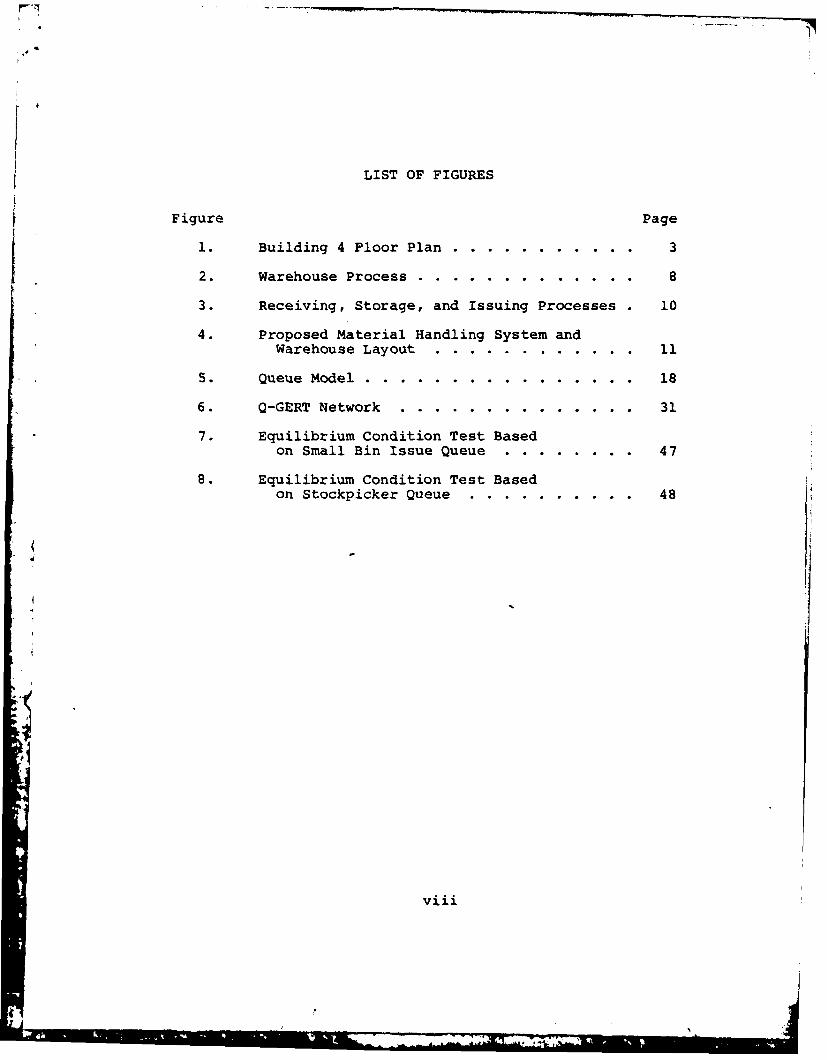
1. Building 4 Floor Plan ..... ........... 3
2. Warehouse Process 8...........8
3. Receiving, Storage, and Issuing Processes 10
4. Proposed Material Handling System andWarehouse Layout ... ............ 11
5. Queue Model ..... ................ . 18
6. Q-GERT Network .... .............. . 31
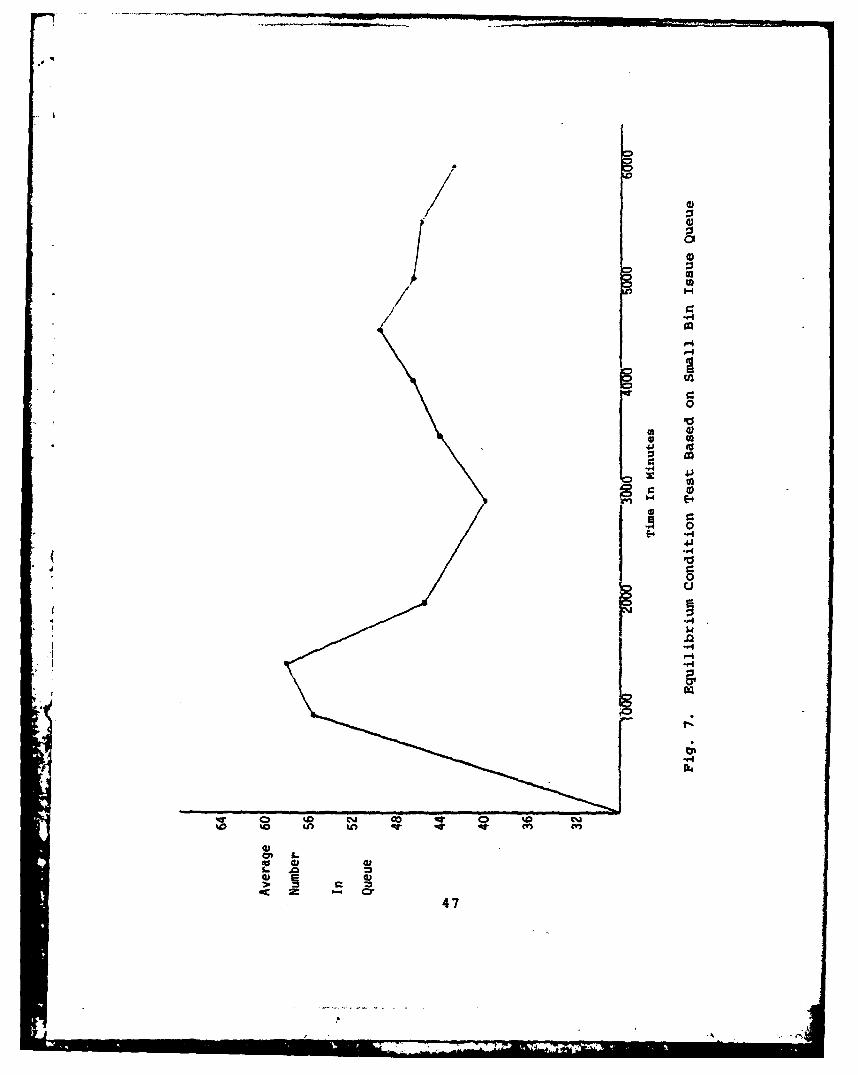
7. Equilibrium Condition Test Basedon Small Bin Issue Queue . ........ . 47
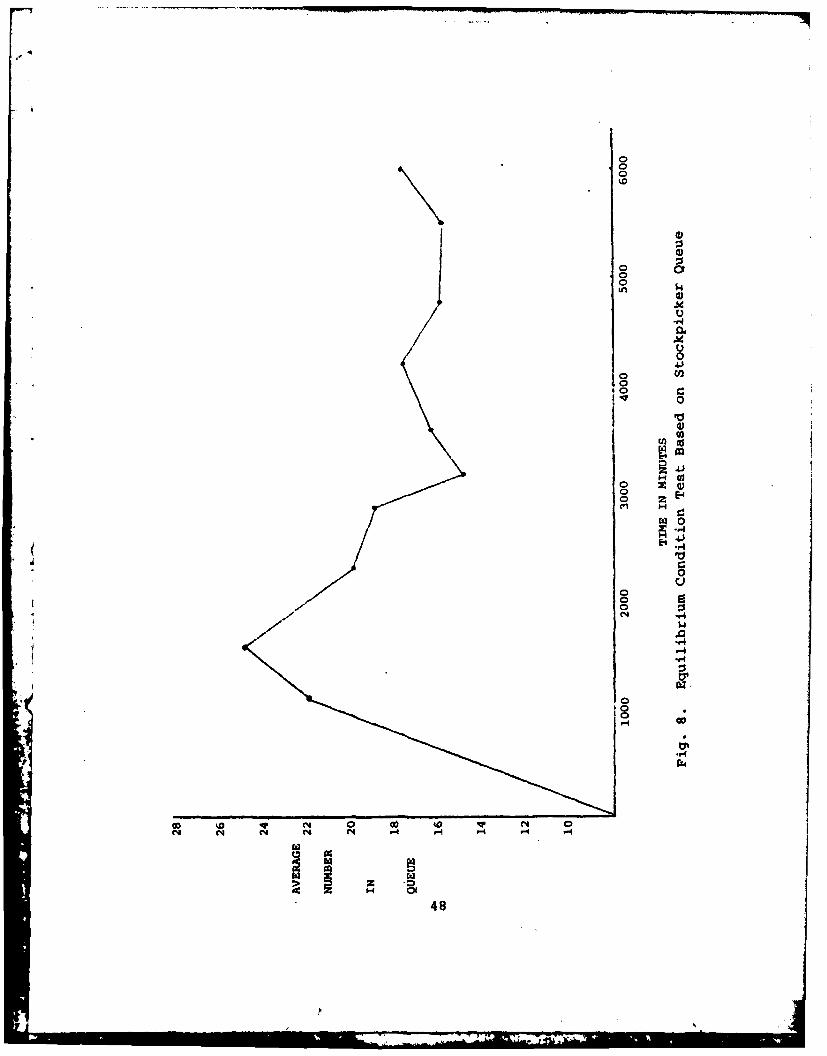
8. Equilibrium Condition Test Basedon Stockpicker Queue .. .......... . 48
I
viii
CHAPTER I
INTRODUCTION
Background
The Aerospace Guidance and Metrology Center (AGMC)
at Newark, Ohio, has a threefold mission (5:3).
1. AGMC accomplishes single point repair of
inertial guidance systems for aircraft and missiles for
the Air Force and other DOD agencies.
2. AGMC provides engineering consultant and sup-
port services for inertial guidance systems when requested
by cognizant engineering activities.
3. AGMC establishes, maintains, and performs
overall technical direction and management of the Air Force
Metrology and Calibration Program. The center, also,
operates the Air Force Measurement Standards Laboratories
as part of this program.
The primary mission of the 2803d Air Base Group
Supply and Transportation Division (AGMC/DM) is to provide
supply support to AGMC. This mission differs from that of
the conventional base supply organization. Normally, the
Air Force employs a Standard Base Supply System (SBSS)
using the UNIVAC 1050-I computer to provide base level
supply support to field activities. However, AGMC/DM uses
1]
this system to support the sophisticated requirements at
AGMC, thus being the only SBSS in the world supporting a
depot level maintenance repair facility (2:3).
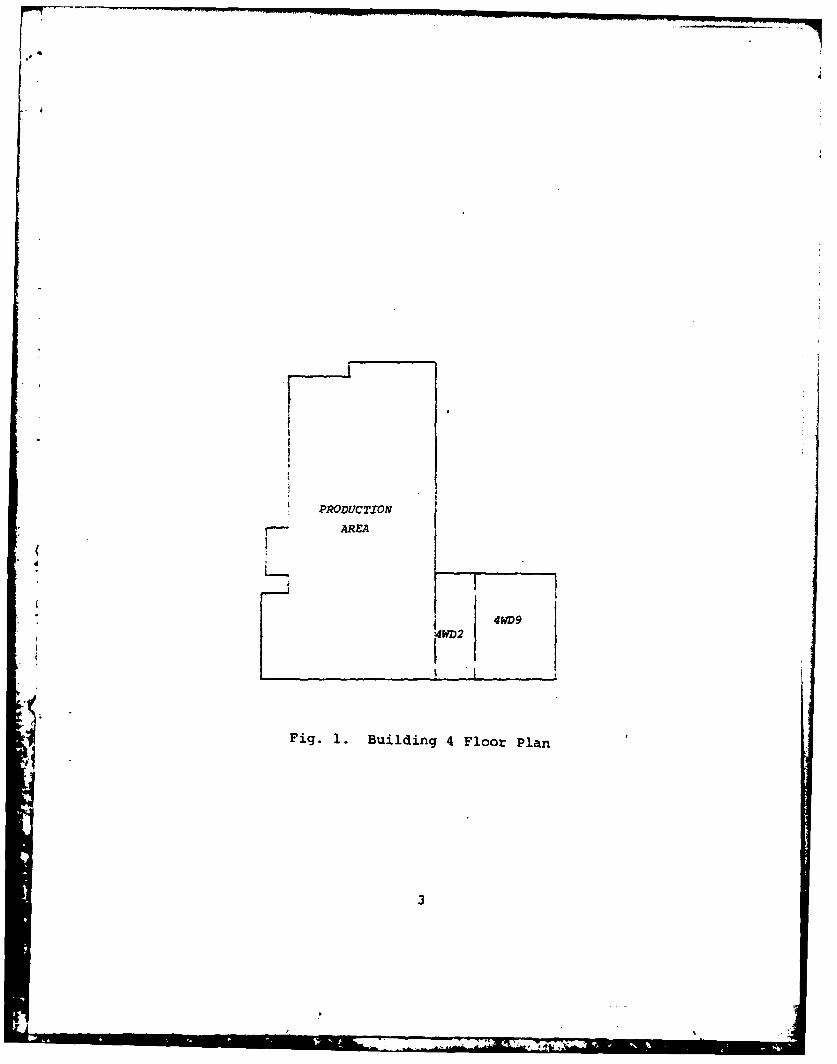
The Material Storage and Distribution Branch
(DMSDR) and the Transportation Branch (DMTP) of AGMC/DM
perform the physical and administrative functions connected
with the receiving, warehousing, distribution, packaging,
and shipping of material at AGMC. These two branches are
located in buildings 4WD2 and 4WD9 adjacent to the main
production facility (Figure 1).
Buildings 4WD2 and 4WD9 are relatively new, having
been constructed in 1977. The material handling equipment
owned by AGMC/DM at that time was not adequate for the new
facilities' material flow and processes. Salvage equipment
was obtained from Warner-Robins AFB, Georgia, and adapted
into a functional layout for the new facilities. This
equipment consisted of heavy-duty live roller conveyors
and gravity roller conveyors.
Between 1977 and 1979, the material handling equip-
ment and the warehouse layout presented many problems.
1. Many discrepancies in material handling pro-
ceduaes and poor space utilization were identified by
Inspector General audits (5:69).
2. Safety and fire hazards were discovered
periodically (5:70).
2
Iam
PRDUCTION
AREA
4WD2
Fig. . Building 4 Floor Plan
3
3. Congested work areas resulted in inefficient
work methods, low morale, and low productivity.
4. The age and size of the conveyors were not con-
ducive to layout change and flexible working procedures,
thus preventing system improvements with the existing
equipment.
Various section chiefs attempted to solve these
problems in their individual areas. These measures usually
gave suboptimal results. The small improvements in their
areas were at the expense of creating new problems in other
warehousing functions.
In 1979, two incidents occurred relating to the
material handling problem in the supply warehouse. First,
the Plans and Programs Directorate (AGMC/XR) enlarged their
industrial engineering staff from one to four people. This
provided increased industrial engineering support to all
non-maintenance organizations, such as AGMC/DM. Secondly,
the industrial engineering group was introduced to the
material handling problem by the supervisor of the Storage
and Issue Section. After an initial investigation, the
decision was nade to develop an improved material handling
system for the entire warehouse area.
AGMC/XR and AGMC/DM jointly submitted a proposal
for a comprehensive material handling system for buildings
4WD2 and 4WD9. This proposal was accepted by the AGMC
4
'4
management and AFLC in February, 1980 and, presently, is
included in the AFLC budget for fiscal year 1982.
The proposed system presents a radical change in
material handling methods and procedures for AGMC/DM. New
equipment is to include conveyors, both live roller and
gravity roller, a wire-guided stock-picker system, hydraulic
lift tables, gravity-flow storage racks, and various types
of individual work station equipment. The physical layout
of the warehouse will be improved by changing the direction
of the flow of material, developing new methods for moving
material, repositioning computer terminals, relocating the
administrative offices, constructing new mezzanine storage
areas, and arranging storage racks to increase effective
storage space.
Problem Statement
Dr. John A. White's Material Handling System Equa-
tion approach was utilized in solving supply's material
handling problems (14:A-6).
MATERIALS + MOVES + METHODS = PREFERRED SYSTEM
By answering pertinent questions about each element in
Dr. White's equation in relationship to the material
handling problems, a theoretical, preferred system was
developed. The theoretical system was analyzed using
the guidelines prescribed in Air Force Regulation (AFR)
5
(12:9). Compliance with AFR 71-11 requires a detailed
description of the proposed system and an economic analysis.
The proposed material handling system is believed
to be sound and functional, but this belief is based mainly
on theoretical evidence, prior material handling experience,
and common sense. Because of time constraints on the sys-
tem's designers, an in-depth analysis of the entire system
was not possible. Therefore, it would be advantageous to
analyze the system's behavior under simulated operating
conditions before actual installation of the system.
Research Objectives
The objective of this research is to test the
material handling system's behavior under simulated
operating conditions before installation of the system.
Since the system is not in operation, this research becomes
a test of design characteristics. The system's structure,
which is comprised of a series of interdependent and inde-
pendent processes working towards a common goal, is
* extremely complex. To thoroughly understand the problem
and research objective, one must comprehend the system's
internal workings. This understanding is especially impor-
tant due to the system's complexity.
6
Scope
The material handling system consists of the follow-
ing functions or operations:
1. The receiving of goods and materials from
either external or internal sources.
2. Storage of material.
a. inertial guidance systems to be repaired
(reparable systems)
b. inertial guidance systems that have been
repaired and are awaiting shipment (serviceable systems)
c. parts used in the iepair process
d. normal supply material for base support
3. Packaging of material.
a. serviceable systems for shipment
b. material for long-period storage
c. normal material for shipment
4. Issuing and distribution of the material from
the warehouse to the production area.
5. Loading and unloading of trucks.
6. Administrative and data processing support
for the first five functions.
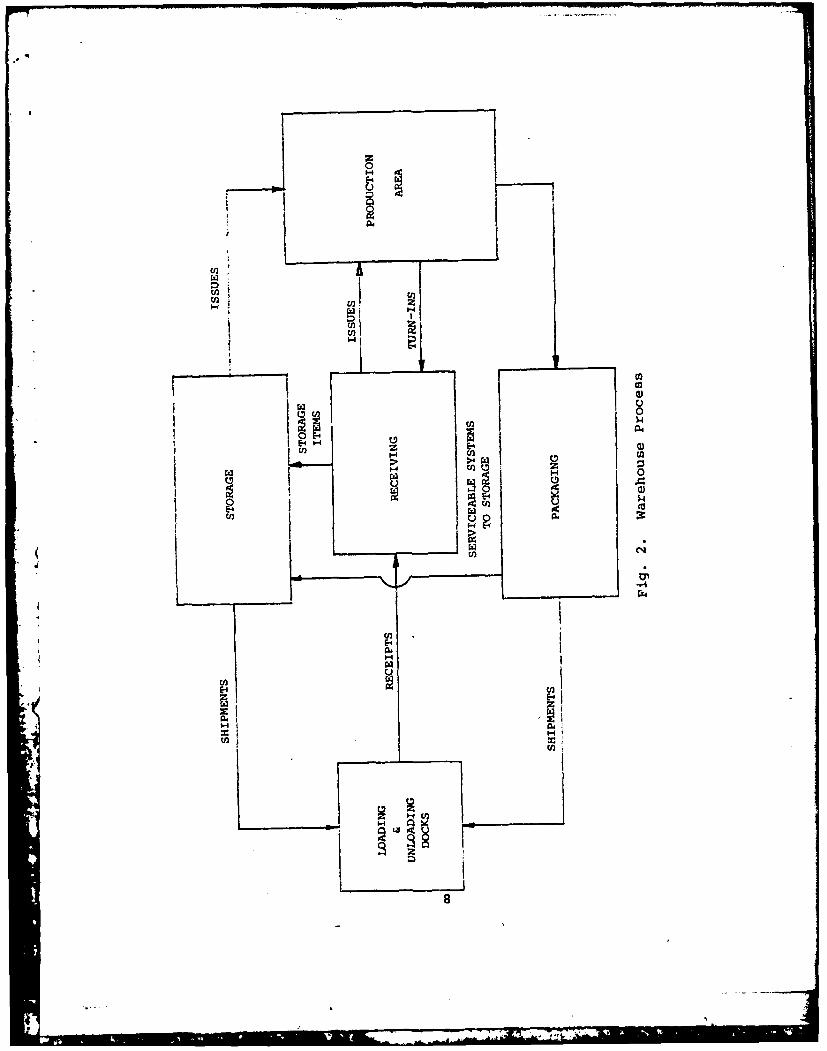
The six broad functions are interrelated as illustrated
in Figure 2.
The changes in methods and procedures and intro-
duction of new equipment have major effects on only a por-
tion of the entire system. The physical movement of
7
E-
>4 w
000
cn~ I
0 2 44
'-44
zzH U
materials to and from the production area is not a part
of the proposed system. The modifications within the
packaging area consist of updating the equipment, bringing
packaging supplies closer to the work stations, and com-
bining certain individual tasks. These improvements,
although important to the packaging function, have little
effect on the other portions of the material handling sys-
tem. The function of the dock crew in loading and unload-
ing of trucks is, also, not greatly affected by the pro-
posed system.
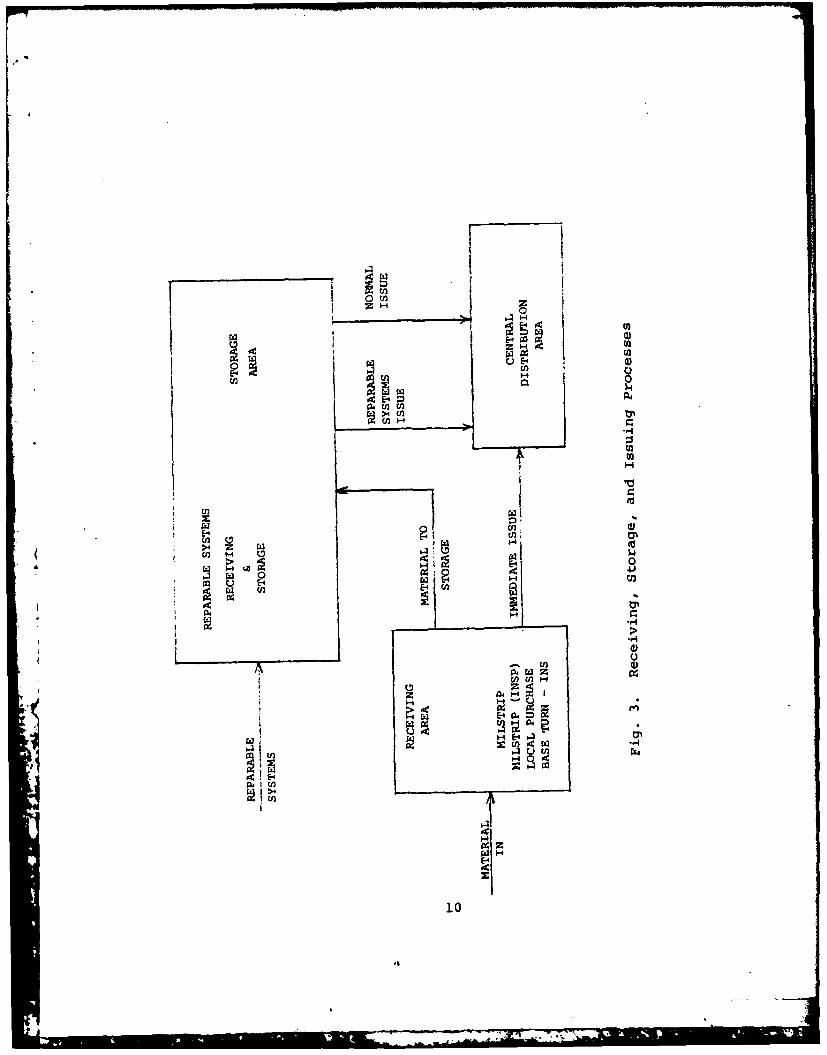
Because of the small amount of change or influ-
ence on the whole system, the packaging function, dock
crew activities, and the physical movement of materials
to and from the production area have been omitted in this
research. The emphasis of this study falls on the receipt,
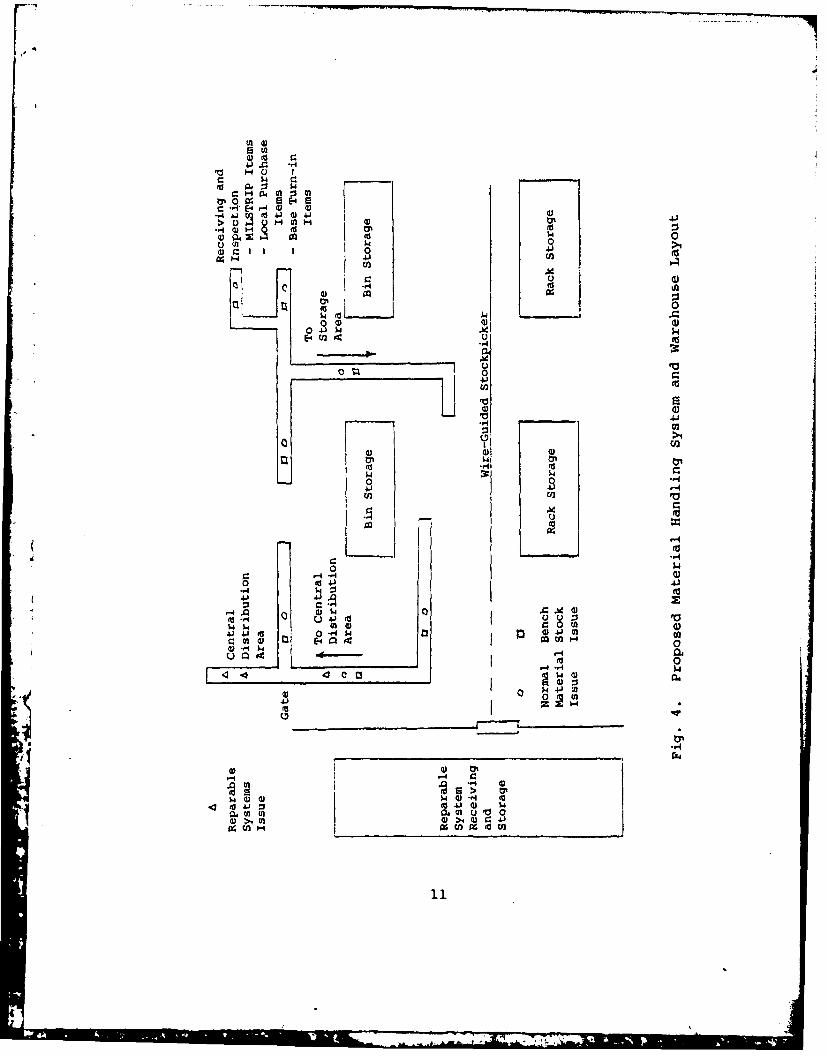
storage, and issue of material. Figure 3 displays the
interactions of the receiving, issuing, and storage pro-
cesses. Figure 4, an iconic model depicting the physical
layout of the proposed system, illustrates the flow of
material through these processes in the warehouse system.
The receiving process consists of four tasks:
opening the packages, verifying the documentation, inspect-
ing the material, and recording items into the supply
inventory system. There are five classifications of
material that can pass through receiving.
9
t%: n~ u t '1 ' I~ n I '[ - . .... - 7 -T -
cn n 0 t0
UUE-
(a
( n E
U )
04U U2 E
> 00*1j
1-4?
-4 4 (J to4 ) W
> H~ 02 r. H 02H
$4 0cl4n 4 0? >4~J 4?4.)E4
*..4 ? H 02W
4?~4z ~ kA002 0go
$)44
00
04? 4)
0301 >4
4.?4
rd 41 V
0 2.0r-4..-4 $4
4. c $44)0
k. .41.A
41 4) $)01 V a 0 u
4- =0 0W.0 .-.- 2.
1. Military Standard Requisition (MILSTRIP)
material--material acquired from government sources.
2. MILSTRIP requiring inspection--MILSTRIP
material such as paint, chemicals, and flammables that
require inspection.
3. Local Purchase--material from private vendors.
4. Base Turn-ins--material coming from internal
sources at AGMC.
5. Reparable Systems--inertial guidance systems
to be repaired at AGMC, which are received in the storage
area because of their size and quantity of shipment.
Once the receiving process is completed, the
material moves by powered conveyor directly to the central
distribution area, to be picked up for delivery provided
a request has been identified by the computer. Otherwise,
the material flows into the storage area, also by powered
conveyor, where it is assigned a bin or rack location
depending on its size. When an issue document is gener-
ated by computer to the storage area, the material
requested is retrieved and conveyed to the central distri-
bution area for delivery.
All material, except the reparable systems, fol-
lows these paths. Because of their size and quantity of
shipment, reparable systems are moved by forklift directly
to the storage area for processing into the supply inventory.
Once a computerized issue document is received in the storage
12
area, the reparable system is retrieved and conveyed to
the central distribution area for delivery. It is impor-
tant to note that normal material issues and reparable
system issues are transported by the same conveyor to the
central distribution area. Upon arrival at the central
distribution area, the reparable systems are separated
from the normal material by an electric eye-gating device
in order to facilitate further processing.
A series of sequential processes can be recog-
nized within the proposed system. Because the demand on
these processes or services exceeds the current capacity
to provide that service, queues or waiting lines precede
the processes (1:379). The system, therefore, is com-
prised of a series of sequential processes with their
( respective queues.
Research Questions
The system's behavior under operating conditions
becomes the queue characteristics at strategic points in
the system (1:598). Research questions to determine the
queue characteristics are directed at the following queues
and respective processes.
1. Receiving section
a. MILSTRIP
b. MILSTRIP (inspection)
c. Local Purchase
13
d. Base Turn-ins
e. Reparable Systems
2. Storage Section
a. Material arriving to be stored
b. Issues of material
c. Issues of reparable systems
3. Central Distribution Area
a. Material incoming for pick-up and delivery
The research questions are:
i. What is the maximum amount of material in the
specified queues under normal operating conditions (pre-
dicted receipts and issues)?
2. What is the average amount of material in the
specified queues under normal operating conditions?
3. Is there sufficient space for the queueing of
materials under normal operating conditions?
4. What are the answers to the first three ques-
tions if, instead of normal operating conditions, a surge
in the workload (25 percent increase in receipt and/or
issues) was experienced?
In studying the queue characteristics, the processes fol-
lowing the respective queues also come under scrutiny.
The research questions imply investigation in server
utilization and idle time. Servers, in these instances,
14
refer to the warehousemen or inspectors performing the
processes.
Assumptions
Certain assumptions were made at the beginning of
this research to facilitate the study.
1. The proposed material handling system is dor-
mant, awaiting AFLC funding. There will be no changes or
modifications prior to installation that would negate this
research.
2. If this research uncovers major problems, the
proposed system is flexible and could be modified before
installation.
3. All equipment will operate as denoted by the
manufacturers' performance standards.(
Limitations
Due to the complexities of the material handling
system, the following areas were con&idered as limitations
in this research..
1. As mentioned before, only those areas that
appear to be more dynamic to the entire system are under
study in this research.
2. There were no labor standards for the various
processes in the DM warehouse area. Subsequently, process
times were generated as a part of this study and their
accuracy will be noted in a later section.
-- 15
Justification
This research involves the development of a simu-
lation model for the analysis of the proposed material
handling system under simulated normal and surge operating
conditions. There are three important benefits that are
to be derived from this study. First, the simulation model
will provide the managers and operators of the system with
a great deal of knowledge concerning the behavior of the
proposed system prior to implementation. This facilitates
the transition and implementation phases and should enhance
employee acceptance. Second, since experimentation, such
as analysis of surge conditions, will be performed on the
simulation model rather than on the real system, the sup-
ply and production operations do not have to be interrupted.Third, if potential problem areas are identified with the
simulation model, there would be cost savings derived from
their resolution prior to installation. Any problem or
system malfunction detected after installation would be
very expensive to correct, and in addition to cost, the
correction would entail disruption of supply and production
operations. Further, if the system faced problems immedi-
ately after installation, the employees' confidence in the
system would be affected. For the new material handling
system to be successful, the employees must demonstrate
cooperation, not apathy or even contempt.
16
w II
Definitions
A Glossary of Terms pertaining to DOD warehousing
terminology appears in Appendix A.
Literature Review
The search for background information for this
study was conducted in three areas.
1. Material handling in the warehouse functions.
2. Queueing theory.
3. Queueing theory applied to material handling.
The studies dealing with material handling in the
warehousing functions were primarily concerned with the
development or design of material handling systems. These
studies are not helpful to this research since the pro-
posed system is past the design stage.4
Although queueing theory normally deals with spe-
cific queueing configurations and models, there are certain
definitions and concepts that one must understand in order
to appreciate this research.
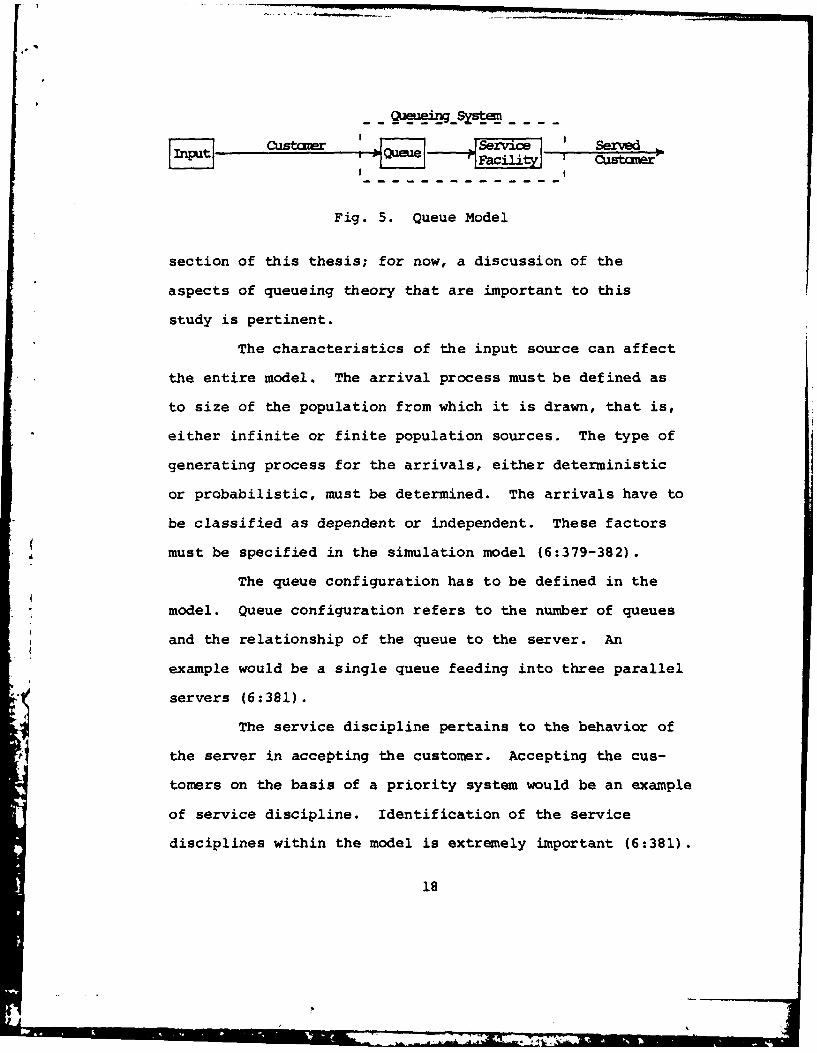
A queue, by operations research terminology, is
defined as a waiting line. The basic queueing system
model, as indicated in Figure 5, consists of an input
source (customer), a queue, and a server (6:381).
Queueing theory influences certain parameters in
the simulation model developed in this research. The
simulation model will be discussed in detail in a later
17
gueegnSystem
f i. . .. .. . . . . l I I ga , l a . a I .
I 'Cu starr Se E I -e .
Fig. 5. Queue Model
section of this thesis; for now, a discussion of the
aspects of queueing theory that are important to this
study is pertinent.
The characteristics of the input source can affect
the entire model. The arrival process must be defined as
to size of the population from which it is drawn, that is,
either infinite or finite population sources. The type of
generating process for the arrivals, either deterministic
or probabilistic, must be determined. The arrivals have to
be classified as dependent or independent. These factors
must be specified in the simulation model (6:379-382).
The queue configuration has to be defined in the
model. Queue configuration refers to the number of queues
and the relationship of the queue to the server. An
example would be a single queue feeding into three parallel
servers (6:381).
The service discipline pertains to the behavior of
the server in accepting the customer. Accepting the cus-
tomers on the basis of a priority system would be an example
of service discipline. Identification of the service
disciplines within the model is extremely important (6:381).
18
Finally, configuration of the service facility
must be considered. Such factors as number of servers,
the service time, and server arrangement must be defined
for the model (6:381-382).
The many facets of queueing theory when assembled
into a model become very complex and difficult to analyze.
For this reason, most literature dealing with queueing
theory applied to material handling analysis was on com-
puter simulation models. As mentioned before, this topic
will be discussed in a later section of this study.
19
CHAPTER II
METHODOLOGY
Overview
The complexity of the proposed material handling
system makes analytical analysis very difficult. The com-
bination of stochastic arrival and service rates, variable
* number of service facilities at each process, and the inter-
relationship between processes inhibit the representation
of the proposed system by an analytical model. Even if an
analytical model could be found or developed for this
situation, it would be difficult to determine its appli-
cability because of its mathematical complexity (1:615).
Phillips (9:65) offered the following advice on the
problem:
The primary reasons for the lack of predictivetools in the material handling arena probably stem
j from the fact that such systems, either in isolationor in relationship to the larger manufacturing environ-ment, are extremely complex.
In order to cope with stochastic, highly inter-active, exogeneously driven material handling systems,the tools and techniques of digital systems simulationanalysis seem to be the most desirable and often theonly available systems analysis technique.
The complexity of the proposed system motivated
the researcher to believe that computer simulation was the
most practical method of analysis.
20
-- p • _ ...
Modeling and Simulation
The definition of simulation, most useful in under-
standing the purpose of this project, is stated as:
Simulation is the process of designing a model ofa real system and conducting experiments with thismodel for the purpose either of understanding thebehavior of the system or of evaluating various strate-gies for the operation of the system 111:21.
The purpose of this project was to understand the behavior
of the proposed material handling system.
Many unique advantages are obtainable in the use
of simulation. Four of them are most important to this
study. First, new policies and decision rules for operating
a system can be experimentally tested by simulation before
introducing them into the real system. The proposed
material handling system will force changes in policies
and managerial decision making in the warehousing system.
These changes were incorporated into the model. The second
advantage occurs when new equipment and procedures are to
be introduced into the system. In this case, simulation
can be used to determine bottlenecks and \other problems
that may arise during actual system operation. Another
advantage is that the researcher has control of tine in a
simulation and that time can be compressed. Finally, simu-
lation can be used to experiment with new situations about
which we have little information, in order to prepare for
what may happen (9:66).
21
-SOL =CJ
There are also disadvantages associated with per-
forming a simulation. The simulation may appear to repre-
sent the real world situation when it actually doesn't.
Simulation is also imprecise and the degree of imprecision
cannot be measured. Analysis of the sensitivity of the
model to changing parameter values can only partially over-
come this difficulty (11:13). Although there are disadvan-
tages, simulation appeared to be the most practical method
to accomplish the research objective in this study.
The simulation process is comprised of nine stages.
These nine stages are listed with a brief description of
each. Their relationship to this study will be covered
later in greater detail.
1. System Definition--Determining the boundaries,restrictions, and measure of effectiveness to beused in defining the system to be studied.
2. Model Formulation--Reduction or abstraction of thereal system to a logic flow diagram.
3. Data Preparation--Identification of the data neededby the model, and their reduction to an appropriateform.
4. Model Translation--Description of the model in alanguage acceptable to the computer to be used.
5. Validation--Increasing to an acceptable level theconfidence that an inference drawn from the modelabout the real system will be correct.
6. Strategic Planning--Design of an experiment thatwill yield the desired information.
7. Tactical Planning--Determination of how each ofthe test runs specified in the experimental designis to be executed.
8. Experimentation--Execution of the simulation togenerate the desired data and to perform sensitivityanalysis.
9. Interpretation--Drawing inferences from the datagenerated by the simulation [11:23].
22
The nine stages are not sequential steps, but
instead, interactive processes. The system being studied
and the computer language used determine the method and
order of accomplishing the nine stages of the simulation
process.
System Definition
The first step in defining the system to be studied
consists of specifying the goals and establishing the boun-
dary conditions (that is, what is and is not a part of the
system to be studied) (11:26). As indicated in Chapter I,
the goal of this simulation study is to determine the
behavior under operating conditions of the receiving,
storing, and issuing activities of the proposed material
handling system.
* The system definition and boundary conditions were
indicated in Chapter I. As stated, the packaging operation,
*dock crew activity, and the distribution of material from
the warehouse to the production areas were omitted from
this study since they have little effect on the proposed
material handling system under investigation.
Material can be transported in the proposed system
primarily by two methods. Forklifts handle the bulk
material while the smaller material is moved by mechanized
methods. These mechanized methods include conveyors and
a wire-guided stockpicker. Both the wire-guided stockpicker
23
and conveyors indicated in the new system differ radically
from the present operating procedures in the warehouse
area. The only alteration in forklift procedures was to
reduce it by 33 percent (5:67). This reduction was accom-
plished by utilizing mechanized methods when applicable.
For this reason, the movement of bulk material by forklift
is not considereu a potential problem area and is omitted
from this study. The increase in material movement by the
new, untried mechanized equipment establishes the impor-
tance of this study.
Model Formulation
The model formulation step is directly related to
the system definition step. Their relationship is such
that both are accomplished almost simultaneously.
A model is a representation of an object, system,or idea in some form other than that of the entityitself. Its purpose is usually to aid us in explain-ing, understanding, or improving a system (11:41.
The diagrams presented in Chapter I are pictorial models
of the proposed material handling system (Figure 2) and the
isolated portion that is being studied (Figure 4). "As
an aid to communication, well thought out models have no
peer. 'One picture is worth a thousand words' testifies
to this function [11:61." The model formulation enabled
the focus of attention to be placed on the factors of
importance that must be included in the simulation.
24
When attempting to build a model, we could includean infinite number of facts and spend an endless amountof time gathering detailed facts about any situationand defining the relationships among them. Conse-quently, we must ignore most of the actual featuresof an event under study and abstract from the realsituation only those aspects that make up an idealizedversion of the real event [11:171.
When the system to be studied was defined, in reality, the
model was being formulated. The important facts and pro-
cesses were included in the model and the insignificant
facts were excluded.
Data Identification
Data input for the model can be classified as
variables, which are further classified as independent and
dependent (response) rariables (2:31). In the warehouse
system, three variables are identified as independent.
d The arrival rate of material to the receiving area for pro-
cessing is an independent variable. This can be the arrival
of trucks bringing reparable systems or other material and
the arrival of material from on-base activities to be
turned in to Supply. The arrival rate of normal issues to
the storage area is another independent variable. This per-
tains to computerized requests from external sources for
conveyable material other than reparable systems. The third
independent variable is th. arrival rate for issue of
reparable systems. These are computerized requests from
the production areas for initial guidance systems, located
in storage, that are to be overhauled.
25
q
The response variables relate to the research ques-
tions introduced in Chapter I. The average and maximum
amount of material contained in specific queues during
simulated operating conditions and the utilization of the
stockpicker comprise the response variables. There are
four queueing areas of importance. One is the queue
located before the receiving process. The second is the
queue leading to the storage of conveyable material arriving
from the receiving area. The third queue is before the
central distribution area and is comprised of material for
issue, both reparable systems and normal issues. The final
queue of interest is the queue of computerized issue docu-
ments, both normal and reparable systems. The first three
queueing areas are critical because of space consideration.
If the space alloted in the system's design for the queueing
of material at these points is not adequate, then the flow
of material will be disrupted and the system will malfunc-
tion. If the queue of issues grows too large, the material
going to base activities will be delayed and therefore the
base activities will be impaired. The amount of time the
stockpicker is utilized is also a response variable.
Its importance cannot be overemphasized. In many instances,
it is the only piece of equipment that can easily reach
stored material locations because of rack height or aisle
width restrictions (5:68).
26
Data can also be labeled as parameters which are
numbers or symbols that remain constant during the simula-
tion run (2:31). Most of the parameters in this study are
outside the control of the researcher. The queue configura-
tions and number of servers at each individual process was
dictated by layout design of the proposed material handling
system. In addition, the positioning of conveyors, storage
racks, and administrative offices was determined by the sys-
tem designers. Therefore, queue configuration and the
number of servers at each warehousing process were included
in the model as parameters.
The service rate at each work station is controlled
by the methods and procedures used by the warehousemen at
that station. These times were considered as parameters
in this research. The server discipline, that is, the order
by which items are processed by the server, is governed by
management decision. For the most part, items are pro-
cessed using the first-in first-out (FIFO) technique. The
only exception involves items deemed critical by management,
which are handled by priority rules. Because the applied
server discipline remains constant, it was also classified
as a parameter.
Data Collection
Since the proposed material handling system will
totally replace the present system, the data elements of
27
the present system will be the same as the ones for the
proposed system. This fact facilitated data collection.
The standard base supply system at Newark contains a com-
prehensive management information system. Data can be
easily obtained, in most instances, from this information
system.
The arrival times of both types of issues, normal
and reparable systems, were collected by a simple random
sample of the Single Line Item Release/Receipt Documents
(DOD Form 1348-1) in the storage area. The date, time of
issue, and item description are three pieces of data con-
tained on the AF Form 1348-1 that were of interest. From
these, the arrival rate and determination of conveyable or
bulk material was projected. The arrival rate of trucks
to the receiving area was obtained by randomly sampling
the foreman's log for shipments received.
As indicated earlier, most of the parameters were
determined by the warehouse layout. The queue configura-
tions, number of servers, and server discipline was
obtained from the design of the proposed material handling
system (5:50-60). The service rate is actually the labor
standard for that respective process or operation. The
service rates were generated by using labor standards when
the difference between the present and proposed processes
were not distinguishable. This method was not always avail-
able because of the lack of labor standards for certain
28
processes which were either changed in the proposed system
or did not have labor standards administered. For these
operations new standards were built. The new standards
resulted from analysis of the proposed methods and pro-
cedures using synthetic measurement such as Methods Time
Measurement (MTM), manufacturer's specifications for equip-
ment, interviews with knowledgeable people in the ware-
housing field, and actual time studies when the operation
could be observed.
Data Analysis
The collected data elements were analyzed prior to
computerization of the simulation model. The arrival rates
were analyzed using the Chi-Square Goodness of Fit test to
determine if the empirical data reasonably fit a theoreti-d
cal distribution. If the empirical data could be repre-
sented by a theoretical distribution, then the theoretical
distribution, with its estimated or specified parameters,
was used in the model.
The design of a stochastic simulation model alwaysinvolves a choice of whether to use empirical datadirectly in the model or to use theoretical probabilityor frequency distributions. First, using raw empiri-cal data implies that all one is doing is simulatingthe past. The use of data from one year would repli-cate only the performance of that year and not neces-sarily tell us anything about the expected futureperformance of the system. Second, it is generallymore efficient of computer time and storage require-ments to use a theoretical frequency or probabilitydistribution rather than to use table look-up pro-cedures for generating the necessary random variatesfor the model's operation [11:27-281.
29
i " 4The service rates at the individual processes were repre-
sented in the model by normal distributions because of
the statistical foundation of the labor standards from
which they were based.
Model Translation
Q-GERT was the computer language selected for this
project. "GERT is an acronym for Graphical Evaluation and
Review Technique. The Q is appended to indicate that queue-
ing systems can be modeled in graphic form (10:vii]."
"Basically, Q-GERT applications relate to queueing systems
analysis or project planning and management [10:5]." Q-GERT
was chosen for this simulation for two reasons. First,
Q-GERT adapts well to simulating models involving queueing
theory. Second, from a practical standpoint, Q-GERT is the
*simulation language predominantly used in AFIT School of
Systems and Logistics courses and research.
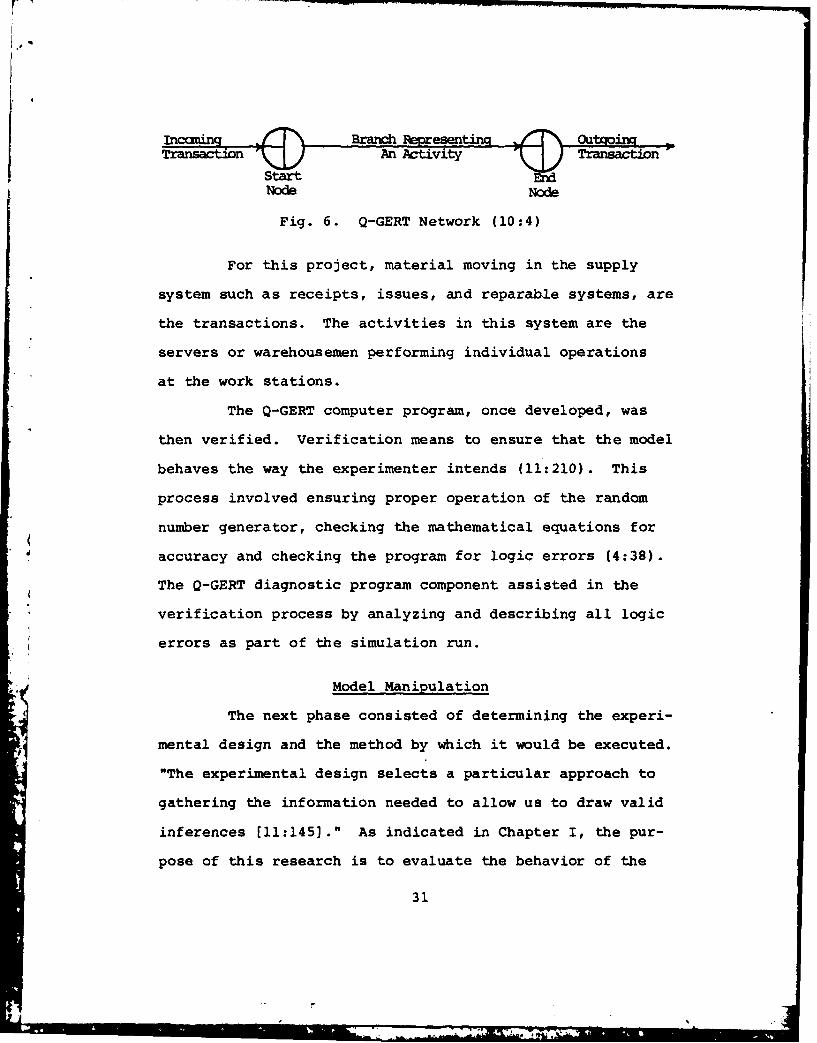
A Q-GERT network is made of nodes and branches.
Each branch represents an activity which involves a process-
ing time or a delay. The nodes act to separate branches
and are used to model milestones, decision points, and
queues. Items that flow through the network are called
transactions (10:3). Figure 6 is a graphic representation
of the Q-GERT network.
30
TascinAn Activity Transaction
Trn
NoeNode
Fig. 6. Q-GERT Network (10:4)
For this project, material moving in the supply
system such as receipts, issues, and reparable systems, are
the transactions. The activities in this system are the
servers or warehousemen performing individual operations
at the work stations.
The Q-GERT computer program, once developed, was
then verified. Verification means to ensure that the model
behaves the way the experimenter intends (11:210). This
process involved ensuring proper operation of the random
number generator, checking the mathematical equations for
accuracy and checking the program for logic errors (4:38).
The Q-GERT diagnostic program component assisted in the
* verification process by analyzing and describing all logic
errors as part of the simulation run.
Model Manipulation
The next phase consisted of determining the experi-
mental design and the method by which it would be executed.
"The experimental design selects a particular approach to
gathering the information needed to allow us to draw valid
inferences [11:1451." As indicated in Chapter I, the pur-
pose of this research is to evaluate the behavior of the
31
proposed material handling system under simulated normal
and surge operating conditions. To accomplish this pur-
pose, the simulation was conducted using two separate models.
The first model included normal operating conditions. This
means that the input variables were set at values which
were determined in the data analysis phase. The second
model utilized the same computer program with an increase
in the arrival rates of receipts, arrival rates of normal
issues, and arrival rates of reparable system issues. The
surge increase was believed to be appropriate for three
reasons. The first reason is that normal growth over the
next five to ten years could result in such an increase
in operations. Second, such a surge rate could be realized
during a period of conflict or war. Finally, the single
point storage concept, which would involve centralization
of all inertial guidance system inventories at Newark, could
result in such an increase.
Validation of the model, which ensures that the
behavior of the model agrees with that of the real system,
is a very important process (11:210). However, while vali-
dation is very important, it is also very difficult to do
precisely since "There is no such thing as the 'test' for
validity [11:291." The most obvious method to validate a
model is to statistically compare it to the real system
(11:227). Of course, in this research, that was impossible
since the real system does not exist. The researcher
32
,,q
therefore had to rely on his expertise and the knowledge
of the employees at Newark who were familiar with the
proposed system, and the supply system in general, for
validation of the simulation model. This researcher
believes that his knowledge of the proposed system greatly
enhanced the validation of the model since he was actively
involved in designing the new system (5:1). Shannon
(11:236) states that
I firmly believe that the professional judgementof the people most intimately familiar with the designand operation of a system is more valuable and validthan any statistical test yet devised.
The tactical planning phase consisted of the
resolution of two problems: (1) sample size, and (2) start-
ing conditions/equilibrium (11:31). The sample size is
important since it affects computer processing time and
the degree of statistical inference that can be obtained
from the model. The statistical testing procedure used in
*this study was the standardized normal test, which allowed
comparison of the mean values of the selected response vari-
ables obtained from simulation runs under both normal and
surge operating conditions. As will be discussed under the
model analysis section of this chapter, the standardized
normal test required sample sizes of at least 30. Thus, each
simulation model was run 30 times to meet the requirements
for the standardized normal test and to keep the computer
processing time low.
33
%.
The proposed system must be studied under a steady-
state condition because the start-up operation would cause
a distortion in the model. The real system would never be
in an empty or start-up condition after implementation.
Starting conditions that the researcher felt were typical
of the system's steady state condition were used in the
simulation. The stabilization period can be shortened
(but not eliminated) if the initial starting conditions
chosen are typical of the steady-state condition (11:184).
Model Analysis
Once the simulations were completed, they were
analyzed by comparing response variable statistics under
normal operating conditions to the respective statistics
obtained under operating conditions with an added surge
rate. The average and maximum sizes of queues for the
receiving area, storage area, issue documentation, and
distribution area, plus the stockpicker utilization factor
were compared for the two operating conditions. This com-
parison was done by testing for a significant difference in
the corresponding means. As mentioned before, a standard-
ized normal test was utilized in each test of means. The
standardized normal test is appropriate when the variances
of the population is unknown andthe sample can be assumed
to approximate a normal distribution (11:220). The sample
size of 30 allowed the researcher to invoke the central
34
I
limit theorem which states "For almost all populations, the
sampling distribution of x is approximately normal when the
simple random sample size is sufficiently large [8:202]."
If no significant difference was detected between the two
simulations, then they were analyzed as being equal. If
they appeared to be significantly different, they were
analyzed separately. In any case, the simulations were
analyzed to determine if the space allocated for queueing
of material in the identified areas was adequate. Accom-
plishing this meant equating the average and maximum amount
of material in a queue to a volume of space and then com-
paring this theoretical volume to the actual space allo-
cated in the layout design of the proposed system. The
utilization of the stockpicker was examined to ensure that
it never approached 100 percent. Although one wants to
utilize the material handling vehicles as much as possible,
a utilization rate much over 75 percent can be dangerous
because of queue build-up and vehicle maintenance require-
ments (13).
-' Summary
This chapter described the methodology used to
I analyze the proposed material handling system at Newark
AFS. A Q-GERT simulation computer model was developed
and used to study the proposed system. The results of the
simulation were analyzed in an effort to detect bottlenecks
and problem areas in the system.
35
CHAPTER III
DATA COLLECTION AND ANALYSIS
Overview
Data collected for use in this study were basically
of two classifications; the arrival rates of both receipts
and issues into the system, and server rates for the vari-
ous processes performed within the system. As indicated
in the last chapter, parameters such as queue configura-
tion, number of servers, and server discipline were func-
tions of the proposed system and, therefore, were defined
by the system design.
Arrival Rates
The arrival rate of trucks to the receiving area
was determined by random sampling the dock foreman's log
of shipments received. This sample of 1980 Fiscal Year
data was converted into 344 one-hour periods. A Chi-Square
Goodness of Fit test, with a significance level of .20,
revealed that the sampled data could be assumed to come from
a Poisson distribution with a mean of 1.82 truck arrivals
per hour. Since the Q-GERT language cautions against using
the Poisson distribution as an input parameter, it was
necessary to transform the Poisson into an exponential dis-
tribution. The mean of an exponential distribution is the
36
I F I M 1 1 .. . "-,.-- ,5 !: , • -
inverse of the mean of the Poisson distribution (8:157).
Therefore, the reciprocal of 1.82, or 33 minutes between
truck arrivals, was used as the input in the receiving por-
tion of the model. The Q-GERT language allows for the
establishment of minimum and maximum times between arrivals
to avoid unrealistic data generation by the simulations.
These minimum and maximum times were obtained from the
sampled data.
The management information system that provided a
source of data for most of this research, tracks warehouse
transactions in the form of line items. A line item simply
refers to a single line entry in the supply inventory sys-
tem. In order to maintain a commonality of measurement
for variables and parameters in the model, the truck
arrival rate had to be adjusted to represent a line item
arrival rate. This was accomplished by comparing the
number of line items processed by the receiving function,
during a specific period, to the number of truck arrivals
for the same period. The number of line items processed
during the period previously sampled was obtained from the
Daily Base Supply Management Reports. The data from the
two-month period revealed that each truck arrival resulted
in the generation of 25 line items in the receiving section.
The dock foreman's log revealed that for the
sampling period, the truck transporting reparable systems
to AGMC arrived at approximately the same time each day.
37
Further, the Transportation Section advised that this truck
was scheduled to arrive at 1200 hours every day. This
scheduled arrival time enables the same truck to be
utilized for transporting both reparable systems to Newark
and serviceable systems from Newark to Wright-Patterson
AFB for entry into the air transportation system. The
sampled data indicated that each truck arrival generated
80 reparable systems to the supply warehouse. Since the
arrival of the truck carrying reparable systems was deter-
mined to be a scheduled or controlled variable, its arrival
in the model was also controlled. The arrival rate of
reparable systems was normally distributed around 1200
hours each day. The minimum and maximum constraints were
Pet at 1100 hours and 1300 hours respectively. Each truk
arrival constituted the input of 80 reparable systems into
the model.
Normal issues, which are computerized requests
from external sources for material other than reparable
systems, had to be separated into two groups because of
differences in arrival rates. While the arrival rate for
normal issues generally followed a random distribution,
those issues generated by the Bench Stock Section were
found to be controlled.
The arrival rate of normal issues was determined by
a simple random sample of the 1980 Fiscal Year Single Line
Item Release/Receipt Documents (DOD Form 1348-1) in the
38
'- . " ! !!! ' ' I'I"I ' I 1' : :: , ; ;: . , - , ,,, ' r',---
storage area. A Chi-Square Goodness of Fit test, with a
significance level of .20, indicated that the arrival rate
of normal issues could be assumed to come from a Poisson
distribution with a mean of 18.75 issues per hour. Again,
it was necessary to transform the Poisson distribution
into an exponential distribution for use in the Q-GERT
model. The transformation resulted in a rate of 3.2
minutes between arrivals of normal issues in the storage
area. The minimum and maximum times between arrivals were
taken directly from the sampled DOD Form 1348-is.
The random sample of DOD Form 1348-Is also indi-
cated that bench stock issues were received as a group on
specific days. This resulted from the method used by the
Bench Stock Section to process issues. For the simulation
model, the arrival of bench stock issues was considered a
controlled variable. The model reflected the fact that an
average of 250 bench stock issue requests arrived at the
storage area at the start of the work day on Tuesday,
Wednesday, and Thursday of each week.
The method of requesting reparable systems for
the production repair process was also determined to be a
controlled process. The random sample of DOD Form 1348-is
revealed that an average of 80 reparable system issues were
received simultaneously in the storage area, at a specified
time each day. Therefore, an input of 80 reparable system
39
n.7.'
issue requests at 0900 hours daily was constructed into
the model.
In conjunction with the arrival rates of material,
the flow of transactions or line items through the model
was divided at specified points by various functions of
the warehouse process. A random sample of both the Daily
Base Supply Management Reports and the DOD Form 1348-1s
for Fiscal Year 1980 supplied information which enabled
the divisions or model branching designs to be quantified.
For example, it was determined that 15 percent of all
receipts require inspection while the remaining 85 percent
do not. The Q-GERT model presented in Appendix B illus-
trates all the branching designs, which were calculated in
the same manner.
Server Rates
In the simulation model, the times required to per-
form warehousing functions or processes by either the ware-
housemen, inspectors, or mechanized devices are represented
by server rates. These server rates were developed by
three basic methods. First, if the current process would
be unchanged in the proposed material handling system, the
present labor standard for that process was used as the
server rate in the model. If the process had no present
labor standard, then one was developed using time study
methods. Secondly, when the proposed warehousing system
40
-i--- .
radically changed a process, a labor standard was developed
using synthetic measurement techniques such as Methods-
Times-Measurement (MTM). Finally, in some instances,
especially those dealing with mechanized processes, the
server times were calculated by examining manufacturer's
specifications for equipment or by interviewing knowlede-
able people in the material handling and warehousing fields.
The statistical foundation of labor standards
allows the server rates to be represented as normal dis-
tributions with the mean equal to the average server time.
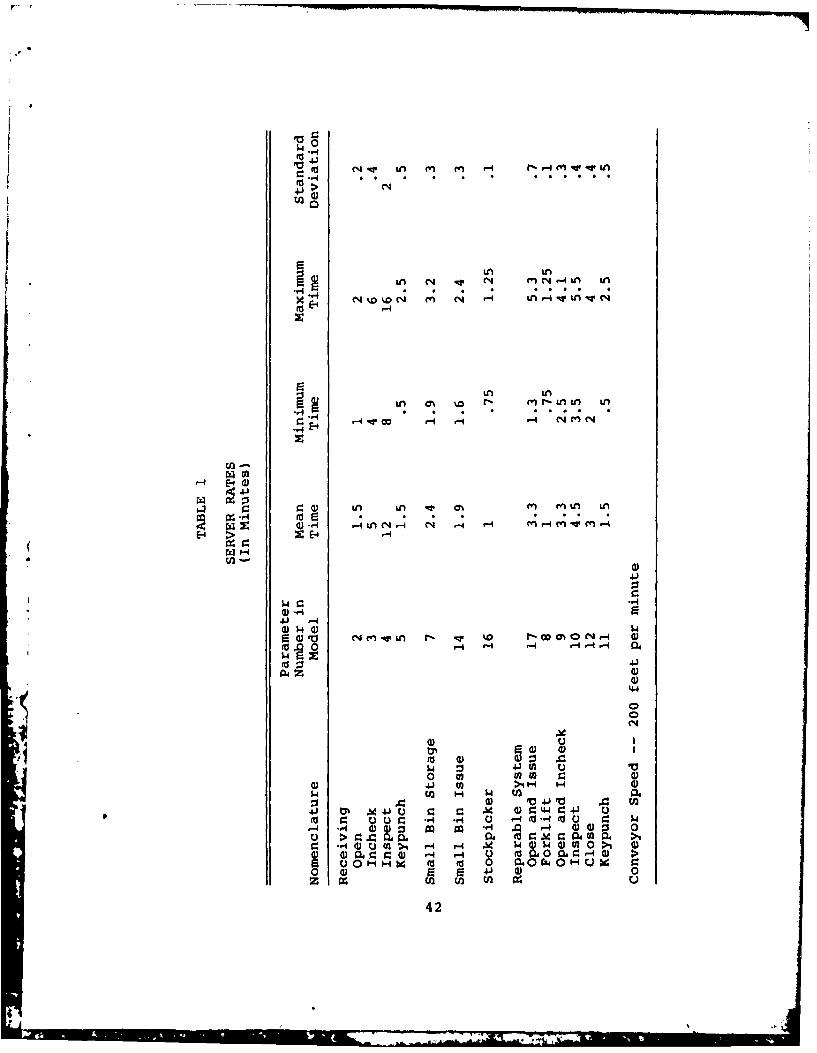
Table 1 presents the server rates for the model. As an
example of server rate calculations, a time study indicated
that the time required to inspect a reparable system is
4.5 minutes with a standard deviation of .4 minutes. The
minimum and maximum times were extracted from the time
study data. As another example of server rate determination,
the manufacturer's specifications indicated a storage/
retrieval rate of 60 items per hour for the wire-guided
stockpicker. This rate was transformed into a rate of one
item per minute for input in the model. The minimum and
maximum times were engineering estimates developed by the
designers of the material handling system. This server
rate was used for all the stockpicker's functions in the
model; storage and retrieval of reparable systems and
storage and retrieval of large bin items.
41
.4.,Mom
4J'
C,4,
4J(' > ' ~ . ~ r
5Ln Ln
LA ~ t O~~(~ (tzlu) L
V Go r-~4 .-4 -I (1 (n N
E~E-4
O) LA LA qc. 0% (n (n tn LA
4)-
A4O'O'J- a)(4-4
am
E 4) a)
Ul H
0P CD WU) 0 a)M. 4 )4
u~~~ 0 ( a 0 H4 H Qw C
$42
Lu~ .. U Lu~LMR $
Summary
As indicated, the majority of data collected came
from random sampling of the supply management information
system. Even though this data was statistically sound, the
findings were presented to the respective section super-
visors for agreement or rebuttal. This effort, actually
a part of model validation, was accomplished in order to
include the eventual model users into the design process
and increase their confidence in the model and its results.
4
43
,oq
CHAPTER IV
MODEL FORMULATION AND MANIPULATION
The proposed model of the material handling system,
with the calculated input data parameters, was translated
into a Q-GERT network and subsequently coded into a Q-GERT
computer program in order to proceed with the simulation
process. The network and computer program are contained
in Appendices B and C, respectively. The interested
reader is referred to Modeling and Analysis Using Q-GERT
Networks, by A. Alan B. Pritsker, for a detailed explana-
tion of the network symbols and associated computer-coded
statements.
Validation
After developing the computer program, an experi-
mental run was made to verify the simulation model. No
errors were detected in the program and the program was
determined to be an accurate representation of the Q-GERT
network; therefore, the model was considered verified.
A meeting was conducted, at this point in the pro-
cess, with the principle users of the simulation model for
the purpose of validating the model. It was felt that
validation at this time would prevent errors and repetition
in the experimental testing and analysis phases of the
44
_7_671
research. In attendance at this meeting were the Deputy
Chief of the Supply Division, the Chief of Warehouse Opera-
tions, the Chief of the Storage and Issue Section, and
two industrial engineers, all of whom were responsible for
the system's design. Areas of discussion were network and
model logic, server and arrival rates, parameter defini-
tions, and model objectives. Acceptance of the model by
the principle users in attendance at the meeting consti-
tuted model validation.
In addition to the validation process, major bene-
fits are derived from the participation of the users of
the model in the simulation model development and evalua-
tion process. Top management involvement is a key factor
for successful implementation and use of management science
models since these managers control the resources withinI1
the system's environment. The line managers, who are
most familiar with the material handling system, can insure
that the model captures the real system. As mentioned in
Chapter III, this form of validation increases the users'
confidence in the simulation model and its results.
Model Manipulation
It is apparent that the real mater.ial handling
system will never be empty or in a start-up condition
ISee B. W. Holz and J. M. Wroth, "Improving StrengthForecasts: Support for Army Manpower Management," Interfaces,Vol. 10, No. 6 (December 1980), for a discussion of key fac-tors necessary for implementation of management science models.
45
after implementation. This fact necessitated experi-
mentally determining an equilibrium/start-up condition in
order to study the system under realistic conditions. This
was accomplished by running the simulation model a total of
ten times, with each successive run being extended for a
longer period of time. Two specific queues were analyzed
because of their critical interaction with the entire net-
work. The average number of items in each queue was
plotted against the respective computer run time length
(Figure 7 and 8). It is observed that a stable state is
not reached until the 3000th time unit. Therefore, in
order to obtain a representative sample for experimental
testing, the model was run for a simulated 5400 time units,
with the first 3000 time units used to reach a steady state
condition, and the last 2400 time units used to generate
data for the analysis. Each time unit in the simulation
represented one minute of real time in the proposed system.
The experimental design of this research included
evaluating specified system variables under both normal
and surge operating conditions. This design involved test-
ing two models; one with the input variables set at the
normal rates as determined in the data collection and
analysis phases, and the second model run under surge con-
ditions, that is an increase of 25 percent in the input
variables. The surge rate model, besides providing infor-
mation on future workloads as mentioned in Chapter II, also
46
0
ra0)
0
-P4
474
0
o ca00
03
4
0
0
0 a04
OD %0N -4'
olo48.
represents a sensitivity analysis. The sensitivity
analysis, which consists of systematically varying the
values of input variables and observing the effect upon
the model's response variables, is important for three
reasons. First, it will demonstrate how sensitive the
model results may be to the parameter values used. This
is another aid in the model validation process. Second,
sensitivity analysis, in the form of varying the input
values, can give an indication of the impact of management
decisions if the external environment changes. Finally,
presenting management and/or the system users with the
results of the sensitivity analysis will usually have a
very positive psychological effect insofar as obtaining
acceptance of the results. The mere fact that we have
explored the sensitivity of the model results to changes
or errors in parameter estimates, will help reassure the
user of the thoroughness of the study (11:235-236).
The input variables that reflected the 25 percent
increase in the surge model, were the arrival rates of the
trucks to the receiving area, the arrival rates of repar-
able systems to the receiving process, and the arrival
rates of normal, bench stock, and reparable system issues.
Since the arrival of reparable systems to receiving, the
arrival of reparable system issues to storage, and the
arrival of bench stock issues to storage were all deter-
mined to be under a controlled process and occur
49
06L-, 'aiCL.W - 1-"! !' 1111 "i I II] I '1 ' - "' .7 :' " ",
simultaneously in the warehouse system, the change in the
surge value of each variable merely reflected a 25 percent
increase. To reflect the surge operating conditions in
the simulation model, the number of reparable systems
entering the receiving process, the number of reparable
system issues and the number of bench stock issues were
increased from 80, 80, and 250 to 100, 100, and 312 respec-
tively.
The exponential distributions which represented
the arrival rates of trucks to receiving and normal issues
to storage were first transformed into the original Poisson
distribution. The mean of the Poisson distribution was
then increased by 25 percent for both variables and
finally, the increased distributions were transformed back
into exponential distributions for input in the surge model.
The new values of the arrival rates of trucks to receiving
and normal issues to storage were 26 minutes between truck
arrivals and 2.6 minutes between normal issue arrivals,
respectively.
The two models used in the experimental design of
this research contained one variation from the proposed
material handling system. The parameter which defined the
number of parallel servers at the inchecking station of
the receiving function was established as 5 by the original
system designers (5:137). This parametric value, when
placed in the surge model, prevented the computer program
50
from running successfully. The author was unable to deter-
mine if the queue influenced by this parameter in the model
was actually exploding or if the interval data collection
system of the Q-GERT language package was simply being over-
loaded. In order to correct the deficiency and provide
comparative data for the experimental testing, this parallel
server parameter value was set at six for both the normal
and surge models.
51
p5
CHAPTER V
RESULTS AND CONCLUSION
Analysis Overview
The two simulation models, representing normal and
surge operating conditions, were analyzed in two phases.
The first step was to determine if there was a significant
difference between the values of the response variables in
the normal and surge models. A test of means using the
standardized normal test accomplished this step. If there
was a significant difference, the models were analyzed
separately in phase two, otherwise they were analyzed as
being equal. The second phase of analysis pertained to
determining if the allotted space for the queueing of
material in the proposed material handling system was ade-
quate. In addition, the utilization of the stockpicker
was examined.
Normal and Surge Operating Conditions
The test statistics used in the comparison of the
normal and surge operating conditions can be found in
Table 2. The means of the response variables generated
by the 30 Q-GERT simulations for the normal and surge
operating conditions are contained in columns two and three
of Table 2, respectively. The first column of Table 2
52
.4J 4J m ~a r. ~ . en 0
.41 .-4 C~4 C~ -4 C4 1 Ln t
'A
o oH 4JA L a r v LE- v A L r- M ON0 IH ul 0m n W c
o r- 0 0; 4
cd U LM
>0
0a
0 9 -4
E- . . * * *
0 r- m~ e'4 0W 0 '. '
Ln
zn
H :
U)
Q)
.04)
4J OHHX iii z 0 Wi
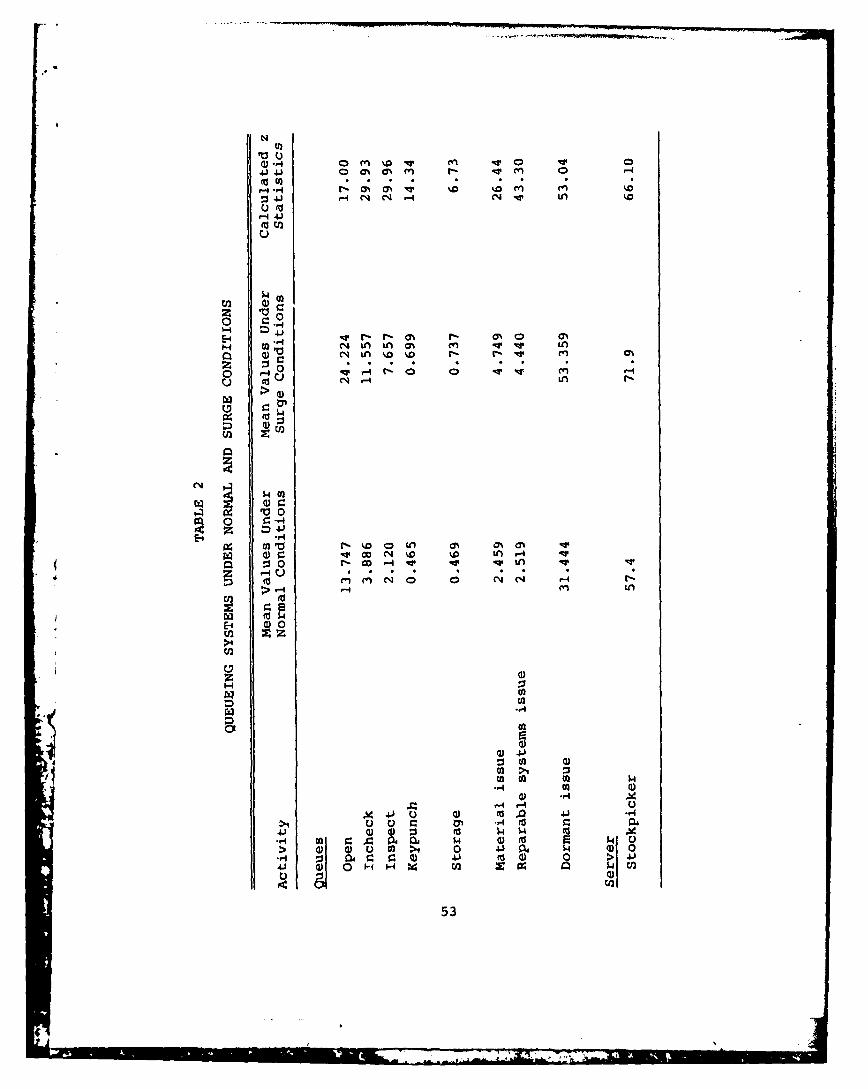
defines the response variable or activity. The first four
queues pertain to the receiving process. The storage
queue contains material being conveyed from the receiving
area into the storage area. The material and reparable
system issue queues represent the movement of material from
the storage area into the central distribution area. The
document issue queue refers to the build-up of computer
generated issue requests for processing in the storage area.
The only server rate under analysis was the wire-guided
stockpicker.
The means of the response variables indicate the
average amount of material in the queues or, for the server
rate, the average percentage of time the server was utilized.
For example, there was an average of 3.886 line items in
4the inchecking queue under normal conditions and 11.557
line items in the same queue under surge conditions.
Also, there was an average of 31.444 issue requests await-
ing processing under normal conditions in the document
issue queue, and 53.359 issue requests under surge condi-
tions. The stockpicker statistics reflect an average
utilization rate of 57.4 percent during normal conditions
and 71.9 percent utilization during surge conditions.
The fourth column of Table 2 reports the calcu-
lated standardized normal z statistics used in the hypo-
thesis testing procedure. This statistic was calculated
using equation 1 when the sample variances of the two
54
MIL:
groups were considered equal and equation 2 when the sample
variances were not considered equal (11:220).
z - 1 2 (Eq. 1)sn2 + n 2 /
z 1 X 2 (Eq. 2)
2 2
\n1-l 2
where:
x = sample mean;2s = sample variances; and
n = sample size.
To determine if the sample variances of the two
models' response variables were equal, the F statistic was
used (11:221). The null hypothesis was that the mean
response variable for each queue or server activity of the
normal model was equal to the respective mean response vari-
able of the surge model. The alternate hypothesis was
that the mean response variables were not equal. The test-
ing procedure involved comparison of the calculated z values
to the critical z value with a significance level of .05.
Since this is a two-tailed test, the tabled critical z
value is 1.96 (11:373). If the calculated value of z is
less than the critical value of z, then the null hypothesis
55
is not rejected. If the calculated value of z is equal to
or greater than the critical value of z, then the null
hypothesis is rejected. Mathematically, this would be
stated as:
H0 xi =x 2
H: 1 x 1 x 2
decision rule:
If z < z*; fail to reject H0
If z > z*; reject H0
where: z* = critical z at .05 level of significance.
In all cases, the null hypothesis was rejected and, there-
fore, the 25 percent increase in normal operating condi-
tion was considered to cause a significant change in the
* behavior of the system.
Queue Analysis
The mean statistics in Table 2 are important to
management because the average build-up of material in
the specified queues and stockpicker utilization constitute
the expected system's behavior for the majority of the time.
The uncertainty that is present with implementation of the
new system can be greatly reduced by understanding the
system's behavior as it will be for the majority of the
time. Equally important, the proposed system must be able
to adapt to the periods of time in which there are maximum
56
I~~~~~~~~~ . . ... . .. ...- - | !
build-ups at queues and strains on the server utilization.
If the system can cope with these periods of intensity,
then obviously, it can cope with the average periods of
operation.
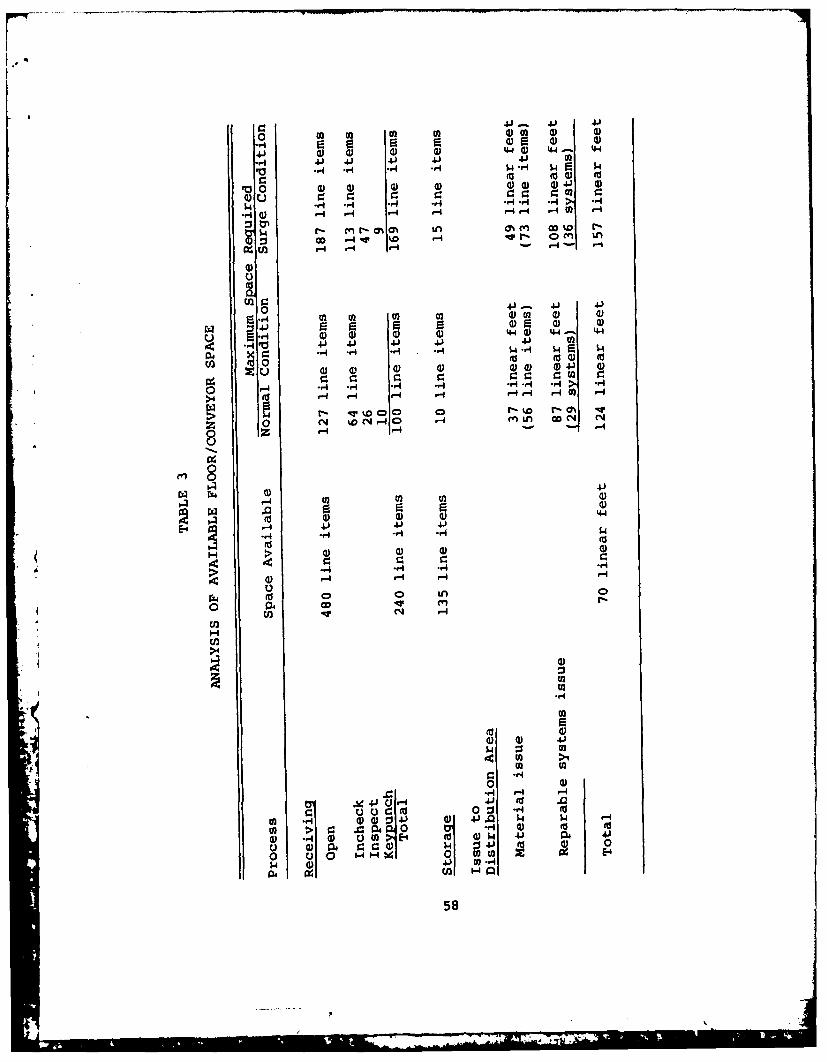
The second phase of the analysis involved com-
paring the material queueing space allocated by the system
designers to the maximum amount of space required at any
one time for material queueing as reported in the Q-GERT
simulations. Since a significant difference was found
between the two models, they were analyzed separately.
The allocated space for material queueing was determined
by converting line items into pallet floor space and
linear feet on conveyors or vice versa, depending on the
process being analyzed. Table 3 shows these calculations
and information on maximum space required as generated by
the Q-GERT simulations that were used in the analysis.
A random sample of the present material handling
system indicated that an average of three line items can
be placed in one tote pan. Each tote pan, which will also
be utilized in the proposed system, occupies two linear
feet of conveyor space. This information determined the
conversion factor of three line items per two linear feet
of conveyor. The random sample also indicated that an
average of 20 line items can be placed on a standard
pallet (40"x48"). A reparable system, in its shipping con-
tainer, occupies three linear conveyor feet. These
57
j. l. 4 41
or 4.) 4-) 4.) U) -)'-4 a)- 14 ig $
4~( to a) a d4) w.. '.4)4) 4) W 4J U
'0*-4 *. 4 .. 4 4 r- -
'00o %D 0) (n a)aa) G4)
E-4 r.1 'J - r4 4-)
0
0 0 4) .4)a) (D 44 U a) a4- 44
C ~ v 44) V) )
z L)4- V) 0) 0 344) 44
r-4 X ~ ~ -4 '-4 rq - 44q- >-4 -40 P-4 'U I CU ) r-4
04 r- 'd I d - pqd4~4~
0-. 4- % 4 r-.4 4-C4- r-4U 4-4NC~
0 z -4 0-4 -
4)
f-4 WU )0rz0 44
4-4 V) 4.) 41
-4 r4 r4- $4-
>) r- -4 -.4
4-4
0 w (nU)
.4
'U 0
1.4 w U
0 0
0 H
U) A) :,U04
1) O ) wU 0)3 V ) (d0 00 UU w E4
58
statistics, when combined with the information on space
availability taken from the proposed system design draw-
ings, provided the calculations represented in the Space
Available column in Table 3 (5:58).
The statistics from Table 3 indicate that no prob-
lem in queueing space is present, under either the normal
conditions or the surge conditions, for the receiving area.
There is space available for 480 palletized line items wait-
ing to be opened in the receiving area. The simulations
indicate that the expected maximum amount of line items in
this area is only 127 and 187 for normal and surge operating
conditions, respectively. The receiving area, consisting of
the incheck, inspect, and keypunch activities, has a con-
veyor capacity of 240 line items and an expected require-
ment for only 100 line items under normal conditions and
169 line items under surge conditions. The expected maxi-
mum requirement for line items moving from the receiving
area to storage is 10 line items under normal conditions
and 15 line items under surge conditions. There is no
apparent space problem in this area either, since there is
a space available for 135 line items.
Material and reparable system issues, moving from
storage to the central distribution area, does appear to
present a potential problem situation. There is a capacity
for 70 linear feet and an expected maximum requirement
of 124 linear feet during normal conditions and 157 linear
59
feet during surge conditions. This inadquate space avail-
ability creates a bottleneck on the conveyor. Further
investigation, however, provides the insight that this
bottleneck is intermittent and temporary. The situation
occurs at the electric eye-gating mechanism as shown in
Figure 4. At this gate, reparable systems are sent straight
ahead and other issued material is diverted to the right
for temporary storage in shelves, awaiting distribution to
production areas or to other base activities. Once past the
gate, the reparable systems enter a queue to be removed from
their containers and issued to the production area. This
reparable system queue has a maximum capacity of nine sys-
tems and once the maximum is reached, the gating mechanism
is blocked. This blockage of the gating mechanism develops
because of the simultaneous issuing of 80 reparable systems
once a day. As seen in Table 2, the average queue size in
this area is 2.459 line items under normal conditions and
4.749 under surge conditions for the majority of the time.
Therefore, a bottleneck situation occurs only once a day
at a specific time. The labor standards, developed for
the removal of the reparable systems from their container
and subsequent issue to production, indicate that the 80
systems can be processed in approximately two hours. Thus,
the bottleneck situation has a probability of occurring only
during a specific, two-hour period. Management awareness
of this potential problem area will allow them to plan
60
'J "'" I'11 I I P l'q - -- - -" ..... q ',
accordingly. They might chose to schedule around the bottle-
neck, revise the proposed material handling system to cor-
rect the situation, or add warehousemen to this area to
decrease the reparable system issue process time.
Server Utilization Analysis
The proposed system designers established a utili-
zation rate of 60 percent for the wire-guided stockpicker
to allow for preventive maintenance, unscheduled main-
tenance, and utilization in other areas. The 57.4 percent
utilization rate, as seen in Table 2 for simulated normal
conditions, is within the established standard. However,
the standard is exceeded during surge operating conditions.
Therefore, during anticipated surge conditions, management
must be aware that preventive actions must be taken or the(*stockpickers will not function as desired. Such actions
could be the temporary or permanent acquisition of a
similar piece of equipment, rescheduling of vehicle main-
*! tenance, or using conventional material handling equipment
in place of the stockpicker when applicable.
Conclusion
The purpose of this research was to study the
behavior of a proposed material handling system under simu-
lated operating conditions in order to gain information
on the system's operating characteristics. The experimental
design of the study was used to analyze specific response
61
.p
variables under both normal and surge operating conditions.
This analysis was conducted using Q-GERT computer simula-
tion models.
The analysis determined that a 25 percent increase
in operating conditions has significant effects on the
proposed system and its components. Problem areas were
identified in the queueing of material and reparable sys-
tems issues, and in the stockpicker utilization rate under
surge operating conditions. It is the author's opinion
that these two problem areas should be addressed by manage-
ment and further research in each area should take place
before the proposed material handling system is imple-
mented.
While the research objective has been reached,
the author feels that the warehouse simulation model is
still a useful tool for management. It has many possible
future uses for management planning and decision making.
With minor modifications, the model could be used to
analyze further modifications and additions to the ware-
housing process such as: additional wire-guided stockpicker
routes, modified storage location layouts, changes in com-
puter input/output transfers, and automated storage and
retrieval systems.
62

APPENDICES
63
APPENDIX A
GLOSSARY OF TERMS
64
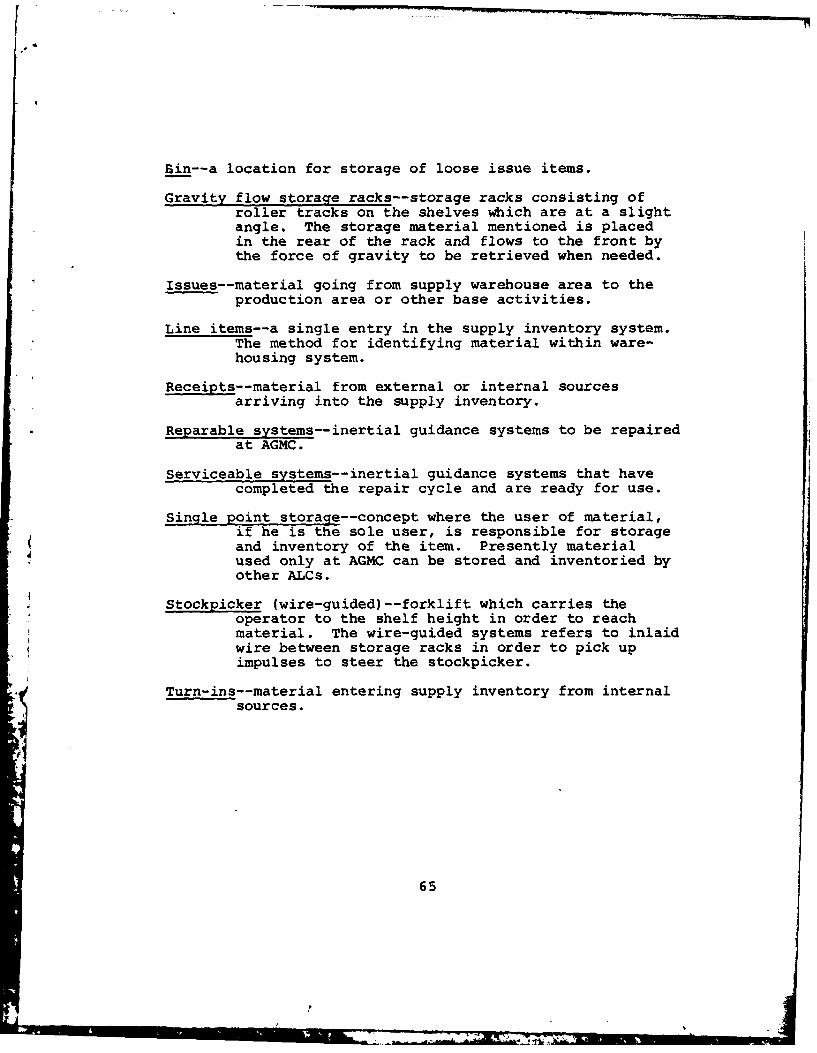
Bin--a location for storage of loose issue items.
Gravity flow storage racks--storage racks consisting ofroller tracks on the shelves which are at a slightangle. The storage material mentioned is placedin the rear of the rack and flows to the front bythe force of gravity to be retrieved when needed.
Issues--material going from supply warehouse area to theproduction area or other base activities.
Line items--a single entry in the supply inventory system.The method for identifying material within ware-housing system.
Receipts--material from external or internal sourcesarriving into the supply inventory.
Reparable systems--inertial guidance systems to be repairedat AGMC.
Serviceable systems--inertial guidance systems that havecompleted the repair cycle and are ready for use.
Single point storage--concept where the user of material,if he is the sole user, is responsible for storageand inventory of the item. Presently materialused only at AGMC can be stored and inventoried byother ALCs.
Stockpicker (wire-guided)--forklift which carries theoperator to the shelf height in order to reachmaterial. The wire-guided systems refers to inlaidwire between storage racks in order to pick upimpulses to steer the stockpicker.
Turn-ins--material entering supply inventory from internalsources.
65
APPENDIX B
Q-GERT NETWORK
66
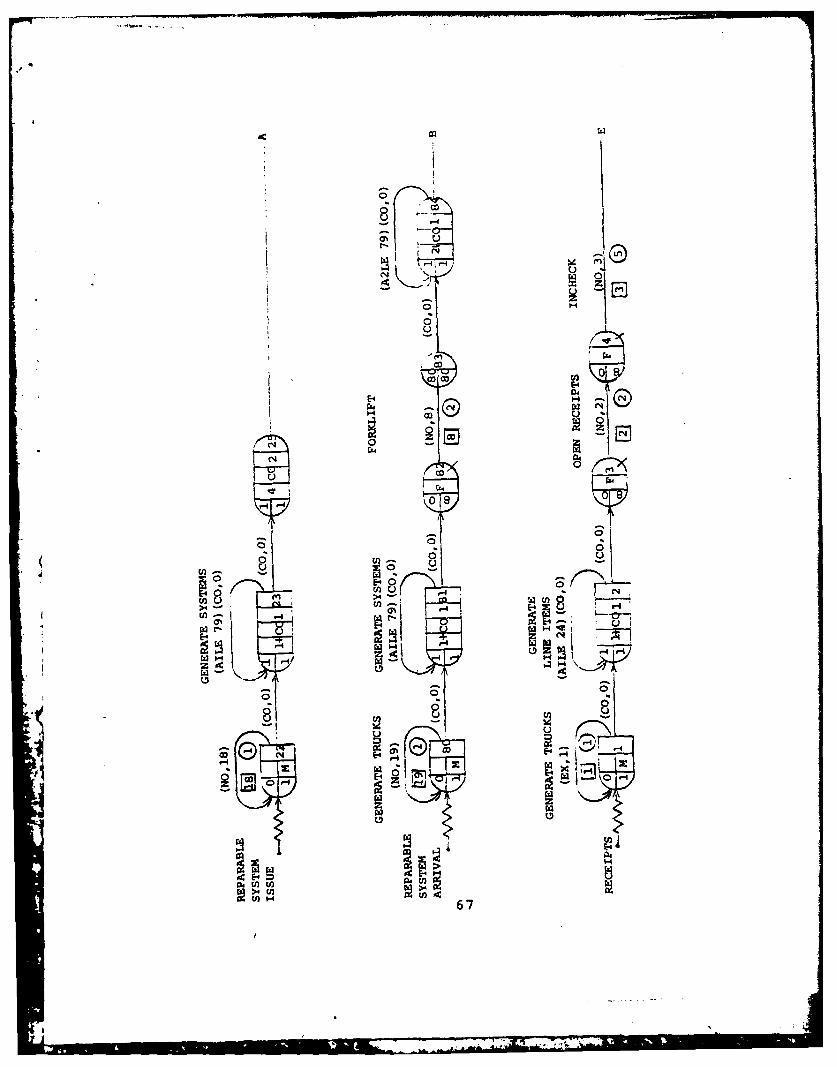
co 1 (1 cn
00
Dw
08
00
Cfl 0(n -~
00
0a 0 C
'.4E-4
0- E-4 9
E~04
cn 67
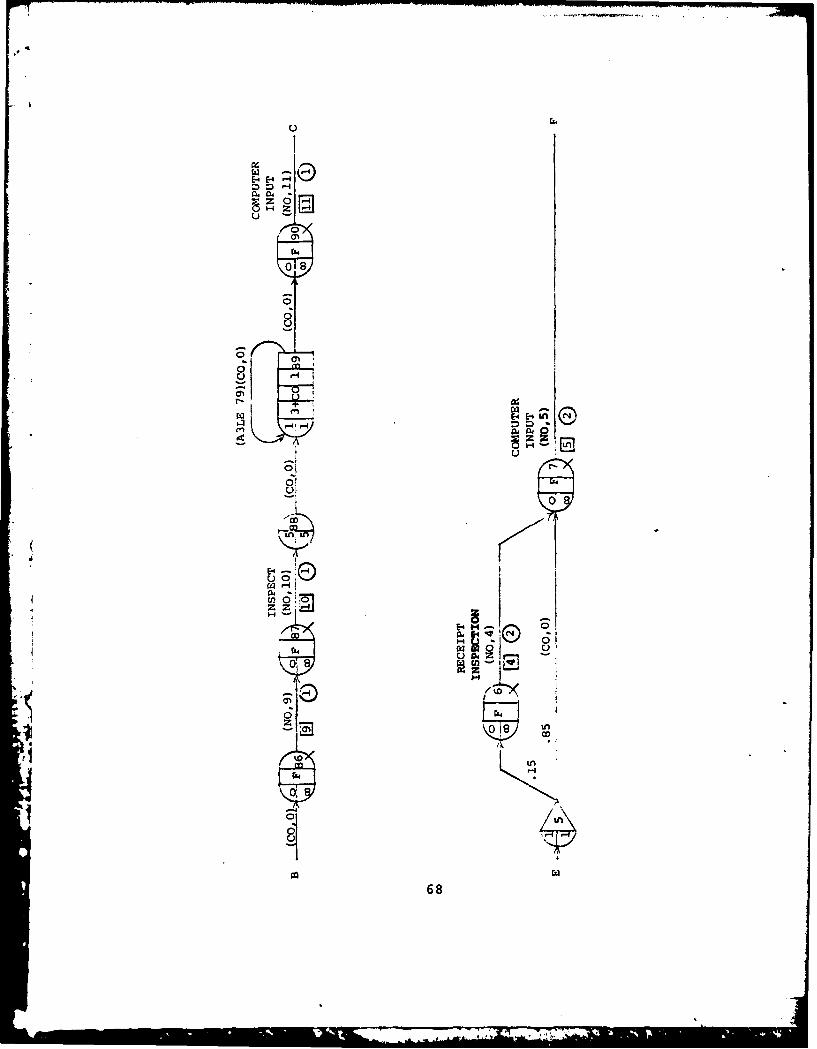
- E
H) z
0
C-)
z* Z
CD-
L) z
0 44
00
P4 -
68
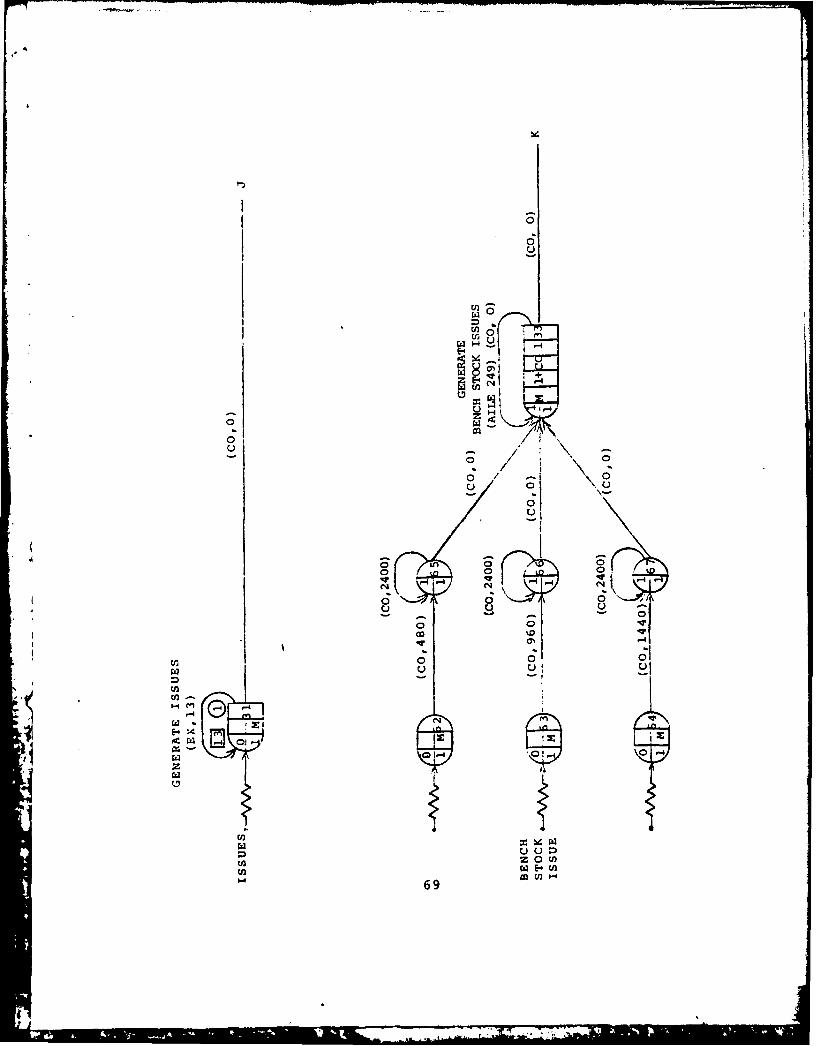
~o
z~i-
r= " '-4
00
U 0/ 0,
o V
0 0
-4*-4
o 0 130
0n 0
'n.
U2
-~ q.
t, W E-C(n
H 69W
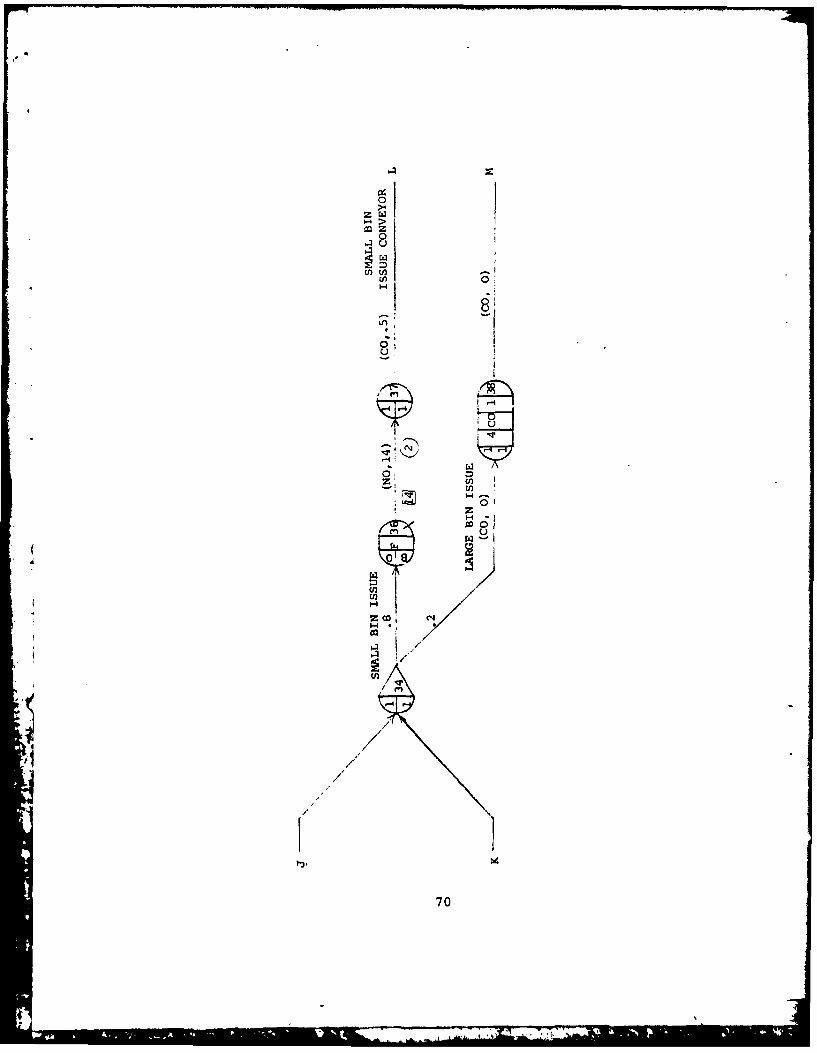
HH.
70
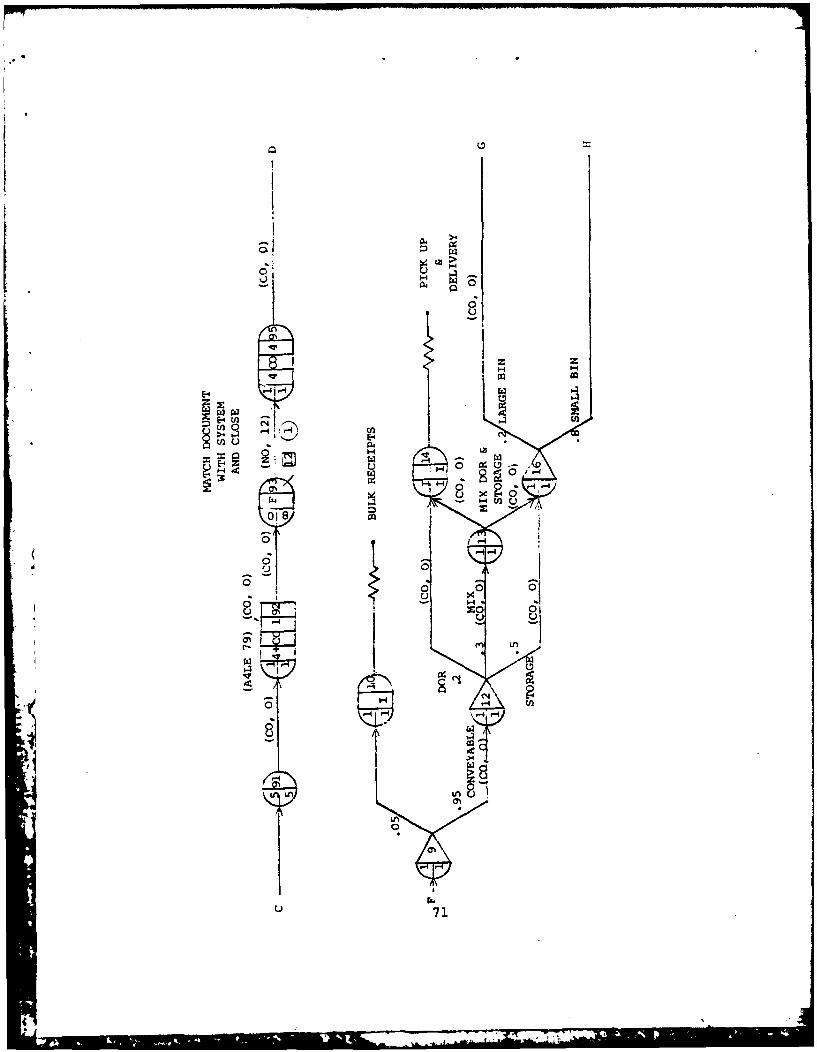
La >014
0
z z
(U) 04 'H La
D4 En L
l-0
0
0 60u o)z
U'
4:w
Lnn
u 71
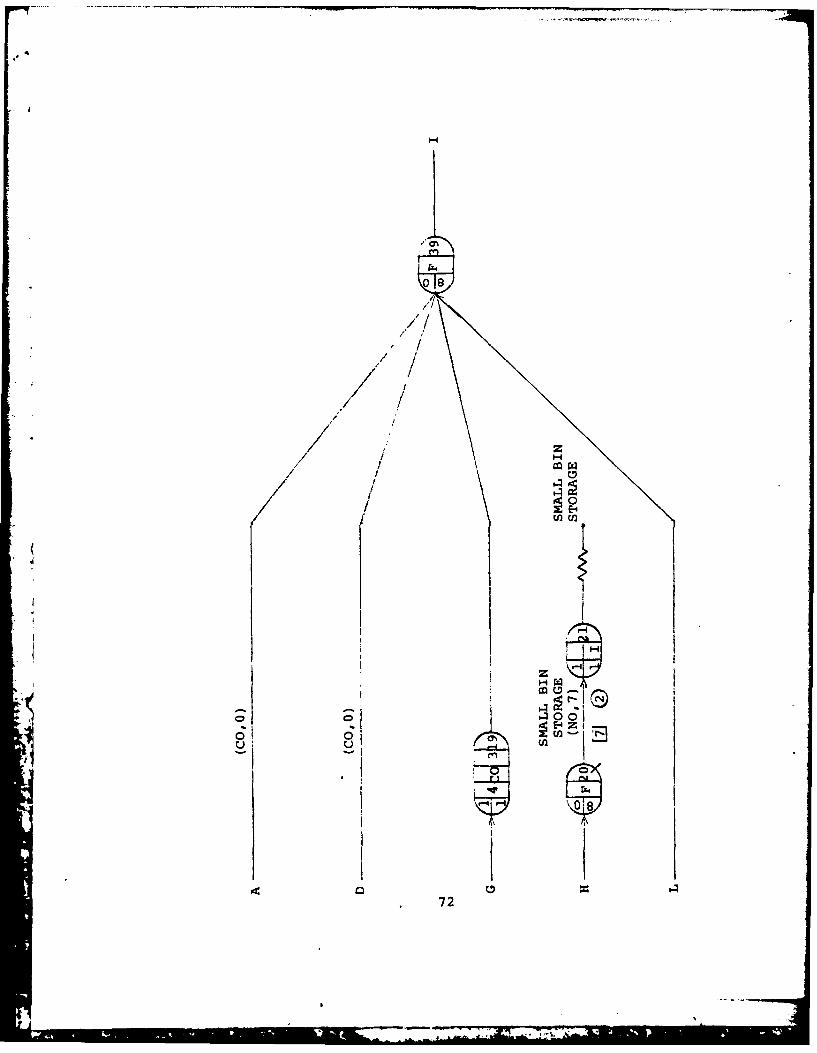
/00
E-/
mI
0.
72
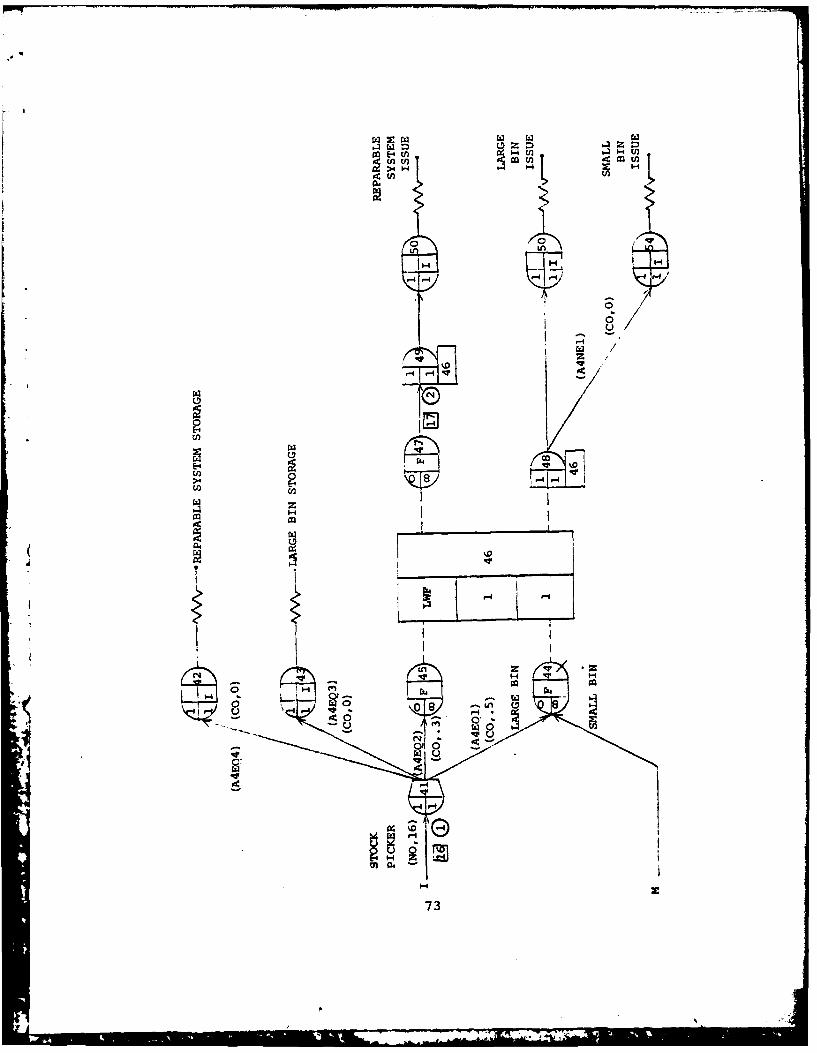
>-4
040
00
10
In 0
C4
U) IEj4c73
-: i
APPENDIX C
Q-GERT SIMULATION PROGRAM LISTING
7
I
7,4
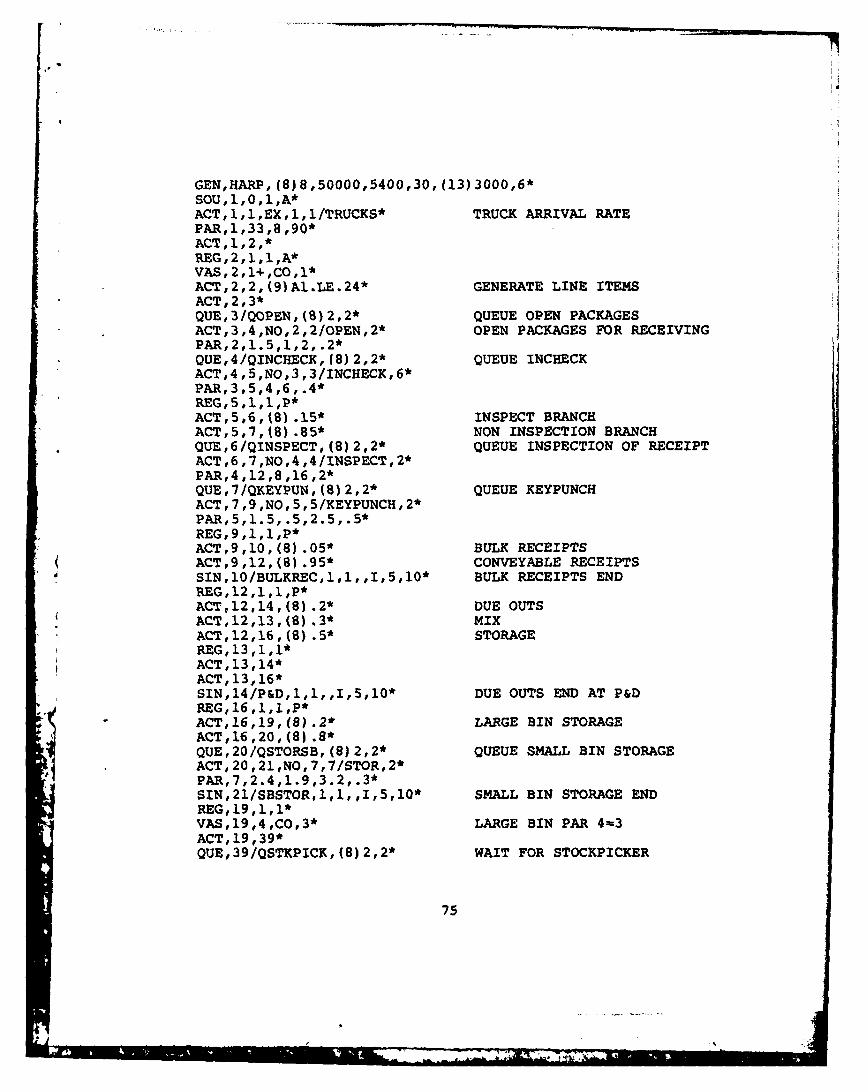
GEN,HARP, (8)8,50000,5400,30,(13)3000,6*SO, 1,0 ,1, A*ACT,1,1,EX,l,1/TRUCKS* TRUCK ARRIVAL RATEPAR, 1,33 ,8 ,90*ACT, 1,2, *REG, 2,1,1,A*VAS,2,14,Co,l*ACT,2,2,(9)AI.LE.24* GENERATE LINE ITEMSACT,2,3*QUE,3/QOPEN,(8)2,2* QUEUE OPEN PACKAGESACT,3,4,NO,2,2/OPEN,2* OPEN PACKAGES FOR RECEIVINGPAR,2,1.5,1,2, .2*ODES 4/QINCHBCK, (8) 2,2* QUEUE INCHECKACT,4, 5,NO,3 ,3/INCHECK, 6*PAR,3,5,4,6,.4*REG,5,1,1,P*ACT,5,6,(8).15* INSPECT BRANCHACT,5,7,tB).85* NON INSPECTION BRANCHQuE,6/QINSPECT,(8)2,2* QUEUE INSPECTION OF RECEIPTACT,6 ,7,NO,4 ,4/INSPECT,2*PAR,4,J.2,8,16 ,2*QUE, 7/QKEYPUN, (8) 2,2* QUEUE KEYPUNCHACT, 7,9,NO, 5,5/KEYPUNCH, 2*PAR, 5,1. 5, .5,2. 5, .5*REG,9,1,1,P*ACT,9,10,(8).05* BULK RECEIPTSACT,9,12,(S).95* CONVEYABLE RECEIPTSSIN,10/BULKREC,1,1,,I,5,10* BULK RECEIPTS ENDREG,12,1,1,P*ACT,12,14,(8).2* DUE OUTSACT,12,13,(8).3* mixACT,12,16,(S).S* STORAGEREG,13,1,1*ACT ,13 ,14*ACT ,13, 16*SIN,14/P&D,1,1,,I,5,10* DUE OUTS END AT P&DREG,16,1,1,P*ACT,16,19,(8).2* LARGE BIN STORAGE"IAPCT, 16, 20, (8) .8*QUE,20/QSTORSB,(8)2,2* QUEUE SMALL BIN STORAGEACT ,20 ,21,NO ,7, 7/STOR ,2*PAR, 7,2 .4 ,1.9 ,3 .2, 3*SIN,21/SBSTOR,1,1,,I,5,1O* SMALL BIN STORAGE ENDREG ,19 ,1, 1*VAS,19,4,CO,3* LARGE BIN PAR 4-3ACT ,19 ,39*QUE,39/QSTKPICK, (8) 2,2* WAIT FOR STOCKPICKER
75
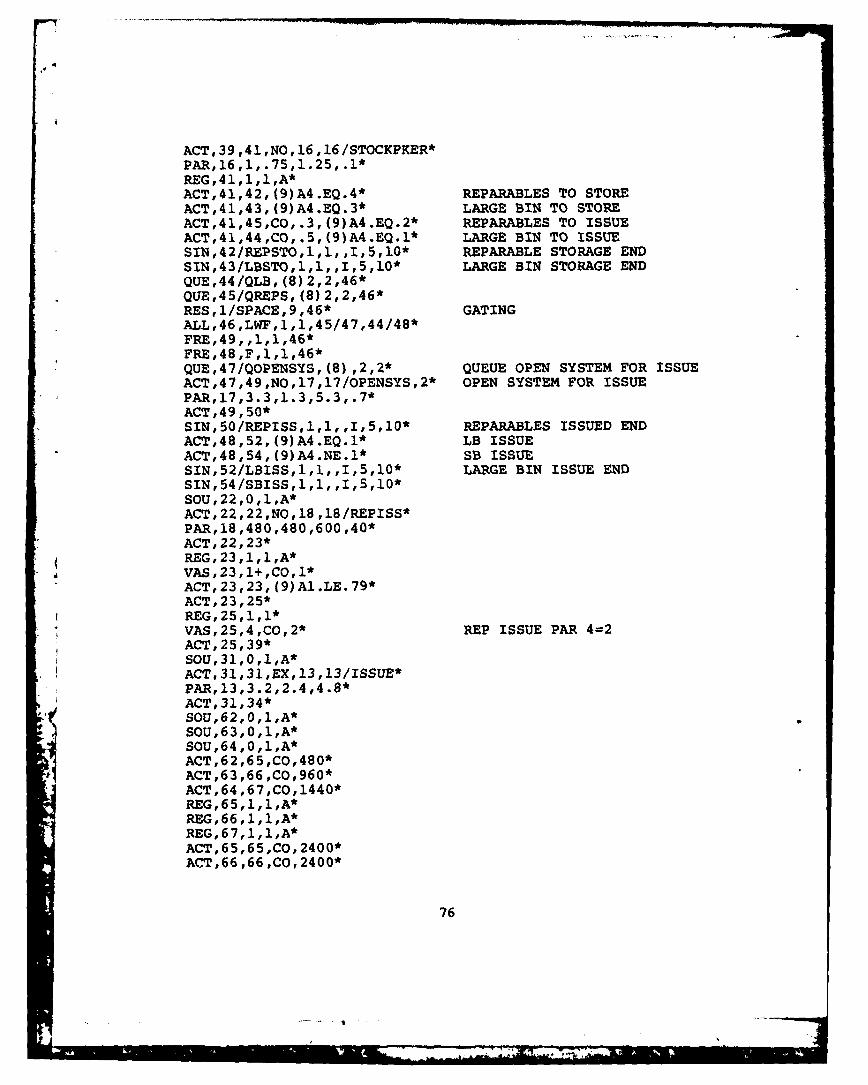
ACT.39 ,41,NO,16 ,l6ISTOCKPKER*PAR, 16 ,1,.75,1. 25,.1*REG, 41 ,1 ,1,A*ACT,41,42,(9)A4.EQ.4* REPARABLES TO STOREACT,41,43,(9)A4.EQ.3* LARGE BIN TO STOREACT,41,45,CO,.3,(9)A4.EQ.2* REPARABLES TO ISSUEACT,41,44,CO,.5,(9)A4.EQ.1* LARGE BIN TO ISSUESIN,42/REPSTO,1,1,,I,5,10* REPARABLE STORAGE ENDSIN,43/LBSTO,1,1,,I,5,10* LARGE BIN STORAGE ENDQUE,44/QLB, (8) 2,2,46*QUE,45/QREPS, (8) 2,2,46*RES,1/SPACE,9,46* GATINGALL ,46 ,LWF ,1 ,l,45 /47 ,44/48 *FRE.,49, ,1,1,46*FRE,48,F,1,1,46*QUE,47/QOPENSYS,(B),2,2* QUEUE OPEN SYSTEM FOR ISSUEACT,47,49,NO,17,17/OPENSYS,2* OPEN SYSTEM FOR ISSUEPAR,17,3.3,1.3,5.3,.7*ACT ,49 ,50*SIN,50/REPISS,1,1,,I,5,10* REPARABLES ISSUED ENDACT,48,52,(9)A4.EQ.1* LB ISSUEACT,48,54,(9)A4.NE.1* SB ISSUESIN,52/LBISS,1,1,,I,5,10* LARGE BIN ISSUE ENDSIN,54/SBISS,1,1, ,I,5,10*SOU,22,0,1,A*ACT,22,22,NO,18 ,18/REPISS*PAR, 18 ,480 ,480 ,600 ,40*ACT, 22,23*REG,23,1,1,A*VAS ,23 ,1+ ,CO, 1*ACT,23,23, (9)A1.LB.79*ACT, 23,25*REG,25,1,1*VAS,25,4,CO,2* REP ISSUE PAR 4=2ACT ,25, 39*SOU,31,0,1,A*ACT,31,31,EX,13,13/ISSUE*PAR, 13 ,3 .2 ,2.4,4 .8 *ACT, 31, 34*SOU ,62,0,1, A*SOU ,63, 0, 1,A*
SOU ,64 ,0 ,1 ,A*
ACT ,63 ,66 ,CO ,960*ACT ,64 ,67 ,CO ,1440*
REG, 66 ,1,1, A*REG,66,1,1,A*ACT,65,65,C,200ACT,66 ,66 ,CO,2400*
76
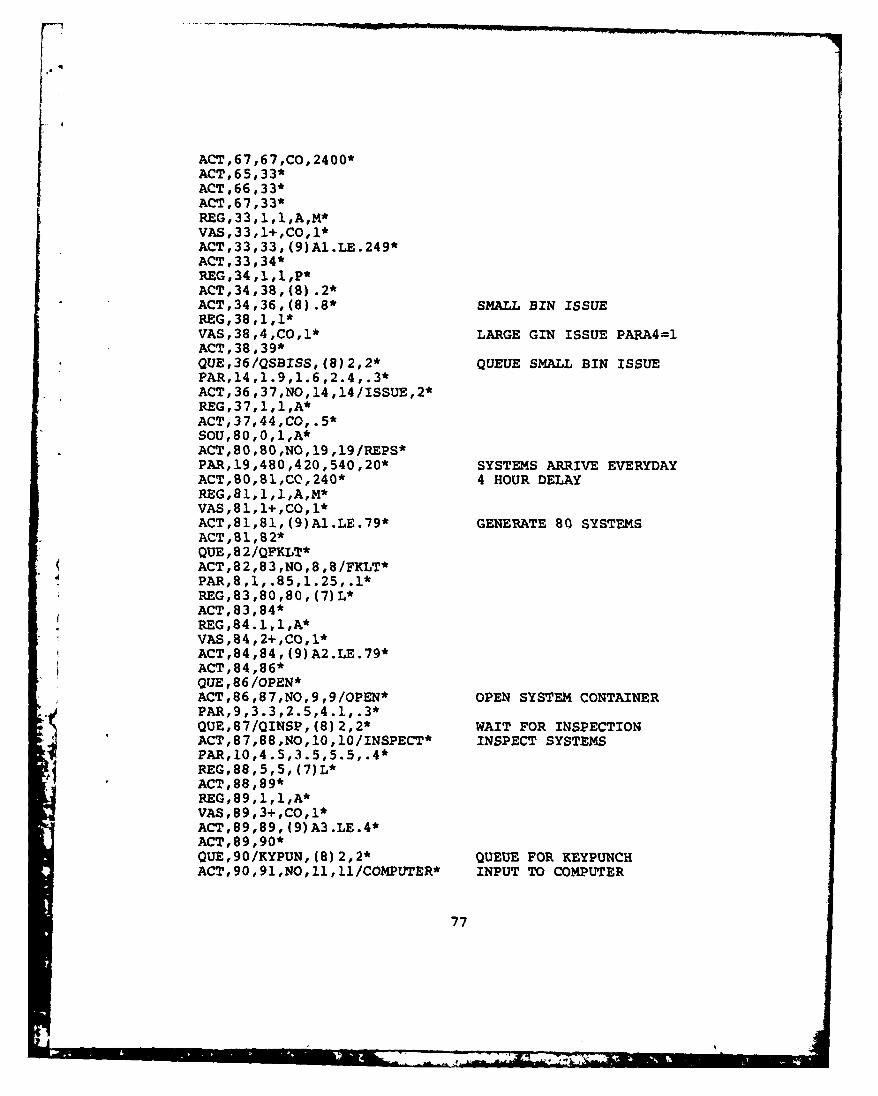
ACT,67 ,67 ,CO,2400*ACT,65 ,33*ACT.66 ,33*ACT ,67 ,33*REG, 33,1,1 ,AM*VAS ,33 ,1+ ,Co ,1*ACT,33,33, (9)A1.LE.249*ACT 33 ,34*REG,34,1,1,P*ACT,34,38, (8) .2*ACT,34,36,(8).8* SMALL BIN ISSUEREG,38,1,1*VAS,38,4,CO,1* LARGE GIN ISSUE PARA4=1ACT ,38 ,39*QUE,36/QSBISS,(8)2,2* QUEUE SMALL BIN ISSUEPAR, 14 ,1.9,1.6,2.4,.3*
* ACT,36,37,NO,14,14/ISSJE,2*REG, 37, 1 ,1,A*ACT,37,44,CO,.5*SOU,8O,0,1,A*ACT,80 ,B0,NO,19 ,19/REPS*PAR,19,480,420,540,20* SYSTEMS ARRIVE EVERYDAYACT,80,Bi,CC,240* 4 HOUR DELAYREG,81,1,1,A,M*VAS,81,1+,Co, 1*ACT,81,81,(9)Al.LE.79* GENERATE 80 SYSTEMSACT,81,82*QUE ,8 2/QFKLT*ACT,82,83,NO,8,8/FKLT*
* PAR,8,1,.85,1.25,.l*REG,83,80,80, (7)L*ACT, 83 ,84 *REG, 84.1 ,1,A*VAS ,84 ,24 ,CO , *ACT ,84 ,84,( 9) A2 .LE .79*ACT ,84 ,86*QUE,86/OPEN*ACT,86,87,NO,9,9/OPEN* OPEN SYSTEM CONTAINERPAR,9,3.3,2.5,4 :t, 3*QUE ,87/QINSP, (8) 2,2* WAIT FOR INSPECTIONACT,87,88,NO,10,10/INSPECT* INSPECT SYSTEMSPAR,10,4 p5,3.5,5.5,.4REG,88,5,5, (7)L*
REG,89,1,1,A*VAS ,89 ,3+ ,Co 1*ACT,89,89, (9)A3.LE.4*ACT ,89 ,90*QUE,90/I(YPUN, (8) 2,2* QUEUE FOR KEYPUNCHACT,90,91,NO,11,11/COMPUTER* INPUT TO COMPUTER
77
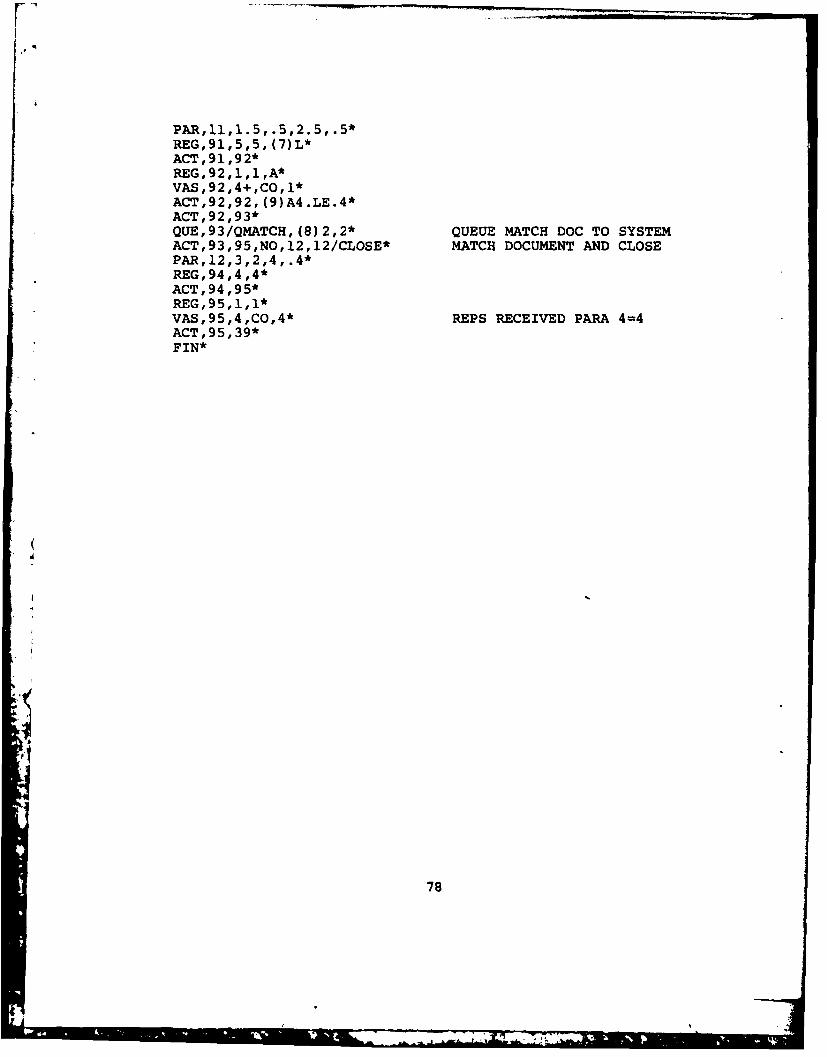
PAR,11, 1.5,.5D 2.5,.5*REG,91,5,5, (7)L*ACT,91 ,92*R.EG, 92 ,1 ,1 ,AVAS ,92 ,4+ ,Co ,1*ACT,92,92, (9)A4.LE.4*ACT, 92,93 *QUE,93/QMATCH,(8)2,2* QUEUE MATCH DOC TO SYSTEMACT,93,95,NO,12,12/CLOSE* MATCH DOCUMENT AND CLOSEPAR,12,3,2,4,.4*REG,94,4 ,4*ACT,94 ,95*REG ,95 ,1, 1*VAS,95,4,CO,4* REPS RECEIVED PARA 4=4ACT ,95, 39 *FIN*
78
SELECTED BIBLIOGRAPHY
79
A. REFERENCES CITED
1. Anderson, David R., Dennis J. Seency, and Thomas A.Williams. An Introduction to Management Science:Quantitative Approaches to Decision Making.St. Paul MN: West Publishing Co., 1979.
2. Barton, Richard F. A Primer on Simulation and Gaming.Englewood Cliffs NJ: Prentice-Hall, Inc., 1975.
3. Chou, Ya-lun. Statistical Analysis. New York: Holt,Rinehart, and Winston, Inc., 1969.
4. Dorough, Captain Robert E., USAF, and Captain Robert H.Holliway, USAF. "A Simulation Study of CheckoutOperations at the Wright-Patterson AFB Commissary."Unpublished master's thesis. LSSR 6-80, AFIT/SL,Wright-Patterson AFB OH, June 1978.
5. Harp, Darwin, and Alfred Soltesz. "Material HandlingStudy: 2803d Air Base Group Supply & Transporta-tion Division." Unpublished research report,unnumbered, Newark Air Force Station OH, 1979.
6. Hillier, Frederick S., and Gerald J. Lieberman. Opera-tions Research. San Francisco: Holden-Day, Inc.,1974.
7. Inspector General, AFLC. Management EffectivenessInspection Report. Newark Air Force Station OH,June 1978.
8. Neter, John, William Wasserman, and G. A. Whitmore.Applied Statistics. Boston: Allyn and Bacon, Inc.,1979.
9. Phillips, Don T. "Simulation of Material HandlingSystems: When and Which Methodology?" IndustrialEngineering, September 1980, pp. 65-77.
10. Pritsker, A. Alan B. Modeling and Analysis UsingQ-GERT Networks. New York: Halsted Press, 1979.
ii. Shannon, Robert E. Systems Simulation the Art andScience. Englewood Cliffs NJ: Prentice-Hall, Inc.,1975.
80
367''t
12. U.S. Department of the Air Force. Air Force MechanizedMaterials Handling Systems. AFR 71-11. Washing-ton: Government Printing Office, 15 January 1979.
13. White, John A. "Increasing Productivity throughImproved Material Handling." Professional seminarlecture, American Institute of Industrial Engineers,Canton OH, October 13, 1979.
14. . "Increasing Productivity through ImprovedMaterial Handling." Unpublished report, unnumbered,American Institute of Industrial Engineers Seminar,Canton OH, October 13, 1979.
B. RELATED SOURCES
Robinson, Willis C. III. "Investigation of the Effect ofProposed Modifications to an Automated MaterialsHandling System Using a GPSS Simulation." Unpublishedtechnical report, DARCOM-ITC-02-08-76-202, DARCOMIntern Training Center, Red River Army Depot,Texarkana TX, May 1976.
Rosenthal, Ronald J. "Investigation of an AutomatedMaterials Handling System Using a GPSS Simulation."Unpublished technical report, DARCOM Intern TrainingCenter, Red River Army Depot, Texarkana TX, November1976.
81
1:1~8