Embed Size (px)
Citation preview

---------------- - -~ -- - - *
AMRL-TR-75-89
EFFECTS OF SOUND ON THE VESTIBULARSYSTEM
MIAMI UNIVERSITY NOOXFORD, OHIO 45056
MARCH 1976
| j Approvedrfor public release: distribution unlimited
AEROSPACE MEDICAL RESEARCH LABORATORYAEROSPACE MEDICAL DMSIONAir Force Systems CommandWright.Patterson Air Force Basow Ohio 45433

When US Gov•cnmer drawings. specifications. or maer data are used for any ptnVnr odthln a deiniely viedGoverwnee procuremea operaion, the Govenmýent tbere¶y er 's wtsponsibiiiy am any obiation what-socrer, and the fact that the Goverment may have fovinlated. funishbd. or i -say way suppltd the said dmwivp.W'ci-cationt. or other data. is not to be regar-ded by implication or otherwise. as in any mrnrj Iicensing the hoieror any other perm% or c.po ation. or conveying any riglts or permission to manufacture. u-,e or set any pnetedunvenhto that mv in any way be related thereto.
Please do not request copies ofthi -pr from Aerospacc Medical Research LAbortory Additio!l copies nmay bepurchased from:
National Technical l'ormation Service5285 Port Royal RomdSpringfield, Virginia 22161
Federal Governaces agaeies and their contractors registered with Defense DocumCattsUo Center s&ouid dkux.requests for copies cf this report to:
Defense Documentation CenterCameron StationAlcnxmuria, Virginia 22314
STECHNICAL REVI¶# AWL &!'PWOVAL
I 'e it•xzpiuem,, repote heirtin were conducted according to 6je "Guide for bhe Ca•r and Use of LaborrnmyAninnls.' lestitute of La•,oraryv Asýmat Resources, Nationa Research Council.
lThis report has been reviewed by the Information Office (01) and is elr asable to the National Technic, Ittfors•oan
Service (N"IS). At NTIS. it will be available to the gencral publi., int-ýLding foreign nations.
This technical report hat O•t•" reviewed and is approved for pablicat•en.
FOR THEF COMMANDER
V: .. t-t-i.
-1%irec-r 7. ..Biodnatucs ad 3itr."oDvision
A ir•eve Lekadle Research Laboq'ratory
AIR~ FOWE - to WAY is 149 S'.,'•, • ,,,/ ' %~ ~~ ~," .. , ,- •/,
N.
S.,. N. N .

(61? ~~~ ~ ~ ~ RA INSTRUFCONDONTIONSDUAR~YTE~
EPOCNTOLIH T WC~C UMA E N T A TIO N AE 3FOESSPEICF
Aerosace edicl Diisio, AiOror
4.TTE(n utemRSmand Wrigh-P.terso COVE 85DT~~ORI~AE ~"NE ~ AURE~IIdiie~.~i mniC~wt~otin O~lc& ¶5 ECal¶T L.SS.(olthi t.; rt
rIS. OTS~ OF NON O4NT THE VESTBULA SYSot)
_________________________________________________________ __________________
Appro........... . o ulcrlae isrb to niie
IT IS~3J.#OISaTEET(fteabire fttdj 1.A *l .ý. ro wot7 T6,COTRCTORGRNTNue1/ve/
__ __ _ __D _ _ __ _ __ __E__ __ _ __ _ _ _ _ _ _ __ _ _ _ _ _ _ __ _ _ _ _ _
vMibami Unvresponse673132
Aestosuare resdose Daveibeen, i evoke rom guna isUn-4 numan eins olloWringhsti-Patieron wit , 8ttcpesue5nPaon
uMs~mtO-ined R NAEP uiore URenyi diournd, aond rntilepetitive IS. diofkR equenAS oy hsreot
uAnppoer fora pbyi inelease- nistbehaviors mediaited a es npr
ytevestibuýlar rspostem
0. AII 173CITI ONCý (%*tne on vpes Ir NO csv Q;1 I\aOL Ieniy S E ubst bulr responses hav bee evoke from guine pigs, ,m,.,e, fando
unan~~>~~~ bensfloigsiuainwth3ai rsue nrsudusandadarqec on, n eeiieadorqe1
ransent. Tese bsevatons eadto liggstins oncenin th

TABLE OF CONTENTS
Page
LIST OF FIGURES . . . . . . . . . . . . . . . . . . . iiiPREF gCE . . . . . . . . . . . . . . . . . . . . . .. . .i
INTRODUCTION . . . . . . . . . . . . . . . . . 2
Purpose . . . . . . . . . . . . . . . . . . . . . 2
The Vestibular System . . . . . . . . . . . . . . 2
Background . . . . . . . . . . . . . . . . . . . 4
Anatomy and Physiology ............. 5
II. VESTIBULAR RESPONSES TO ACOUSTICAL STIMULATION . 12
Pressure Transients ...... ..... .... 12
Biomechanical Responses . . . . . . . . . . . 13
Physiological Responses ........... 19
Infrasound . . . . . . . . . . . . . . . . . . . 24
Biomechanical Responses . . . . . . . . . .. 24
Physiological Responses ........... 26
Sustained Audiofrequency Sound . . . . . . . . 31
Biomechanical Responses . . . . . . . . . . . 31
Physiological Responses ........... 38
Repetitive Audiofrequency Transients . . . . . . 39
Observationc with Guinea Pigs . . . . . .. 41
Observations with Monkeys . . . . . . . . .. 46
Oboervations with Human Beings . . . . . . . . 52
Interaction Between Acoustical VestibularStimulation and Other Types of VestibularStimulation . . . . . . . . . . . . . . . . . . . 53
..........

TABLE OF CONTENTS (CONTINUED)
Page
Acoustical Vestibular Stimulation andAngular Acceleration ........... 53
Acoustica:L Vestibular Stimulation andCaloric Irrigation . . . . ... . ...... 55
Acoustical Vestibular Stimulation andAlcohol Injection . . . .. . . ... . . .. 56
Miscellaneous Additional Experiments . . . . .. 57
III. DISCUSSION . . . . . . . . o . . . . . . . . . . 61
Anatomical Differences !3etween Guinea Pigand Monkey Ears ........ ........ 61
Mechanisms of Acoustical Vestibular Stimulation . 62
Assumptions . . . . . . . . . . . . . . . . . 62
Alternative Hypotheses . . . . . . . . . .. 63
IV. CONCLUSIONS ............o.. 70
REFERENCES . . . . . . . . . . . . . . . . . . . . . . 74
iii

LIST OF FIGURES
Page
1. Acoustical Vestibular Stimulation, IncludingThree Feedback Pathways . . ....... . . ... 6
2. Bony Labyrinth and Membranous Labyrinth (Endo-
lymph-filled Space). . . . .... . ..... 7
3. rMembranous Labyrinth ... . ,.. . ..... 8
4. Stapes Displacement as a Function of PressureChange at Tympanic Membrane of the Guinea Pig . . 14
5. Tympanic Membrane Rotation (Observed) and UmboLinear Displacement (Calculated) as a Functionof Pressure Changes at Tympanic Membrane ofHuman Cadaver . . . . . . . . . . . . . . . . 15
6. Guinea Pig Perilymph Pressure Changes inResponse to Increased and Decreased Pressureat the Tympanic Membrane. ...... ...... 17
7. Monkey Perilymph Pressure Changes in Responseto Increased and Decreased Pressure at theTympanic Membrane ........... . . . 18
8. Changes in Action Potential Rate from a SingleVestibular Neuron as a Function of Increasedor Decreased Pressure at the Tympanic Membrane . . 20
9. Pressure Increase at Tympanic Membrane,Elicited Head Movements, and Eye Movements . . . . 22
10. Electronystagmogram and Volume Displacement ofthe Right and Left Tympanic MembranesDuring Whole Body Pressure Changes . . . .. . 25
ll. Perilymph Pressure Changes Evoked by HighIntensity and Low Intensity InfrasoundStimulation . . . .. . . . . . . . . . . 27
12. Amplitude and Phasp Angle of PerilymphPressure Response as a Function of InfrasoundFrequency . . . . . . . . . .. . . . . . . . . . 28
13. Displacement of Stapes as a Function of Phaseof Sinusoidal Acoustical Stimulus at ThreeIntensities . . . . . . . . . . . . . . . . . . . 33
iii

LIST OF FIGURES (CONTINUED)
Page
14. Stapes Nonlinear Displacement as a Functionof Stimulus Intensity . .......... . • . 34
15. Ferilymph Pressure Drop as a Function ofIntensity of 800..Hz Stimulus . . . . . . . . . . . 36
16. Perilymph Pressure Changes as a Function ofStimulus Frequency ...... . .... .. ... 37
17. Thresholds for Evoking Rotatory Nystagmus fromMonkeys . . . . .. . . . . . . .. . . . . . . . 40
18. Eye Movements Evoked from Guinea PigsRepetitive Audiofrequency Transients . . . . . . . 43
19. Average Response Amplitude of Guinea Pig EyeMovements E'roked by Tone Bursts of 500- andlO00-Hz . . . . . . . . . . . . . . .. • • 45
20. Average Response Amplitude of Guinea PigEye Movements Evoked by Repetitive AcousticalTransients at Repetition Rates Varying from50/sec to 2/sec ... ......... ... 47
21. Paired Comparison Observations of Monkey EyeMovement Amplitudes .... ........ 51
22. Effects of Alcohol Injection on theThresholds for Sound-Evoked Nystagmusin the Monkey ...... ... .... 58
iv

PREFACE
The research described in this report was performed under
Contract F 33 615-73-C-4002 between the United States Air Forceand Miami University, Oxford, Ohio. This research was
accomplished both in the laboratory of the first author atMiami University and in facilities of the Aerospace Medical
Research Laboratory at Wright-Patterson Air Force Base.
Much of the data described in this report have beenpublished elsewhe: e and the methods are only briefly considered
here; in those cases where unpublished observations are
described (particularly Section II, p. 39), methods arepresented in greater detail.
We thank our colleagues who have contributed to this
effort, particularly H. E. von Gierke, C. S. Harris, and thestaff of the Veterinary Medical Division at Wright-PattersonAir Force Base.
I
I

SECTION I
INTRODUCTION
Sound exposure may evoke several types of responses from a
hv'man being in addition to those directly related to hearing.
Among these nonauditory effects of sound are responses that
result from activation of vestibular system receptors.
PURPOSE
We are interested in describing the biomechanical and
physiological mechanisms whereby sound affects the receptors of
4 the vestibular system. The primary purpose of this report is to
review acoustical vestibular stimulation performed with human
observers and laboratory animals. Animal experimentation has
been pursued to further our understanding u: the effects ofsound on the vestibular system that have been observed in human
beings. Primary attention is devoted to experiments conducted
in our laboratory; however, current work from other laboratories
is also considered. ITHE VESTIBULAR SYSTEM
The vestibular system has two distinct, yet Interrelated
functions. First, the vestibular system coordinates with other
sensory systems in maint," ning the spatial orientation of the
body, including the head and eyes. Vestibular' influences can be
observed in several orientation reflexes (e.g., the counter-
rolling of the eyeball when the head is tilted). The vestibular
system is often presented as a postural control syster because
it makes important contributions to motor control of the body.
This classification is riot completely correct because the
vestibular system also has a significant influence upon our
*1 2

spatial orientation perceptual system. This second function is
associated with subjective awareness of (1) body orirntation
with respect to gravity, and (2) body movement (within limits).
Vestibular receptors rontribute to perception of orientation and
motion because they respond to linear and angular acceleration
(gravity can be described as linear acceleration). Obviously,
many senses, including the visual system, the auditory system,
and the skin, contribute to perception of Etpatial orientation.
The contribution of the vestibular system to spatial orientation
perception is clearly illustrated when signals from vestibular
receptors are modified by disease or unusual stimulation.
One of the difficulties that we encounter in dealing with
the vestibular system relates to the unusual nature of thesensations evoked by stimulation of vestibular receptors. We
can think of no sensation that is uniquely correlated with
vestibular stimulation in the way visual sensations are
correlated with stimulation of the eye or auditory sensations
are associated with stimulation of the ear. For example, strong
motion sensations may result from strictly visual inputs, asmost of us have noticed while watching a "chase scene" in a
motion picture theater. Similarly, we encounter difficulties
when we attempt to uniquely relate particular sensations to
vestibular disturbances. To illustrate, the symptoms of motion
sickness can be evoked by unusual or intense vestibular
stimulation? however, similar sensations can be evoked under
many other conditions (e.g., alcnholic intoxication). Unless
we have reason to believe that vestibular receptors are somehow
stimulated, we are unable to attribute particular unpleasant
sensations to the vestibular system.
Further information on the general nature of the vestibular
system is available in Howard and Templeton (ref 20).
3
L
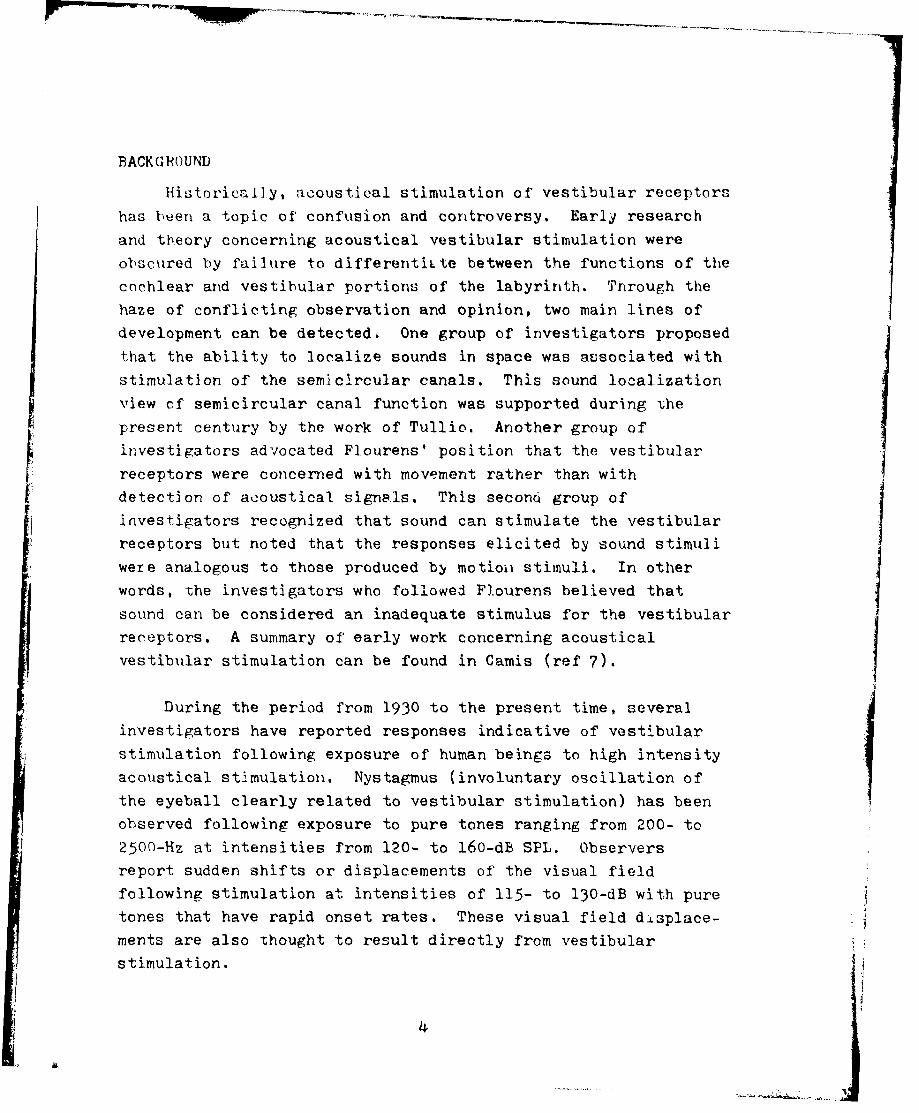
BACKGROUND
Historically, acoustical stimulation of vestibular receptors
has been a topic of' confusion and controversy. Early research
and theory concerning acoustical vestibular stimulation wereobscured by failure to differentiLte between the functions of the
cochlear and vestibular portions of the labyrinth. Through thehaze of conflicting observation and opinion, two main lines ofdevelopment can be detected. One group of investigators proposed
that the ability to localize sounds in space was ausociated withstimulation of the semicircular canals. This sound localization
view cf semicircular canal function was supported during ihe
present century by the work of Tullio. Another group ofinvestigators advocated Flourens' position that the vestibular
receptors were concerned with movement rather than with
detection of acoustical signals. This second group of
investigators recognized that sound can stimulate the vestibularreceptors but noted that the responses elicited by sound stimuli
ere analogous to those produced by motio•i stimuli. In otherwords, the investigators who followed Flourens believed thatsound can be considered an inadequate stimulus for the vestibular
receptors. A summary of early work concerning acoustical
vestibular stimulation can be found in Camis (ref 7).
During the period from 1930 to the present time, several
investigators have reported responses indicative of vestibular
stimulation following exposure of human beings to high intensity
acoustical stimulation. Nystagmus (involuntary oscillation of
the eyeball clearly related to vestibular stimulation) has been
observed following exposure to pure tones ranging from 200- to
2500-Hz at intensities from 120- to 160-dB SPL. Observers
report sudden shifts or displacements of the visual field
following stimulation at intensities of 115- to 130-dB with puretones that have rapid onset rates. These visual field displace-
ments are also thought to result directly from vestibular
stimulation.
Dizziness, nausea, and disturbances of post-al equilibrium
have been correlated with sound stimulation at intensities andfrequencies lower than those which are required to evoke
nystagmus or reports of visual field displacement. These
responses are believed to reflect activation of vestibularreceptorsl however, the possibility that dizziness, nausea, andequilibrium disturbance result from acoustical stimulation ofphysiological systems in addition to the one associated withvestibular receptors cannot be discounted. References for
recent acoustical vestibular stimulation research can be found
in Parker et al (ref 28) and Harris (ref 18).
ANATOMY AND PHYSIOLOGYIt is convenient to think about the mechanisms between
acoustical stimulation and physiolcgical or behavioral vestibular
responses in terms of three basic blocks, as illustrated inFig. 1. Environmental sound enters the body primarily at the
tympanic membrane of the middle ear (due to the mechanicalimpedance match between body fluids and air at this point).
Sound energ. is transformed into tympanic membrane oscillation,
and an oscillatory motion of the middle ear bones (ossicular
chain) is evoked by tympanic membrane motion. The ossicular o
chain terminates with the footplate of the stapes at the ovalwindow of the labyrinth.
The bony labyrinth refers to the fluid-filled cavities of
the temporal bone. The membranous labyrinth is located within
the bony labyrinth. The perimeter of the bony labyrinth is
filled with perilymph and roughly defines the shape of thevestibule, cochlea, and semicircular canals (see Fig. 2).
Figure 3 illustrates the endolymph-filled series of sacks andtubes that comprises the membranous labyrinth. The sensory
receptors for the auditory system are located in the cochlea;
the utricle, saccule, and semicircular canals contain the
vestibular receptors.
.5

4. 0
40
z Q)
cc0)LU l
z~ :w
w Wi
z w-' 4
UU r.m
0 2dLU H
z*
I-..
CO) >4
0P )
4r
6j
......... ..

ca
$4-
9Cd
Ir.
C d 0
0P 0
CC)
CL 4
0)U
a C.)
0)0HP4
MC/)d
H -4-40 C
a 0 .- I 0)
CL
..... ..

a) :-.c4
.4, ~ 4 HH~C
41 ( to4-ýC.) 0CO
Q 4-
0~ -r 4. .d 0+ i
.,I pBý

The sensory apparatus of the vestibular system is
morphologically differentiated into two types of receptors:
one for detection of linear acceleration (statolith organs in
the utricle and saccule) and the other for detection of angular
acceleration (crista organs in the three semicircular canals).
Both types of receptors are activated by deformation of sensory
hair cells as a rpsult of inertial displacement of accessory
components. However, the mechanism of accessory structure
inertial displacement differs significantly for the two types
of vestibular receptors.
Displacement of the statolith mass stimulates the sensory
hair cells of the utricle and saccule. The statolith is displaced
relative to the hair cells during linear acceleration exposure
because the statolith has a higher specific mass than the
surrounding medium. The hair cells of t.he semicircular canal
crista organs are stimulated by displacement of a gelatinous
flap (cupula) which extends into -the membranous semicircular
canal. The cupula, in turn, is displaced during angular
acceleration by inertial movement of endolymph in the membranous
ring contained within the bony semicircula:? canal. Both the
statolith and cupula behave as though they contained a weak
spring and return to a neutral position after termination of
acceleration (see ref 20).
Differences in the nature of fluid displacement associated
with stimulation of the two types of vestibular receptors may be
important for our purposes. Displacement of the statolith mass
is not directly dependent upon movement of labyrinth fluids;
the fluid displacement resulting from a change in position of
the statolith mass should be relatively small and localized.
Conversely, displacement of the semicircular canal cupula is
directly dependent upon volume displacement of fluid within the
membranous ring.
Ossicular chain motion results in displacement of perilymph
9 .
JI

and endolymph through the labyrinth. This labyrinth fluid
displacement is dependent upon elastic "release points" in the
nonelastic bony labyrinth wall. The major labyrinth release
point is the round window: three additional openings in the
labyrinth wall includc the perilymphatic and endolymphatic ducts,
which connect the labyrinth to the cranial cavity, and the
capillaries. Labyrinth fluid displacement associated with
inward (medial) displacement of the stapes is indicated by the
arrows in Fig. 2.
The block diagram presented in Fig. 1 suggests that we
consider sound-induced vestibular responses at three levelst
biomechanical, physiological, and behavioral. Biomechanical
responses to acoustical stimulation include ossicular chain and
labyrinth fluid displacement that may result in physiological
responses beginning with sensory hair cell activation. We
include eye movements, postural adjustments, and other
reflexive (unconditioned) responses to vestibular stimulation
with neural activity under the heading of physiological responses.
Goal-oriented activity of an organism and stimulus-induced
perceptual changes can be considered under the heading of
behavioral responses. Observations from our laboratory haveI
been primarily concerned with biomechanical and physiological
responses evoked by acoustical stimulation; however, our goal
is to relate these biomechanical and physiological observations
to reports of other investigators regarding behavioral responses.
Three possible feedback pathways are also illustrated in
Fig. J. The pathway labeled "behavior" indicates that an
organism's overt actions can modify the acoustical stimulation
that it receives. Potential physiological feedback could result
from activation of the middle ear muscle (acoustic) reflex and
the efferent portion of the vestibular nerve. The middle ear
muscle reflex, which reduces the efficiency of sound energy
transfer from air to labyrinth fluids, has a latency of 60- to
150-msec, and gradually adapts to continuous stimulation over a
10
"UL

period of minutes (ref 36 and 15). The efferent neural fibers,
which termirate on vestibular sensory hair cells, appear similar
to those of the cochlea (ref 29 and 35). Cochlear efferent
neurons perform an inhibitory function (ref 12 and 39); the
physiological activity of the vestibular efferents has not been
clearly estiblished.
.
i 11} :I
,i4

SECTION II
VESTIBULAR RESPONSES TO ACOUSTICAL STIMULATION
We divide acoustical stimuli into four categories based on A
the temporal character of the pressure changes. Pressure
transients, including pressure step functions and ramp functions,
comprise one of these categories. The remaining three categories
of acoustical stimulation that we employ consist of pressure
oscillations. Infrasound refers to pressure osbillation at
frequencies below 20 Hz, sustained audiofrequency sound denotes
oscillations in the 20- to 20,000-Hz frequency range, and
repetitive audiofrequency transients refer to trains of noise
or tone bursts presented at various repetition rates. In
addition to frequency, acoustical stimuli are specified by
several other parameters: intensity, duration, phase, and
onset rate. We specify the intensity of pressure transients in
centimeters of mercury (cm Hg) of overpressure (pressure changes
with respect to ambient air pressure). The intensity of
oscillatory pressure is expressed in terms of the sound pressure
level (SPL) scale in decibels (dB) with respect to 0.0002
microbar.
PRESSURE TRANSIENTS
One of our proposed mechanisms to account for acoustical
vestibular stimulation is based on unidirectional (dc) flow of
perilymph and endolymph through the labyrinth (see Section III,
p. 62). We postulate that a dc labyrinth fluid flow results
from static displacement of the stapes. One tachnique for
producing static stapes displacement is exposure of an animal
to transient pressure changes in the outer ear canal (external
auditory meatus). Therefore, we undertook a series of
experiments on biomechanical and physiological responses to
external auditory meatus pressure transients.
12
IL

Biomechanical Responses
Biomechanical responses to pressure transients have been
examined with two techniquest (1) direct observation of the
ossicular chain, and (2) labyrinth fluid pressure changes.
These responses have been examined in anesthetized guinea pigs
and monkeys (Macca mulatta) and in human cadavers.
Figure 4 illustrates longitudinal axis stapes displacement
as a function of the intensity of a pressure step function at a
guinea pig's tympanic membrane. The abscissa represents peak
stimulus pressure with pressure increases to the right of the
ordinate and pressure decreases to the left. Stapes displacement
is indicated on the ordinate; points above the abscissa represent
medial displacement (into the oval window) and points below the
abscissa indicate lateral stapes displacement (out of the oval
window). The stimulus source was a hypodermic syringe, which
was connected to a hollow earbar with polyethylene tubing.
Responses were recorded by direct observation with an operating
microscope through an opening in the bulla. The curve illustratesthat increased pressure at the tympanic membrane resulted in aninitial medial stapes movement, followed, at higher stimulus
intensities, by lateral stapes displacement. Tympanic membrane
pressure decreases resulted in a lateral stapes displacement Ithat increased unidirectionally as a function of stimulus
magnitude. These observations confirmed our expectations that
pressure transients would produce static stapes displacements;
however, the bidirectional stapes response to pressure increases
was unexpected.
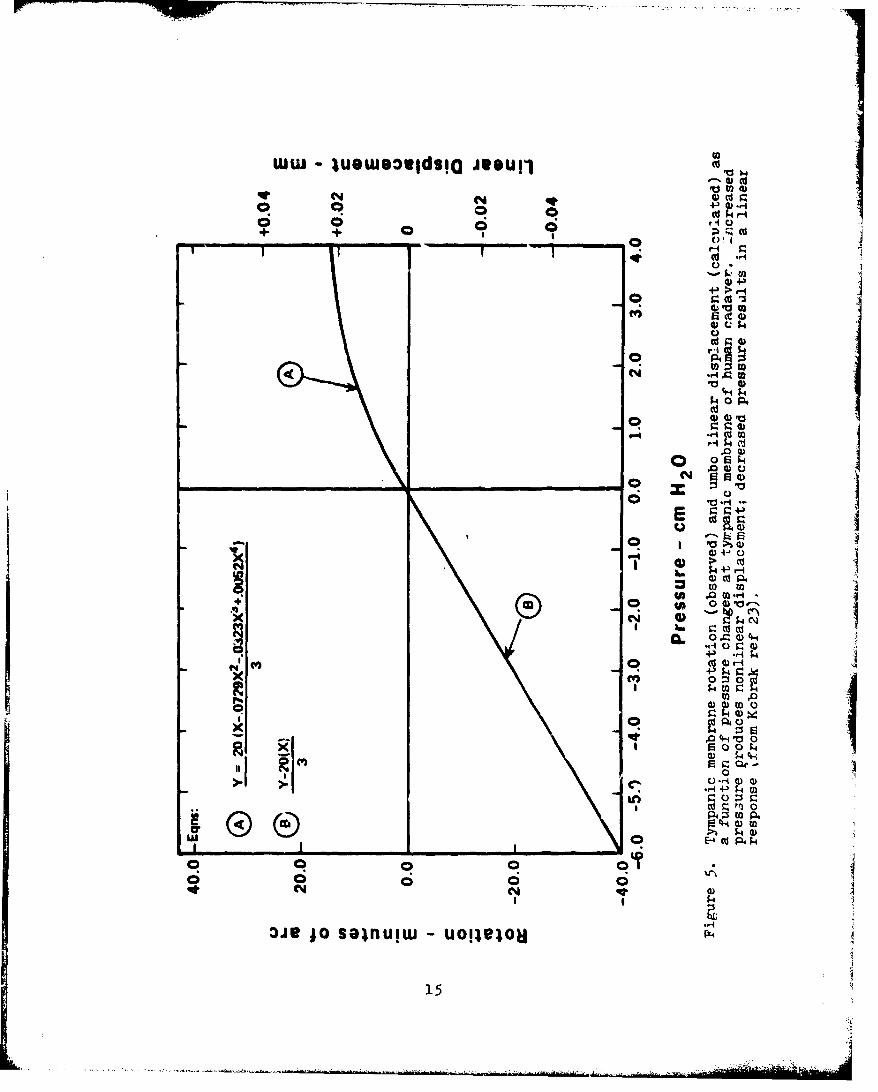
Kobrak (ref 23) observed the rotation of the tympanic
membrane as a function of pressure changes in the external
auditory meatus. From the rotation observations, linear
displacement of the umbo was calculated. The results of these
observations, which are illustrated in Fig. 5, indicate that the .
middle ear response to static pressure decreases is approximately
linear across tie range of 0- to - 6 .0-cm H2 0; however, the
13
I t •

I =I
MEDIAL
34
STIMULUS PRESSURE - cm Hg ,
-2a -15 -1.0 -. 5 +0o +1.5 +20o
7E~5 1 z
6--
L ATEA
q..•
eL
eL101'O
LATERAL•
Figure 4. Stapes displacement as a function of pressure changeat tympanic membrane of the guinea pig. Each pointrepresents the average of 4 observations. Variationwas negligible. A bidirectional response to pressureincreases is illustrated (from Parker and Reschke,ref 26).
14
Ww - %uewS*vgaSiQj jeuSl
4 N 4
oi II 04-
Cd
0 rj
4.)C.)
4)Cd
tooz ('1C~
.9 4)
_ _ _ _ _ _ _ _0 P N C
4-110 )4.0) .,4$
CU 4-4
00Ox
1c1
ciS~ SOfl! uoicu :1

response of the middle ear to static pressure increases is
nonlinear.
Variation in perilymph pressure (top trace) as a function
of transient pressure change at Lhe tympanic membrane (bottom
trace) is illustrated in Fip. 6. Downward deflection for both
pressure tracUs indicates increased pressure. The middle trace
in ( ,ch oscillograph record indicates time in 1-sec intervals.
Records A and B illustr'Ate responses to ramp fun,-tions of
increased pressure at the tympanic membranel record C illustrates
the response to a ramp function of decreased pressure. These
responses were obtained by cementing a saline-filled glass pipette
into a 1-mm hole in the superior semicircular canal of a guinea
pig and connecting the pipette to a pressure transducer. The
stimulus arrangement was the same as that employed for the
stapes displacement observations. The perilymph pressure
recordings provide essentially the same information as thedirect stapes displacement observations, transient pressure
increases at the tympanic membrane elicit a bidirectional
response, whereas tympanic membrane pressure decreases result
in a unidirectional perilymph pressure change or stapes
displacement.
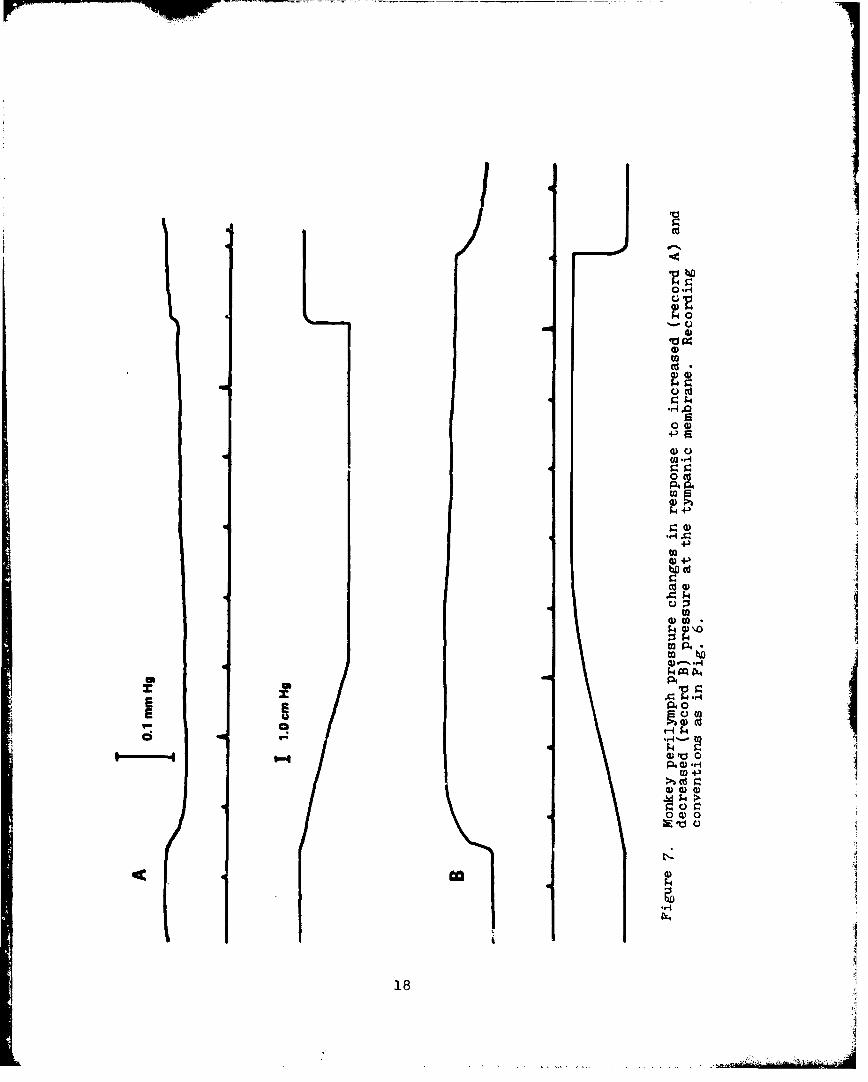
Perilymph pressure changes recorded from the horizontal
semicircular canal of a monkey are presented in Fig. 7. Record
A illustrates the response evoked by transient pressure increases
and record B illustrates the responses evoked by transient
pressure decreases at the monkey's tympanic membrane.II
Figures 6 and 7 essentially describe the transfer
characteristics relating perilymph pressure changes to transient
pressure changes at the tympanic membranes of the guinea pig and
the monkey. These transfer characteristics are presented in the
form of oscillograph records because repeated stimulus exposures
frequently resulted in a change in the form or amplitude of the
response; therefore, presentation of average response curves
16
&I

...... A.0.1 mm Hg I
J , A., II ,. .I
p~~ A A I . . .1p
Figure 6. Guinea pig perilyimph pressure changes in response to increased(records A and B) and decreased (record C) pressure at thetympanic membrane. See text (from Parker and Reschke,ref 26).J
L~.. - ..--. ~---'-.~----~. 17 TI.7.........
40
0 i
.0
00(L
00C
P4 P4
UG)+
rw.
m P4 )
E ~P40
0r-I ý4
w 00
A 4) r
18 -
Cdi

appears inappropriate. Figures 6 and 7 illustrate three
consistent differences between guinea pigs and mcnkeys. First,
monkeys yielded unidirectional responses to both transient
pressure increases and decreases while guinea pigs exhibited a
bidirectional response to transient pressure increases at the
tympanie membrane. Second, the maximum perilymph pressure
change obtained from monkeys was invariably in the region of
0.1-mm Hg or less, whereas guinea pigs demonstrated maximum
perilymph pressure changes of several times this value. Third,
monkey oerilymph pressure changes saturated (reached maximum
value) at stimulus intensities of 1.0-cm Hg or lessi guinea
pigs' responses saturated at somewhat higher stimulus
intensities.
Physiological Responses
Two types of physiological responses to pressure transients
have been examined: (1) primary vestibular nerve activity, and(2) reflexive head and eye movements.
Responses from single vestibular ganglion neurons were
obtained from 3M KCl-filled micropipettes (2-microns tipdiameter) that were located at the mouth of the internal
vestibular meatus in anesthetized guinea pigs (see ref 27).
Figure 8 illustrates changes in action potential rate that were
observed in 1 of 11 neurons from which responses to pressure
transients could be obtained (out of a total of 32 neurons that
were isolated). The average action potential rate (pulses per
second) associated with 4 presentations of pressure increases
(top record) and 2 presentations of pressure decreases (bottom
record) is plotted in the figure. The temporal location of the
stimuli is indicated by the black horizontal bars. Pressure
increases of 1- to 2-cm Hg resulted in a decrement in neural
response rate, and pressure decreases of approximately 1.5-cm Hg
elicited a pulse rate increment. The response latencies
indicated by the curves in Fig. 8 are relatively short (less than
1-sec); however, other neurons that were sampled exhibited
19

,•.•';;*" "' " " '"' •- I I ............. ...' ". ... . .. .
j76-
72-1-2 cm Hg
78-
6i-
6614
.1
oS2
76-
-1.5 cm Hg74-
72-
70-
-10 -8 -6 -4 --2 1 3 5 7 9 11 i
TIME INTERVALS (SEC)Figure 8. Changes in action potential rate from a single vestibular
neuron as a function of increased (top curve) or decreased(bottom curve) pressure at the tympanic membrane. Temporallocation of the stimulus is indicated by the horizontal barunder each curve (from Parker and von Gierke, ref 27).
20
•~~~~~~ .• ..... .... .. •._ _..,• ,. .. . .. .. . , t. . :.. . . ., ,. . • '

response latencies of Up to 5-sec. Response latencies are of
interest when we compare neu'8a.1 pulse rate data to head and eye
movement observations.
These neural response data are important because they clearly
demonstrate that vestibular receptors in the guiinea pig can be
physiologically activated by pressure transients. The
vestibular ganglion contains cells from the horizontal and
superior semicircular canals as well as the utricle and saccule.
The observation that 11 of 32 isolated neurons exhibited changes
in response rate to pressure transients is consistent with the
suggestion that only the semri-nircular canal vestibular receptors
are stimulated by sound energy.
An oscillograph record of head and eye movements elicited
from an unanesthetized guinea pig by a pressure increment step
function is illustrated in Fig. 9. Head movements were recorded
with a force transducer following a technique described by Parker
(ref 24). The animal's head was restrained by a head holder
that was attached to the force transducer, aid the output of theforce transducer indicated the attempts by the animal to change Iits head position in response to stimulation. Among the
interesting features of this recording technique is the fact
that one of the feedback loops providing the animal with
information concerning the consequences of head movement commands
is opened. Eye movements were recorded from electrodes that
were located subcutaneously above and below the eye following
ordinary electronystagmographic procedures.
The upper trace in Fig. 9 indicates the pressure transient
that wAs delivered to the tympanic membrane; the second trace is
the outpit of the force transducer; the third trace is a record
of eye movements; and the bottom trace is the time marker (1-see
intervals). Peak stimulus intensity (excluding overshoot) was4 .3-cm Hg, and the stimulus duration was about 19-sec. The
force transducer output trace shows that the animal attempted to
21

H )
C).
(D *4-:'O
.02)
4-1 -P
WO)
oO
C) Cd
PG
a~Cd
$.0))C) Wa1:
5.4
W ) 04-D
a)
5-4 0
hii

turn its head toward the side of stimulation about 6-sec after
stimulus onset. The eye movements evoked by this stimulus were
complex, and the full nature of these movements uannot be
revealed by electronystagmography. Approximately 9-sec after
stimulus onset, the eyeball exhibited a slow downward deflection
followed by nystagmus in approximately the vertical plane which
continued beyond the termination of the stimulus.
The data presented in Fig. 9 are important because they
demonstrate that responses analogous to those elicited by "normal"
vestibular stimulation can be produced by stimulation with
pressure transients. The very long response latencies illustrated
by these data are alsc of interest.
We have made numerous attempts to elicit eye movements from
unanesthetized monkeys in response to pressure transients. We
have not been able to record eye movements from monkeys in
response to pressure transients up to 40-cm1 Hg. Several
stimulation arrangements were employed to ascertain that the
stimuli were freely conducted to the tympanic membrane with the
same result: no response. Rotary nystagmus in response to
intense audiofrequency sound could be elicited from the saae
ears with the same earbar placements as those that failed to
exhibit a response to pressure transients (see Section II,
p. 38). The implications of this failure to replicate
physiological vestibular responses to pressure transients
across species are discussed in Section III.
There has been little systematic investigation of human
response to pressure transients although anecdotal reports of
disorientation during static pressure change are widely cited
(see ref 2?). The best information available derives from a
study by Ingelstedt, Ivarsson, and Tjernstrom (ref 21) in which
vertigo was elicited from 5 out of 79 otologically healthy
observers during simulated ascents from underwater dives.
Nystagmus was observed concurrent with the reported vertigo.
23

Figure 10, which is taken from ref 21, illustrates the relation-
ship between subjective vertigo, nystagmus, volume displacements
of the right and left eardrums, and the stimulus pressure.
INFRASOUND
Based on our observations of responses to pressure transients,
we deduced that appropriate frequencies and intensities of
infrasound should elicit vestibular responses (in the guinea pig).
Moreover, infrasound allowed us to estimate the frequency
response of the ossicular chain-perilymph pressure system.
Biomechanical Responses
Pressure changes in the semicircular canal perilymph were
examined as a function of exposure to infrasound with
anesthetized guinea pigs and monkeys. A piston phone generated
acoustical stimuli at intensities from 112- to 150-dB SPL and
frequencies from 0.5- to 50-Hz.
Perilymph pressure changes i.n response to intense infrasound
are complex and difficult to interpret. Part of the difficulty
results from the observation that the perilymph pressure response
can exhibit at least two different response components when
stimulated by infrasound; we use the labels "primary response
component" and "secondary response component." Either response
component may appear alone, or both may appear simultaneously,
depending upon stimulus parameters. Variation in response, both
within and across species also introduces interpretation
difficulties. Fortunately, differences between monkeys and
guinea pigs are considerably greater than differences within
either of these species.
The response of the ossicular chain-perilymph pressure
system appears to be linear in the low infrasound frequency
range (0.5- to 2-Hz) and the low audiofrequency range (50- to
70-Hz); that is, the perilymph pressure output waveform nearly
2 24
~ - ____________________________-~ t.

t. W4)
C H bb W r
H " o
-. W 4
a) 40, c
'd 4) 9 MPU 4*"ý
I I a) WC) -HW
Id 0
a' Wao 0)r.) P
o-'i a) aSaSP ,OQ4
A-- 0 S-
00
zoa .a*-*--*--- 0 -O X
L. - - -- i. L le b¾+'-P
Id 0 901 a$~
o l pS v. aS ) op9 I :5 0 -
x0 ' S-i - 0 m-
M I- +'W H4C
%S-i W1 P 4 4) 4 - 4
Xx~ z
o 0 0 0 C;
* + . +4
"D2E z E E

replicates the acoustical input waveform. At stimulus
frequencies intermediate between these values the perilymph
pressure output may be complex. Figur-e 11 illustrates an
oscillograph record of perilymph pressure changes evoked by
5.7-Hz infrasound at 150-dB SPL (record A) and 112-dB SPL
(record B). The top trace in each record illustrates perilymph
pressure changes, and the bottom trace shows the pressure changes
at the tympanic membran; produced by the infrasound stimulus.The response elicited by the high intensity stimulus is clearly
complex, whereas the response to the low intensity stimulus
approximates the input waveform. The perilymph pressure
change of record B illustrates what we call the primary
response component.
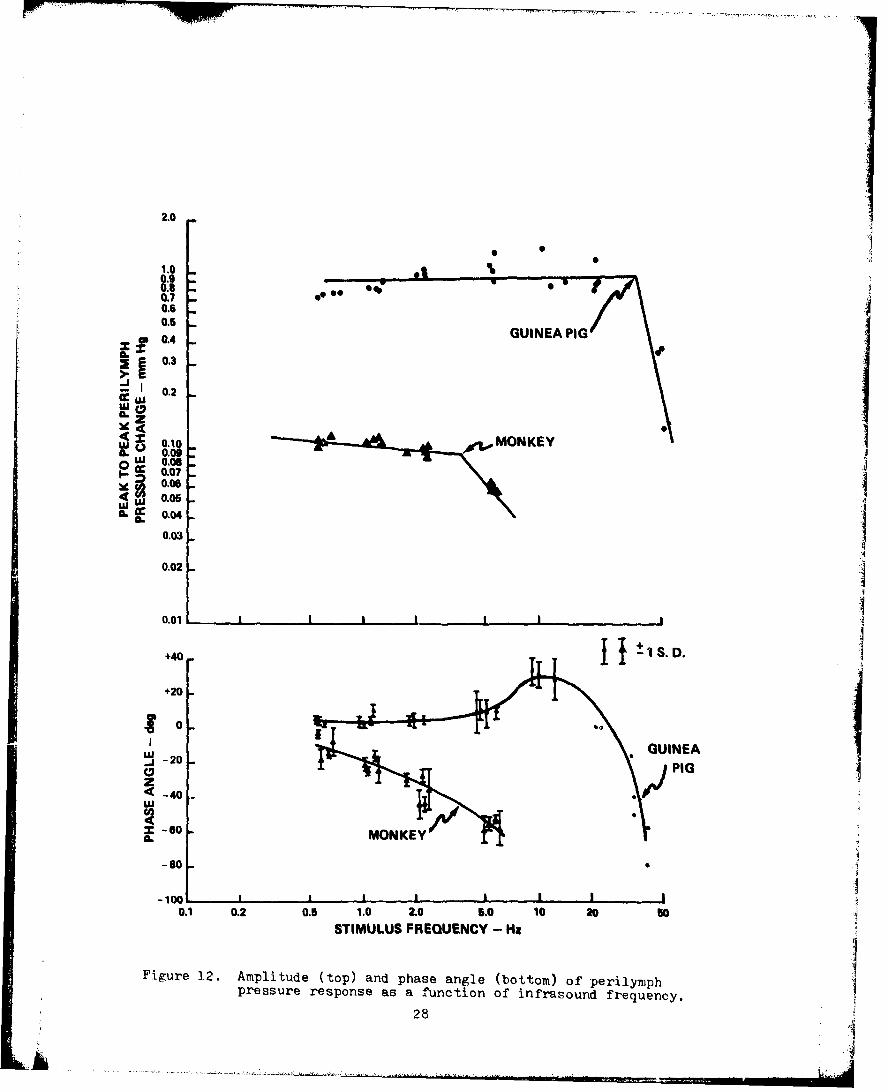
Employing particular stimulus parameters, it was possibleto determine the transfer characteristics for the primaryrespanse component of perilymph pressure change as a function
of stimulus frequency. Transfer characteristics for the guinea
p"g and the monkey are illustrated in Fig. 12. These curves
indicate two major differences between guinea pigs and monkeys.
First, the amplitude of the perilymph pressure response evoked
from the guinea pig was an order of magnitude greater than the j
perilymph pressure response evoked from the monkey by the same
infrasound intensity. Second, the upper limit of the natural
frequency range was greater for the guinea pig than the monkey
by about three octaves.
The secondary response component was much smaller inmagnitude than the primary response component. At frequencies '1where the secondary response component initially appears alone
(as frequency is increased, +20-Hz for the monkey, +40-Hz for
the guinea pig) the output invariably exhibited a phase lead
with respect to the input by at least 30 deg.
Physiological Responses
Restrained, awake guinea pigs and monkeys as well as human
26"I

Perilymph pressure
Acoustical stimulus - 150 dB
Perilymph pressure11
Acoustical stimulus -112 dB
Figure 11. Perilymph pressure changes evoked by high intensity(A) and low intensity (B) infrasound stimulation.See text.
27
1.0
0.7 S0.60.5
a 0.4 GUINEA PIG-0 ,5
SE 0.3
0.2'U
LU 0.10 ^ MNEI. 0.0w0OW 0.06
X 0.07
0, 0.05XIL 0.04
0.03
0.02
0.01 ! .I
+40 1S.D.
+20
$0
-20
-40.
x -60 ~MONKEY•
-80 i
-100. I I I I i0.1 0.2 0.5 1.0 2.o 5.0 10 20 50
STIMULUS FREQUENCY - Ha
Figure 12. Amplitude (top) and phase angle (bottom) of perilymphpressure response as a function of infrasound frequency.
28

observers were exposed to intense infrasound (172-dB SPL at I-,
2-, and 4-Hz; 169-dB SPL at 10-Hz; 162-dB SPL at 20-Hz; and
158-dB SPL at 30-Hz) that was generated by the "dynamic pressure
chamber" located at Wright-Patterson Air Force Base, Ohio.
Whole-body exposures were performed with the subjects located
inside the dynamic pressure chamber. Two whole-body exposures
of guinea pigs were performed after the external auditory meatus
on one side had been sealed with bone wax. When the subjectr'
were located outside the chamber, infrasound was presented to
one ear through a hollow earbar that was sealed in the external
auditory meatus and connected to the dynamic pressure chamber
with plastic tubing. Responses from 5 guinea pigs and 4 monkeys
were examined.
Consistent, repeatable eye movements of the types that are
ordinarily associated with vestibular stimulation (nystagmus and
counterrolling) were not observed in response to infrasound.
Two of the guinea pigs exhibited a few nystagmus beats during
stimulation, but these observations were not repeatable. One J
of these animals also exhibited a very small oscillatory eye
movement that was Lpparently in phase with the stimulus, but the
response was too small to record with electrophysiological
techniques. None of the monkeys demonstrated any evidence of
vestibular-induced eye movements.
The failure to observe physiological vestibular responses
to infrasound from guinea pigs was surprising in view of an
earlier study (ref 28) in which we demonstrated nystagmus to
pressure oscillations of about 166-dB SPL. In the earlierstudy, however, the pressure oscillation was generated by an
animal respiratorl the oscillations were between ambient
pressure (0-cm Hg) and +3.8-cm Hg rather than being symmetrical
around ambient pressure, as is the case with infrasound.
Consequently, the response may have resulted from the static
pressure component of the stimulus.
29
I:

In studies with human beings, visual nystaemus and postural
equilibrium were employed as measures of vestibular activationby infrasound stimulation. Visual nystagmus was monitored with
recording electrodes, and postural equilibrium was determined
with a rail task (ref 13). Infrasound was coupled from thedynamic pressure chamber via a large diameter flexible hose to
short secondary hoses at the earmuff devices that enclosed the
ears. Adjustment of the length of the coupling hose and of the
secondary hoses allowed presentation to one or both ears and of
phase differences in the signals to the two ears.
Visual nystagmus was studied on volunteers who experiencedinfrasound monaurally, bilaterally in-phase, and bilaterally
1800 out-of-phase at levels of 142-dB to 155-dB. The results
may be summarized by the statement that visual nystagmus was not
observed for any of the conditions investigated.*
Postural equilibrium, as indicated by ability to stand on
narrow rails, was evaluated for infrasound exposures at levels jranging from 110- to 140-dB. Exposure conditions were the same
as those employed in the study on visual nystagmus. Statisticalanalysis of the data obtained in this experiment revealed no
effects of infrasound on postural equilibrium for the conditions
evaluated. While infrasound stimulation failed to elicitvestibular responses, audiofrequency stimulation employing the
same methodology yielded clear vestibular effects beginning at
exposure levels of 105 dB (ref 19).
In a recent nonsystematic observation, two investigatorsexposed themselves to infrasound at intensities up to 172-dB
and frequencies of 2- to 8-Hz for periods up to 25 sec. The
C. S. Harris, personal communication, Aerospace Medical
Research Laboratories, Wright-Patterson Air Force Base, Ohio,
August, 1972.
30

investigators were unable to detect disorientation or nystagmusat these exposure levels.*
The results of these investigations correlate with those of
Alo'od et al (ref 4), who reported that only 1 of 21 observers
exhibited transient, mild vertigo during exposure to 140-dB
infrasound at 12-Hz. In contrast to the results from the Wright-
Patterson investigators and those described by Alford et al,
Evans (ref 10) and Evans and Tempest (ref 11) have reported that
infrasound at 7-Hz applied for approximately 1-min can elicit
nystagmus at intensities as low as 125-dB. Reconriliation ofthe discrepant observations concerning the effects of infrasoundon the vestibular system is difficult without more complete
information than we have available; however, the Evans andTempest reports leave open two areas for examination. First,
it is possible that the nystagmus was produced by audiofrequency
sound that was a distortion product of the infrasound signal.
Several z2.!servations place the threshold for nystagmus response
to audiofrequency sound in the 130-dB range. Second, in the
absence of adequate controls, including "blind" evaluation ofthe data, the evaluator's prior information may intrudeexcessively on his evaluation of the ambiguous nystagmus records.
SUSTAINED AUDIOFREQUENCY SOUND
The experiments presented in this section are essentially
replications of the basic observations from other investigators(see Section I, p. 4). Our variations on the theme include the
use of different species, extension of the stimulus range, andexamination with the perilymph pressure recording technique.
I
Bionechanical Responves
The action of the guinea pig ossicular chain was observed
*D. L. Johnson, personal communication, Aerospace Medical
Research Laboratories, Wright-Patterson Air Force Base, Ohio,
May, 1973.
31
1La

under stroboscopic illumination during intense audiofrequencysound stimulation. This technique allowed us to determine the
displacement of the stapes at various points within the stimulus
sinusoid. Figure 13 indicates magnitude of stapes displacement(ordinate) as a function of the phase angle between the
stroboscope flash and the stimulus sinusoid (abscissa) for three
intensity levels. At the lowest stimulus intensity, the inotion
of the stapes was approximately symmetrical around its resting
position (zero on the ordinate). At higher stimulus intensities,
the motion of the stapes was increasingly asymmetrical, the
stapes moved farther in the lateral direction than in the medial
direction. Examination of the output of a condenser microphone
or pressure transducer probe located in the external auditory
meatus indicated that the response asymmetry was not a function
of stimulus asymmetry. These observations, which were obtained
by Reschke (ref 30), confirm the reports of Guinan and Peake
(ref 14) and Kobrak (ref 23).
The magnitude of stapes nonlinear displacement as a function
of stimulus intensity can be calculated from the curves presented
in Fig. 13. Each of the three pointc illustrated in Fig. 14
was derived from one of the curves of Fig. 13 and represents the
area under a particular curve indicating lateral displacement
divided by the total area enclosed by the curve. If the curves
of Fig. 13 were perfectly symmetrical, this calculation wouldyield a value of 0.5; on the other hand, if all of the stapes
motion were lateral to its normal resting position, the
calculation would yield a value of 1.0. Admittedly, interpretationof a function based on three points is tenuous; nevertheless,
Fig. 14 suggests that the magnitude of lateral shift of stapes
average position is a logarithmic function of stimulus intensity.
Further, extrapolation suggests that the onset of stapes
nonlinearity occurs at approximately 134I-dB SPL and that stp.pes
oscillation completely lateral to the normal resting position
would be evoked by stimulus intensities of about 160-dB SPL.
32
i

4"-3
- H
w 0ý
C)~'ifl- U~in
VN Ln I- -\CDU4 9- '4%11 0
000'S-40w
.01
'S C..4Cd
d04
p4 4
"5**
'.$4
330

.- . . - ..f .. r - w~ .v' .- . .'.......
rrw
r- U)
o oaSI) I ~*25
%0,
4)
C)
*'-I 0) 4C") )c 4F*H a;i
P~4
o0 0 0 od P '%00L
IN3W33V~dSIUI S~dV.LS 1VJ.O
.LN3II3~V~dSIO SUdV1S lVHI31VI
*r4
34

..... ------ .... ..J ... .. .
Perilymph pressure change responses to intense audiofrequency
sound have been recorded with the techniques previously described
from anesthetized guinea pigs and monkeys. Audiofrequency sound
usually elicits a perilymph pressure drop which is similar to
the drop evoked by transient pressure decreases at the tympanic
membrane (see Figs. 6 and 7). Peak perilymph pressure drops
evoked by stimuli of 139- to 163-dB SPL at 800-Hz from a guinea
pig and a monkey are illustrated in Fig. 15. The curves form
power functions that have exponents of 1.65 for the guinea pig
and 1.1 for the monkey. In other words, a 20-dB increase in
stimulus intensity elicits a 33-dB perilymph pressure change
from the guinea pig and a 22-dB perilymph pressure change from
the monkey. Also, the magnitude of the guinea pig's perilymph
pressure response is greater than the magnitude of the monkey's
response for a given stimulus intensity level. Although
responses vary across stimulus frequencies and among ears within
a species, the magnitude and slope of the guinea pig's perilymph
pressure responses were invariably greater than the monkey's
responses. Observations of perilymph pressure drops are
consistent with the ossicular chain data described in Figs. 13
and 14.
Perilymph pressure changes as a function of stimulus frequency
variation are illustrated in Fig. 16. The upper trace of the
oscillograph record illustrates perilymph pressure changes, with
upward pen deflections indicating pressure decreases, and the
lower trace shows one side of the sound stimulus envelope. The
middle trace indicates time in 1-sec intervals; the marker on
the time line indicates the points at which the frequency sweep
reached particular values. Stimulus intensity varied irregularly
from 159-dB to 168-dB SPL as a function of frequency. Large
perilymph pressure drops are associated with stimulus frequencies
in the 200- to 300-Hz, 500- to 600-Hz, and 800- to 900-Hz
frequency ranges. Stimulation at 1000-Hz elicited a small
perilymph pressure increment. The oscillation of the perilymph
pressure trace in the 150- to 300-Hz range is an artifact. The
35

10.09.0-8.07.06.0-
5.0
4.0-
3.0-
2.02.0- GUINEA PIG
01.0E 0.9E 0.8.1 0.7 -
0. 0.60
0.5
Lu 0.4- 0 00.3- 0
a.m 0.2 -a..
MONKEYLuA. 0.1
0.097 A0.080.07- A0.06-
0.05
0.04
0.03
A
0.02
0.01, I I I139 143 147 151 155 169 163 16;
STIMULUS INTENSITY - dB SPI.
Fi-ure 15. PeC'iylrrph pressure drop as a forict,iori of' intensity of
800-Hz stimulus.
...

>11
5-4
ot
0
Cd
Cd )
o0 2
ý44'0
'-41
PI-4
PL4
37I

location of the peak perilymph pressure changes varied to a
small degree as a function of the direction of the frequency
sweep. Examination of pressure changes in the tube connecting
the speaker to the monkey's ear as well as observation of the
output of a condenser microphone probe located in the hollow
earbar indicated that the perilymph pressure changes illustrated
in Fig. 16 were not a function of nonlinearities in the acoustical
stimulation system. The oscillograph trace presented in Fig. 16
is interesting because it suggests that considerable variation
in vestibular sensitivity to acoustical stimulation as a function
of frequency should be observable.
Physiological Responses
Eye movement responses to audiofrequency sound in the 500-
to 2000-Hz frequency range have been examined in guinea pigs by
Reschke (ref 30). Intensity thresholds for eliciting nystagmus
from unanesthetized guinea pigs vary as a function of stimulus Jfrequency and duration. Stimulus durations of greater than 4-sec
do not modify the intensity-frequency thresholds. Minimum
threshold values that have been observed are as follows: 142-dB
SPL at 500-Hz; 152-dB SPL at 600-Hz; 169-dB SPL at 700-, 800-,
and 1000-Hz; 160-dB SPL at 2000-Hz; and 162-dB SPL for broad
band noise. These observations are consistent with the perilymph
pressure observations insofar as the 500-Hz stimuli are concerned.
Unfortunately, Reschke was unable to perform eye movement
threshold measures at 200-Hz and failed to do so for 900-Hz;
therefore, we cannot confidently state that perilymph pressure
changes are directly related to eye movement thresholds in an
awake animal.
High intensity, audiofrequency sound stimulation elicited
clear eye movements from monkeys. Ordinarily, these eye movements
took the form of rotatory nystagmus, i.e., the eye rotated around
the corneal-retinal axis exhibiting a slow turning in one
direction followed by a quick jerk in the opposite direction.
38

At higher intensity levels, horizontal and vertical nystagmus
were also elicited.
Threshr'd stimulus intensity for eye movements at particular
frequencies varied across animals; the maximum difference noted
for a particular frequency was 20-dB. Sensitive monkeys (those
with low eye movement thresholds) exhibited only rotatory eye
movements at threshold stimulus levels. Relatively insensitive
monkeys (those with high eye movement thresholds) demonstrated
rotatory, horizontal, or vertical nystagmus at nearly the same
intensity levels. For some of the insensitive monkeys,
rotatory nystaguus was not seen. Post-mortem examination ofears from two of the relatively insensitive monkeys failed to
reveal any gross signs of middle ear abnormality or infection.
Thresholds for eye movements also varied as a function of"arousal" across trials within a particular animal. After a
period of 45- to 60-min in the restraining chair, the monkeys
appeared to become sleepy and withdrawn, and the eye movementthreshold increased. The original threshold for responding
could usually be restored if the experimenter tickled the monkeys
or "made faces" at them just prior to stimulus presentation.In spite of our best efforts, the monkeys habituated to attempts
to keep them alert, and experiments were terminated after a
period not exceeding 2 hours. The average intensity-frequencyeye movement threshold function for continuous sound, which was
calculated across 19 monkey ears, i3 included in Fig. 17.
REPETITIVE AUDIOFREQUENCY TRANSIENTS
Following the reports by Evans and Tempest (refs 10 and 11)
of nystagmus evoked by infrasound, we undertook a series ofstudies to examine this response employing guinea pigs, monkeys,
and human beings. Repeated attempts to replicate the Evans and
Tempest observations with any of these three species have been
unsuccessful, The failure to replicate `nfrasound-evoked
39

CL
z0
w w-4
0 M a)
/~~ 0) w~l.
to
4)I
P
0 . to 3d
N4 00
0) H
.4O
0
* 40 (~~40

nystagmus observations led us to the suggestion that Evans andTempest may not have been investigating responses to pure tone
infrasound; rather, they may acl;ually have used an infrasound-
modulated audiofrequency sound, and their results might be
replicable using intermittent sound.
Observations with Guinea Pigs
Useful data were obtained from 13 young (300- to 350-grams),
female guinea pigs.
The guinea pigs were restrained by taping their legs and
wrapping them in newspaper. The animals were shaved around theeprs and eyes to aid in the placement of earbars and electrodes.The skin at the base of the pinnae was injected with a local
anesthetic (0.25-cc of lidocaine hydrochloride). After allowing
a few minutes for the anesthesia to develop, the base of the
pinnae was cut to facilitate earbar placement.
The animals were then placed in a modified stereotaxic
instrument and held with hollow earbars, a nose bar, and tape.The animals were tested with static, positive pressure generated
from a 1-cc syringe and transmitted through an earbar to determineif a prcper seal had been made in the external auditory meatus.
Corn:•-v'oll - ; of the eye occurred if the earbar had beencr.'-ctly placed (see ref 28). Subdermal electrodes, which wereusec, to record eye movements, were placed above and below the
eye ipsilateral to the ear that was stimulated.
Five stimulus dimensions (intensity, frequency, duration,
onset/offset time, and repetition rate) were studied using the
guinea pigs. Into -.ty was varied in 2-dB steps at 700-, 800-,
900-, 10C•, and. 'lluu-Hz. Durations ranged from 10- to 300-msecand onset/offset times were 5-, 10-, 25-, 50-, and 100-msec.
Repetition rates ranged from 2/sec to 50/sec. Each stimulus
dimension was exami. individually as the independent variable
41
L~.l

with the other dimensions held constant. The order of
presentation of particular stimulus values within a dimension
was randomized.
The amplitude of the eye movement response, measured in
millivolts, was the dependent variable. In a series of responses,
the first two responses were ignored, in order to reduce
transient effects, and the next eight responses were evaluated,
when the amplitudes were calculated by the experimenter. In
those cases when the computer was used to determine the average
response, the first two responses were included in the
calculation, and the number of responses used ranged from 5 to
25.
Intense, intermittent sound elicited large vertical eye
movements from 13 guinea pigs. The magnitude of movement
ranged up to 5-mm and was easily recorded with vertically
placed subdural electrodes. Fig. 18 illustrates electro-
physiologically recorded eye movements. In 18-A and 18-B the
stimulus marker is on the top trace, time in seconds is indicated
on the middle trace, and the bottom trace represents the eye
movements. Unidirectional dorsal eye movements produced the
record illustrated in 18-A. The electrical change illustrated
in 18-B is bidirectional. Whether the eye movement that was
associated with this record was also bidirectional could not
be determined optically, and the initial electrophysiological
change may have been the result of muscle potentials rather
than eye movements.
Computer-generated averages of 14 and 10 responses to tone
bursts are illustrated in Figs. 18-C and 18-D, respectively.In the case of Fig. 18-C the eye appeared to move unidirectionally
and dorsally. The onset of this dorsal eye movement had a
latency of about 79-msec. In the record of Fig. 18-D the trace
is bidirectional: the downward trace deflection (indicating
dorsal eye movement) had a latency of about 62-msec and the
42

AA, A ,, 4, A
0.1.M
/! .1 ./ /1 /I '
0.1 mVyi/
S i ,i I
B
, ! I iL
C D
500 msec 500 msec £
Figure 18. Eye movements evoked from guinea pigs by repetitiveaudiofrequency transients. See text.
"• ••'••'••'•"'• ... "•,• • .••.;..•,,.s-o••,•.•.. "' -' -. • :•._• • , • .• ,..

upward portion of the trace deflection had a latency of about
20-msec. The form of response illustrated in Fig. 18-D was
seen in approximately one-third of the computer averaged records.
Eye movement latencies recorded from one animal averaged 64-msec
(standard error of the mean = 4.7-msec)l in those cases where
the early component was recorded, the latencies averaged 23-msec
(standard error of the mean = 2.0-.msec). The stimuli thatelicited these responses had a frequency of 800-Hz, onset/offset
time of 5-msec, and varied in duration between 10- and 300-msec.
Response amplitude was an increasing monotonic function ofstimulus intensity, as illustrated in Fig. 19. The filled
circles indicate the response evoked by a 1000-Hz stimulus, and
the open circles indicate responses evoked by a 500-Hz. Each
point represents the average of 8 responses. The 1000-Hz
response appears to saturate around 150-dB. The lines of best
fit were determined by eye, and power functions were calculated
from the lines following the equation R = k Sn, where R is
response magnitude, S is stimulus intensity, k is a constant,
and n is an exponent. The nonasymptotic portion of the 1000-Hz
plot yielded a power function that has an exponent of 0.91 and
the 500-Hz plot had an exponent of 1.27.
Response duration was an increasing monotonic function of
stimulus duration up to 300-msec, which was the maximum stimulus
duration examined in this study. Minimum response duration wasabout 50-msec. The response amplitude reached an asymptotic
value for stimulus durations of 100- to 300-msec in several
animals
The effects of varying onset/offset time were examined innine animals. Onset/offset times of 5-, 10-, 25-, 50-, and
l00-msec at durations of 15-, 20-, 30-, 50-, 100-, 200-, and
300-msec were employed. The repetition rate was held constant
at 2/sec. The curves of response amplitude as a function of
onset/offset time for the various durations revealed an inverse
44

0n00
00
* 0
AJ~
w 0dII
"4In0
C*4 LO
C) *
'.40)oallW 4. OHS3
-4

relationship between onset/offset time and response amplitude.
Analysis of all possible pairs of onset/offset times within
durations, within animals using a binomial test indicated that
this relationship is statistically significant beyond the 0.001
probability level. The data from which the curves were derived
are quite irregularl beyond the relationship between response
amplitude and onset/offset time the curves yielded little
information.
Complete data concerning the effects of varying stimulus
repetition rate on eye movement amplitude were obtained from six
ears. The curves from six animals of average response amplitude
as a function of repetition rate are illustrated in Fig. 20.
Each separate curve represents a different stimulus duration (the
maximum stimulus duration was limited by the repetition rate).
The standard error of the mean varied from 0.0006- to 0.010-mv
for the points presented in Fig. 20. Generally, larger eye
movements were produced by lower stimulus repetition rates.
Departures from the low repetition rate-large eye movement
trend can be seen in the curves between the repetition rates of
10/sec and 5/sec. In 15 of 30 possible comparisons, 10/sec
elicited larger eye movements than 5/sec; for 95 other possible
comparisons in only 16 cases did the higher repetition late
elicit a larger response than the lower repetition. Employinga binomial expansion, the probability-that the direction of eye
movement magnitude changes for the 10/sec to 5/sec comparisons
was drawn from the same population as for the other comparisons
(50/sec to 33/sec, 33/sec to 20/see, 20/sec to 10/sec, and 5/sec
to 2/sec) is less than 0.02. In other words, stimuli at 10/sec
elicit larger responses with respect to stimuli at 5/sec than
would be expected on the basis of examination of the responses
to the o'cher repetition rates.
Observations with Monkeys
Useful observations were obtained from seven Rhesus monkeys.
46

a a
in 4)3
4.JO0) 4)
AN
ioo
E .-
w r
-P 0
0 3r
b 0Cd
E 0
E -N •a,
N r
E inIn INw0
N
1-4+
in4$
In N
AW -3UfjlJldflV 3SNOdS3H
47

Thresholds for rotatory nystagmus were determined by cirect
observation through an operating microscope during stimulation
at frequencies ranging from 100- to 2000-Hz. The sound levels
employed to study the effects of interruption were ordinarily
set about 5-dB below the levels of sound that would elicit
nystagmus when the stimulus was presented continuously.
During previous experiments we had noted that the monkey's
responsiveness changed markedly over time. These responsiveness
changes were apparently associated with several factors,including damage and degree of arousal. We were able to check
possible gross damage by examining the external meatus and the
tympanic membrane with the otoscope. We attempted to maintain
arousal by tickling the monkeys, shaking their limbs, and"making faces" at them.
For the studies on the effects of intermittent sound, the
stimulus intensities were set at a level that elicited clearly
detectable eye movements. The observer's task was to observe
the monkey's eye movement through the operating microscope and
to estimate the magnitude of movement. The intensity levels
that yielded clear eye movements varied across frequency. jBecause of these intensity differences, response variation as
a function of frequency was confounded and therefore was not
investigated systematically.
The initial repetitive sound observations were concerned
with determination of the effects of variation in stimulus
duration. Durations between 50- and 120-msec were used.
During these initial observations it became apparent that the
response changes produced by changes in the parameters of
interrupted sound stimulation that we were employing were small
and variable. In an attempt to obtain useful data, paired
comparisons procedures were employed in the subsequent monkey
experiments.
48

Two types of paired comparisons studies were performed with
the monkeys. In the first type of paired comparisons study,
three onset/offset times (10-, 25-, and 50-msec) were examined.
Each onset/offset time was paired with the other two onset/offset
times, and order was counterbalanced. The sequence of
presentation of the six possible pairs was randomized. The
onset/offset time paired comparisons were studied at three
frequencies (300-, 1000-, and 3000-Hz) and three repetition
rates (2/sec, 5/sec, and 10/sec). Only onset/offset time was
varied within a pair of stimulus presentations. In the second
type of paired comparisons study, three levels of repetition
rate were systematically paired at each of the three frequencies
and three onset/offset times.
Responses to the various stimuli were determined by direct
observation through the operating microscope. Ordinarily a
particular stimulus constellation (frequency, intensity,
onset/offset time, duration, and repetition rate) was presented
for a period of 5- to 10.-sec. The observer's task was to state
which of the pair of stimuli elicited a larger eye movementresponse.
Repetitive acoustical transients (trains of tone bursts)
elicited brief, transient eye displacements (jerks) at the
frequency of repetition. Under direct microscopic observation,these jerks appeared very quick (less than 0.1-sec duration)
and the eye appeared to return to the original resting positionbetween tone bursts. These eye jerks elicited by intermittent
sound could be observed at stimulus intensity levels onlyslightly below (2- to 5-dB) those at which continuous sound
would elicit nystagmuq.
Response differences as a function of the intermittent
sound stimulus characteristics were observed in 10 ears from 6monkeys. The following characteristics of the tone bursts were
varied: frequency (300- to 3000-Hz), intensity (120- to 172-dB),
49
............

•~~~~. 7,••..<•.
duration (50- to 200-msec), repetition rate (1/sec to 10/sec),
and onset/offset time (5- to 50-msec).
Effects of varying stimulus duration were observed in two
ears. The results indicate that variation of the stimulus
duration between 50- and 120-msec did not produce notable
differences in eye movement amplitude, For longer stimulus
durations, some decrement in response amplitude was observed.
Paired comparisons observations were performed varying
stimulus onset/offset time and repetition rate. Complete paired
compa,'isons observations of onset/offset time were obtained from
two ears. Overall (collapsed across frequency and repetition
rate) none of the onset times produced a larger response than
the other two onset times at a statistically significant level.
However, in one subset of data a clear interaction between
stimulus frequency and onset/offset time was revealed. As
illustrated in Fig. 21-A, the number of observations for whicha particular onset'offset time produced a "larger" response
varied as a function of frequency (collapsed across repetition
rates). At the high frequency the short onset time tended to
produce a larger response, whereas at the low frequency the
longer onset time seemed to be more potent. Differences between
the two onset/offset curves as a function of stimulus frequency
are significant beyond the 0.05 level (X2 = 7.10, p < 0.05 with
2 df).
Complete paired comparisons data on the effects of variation
in repetition rate were obtained for two ears. One of these
ears yielded the data illustrated in Fig. 21-B. The two curves
represent the number of "larger" responses elicited by different
repetition rates for two stimulus onset/offset times. The data jwere collapsed across frequency (300-, 1000-, and 2000-Hz) to
yield these curves. X2 analysis indicates that the 5/sec
repetition rate elicited a "larger" response more frequently
than repetition rates of 2/sec and 10/sec (collapsed across
50

N
to N
.00 P-4-,
.00,O
'.00
1L1
rN 0
to~ Wn
S3SNOdS3H AU3DUVI, :J0 38wflN
51
* . ...... . .. ...

frequency and onset/offset time; X2 = 6.73, R < 0.05 with 2 df).
The interactions of repetition rate by frequency and repetition
rate by onset/offset times did not approach statistical
significance. Data from the second ear that yielded a complete
paired comparisons study of repetition rate did not show a 5
statistically significant trend in favor of the 5/sec repetition
rate.
Observations with Human Beings
The effects of intermittent and continuous 1000-Hz tones
on human equilibrium was examined by Harris (ref 18). Harris
demonstrated that sound monaurally presented at intensities as
low as 95-dt ;coduced statistically significant decrements in
the ability of a subject to maintain equilibrium in a rail test.Harris' results suggested that intermittent sound might provide
a more effective stimulus for the vestibular system than
continuous sound.
Reschke, Homick, Landreth, and Parker (ref 31) recently
reported the results of an experiment on transient visual fieldshifts evoked by acoustical stimulation in man. Among thefindings reported by Reschke et al, are the following:
(1) Rapid onset tone bursts (less than 50-msec rise time) evoke
transient lateral shifts of the visual field. (2) Slow onset
tone bursts (greater than 50-msec rise time) evoke tilting or
rotation of the visual field which subjectively appears to have
a greater latency than the lateral visual field shifts.(3) Maximum response sensitivity was observed in the 800- to
900-Hz frequency range. (4) The appearance of visual field
shifts in response to sound was correlated with the middle ear
muscle reflex.
Recently we undertook a second series of studies concerning
the apparent visual field shift evoked by repetitive acoustical
transients in human beings. These studies employed the
'.4
52
. . .......

psychophysical techniques of magnitude estimation and paired
comparisons: the observer's task was to indicate the apparentmagnitude of displacement of an object in the visual fieldfollowing exposure to train of identical acoustical transients
(magnitude estimation) or to indicate which of two trains oftransients, which were similar with the exception of one
dimension, evoked greater apparent movement (paired comparisons).
These apparent visual field shift studies are incomplete.However, the trends of the initial observations are as follows.Fir.ý ;ound stimulation at the 120- to 125-dB level produces
appac'ent displacement of the visual field in about 50% of the" dividuals examined. Characteristics of the apparent motion
vary across observers and within observers across time. Second,slow repetition rates tend to produce greater apparent motion
than rapid repetition rates. There is a slight suggestion of aresonance at repetition rates of 1/sec to 1.3/sec; however, the
apparent motion produced by stimuli in the 1/sec repetition raterange is greater than the apparent motion produced by stimuliin the 3/sec to 5/sec repetition rate range. Third, the stimulusfrequencies that elicit the largest apparent displacement
responses vary across individuals. In general, stimuli of 500-and 800-Hz evoke a greater response than do stimuli of 100-,300-, and 1000-Hz. Fourth, the observations for stimulusdurations of 50- to 500-msec yield no clear trend.
INTERACTION BETWEEN ACOUSTICAL VESTIBULAR STIMULATION
AND OTHER TYPES OF VESTIBULAR STIMULATION
Observations have been performed concerning the interaction
between sound and three other forms of vestibular stimulation(angular acceleration, caloric stimulation, and alcohol injection)
employing guinea pigs and monkeys.
Acoustical Vestibular Stimulation and Angular Acceleration
The effects of angular acceleration on the latency of eye
53

o r , - ... "
movements evoked by pressure transients were investigatedemploying three guinea pigs. Angular displacement was around
the animal's longitudinal body axis (Z-axis) with the animal in
the prone position and had a magnitude of 90 degrees. Theangular displacement approximated a ramp function; the majorstimulus parameter varied was rotation duration (5- to lO-sec).
Acoustical stimulation (a pressure square wave slightly greater
than the minimum necessary to elicit nystagmus) was presented
at the termination of the angular displacement or during angular
displacement.
The latency of the eye movements evoked by the starL,;
pressure stimulus was determined by direct observation through
an operating microscope and with the aid of an oscillograph.
Latencies were determined across a series of stimulations when
the pressure stimuli were combined with angular acceleration
(experimental condition) and when the animal had been stationary
for at least 1-min (control condition). The sequence of
conditions was counterbalanced and the results were analyzed
with a paired "t" test.
As has been described previously (ref 28), static pressure
evokes a complex eye movement from the guinea pig. This eye
movement consists of a counterrolling component and a nystagmus
component. For ,ne animal angular displacement of the head
toward the pressure stimulated ear produced a significant
decrease in the latency of the nystagmus response to the static
pressure (t = 4. 9 9 4, df = 29, y < 0.001). Similar results were
obtained in a second experiment with another animal. Because
the position of the statolith organs with respect to gravity
changes during horizontal axis rotation, the results obtained
in these experiments cannot be attributed to semicircular canal
action with confidence. This difficulty was overcome by
subjecting the animal to rotation around the Z-axis with the
Z-axis oriented vertically. These observations have not been
completed.
5 4~

Acoustical Vestibular Stimulation and Caloric Irrigation
The effects of caloric stimulation on the latency of eye
movements evoked by pressure transients was investigatedemploying 10 guinea pigs. Water caloric stimuli were presented
through a tube which terminated near the tympanic membrane.
Hot calorics were 48-deg C; cold calorics were 25-deg C. The
apparatus was set to a flow rate of 0.2 cc per sec.
The guinea pigs appeared to be quite insensitive to caloric
stimulation. Only rarely were eye movements evoked during the
caloric stimulaticm i>en in those instances we cannot be sure
whether the responses were the result of the caloric character
of the stimulus or some other characteristic such as the
pressure produced by the water flow. Further, no evidence of
response to caloric stimulation was seen when the animal was
prone; only when the animal's Y-axis was in the vertical plane
and the nose was elevated 30- to 45-deg was evidence of caloric
stimulation of the vestibular system obtained.
Two types of experiments were performed. In the first type,
hot or cold stimulation was presented to the top ear for 10-
to 30-sec followed immediately by static pressure stimulation
of the contralateral ear (successive stimulation). In the
second type of experiment, caloric and static pressure
stimulation were presented simultaneously. At least 1-min
elapsed between presentation of the caloric stimuli. The static
pressure was set to a lfvel that was slightly greater than the
threshold for eliciting eye movements. Latencies of
counterrolling and nystagmus were recorded as in the experiment
on interaction between angular acceleration and acousticalvestibular stimulation.
The pattern of eye movements evoked by static pressure
following cold caloric irrigation differed from the pattern of
eye movements following hot caloric irrigation. After
55

oontralateral caloric stimulation, the ventral component of the
pressure-evoked counterrolling was more pronounced when cold
water was used than when hot water was used. Differences in
latency of counterrolling following hot and cold caloric
stimulation were small and not statistically significant. On
the other hand, nystagmus differences were pronounced. For one
animal, the nystagmus latency following cold caloric stimulation
was larger than the latency following hot caloric irrigation
(t = 1.73, df = 19, P_ < 0.05). Essentially the same result was
seen in two other animals.
The interaction between caloric stimulation and sound is
currently being examined in monkeys. The results of the
observations are incomplete.
Acoustical Vestibular Stimulation and Alcohol Injection
The effects of alcohol on eye movemen ., evoked by sound were
examined in 3 monkeys and 4 guinea pigs. The general procedurefollowed was to determine the animal's threshold and then to
repeat threshold determinations following intravenous injectionof normal saline solution (control condition) or ethanol
(experimental condition). Alcohol doses ranged from 0.5- to J4-cc of 10C% ethanol. Gas'chromatograph analyses of blood
samples indicated blood alcohol levels ranging from undetectable
to 6.6%.
The influence of alcohol on the response evoked by acousticalvestibular stimlulation differed for the guinea pigs and the
monkeys. In the case of the guinea pigs, the latency ofnystagmus evoked by a particular intensity of static pressure
in the external auditory meatus was not affected by alcoholinjection up to the point of death. On the other hand, the
rotatory eye movements evoked by transient sound bursts were
strongly affected by alcohol injection in the monkeys.Essentially, the monkeys appeared to "pass out." Initially,
56

sound evoked eye movements could be detected at approximately
the original levels if strenuous efforts were made to arouse
the monkey. H{owever, with the passage of time (ranging from
5- to 30-mmn apparently depending on amount of alcohol injected)
it became impossible to arouse the monkeys, and no eye movements
related to the acoustical stimulation could be detected. The
loss of sound evoked eye movements for one monkey is illustrated
in Fig. 22.
The studies reviewed in this section support the view that
sound activates the vestibular system by stimulating semicircular
canal receptors. Further, it can be suggested that the
combination of acoustical stimulation and acceleraition should
produce greater disturbance of human performance that requires
accurate vestibular information than when either acceleration
or sound are presented alone. This prediction should be
examined employing human observers. A
The results of the alcohol studies were somewhat surprising.
On the basis of Schroeder's studies (refs 33 and 34) we hadanticipated that alcohol. injection would potentiate the response
produced by acoustical stimulation. The reason for the failureI
to observe potentiation, particularly in the monkey, is unclear.The experiment probably should be repeated employing huma.n
observers before we embark on extensive speculation.
MISCELLANEOUS ADDITIONAL EXPERIME~NTS
Before performing the observations reported in the preceding
sections, we undertook a series of preliminary experiments that
were concerned with the effects of pressure transients in the
guinea pig. We wished to ascertain that the head and eye
movement responses evoked by pressure transients were a result
of vestibular endorgan stimulation.
Five preliminary experiments were performed. First, we
574

T I I0
44I-4 w$
mz
CL004
U)j 0,
200
LU Z.
Z_ _ _ _ _ _ _ _ _ _ _ _ _ _ _ _ 0 T)
am0
040 -49-1
0
04.4
u4 - , - w4 i-I r ~ 9 4 P-I 4 V4 0 -4 W4('
UdS OP -sflR9VISAN HOAI U11HS3IH.LPL4
58
L .7777=. - j

sectioned th% eighth cranial nerve unilaterally in six guinea
pigs. No physiological vestibular responses could be obtained
from the ears on the side of the lesion. These results indicatethat the transient pressure stimulus affects receptors served by
the eighth nerve. Second we subjected guinea pigs to streptomycin
intoxication, which produces destruction of vestibular andcochlear sensory hair cells (ref 37). Little or no physiologicalvestibular response to pressure transients could be obtained
from the streptomycin intoxicated animals. The implication ofI
these results is that physiological vestibular responses topressure transients are mediated by membranous labyrinth sensory
hair cells.
The third preliminary experiment attempted to determine
whether the cochlear or vestibular hair cells are responsiblefor the eye movement responses to pressure transients.Stimulation deafness was produced by high intensity, longduration noise exposure. This procedure destroys the cochlearIsensory hair cells (ref 38). Nystagmus could be elicited from
noise-deafened animals by- pressure transient stimulation atapproximately the same intensities as prior to noise exposure,indicating that the cochlear hair cells are not responsible for
this response.
The fourth and fifth preliminary experiments sought todetermine the vestibular receptor that mediates the eye movementresponses to pressure transients. We removed the statolith massfrom the statolith organs by centrifugation (see ref 25).Nystagmus was elicited at the usual levels of pressure transientstimulation; a subsequent experiment indicated that this procedurereduced the amplitude of head movement responses to pressuretransients. Finally, we surgically blocked th semicircular
canals (see ref a). Following blockage of all three canals,eye movement responses to pressure tranpients were eliminated.Incomplete responses were observed in those instances where onlyone or two of the three canals was blocked. The results of this
59

experiment are difficult to interpret because of the high,
incidence of postoperative middle ear infection. The
observations are consistent, however, with the hypothesis that
pressure transients stimulate the semicircular canal receptors.
60
* . . . ........

SECTION III
DISCUSSION
The results of the experiments described in the preceding
section do not provide us with complete answers to our questions
concerning the biomechanical and physiological mechanisms of
acoustical vestibular stimulation. A major difficulty is the
failure of the monkey to exhibit physiological vestibular responses
to pressure transients (at the intensities that we employed),
whereas monkeys demonstrate these responses to.audiofrequency
sound at approximately the same intensities as the guinea pig or
human beings.
In the first part of this discussion we consider differences
between guinea pig and monkey ears that may help us to understand
the differences in responses that we have observed. The second
part of the discussion focuses on possible mechanisms ofacoustical vestibular stimulation and attempts to assess our
current position.
ANATOMICAL DIFFERENCES BTWEEN GUINEA PIG AND MONKEY EARS 4
The ears of monke>y and guinea pigs are quite similar;
however, there are a !'ew anatomical differences between these
species that may help to explain the response differences that
we have observed. Three possibly important anatomical
differences between the middle ears of these two species have
been noted. First, the malleus and incus are fused in the adult
guinea pig, whereas these two middle ear bones remain separate
in the adult monkey. Second, the anterior process of the malleus
is well developed in the guinea pig and Geverely limits medial
displacement of the malleus manubrium. Our observations suggest ithat the guinea pig's malleus anterior process may provide a
fulcrum for malleus rotation when the tympanic membrane is
61

strongly displaced; this may account for the bidirectional stapes
displacement that we have noted when the guinea pig is exposed
to increased pressure transients. The anterior process of the
monkey's malleus does not appear to limit medial malleus
displacement. Third, the angle between the manubrium of the
malleus and the long process of the incus is approximately 15
degrees in the monkey and about 45 degrees in the guinea pig.
Information concerning differences in the labyrinths of
guinea pigs and monkeys is not 'readily available. For example,
we do not know the relative ease of fluid flow through the
perilymphatic and endolymphatic ducts in these species; we do
not know if there are differences in the relative stiffness of
the various labyrinth membranes. Clearly, information concerningthese points is required before we can confidently account forthe response differences that we have observed.
MECHANISMS OF ACOUSTICAL VESTIBULAR STIMULATION
Development of a biomechanic~l/physiological model for
vestibular stimulation by sound energy is one of' the goals that
has been pursued in o r laboratory. Before proceeding to
consideration of particular hypothetical mechanisms, we note
three assumptions concerning the general nature of the system.
Assumptions
The following assumptions underlie our acoustical vestibular
stimulation hypotheses. First, wre assume that sound energy
elicits vestibular responses as a result of its action upon
vestibular endorgans. In other words, we do not believe that
sound energy somehow bypasses the vestibular receptors and
directly affects central nervous system nuclei. Visual,
olfactory, and gustatory responses would be expected if sounddirectly affected the central nervous system, and this is not
the case (with the possible exception of focused ultrasound).
This assumption is supported by the preliminary experiments
62

that are summarized in Section II, p. 57. Second, we assume
that sound energy elicits vestibular responses by displacing a
component of the vestibular endorgans. This assumption is based
on well-established observations of vestibular physiology which
indicate that vestibular endorgans are activated by the shearing
force produced when accessory structures are displaced with
respect to the sensory hair cells (see Section I, p. 5). This
assumption is also supported by the observation that vestibular
responses evoked by particular sounds have the same form as
those responses elicited by "adequate" vestibular stimulation
(acceleration) and that essentially the same response can be
observed across several stimulus replications. Third, we
assume that vestibular endorgan components are displaced as a
consequence of labyrinth fluid displacement. This assumptionis based on the observation that the middle ear transduces
sound energy into labyrinth fluid displacement, as noted in
Section I, p. 5.
Alternative Hypotheses
As noted in the preceding section, we assume that sound
activates vestibular receptors as a result of labyrinth fluid
displacement. Alternative hypothetical mechanisms of acoustical
vestibular stimulation reflect the possible types of fluid
displacement in the labyrinth.
We distinguish between three main classes of sound-induced
labyrinth fluid displacement: (1) ac volume displacement,
(2) eddy currents, and (3) dc volume displacement. Sound
stimulation at o dinary intensity levels results in stapes
oscillation; the stapes oscillation produces oscillation of the
endolymph and perilymph (ac volume displacement) which is
compensated by, ac displacement of the elastic round window
membrane (see Section I, p. 5). Localized rotatory fluidmotion--eddy currents--appear during high velocity fluid
displacement. Deetjen (ref 9) and von Bdk~sy (ref 5) have
63
• - •:t -.:,.,"-.+•P•--.,): I
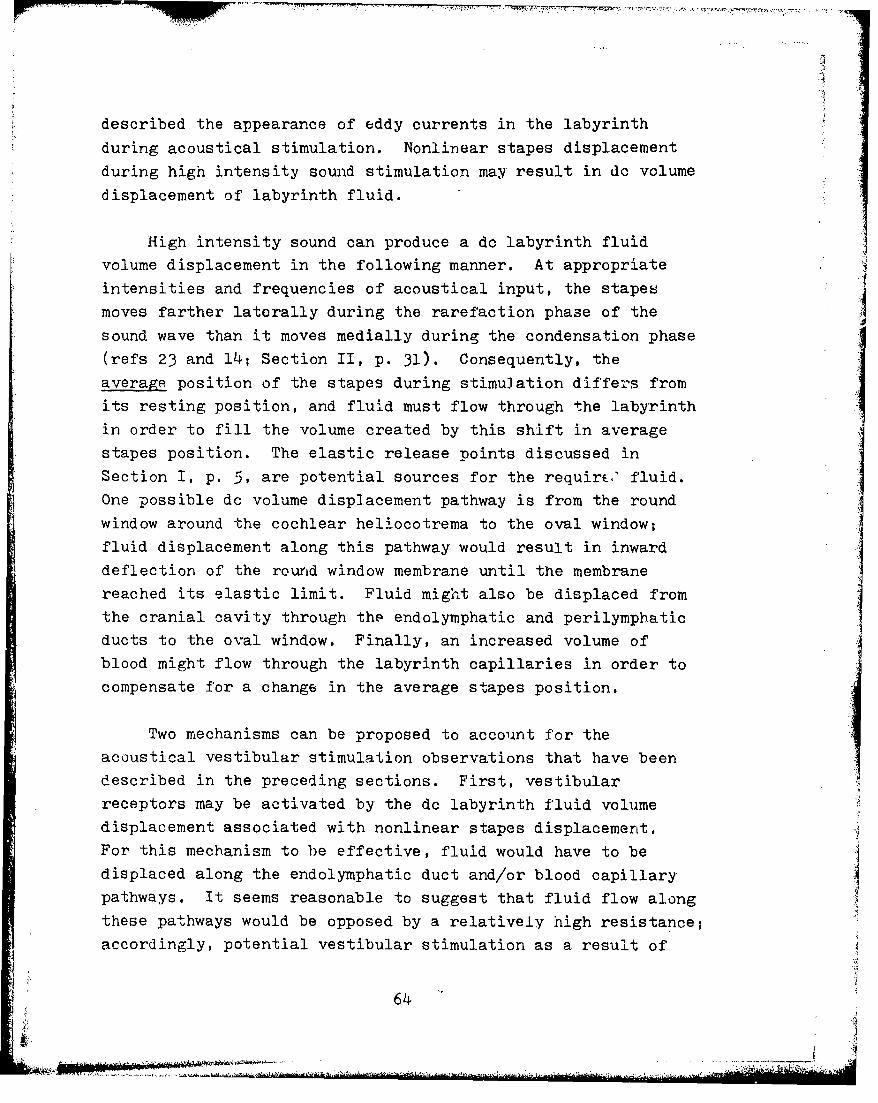
described the appearance of eddy currents in the labyrinth
during acoustical stimulation. Nonlinear stapes displacement
during high intensity sound stimulation may result in dc volume
displacement of labyrinth fluid.
High intensity sound can produce a dc labyrinth fluid
volume displacement in the following manner. At appropriate
intensities and frequencies of acoustical input, the stapes
moves farther laterally during the rarefaction phase of the
sound wave than it moves medially during the condensation phase
(refs 23 and 14; Section II, p. 31). Consequently, the
average position of the stapes during stimuiation differs from
its resting position, and fluid must flow through the labyrinth
in order to fill the volume created by this shift in average
stapes position. The elastic release points discussed in
Section I, p. 5, are potential sources for the requir.' fluid.
One possible dc volume displacement pathway is from the round
window around the cochlear heliocotrema to the oval window;
fluid displacement along this pathway would result in inward
deflection of the round window membrane until the membrane
reached its elastic limit. Fluid might also be displaced from
the cranial cavity through the endolymphatic and perilymphatic
ducts to the oval window. Finally, an increased volume of
blood might flow through the labyrinth capillaries in order to
compensate for a change in the average stapes position.
Two mechanisms can be proposed to account for the
acoustical vestibular stimulation observations that have been
described in the preceding sections. First, vestibular
receptors may be activated by the dc labyrinth fluid volume
displacement associated with nonlinear stapes displacement.
For this mechanism to be effective, fluid would have to be
displaced along the endolymphatic duct and/or blood capillary
pathways. It seems reasonable to suggest that fluid flow along
these pathways would be opposed by a relatively high resistance;
accordingly, potential vestibular stimulation as a result of
64

this fluid flow should have a relatively long time constant
(see Fig. 9). Second, the receptors of the vestibular apparatus
could be stimulated by a combination of the dc volume displace-
ment and eddy currents in the labyrinth fluids. This second
mechanism can be visualized in the following manner. Eddy-
currents are produced in the labyrinth fluids as a result of
high velocity fluid oscillation during audiofrequency sound
exposure. N~ormally these eddy currents remain localized in
the cochlear region of the labyrinth. Increasing sound
intensity has two effects. First, the strength of the eddyI current may be slightly increased. Second, stapes nonlinearityproduces a dc flow of fluid through the labyrinth that displacesthe eddy current from its usual location toward one of the
vestibular endorgans. The manner in which this might work maybe clarified if you consider the situation when a canoe paddle.Iis passed through the water of a moving river. Passage of the
paddle through the water creates small swirls or eddy currents
that are carried downstream by the current of the river until
they dissipate. The relatively long response time constant
that was suggested for the first mechanism would also beI
postulated with this second mechanism.
Observations with guinea pigs and human beings support a~1 dc fluid displacement mechanism of acoustical vestibular
stimulation. Guinea pigs exhibit clear physiological vestibular
responses to pressure transients. It is difficult to conceive
of eddy currents being generated by pressure transient ramp
functions such as those illustrated in Figs. 6 and 7;nevertheless, ramp function stimulation does elicit eye and head
movement responses from guinea pigs. Consequently, the dno
labyrinth fluid flow produced by static displacement of theI stapes is apparently sufficient, to stimulate guinea pigvestibular receptors. The experiments described in Section II,p. 57, suggest that the semicircular canal crista organs are
activated by this fluid flow. In the case of theobservations with human beings apparently, a particular level
65

of volume displacement must be reached before the vestibular
receptors ar.3 activated; however, the observations are
consistent with a dc fluid displacement mechanism. iJ
When we examine the monkey's response to acoustical
stimulation, the picture becomes confused. Part of our problemis attributable to the fact that we have been unable to obtain
direct dc fluid volume displacement measurements from thelabyrinths of either guinea pigs or monkeys up to the present
time. In the absence of direct fluid volume displacement
observations, we can suggest that perilymph pressure changesare correlated with dc volume displacements. Examination of
Figs. 6, 7, and 15, keeping this assumption in mind, is
instructive. Rotatory nystagmus has been observed in the
monkey following stimulation with an 800-Hz tone at 149-dB SPL.Figure 15 indicates that an audiofrequency stimulus of this
magnitude can result in an 0.03-mm Hg perilymph pressure dropin the monkey's semicircular canal. Fig. 7 demonstrates that
perilymph pressure drops of approximately 0.08-mm Hg can be *1elicited by pressure transients at the tympanic membrane in the
monkey. If a perilymph pressure drop of 0.03-mm Hg is
associated with physiological vestibular responses toaudiofrequency sound, why do perilymph pressure drops of morethan double this value fail to produce similar vestibular
responses when pressure transients comprise the stimulus?
At least three answers can be given to the preceding
question. First, our assumption regarding the correlationbetween perilymph pressure change and volume displacement may
be incorrect; for a given perilymph pressure value, the
magnitude of labyrinth. fluid flow may be less in the monkey
than in the guinea pig. Second, dc volume displacement alone
may not be an effective vestibular stimulus for the monkey.
It is quite conceivable that the various elastic release points
in the monkey present a different pattern of opposition tofluid flow in the monkey from that which obtains in the guinea
66

pig. If this is the case, the pattern of dc fluid displacement
resulting from stapes nonlinearity in the monkey could
completely bypass the vestibular receptors. Consequently, the
dc displacement-eddy current mechanism of acoustical vestibular
stimulation may be required to explain the results with monkeys.
Third, the middle ear nonlinearity may result in larger
labyrinth fluid pressure changes at tone onset than during
continuous stimulation.
We offer no explanation for the apparent discrepancy between
the observations with monkeys and those with human beings, at
the present time. Perhaps the inner ears of monkeys and human
beings differ in some critical, yet currently unknown manner.
Before proceeding with a theoretical analysis, the monkeys
should be studied employing the techniques of Ingelstedt et al
(ref 21) and human beings should be examined with external
auditory meatus pressure transients.
Further support for the dc displacement-eddy current
hypothesis is found in the observations with repetitive
audiofrequency sound. In human beings, acoustic transients
evoke motion sensations at levels well below those at which
sustained sound results in vestibular response. The stapes
nonlinearity should result in a movement of the eddy current
produced by the audiofrequency component of the stimulus.
Kobrak's observaticns (ref 23) suggest that the onset of thisnonlinearity in human beings should be in the 110- to 120-dB
range, which corresponds quite well with the observed onset of
vestibular responses. In this regard the apparent onset of
stapes nonlinearity in cats (ref 14) and guinea pigs (Section
II, p. 31) occurs at levels 10- to 20-dB higher than in human
beings. This conclusion, while it fits with our observations,
should be viewed with caution because of the differences in
techniques employed by Kobrak, by Guinan and Peake, and in
our laboratory.
67
Elsewhere (ref 27) we have suggested that repetitive
audiofrequency stimulation should activate the vestibular
system as a result of the demodulation properties of the
nonlinear middle ear transmission. Audiofrequency sound
modulated with infrasound or interrupted must result in a
rectified component at the output of the middle ear that would
manifest itself as infrasound or changing static pressure at
the input to the inner ear. It might therefore be more
effective with respect to vestibular stimulation than primary
infrasound or static pressure stimuli at the tympanic membrane,
which would be considerably attenuated by the middle ear.
Further experimental data to clarify these mechanisms are
required.
The acoustical vestibular stimulation mechanisms suggested
by our research differ from those proposed by previous
investigators. Deetjen (ref 9) observed the formation of eddy
currents in labyrinth fluids during intense acoustical
stimulation. He hypothesized that the eddy currents stimulate
the semicircular canal crista organs because they produce
endolymph displacement. We reject the hypothesis that eddy
currents alone are sufficient to elicit vestibular-induced
eye and head movements for the following reasons. First,
several lines of evidence suggest that the mechanisms which
transduce sound pressure into ac labyrinth fluid displacement
saturate in the 120- to 140-dB SPL range (refs 6 and 38). If
eddy currents alone account for the appearance of physiological
vestibular responses, we would expect to observe these responses
at stimulus intensities below 135-dB SPL. Second, Figs. 13 and
14 suggest that change in the average position of the stapes
first appears for stimulation in the 134- to 144-dB SPL
intensity range. The correlation between the appearance of
this form of stapes nonlinearity and physiological vestibularresponses is consistent with the suggestion of a combinationeddy current-dc fluid displacement hypothesis of acoustical
vestibular stimulation (in the monkey).
68$

In 1935, von Bdkdsy (ref 5) proposed that the statolith
organs are stimulated by high intensity sound exposure. Hesuggested that eddy currents produce displacement of thestatolith organ sensory epithelium. The hair cells arestimulated because the motion of the statolith mass lags behindthe motion of the sensory epithelium. Our observations suggestthat the semicir .ular canal crista organs rather than thestatolith organs are stimulated by intense sound. Thisconclusion is valid, however, only for the types of responsesthat we recorded. Other types of vestibular responses toacoustical stimulation may derive from statolith organdisplacement (see Section II, p. 57). I
A
69

SECTION IV
CONCLUSIONS
The experiments that we have described are concerned with
determining the mechanisms of acoustical vestibular stimulation.
Two possible stimulation mechanisms are proposed, (1) a dc
fluid displacement hypothesis, and (2) a combination dc fluid
displacement-eddy current hypothesis. Biomechanical and
physiological responsea to acoustical stimulation have been
examined in guinea pigs, monkeys, and human beings. The
acoustical stimuli included (1) pressure transients (step and
ramp functions of pressure change at the tympanic membrane),
(2) infrasound, (3) intense audiofrequency sound, and
(4) repetitive audiofrequency transients. Stapes displacement
and perilymph pressure change were the biomechanical responses
examined. Physiological responses included vestibular nerve
recording, eye movements (slow rolling and nystagmus), head
movements, perceived displacement of the visual field, and
postural equilibrium.
The results of experiments with acoustical pressure
transients are as follows.
e Longitudinal-axis stapes displacement was produced by
step and ramp functions of pressure in guinea pigs. Increased
pressure at the tymipanic membrane elicited a bidirectional
stapes displacement; tympanic membrane pressure decreases
resulted in unidirectionally increasing lateral stapes
displacement. A transfer characteristic relating tympanic
membrane pressure change to stapes diuplacement for the guinea
pig is given in Fig. 4. For hunan cadavers, the stapes
displacements evoked by pressure transients were monotonic;
however, a nonlinear response was produced by static pressure
increases (Fig. 5).
70

a Perilymph pressure recordings yielded results which wereessentially equivalent to the stapes displacement observationsfor the guinea pig. For the monkey, perilymph pressure changeswere a monotonic function of tympanic membrane pressure changesand were of smaller magnitude than those observed in the guineapig. Transfer characteristics relating perilymph pressurechanges to pressure transient stimulus intensity are given inFigs. 6 and 7 for the guinea pig and monkey, respectively.
9 Changes in rate of vestibular neuron response were
elicited by pressure transients at the tympanic membrane of the
guinea pig. Tympanic membrane pressure increases resulted ina decrement in neuron action potential rate and vice versa.
* Head and eye movements were evoked from unanesthetized
guinea pigs by pressure transients. Minimum stimulus intensitiesrequired to elicit these responses were in the range of 1.5-to 2.0-cm Hg.
9 No evidence of vestibular-induced eye movement3 could be
detected in monkeys exposed to pressure transients up to 40-cm
Hg.
* Nystagmus was evoked from about 6% of the normal human
observers who were exposed to whole-body pressure increases.These observers all exhibited unusually high forcing pressures
for opening the Eustachian tube on one side.
Stimulation with infrasound yielded the following
observations:
a Perilymph pressure changes replicated the infrasound
stimulus waveform at frequencies in the low infrasonic (0.5- to2-Hz) and low audiofrequency (40- to 50-Hz) ranges. Stimulationbetween these frequency ranges resulted in complex perilymph
pressure changes that were composed of at least two response
71

-.... ....... ..... -.....1.... '-.. . . ... ........... ...
A
components. Peak to peak perilymph pressure evoked by
particular stimulus intensities were lower for the monkey than
for the guinea pig. The frequency response of the monkey's
ear differed frnm the frequency response of the guinea pig's
ear, when examined with infrasound.
a Consistent vrestibular-induced eye movements could notbe detected in guinea pigs, monkeys, or human beings exposeid
to infrasound at intensities up to 172-dB SPL.
Sustained audiofrequency sound stimulation results were as
follows:
* The average position of the guinea pig stapes during
intense audiofrequrpncy sound stimulation differed from the
resting position. The magnitude of this stapes nonlinearity isa logarithmic function of stimulus intensity. The minimum
stimulus intensity required to produce stapes nonlinearity in
the guinea pig was about 134-dB SPL.
* Intense audiofrequency stimulation produced dc perilymph
pressure changes which can be related to stimulus intensity by
a power function for both the guinea pig and the monkey. Themagnitude of perilymph pressure response for a given stimulusintensity was greater in the guinea pig than in the monkey.
* Guinea pigs, monkeys, and human beings exhibited nystagmus
in response to audiofrequency stimulation. Minimum stimulusintensities necessary to produce nystagmus are similar for all
species: 135- to 145-dB SPL.
Repetitive audiofrequency transients produced the following
results:
* Transient eye movements were evoked from guinea pigs and
monkeys in response to repetitive audiofrequency transients. The
72j
-.
stimulus characteristics required to evoke the eye movementswere similar in the two species.
* Eye movements were not obtained from human observers at
the stimulus levels that we employedl however, the observersdid report visual fie.d displacements correlated with stimulus
presentations.
* None of the three species examined in these experimentsyielded clear evidence of a resonance responsel i.e., no
repetition rate evoked consistently stronger responses than the
other repetition rates employed.
* Postural equilibrium was disturbed by repetitiveaudiofrequency transients at significantly lower intensities
than wi.th sustained audiofrequency sound.
The guinea pig observations support a dc volume displacement
mechanism of acoustical vestibular stimulation. However, the
monkey data and the results with human beings are consistent
with a dc volume displacement-eddy current hypothesis.
73
..............

REFERENCES
1. Ades, H. W., "Orientation in Space," Benox Report: AnExploratory Study of the Biological Effects of Noise, ONRProject NR 144079, The University of Chicago, 1953.
2. Ades, H. W., Graybiel, A., Morrill, S. N., Tolhurst, G. C.,
and Niven, J. I., Nystaamus Elicited by High Intensity
Sound, Research Project NM 13 01 99, Subtask 2, Report No. 6,
Naval School of Aviation Medicine, Pensacola, Florida, 1957.
3. Ades, H. W., Graybiel, A., Morrill, S. N., Tolhurst, G. C.,and Niven, J. I., Nonauditory Effects of High Intensity
Sound on Deaf Human Subjects, Research Project NM 001 102503, Report No. 5, Naval School of Aviation Medicine,
Pensacola, Florida, 1958.
4. Alford, B. R., Jerger, J. F., Coats, A. C., Billingham, J.,French, B. 0., and McBrayer, R. 0., "Human Tolerance to Low
Frequency Sound," American Academy of Ophthalamology andOtolar.ngology' Transactions 2.0, 40-47, 1966.
5. B~k4sj, G., von, "Uber akustische Reizung des Vestibular-apparatus," Pflug. Arch. ges. Physiol. 236, 59, 1935.
6. B~k~sy, G., von, Experiments in Hearing, McGraw Hill Book
Co., New York, 1960.
7. Camis, M., The Physiology of the Vestibular Apparatus,
Clarendon Press, Oxford, 1930.
8. Correia, M. J., and Money, K. E., "The Effects of Blockage
of All Six Semicircular Canal Ducts on Nystagnius Produced byDynamic Linear Acceleration in the Cat," Acta Oto-l.aryng
_2, 7, 1970.
it ' 1J

.. .. . . . .! . .. . ... .. . ... .. ... .. . ... ... .. ... ...... ..... ...
9. Deetjen, H., "Akustische Stromungen der Peilymphe," ---.-Bio. 39, 159, 1899.
10. Evans, M. J., "Infrasonic Effects on the Human Organs ofEquilibrium," Proceedings of Fall Meeting of the BritishAcoustical Society, 71-104, 1971.
11. Evans, M. J., and Tempest, W., "Some Effects of Infrasonic
Noise in Transportation," J. Sound and Vibration 22, 19-24,
1972.
12. Fex, J., "Efferent Inhibition in the Cochlea Related to HairCell Activity, Study of Postsynaptic Activity of the Crossed
Olivocochlear Fibers in the Cat," J. Acoust. Soc. Amer. 41,666, 19(7.
13. Graybiel, A., and Fregley, A. R., A New Quantitative AtaxiaTest Battery, Report No. 107, Naval School of Aviation *1
Medicine, Pensacola, Florida, 1963.
14. Guinan, J. J., and Peake, W. T., "Middle-ear Characteristics
of Anesthetized Cats," J. Acoust. Soc. Amer. 41, 1237, 1967.
15. Gulick, W, L., Hearing: Physiology and Psychophysics,Oxford University Press, New York, 1971.
16. Hardy, M., "Observations on the Innervation of the MaculaSacculi in Man," Anat. Rec. 59, 403, 1934.
17. Harris, C. S., Effects of Acoustical Stimuli on the Ve. bular
System, Technical Report 71-58, Aerospace Medical ResearýhLaboratory, Wright-Patterson Air Force Base, Ohio, 1971.
18. Harris, C. S., Effects of Increasing I~i-Lnsitv Levels ofIntermittent and Continuous 1000 Hz Tones on Human EquilibriumTechnical Report 72-11, Aerospace Medical Research Laboratory,
Wright-Patterson Air Force Base, Ohio, 1972.
75
IOU,

19. Harris, C. S., and Sommer, H. C., Human Equilibrium During
Acoustical Stimulation by Discrete Frequencies, Technical
Report 68-7, Aerospace Medical Research Laboratory,
Wright-Patterson Air Force Base, Ohio, 1968.
20, Howard, I. P., and Templeton, W. B., Human Spatial
Orientation, John Wiley and Sons, London, 1966.
21. Ingelstedt, S., Ivarsson, A., and Tjernstr'm, 0., "Vertigo
Due to Relative Overpressure in the Middle Ear," Acta
Oto-laryng. L8, 1-14, 1974.
22. Kennedy, R. S., A Bibliography of the Role of the VestibularApparatus Under Water and Pressure: Content Oriented and
Arnotated, Report No. 1, Naval Medical Research Institute,
Per •acola, Florida, 1972.
23. Kobral-, H. G., "Construction Material of the SoundConduction System of the Human Ear," J. Acoust. [ )c. Amer.20, 125-130, 1948.
24ý Parker, D. E., "Interaction Between Electrical and
Mechanical Vestibular Stimulation: Observations on Rabbits
and Men,' J. Exper. Psychol. 84, 96, 1970.
25. Parker, D. E., Covell, W. P., and von Gierke, H. E.,
"Exploration of Vestibular Damage in Guinea Pigs Following
Mechanical Stimulation," Acta Oto-laryn . Suppl. 2 1968.
26. Parker, D. E., and Reschke, M. F., "Mechanisms of Acoustical
Vestibular Stimulation I. Middle Ear Nonlinearity,"
Minerva Otorinolaringologica 22, 240-249, 1972.
27. Parker, D. , , and von Gierke, H. E., "Vestibular Nerve
Re8ponse t- Pressure Changes in the External Auditory Meatusot the Guinea Pig," Acta Oto-larn. 71, 456 1971.
76_AL

28. Parker, D. E., von Gierke, H. E., and Reschke, M. F.,"Studies of Acoustical Stimulation of the Vestibular
System," Aerospace Med. 3U, 1321, 1968.
29. Rasmuss6en, G. L., "Efferent Fibers of the Cochlear Nerveand Cochlear Nuclex..s," In Neural Mechanisms of the Auditory
and Vestibular Systems, G. L. Rasmussen and W. F. Windle(Eds.), Charles C. Thomas, Springfield, Illinois, 1960.
30. Reschke, M. F., High-intensity, Audiofrequency Vestibular
Stimulation in the Guinea Pig, Unpublished Doctoral
Dissertation, Department of Psychology, Miami University,Oxford, Ohio, 1971.
31. Reschke, 14. F., Homick, J., Landreth, J., and Parker, D. E.,"Acoustical Vestibular Stimulation in Man," Minerva
Otorinolaringologica ?J, 1975.
32. Reschke, M. F., Parker, D. E., and von Gierke, H. E.,"Stinm lation of the Vestibular Apparatus in the GuineaPig by Static Pressure Changes: Head and Eye Movements,"
J. Acoust. Soc. Amer. 48, 913, 1970.
33. Schroeder, D. J., "Influence of Alcohol on VestibularResponses to Angular Acceleration," Aerospace Me, 42,
959-970, 1971.
34. Schroeder, D. J., Alcohol and Disorientation-relatedResponses I. Nystagmus and "Vertigo" During Caloric andOptokinetic Stimulation. FAA Office of Aviation MedicineTech. Rep. No. 71-6, Civil Aeromedical Institute,
Federal Aviation Administration, Oklahoma City, 1971.
77
...

35. Smith, C. A., and Rasmussen, G. L., "Nerve Endings in theMaculae and Cristae of the Chinchilla Vestibule, WithSpecial Reference to the Efferents," In Third Syimposium on
the Role of the Vestibular Organs in Space Exploration,
NASA SP-152, National Aeronautics and Space Administration, JWashington, D. C., 1967.
36. Weiss, H. S., Mundie, J. R., Cashin, J. L., and
Shinabarger, E. W., "The Normal Human Intra-aural Muscle
Reflex in Response to Sound," Acta Oto-laryng. 5, 505, 1962.
37. Wersall, J., and Hawkins, J. E., Jr., "The Vestibular
Sensory Eplithelia in the Cat Labyrinth and Their Reaction
to Streptomycin Intoxication," Acta Oto-laryrni. 1, 1, 1962.
38. Wever, E. G., and Lawrence, M., Physiological Acoustics,
Princeton University Press, Princeton, 1954.
39. Wiederhold, M. L., and Kiang, N. Y. S., "Effects of jStimulation of the Crossed Olivocochlear Bundle on Single
Auditory Nerve Fibers in the Cat," J. Acoust. Soc. Amer.
40, 1427, 1970.
78*U. S. GOVEO6WNT POUNTIM OFFICi 1976 - 657-630/649
",A
.1


![Electrical Vestibular Stimulation after Vestibular ......electrical stimulation of the vestibular system to one ear [4,5,9]. However studies have also reported vestibular responses](https://img.pdfslide.us/doc/110x75/60f6b0762ca1b41e91018b73/electrical-vestibular-stimulation-after-vestibular-electrical-stimulation.jpg)