Embed Size (px)
Citation preview

,AD-Ai40 569 THIN FILM MODELS OF SMSI (SHOW STRONG METAL-SUPPORT i/liINTERACTIONS) CATALYS..(U) TEXAS UNIV AT AUSTIN DEPT OFCHEMISTRY D N BELTYON ET AL. i? OCT 83 TR-38
UNCLASSIFIED Neegi4-75-C-0922 F/G 20/12 NL
EEEM EEEEEEEEmmmmmmsmmmmmmIEEEEEEEEEEEEEEu.,
III _.
AA
4 1111.0 1" 128 I5
IIIII,L3.
1J.6
0. 1".Ig
LLi
MICROCOPY RESOLUTION "TEST C"ART ..;
N4ATOONk k*A4 STANDARDS -1963-A
. &""E-n%11 .2 111 .4 1 1
. . , . -.. . . ., ".
.% 'P '. ='. .~ ,k ,e ,. k .' ,_t , .. m i.. " ,'. ', .'-. . .- ' - ' . - ,,.'. L-"'i
... . % '. , % % % .. ,, % ,. .. .. ROCOP RES LUIO T. S CHART- - ,- -. ..' . . . . . . . . .

OFFICE OF NAVAL RESEARCH
ifL Contract N00014-75-C-0922
0 Task No. NR 056-57844
TECHNICAL REPORT NO. 30
Thin Film Models of SMSI Catalysts:
Pt on Oxidized Titanium
by
D. N. Belton, Y.-M. Sun and J. M. White
Prepared for publication
in
The Journal of Physical Chemistry
Department of Chemistry
University of Texas at Austin
Austin, Texas 78712
APR 2 6 1984 .*,October 17, 1983
>-ACD Reproduction in whole or in part is permitted for
any purpose of the United States Government.
LAJ This document has been approved for public release.jM and sale; its distribution is unlimited.ELil

or 17
SECURITY CLASSIFICATION OF THIS PAGE (*%en Date Entered)
REPORT DOCUMENTATION PAGE READ OMSTRUCTIORS1. REPORT NUMBER 2. GOVT ACCESSION NO. 3. RECIPIENT'S CATALOG NUMBER
4. TITLE (amtSubtitle) S. TYPE OF REPORT & PERIOD COVERED
Thin Film Models of SMSI Catalysts: Pt Technical Report 30on Oxidized Titanium Jan. 1 - Dec. 31, 1983
S. PERFORMING ORG. REPORT NUMBER
7. AUTIOR(a) S. CONTRACT OR GRANT NUMBER(*)D. N. Belton, Y.-M. Sun and J. M. White
N00014-75-C-0922
It. PERFORMINGORGANIZATION NAME AND ADDRESS 10. PROGRAM ELEMENT. PROJECT. TASKJ. M. White AREA 6 WORK UNIT NUMBERSDept. of Chemistry, University of Texas Project NR-056-578
I Austin, TX 78712
it. CONTROLLING OFFICE NAME AND ADDRESS I2. REPORT DATEDepartment of the Navy October 17, 1983Office of Naval Research 1s. NUMBEROF PAGES
Arlington, VA 22217 2614. MONITORING AGENCY NAME & ADORESS(II different from Contolling Office) IS. SECURITY CLASS. (of Sie report)
i |S 111.L ECL ASSI F1 €ATI ON/OOWN GRADING
t.,. SCHEDULE
'16. 0ISTF IUTION STATEMENT (oldis Repert)
" . Approved for public release: Distr.ibution unlimited.
17. DISTRIBUTION STATEMENT (elfte ,abetrect enter d In St/ock 20, If differeng brm Report)
IS. SUPPLEMENTARY NOTES
Preprint: Accepted, The Journal o.f Physical Ch.emistry
1.. KEY WORDS (Cnlnue en revere. de if neceeawy mid tdentil, by block umber)..
20. ABSTRACT (ContiMlan rev ee olde It neceem. eand IdontIf by block umber)Thin-films of Pt, vapor deposited on an oxidized Ti foil, havebeen utilized as models of high surface area Pt/TiO 2 catalystswhich show strong metal support interactions. As a function of Pcoverage, the development of bulk Pt chemisorption characteristicoccurs at significantly lower coverages on the oxidized substrateAt a given Pt coverage there is less chemisorption of both CO & Hon the reduced, as compared to the oxidized, Ti-O2 and the desorp-
tion spectra peak at lower temperatures. We propose a model in
"oot A 73 EDITION OF I NOV 68 IS OBSOLETES/N 0102-014-16011
SECURITY CLASSIFICATION OF THIS PAGE (fhDte Btra "0
20. which the morphology of the Pt on the reduced catalysts issignificantly flatter (dominated by (111) terraces) and isslightly modified electronically, as compared to theoxidized sample.
8. I:
: I ':
Tin Flr, . 'odel-z of S.:S1. Catalystsi: Pt on Oxidizcd-, Ti4tarniurn
D. N. Belton, Y.-M. Sun and J. M. White
Department of Chemistry
University of Texas
Austin, TX 78712
*Supported in part by the Office of Naval Research.

Ab!;tract
Thin films of Pt, vapor deposited on an oxidized Ti foil, have been
utilized as models of higt. surface area Pt/ TiO catalysts whic snow strong
metal-support interactions (S::Si). Both fully oxidized(Ti(4 and partially
reduced(significant amounts of T surfaces were studicd. As a function
of Pt coverage, the development of bulk Pt chemisorptizn characteristics
occurs at significantly lower coverages on the oxidized substrate. In
particular, at a given Pt coverage there is less chemisorption of both CC
and Hthe desorption2 o
spectra peak at lower temperatures. No evidence for significant differences
it! the chemical state of the Pt is found by XPS and AES. 'e propose a
model, consistent with earlier work on high surface area Pt/TiOtI catalysts,
in which the morphology of the Pt on the reduced catalysts is significantly
flatter (dominated by (111) terraces) and is slightly modified
electronically, as compared to the oxidized sample.
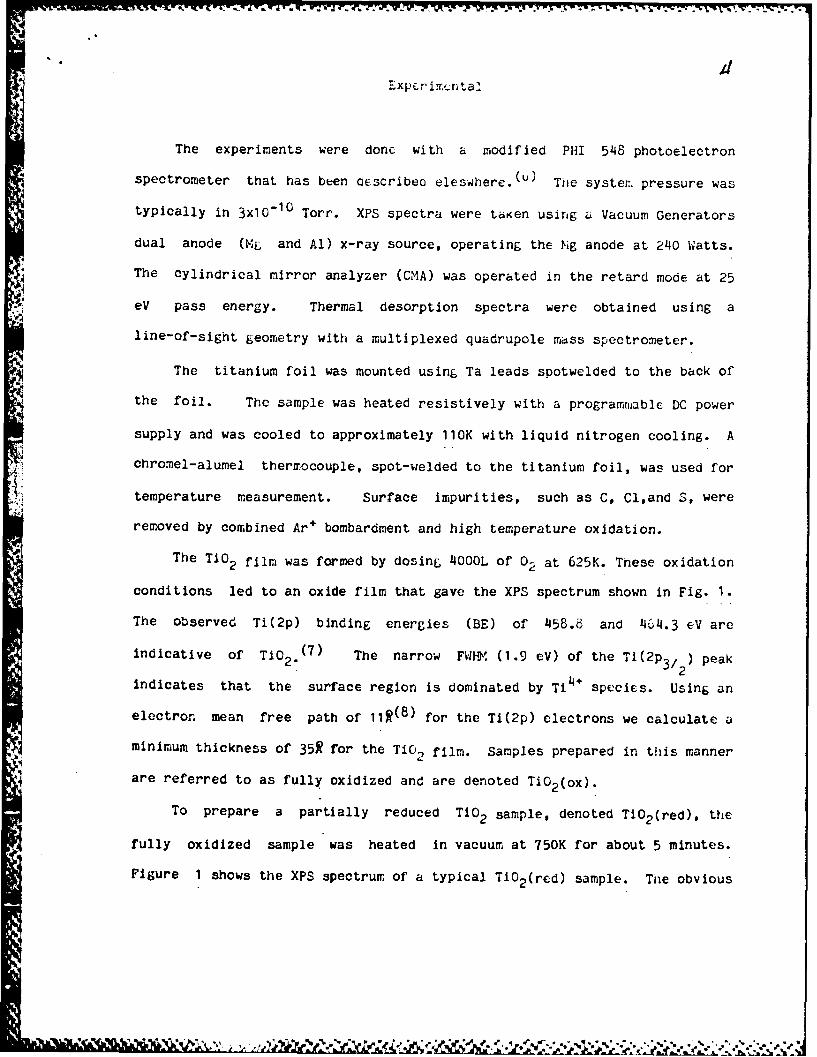
Introduction.
Since the detailed report by Tauster Et aj. ( 1 2 ) of stror_: metal
support interactions (SVSI) in several systems, the cause of this
interestinE effect has been an area of grcot activity in, the surface
science-catalysis community. SMSI is characterized by the loss of a
supported metal's ability to chemisorb CO and 12. Explanations such as
metal particle morphology, surface contaminants, encapsulation of metal
particles by the support, and charge transfer between metal anc support have
been proposed to explain the phenomena. Experiments conducted on metal
impregnated oxide powders, the actual catalyst, have been unable to control
unambiguously many of the system variables and thus have been unable to
determine the cause(s) for SMSI. UHV studies on models for these catalysts
have most often explored the electronic structure of the system through
electron spectroscopy. This approach has sometimes led to the conclusion
that electrons are transferred from the support to the metal, (3 -5 ) but
without the supporting chemisorption studies it is impossible to assign this
charge transfer as the cause of SMSI.
In the experiments presented here we model the Pt/TiO 2 catalyst (both
SMSI and non-SMSI) in UHV. The model consists of various amounts of Pt
deposited on a thin film(f 50A ° ) of TiO2. These thin films and the
supporting oxide were characterized using X-ray photoelectron spectroscopy
(XPS) and Auger electron spectroscopy (AES). Thermal desorption
spectroscopy (TDS) of two different adsorbates,H2 and CO, was examined and
correlated with the XPS data.
N
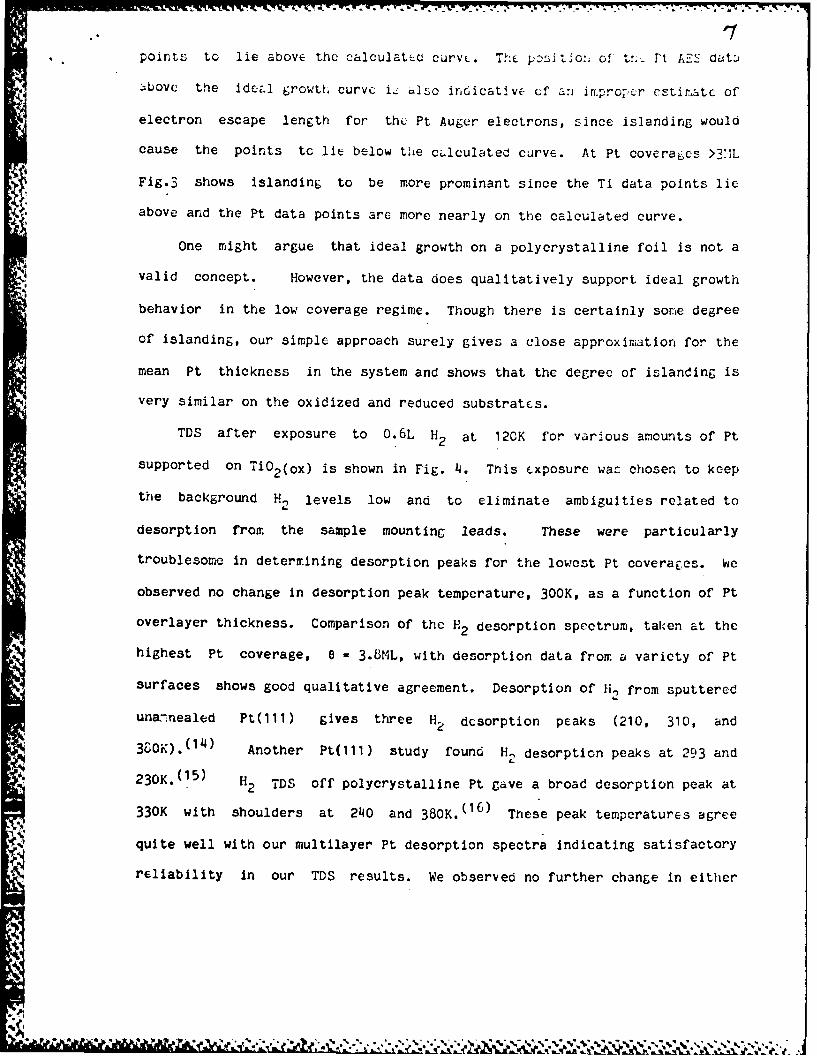
Exper imn t a!
The experiments were donc with a modified PHI 548 photoelectron
spectrometer that has been describeo eleswhere.( U ) The syster. pressure was
typically in 3x10 -1 0 Torr. XPS spectra were taKen using a Vacuum Generators
dual anode (ML and Al) x-ray source, operating the Mg anode at 240 Watts.
The cylindrical mirror analyzer (CMA) was operated in the retard mode at 25
eV pass energy. Thermal desorption spectra were obtained using a
line-of-sight geometry with a multiplexed quadrupole mass spectrometer.
The titanium foil was mounted using Ta leads spotwelded to the back of
the foil. The sample was heated resistively with a programiablc DC power
supply and was cooled to approximately 110K with liquid nitrogen cooling. A
chromel-alumel thermocouple, spot-welded to the titanium foil, was used for
temperature measurement. Surface impurities, such as C, Cl,and S, were
removed by combined Ar+ bombardment and high temperature oxidation.
The TiO 2 film was formed by dosing 4000L of 02 at 625K. These oxidation
conditions led to an oxide film that gave the XPS spectrum shown in Fig. 1.
The observed Ti(2p) binding energies (BE) of 458.8 and 464.3 eV are
indicative of Ti02 (7) The narrow FWHM: (1.9 eV) of the Ti(2p 3, ) peak2
indicates that the surface region is dominated by Ti 4+ species. Using an
electron mean free path of 11(8) for the Ti(2p) electrons we calculate a
minimum thickness of 351 for the Ti 2 film. Samples prepared in this manner
are referred to as fully oxidized and are denoted TiO 2 (ox).
To prepare a partially reduced TiO 2 sample, denoted TiO 2 (red), the
fully oxidized sample was heated in vacuum at 750K for about 5 minutes.
Figure 1 shows the XPS spectrum of a typical T1O 2 (red) sample. The obvious
!e,

low bL s:iouluer i j t , :caicc U-- .-CA -'> :C LOi.
to a concurrent increase in the intensity of this s.%oul"cr. Ar. approximate
deccaiposltion of the pcak srhape indicates Lbout 2U, of tho, total Ti(2p)
signal originates from Ti3 4. The method of re-duction, iieLtjinE in vacuum at
relatively low temperatures, is expected to cause diffusion cf oxygen into
the Ti foil, leaving the surface region oxygen-deficient. ;;2thin tihis
framework, the bulk of the TiO 2 filr is more highly reduced than the surface
suggesting that the actual surface concentration of Ti 3 + is lower thai: 20.
Ri Establishing an upper limit of Ti3+ concentration was not attempted due to
the difficulties involved in estimating the distribution of Ti3+ as a
function of distance from the surface.
Controlled amounts of Pt were vapor deposited onto the oxidized and
reduced TiO 2 substrates. The Pt doser consisted of a resistively heated L'
filament wrapped with a 99.99% Pt wire. The temperature of the Pt was
monitored with a W/5%Re-W/26'PRe thermocouple and was typically held constant
to within 3K at about 1600K. During Pt deposition, the oxidizeo foil
substrate was placed approximately 3 cm from the doser and in a position
that gave macroscopically uniform coverages over the oxide surface. A
typical dose rate was 0.5 ML min - as determined by the time dependence of
the relative Auger signals of Pt and Ti. This rate was easily varied by
changing either doser temperature or sample position. No impurities were
found by AES in the Pt overlayer. Figure 2 shows a typical AES spectrum for
multilayer Pt on TIO2. This quality was obtained only after considerable
effort; deposition of C in the Pt overlayers was a particularly troublesome
problem. Since surface carbon is known to suppress chemisorption, (9 ,10) it
is very important that the Pt overlayer be free of it. Moreover, C buildup
would lead to improper determination of the Pt overlayer thickness.
.. SOL

~~7 S.-7- -17 - w.. * ~ . 7-S
hesults
Figure 3 shows the behavior of thf Ti(:,57) znt Pt(235) ACl si*LlS s Za
function of Pt dose with the substrate held at 30OK. Data for deposition
onto both the oxidizcd and reduced substrates :re included. Crowth curves
based on an ideal (layer-by-layer) model are also shown. These curves are
calculated as follows: When the first monolayer is complete, the Ti(387 eV)
signal will be 0.53 of its initial value aL calculated using(11)
'Ti(d) = ITi exp[-d/(A-icos 6)]
In this equation d is the thickness of 1 monolayer (ML) of Pt (2.41 A),
ITi(d) the peak-to-peak height of the Ti(387) signal, 'Ti the initial 387 cV
signal, ATi the electron inelastic mean free path ( 8 P for a 337 eV
electron(b.12. 13 )), and 0 the analyzer acceptance angle (500). Tne Pt(235)
signal for I ML of uniform coverage is calculated using a similar equation
with A Pt = 7 A. Although the assignment of mean free paths is not
unambiguous, these values are reasonable choices for this system. Between C
and 1 ML coverage, the signals are assumed to change linearly with Pt
coverage. The same equations can be used to compute attentuation and growth
for full development of II monolayers with linear segments between. These
linear segments are shown in Fig. 3.
Examination of Fig. 3 shows the growth mode is nearly ideal for tht
first 3ML of Pt. The fact that the Ti AES points lie slightly below the
calculated curve indicates that islanding with 3D particle formation is not
dominant in this region. The deviation is probably due to choice of
electron inelastic mean free path lengths since islanding would cause the
.. *. ..IN % -. - .*.*
S... 7
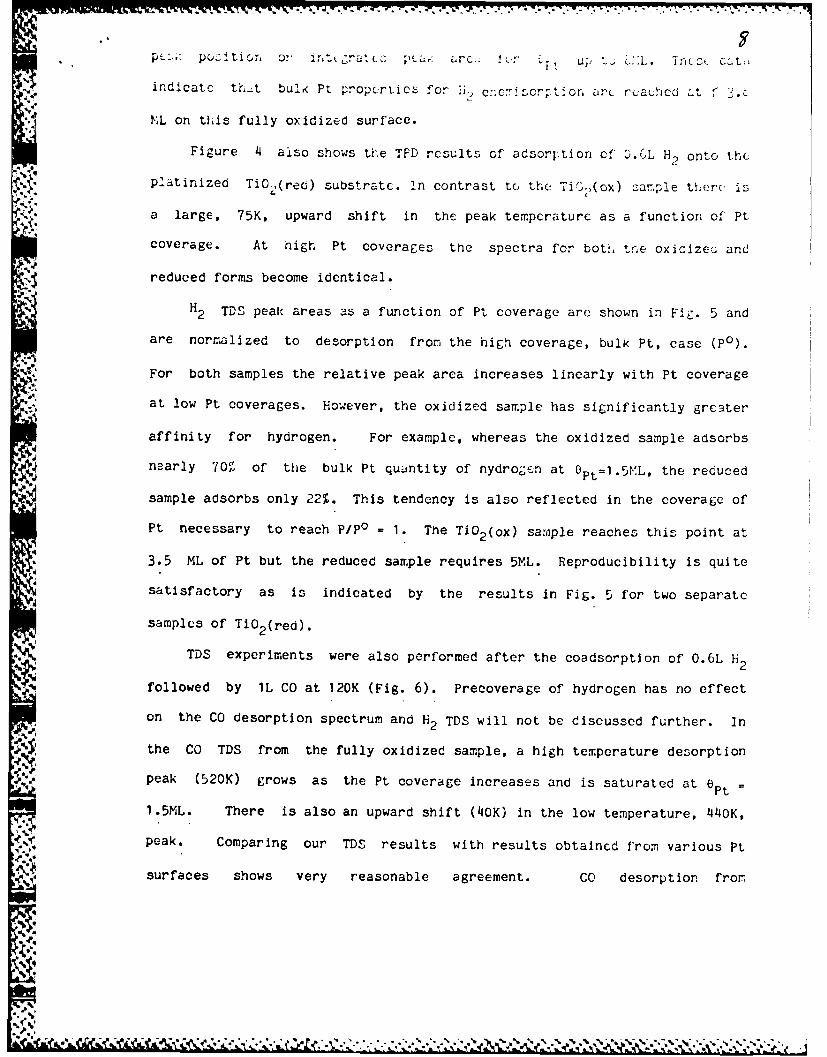
points to lie above the calculated curvL. The pDsitlo: of tn; Pt AEE dataj
above the idea.l growtL curvc i.: aaso inicativc of an inrproEr estimatc of
electron escape length for the Pt Auger electrons, since islanding would
cause the points tc lie below the calculated curve. At Pt coverages >3'L
Fig.3 shows islanding to be more prominant since the Ti data points lie
above and the Pt data points are more nearly on the calculated curve.
One might argue that ideal growth on a polycrystalline foil is not a
valid concept. However, the data does qualitatively support ideal growth
behavior in the low coverage regime. Though there is certainly some degree
of islanding, our simple approach surely gives a close approximation for the
mean Pt thickness in the system and shows that the degree of islanding is
very similar on the oxidized and reduced substrates.
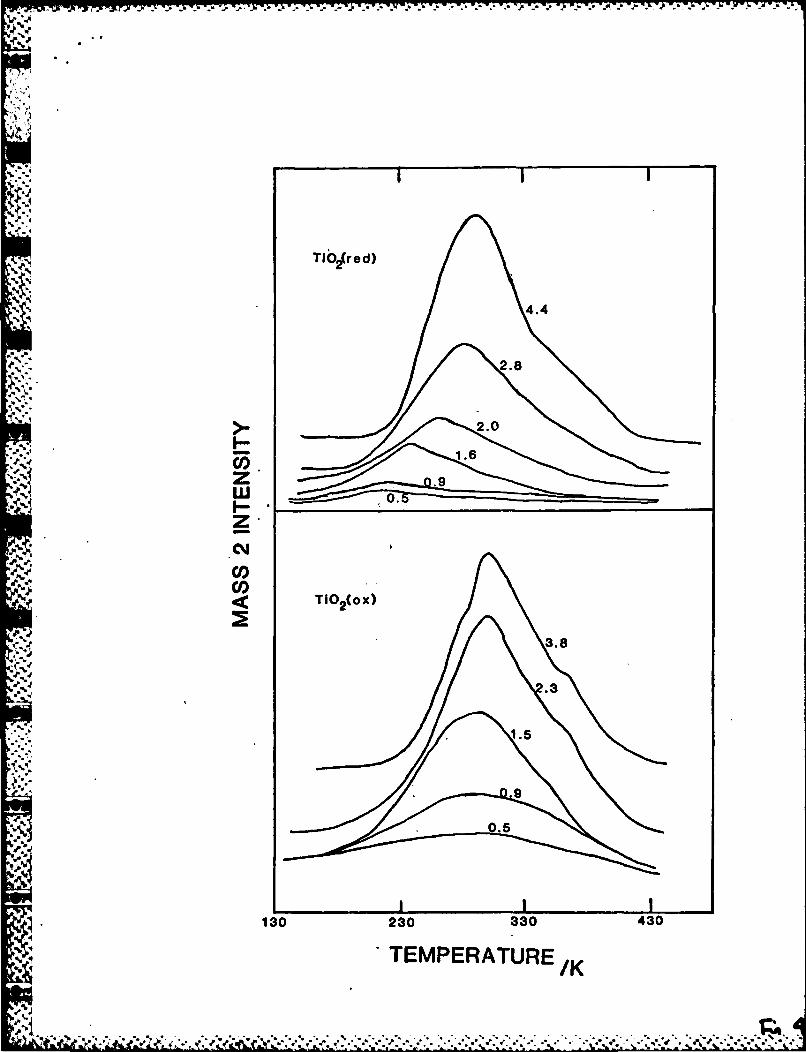
TDS after exposure to 0.6L H2 at 120K for various amounts of Pt
supported on TiO 2 (ox) is shown in Fig. 4. This exposure wac chosen to keep
the background H, levels low and to eliminate ambiguities related to
desorption from the sample mounting leads. These were particularly
troublesome in determining desorption peaks for the lowest Pt coverages. We
observed no change in desorption peak temperature, 300K, as a function of Pt
overlayer thickness. Comparison of the H2 desorption spectrum, taken at the
highest Pt coverage, e - 3.BML, with desorption data from a variety of Pt
surfaces shows good qualitative agreement. Desorption of H, from sputtered
unannealed Pt(111) gives three H2 dcsorption peaks (210, 310, and
30K) . 1 ) Another Pt(111) study found H2 desorption peaks at 293 and
230K. 1 5 ) H2 TDS off polycrystalline Pt gave a broad desorptlon peak at
330K with shoulders at 240 and 380K.(1 6 ) These peak temperatures agree
quite well with our multilayer Pt desorption spectra indicating satisfactory
reliability in our TDS results. We observed no further change in either
A.PA
. . .Z : * . b , 1~. , <... W . * *[. J . , ,. .. . . . . . ,. . - . .. -. _
p:.;: p i tio r itt -j ra .c Z;: &rc- r L u L. crcc - ctL
indicate th-t bulK Pt propcrtic for i.,j cn:-,crcrp to arc rc'acthed Lt .
ML on this fully oxidized surface.
Figure 4 also shows tire TPD results of adsorption cf 3.L H 2 onto th
platinized TiO,(red) substratc. In contrast to the Ti-,,(ox) sample there is
a large, 75K, upward shift in the peak tempcraturc as a function of Pt
coverage. At high Pt coverages the spectra for both the oxicize and
reduced forms become identical.
4' H2 TDS peak areas as a function of Pt coverage are shown in Fig. 5 and
are normalized to desorption from the high coverage, bulk Pt, case (PO).4.-
For both samples the relative peak area increases linearly with Pt coverage
at low Pt coverages. However, the oxidized sample has significantly greater
affinity for hydrogen. For example, whereas the oxidized sample adsorbs
nearly 70%" of the bulk Pt quantity of hydrogen at Opt=1.5tL, the reduced
sample adsorbs only 22%. This tendency is also reflected in the coverage of
Pt necessary to reach P/pO = 1. The TiO 2 (ox) sample reaches this point at
3.5 ML of Pt but the reduced sample requires 5ML. Reproducibility is quite
4 satisfactory as is indicated by the results in Fig. 5 for two separate
samples of TiO 2 (red).
TDS experiments were also performed after the coadsorption of 0.6L H2
followed by IL CO at 120K (Fig. 6). Precoverage of hydrogen has no effect
on the CO desorption spectrum and H2 TDS will not be discussed further. In
the CO TDS from the fully oxidized sample, a high temperature desorption
peak (520K) grows as the Pt coverage increases and is saturated at pt=
1.5ML. There is also an upward shift (40K) in the low temperature, 440K,
peak. Comparing our TDS results with results obtaincd from various Pt
surfaces shows very reasonable agreement. CO desorption fror
47
.1%,
"4,. ,. . ¢ w j , ' ' , a ' . ' ' . , : . - ' . , . • . - . , . - . , % . _ , . - - . , - , - > . - .

.. .
2yeryo.t:-li Pt ivcr fCur L p-J-,:L (11 , 1'.., 415
5 inc, wC c:.I V coleU tC 1-.2. w i (Lc not oLbLcrv- th 11 ,.
desorption peak. There is a small peak near 1OK but it is distorted by
desorption from the leads. The high temperature pEal's have roughly the Lae
peak area ratios as that observed fcr polycrystalline Pt;1 ) howevcr, our
peak temperatures are shifted by about 25K to higher values. Other CO or, Pt
desorption data is similar. Desorption peaks of 430 and 535K werc observed
for the Pt(110) surface.(17) Pt(111), 6(111)x(100) and 6(111)x(ll) all
give peaks at 420K and 53 0K.( 18 ) These results support our interpretation
of the data in terms of bulk Pt behavior at high Pt coverages.
Turning to the coadsorption of H2 and CC on the partially reducea
sample, a much larger coverage of Pt is necessary to acquire the high
temperature CO desorption peak. Examination of Fig.6 shows that even at
ept = 2.8 NL the high temperature CC peak is not present. Moreover, for
8Pt = 4.41L, the CO desorption has not acquired the bulk Pt TDS profile, as
evidenced by the ratio of the two high temperature peaks. More desorption
occurs in the 180-300K region on this reduced sample. The peak area of this
low temperature region decreases almost linearly with increasing Pt coverage
until apt 2 11L. For higher Pt coverages the peak areas ir, the low
temperature region are equal on the oxidized and reduced samples. Clearly,
CO uptake is suppressed on the reduced sample.
-4

,0
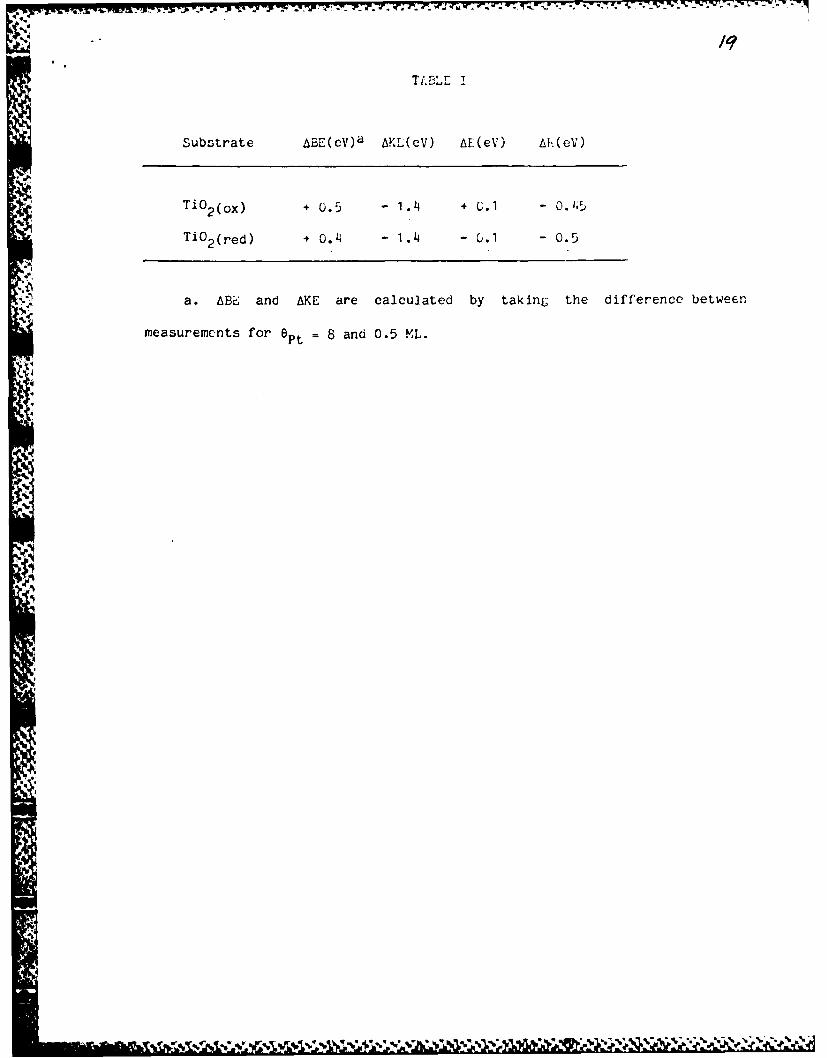
By measuring the peak positions of both XPS and Auger transitions in
the X-ray excited electron spectra, Auger parameters(19-22) were calculated
for Pt/TiO 2 (red) and Pt/TiO 2 (ox) and are listed in Table I. These
calculations are based on comparison of the data for 6pt = 0.5 and 8 ML, thc
latter coverage being equivalent to bulk Pt. The initial state chemical
shift, AE, and final state relaxation shift, AR, are shown for the two
different platinized subtrates. Values were calculated using the equations:
A(BE) - AE - AR -
A(KE) - - AE + 3AR + AEbending
4'
where AEbending represents the change in measured energy due to band
bending. The validity of these equations has been the subject of much
debate. Recent work indicates that corrections of up to 3 eV are warranted
in some situations. (23) We will not attempt to address the accuracy of the
simplifying assumptions from which these equations are derived. In spite of
the difficulties of interpretation, the comparison of the two very similar
* systems discussed here is justified in the sense that differences in the
values of AE will reflect different Pt/TiO 2 electronic structures.
As is evident from the data of Table I there is essentially no
difference in the amount of initial state chemical shift for the two
samples. AEbending , which would reflect changes in the underlying oxide in
passing from low to high coverages of Pt, was assumed to be equal to zero
for both the reduced and oxidized samples based on the fact that no BE
change in either the Ti(2p 3/2 ) or the valence levels (by UPS) were observed
as the Pt coverage changed.
*4,
The quoted c:.:pc rimenta] err,. of c. -V w, sbthr,: L, sir]k prc: rtjc:
of error using C.1 eV as the uncertainty in the XPS and AES measurements.
Tnus, we conclude that the difference in the Lumount of cnarZe transfer in
the two systems is negligible.
Discussion
Tne TDS experiments show that introduction of Ti3 into the TiO 2
lattice has a large effect on the chemisorption properties of a Pt
overlayer. Hydrogen chemisorption is suppressed and peak desorption
temperatures are lowered when the substrate is reduced (Ti3 + is introduced)
prior to Pt deposition. CO desorption profiles are also altered upon
substrate reduction; a new low temperature desorption state appears and the
highest temperature desorption peak disappears. These results are
characteristic of SMSI and show that we have successfully modelled an SNSI
catalyst.
Several explanations for the observed SMSI chemisorption effects have
5. been offered. One involves contamination of the Pt overlayer. Carbon
contamination can be a problem when vapor depositing Pt and small amounts of
it can cause a significant change in the CO and H2 desorptlon spectra. In
earlier work (2 4 ) we reported neither CO nor H2 chemisorption for Pt
coverages of 3ML or less. With improved TDS sensitivity, these experiments
were repeated and expanded in this work, and were shown to be in error due
to C contamination in the Pt overlayer. Surface carbon has the dual effect
of causing an error in the calibration of the Pt overlayer thickness and
suppressing chemisorption. Contamination effects were successfully
eliminated in the present experiments through a series of changes in the
construction of the Pt doser. Careful AES analysis indicated no carbon
-V@
C . tam:in at 1i c-.
Anc'trer pcstulated expIarnz tior. for' S:$: iz tnc forr:3tiri of Pt-TiCx
bonds and the consequent change in chemisorption because of alteration of
the Pt atoms involved.(25) Tne results of Fig. 5 discount this as the
direct and only cause. If a local Pt-Ti bond was responsible for the
" alteration in Pt chernisorption properties then the effect should extend over
only 1-2ML of Pt. However, from Fig. 5 it is clear that the SMSI effect
A! extends over more than 4M.L since the curves(ox. and red.) do not coincide
until coverages of at least 5ML of Pt are reached. This eliminates a local
Pt-Ti bond as the sole cause for SMSI. This conclusion is supported by
4. EXAFS data where no Pt-Ti or Pt-O bond distance could be observed with a
L .9-coordination number greater than 0.5, the limit of EXAFS sensitivity.(26)
Another often postulated cause of SMSI is charge transfer from the
support to the metal.( 4 ,24'27) We detected no significant difference in the
binding energy of the Pt core level when the reduced and oxidized substrates
were compared and conclude that there is no support for a detectable
difference in the oxidation number of Pt. This result is somewhat different
frim other work done on single cyrstal SrTiO and for Ni/TiO34 3
systems. (4 ) Our work is in good agreement with Huizinga(2 6 ) who finds no
differences in reduced and oxidized Pt/T102 powder systems by XPS. Huizinga
suggests that the conclusions drawn in the Pt/SrTiO, and Ni/TiO2 work
mentioned above are the result of difficulties in the interpretation of
calculated Auger parameters. It is worth noting that the extended range of
the suppressed chemisorption indicated in Fig. 5 is strong evidence against
the charge transfer model because charge screening lengths in metallic
systems are no more than one lattice spacing.
T10 2 migration and subsequent encapsulation of the Pt overlayer Is a
.
%* -. .*
.4, • " .. " 4 ", . "= * " % •% ' • ' %" 4

LA " fourtii pos'ibleL xplaratio. for thc ob:ervc (fcott. T:: efct
* could very 6ell b2 a rajor contributor tc SILSI in po;dtr catalyst ampiLu
which have been subjectec to long and high temperature reduction processcs.
However, the samples investigated here are riot Cxpccteo to bc subject to
this effect since the temperatures of Pt deposition were never higher than
300K. If encapsulation is occurring then it most likely happens as the hot
gas phase Pt atoms strike the surface durinE deposition. We expect this
would occur to about the same extent on both the reduced and oxidized
i * samples since the near-surface region probably has about the same structure
for both samples. Modeling of the experimental Pt AES growth curve was
performed to determine the extent to which encapsulation could differ on the
two different substrates without being detected. Very conservatively, these
calculations indicate that the extent of migration could not exceed 0.25ML
of TiO 2 in any case without being detectable. Thus, w!,ile we can not
eliminate encapsulation on the reduced substrate as the cause of SMSI, it
seems unlikely under our conditions.
In audition to encapsulation, other Pt overlayer morphology differenccs
could exist. For the substrates prepared here, small differences in the
arlount of Jslandini, or the structurc of the islands could be a major
contributor to SMSI. Since an oxidized polycrystalline Ti foil is used to0support tne Pt in our experiments, we do not expect long ratige order arid/cr
Ideal epitaxial growth of Pt on the substrate. Moreover, the local
structure of the oxide surface is probably changcd (both atoz:ically and
electronically) in passing from the fully oxidized to the partially reduced
cases. Even though t AES growth curves (Fig. 3) show ric significant
differences in the tw, r es, this is not a strong constraint and the
detailed local structur' , significantly different. If we attempt to
IJ*%* . .% -*,. *.v.,.~, ~ ,*..*.~ -.. _J
'.;.' N2 ; 4 -. -.. IF- . o-- .7. 77 71: 7 wt ,97 7 .-- - .
differences in 3L groth of Ft particlhs, thLn wc must concludc that 70%
fewer Pt atoms are exposed on the reducves surfacv. Diffcrences in growth
mode of this ragnitude woulo certainly be detectable in the AES growth
curves and we conclude that the suppression cf cheinsorption can not bc
attributed entirely to this cause.
Another difference in the Pt on the two supports could be the surface
structure of the Pt particles as opposed to their overall size or thickness.
Usiri electron microscopy, Baker et. al.(2 8 ,29 ) showed that Pt on reduced
TiC2.. powder catalysts haL a flat pillbox mrorpholoigy as opposed to
hemispherical particles on the oxidized catalyst.
The idea of a pillbox morphology on the reduced substrate is further
supported by FTIR work done by Tanaka and White(30) wiho investigated CO
stretching frequencies for CO adsorbed on both reduced and oxidized Pt/Ti0 2
powders. Upon reduction, they observed preferential loss of a CO stretching
frequency attributed to CO bound at step sites on Pt and argued that
reduction of the catalyst lead to a Pt morphology dominated by close-packed
(111) terrace sites. It is important to note that they also observed a
decreased intensity in other CO stretching bands indicating an overall loss
in CO uptake.
In light of these results, the following interpretation of our data is
proposed. Pt deposited on the reduced surface tends to grow with a
close-packed geometry whereas on the oxidized surface the tendency is toward
rougher (higher Miller index) surfaces. These modes are governed by small
changes in the character of the Pt/TiO 2 interaction at very low coverages.
These initial interaction differences, which are assumed to control the kind
of metal surface structure formed, become insignificant only after several
,-:L of" Pt havc b-crn depcsitc,. ibv aisj:.c tn,.t th, , t( ::;.t.r1Atrc ('
,C desorption pcai. crn be attributcc t-. &.,scrption of CC frc:; zte. ,
Tris assumption iz baseC on I.EEEL2 an(" TLS wo i., by '-Cltl]lan ;nj GlariJ lor
CO adsorption on a Pt(321) surface.(31) Tricy attribut a higi
temperature(546K) CO desorption state to desorption from step sites. 3n
this basis, one would expect high temperEiture peaks tc be strono(r on
oxidized than reduced samples as observed. As is evident fron Fig. 6, more
than 3ML of Pt are required before a high temperature CC desorption state is
seen for the reduced TiO 2 sample.
These morphology differences, by themseleves, can not dccount for all
the observations. Nonstepped Pt surfaces such as Pt(111) and Pt(110) have
desorption states in the 400-550K region.(171 8 ) Therefore, even if the Pt
overlayer morphology changes to the flatter structure upon reduction, it
should still show CO desorption in the high temperature regime. To account
for the full loss of the high temperature CO desorption on the reduced
samples, we propose that there is, particulary at low coverages, an
electronic interaction between the Pt and the reduced support that alters
slightly the state of the Pt and lowers the strength of the Pt-CO bond. Our
XPS data shows that this interaction cannot be explained as 'imple charge
transfer between support and metal. Using UPS and ELS we were unable to
detect any significant differences in the valence electronic stucture of the
oxidized and reduced Pt/TiO 2 systems, but further work with better
sensitivity and resolution is needed. The electronic effects seem to be
fairly short-ranged as evidenced by monitoring the peak area of the low
temperature CO desorption peaks. At Pt coverages of 2ML the low temperature
desorption re&ion for the reduced sample is the sane as for bulk Pt (both
shape and area). This can be taken as a rough guide to the extent of the
h Y

; ;" " in teract lmn. ;, h e e r ri r: : r I :, L y) e. .' ur
simultaneously, further speculation about th(cir origin and intcrrelatior. iz
not warranted.
Conclusions
From the data presented here we draw the following conclusions:
1) An SMSI catalyst can be successfully modelled using low surface area thin
films of oxidized Ti metal with controlled amounts of Pt vapor-deposited
thereon.
2) Suppression of CO and H2 chemisorption on reduced, as compared to fully
oxidized titania films with Pt overlayers, is interpreted in terms of two
factors: (a) flatter Pt particle morphology on the reduced samples and (b) a
different electronic interaction between the Pt and TiO 2 which, at low Pt
coverages, suppresses CC and H2 chemisorption.
3) Auger parameter measurements indicate that the electronic interaction is
not the result of a simple charge transfer.

icfcrenccc
1. S.J. Tauster, S.C. Fung, and R.L. Garten, J. Amer. Chem. Soc..
100,170(1978) .
2. S.J. Tauster and S.C. Fung, J. Catal., 55,29(1978).
3. M.K. Bahl, S.C. Tsai, and Y.W. ChunZ, Phys. Rev. 321.1344I(1980).
14. C.C. Kao, S.C. Tsai, and Y.1,'. Chung, J. Catal., 73,13609E22).
5. C.C. Kao, S.C. Tsai, M.K. Bahl, and Y.1.. Chung, Surface Sci.,
95,110980).
6.J.W. Rogers, C.T. Campbell, R.L. Hance, and W rhite, Surface Sci.,
97,1425(1980).
7. C.D. I-;agner, W.M. Rig~s, L.E. Davis, J.F. '.oulder, and G.E. ?Mullenberb,
4 Handbook of X-ray Photoelectron Spectroscopy (Physical Electronics
* Ind., Inc., 1979)p.68.
8. M.P. Seah and W.A. Tench, Surface and Interface Analys1:;, 1,2(1979).
9. E.I. Ko and TR.J. Madx, Surface Sci., 100,L449(1980)
10. F. Kiskinova and D.W. Goodman, Surface Sci., 109,L555(1981).
11. D. J. Jackson, T. E. Gallon, and A. Chambers, Surface Sci.,
36,381(1973).
12. C.C. Chung, Surface Sci., 48,901975).
13. M.L. Tarng and G.K. kehner, J. Appl. Phys., 4.1534(1973).
14. K. Christrnann, G. Ertl, and T. Pignet, Surface Sdi., 54,365(1976).
15. K. Christmann and G. Ertl, Surface Sci., 60,365(1976).
16. K.T. Thrush and J.M. White unpublished.
17. R.W. McCabe and L.D. Schmidt, Surface Sci., 60,65(0976).
18. D.M.Collins and W.E. Spicer, Surface Sci., 6),55(1977).
9~~~ ~ ~ ~ C. . hhr :, % Ec
2.T. D. Thoma., J. El ectrcn Sp.-c. and Rt Kat . PnCni... , -10,1171 9SO~)
21. N.D. Lang and A.L. ilizPhys. Rev. B16,2'4025(1977).
22. S. P. Kowalczyk, L. Ley, F.R. McFeely, R.A. Pollak, and D.A. Shirley,
Phys. Rev. U39,331(1974).
23. T.D. Thomas, J. Electron Spcc. Relat. Phenom., 20,117(1980).
241. J.A. Schreifels, D.14. Belton, J.M. White and E.L. Hance, Chemn. Phys.
Lett., 90,261(1982).
25. J.A. Horsely, J. Amer. Chemn. Soc., 110,2870(1979).
26. T. Huizinga, Metal Suppport Interactions in Pt and Rh Al 9 0 and TiO2
Catalysts. Dissertation, Eindhoven University of Technology, (1983).
27. B.H. Chen and J.F.. White, J. Phys. Chem., 86,353'4(1982).
28. R.T.K. Baker, E.B. Prestridge, and R.L. Garten, 59,293(1970).
29. P.T.K.Bal,-r, J. Catal., 63,523(1980).
30. K. Tanaka and J.10. White, J. Catal., 79,81(1983).
31. M.R. McClellan, F.R. McFeely and O.L. Gland, G.M. Research Report
PC-182(1981).
7, 7 n W. n .i ! 77 7. v.
TIMLE 1
Substrate ABE(eV)a AKL(eV) AE(eV) AM(eV)
TiO 2 (ox) + 0.5 - 1.4 + C.1 - 0.45
TiO 2 (red) + 0.4 - 1.4 - 0.1 - 0.5
a. ABE and AKE are calculated by taking the difference between
measurements for ePt = 8 and 0.5 ML.
I

-1 -W'--- , . r~ . . .-
Fi ure 2ptions
Fi&ure 1: XPS of Ti(2p) region for TiO;:(ox) and 7i0 2 (red).
Figure 2: AES of nutilayer Pt deposited or. Ti2(ox).
Figure 3: Ti(387), open symbols, and Pt(235), closed symbols, AES signals
vs. Pt dose on TiO 2 (ox), triangles, and TiO 2 (red), circles. Calculated
ideal growth(layer-by-layer) curve is indicated by the solid curves.
Figure 4: H 2 TDS of 0.6L H2 adsorbed at 130K. Each spectrum is labeled with
coverage of Pt (ML) aeposited on the TiC 2 substrate prior to the desorption
experiment.
Figure 5: Relative peak areas for 112 desorption from platinized
TiO2(ox),triangles, and TiO 2 (red), circles. Filled and open circles
represent 2 different experiments on TiO 2 (red). Adsorption conditions were
the same as for Fig. 4.
Figure 6: CO TDS of IL CC coadsorbed with 0.6L H2 at 130K. Each spectrum is
labelled with the coverage of Pt deposited onto the TiO 2 substrate prior to
the desorption experiment.
MIZ
MAR. 3 . 33 * * k:: ~ T

C4Jto
.2 0
MNN

-V
-.4
0I0
00
-,-I
0>oG)0, ~.
0 w1%~.
-4. 0..4
00N
4-A
4.0
0.
4-,
'I
0
-V
I'. *~0.
3 ~i NP
V* *~ **
P

-0E
C4
.5.
.0
cf)a- I 0
00
4R 't0 0
T10(r e d)
4.4
V2.
C,)
Cl)
T102(ox)
3.8
.3
V.5
-..
130 230 330 430
TEMPERATURE /K

t O.., ' " ' .-
1.0 o1
0.8 -0
P. 0.6
' 0.4-o
.
0.2
0 1 2 3 4 5
Pt coverage/(ML )
I m 'f-- . p

-CD
0'
U) so
0w
ctcc0n
00C
ow
0-0
CI
* K
,AISN3NI 9 SV0
-------

kq~ 4
' !rf
~ Op
8; 4-
..


![Adsorbate-driven reactive interfacial Pt-NiO …advances.sciencemag.org/content/advances/4/7/eaat3151.full.pdf · support interaction (SMSI) effect] was discovered by Schwab (1),](https://img.pdfslide.us/doc/110x75/5b9880cf09d3f2ef798c25f4/adsorbate-driven-reactive-interfacial-pt-nio-support-interaction-smsi-effect.jpg)