Embed Size (px)
Citation preview
J. Phys. Chem. 1984, 88, 4995-5004 4995
This exchange at the acetate level cannot explain the 12CH3'2CH2160H and '3CH313CH21sOH formation without an exchange with water of the formed acetaldehyde or surface acetyl species.
Table I1 gives the statistical repartition of the labeled carbon and oxygen in the ethanol obtained after reaction with the same CO mixture and for the same number of equilibria for C H 2 0 and
The isotopic repartition after five (5 + 5) water-aldehyde equilibria shows that the mechanism by carboxylate species cannot be rejected. Even if the results of Takeuchi and Katzer" show that there is a minor contribution to the ethanol production by a methanol homologation they cannot exclude the intermediacy of methanol precursors.
Conclusions It is shown with the results of Takeuchi and Katzer' that the
mechanism consisting of a CO insertion into a M-CH3 group
CH3CHO.
cannot be rejected if we take into account a rapid reversible water-aldehyde reaction which is not the case in the previously cited work^.^-^
The methyl group can be formed in different ways: surface carbon, aldehyde, or methoxy species with the participation of the ~ u p p o r t . ~ The work of Takeuchi and Katzer, showing that the methanol cannot come from a surface carbon, combined with the recent results of Makambolz which showed a direct way from a methoxy to a methyl group and, finally, the presence of formyl species as evidenced in our laboratory on a 2% Rh-2% Ce02/Si02 catalyst lead us to suggest a mechanism through nondissociative adsorption of CO.
Acknowledgment. A bursary from the Hydro-Quebec Research Center to R.B. is gratefully acknowledged. We are indebted to one of the referees for printing out ref 8.
Registry No. CO, 630-08-0; Rh, 7440-16-6; ethanol, 64-17-5.
(1 1) Takeuchi, A,; Katzer, J. R.; Crecely, R. W. J. Catal. 1983,82, 474. (12) Makambo, L. Thesis Docteur es Sciences Universitd Poitiers, 1983.
Analysis of Slow-Motional Electron Spln Resonance Spectra in Smectic Phases in Terms of Molecular Configuration, Intermolecular Interactions, and Dynamics
E. Meirovitchtl and J. H. Freed*$
Baker Laboratory of Chemistry, Cornell University, Ithaca, New York 14853, and Isotope Department, The Weizmann Institute of Science, 761 00 Rehovot, Israel (Received: February 21, 1984)
ESR spectra from two oxazolidine derivative spin probes (CSL and 1,14-stearic acid) dissolved in the smectic phase of S2 were carefully analyzed and the results interpreted in terms of ordering characteristics, molecular conformation, and dynamics by using powerful and comprehensive spectral simulation techniques. The rigid CSL is highly ordered in the smectic A phase as expected for strong interactions with the rigid aromatic cores of the liquid-crystal molecules and shows reorientational motion well approximated as Brownian in the mean potential of the solvent molecules. The principal axes of ordering of CSL are found to be tilted with respect to the principal axes of the magnetic tensor, and the Euler angles specifying this tilt could be determined, because of the sensitivity of the slow-motional spectra to these parameters. The considerable sensitivity of these spectra to the shape of the orienting potential is also demonstrated, and values for coefficients in the expansion of the potential in the spherical harmonics through L = 4 are estimated. The flexible 1,14-stearic acid probe is only weakly ordered in the smectic phase. It shows an anisotropy in its rotational diffusion tensor that is smaller than predicted for an extended all-trans conformation, suggesting an average configuration with a decreased length-to-width ratio. However, the end segment containing the N-O group appears to be in an all-trans configuration, judging by the observed collinearity between the principal symmetry axis of diffusion and ordering with that of the hyperfine tensor. Its low ordering and reduced activation energy for reorientation in the smectic phase suggest primary coupling to the alkyl chain region of the solvent molecules. The spectral simulations are improved by introducing asymmetry in the viscosity, but related anomalies suggest the likelihood of some other mechanism such as a fluctuating torque model. A comparison of the results of this and other studies is made to show how, by the use of different spin probes, one can obtain insights into the intermolecular interactions operating in anisotropic fluids.
I. Introduction Anisotropic fluids differ from isotropic liquids in that there is
a mean ordering potential in the former case. It leads to preferred spatial orientations being imposed on the constituent molecules. Various spectroscopic methods, including nuclear magnetic res- onance (NMR) and electron spin resonance (ESR), have been employed to elucidate ordering characteristics in liquid-crystalline phases.'J The anisotropic parts of the N M R interaction are a t most of the order of several hundred kilohertz. Molecular re- orientation in liquids, occurring at rates of the order of 107-1010 s-l, is, therefore, rapid on the time scale of this technique, and the N M R spectra are determined by motionally averaged Ham- iltonians. Thus, the appearance of the spectrum is not directly
+ Weizmann Institute. * Cornell University.
0022-3654/84/2088-4995$01.50/0
affected by the dynamic rates, so the experimentally measurable spectral shifts are related to products of mean geometric param- eters (e.g., averaged conformations of chain segments) and of ordering tensors representing the molecular orientation in the mean potential due to the surrounding molecules. It is not possible to decouple these in a straightforward manner. Assumptions re- garding molecular conformation need to be made to extract in-
(1) (a) Doane, J. W. 'Magnetic Resonance of Phase Transitions"; Owens, F. J., Poole, C. P., Farach, H. A., Eds., Academic Press: New York, 1979; p 171. (b) "Introduction to Liquid Crystals"; Priestly, E. B., Wojtowicz, P. J., Sheng, P., Eds.; Plenum Press: New York, 1969. (c) Diehl, P.; Khetrapal, C. L. In "NMR, Basic Principles and Progress"; Diehl, P., Fluck, E., Kosfeld, R., Eds.; Springer-Verlag: West Berlin, 1969; p 3. (d) Mantsch, H. H.; Saito, H.; Smith, I. C. P. Prog. Nucl. Magn. Reson. Spectrosc. 1976, 11, 211.
(2) "Spin Labeling: Theory and Applications"; Berliner, L. J., Ed.; Aca- demic Press: New York, 1976 and references therein.
0 1984 American Chemical Society
4996 The Journal of Physical Chemistry, Vol. 88, No. 21, 1984 Meirovitch and Freed
I
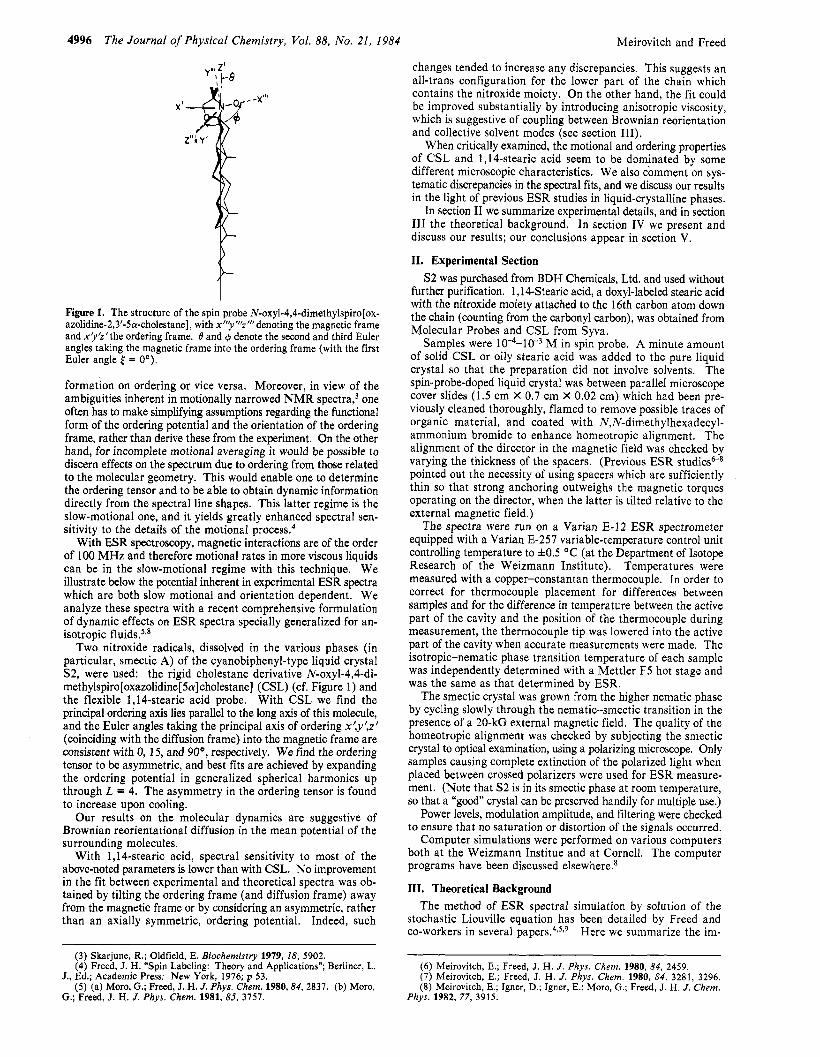
Figure 1. The structure of the spin probe N-oxyl-4,4-dimethylspiro[ox- azolidine-2,3’-5a-cholestane], with x”’y”z’’’ denoting the magnetic frame and x’y’z’the ordering frame. 0 and @ denote the second and third Euler angles taking the magnetic frame into the ordering frame (with the first Euler angle [ = 0”).
formation on ordering or vice versa. Moreover, in view of the ambiguities inherent in motionally narrowed NMR ~ p e c t r a , ~ one often has to make simplifying assumptions regarding the functional form of the ordering potential and the orientation of the ordering frame, rather than derive these from the experiment. On the other hand, for incomplete motional averaging it would be possible to discern effects on the spectrum due to ordering from those related to the molecular geometry. This would enable one to determine the ordering tensor and to be able to obtain dynamic information directly from the spectral line shapes. This latter regime is the slow-motional one, and it yields greatly enhanced spectral sen- sitivity to the details of the motional p r o c e ~ s . ~
With ESR spectroscopy, magnetic interactions are of the order of 100 MHz and therefore motional rates in more viscous liquids can be in the slow-motional regime with this technique. We illustrate below the potential inherent in experimental ESR spectra which are both slow motional and orientation dependent. We analyze these spectra with a recent comprehensive formulation of dynamic effects on ESR spectra specially generalized for an- isotropic fluids.s**
Two nitroxide radicals, dissolved in the various phases (in particular, smectic A) of the cyanobiphenyl-type liquid crystal S2, were used: the rigid cholestane derivative N-oxyl-4,4-di- methylspiro[oxazolidine[5~~]cholestane] (CSL) (cf. Figure 1) and the flexible 1,lCstearic acid probe. With CSL we find the principal ordering axis lies parallel to the long axis of this molecule, and the Euler angles taking the principal axis of ordering x‘,y’,z‘ (coinciding with the diffusion frame) into the magnetic frame are consistent with 0, 15, and 90°, respectively. We find the ordering tensor to be asymmetric, and best fits are achieved by expanding the ordering potential in generalized spherical harmonics up through L = 4. The asymmetry in the ordering tensor is found to increase upon cooling.
Our results on the molecular dynamics are suggestive of Brownian reorientational diffusion in the mean potential of the surrounding molecules.
With 1,14-stearic acid, spectral sensitivity to most of the above-noted parameters is lower than with CSL. No improvement in the fit between experimental and theoretical spectra was ob- tained by tilting the ordering frame (and diffusion frame) away from the magnetic frame or by considering an asymmetric, rather than an axially symmetric, ordering potential. Indeed, such
(3) Skarjune, R.; Oldfield, E. Biochemistry 1979, 28, 5902. (4) Freed, J. H. ‘Spin Labeling: Theory and Applications”; Berliner, L.
( 5 ) (a) Moro, G.; Freed, J. H. J. Phys. Chew. 1980,84, 2837. (b) Moro, J., Ed.; Academic Press: New York, 1976; p 53,
G.; Freed, J. H. J . Phys. Chem. 1981,85, 3757.
changes tended to increase any discrepancies. This suggests an all-trans configuration for the lower part of the chain which contains the nitroxide moiety. On the other hand, the fit could be improved substantially by introducing anisotropic viscosity, which is suggestive of coupling between Brownian reorientation and collective solvent modes (see section 111).
When critically examined, the motional and ordering properties of CSL and 1,14-stearic acid seem to be dominated by some different microscopic characteristics. We also comment on sys- tematic discrepancies in the spectral fits, and we discuss our results in the light of previous ESR studies in liquid-crystalline phases.
In section I1 we summarize experimental details, and in section 111 the theoretical background. In section IV we present and discuss our results; our conclusions appear in section V.
11. Experimental Section S2 was purchased from BDH Chemicals, Ltd. and used without
further purification. l114-Stearic acid, a doxyl-labeled stearic acid with the nitroxide moiety attached to the 16th carbon atom down the chain (counting from the carbonyl carbon), was obtained from Molecular Probes and CSL from Syva.
Samples were 10-4-10-3 M in spin probe. A minute amount of solid CSL or oily stearic acid was added to the pure liquid crystal so that the preparation did not involve solvents. The spin.probe-doped liquid crystal was between parallel microscope cover slides (1.5 cm X 0.7 cm X 0.02 cm) which had been pre- viously cleaned thoroughly, flamed to remove possible traces of organic material, and coated with N,N-dimethylhexadecyl- ammonium bromide to enhance homeotropic alignment. The alignment of the director in the magnetic field was checked by varying the thickness of the spacers. (Previous ESR studies6-8 pointed out the necessity of using spacers which are sufficiently thin so that strong anchoring outweighs the magnetic torques operating on the director, when the latter is tilted relative to the external magnetic field.)
The spectra were run on a Varian E-I2 ESR spectrometer equipped with a Varian E-257 variable-temperature control unit controlling temperature to f0.5 OC (at the Department of Isotope Research of the Weizmann Institute). Temperatures were measured with a copper-constantan thermocouple. In order to correct for thermocouple placement for differences between samples and for the difference in temperature between the active part of the cavity and the position of the thermocouple during measurement, the thermocouple tip was lowered into the active part of the cavity when accurate measurements were made. The isotropic-nematic phase transition temperature of each sample was independently determined with a Mettler F5 hot stage and was the same as that determined by ESR.
The smectic crystal was grown from the higher nematic phase by cycling slowly through the nematic-smectic transition in the presence of a 20-kG external magnetic field. The quality of the homeotropic alignment was checked by subjecting the smectic crystal to optical examination, using a polarizing microscope. Only samples causing complete extinction of the polarized light when placed between crossed polarizers were used for ESR measure- ment. (Note that S2 is in its smectic phase at room temperature, so that a “good” crystal can be preserved handily for multiple use.)
Power levels, modulation amplitude, and filtering were checked to ensure that no saturation or distortion of the signals occurred.
Computer simulations were performed on various computers both at the Weizmann Institue and at Cornell. The computer programs have been discussed elsewhere.8
111. Theoretical Background The method of ESR spectral simulation by solution of the
stochastic Liouville equation has been detailed by Freed and co-workers in several paper^.^^^,^ Here we summarize the im-
(6) Meirovitch, E.; Freed, J. H. J . Phys. Chem. 1980, 84, 2459. (7) Mefrovitch, E.; Freed, J. H. J. Phys. Chem. 1980, 84, 3281, 3296. (8) Meirovitch, E.; Igner, D.; Igner, E.; Moro, G.; Freed, J. H. J . Chem.
Phys. 1982, 77, 3915.
Slow-Motional ESR Spectra in Smectic Phases The Journal of Physical Chemistry, Vol. 88, No. 21, 1984 4997
portant features and parameters of the theory and refer the reader to the original work for details. We also assume some familiarity with rudimentary properties of liquid crystals on the part of the reader and mention only those features relevant to this discussion.
The stochastic Liouville equation describes the time dependence of the spin density matrix, p(Q, t ) , according to
where po is the equilibrium spin density matrix and Q represents the set of Euler angles specifying molecular orientation. rn is the time-independent rotational diffusion operator; the time de- pendence of Q is described by a stationary Markov process, and rn is the corresponding Markov operator, Le.
where P(0,t) is the probability of being a t orientation Q at time t . Usually Fa is taken as the rotational diffusion operator. The spin Hamiltonian can be separated into three parts, Ho + H,(Q) + e ( ? ) , where Ho includes the orientation-independent nuclear and electronic Zeeman interactions and the isotropic part of the 14N hyperfine interaction and H I (a) contains the anisotropic parts of the various terms of the spin Hamiltonian, of which the hy- perfine interaction and the electronic Zeeman interaction (the A and g tensors, respectively) are the most important. E(?) is the time-dependent interaction of the electron spin with the oscillating electromagnetic field needed for spectral observation.
For a solute undergoing Brownian rotational diffusion in the presence of an orienting potential exerted by the liquid-crystalline solvent, the diffusion equation becomes
a ( ~ , t ) / a t = -~w(QJ),P(Q,~)I - r , [p (w) - ~ ~ ( ~ 1 1 (1)
a ~ ( ~ , t ) / a t = -r,P(Q,t) (2)
where is the vector operator which generates infinitesimal rotations (and can be identified with an angular momentum op- erator), U(Q) is the potential exerted by solvent on solute, and R is the molecular diffusion tensor.
Solution of eq 1 requires that all component terms be specified in the same coordinate frame; this is achieved through appropriate application of the Wigner rotation matrices. The different co- ordinate frames of relevance are defined as follows:
(a) The laboratory frame, denoted by x,y,z, is defined by the external magnetic field Ho, with Ho along the z direction.
(b) The director frame, denoted x”,y”,z”, relates to the liq- uid-crystalline solvent. The nematic director Z is perpendicular to the smectic layers (for a smectic A phase) and is parallel to the average orientation of the long axis of the liquid-crystal molecules. By virtue of the cylindrical symmetry of the smectic A phases, x”and y”are arbitrary. Since the director Z becomes “frozen in” upon crossing the nematic to smectic phase transition, the relative orientation of Z and Ho can be varied easily experi- mentally.
(c) The ordering frame x’y’z’is associated with the preferred molecular orientation relative to the director. The ordering frame may be tilted relative to the magnetic frame x”’y a as specified by the three Euler angles f , 0, and q5, which are all adjustable in the calculations. For example, for doxyl-labeled aliphatic chains, the manner of attachment of the nitroxide ring to the carbon skeleton is such that z’is parallel to z”’ provided that the portion of the chain containing the nitroxide moiety is in an all-trans conformation. Then deviation of z’ from z”’ is related in a straightforward manner to conformations other than an extended all-trans configuration. We shall refer below to the solid angle Q ( S , O , @ ) defining the relative orientations of the x’y ’z’ and the x”’y”’z”’ frames as the “ordering tilt” (see Figure 1).
The molecular diffusion frame is taken in our formulation to coincide with the ordering frame and is restricted to axial sym- metry.
(9) (a) Freed, J. H.; Bruno, G. V.; Polnaszek, C. F. J. Phys. Chem. 1971, 75, 3385. (b) Polnaszek, C. F.; Bruno, G. V.; Freed, J. H. J . Chem. Phys. 1973, 58, 1324. (c) Polnaszek, C. F.; Freed, J. H. J . Phys. Chem. 1975, 79, 2283 . (d) Polnaszek, C. F. Ph.D. Dissertation, Cornel1 University, 1976. (e) Mason, R. P.; Polnaszek, C. F.; Freed, J. H. J . Phys. Chem. 1974, 78, 1324.
(d) The magnetic frame, denoted by x”’y”’z”’, is that frame in which the g tensor is diagonal. Our formulatiorr allows for an arbitrary tilt between the principal axes of the g tensor and the principal axes of the A tensor.
By convention, of a nitroxide is defined as lying along the nitrogen p orbital (or the N-0 ?r orbital), as lying along the N-0 bond, and y”’ as being perpendicular to the other two. Obviously, the orientation of the ordering frame is fluctuating in time relative to the director frame, due to the molecular motion.
Using full line-shape analysis, it is possible to obtain details of the ordering, dynamics, and conformation of probe molecules dissolved in liquid-crystalline solvents, Le., details of reorientational rates, relative bond angles, molecular flexibility, order parameters, orientation of ordering (and diffusion) axes, and coupling of the dynamic behavior of probe and solvent molecules.6-12 For axially symmetric diffusion, the two rotational diffusion constants are RIl and R,, the former being that for rotation parallel to the z’ axis and the latter being perpendicular to it. The case of RII # R, is referred to as “anisotropic diffusion”. In the Stokes-Einstein limit, N RII/R, is determined by simple geometric aspects of the molecule. Thus, for CSL, one estimates N = 4.7,’O while for an all-trans stearic acid, roughly 10,” provided both molecules are approximated by perfect cylinders. For a model of Brownian reorientation, the difference between the behavior of a probe molecule in anisotropic vs. isotropic medium is due only to the ordering. Another simple case is for the diffusion tensor to be diagonal in the director frame x”,y ”,z” (rather than a molecular frame), a case referred to as “anisotropic viscosity”. The principal axes of diffusion of the solute are then determined not by solute geometry but by soluent properties. The elemznts of the tensor diagonal in !his frame arePenoted ,as R,, and R with anisotropy parameter N defined by N = RII/R,.
Freed and co-workers (see, in particular, ref 9c and Appendix C of ref 12) have considered the more complex situation of combined anisotropic diffusion and viscosity and have found a convenient special case in which the diffusion tensor can be de- composed into two components, with time-independent principal values respectively in the molecular and the director frames. This is the approach for anisotropic viscosity we have adopted in the present work. However, Polnaszek and Freedgc have suggested that an N # 1 .O could be symptomatic of a mechanism whereby localized collective modes of the liquid-crystalline solvent become coupled into the Brownian reorientation of the ESR probe.
Liquid-crystalline solvent molecules exert a mean ordering potential on the solute molecules, causing them to orient pref- erentially. The mean orienting potential for probes dissolved in a liquid-crystalline solvent is written most generally as
(4)
where the D’s are elements of the Wigner rotation matrices of rank L and the Q = (a,&-y) are the Euler angles between the molecular ordering and the director frames. Symmetry consid- erations allow for simplification of this expression. The equivalence of Z and -E reduces the expansion to only terms of even L. A uniaxial liquid crystal implies cylindrical symmetry about E, so U(Q) becomes independent of 7, Le., M = 0. For an axially symmetric probe in a uniaxial medium, the potential can be expanded by using the Legendre polynomials PL(p) = @o(OpO) as the basis et,^,^^ i.e.
( 5 ) L
The commonly used order parameter, S, is defined by
j d Q exp(-U/ k T ) Dao( Q)
S d Q exp(-U/kr) s = ( 1 / 2 ( 3 cos2 p - 1) ) = =
(10) Rao, K. V. S.; Polnaszek, C. F.; Freed, J. H. J . Phys. Chem. 1977,
(1 1) Broido, M. S.; Meirovitch, E. J . Phys. Chem., in press. 81, 449.
4998 The Journal of Physical Chemistry, Vol. 88, No. 21, 1984 Meirovitch and Freed
where cos p = Z’.z’rr. For many systems it is reasonable to assume cylindrical molecular symmetry and to truncate the expansion at L = 2. Then, the potential U reduces to a form similar to the Maier-Saupe potential in which only the first term Di0 = Pz in the expansion is kept. (Note, however, that a Maier-Saupe potential is a mean-field model, whereas eq 5 refers to the true potential of mean torque acting on the molecule.) When the assumption of cylindrical molecular symmetry is not valid, it is necessary to use the expansion. Previous studies have shown that even when the molecular ordering is cylindrically symmetric, inclusion of the P4 term may be necessary.1° Using the real linear combinations of the D’s and assuming that we may use a simple molecular ordering frame (Le., U( 9 ) has point group symmetry Dz) , one obtains for an asymmetric molecule
(where for simplicity we have not included the term in D:,(Q) + &(a)). The related order arameters ( D i 2 ( 9 ) + DW2(Q)),
are given by expressions analogous to eq 6.
For a long ellipsoidal molecule, it is expected that z’ will be more strongly ordered (parallel (perpendicular) to the director for a prolate (oblate) ellipsoid) than x’or y’, implying (D;,) is greater than (PW2). (db2 + &2) is a measure of the difference in ordering of the x’ and y’ axes, Le., of the asymmetry in the fluctuations of the long molecular axis about the director. Preferential ordering of y ’ greater than x’ along the director corresponds to ( D k 2 + D k 2 ) being greater than zero.
In performing slow-motional line-shape analyses, one varies the rotational diffusion coefficients, the ordering parameters, as well as the relative orientation of the diffusion (ordering), and magnetic coordinate frames in order to obtain best-fit simulations. We discuss in detail the sensitivity of spectra to these parameters below, and we point out that it is precisely the sensitivity to these pa- rameters which allows for the extraction of detailed information about probe molecules in ordered systems.
We show that careful analysis of a series of spectra, obtained by varying the orientation of the liquid-crystalline director n’ relative to the external magnetic field H,, and not just a single spectrum, is imperative if one is to obtain a unique and accurate fit. Moreover, some of the information inherent in the ESR spectrum, relating primarily to ordering characteristics, is ob- tainable only with orientation-dependent and slow-motional spectra.
IV. Results and Discussion A. Magnetic Parameters. The proper procedure for deter-
mining the magnetic parameters is to prepare an isotropic rig- id-limit powder of the spin-probe-doped sample and simulate the ESR spectrum. Due to limited resolution, it is usually impossible to determine all six principal values of the two tensors A and g. Ad,, is, however, always obtainable with relatively high precision. Both the CSL and the 1,14-stearic acid spectra are still affected by motion at the lower limit of the smectic A phase of S2. By lowering the temperature below the smectic A to solid phase transition, we obtained a solid dispersion of liquid-crystalline molecules, containing a small amount of randomly dispersed paramagnetic ESR probes, and the magnetic parameters obtained from the associated ESR spectrum do not necessarily reflect those typical of the smectic A phase. The best “model system” we could conceive of was to dissolve the spin probes in the nematic phase of 5CB, which is chemically similar to the liquid-crystal S2, both being cyanobiphenyl derivatives. 5CB can easily be supercooled.* We lowered the temperature of CSL and 1,14-stearic acid doped into 5CB in order to obtain isotropic rigid-limit powder spectra. These exhibited relatively low resolution, and only Azl,l could be determined with reasonable accuracy. We obtained 30.8 rt 1.0 G for CSL and 31.8 f 1.0 G for 1,lCstearic acid.
The isotropic constant aN was obtained from ESR spectra recorded in the isotropic phases of S2 and 5CB. We measured 14.15 and 14.2 G, respectively, for CSL and 14.45 and 14.3 G,
( D i 0 ( 9 ) ) , and ( D k 2 ( 9 ) + D,,(Q)) ?
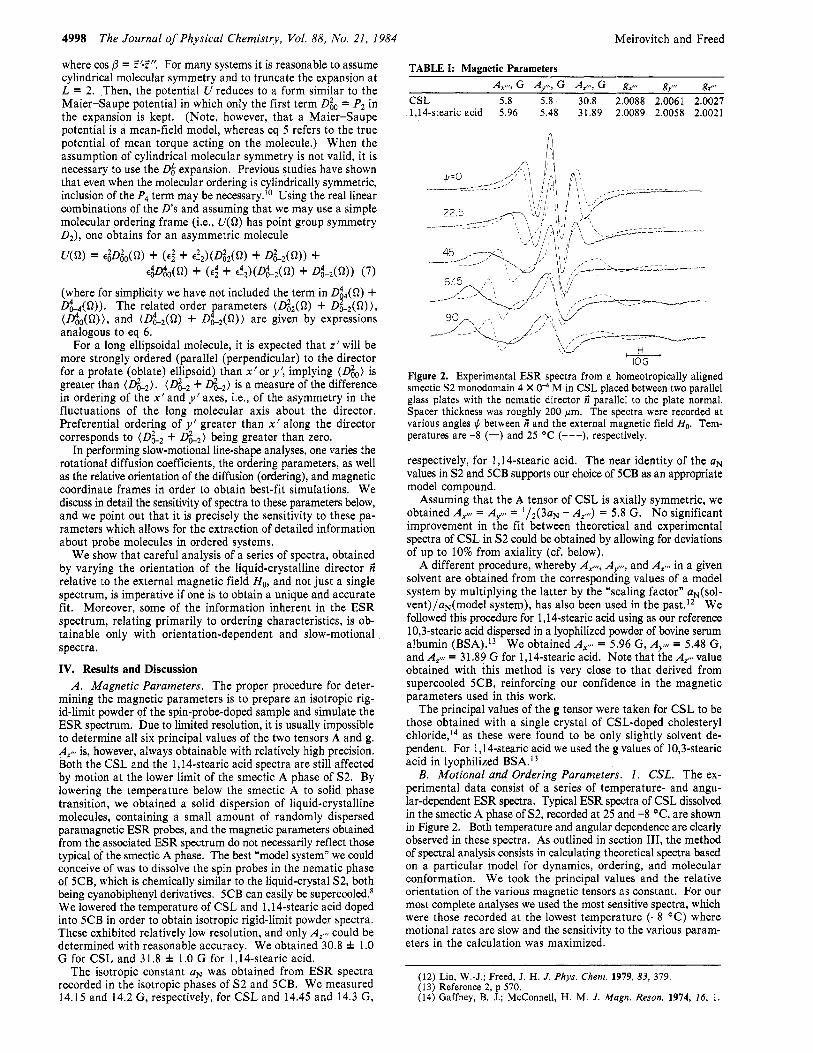
TABLE I: Magnetic Parameters A?,,, G A y , G A+,,, G g p g,,w g y
CSL 5.8 5.8 30.8 2.0088 2.0061 2.0027 1.14-stearic acid 5.96 5.48 31.89 2.0089 2.0058 2.0021
wj > ,- - - _ - - _ - -
, H ~
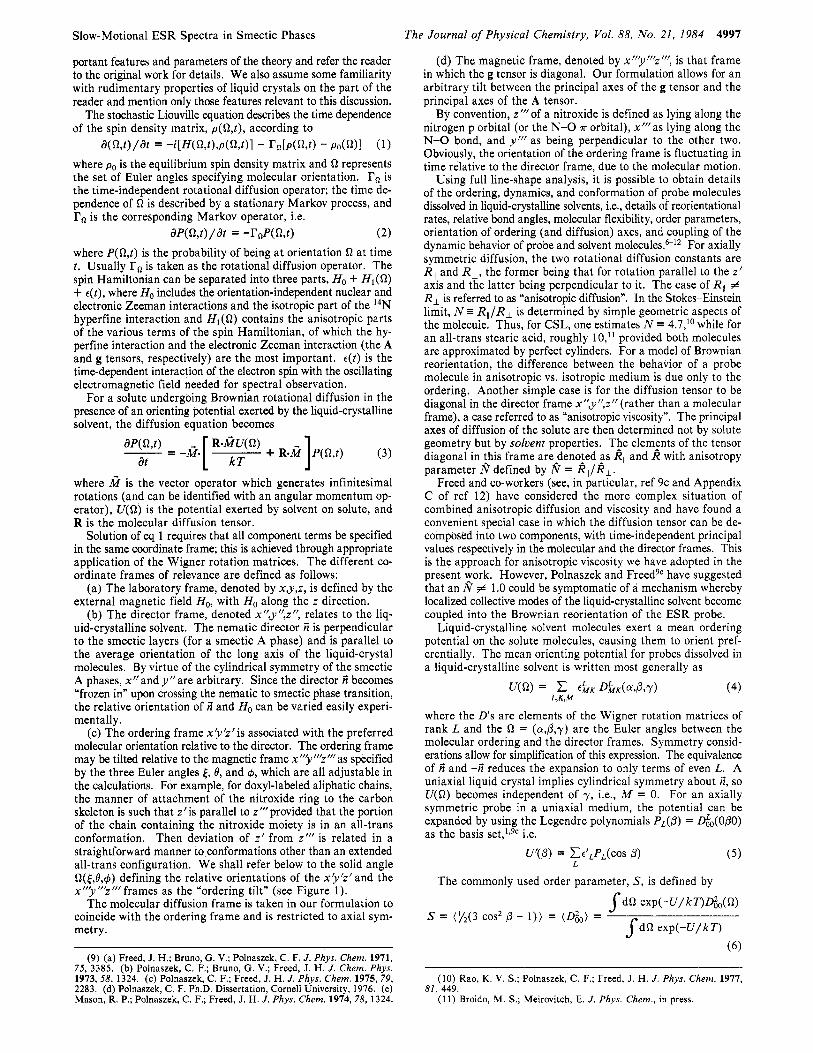
IOG Figure 2. Experimental ESR spectra from a homeotropically aligned smectic S2 monodomain 4 X O4 M in CSL placed between two parallel glass plates with the nematic director n’ parallel to the plate normal. Spacer thickness was roughly 200 pm. The spectra were recorded at various angles + between n’ and the external magnetic field Ho. Tem- peratures are -8 (-) and 25 “C (---), respectively.
respectively, for 1,14-stearic acid. The near identity of the aN values in S2 and 5CB supports our choice of 5CB as an appropriate model compound.
Assuming that the A tensor of CSL is axially symmetric, we obtained Ax,,, = A y = 1/2(3aN - AZ,,,) = 5.8 G. No significant improvement in the fit between theoretical and experimental spectra of CSL in S2 could be obtained by allowing for deviations of up to 10% from axiality (cf. below).
A different procedure, whereby Ax,,,, AY+ and Aztt, in a given solvent are obtained from the corresponding values of a model system by multiplying the latter by the “scaling factor” aN(sol- vent)/a,(model system), has also been used in the past.12 We followed this procedure for 1,14-stearic acid using as our reference 10,3-stearic acid dispersed in a lyophilized powder of bovine serum albumin (BSA).13 We obtained AX,,, = 5.96 G, Ay”, = 5.48 G, and Ai,, = 31.89 G for 1,14-stearic acid. Note that the Art value obtained with this method is very close to that derived from supercooled 5CB, reinforcing our confidence in the magnetic parameters used in this work.
The principal values of the g tensor were taken for CSL to be those obtained with a single crystal of CSL-doped cholesteryl chloride,14 as these were found to be only slightly solvent de- pendent. For 1,14-stearic acid we used the g values of 10,3-stearic acid in lyophilized BSA.13
B. Motional and Ordering Parameters. I . CSL. The ex- perimental data consist of a series of temperature- and angu- lar-dependent ESR spectra. Typical ESR spectra of CSL dissolved in the smectic A phase of S2, recorded at 25 and -8 OC, are shown in Figure 2. Both temperature and angular dependence are clearly observed in these spectra. As outlined in section 111, the method of spectral analysis consists in calculating theoretical spectra based on a particular model for dynamics, ordering, and molecular conformation. We took the principal values and the relative orientation of the various magnetic tensors as constant. For our most complete analyses we used the most sensitive spectra, which were those recorded at the lowest temperature (-8 “C) where motional rates are slow and the sensitivity to the various param- eters in the calculation was maximized.
(12) Lin, W.-J.; Freed, J. H. J . Phys. Chem. 1979, 83, 379. (1 3) Reference 2, p 570. (14) Gaffney, B. J.; McConnell, H. M. J. Mugn. Reson. 1974, 16, 1.

Slow-Motional ESR Spectra in Smectic Phases
A
The Journal of Physical Chemistry, Vol. 88, No. 21, 1984 4999
L
Figure 3. Comparison between the experimental spectrum recorded for # = 0” at -8 OC and various calculated spectra. Input variables common to all theoretical spectra in this figure: gdrf = 2.0089, gy = 2.0058, gZ,,,
truncation scheme L = 8, K = 4 used except for the calculated trace in (b), for which L = IO, K = 4 were used; nL (number of Lanczos steps in the process of tridiagonalizing the original matrix5) = 40; inhomoge- neous h e width T,*-’ = 1.5 G. Specific input variables used: (a) calculated (---): R, = 6 X lo6 s-l, ea = 2.5, B = 6 = O”, experimental (-); (b) calculated (---): R, = 4 X IO6 s-l, ea = 5.0, 0 = 6 = O”, experimental (-); (c) same as calculated spectrum in (a) (-), same as calculated spectrum in (a), except that 8 = 15” and 6 = 90” rather than
e: + €2, = 1, e: = 2.5, and e; + e!, = 0 (-.-).
The first attempts were directed toward simulation of the I,L = 0” spectrum recorded at -8 O C (with + denoting the angle between the liquid-crystalline director Z of the uniform sample and the external magnetic field Ho), assuming axial ordering, coincidence of the magnetic axis and the main ordering axis z’(see Figure l), identity of the A and g tensor coordinate frames, and a diffusional anisotropy of N = RII/R, = 4.7 as predicted by simple geometric considerations.10 Then, the only variables in the calculation are the motional rate R,, the ordering parameter (Dk), and the inhomogeneous line width T2*-’.
The dashed lines in parts a and b of Figure 3 represent cal- culations performed with R , = 6 X lo6 s-’ and (go) = 0.53 and with R , = 4 X lo6 s-l and (Die) = 0.78, respectively. The main discrepancy between the theoretical and the experimental spectra is the exceedingly large hyperfine splitting of the former. Com- parison of parts a and b of Figure 3 shows that slowing down the motion and increasing the ordering does indeed reduce the hy- perfine splitting, but the relative intensities of the hyperfine components are affected in the wrong direction. To proceed further, one must necessarily modify the model used to be a less restrictive one. For R , = 6 X lo6 s - I and ( D t o ) = 0.53, the I,L = 0 spectrum is very sensitive to the relative magitude of the ordering parameters and nearly invariant to noncoincidence of z’ and y”’, as illustrated in Figure 3c. However, asymmetric ordering with (Di2 + d#?j2) # 0 increased, rather than decreased, the disagreement between theory and experiment and was, therefore, not considered. The only way to improve the fit a t orientations close to $ = 0 within the dynamic range defined by R = 6 X IO6 s-l and (D&) = 0.78-0.82 (or 6; = 5.0-6.0) is to reduce the hyperfine component Ayttxt,, from 5.8 G to about 4 G. To obtain an overall best fit, Le., good agreement between theory and experiment for the entire series of angular-dependent spectra recorded a t -8 “C, further significant changes in the magnetic parameters had to be made. Such readjustment could not be justified on physical grounds, nor could one maintain the scaling relations of the A tensor, which would be inconsistent with previous studies.6Jo,9CJZ Thus, we look for “improvements” in the dynamical model.
= 2.0021, Ad,, = A,w = 5.8 G, A p = 30.8 G,14 N = RIl/R, = 4.7;
6 = 00 (--- ), * same as calculated spectrum in (a), except that ef = 1.5,
Figure 4. Experimental spectrum recorded for 1c. = 0’ at 8 “C (-) Input parameters common to all calculations: magnetic parameters as in captions of Figure 3, $ = 90°, N = 4.7, truncation scheme L = 14, K = 6, M = 2. Specific input parameters: (a) 8 = 15”, 6 = 90°, T2*-l = 1.5 G, e; = 6.5, R, = 1.0 X lo6 S-’ (---); R, = 2.0 X IO6 S-’ ( -e - ) .
(b) R, = 2.0 X lo6 S-I, e f = 5.5, T2*-’ = 0.7 G, 8 = 15”, 6 = 90” (---); 8 = 6 = 0” (-*-). (c) R , = 2 X lo6 s- ’ , e; = 5.5, Tz*-’ = 0.7 G, 8 = 15O, q5 = 90’ (---); q5 = 80’ (-*-). (d) R 1.0 X lo6 S-I, B = 1 5 O ,
G (---); ef = 5.5, Tz*-I = 0.7 G (-*-); e f = 2.0, t i + €22 3.55, T2*-’ q5 = 90°, ef = 3.0, e: + €2, = 1.0, 6; = 1.0, e j :~ !~ = 0.55, T,*-‘ = 1.5
= 0.7 G (...).
We found that with R , = (1-2) X IO6 s-l and (D;,) = 0.78-0.82 ( E ; = 5.0-6.0) the experimental + = 0 spectrum obtained at -8 “C is quite sensitive to the motional rate R , (Figure 4a) to tilting the ordering (diffusion) frame away from the magnetic frame (Figure 4b,c) and to the detailed form of the ordering potential (Figure 4d).
Inspection of molecular models suggests that the magnetic y ”’ axis is tilted at approximately 15-20” from the long molecular axis z’. Furthermore, an analysis of CSL dissolved in the nematic phase of 4,4’-dimethoxya~oxybis(benzene)~~ indicated that the ordering tensor is axially symmetric in a frame x’y’z’ which is related to the magnetic frame x”~”’z”’such that y’= z”’, whereas z’and x’are respectively tilted at an angle 6’ relative to y”’and x”’ (see Figure 1). This model is consistent with CSL being approximated by a cylinder with its main symmetry axis along z’, but the nitroxide is tilted with respect to it.
More generally, we allow for an arbitrary tilt between xly’z’ and x”’y’’’z’”; Le., all three Euler angles {, 8, and 4 are free variables. We have, indeed, varied them in our calculations. However, we found the following model, which does not ap- proximate CSL as a perfect cylinder, to be a sensible and useful one. We took z’as parallel to the largest dimension of the molecule, y’along the NO K orbital, and x’perpendicular to both (thus, lying within the plane of the oxazolidine ring). This model reflects both the geometry and the electronic structure of CSL and should, therefore, play a major role in determining the order characteristics of this molecule. We estimate C; = Oo, 15’ C 8 < 20°, and 4 = 90’ (see Figure 1).
As outlined below, we have determined the best-fit value of 6’. Possible deviations from this model were also examined by varying C; and 4 in the vicinity of 0 and 90°, respectively. Our results show that such deviation can be ignored.
Figure 3b reveals the substantial improvement in the spectral fit with C; = 0”, 0 = 15O, and 4 = 90” vs. E = 0 = 4 = 0”, whereas
(15) Carr, S. G.; Khoo, S. K.; Luckhurst, G. R.; Zannoni, C. Mol. Cryst. Liq. Cryst. 1976, 35, I.
5000 The Journal of Physical Chemistry, Vol. 88, No. 21, 1984 Meirovitch and Freed
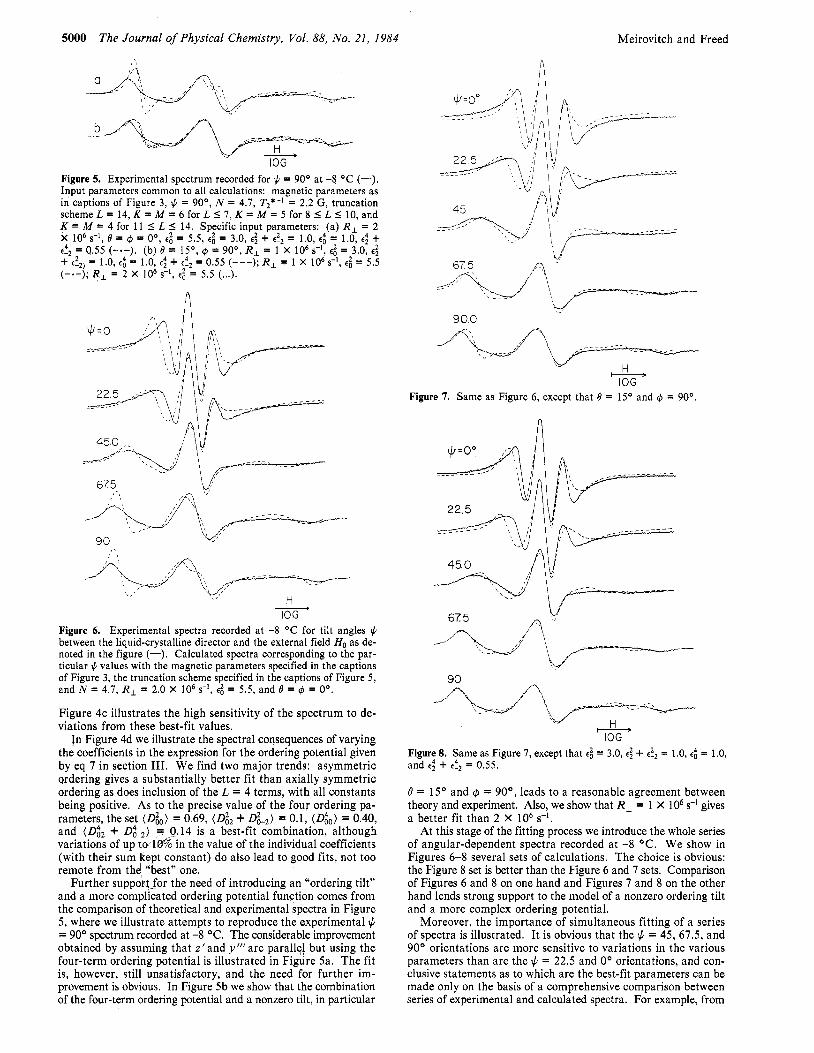
Figure 5. Experimental spectrum recorded for $ = 90° at -8 OC (-). Input parameters common to all calculations: magnetic parameters as in captions of Figure 3, $ = 90°, N = 4.7, T2*-I = 2.2 G, truncation scheme L = 14, K = M = 6 for L 5 7, K = M = 5 for 8 I L I 10, and K = M = 4 for 11 5 L 5 14. Specific input parameters: (a) R, = 2 X lo6 d, 6 = 6 = Oo, e: = 5.5, e: = 3.0, e: + e!2 = 1.0, e$ = 1.0, e; + e!, = 0.55 (-a-). (b) 6 = 15’, 6 = 90°, R, = 1 X lo6 s-’, e l = 3.0, E: + e!2) = 1.0, e: = 1.0, e: + e$ = 0.55 (---); R , = 1 X lo6 s-’, e; = 5.5 ( -e - ) ; R , = 2 X lo6 s-’, e; = 5.5 (...).
90.0
67 5 p
H IOG -
Figure 6. Experimental spectra recorded at -8 OC for tilt angles J , between the liquid-crystalline director and the external field Ho as de- noted in the figure (-). Calculated spectra corresponding to the par- ticular J , values with the magnetic parameters specified in the captions of Figure 3, the truncation scheme specified in the captions of Figure 5, and N = 4.7, R, = 2.0 X lo6 s-l, e: = 5.5, and 6 = 6 = Oo.
Figure 4c illustrates the high sensitivity of the spectrum to de- viations from these best-fit values.
in Figure 4d we illustrate the spectral consequences of varying the coefficients in the expression for the ordering potential given by eq 7 in section 111. We find two major trends: asymmetric ordering gives a substantially better fit than axially symmetric ordering as does inclusion of the L = 4 terms, with all constants being positive. As to the precise value of the four ordering pa- rameters, the set (go) = 0.69, (G2 + dW2) = 0.1, (D:o) = 0.40, and (D& + D g , ) = 0.14 is a best-fit combination, although variations of up t w l d in the value of the individual coefficients (with their sum kept constant) do also lead to good fits, not too remote from the! :best” one.
Further suppol;t_for the need of introducing an “ordering tilt” and a more complicated ordering potential function comes from the comparison of theoretical and experimental spectra in Figure 5, where we illustrate attempts to reproduce the experimental J. = 90’ spectrum recorded at -8 OC. The considerable improvement obtained by assuming that z’ and y’” are parallel but using the four-term ordering potential is illustrated in Figure 5a. The fit is, however, still unsatisfactory, and the need for further im- provement is obvious. In Figure 5b we show that the combination of the four-term ordering potential and a nonzero tilt, in particular
* IOG
Figure 7. Same as Figure 6 , except that 6 = 15’ and 6 = 90°.
90
IOG Figure 8. Same as Figure 7, except that e: = 3.0, e: + e: = 1 .O, e t = 1 .O, and e: + e!2 = 0.55.
8 = 15’ and 4 = 90°, leads to a reasonable agreement between theory and experiment. Also, we show that R , = 1 X lo6 s-’ gives a better fit than 2 X lo6 d.
At this stage of the fitting process we introduce the whole series of angular-dependent spectra recorded at -8 ‘C. We show in Figures 6-8 several sets of calculations. The choice is obvious: the Figure 8 set is better than the Figure 6 and 7 sets. Comparison of Figures 6 and 8 on one hand and Figures 7 and 8 on the other hand lends strong support to the model of a nonzero ordering tilt and a more complex ordering potential.
Moreover, the importance of simultaneous fitting of a series of spectra is illustrated. It is obvious that the J. = 45, 67.5, and 90’ orientations are more sensitive to variations in the various parameters than are the J. = 22.5 and 0’ orientations, and con- clusive statements as to which are the best-fit parameters can be made only on the basis of a comprehensive comparison between series of experimental and calculated spectra. For example, from
Slow-Motional ESR Spectra in Smectic Phases The Journal of Physical Chemistry, Vol. 88, No. 21, 1984 5001
TABLE II: Ordering Parameters and Rates of Rotational Reorientation for CSL in S2 Smectic Phasealb temp, OC (Dk) e l (Diz + D k Z ) e; + e!, (D&) e: (D& + D k 2 ) e: + e!, Tz*-I, G 10"R,, s-I 10-6R, s-I E,, kcal/mol
40 0.38 1.7 0.5 32.0 69.0 25 0.34 1.25 0.06 0.23 0.17 0.73 0.03 0.1 1 .o 15.0 32.5
9 0.73 3.1 0.03 0.4 0.44 1.0 0.05 0.2 1.5 5.0 11.0 12 1 0.75 3.2 0.05 0.6 0.47 1.15 0.07 0.32 1.5 2.5 5.4
-8 0.69 3.00 0.1 1.00 0.40 1.00 0.14 0.55 1.5-2.2 1 .o 2.2
Transition Temperatures ("C) of CSL-Doped S2 S2:solid u SmA - nematic t, isotropic
-10.0 45.2 46.1
T2*-' was found to increase slightly upon going from # = 0 to 90", at -8 "C. The effect was small for -8 "C and almost negligible at higher temperatures. For the spectra illustrated in Figures 6-8, Tz*-' = 2.2 G was taken for $ = 67.5 and 90" and T2*-' = 1.5 G for $z = 45.0, 22.5, and 0". bR = (R,,R,)'/Z SKI .
the + = 0" spectra alone, one would not be able to conclude that axial ordering is inappropriate.
So far we have only allowed for small variations in the theo- retical value of 4.7 for N . As previous work on CSL dissolved in smectic A and B, phases in benzylidene liquid crystals has shown,6 the spectral fit would be improved substantially by using high values of N (interpreted in terms of deviations from Brownian motion). We have also examined this possibility for the CSL in s 2 .
As outlined previously, extensive spectral simulations have been performed to obtain accurate and unique motional, ordering, and geometric parameters. While RII has been determined with relatively high precision, less effort has been invested in fixing a lower limit for R,. We have decreased R , to 1.9 X lo5 s-l, with RII = 4.7 X lo6 s-l (Le., N = 25) and found that the agreement between theory and experiment is reduced. However, such slow motions for R , are probably better studied by other techniques such as electron spin echoes,16 so we reserve final judgment on this matter.
A comment on the quality of the fits in Figure 8 is in order. There is a tendency to view curve-fitting techniques as successful and the results implied as reliable, when good agreement between theory and experiment is achieved. The spectral match in Figure 8 is definitely not perfect. Nevertheless, it represents the best fit after having extensively varied the model parameters. The large sensitivity of the predicted spectra to these parameters (cf. Figures 3-5) allowed us to make the relative distinctions to select this best fit. We cannot, of course, rule out further improvements in fit from the use of even more sophisticated models.
It should be mentioned that the angular dependence of ESR spectra in ordered fluids and uniform morphologies has been studied in the past.'*," However, in these previous cases the molecular motion was rapid on the ESR time scale (or else this was assumed to be so), thus implying relatively low spectral sensitivity. A similar comment applies to a previous slow-motional study of CSL in nematic phase V,Io where the ESR spectra were found to be insensitive to tilting z' away from y"' and to the introduction of asymmetric ordering, but this study only included + = Oo spectra.
Even in the few cases where y"'and z'were found to be non- collinear, the results conformed to axial ordering in the proper frame.15
As mentioned previously, we chose the -8 "C series of spectra as a starting point in the curve-fitting process, on the basis of considerations of maximum spectral sensitivity. The set of var- iables which have led to the best fit were used as a starting point for simulating the higher temperature spectra. Keeping 8 = 15" and 4 = 90" (the tilt between z'and y"'is, most likely, temperature invariant), we proceeded by increasing R, and reducing the value of the ordering parameters, with the premise that, for probe molecules located in a given region of the smectic bilayer throughout the temperature range investigated, ordering is lower
(16) Stillman, A. E.; Freed, J. H. J . Chem. Phys. 1980, 72, 550. (17) (a) Luckhurst, G. R.; Setaka, M. Mol. Cryst. Liq. Cryst. 1972, 19,
179. (b) Luckhurst, G. R.; Setaka, M.; Zannoni, C . Mol. Phys. 1974, 28, 49. (c) Pusnick, F.; Schara, M. Chem. Phys. Lett. 1976, 37, 106.
_. . . -. - ... - - - -
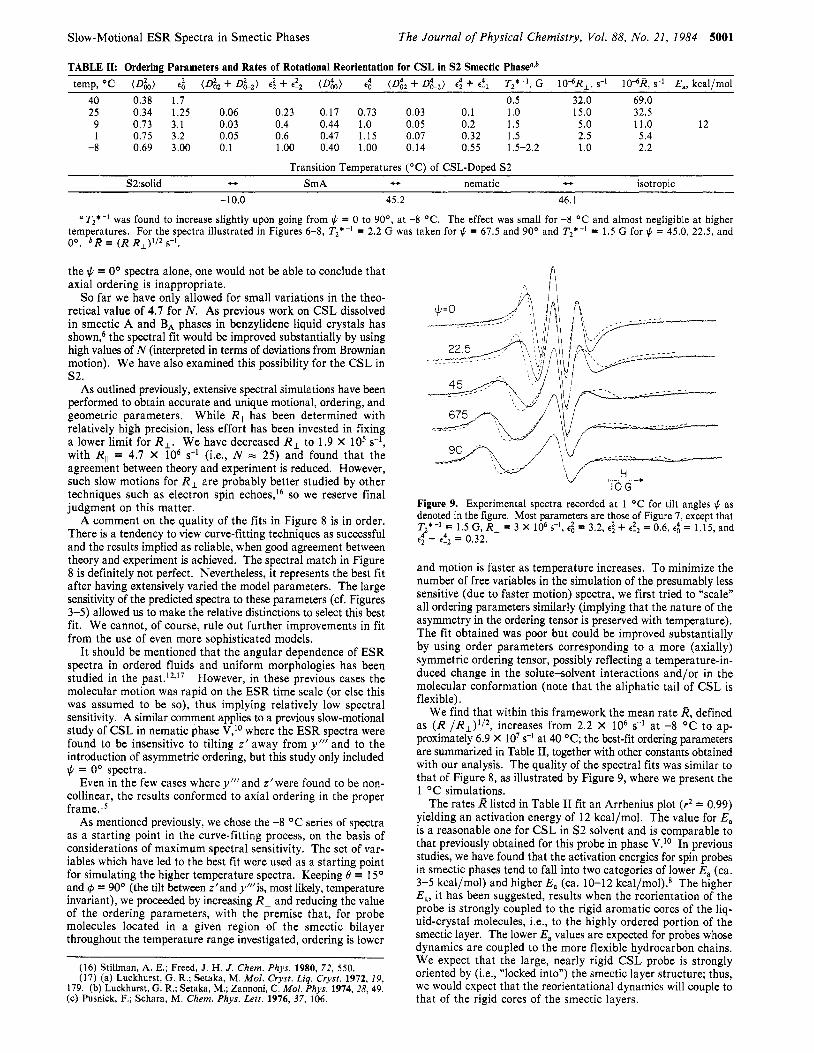
Figure 9. Experimental spectra recorded at 1 OC for tilt angles $z as denoted in the figure. Most parameters are those of Figure 7, except that T z * - l = 1 . 5 G , R I = 3 X 1 0 6 s - l , e ~ = 3 . 2 , e : + e 2 2 = 0 . 6 , e ~ = 1.15,and e: + e$ = 0.32.
and motion is faster as temperature increases. To minimize the number of free variables in the simulation of the presumably less sensitive (due to faster motion) spectra, we first tried to "scale" all ordering parameters similarly (implying that the nature of the asymmetry in the ordering tensor is preserved with temperature). The fit obtained was poor but could be improved substantially by using order parameters corresponding to a more (axially) symmetric ordering tensor, possibly reflecting a temperature-in- duced change in the solute-solvent interactions and/or in the molecular conformation (note that the aliphatic tail of CSL is flexible).
We find that within this framework the mean rate R, defined as ( R , ~ / R ~ ) ~ / ~ , increases from 2.2 x IO6 s-l at -8 "C to ap- proximately 6.9 X lo7 s-l at 40 "C; the best-fit ordering parameters are summarized in Table 11, together with other constants obtained with our analysis. The quality of the spectral fits was similar to that of Figure 8, as illustrated by Figure 9, where we present the 1 O C simulations.
The rates R listed in Table I1 fit an Arrhenius plot (9 = 0.99) yielding an activation energy of 12 kcal/mol. The value for E, is a reasonable one for CSL in S2 solvent and is comparable to that previously obtained for this probe in phase V.Io In previous studies, we have found that the activation energies for spin probes in smectic phases tend to fall into two categories of lower E, (ca. 3-5 kcal/mol) and higher E, (ca. 10-12 kcal/mol).8 The higher E,, it has been suggested, results when the reorientation of the probe is strongly coupled to the rigid aromatic cores of the liq- uid-crystal molecules, Le., to the highly ordered portion of the smectic layer. The lower E, values are expected for probes whose dynamics are coupled to the more flexible hydrocarbon chains. We expect that the large, nearly rigid CSL probe is strongly oriented by (Le., "locked into") the smectic layer structure; thus, we would expect that the reorientational dynamics will couple to that of the rigid cores of the smectic layers.
5002 The Journal of Physical Chemistry, Vol. 88, No. 21, 1984 Meirovitch and Freed
i .60
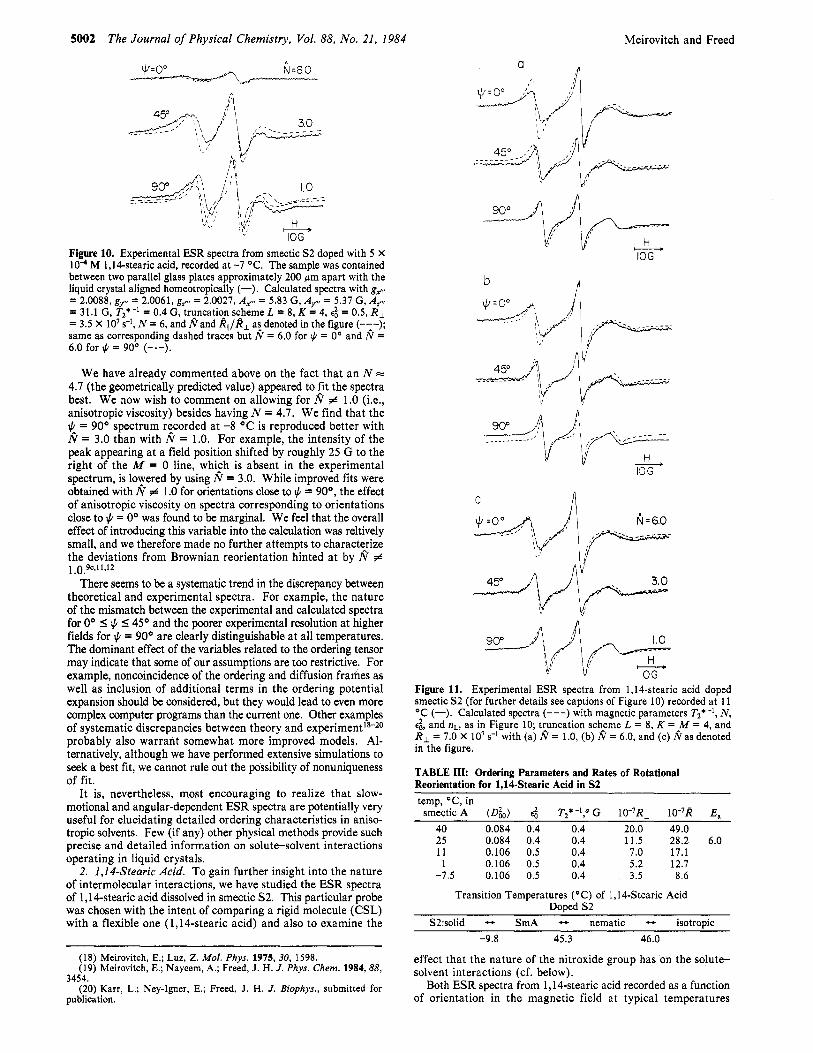
Figure 10. Experimental ESR spectra from smectic S2 doped with 5 X lo4 M 1,lCstearic acid, recorded at -7 "C. The sample was contained between two parallel glass plates approximately 200 pm apart with the liquid crystal aligned homeotropically (-). Calculated spectra with gytt
= 31.1 G, T2*-' = 0.4 G, truncation scheme L = 8, K = 4, ea = 0.5, R, = 3.5 X lo7 s-', N = 6, and I? and All/AL a! denoted in the figure (-:-); same as corresponding dashed traces but N = 6.0 for # = 0" and N = 6.0 for $ = 90" (-.-).
= 2.0088, g y = 2.0061, gp = 2.0027, A p = 5.83 G, A,w = 5.37 G, Aft,
We have already commented above on the fact that an N = 4.7 (the geometrically predicted value) appeared to fit the spectra best. We now wish to comment on allowing for N # 1.0 (Le., anisotropic viscosity) besides having N = 4.7. We find that the J , = 90" spectrum recorded at -8 O C is reproduced better with
= 3.0 than with N = 1.0. For example, the intensity of the peak appearing at a field position shifted by roughly 25 G to the right of the M = 0 line, whilch is absent in the experimental spectrum, is loyered by using N = 3.0. While improved fits were obtained with N # 1 .O for orientations close to J , = 90°, the effect of anisotropic viscosity on spectra corresponding to orientations close to J , = Oo was found to be marginal. We feel that the overall effect of introducing this variable into the calculation was reltively small, and we therefore made no further attempts to characterize the deviations from Brownian reorientation hinted at by N # 1.0~9C,11,12
There seems to be a systematic trend in the discrepancy between theoretical and experimental spectra. For example, the nature of the mismatch between the experimental and calculated spectra for Oo I J , 5 45O and the poorer experimental resolution at higher fields for J , = 90" are clearly distinguishable a t all temperatures. The dominant effect of the variables related to the ordering tensor may indicate that some of our assumptions are too restrictive. For example, noncoincidence of the ordering and diffusion frahes as well as inclusion of additional terms in the ordering potential expansion should be considered, but they would lead to even more complex computer programs than the current one. Other examples of systematic discrepancies between theory and probably also warrant somewhat more improved models. Al- ternatively, although we have performed extensive simulations to seek a best fit, we cannot rule out the possibility of nonuniqueness of fit.
It is, nevertheless, most encouraging to realize that slow- motional and angular-dependent ESR spectra are potentially very useful for elucidating detailed ordering characteristics in aniso- tropic solvents. Few (if any) other physical methods provide such precise and detailed information on solute-solvent interactions operating in liquid crystals.
2. 1,14-Stearic Acid. To gain further insight into the nature of intermolecular interactions, we have studied the ESR spectra of 1,lCstearic acid dissolved in smectic S2. This particular probe was chosen with the intent of comparing a rigid molecule (CSL) with a flexible one (1,14-stearic acid) and also to examine the
(18) Meirovitch, E.; Luz, 2. Mol. Phys. 1975, 30, 1598. (19) Meirovitch, E.; Nayeem, A.; Freed, J. H. J . Phys. Chem. 1984, 88,
(20) Karr, L.; Ney-Igner, E.; Freed, J. H. J . Biophys., submitted for 3454.
publication.
n a
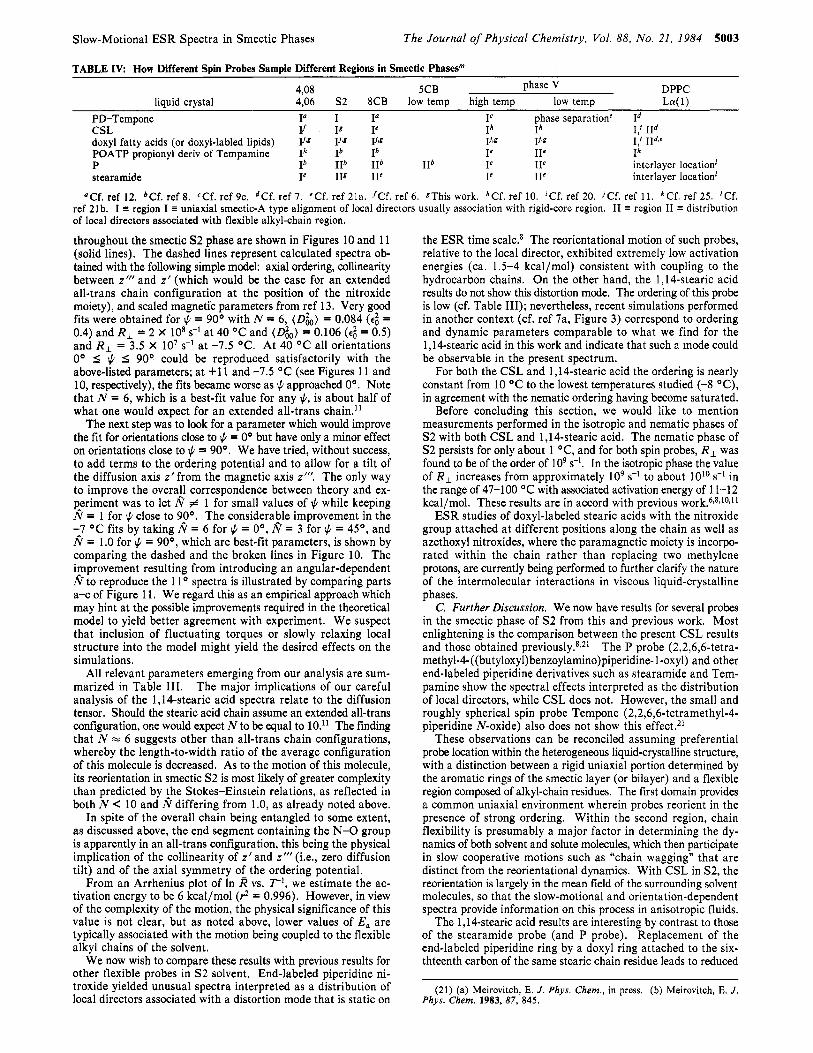
90" - Figure 11. Experimental ESR spectra from 1,14-stearic acid doped smectic S2 (for further details see captions of Figure 10) recorded at 11 "C (-). Calculated spectra (---) with magnetic parameters Tz*-', N, e t , and nL, as in Figure 10; truncation scheme L = 8, K = M = 4, and R, = 7.0 X lo7 s-I with (a) I? = 1.0, (b) I? = 6.0, and (c) I?as denoted in the figure.
TABLE III: Ordering Parameters and Rates of Rotational Reorientation for 1.14-Stearic Acid in 52 temp, "C, in smectic A (D&) e t TZ*-l," G 10-7R, 10-7R E,
40 0.084 0.4 0.4 20.0 49.0 25 0.084 0.4 0.4 11.5 28.2 6.0 11 0.106 0.5 0.4 7.0 17.1 1 0.106 0.5 0.4 5.2 12.7
-7.5 0.106 0.5 0.4 3.5 8.6
Transition Temperatures ("C) of 1,146tearic Acid Doped S2
S2:solid - SmA - nematic - isotroDic -9.8 45.3 46.0
effect that the nature of the nitroxide group has on the solute- solvent interactions (cf. below).
Both ESR spectra from 1,14-stearic acid recorded as a function of orientation in the magnetic field at typical temperatures
Slow-Motional ESR Spectra in Smectic Phases The Journal of Physical Chemistry, Vol. 88, No. 21, 1984 5003
TABLE I V How Different Spin Probes Sample Different Regions in Smectic Phasesm
DPPC phase V 4,08 5CB
PD-Tempone I' I I" I C phase separation' Id liquid crystal 4,06 S2 8CB low temp high temp low temp Lff(1)
CSL If Ig Ie Ih Ih I,' IId doxyl fatty acids (or doxyl-labled lipids) 1j.Z Ij,E Ij.1 I j z 1j.z I,' IId,' POATP propionyl deriv of Tempamine I' Ib Ib IC IIC Ih P Ib IIb IIb IIb Ie IIe interlayer location' stearamide Ie 11s IIC Ie I Ie interlayer location'
"Cf. ref 12. bCf. ref 8. CCf. ref 9c. dCf. ref 7. 'Cf. ref 21a. 'Cf. ref 6 . EThis work. hCf. ref 10. 'Cf. ref 20. 'Cf. ref 1 1 . kCf. ref 25. 'Cf. distribution ref 21b. I
of local directors associated with flexible alkyl-chain region. region I uniaxial smectic-A type alignment of local directors usually association with rigid-core region. I1 region I1
throughout the smectic S2 phase are shown in Figures 10 and 11 (solid lines). The dashed lines represent calculated spectra ob- tained with the following simple model: axial ordering, collinearity between z"' and z' (which would be the case for an extended all-trans chain configuration at the position of the nitroxide moiety), and scaled magnetic parameters from ref 13. Very good fits were obtained for + = 90" with N = 6, ( D h ) = 0.084 ( e t = 0.4) and R , = 2 X lo8 s-l a t 40 "C and (d,) = 0.106 (e; = 0.5) and RI = 3.5 X lo7 s-l a t -7.5 "C. At 40 "C all orientations 0" S + I 90" could be reproduced satisfactorily with the above-listed parameters; a t +11 and -7.5 "C (see Figures 11 and 10, respectively), the fits became worse as + approached 0". Note that N = 6, which is a best-fit value for any +, is about half of what one would expect for an extended all-trans chain."
The next step was to look for a parameter which would improve the fit for orientations close to + = 0" but have only a minor effect on orientations close to J. = 90". We have tried, without success, to add terms to the ordering potential and to allow for a tilt of the diffusion axis z' from the magnetic axis z"'. The only way to improve the overa!l correspondence between theory and ex- periment was to let N # 1 for small values of + while keeping 8 = I for + close to 9,O". The considerable improvement in the -7 "C fits by taking N = 6 for + = O", 8 = 3 for + = 45", and 8 = 1.0 for + = 90°, which are best-fit parameters, is shown by comparing the dashed and the broken lines in Figure 10. The ipprovement resulting from introducing an angular-dependent N to reproduce the 1 1 " spectra is illustrated by comparing parts a-c of Figure 1 1. We regard this as an empirical approach which may hint at the possible improvements required in the theoretical model to yield better agreement with experiment. We suspect that inclusion of fluctuating torques or slowly relaxing local structure into the model might yield the desired effects on the simulations.
All relevant parameters emerging from our analysis are sum- marized in Table 111. The major implications of our careful analysis of the 1,lCstearic acid spectra relate to the diffusion tensor. Should the stearic acid chain assume an extended all-trans configuration, one would expect N to be equal to 10." The finding that N = 6 suggests other than all-trans chain configurations, whereby the length-to-width ratio of the average configuration of this molecule is decreased. As to the motion of this molecule, its reorientation in smectic S2 is most likely of greater complexity than predicted by the Stokes-Einstein relations, as reflected in both N < 10 and N differing from 1.0, as already noted above.
In spite of the overall chain being entangled to some extent, as discussed above, the end segment containing the N - 0 group is apparently in an all-trans configuration, this being the physical implication of the collinearity of z' and z'" (i.e., zero diffusion tilt) and of the axial symmetry of the ordering potential.
From an Arrhenius plot of In R vs. TI, we estimate the ac- tivation energy to be 6 kcal/mol (9 = 0.996). However, in view of the complexity of the motion, the physical significance of this value is not clear, but as noted above, lower values of E, are typically associated with the motion being coupled to the flexible alkyl chains of the solvent.
We now wish to compare these results with previous results for other flexible probes in S2 solvent. End-labeled piperidine ni- troxide yielded unusual spectra interpreted as a distribution of local directors associated with a distortion mode that is static on
the ESR time scale.8 The reorientational motion of such probes, relative to the local director, exhibited extremely low activation energies (ca. 1.5-4 kcal/mol) consistent with coupling to the hydrocarbon chains. On the other hand, the 1,14-stearic acid results do not show this distortion mode. The ordering of this probe is low (cf. Table 111); nevertheless, recent simulations performed in another context (cf. ref 7a, Figure 3) correspond to ordering and dynamic parameters comparable to what we find for the l,l4-stearic acid in this work and indicate that such a mode could be observable in the present spectrum.
For both the CSL and 1,lCstearic acid the ordering is nearly constant from 10 "C to the lowest temperatures studied (-8 "C), in agreement with the nematic ordering having become saturated.
Before concluding this section, we would like to mention measurements performed in the isotropic and nematic phases of S2 with both CSL and 1,14-stearic acid. The nematic phase of S2 persists for only about 1 "C, and for both spin probes, R , was found to be of the order of lo9 s-l. In the isotropic phase the value of R , increases from approximately lo9 s-l to about 1Olo s-l in the range of 47-100 "C with associated activation energy of 11-12 kcal/mol. These results are in accord with previous work.6,8*10s11
ESR studies of doxyl-labeled stearic acids with the nitroxide group attached at different positions along the chain as well as azethoxyl nitroxides, where the paramagnetic moiety is incorpo- rated within the chain rather than replacing two methylene protons, are currently being performed to further clarify the nature of the intermolecular interactions in viscous liquid-crystalline phases.
C. Further Discussion. We now have results for several probes in the smectic phase of S2 from this and previous work. Most enlightening is the comparison between the present CSL results and those obtained previously.8,21 The P probe (2,2,6,6-tetra- methyl-4-((butyloxyl)benzoylamino)piperidine- 1 -0xyl) and other end-labeled piperidine derivatives such as stearamide and Tem- pamine show the spectral effects interpreted as the distribution of local directors, while CSL does not. However, the small and roughly spherical spin probe Tempone (2,2,6,6-tetramethyl-4- piperidine N-oxide) also does not show this effect.21
These observations can be reconciled assuming preferential probe location within the heterogeneous liquid-crystalline structure, with a distinction between a rigid uniaxial portion determined by the aromatic rings of the smectic layer (or bilayer) and a flexible region composed of alkyl-chain residues. The first domain provides a common uniaxial environment wherein probes reorient in the presence of strong ordering. Within the second region, chain flexibility is presumably a major factor in determining the dy- namics of both solvent and solute molecules, which then participate in slow cooperative motions such as "chain wagging" that are distinct from the reorientational dynamics. With CSL in S2, the reorientation is largely in the mean field of the surrounding solvent molecules, so that the slow-motional and orientation-dependent spectra provide information on this process in anisotropic fluids.
The 1,14-stearic acid results are interesting by contrast to those of the stearamide probe (and P probe). Replacement of the end-labeled piperidine ring by a doxyl ring attached to the six- thteenth carbon of the same stearic chain residue leads to reduced
(21) (a) Meirovitch, E. J . Phys. Chem., in press. (b) Meirovitch, E. J . Phys. Chem. 1983.87, 845.
5004 J. Phys. Chem. 1984,88, 5004-5008
mean ordering in the smectic phase of S2 and also to an apparent loss of coupling to the postulated cooperative chain-distortion mode.
We summarize in Table IV the different ways that the different probes appear to behave in various smectic phases.
V. Conclusions We are able to describe the motion of CSL and the 1,lCstearic
acid segment containing the nitroxide moiety in the smectic A phase of S2 mainly in terms of reorientation in a mean potential, in contrast to some other probes exhibiting unusual patterns, presumably due to the existence of cooperative chain distortion modes that are slow on the ESR time scale. Such differences are attributed to the different regions of the smectic layer reported on by the various probes, a feature that suggests the unique value of such studies.
We have shown that the simulations of the slow-motional and orientation-dependent ESR spectra of CSL in S2 are very sensitive to the detailed form of the mean orienting potential, and this permitted its fairly complete estimation from the slow-motional spectra.
The results on 1,14-stearic acid showed features that related to its average chain conformation and to deviations from a model of simple reorientation in a mean potential.
This work and recent related studies illustrate the great wealth of both equilibrium and dynamic information which is, in principle, contained in slow-motional ESR spectra in oriented fluids. This warrants further development of theoretical models to compare with experimental results as well as development of newer ex-
perimental techniques to more effectively abstract out the static and dynamic information inherent in these spectra. As but a few examples, we mention in the former context ( 1 ) inclusion of better models of molecular reorientation that include localized cooper- ativityi6 and (2) inclusion of the effects of internal vs. overall reorientationZ2 as well as (3) allowing for the possibility of non- coincidence of principal molecular axes of ordering and of dif- fusion. In the latter context we mention the use of spin echo methods for accurately determining relaxation even in the presence of considerable inhomogeneous b r ~ a d e n i n g , ~ ~ , ~ ~ especially the development of new two-dimensional electron spin echo methods.24 Finally, efficient nonlinear least-squares methods designed to seek out the optimum ordering and dynamic parameters (six in the present CSL study and three in the 1,14 stearic acid study) need to be developed.26
Acknowledgment. This work was supported by NSF Solid State Grant No. 81-02047, by NIH Grant No. GM-25862, and by the Charles Revson Foundation.
Registry No. CSL, 18353-76-9; S2, 83488-72-6; 1,14-stearic acid, 61443-66- 1.
(22) Campbell, R. F.; Meirovitch, E.; Freed, J . H. J. Phys. Chem. 1979, 83, 525.
(23) Stillman, A. E.; Schwartz, L. J.; Freed, J. H. J . Chem. Phys. 1980, 73, 3502. Schwartz, L. J.; Stillman, A. E.; Freed, J. H. J . Chem. Phys. 1982, 77, 5410.
(24) Millhauser, G. L.; Freed, J. H. J . Chem. Phys. 1984, 81, 37. (25) Broido, M. S.; Meirovitch, E. J . Phys. Chem. 1982, 86, 4197. (26) Moro, G.; Nayeem, A.; Freed, J. H., unpublished work.
Localized Electrons in Crystalline 1 ,(i-Hexanediol and 1,8-0ctanediol Studied by Absorption Spectroscopy at 4.2 and 77 K
Masaaki Ogasawara,* Ola Claesson, Hiroshi Yoshida,
Faculty of Engineering, Hokkaido University, Sapporo 060, Japan
and Anders Lund
The Studsvik Science Research Laboratory, S-611 82 Nykoping, Sweden (Received: February 23, 1984)
In a steady-state study of the optical absorption spectrum of localized electrons in y-irradiated crystalline 1,6-hexanediol and l&octanediol, infrared absorption bands with A,,, at ca. 1300 and ca. 1000 nm, respectively, have been found at 4.2 K, in addition to the visible absorption band of the localized electron which is comprised of two or three partially resolved peaks. The effects of temperature, photobleaching, and sample preparation method have been investigated. The results altogether indicate that electrons are localized at two distinctly different trapping sites, shallow and deep.
Introduction Since the pioneering work by Bardsley et aL,l several organic
crystalline compounds in which localized electrons are produced by ionizing radiation have been known. By use of ESR and ENDOR spectroscopy, irradiated single crystals of some carbo- hydrates have been studied extensively and the geometrical structures of the trapping sites for electrons in several sugars have become ~ l e a r . ~ . ~ Yet there are only a limited number of reports
(1) Bardsley, J.; Baugh, P. J.; Phillips, G. 0. J . Chem. SOC., Chem. Com- mun. 1972, 24, 1335.
(2) (a) Box, H. C.; Budzinski, E. E.; Freund, H. G. J . Chem. Phys. 1978, 69, 1309. (b) Box, H. C.; Budzinski, E. E.; Freund, H. G.; Potter, W. R. J. Chem. Phys. 1979, 70, 1320. (c) Budzinski, E. E.; Potter, W. R.; Potienko, G.; Box, H. C. J . Chem. Phys. 1979, 70, 5040. (d) Budzinksi, E.; Potter, W. R.; Box, H. C. J . Chem. Phys. 1980, 72, 972.
0022-3654/84/2088-5004$01 SO10
on the optical absorption spectrum of the localized electrons in organic crystalline mat rice^^-^ and details of the energy levels and potential depth of the electrons remain unknown. Since the trapping sites for electrons in crystalline matrices must be better defined than those in amorphous matrices, a sharper and more complicated absorption spectrum had been expected. Actually observed spectra so far were, however, characterized by a very
(3) (a) Samskog, P.-0.; Kispert, L. D.; Lund, A. J . Chem. Phys. 1983, 78, 5790. (b) Samskog, P.-0.; Kispert, L. D.; Lund, A. J. Chem. Phys. 1983,79, 635.
(4) Samskog, P.-0.; Lund, A,; Nilsson, G.; Symons, M. C. R. J . Chem. Phys. 1980, 73, 4862.
(5) Buxton, G. V.; Salmon, G. A. Chem. Phys. Lett. 1980, 73, 304. (6) Samskog, P.-0.; Lund, A,; Nilsson, G. Chem. Phys. Lett. 1981, 79,447. (7) Ichikawa, T.; Yoshida, H. Radiat. Phys. Chem. 1978, 1 1 , 173.
0 1984 American Chemical Society