Embed Size (px)
Citation preview

Annual Meeting
of Shareholders
Q3 Financial Highlights 2017
Annual Meeting
of Shareholders
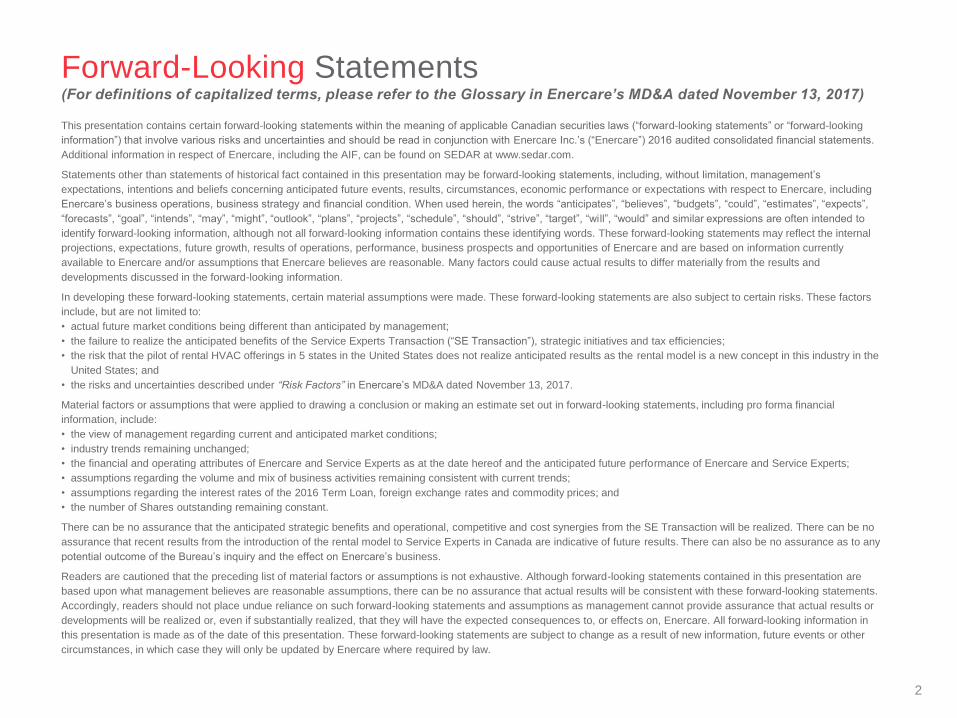
Forward-Looking Statements (For definitions of capitalized terms, please refer to the Glossary in Enercare’s MD&A dated November 13, 2017)
This presentation contains certain forward-looking statements within the meaning of applicable Canadian securities laws (“forward-looking statements” or “forward-looking
information”) that involve various risks and uncertainties and should be read in conjunction with Enercare Inc.’s (“Enercare”) 2016 audited consolidated financial statements.
Additional information in respect of Enercare, including the AIF, can be found on SEDAR at www.sedar.com.
Statements other than statements of historical fact contained in this presentation may be forward-looking statements, including, without limitation, management’s
expectations, intentions and beliefs concerning anticipated future events, results, circumstances, economic performance or expectations with respect to Enercare, including
Enercare’s business operations, business strategy and financial condition. When used herein, the words “anticipates”, “believes”, “budgets”, “could”, “estimates”, “expects”,
“forecasts”, “goal”, “intends”, “may”, “might”, “outlook”, “plans”, “projects”, “schedule”, “should”, “strive”, “target”, “will”, “would” and similar expressions are often intended to
identify forward-looking information, although not all forward-looking information contains these identifying words. These forward-looking statements may reflect the internal
projections, expectations, future growth, results of operations, performance, business prospects and opportunities of Enercare and are based on information currently
available to Enercare and/or assumptions that Enercare believes are reasonable. Many factors could cause actual results to differ materially from the results and
developments discussed in the forward-looking information.
In developing these forward-looking statements, certain material assumptions were made. These forward-looking statements are also subject to certain risks. These factors
include, but are not limited to:
• actual future market conditions being different than anticipated by management;
• the failure to realize the anticipated benefits of the Service Experts Transaction (“SE Transaction”), strategic initiatives and tax efficiencies;
• the risk that the pilot of rental HVAC offerings in 5 states in the United States does not realize anticipated results as the rental model is a new concept in this industry in the
United States; and
• the risks and uncertainties described under “Risk Factors” in Enercare’s MD&A dated November 13, 2017.
Material factors or assumptions that were applied to drawing a conclusion or making an estimate set out in forward-looking statements, including pro forma financial
information, include:
• the view of management regarding current and anticipated market conditions;
• industry trends remaining unchanged;
• the financial and operating attributes of Enercare and Service Experts as at the date hereof and the anticipated future performance of Enercare and Service Experts;
• assumptions regarding the volume and mix of business activities remaining consistent with current trends;
• assumptions regarding the interest rates of the 2016 Term Loan, foreign exchange rates and commodity prices; and
• the number of Shares outstanding remaining constant.
There can be no assurance that the anticipated strategic benefits and operational, competitive and cost synergies from the SE Transaction will be realized. There can be no
assurance that recent results from the introduction of the rental model to Service Experts in Canada are indicative of future results. There can also be no assurance as to any
potential outcome of the Bureau’s inquiry and the effect on Enercare’s business.
Readers are cautioned that the preceding list of material factors or assumptions is not exhaustive. Although forward-looking statements contained in this presentation are
based upon what management believes are reasonable assumptions, there can be no assurance that actual results will be consistent with these forward-looking statements.
Accordingly, readers should not place undue reliance on such forward-looking statements and assumptions as management cannot provide assurance that actual results or
developments will be realized or, even if substantially realized, that they will have the expected consequences to, or effects on, Enercare. All forward-looking information in
this presentation is made as of the date of this presentation. These forward-looking statements are subject to change as a result of new information, future events or other
circumstances, in which case they will only be updated by Enercare where required by law.
2

Annual Meeting
of Shareholders
JOHN MACDONALD President & CEO
Annual Meeting
of Shareholders
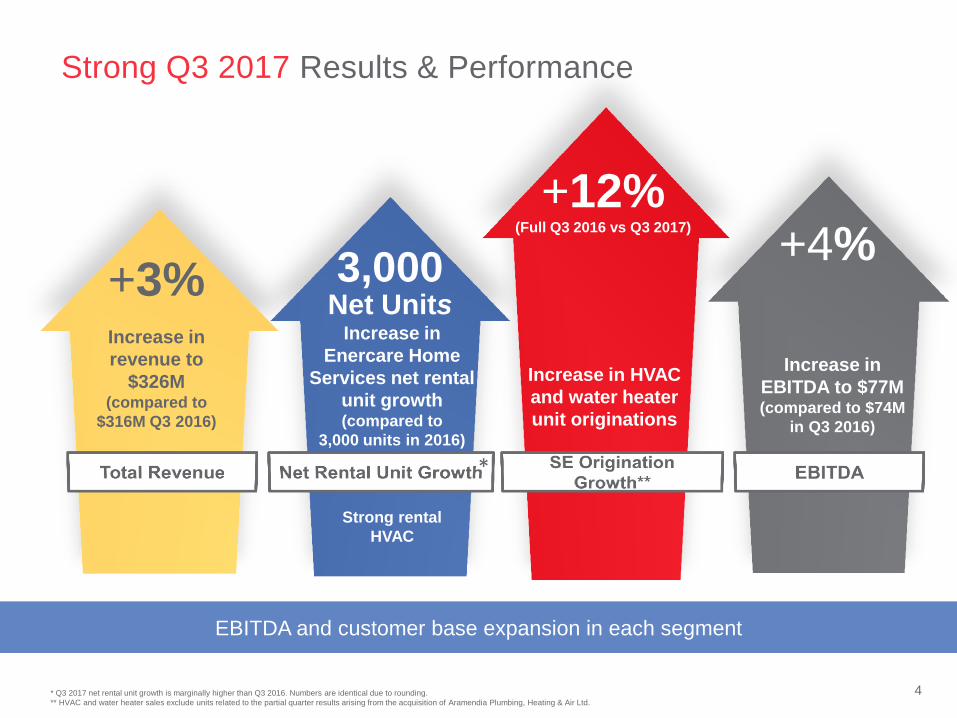
Strong Q3 2017 Results & Performance
Increase in
revenue to
$326M (compared to
$316M Q3 2016)
+3% 3,000 Net Units
+12% (Full Q3 2016 vs Q3 2017)
+4%
Increase in
Enercare Home
Services net rental
unit growth (compared to
3,000 units in 2016)
Increase in
EBITDA to $77M (compared to $74M
in Q3 2016)
Increase in HVAC
and water heater
unit originations
EBITDA and customer base expansion in each segment
Strong rental
HVAC
4
*
* Q3 2017 net rental unit growth is marginally higher than Q3 2016. Numbers are identical due to rounding.
** HVAC and water heater sales exclude units related to the partial quarter results arising from the acquisition of Aramendia Plumbing, Heating & Air Ltd.
Annual Meeting
of Shareholders
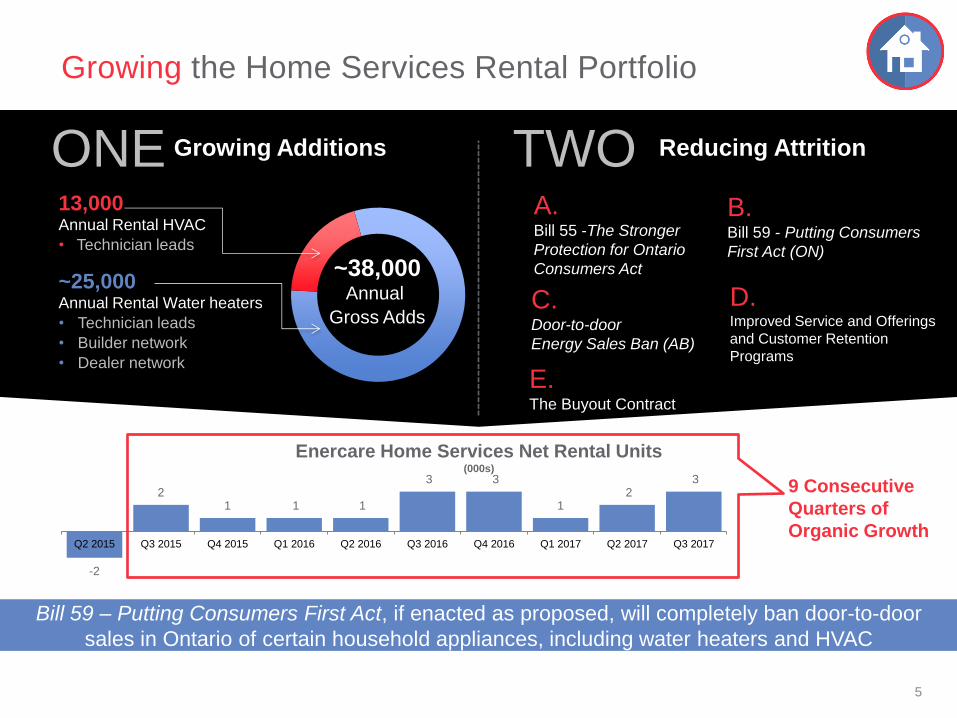
-2
2 1 1 1
3 3
1 2
3
Q2 2015 Q3 2015 Q4 2015 Q1 2016 Q2 2016 Q3 2016 Q4 2016 Q1 2017 Q2 2017 Q3 2017
Bill 59 – Putting Consumers First Act, if enacted as proposed, will completely ban door-to-door
sales in Ontario of certain household appliances, including water heaters and HVAC
9 Consecutive
Quarters of
Organic Growth
Enercare Home Services Net Rental Units (000s)
Growing the Home Services Rental Portfolio
13,000 Annual Rental HVAC
• Technician leads
~38,000 Annual
Gross Adds
ONE Growing Additions TWO Reducing Attrition
A. Bill 55 -The Stronger
Protection for Ontario
Consumers Act
C. Door-to-door
Energy Sales Ban (AB)
B. Bill 59 - Putting Consumers
First Act (ON)
~25,000 Annual Rental Water heaters
• Technician leads
• Builder network
• Dealer network
5
D. Improved Service and Offerings
and Customer Retention
Programs
E. The Buyout Contract
Annual Meeting
of Shareholders
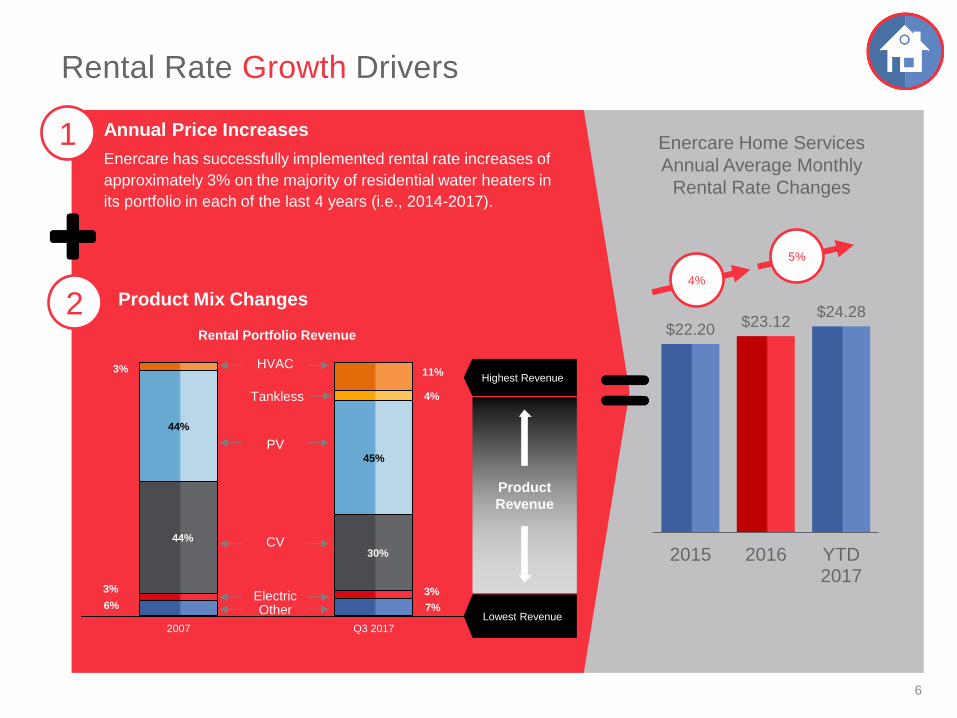
Rental Rate Growth Drivers
$22.20 $23.12
$24.28
2015 2016 YTD2017
5%
Enercare Home Services
Annual Average Monthly
Rental Rate Changes
6% 7%
3% 3%
44%
30%
44%
45%
4%
3% 11%
2007 Q3 2017
HVAC
PV
CV
Electric Other
Tankless
Highest Revenue
Lowest Revenue
Rental Portfolio Revenue
Annual Price Increases
Enercare has successfully implemented rental rate increases of
approximately 3% on the majority of residential water heaters in
its portfolio in each of the last 4 years (i.e., 2014-2017).
Product Mix Changes
1
2
6
Product
Revenue
4%
5%
Annual Meeting
of Shareholders
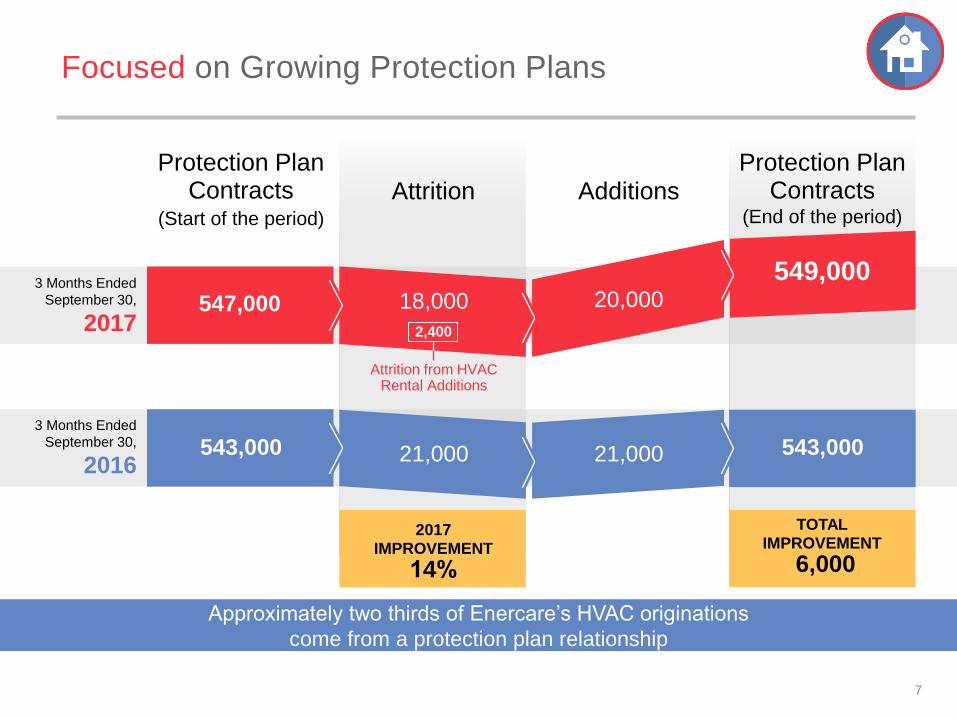
3 Months Ended
September 30,
2016
7
Approximately two thirds of Enercare’s HVAC originations
come from a protection plan relationship
3 Months Ended
September 30,
2017
Protection Plan Contracts
(Start of the period)
Attrition Additions Protection Plan
Contracts (End of the period)
18,000
2,400
Attrition from HVAC Rental Additions
21,000 21,000
20,000
549,000
543,000
2017
IMPROVEMENT
14%
TOTAL IMPROVEMENT
6,000
547,000
543,000
Focused on Growing Protection Plans
Annual Meeting
of Shareholders
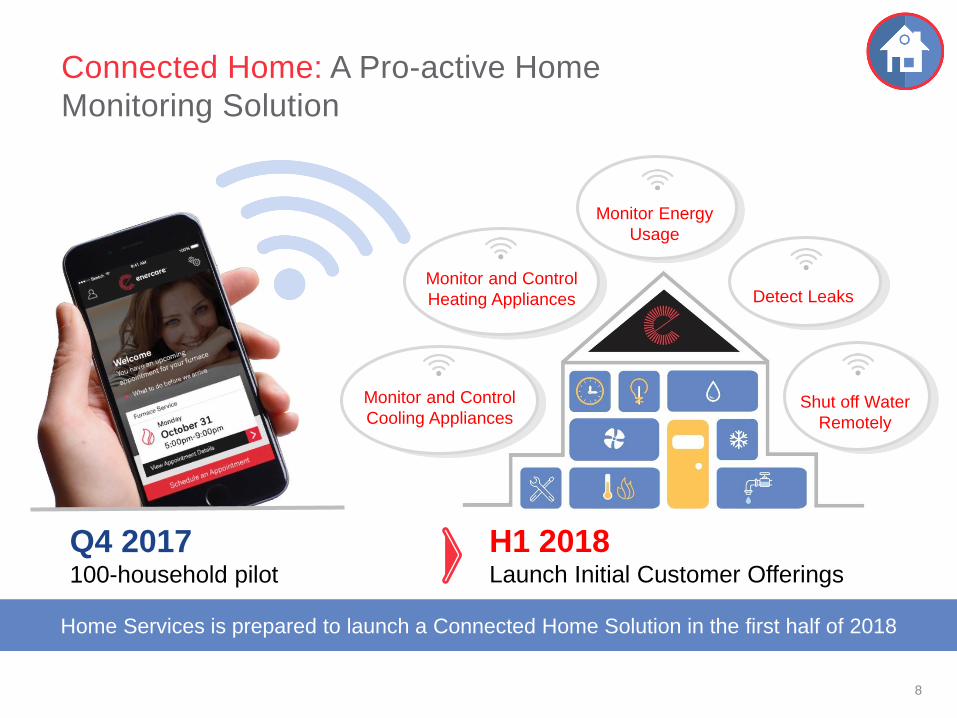
Connected Home: A Pro-active Home
Monitoring Solution
Q4 2017 100-household pilot
H1 2018 Launch Initial Customer Offerings
8
Home Services is prepared to launch a Connected Home Solution in the first half of 2018
21,000
Monitor and Control
Heating Appliances
Monitor and Control
Cooling Appliances
Monitor Energy
Usage
Detect Leaks
Shut off Water
Remotely
Annual Meeting
of Shareholders
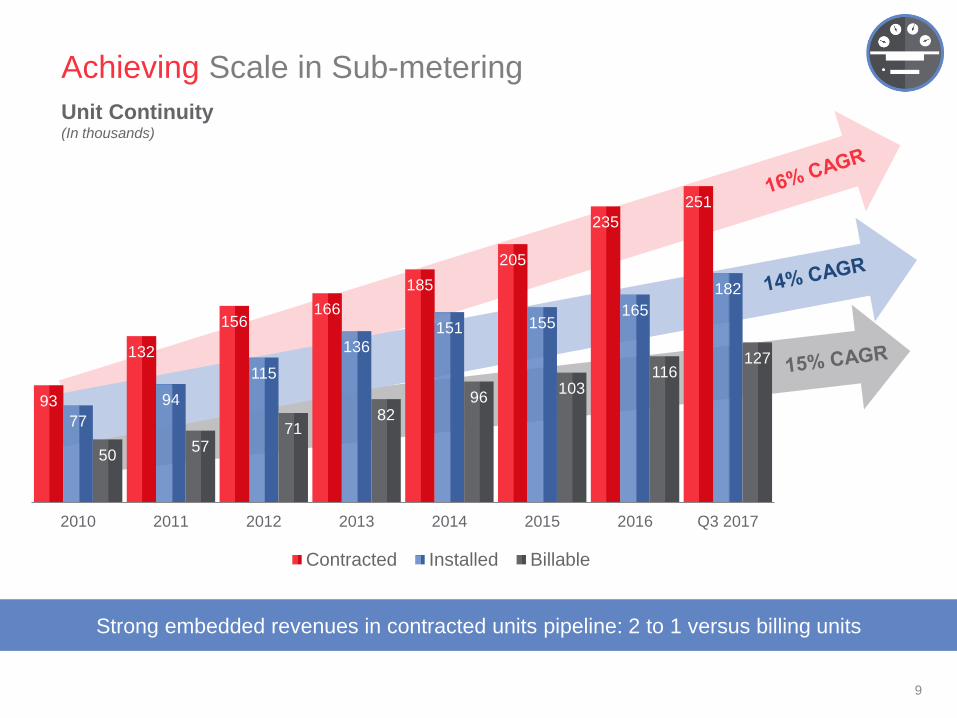
Unit Continuity (In thousands)
Strong embedded revenues in contracted units pipeline: 2 to 1 versus billing units
Achieving Scale in Sub-metering
9
93
132
156 166
185
205
235
251
77
94
115
136
151 155 165
182
50 57
71 82
96 103
116 127
2010 2011 2012 2013 2014 2015 2016 Q3 2017
Contracted Installed Billable
Annual Meeting
of Shareholders
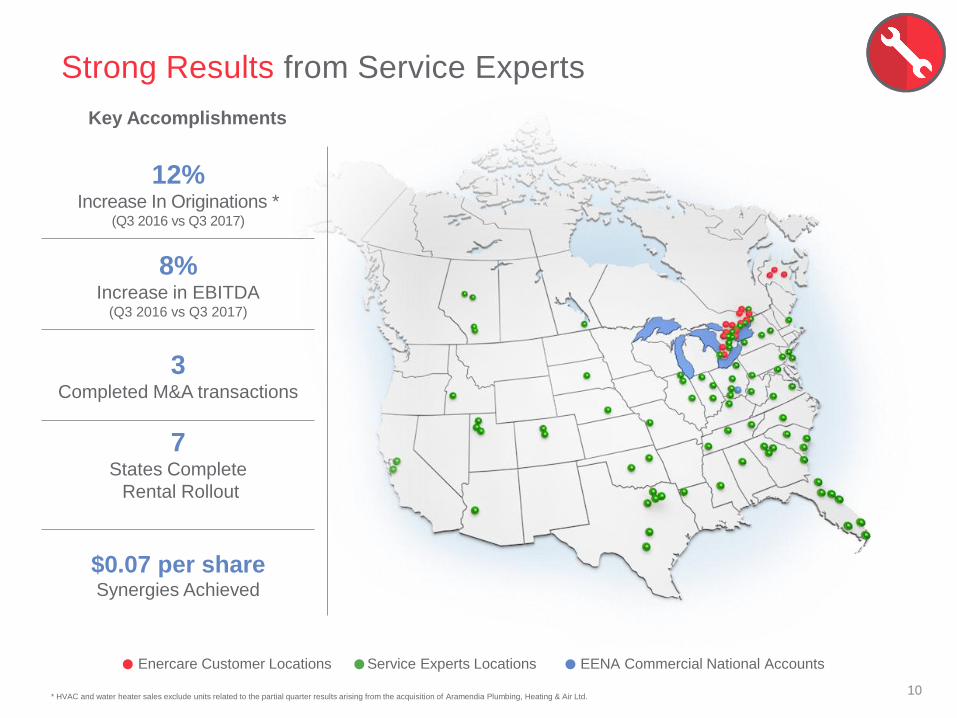
Key Accomplishments
10
Strong Results from Service Experts
12% Increase In Originations *
(Q3 2016 vs Q3 2017)
8% Increase in EBITDA
(Q3 2016 vs Q3 2017)
3 Completed M&A transactions
7 States Complete
Rental Rollout
$0.07 per share Synergies Achieved
Enercare Customer Locations Service Experts Locations EENA Commercial National Accounts
* HVAC and water heater sales exclude units related to the partial quarter results arising from the acquisition of Aramendia Plumbing, Heating & Air Ltd.
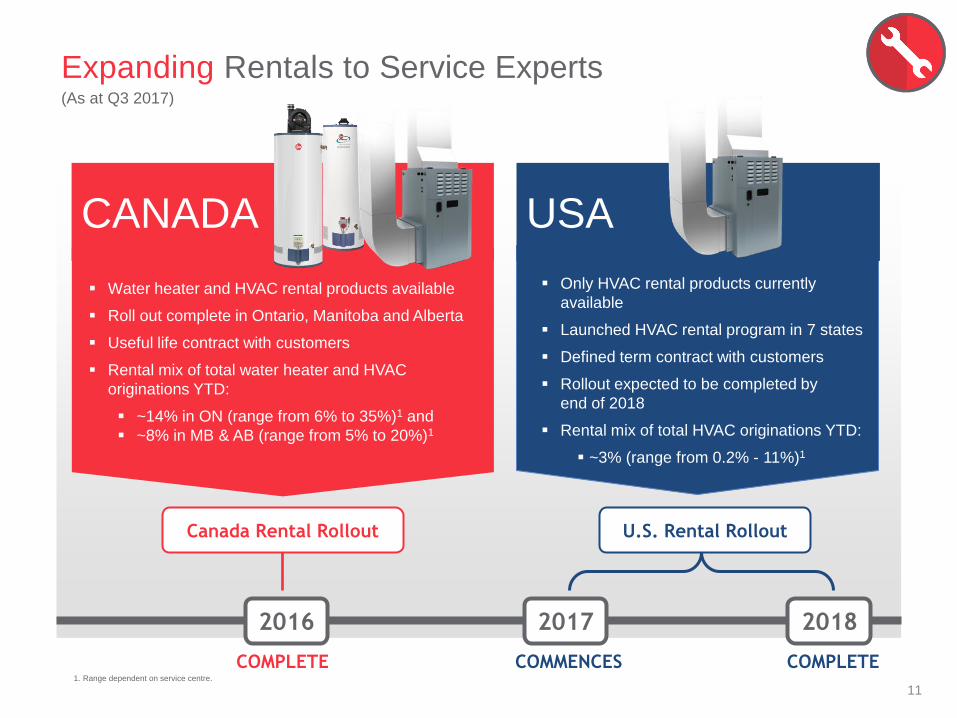
Expanding Rentals to Service Experts
Water heater and HVAC rental products available
Roll out complete in Ontario, Manitoba and Alberta
Useful life contract with customers
Rental mix of total water heater and HVAC
originations YTD:
~14% in ON (range from 6% to 35%)1 and
~8% in MB & AB (range from 5% to 20%)1
Only HVAC rental products currently
available
Launched HVAC rental program in 7 states
Defined term contract with customers
Rollout expected to be completed by
end of 2018
Rental mix of total HVAC originations YTD:
~3% (range from 0.2% - 11%)1
2016 2017 2018
COMMENCES COMPLETE COMPLETE
U.S. Rental Rollout Canada Rental Rollout
CANADA USA
11
(As at Q3 2017)
1. Range dependent on service centre.
Annual Meeting
of Shareholders
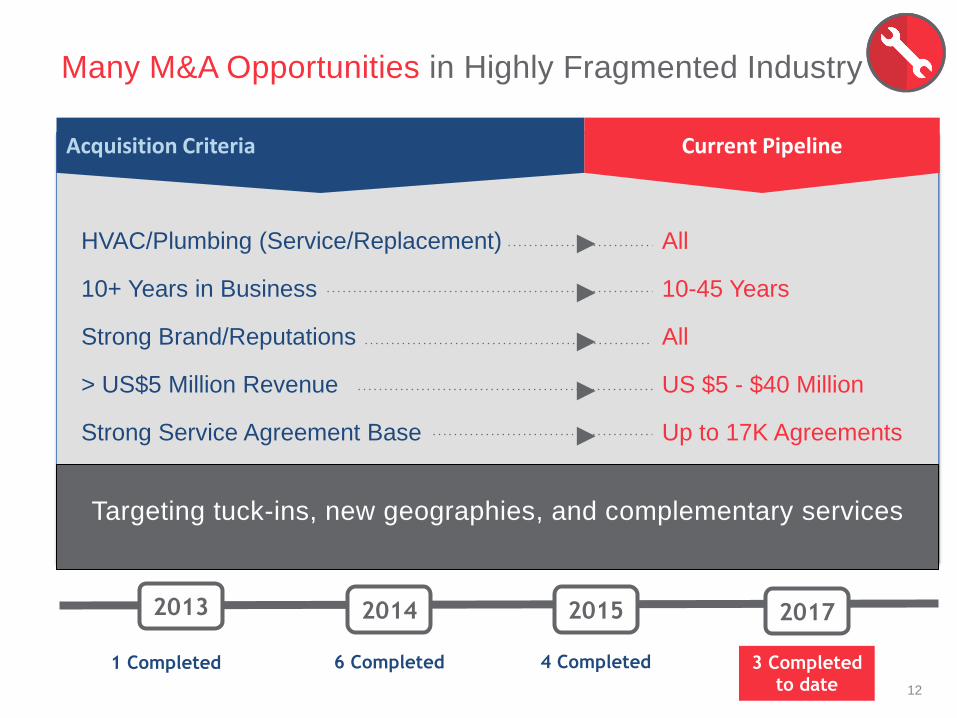
Many M&A Opportunities in Highly Fragmented Industry
Targeting tuck-ins, new geographies, and complementary services
HVAC/Plumbing (Service/Replacement)
10+ Years in Business
Strong Brand/Reputations
> US$5 Million Revenue
Strong Service Agreement Base
All
10-45 Years
All
US $5 - $40 Million
Up to 17K Agreements
Acquisition Criteria Current Pipeline
12
2013 2014 2015
6 Completed 4 Completed 1 Completed
2017
3 Completed to date
2018
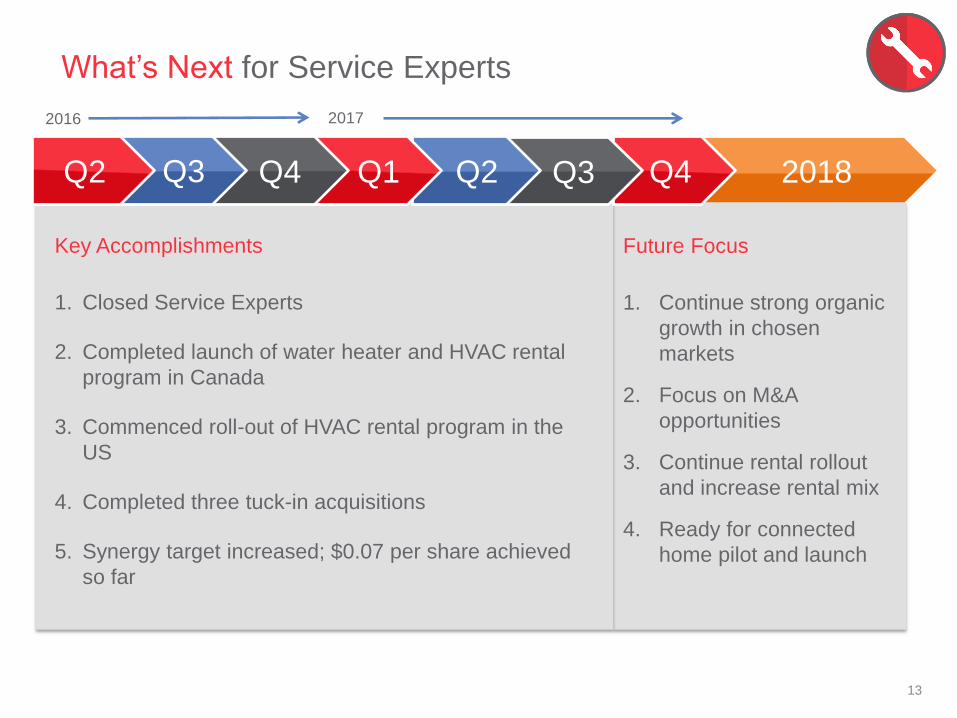
What’s Next for Service Experts
Key Accomplishments
1. Closed Service Experts
2. Completed launch of water heater and HVAC rental
program in Canada
3. Commenced roll-out of HVAC rental program in the
US
4. Completed three tuck-in acquisitions
5. Synergy target increased; $0.07 per share achieved
so far
Future Focus
1. Continue strong organic
growth in chosen
markets
2. Focus on M&A
opportunities
3. Continue rental rollout
and increase rental mix
4. Ready for connected
home pilot and launch
2016 2017
13
Q4 Q3 Q2 Q1 Q4 Q3 Q2

Annual Meeting
of Shareholders
EVELYN SUTHERLAND CFO
Annual Meeting
of Shareholders
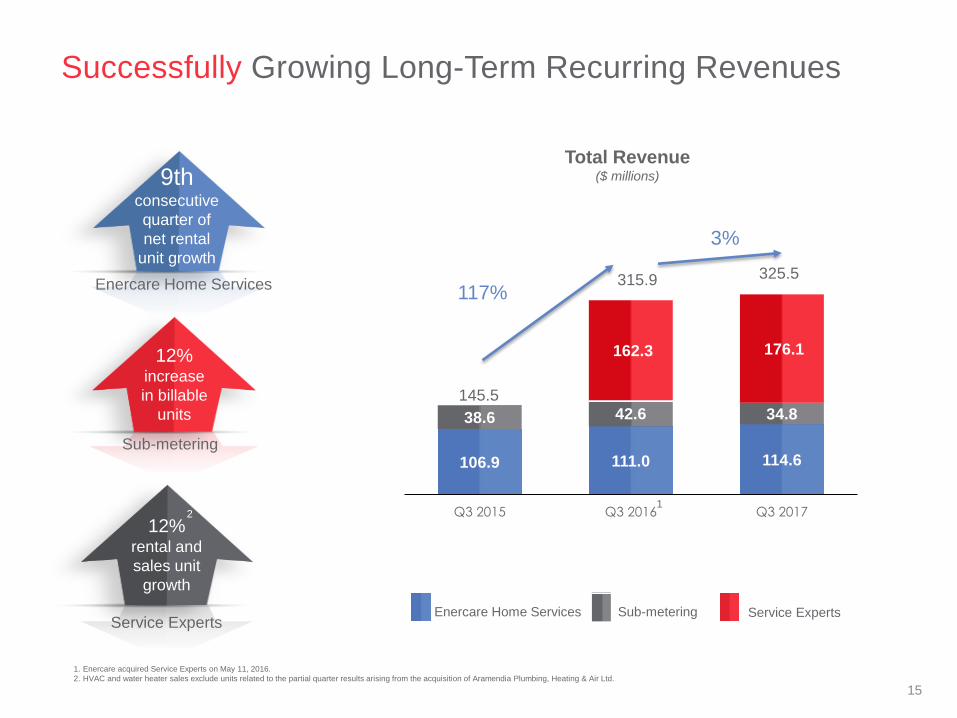
Total Revenue
($ millions)
106.9 111.0 114.6
38.6 42.6 34.8
162.3 176.1
Q3 2015 Q3 2016 Q3 2017
Enercare Home Services Sub-metering
3%
Service Experts Service Experts
Enercare Home Services
9th consecutive
quarter of
net rental
unit growth
Sub-metering
12%
rental and
sales unit
growth
12%
increase
in billable
units
Successfully Growing Long-Term Recurring Revenues
15
325.5 315.9 117%
145.5
1. Enercare acquired Service Experts on May 11, 2016.
2. HVAC and water heater sales exclude units related to the partial quarter results arising from the acquisition of Aramendia Plumbing, Heating & Air Ltd.
1 2
Annual Meeting
of Shareholders
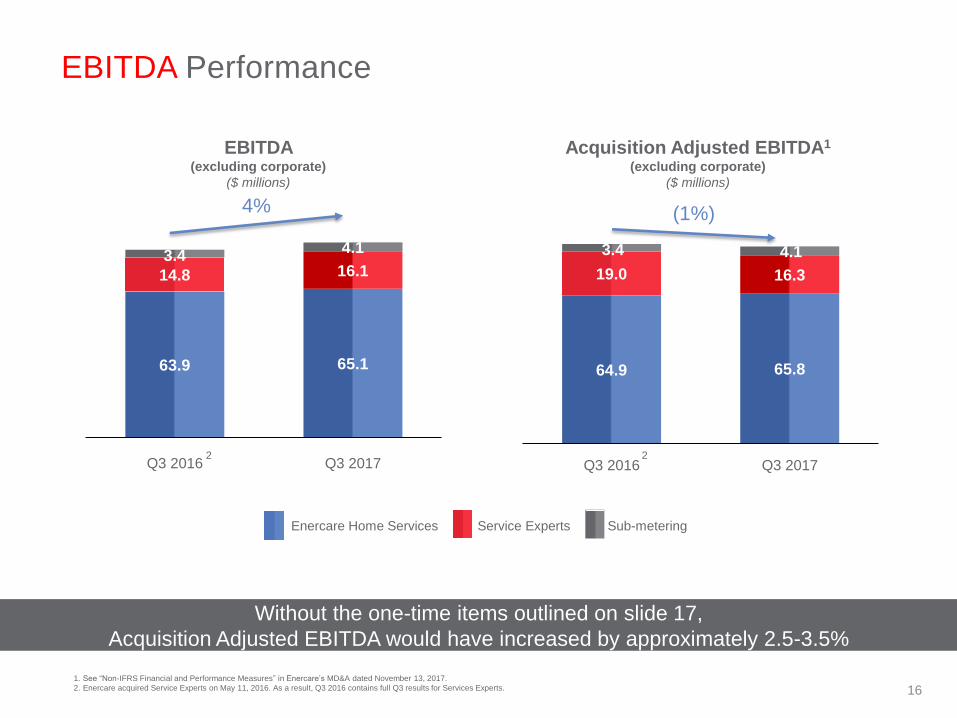
EBITDA Performance
Enercare Home Services Sub-metering Service Experts
EBITDA (excluding corporate)
($ millions)
1. See “Non-IFRS Financial and Performance Measures” in Enercare’s MD&A dated November 13, 2017.
2. Enercare acquired Service Experts on May 11, 2016. As a result, Q3 2016 contains full Q3 results for Services Experts.
63.9 65.1
14.8 16.1 3.4
4.1
Q3 2016 Q3 2017
4%
Acquisition Adjusted EBITDA1 (excluding corporate)
($ millions)
64.9 65.8
19.0 16.3
3.4 4.1
Q3 2016 Q3 20172
(1%)
Without the one-time items outlined on slide 17,
Acquisition Adjusted EBITDA would have increased by approximately 2.5-3.5%
16
2
Annual Meeting
of Shareholders
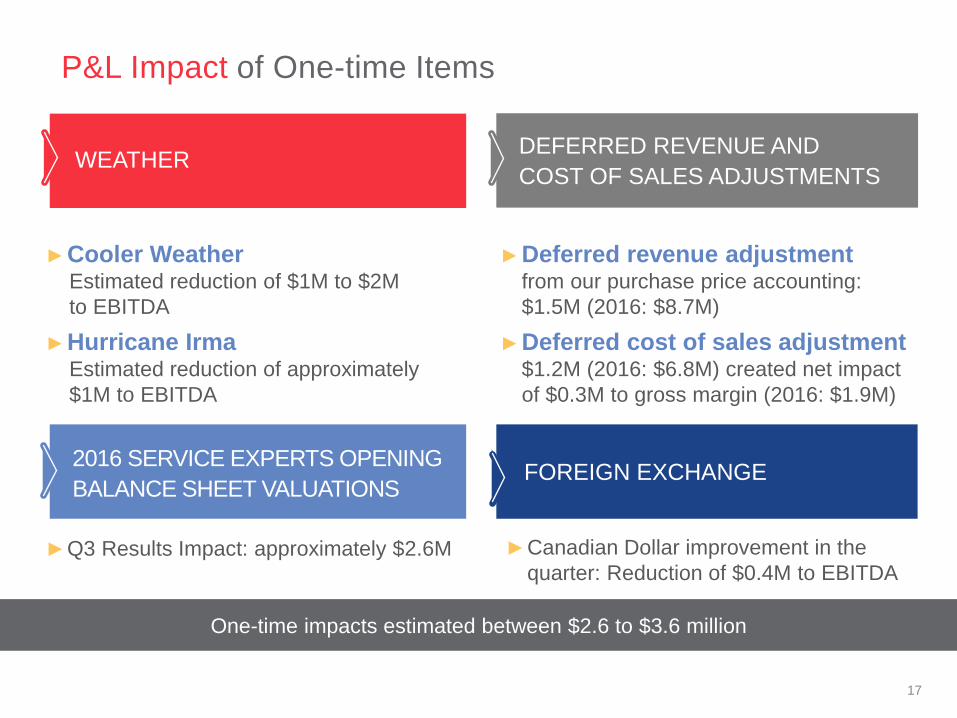
WEATHER
21,000 543,000
P&L Impact of One-time Items
DEFERRED REVENUE AND
COST OF SALES ADJUSTMENTS
2016 SERVICE EXPERTS OPENING
BALANCE SHEET VALUATIONS FOREIGN EXCHANGE
►Cooler Weather Estimated reduction of $1M to $2M
to EBITDA
►Hurricane Irma Estimated reduction of approximately
$1M to EBITDA
►Deferred revenue adjustment from our purchase price accounting:
$1.5M (2016: $8.7M)
►Deferred cost of sales adjustment $1.2M (2016: $6.8M) created net impact
of $0.3M to gross margin (2016: $1.9M)
►Q3 Results Impact: approximately $2.6M ►Canadian Dollar improvement in the
quarter: Reduction of $0.4M to EBITDA
17
One-time impacts estimated between $2.6 to $3.6 million
Annual Meeting
of Shareholders
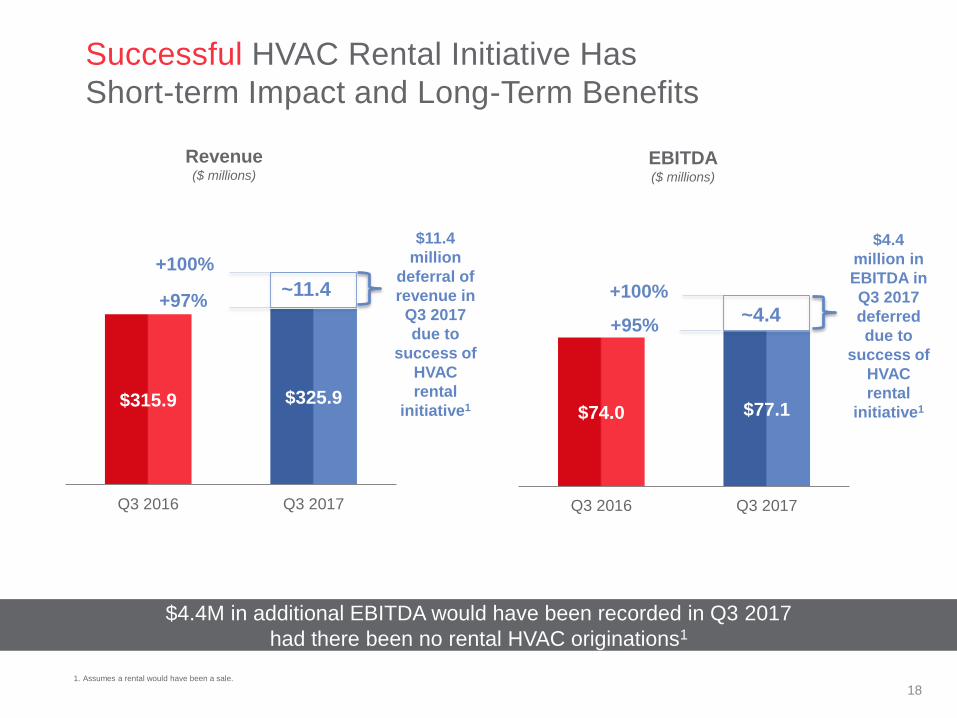
$315.9 $325.9
Q3 2016 Q3 2017
$4.4M in additional EBITDA would have been recorded in Q3 2017
had there been no rental HVAC originations1
Revenue ($ millions)
+97%
+100%
$11.4
million
deferral of
revenue in
Q3 2017
due to
success of
HVAC
rental
initiative1
Successful HVAC Rental Initiative Has
Short-term Impact and Long-Term Benefits
1. Assumes a rental would have been a sale.
18
$74.0 $77.1
Q3 2016 Q3 2017
EBITDA ($ millions)
+95%
+100%
$4.4
million in
EBITDA in
Q3 2017
deferred
due to
success of
HVAC
rental
initiative1
~11.4
~4.4
Annual Meeting
of Shareholders
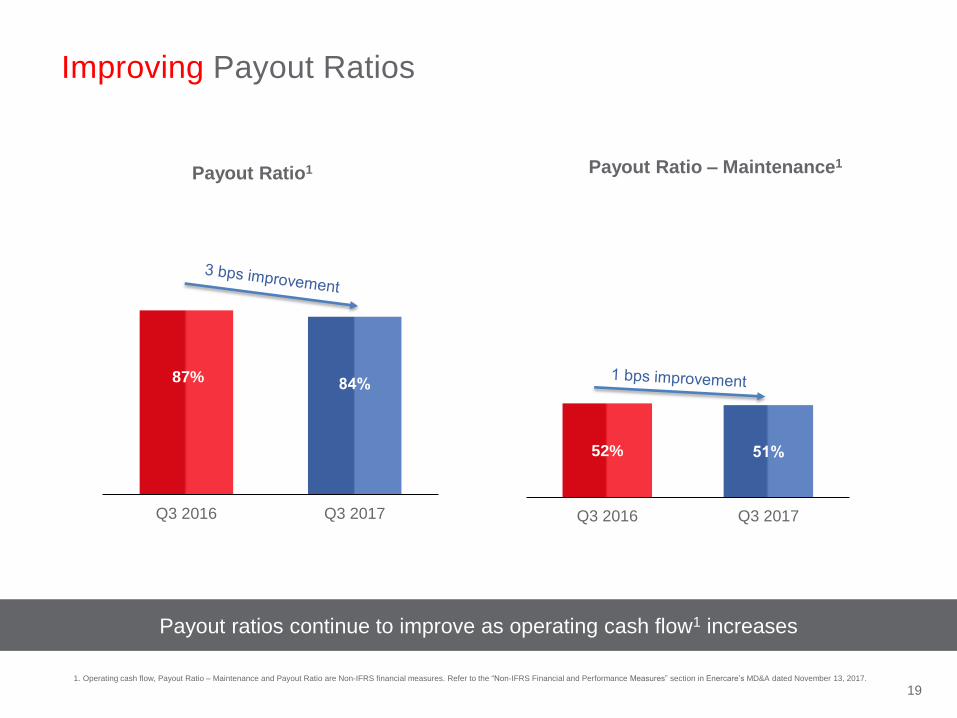
87% 84%
Q3 2016 Q3 2017
52% 51%
Q3 2016 Q3 2017
Payout Ratio1
Payout Ratio – Maintenance1
Improving Payout Ratios
Payout ratios continue to improve as operating cash flow1 increases
19 1. Operating cash flow, Payout Ratio – Maintenance and Payout Ratio are Non-IFRS financial measures. Refer to the “Non-IFRS Financial and Performance Measures” section in Enercare’s MD&A dated November 13, 2017.
Annual Meeting
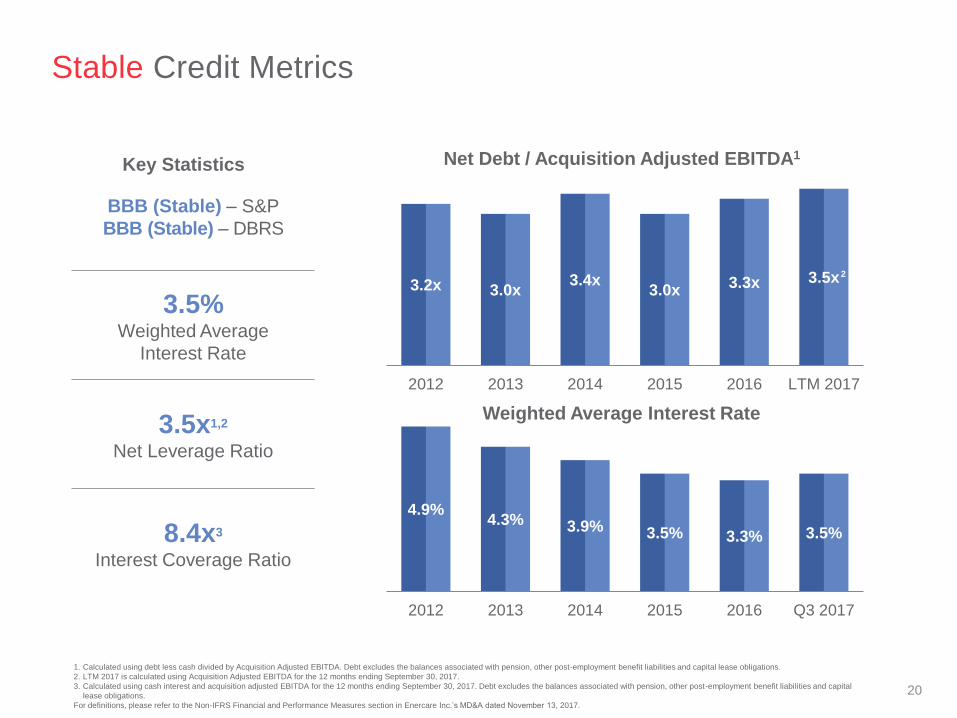
of Shareholders 4.9%
4.3% 3.9% 3.5% 3.3% 3.5%
2012 2013 2014 2015 2016 Q3 2017
Weighted Average Interest Rate
3.2x 3.0x 3.4x
3.0x 3.3x 3.5x
2012 2013 2014 2015 2016 LTM 2017
Stable Credit Metrics
20
Net Debt / Acquisition Adjusted EBITDA1 Key Statistics
BBB (Stable) – S&P
BBB (Stable) – DBRS
3.5%
Weighted Average
Interest Rate
3.5x1,2
Net Leverage Ratio
8.4x3
Interest Coverage Ratio
2
1. Calculated using debt less cash divided by Acquisition Adjusted EBITDA. Debt excludes the balances associated with pension, other post-employment benefit liabilities and capital lease obligations.
2. LTM 2017 is calculated using Acquisition Adjusted EBITDA for the 12 months ending September 30, 2017.
3. Calculated using cash interest and acquisition adjusted EBITDA for the 12 months ending September 30, 2017. Debt excludes the balances associated with pension, other post-employment benefit liabilities and capital
lease obligations.
For definitions, please refer to the Non-IFRS Financial and Performance Measures section in Enercare Inc.’s MD&A dated November 13, 2017.

Annual Meeting
of Shareholders
Q&A
Annual Meeting
of Shareholders
JOHN MACDONALD President & CEO
Annual Meeting
of Shareholders
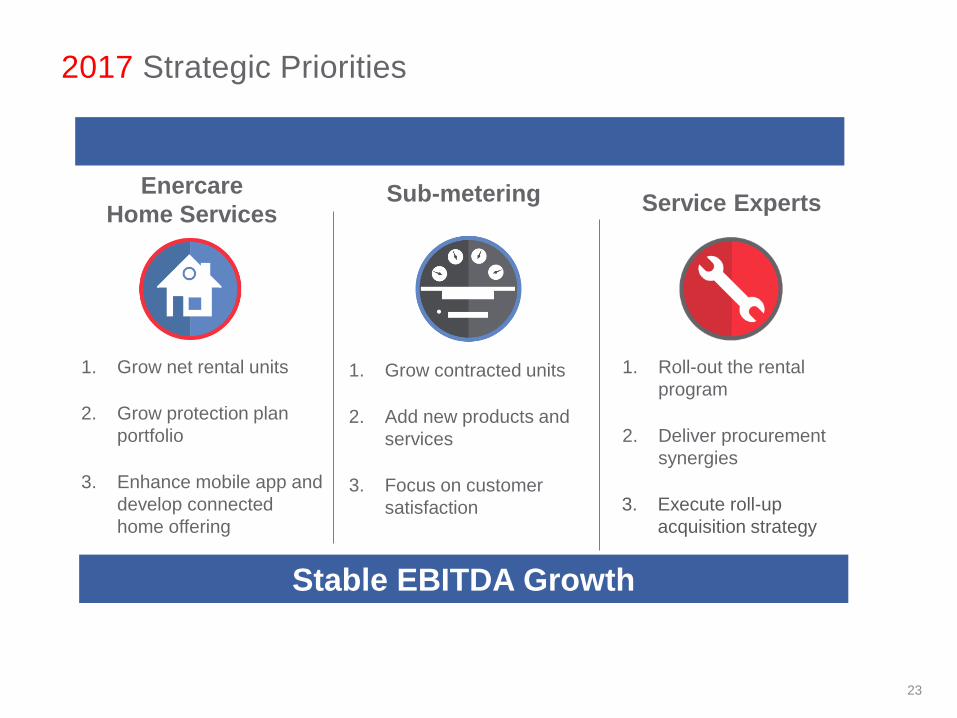
1. Roll-out the rental
program
2. Deliver procurement
synergies
3. Execute roll-up
acquisition strategy
2017 Strategic Priorities
1. Grow net rental units
2. Grow protection plan
portfolio
3. Enhance mobile app and
develop connected
home offering
1. Grow contracted units
2. Add new products and
services
3. Focus on customer
satisfaction
Enercare
Home Services Sub-metering Service Experts
Stable EBITDA Growth
23

Annual Meeting
of Shareholders
Q3 Financial Highlights 2017