Embed Size (px)
Citation preview
STATS IN BRIEF U.S. DEPARTMENT OF EDUCATION MARCH 2015 NCES 2015-165
What Is the Price of College? Total, Net, and Out-of-Pocket Prices by Type of Institution in 2011–12
AUTHORS
David Radwin Christina Chang Wei RTI International
PROJECT OFFICER
Tracy Hunt-White National Center for Education Statistics
Statistics in Brief publications present descriptive data in tabular formats to provide useful information to a broad audience, including members of the general public. They address simple and topical issues and questions. They do not investigate more com-plex hypotheses, account for inter-relationships among variables, or support causal inferences. We encourage readers who are inter-ested in more complex questions and in-depth analysis to explore other NCES resources, including publications, online data tools, and public- and restricted-use datasets. See nces.ed.gov and refer-ences noted in the body of this document for more information.
This report was prepared for the National Center for Education Statistics under Contract No. ED-IES-09-C-0039 with RTI International. Mention of trade names, commercial products, or organizations does not imply endorsement by the U.S. Government.
Americans believe in the value
of a college education but worry about its
price. Recent surveys show large majorities
affirming the importance of postsecond-
ary education but characterizing it as too
expensive and sometimes financially out
of reach (Hart Research Associates 2013;
Lumina Foundation and Gallup 2013;
Taylor et al. 2011). Paying for postsecond-
ary education is an issue likely to affect
most young people and their families
directly at a time when 64 percent of ninth-
graders nationally intend to earn at least
an associate’s degree (calculated from
Ingels et al. 2011, p. 11) and 79 percent of
their parents expect their ninth-graders to
do so (calculated from LoGerfo,
Christopher, and Flanagan 2011, p. 8).
To address these concerns, the Higher
Education Opportunity Act of 2008 re-
quired the U.S. Department of Education
to publish net prices, tuition and fees,
and annual percentage changes in these
values on the College Affordability and
Transparency Center Website and to high-
light the institutions within each sector
with the highest and lowest values. It
also required all colleges and universities
eligible for Title IV federal aid to report
average net prices and to create online
calculators to enable prospective stu-
dents and their families to estimate the
net price of attendance.
2
This Statistics in Brief describes
three measures of the price of under-
graduate education in the 2011–12
academic year: average total price of
attendance (also known as the student
budget), average net price of attend-
ance after grants, and average out-of-
pocket net price. It updates an earlier
study of 2007–08 college prices (Wei
2010) and adds details and context to
more recent publications describing
2011–12 prices (Horn and Paslov
2014b; Paslov and Skomsvold 2014;
Simone et al. 2013) and trends in prices
over time (Ginder and Sykes 2013;
Horn and Paslov 2014a; Snyder and
Dillow 2013, pp. 540–546). The findings
in this report are drawn from data in
the 2011–12 National Postsecondary
Student Aid Study (NPSAS:12), a
nationally representative study of
students enrolled in postsecondary
institutions in the 50 states and the
District of Columbia.1
1 Prior cycles of NPSAS included sampled institutions from Puerto Rico.
NPSAS:12 cov-
ered all institutions participating in
federal financial aid programs author-
ized under Title IV of the Higher
Education Act, which include Pell
Grants, Direct Subsidized and Unsubsi-
dized Loans (also known as Stafford
Loans), Direct PLUS Loans to parents
of dependent undergraduates, and
federal work-study.
Estimates are presented for students
enrolled at four types of postsecondary
institutions: public 2year institutions,
public 4year institutions, private non-
profit 4year institutions, and for-profit
institutions at all levels (less-than-
2year, 2year, and 4year).2
2 To learn more about the types of institutions, go to the online college search tool, College Navigator at http://nces.ed.gov/collegenavigator. Among full-time under-graduates enrolled at for-profit institutions, there is relatively little variation by institution level in average tuition and fees, total price of attendance, or net price of attendance after grants (Ginder and Sykes 2013, tables 1a, 3a, 4a).
These types
of institutions enrolled 89 percent of
full-time, full-year undergraduates in
2011–12: public 2year institutions en-
rolled 20 percent of these students,
public 4year institutions enrolled 39
percent, private nonprofit 4year insti-
tutions enrolled 19 percent, and for-
profit institutions enrolled 11 percent
(table 1). The remaining 11 percent of
undergraduates were enrolled at other
types of institutions or enrolled at
more than one institution.3
3 Skomsvold, Radford, and Berkner (2011) present detailed in-formation on the educational outcomes of first-time students beginning at these types of institutions.
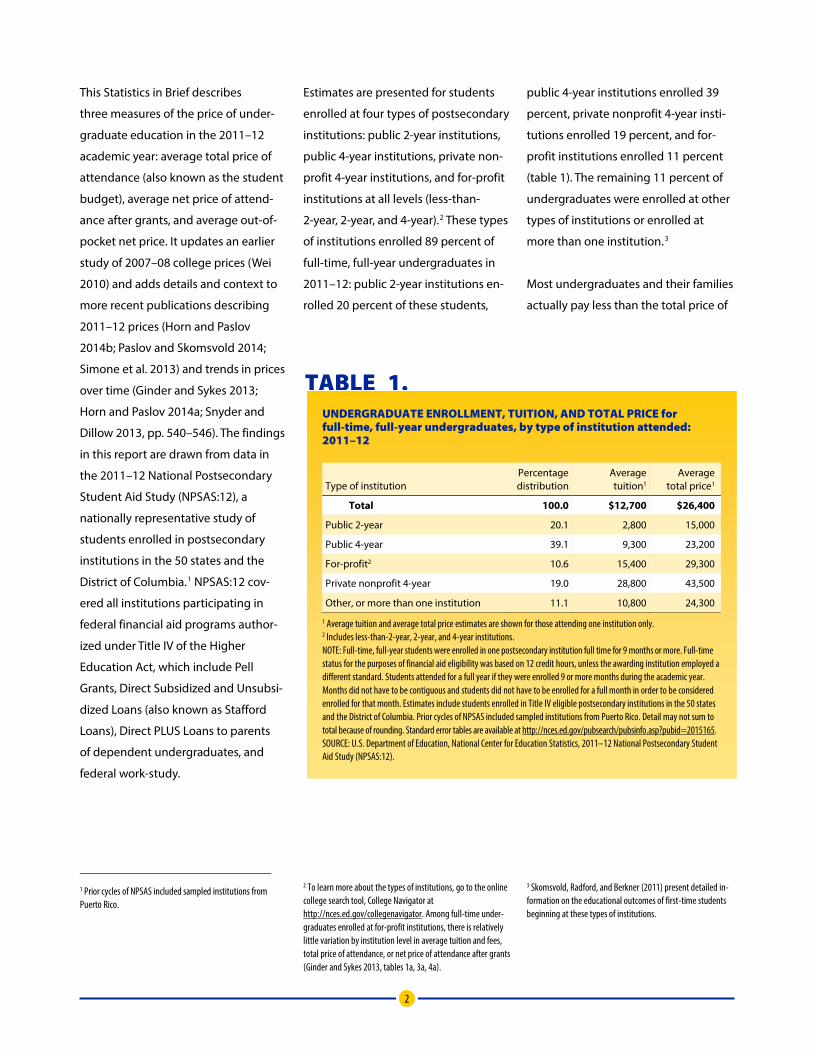
TABLE 1. UNDERGRADUATE ENROLLMENT, TUITION, AND TOTAL PRICE for full-time, full-year undergraduates, by type of institution attended: 2011–12
Type of institution Percentage distribution
Average tuition1
Average total price1
Total 100.0 $12,700 $26,400
Public 2-year 20.1 2,800 15,000
Public 4-year 39.1 9,300 23,200
For-profit2 10.6 15,400 29,300
Private nonprofit 4-year 19.0 28,800 43,500
Other, or more than one institution 11.1 10,800 24,300
1 Average tuition and average total price estimates are shown for those attending one institution only. 2 Includes less-than-2-year, 2-year, and 4-year institutions. NOTE: Full-time, full-year students were enrolled in one postsecondary institution full time for 9 months or more. Full-time status for the purposes of financial aid eligibility was based on 12 credit hours, unless the awarding institution employed a different standard. Students attended for a full year if they were enrolled 9 or more months during the academic year. Months did not have to be contiguous and students did not have to be enrolled for a full month in order to be considered enrolled for that month. Estimates include students enrolled in Title IV eligible postsecondary institutions in the 50 states and the District of Columbia. Prior cycles of NPSAS included sampled institutions from Puerto Rico. Detail may not sum to total because of rounding. Standard error tables are available at http://nces.ed.gov/pubsearch/pubsinfo.asp?pubid=2015165. SOURCE: U.S. Department of Education, National Center for Education Statistics, 2011–12 National Postsecondary Student Aid Study (NPSAS:12).
Most undergraduates and their families
actually pay less than the total price of
3
attendance because students receive
financial aid (Radwin et al. 2013).
Therefore, this Statistics in Brief pre-
sents the average total price of
attendance (tuition and nontuition
expenses); the average net price of
attendance after grants (total price of
attendance minus all grants); and the
average out-of-pocket net price (total
price of attendance minus all aid, in-
cluding loans, work-study, job training
benefits, military tuition aid, and Veter-
ans’ benefits) by type of institution.
STUDY QUESTIONS
1 What are the average
prices paid by full-time
undergraduates at
different types of
institutions?
2 How do the components
of average total and net
prices of attendance vary
by type of institution? 3 How do the net prices
paid by full-time under-
graduates vary by
income?
Full-Time, Full-Year Enrollment All of the statistics presented here
are based on undergraduates who
enrolled full time for the full academic
year (at least 9 months) at a single
institution, referred to as “full time”
throughout the remainder of this
report. Such students face higher av-
erage tuition expenses and average
total price of attendance than stu-
dents who enrolled part time or for
only part of the academic year (Paslov
and Skomsvold 2014, pp. 9, 29). Over-
all, 38 percent of undergraduates
enrolled full time in 2011–12. The pro-
portion of students enrolled full time
varies with type of institution, ranging
from 20 percent at public 2year insti-
tutions to 32 percent at for-profit
institutions, 53 percent at 4year
public institutions, and 63 percent at
private nonprofit 4year institutions
(Skomsvold 2014, p. 26), so restricting
the analyses to these students facili-
tates valid comparisons of prices.
All comparisons of estimates were
tested for statistical significance using
the Student’s t statistic, and all differ-
ences cited are statistically significant
at the p < .05 level.4
4 No adjustments for multiple comparisons were made. The standard errors for the estimates can be found at http://nces.ed.gov/pubsearch/pubsinfo.asp?pubid=2015165.
Comparisons that
are not statistically significant at this
level are characterized as not measur-
ably different.
4
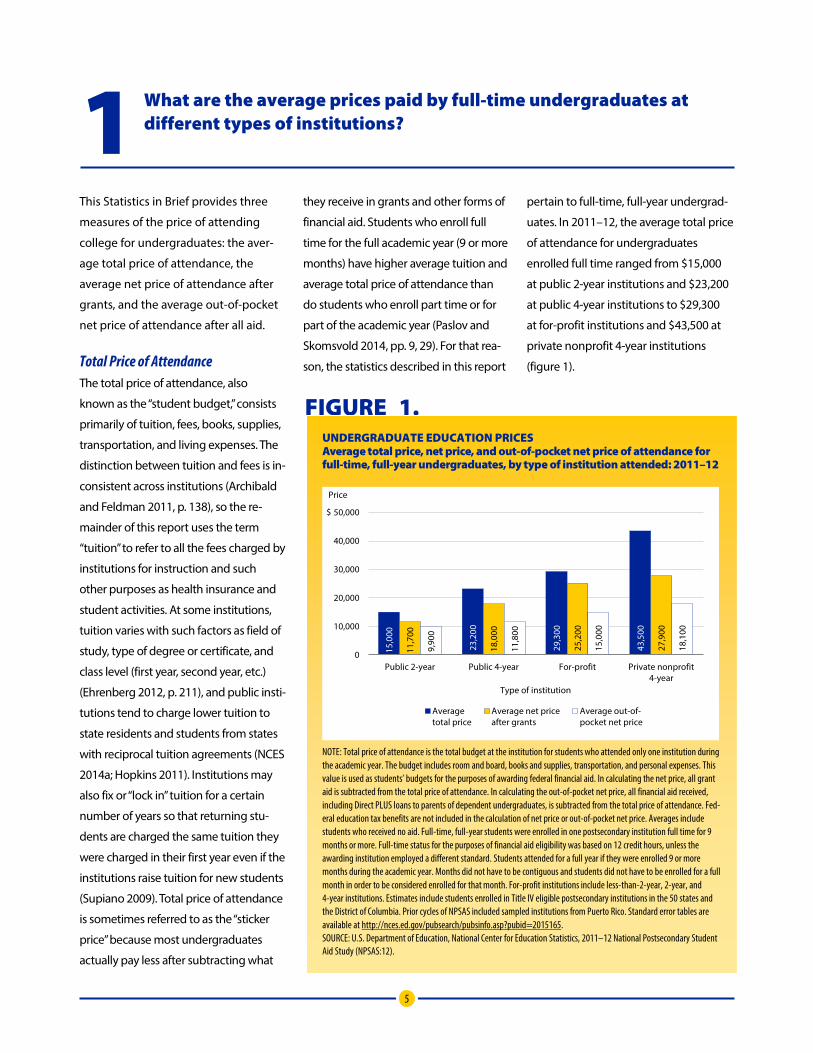
KEY FINDINGS • Among undergraduates who were
enrolled full time, public 2year
students had the lowest average
total price of attendance ($15,000)
(figure 1). The average total price of
attendance was $23,200 at public
4year institutions and $29,300
at for-profit institutions. Undergrad-
uates at private nonprofit 4year
institutions had the highest average
total price of attendance ($43,500).
• Most undergraduates enrolled full
time in 2011–12 received grant aid
from federal, state, institutional, or
private sources (table 2). After
grants were taken into account,
undergraduates’ net price averaged
$11,700 at public 2year institutions,
$18,000 at public 4year institutions,
$25,200 at for-profit institutions,
and $27,900 at private nonprofit
4year institutions (figure 1).
• Many undergraduates also took out
loans, participated in work-study, or
received Veterans’ benefits or other
forms of aid to help pay the immedi-
ate expenses of postsecondary
education (table 2). After accounting
for all financial aid, the average out-
of-pocket net price for full-time
undergraduates was $9,900 at public
2year institutions, $11,800 at public
4year institutions, $15,000 at for-profit
institutions, and $18,100 at private
nonprofit institutions (figure 1).
• Aside from the total price of attend-
ance, two critical factors determine
the allocation of need-based aid:
students’ dependency status and
family income.5 For dependent stu-
dents in most quarters of the
income distribution, public 2year
institutions had the lowest average
net price of attendance, ranging
from $8,300 to $14,000 (figure 5),
and average out-of-pocket net
price, ranging from $7,500 to
$13,100 (figure 6). Independent
students faced the lowest average
net price of attendance at public
2year institutions, ranging from
$11,400 to $14,100 (figure 7), and
the lowest average out-of-pocket
net price at public 2year and
public 4year institutions, ranging
from $8,600 to $13,600 (figure 8).
Dependent and independent
students across the income distri-
bution generally paid the highest
average net price of attendance
and average out-of-pocket net
price at private nonprofit institu-
tions and at for-profit institutions,
with no measurable difference
between the two types of institu-
tions (figures 5–8).
5 Income consists of parents’ income for dependent students. For independent students, it consists of the income of the stu-dent (and spouse if the student is married).
5
1 What are the average prices paid by full-time undergraduates at different types of institutions?
This Statistics in Brief provides three
measures of the price of attending
college for undergraduates: the aver-
age total price of attendance, the
average net price of attendance after
grants, and the average out-of-pocket
net price of attendance after all aid.
Total Price of Attendance The total price of attendance, also
known as the “student budget,” consists
primarily of tuition, fees, books, supplies,
transportation, and living expenses. The
distinction between tuition and fees is in-
consistent across institutions (Archibald
and Feldman 2011, p. 138), so the re-
mainder of this report uses the term
“tuition” to refer to all the fees charged by
institutions for instruction and such
other purposes as health insurance and
student activities. At some institutions,
tuition varies with such factors as field of
study, type of degree or certificate, and
class level (first year, second year, etc.)
(Ehrenberg 2012, p. 211), and public insti-
tutions tend to charge lower tuition to
state residents and students from states
with reciprocal tuition agreements (NCES
2014a; Hopkins 2011). Institutions may
also fix or “lock in” tuition for a certain
number of years so that returning stu-
dents are charged the same tuition they
were charged in their first year even if the
institutions raise tuition for new students
(Supiano 2009). Total price of attendance
is sometimes referred to as the “sticker
price” because most undergraduates
actually pay less after subtracting what
they receive in grants and other forms of
financial aid. Students who enroll full
time for the full academic year (9 or more
months) have higher average tuition and
average total price of attendance than
do students who enroll part time or for
part of the academic year (Paslov and
Skomsvold 2014, pp. 9, 29). For that rea-
son, the statistics described in this report
pertain to full-time, full-year undergrad-
uates. In 2011–12, the average total price
of attendance for undergraduates
enrolled full time ranged from $15,000
at public 2year institutions and $23,200
at public 4year institutions to $29,300
at for-profit institutions and $43,500 at
private nonprofit 4year institutions
(figure 1).
FIGURE 1. UNDERGRADUATE EDUCATION PRICES Average total price, net price, and out-of-pocket net price of attendance for full-time, full-year undergraduates, by type of institution attended: 2011–12
15,0
00
23,2
00
29,3
00
43,5
00
11,7
00
18,0
00
25,2
00
27,9
00
9,90
0
11,8
00
15,0
00
18,1
00
0
10,000
20,000
30,000
40,000
50,000
Public 2-year Public 4-year For-profit Private nonprofit4-year
Price
Type of institution
Averagetotal price
Average net priceafter grants
Average out-of-pocket net price
$
NOTE: Total price of attendance is the total budget at the institution for students who attended only one institution during the academic year. The budget includes room and board, books and supplies, transportation, and personal expenses. This value is used as students’ budgets for the purposes of awarding federal financial aid. In calculating the net price, all grant aid is subtracted from the total price of attendance. In calculating the out-of-pocket net price, all financial aid received, including Direct PLUS loans to parents of dependent undergraduates, is subtracted from the total price of attendance. Fed-eral education tax benefits are not included in the calculation of net price or out-of-pocket net price. Averages include students who received no aid. Full-time, full-year students were enrolled in one postsecondary institution full time for 9 months or more. Full-time status for the purposes of financial aid eligibility was based on 12 credit hours, unless the awarding institution employed a different standard. Students attended for a full year if they were enrolled 9 or more months during the academic year. Months did not have to be contiguous and students did not have to be enrolled for a full month in order to be considered enrolled for that month. For-profit institutions include less-than-2-year, 2-year, and 4-year institutions. Estimates include students enrolled in Title IV eligible postsecondary institutions in the 50 states and the District of Columbia. Prior cycles of NPSAS included sampled institutions from Puerto Rico. Standard error tables are available at http://nces.ed.gov/pubsearch/pubsinfo.asp?pubid=2015165. SOURCE: U.S. Department of Education, National Center for Education Statistics, 2011–12 National Postsecondary Student Aid Study (NPSAS:12).
6
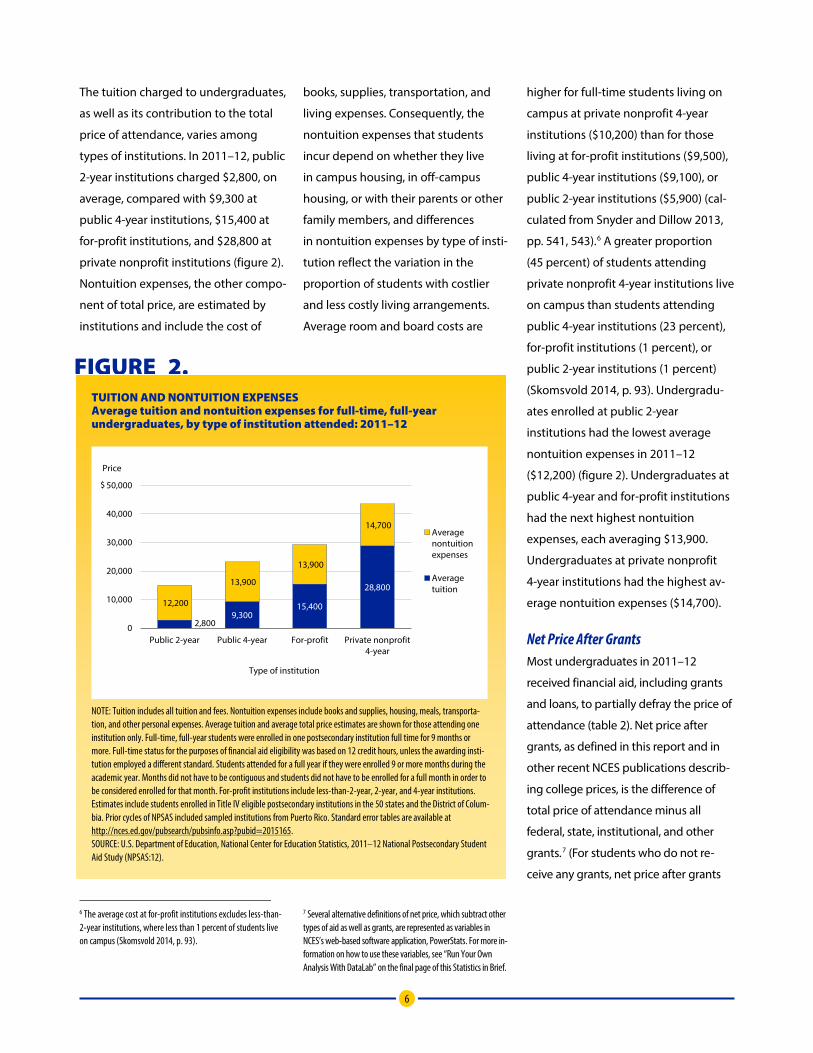
The tuition charged to undergraduates,
as well as its contribution to the total
price of attendance, varies among
types of institutions. In 2011–12, public
2year institutions charged $2,800, on
average, compared with $9,300 at
public 4year institutions, $15,400 at
for-profit institutions, and $28,800 at
private nonprofit institutions (figure 2).
Nontuition expenses, the other compo-
nent of total price, are estimated by
institutions and include the cost of
books, supplies, transportation, and
living expenses. Consequently, the
nontuition expenses that students
incur depend on whether they live
in campus housing, in off-campus
housing, or with their parents or other
family members, and differences
in nontuition expenses by type of insti-
tution reflect the variation in the
proportion of students with costlier
and less costly living arrangements.
Average room and board costs are
higher for full-time students living on
campus at private nonprofit 4year
institutions ($10,200) than for those
living at for-profit institutions ($9,500),
public 4year institutions ($9,100), or
public 2year institutions ($5,900) (cal-
culated from Snyder and Dillow 2013,
pp. 541, 543).6
6 The average cost at for-profit institutions excludes less-than-2-year institutions, where less than 1 percent of students live on campus (Skomsvold 2014, p. 93).
A greater proportion
(45 percent) of students attending
private nonprofit 4year institutions live
on campus than students attending
public 4year institutions (23 percent),
for-profit institutions (1 percent), or
public 2year institutions (1 percent)
(Skomsvold 2014, p. 93). Undergradu-
ates enrolled at public 2year
institutions had the lowest average
nontuition expenses in 2011–12
($12,200) (figure 2). Undergraduates at
public 4year and for-profit institutions
had the next highest nontuition
expenses, each averaging $13,900.
Undergraduates at private nonprofit
4year institutions had the highest av-
erage nontuition expenses ($14,700).
FIGURE 2. TUITION AND NONTUITION EXPENSES Average tuition and nontuition expenses for full-time, full-year undergraduates, by type of institution attended: 2011–12
2,800 9,300
15,400
28,800
12,200
13,900
13,900
14,700
0
10,000
20,000
30,000
40,000
50,000
Public 2-year Public 4-year For-profit Private nonprofit4-year
Price
Type of institution
Averagenontuitionexpenses
Averagetuition
$
NOTE: Tuition includes all tuition and fees. Nontuition expenses include books and supplies, housing, meals, transporta-tion, and other personal expenses. Average tuition and average total price estimates are shown for those attending one institution only. Full-time, full-year students were enrolled in one postsecondary institution full time for 9 months or more. Full-time status for the purposes of financial aid eligibility was based on 12 credit hours, unless the awarding insti-tution employed a different standard. Students attended for a full year if they were enrolled 9 or more months during the academic year. Months did not have to be contiguous and students did not have to be enrolled for a full month in order to be considered enrolled for that month. For-profit institutions include less-than-2-year, 2-year, and 4-year institutions. Estimates include students enrolled in Title IV eligible postsecondary institutions in the 50 states and the District of Colum-bia. Prior cycles of NPSAS included sampled institutions from Puerto Rico. Standard error tables are available at http://nces.ed.gov/pubsearch/pubsinfo.asp?pubid=2015165. SOURCE: U.S. Department of Education, National Center for Education Statistics, 2011–12 National Postsecondary Student Aid Study (NPSAS:12).
Net Price After Grants Most undergraduates in 2011–12
received financial aid, including grants
and loans, to partially defray the price of
attendance (table 2). Net price after
grants, as defined in this report and in
other recent NCES publications describ-
ing college prices, is the difference of
total price of attendance minus all
federal, state, institutional, and other
grants.7
7 Several alternative definitions of net price, which subtract other types of aid as well as grants, are represented as variables in NCES’s web-based software application, PowerStats. For more in-formation on how to use these variables, see “Run Your Own Analysis With DataLab” on the final page of this Statistics in Brief.
(For students who do not re-
ceive any grants, net price after grants
7
equals the total price of attendance
even for students who receive other
types of aid such as loans and work-
study.) In 2011–12, the average net price
after grants for undergraduates enrolled
full time was $11,700 at public 2year
institutions and $18,000 at public 4year
institutions (figure 1). At for-profit insti-
tutions, the average net price after
grants was $25,200. Private nonprofit
4year institutions had the highest aver-
age net price after grants ($27,900).
Out-of-Pocket Net Price Out-of-pocket net price is the total
price of attendance minus grants and
all other types of financial aid, includ-
ing student loans, Direct PLUS Loans
to parents of undergraduate students,
work-study, Veterans’ benefits, and
other aid. Unlike grants, which are typ-
ically awarded without imposing any
further obligations, other aid usually
either must be repaid (in the case of
loans) or must be earned through em-
ployment while enrolled (work-study)
or prior employment (Veterans’ bene-
fits). (Financial aid does not include
federal tax deductions and credits
available to some undergraduates and
their families.)
The out-of-pocket net price does not
include the subsequent costs of re-
paying student loans and is,
therefore, the immediate amount
that students and their families must
pay at the time of attendance.
As with net price after grants, public
2year institutions had the lowest av-
erage out-of-pocket net price for full-
time students ($9,900), followed by
public 4year institutions ($11,800)
(figure 1). The out-of-pocket net price
at for-profit institutions was $15,000,
on average, and it was $18,100 at pri-
vate nonprofit 4year institutions.
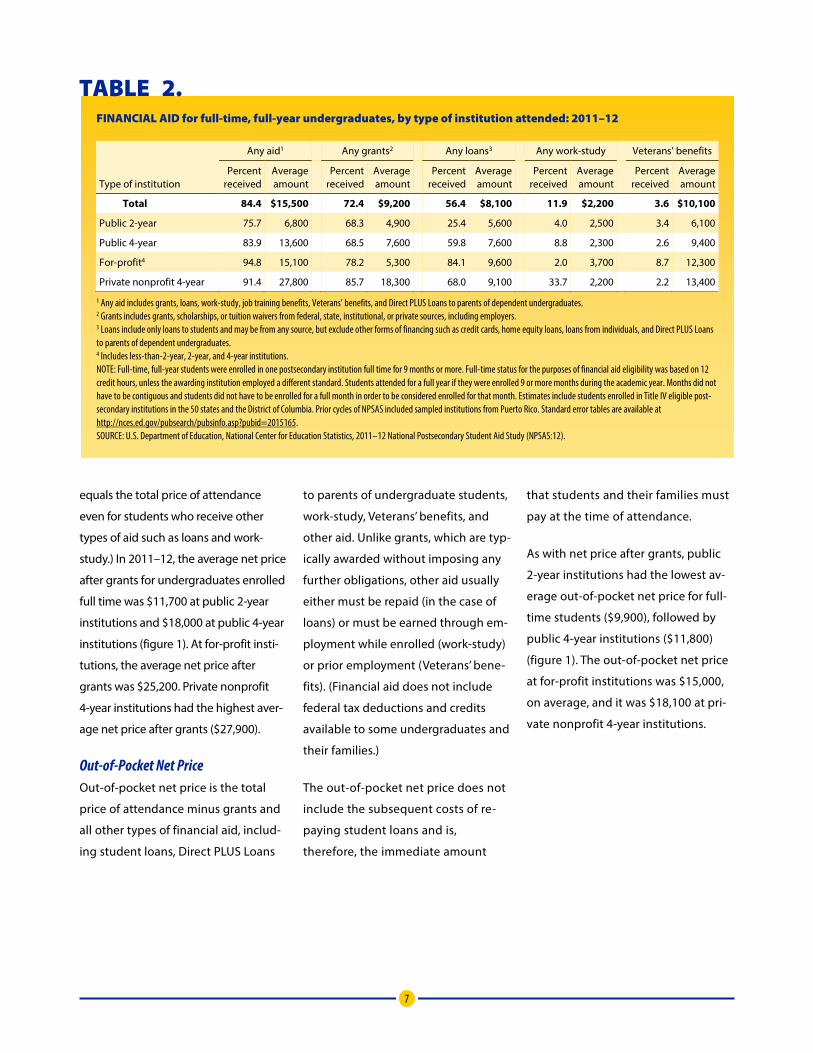
TABLE 2. FINANCIAL AID for full-time, full-year undergraduates, by type of institution attended: 2011–12
Type of institution
Any aid1 Any grants2 Any loans3 Any work-study Veterans’ benefits
Percent received
Average amount
Percent received
Average amount
Percent received
Average amount
Percent received
Average amount
Percent received
Average amount
Total 84.4 $15,500 72.4 $9,200 56.4 $8,100 11.9 $2,200 3.6 $10,100
Public 2-year 75.7 6,800 68.3 4,900 25.4 5,600 4.0 2,500 3.4 6,100
Public 4-year 83.9 13,600 68.5 7,600 59.8 7,600 8.8 2,300 2.6 9,400
For-profit4 94.8 15,100 78.2 5,300 84.1 9,600 2.0 3,700 8.7 12,300
Private nonprofit 4-year 91.4 27,800 85.7 18,300 68.0 9,100 33.7 2,200 2.2 13,400
1 Any aid includes grants, loans, work-study, job training benefits, Veterans’ benefits, and Direct PLUS Loans to parents of dependent undergraduates. 2 Grants includes grants, scholarships, or tuition waivers from federal, state, institutional, or private sources, including employers. 3 Loans include only loans to students and may be from any source, but exclude other forms of financing such as credit cards, home equity loans, loans from individuals, and Direct PLUS Loans to parents of dependent undergraduates. 4 Includes less-than-2-year, 2-year, and 4-year institutions. NOTE: Full-time, full-year students were enrolled in one postsecondary institution full time for 9 months or more. Full-time status for the purposes of financial aid eligibility was based on 12 credit hours, unless the awarding institution employed a different standard. Students attended for a full year if they were enrolled 9 or more months during the academic year. Months did not have to be contiguous and students did not have to be enrolled for a full month in order to be considered enrolled for that month. Estimates include students enrolled in Title IV eligible post-secondary institutions in the 50 states and the District of Columbia. Prior cycles of NPSAS included sampled institutions from Puerto Rico. Standard error tables are available at http://nces.ed.gov/pubsearch/pubsinfo.asp?pubid=2015165. SOURCE: U.S. Department of Education, National Center for Education Statistics, 2011–12 National Postsecondary Student Aid Study (NPSAS:12).
8
2 How do the components of average total and net prices of attendance vary by type of institution?
Differences in the average total price
of attendance reflect variation in both
tuition and such nontuition expenses
as whether students live with their
parents and whether students them-
selves are responsible for dependents.
Differences in the average net price of
attendance after grants and out-of-
pocket net price of attendance roughly
mirror differences in the average total
price of attendance, but they also
reflect the aid packages characteristi-
cally received by students at each
type of institution.
Public 2-Year Institutions In 2011–12, students enrolled full time at
public 2year institutions had the lowest
average total price of attendance
($15,000), average net price of attend-
ance after grants ($11,700), and average
out-of-pocket net price ($9,900), com-
pared with students at all the other types
of institutions discussed in this report
(figure 1). Tuition was lower at public
2year institutions, averaging $2,800,
compared with $9,300 to $28,800 at
other types of institutions (figure 2).
Nontuition expenses, the other compo-
nent of total price of attendance, were
also lowest at public 2year institutions,
averaging $12,200. Public 2year stu-
dents lived with their parents at a
higher rate than other undergraduates
(Skomsvold 2014, p. 93), which may
have been a less expensive option than
living in separate housing.
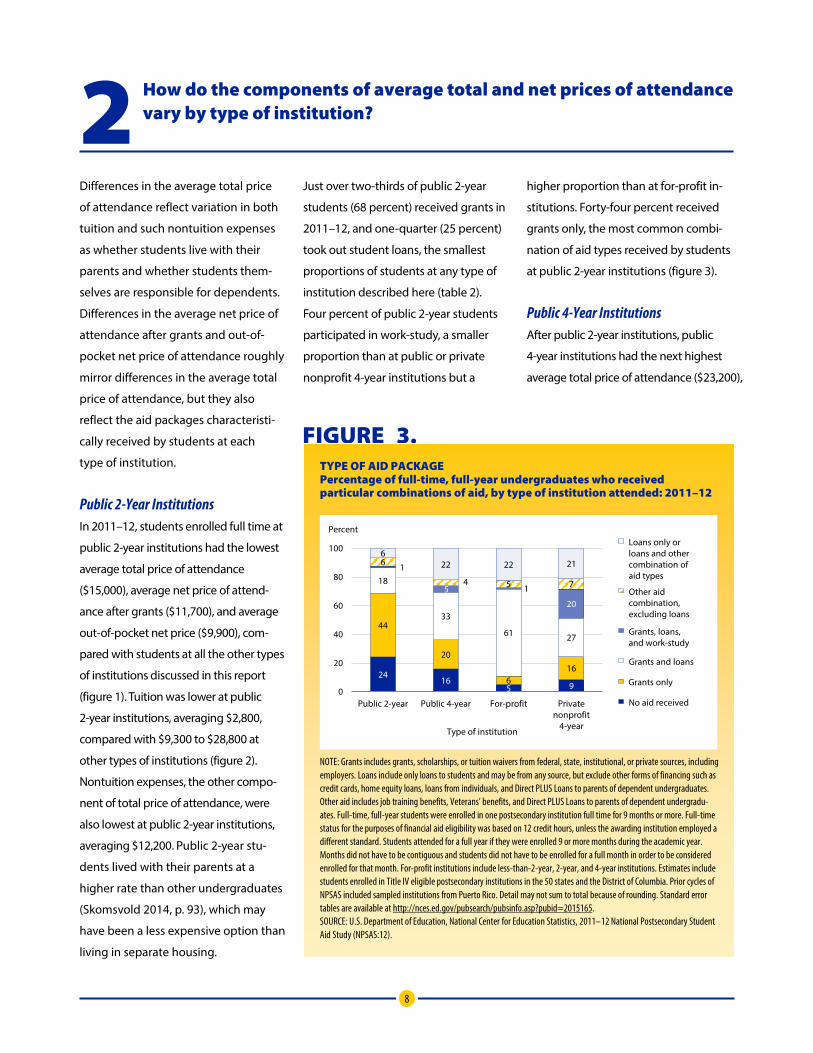
Just over two-thirds of public 2year
students (68 percent) received grants in
2011–12, and one-quarter (25 percent)
took out student loans, the smallest
proportions of students at any type of
institution described here (table 2).
Four percent of public 2year students
participated in work-study, a smaller
proportion than at public or private
nonprofit 4year institutions but a
higher proportion than at for-profit in-
stitutions. Forty-four percent received
grants only, the most common combi-
nation of aid types received by students
at public 2year institutions (figure 3).
FIGURE 3. TYPE OF AID PACKAGE Percentage of full-time, full-year undergraduates who received particular combinations of aid, by type of institution attended: 2011–12
2416
5 9
44
20
616
18
33
61 27
1
5 1
20
6
4 5 7
622 22 21
0
20
40
60
80
100
Public 2-year Public 4-year For-profit Privatenonprofit
4-year
Percent
Type of institution
Loans only or loans and other combination of aid types
Grants and loans
Grants only
No aid received
Grants, loans, and work-study
Other aid combination, excluding loans
NOTE: Grants includes grants, scholarships, or tuition waivers from federal, state, institutional, or private sources, including employers. Loans include only loans to students and may be from any source, but exclude other forms of financing such as credit cards, home equity loans, loans from individuals, and Direct PLUS Loans to parents of dependent undergraduates. Other aid includes job training benefits, Veterans’ benefits, and Direct PLUS Loans to parents of dependent undergradu-ates. Full-time, full-year students were enrolled in one postsecondary institution full time for 9 months or more. Full-time status for the purposes of financial aid eligibility was based on 12 credit hours, unless the awarding institution employed a different standard. Students attended for a full year if they were enrolled 9 or more months during the academic year. Months did not have to be contiguous and students did not have to be enrolled for a full month in order to be considered enrolled for that month. For-profit institutions include less-than-2-year, 2-year, and 4-year institutions. Estimates include students enrolled in Title IV eligible postsecondary institutions in the 50 states and the District of Columbia. Prior cycles of NPSAS included sampled institutions from Puerto Rico. Detail may not sum to total because of rounding. Standard error tables are available at http://nces.ed.gov/pubsearch/pubsinfo.asp?pubid=2015165. SOURCE: U.S. Department of Education, National Center for Education Statistics, 2011–12 National Postsecondary Student Aid Study (NPSAS:12).
Public 4-Year Institutions After public 2year institutions, public
4year institutions had the next highest
average total price of attendance ($23,200),
9
average net price of attendance after
grants ($18,000), and average out-of-
pocket net price ($11,800) for under-
graduates enrolled full time in 2011–12
(figure 1). These institutions charged an
average of $9,300 for tuition, more than
public 2year institutions and less than
for-profit and nonprofit 4year institu-
tions (figure 2). Undergraduates at public
4year institutions also spent more than
public 2year students on average
nontuition expenses ($13,900) and a
higher proportion of public 4year
students lived in on-campus or off-
campus housing than with their parents
(Skomsvold 2014, p. 93).
Undergraduates at public 4year insti-
tutions received financial aid to help
defray the total price of attendance at a
higher rate than their public 2year
counterparts, with 69 percent of public
4year students receiving grants, 60
percent taking out student loans, and
9 percent participating in work-study
(table 2). As a result, the average out-of-
pocket net price for students at public
4year institutions was only $1,900 more
than that for public 2year students,
even though the average total price of
attendance at public 4year institutions
was $8,200 higher than at public 2year
institutions (figure 1).
For-Profit Institutions For-profit institutions are privately
owned, profit-seeking enterprises that
do not receive direct government
appropriations or financial support from
endowments and philanthropic gifts.
They offer bachelor’s degrees, associate’s
degrees, and certificates. Compared with
other undergraduates, students at
for-profit institutions were more often
deemed independent for financial aid
purposes and more often had their own
dependents (Skomsvold 2014, pp. 64, 85),
which added to their nontuition ex-
penses. In 2011–12, the average total
price of attendance for undergraduates
enrolled full time at for-profit institutions
($29,300) was higher than that at public
2year institutions and public 4year insti-
tutions but lower than that at private
nonprofit 4year institutions (figure 1).
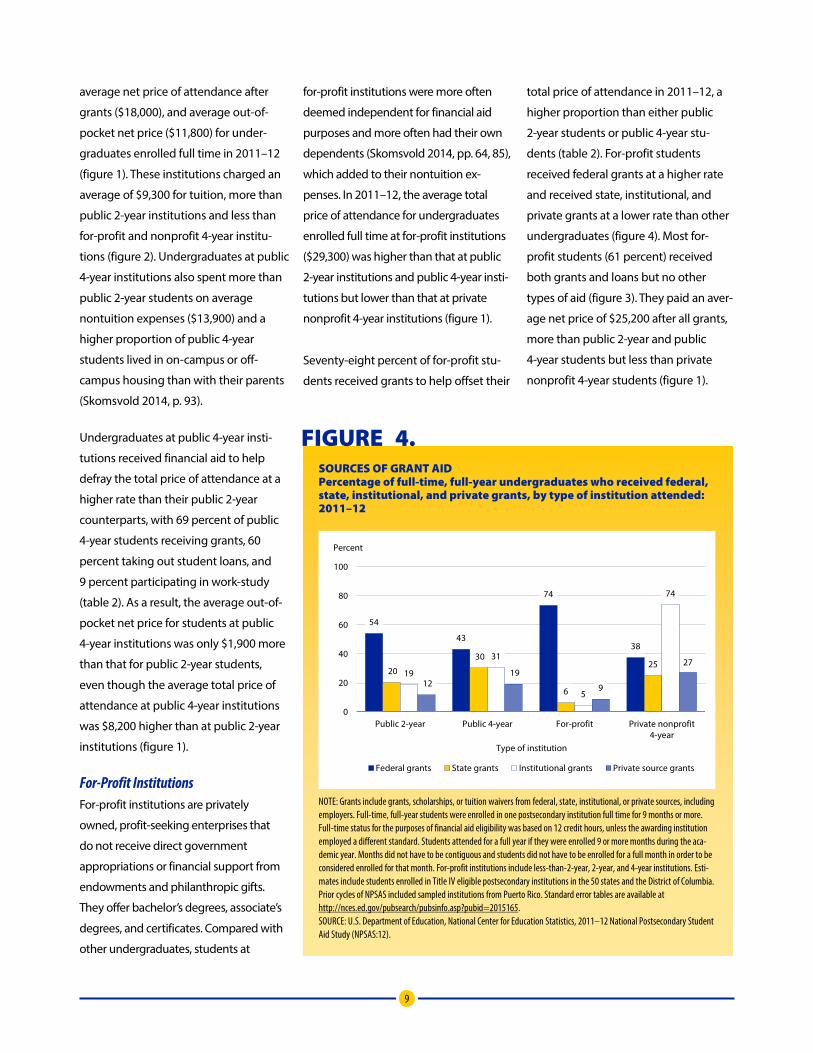
Seventy-eight percent of for-profit stu-
dents received grants to help offset their
total price of attendance in 2011–12, a
higher proportion than either public
2year students or public 4year stu-
dents (table 2). For-profit students
received federal grants at a higher rate
and received state, institutional, and
private grants at a lower rate than other
undergraduates (figure 4). Most for-
profit students (61 percent) received
both grants and loans but no other
types of aid (figure 3). They paid an aver-
age net price of $25,200 after all grants,
more than public 2year and public
4year students but less than private
nonprofit 4year students (figure 1).
FIGURE 4. SOURCES OF GRANT AID Percentage of full-time, full-year undergraduates who received federal, state, institutional, and private grants, by type of institution attended: 2011–12
54
43
74
38
20
30
6
2519
31
5
74
1219
9
27
0
20
40
60
80
100
Public 2-year Public 4-year For-profit Private nonprofit4-year
Percent
Type of institution
Federal grants State grants Institutional grants Private source grants
NOTE: Grants include grants, scholarships, or tuition waivers from federal, state, institutional, or private sources, including employers. Full-time, full-year students were enrolled in one postsecondary institution full time for 9 months or more. Full-time status for the purposes of financial aid eligibility was based on 12 credit hours, unless the awarding institution employed a different standard. Students attended for a full year if they were enrolled 9 or more months during the aca-demic year. Months did not have to be contiguous and students did not have to be enrolled for a full month in order to be considered enrolled for that month. For-profit institutions include less-than-2-year, 2-year, and 4-year institutions. Esti-mates include students enrolled in Title IV eligible postsecondary institutions in the 50 states and the District of Columbia. Prior cycles of NPSAS included sampled institutions from Puerto Rico. Standard error tables are available at http://nces.ed.gov/pubsearch/pubsinfo.asp?pubid=2015165. SOURCE: U.S. Department of Education, National Center for Education Statistics, 2011–12 National Postsecondary Student Aid Study (NPSAS:12).
10
Benefits for military veterans and their
qualified dependents were another
important source of aid for this group:
9 percent of for-profit students
received Veterans’ benefits in 2011–12,
compared with 2 to 3 percent of
students enrolled in other types of
institutions (table 2). Although not
officially considered grants, Veterans’
benefits are similar to grants in that
they do not require repayment like
loans or employment obligation like
work-study, and they do reduce the
out-of-pocket net price of postsecond-
ary education. In 2011–12, the average
out-of-pocket net price at for-profit
institutions was $15,000, which
exceeded the average out-of-pocket
net price at public 2year institutions
and public 4year institutions but was
below the average for private non-
profit 4year institutions (figure 1).
Private Nonprofit 4-Year Institutions Among students at the types of institu-
tions described in this report, full-time
students at private nonprofit 4year
institutions had the highest average to-
tal price of attendance ($43,500)—
$14,200 higher than that for students
at for-profit institutions—which was a
result of having both the highest aver-
age tuition ($28,800) and the highest
average nontuition expenses ($14,700)
(figures 1 and 2). Students at private
nonprofit 4year institutions had the
largest proportion who lived in campus
housing, which makes up a substantial
portion of nontuition expenses
(Skomsvold 2014, p. 93).
Students at private nonprofit 4year
institutions also had the highest
proportion who received grants
(86 percent) and received the largest
average amount of grant aid per
recipient ($18,300) (table 2). Most stu-
dents in these institutions (74 percent)
received grants from the institutions
themselves (figure 4). This grant aid
helped reduce the average net price
after grants to $27,900, the highest net
price after grants across all types of
institutions (figure 1). While students
at private nonprofit 4year institutions
still paid more after grants than stu-
dents at for-profit institutions, grant
aid narrowed the gap from a $14,200
difference in average total price of
attendance to a $2,700 difference in
the average net price of attendance.
Loans, work-study, and other aid fur-
ther reduced the average out-of-
pocket net price paid by students at
private nonprofit 4year institutions to
$18,100 (figure 1). Work-study was a
particularly prevalent form of aid
among students at these institutions.
One-third (34 percent) of private non-
profit 4year students participated in
work-study, compared with 2 to 9 per-
cent among their counterparts in other
types of institutions (table 2).
11
3 How do the net prices paid by full-time undergraduates vary by income?
Despite recent increases in the preva-
lence and proportion of merit-based
aid (Woo and Choy 2011; Rampell
2013), most grants to undergraduates
are awarded on the basis of financial
need, as are loans and work-study.
Need represents the difference be-
tween the total price of attendance,
which varies among types of institu-
tions, and the ability of students and
their families to pay. The formulas used
to estimate capacity to pay for postsec-
ondary education, commonly known
as the expected family contribution
(EFC), are complex, but two key factors
are whether the student is financially
dependent for the purpose of financial
aid determination and the student’s
family income.8 Overall, 69 percent of
undergraduates enrolled full time in
2011–12 were financially dependent,
including 22 percent of for-profit stu-
dents, 58 percent of public 2year
students, 80 percent of public 4year
students, and 85 percent of private
nonprofit 4year students (NCES
2014b). Dependent students’ EFC is
based on their parents’ income,
whereas independent students’ EFC is
based on their own income plus their
spouses’ income if they are married.
8 Independent students are age 24 or over and students under 24 who are married, have dependents, are veterans or on active duty, are orphans or wards of the courts, are homeless or at risk of homelessness, or were determined to be independent by a financial aid officer using professional judgment. Other under-graduates under age 24 are considered to be dependent.
Income Distribution by Dependency Status To portray variations in postsecondary
prices by income level, this section first
separates dependent undergraduates
from independent undergraduates
and then divides each group into
quarters of the income distribution:
low-income, low middle-income, high
middle-income, and high-income.
Dependent students are classified
based on their parents’ income, and
independent students are classified
based on their own income and that
of their spouses if they are married.
The cutpoint values for the income
distribution are calculated separately
for dependency status. For dependent
students, the low-income quarter in-
cluded students whose family income
was less than $31,224, the low middle-
income quarter included students
whose family income was $31,224–
$68,750, the high middle-income
quarter included students whose
family income was $68,751–$111,336,
and the high-income quarter included
students whose family income was
more than $111,336. For independent
students, the low-income quarter
included students whose income was
less than $4,510, the low middle-
income quarter included students
whose income was $4,510–$14,489,
the high middle-income quarter
included students whose income was
$14,490–$29,096, and the high-income
quarter included students whose
income was more than $29,096.
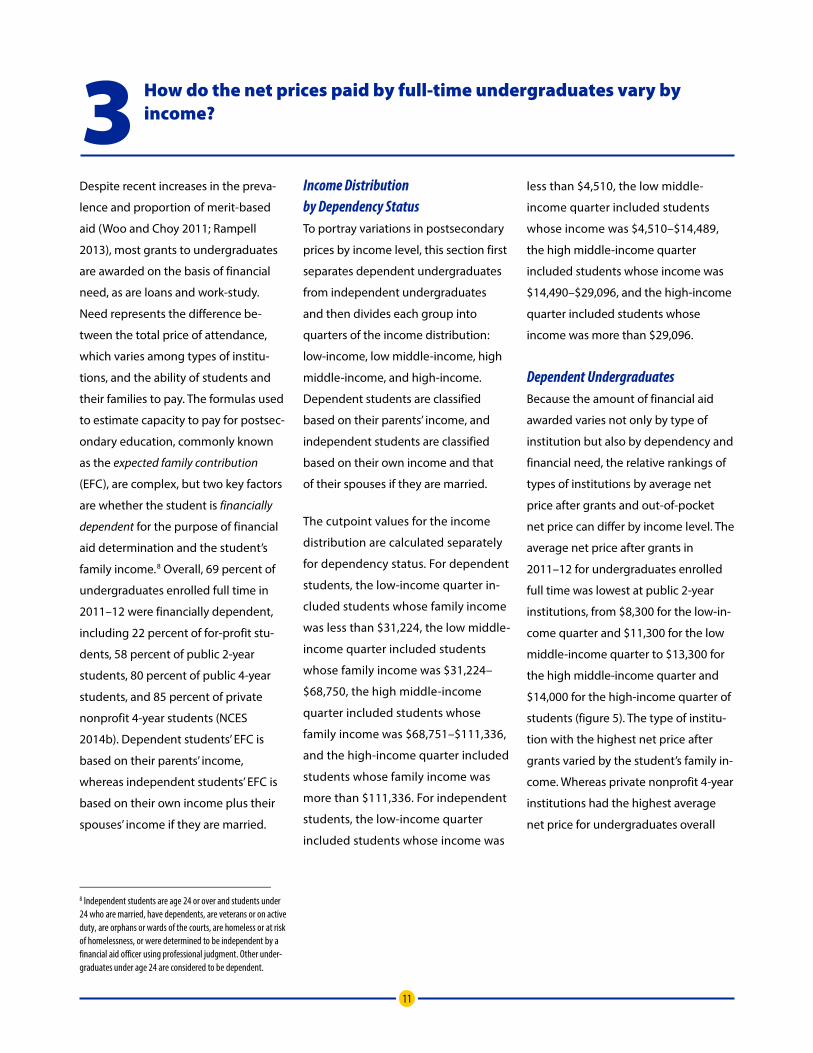
Dependent Undergraduates Because the amount of financial aid
awarded varies not only by type of
institution but also by dependency and
financial need, the relative rankings of
types of institutions by average net
price after grants and out-of-pocket
net price can differ by income level. The
average net price after grants in
2011–12 for undergraduates enrolled
full time was lowest at public 2year
institutions, from $8,300 for the low-in-
come quarter and $11,300 for the low
middle-income quarter to $13,300 for
the high middle-income quarter and
$14,000 for the high-income quarter of
students (figure 5). The type of institu-
tion with the highest net price after
grants varied by the student’s family in-
come. Whereas private nonprofit 4year
institutions had the highest average
net price for undergraduates overall
12
($27,900) (figure 1), dependent under-
graduates in the bottom three-quarters
of the income distribution paid the
highest average net price at for-profit
institutions, ranging from $24,300 for
the low-income quarter to $27,400 for
the low middle-income quarter and
$32,600 for the high middle-income
quarter (figure 5). Dependent students
in the high-income quarter faced the
highest average net price at private
nonprofit 4year institutions ($35,500)
and for-profit institutions ($33,400),
with no measurable difference (no dif-
ference that is statistically significant at
the p < .05 level) between the two
types of institutions (figure 5).
Within every type of institution,
dependent undergraduates in the low
middle-income quarter faced a higher
average net price than dependent
undergraduates in the low-income
quarter, and those in the high middle-
income quarter faced a higher average
net price than those in the low middle-
income quarter. Dependent under-
graduates in the high-income quarter
paid a higher average net price than
undergraduates in the high middle-
income quarter, except for dependent
undergraduates at for-profit institu-
tions, where there was no measurable
difference in average net price be-
tween students in the high-income
quarter and students in the high
middle-income quarter.
FIGURE 5. NET PRICE AFTER GRANTS BY FAMILY INCOME Average net price after grants for full-time, full-year dependent undergraduates, by family income and type of institution attended: 2011–12
8,30
0
11,3
00
13,3
00
14,0
00
12,3
00
16,2
00
20,4
00
22,8
00
24,3
00
27,4
00
32,6
00
33,4
00
19,7
00
23,3
00
28,8
00
35,5
000
10,000
20,000
30,000
40,000
50,000
Low-income(less than $31,224)
Low middle-income
($31,224–$68,750)
High middle-income
($68,751–$111,336)
High-income(more than$111,336)
Price
Family income level
Public 2-year Public 4-year For-profit Private nonprofit 4-year
$
NOTE: The net price after grants is the total price of attending a postsecondary institution, including tuition and fees, books and supplies, housing, meals, transportation, and other personal expenses, minus all grant aid. Grants includes grants, schol-arships, or tuition waivers from federal, state, institutional, or private sources, including employers. The net price after grants is calculated for all students, regardless of whether they received any grant aid. Family income consists of parents’ annual income in 2010. Dollar cutoffs are based on the income distribution among all dependent undergraduates: Full-time, full-year students were enrolled in one postsecondary institution full time for 9 months or more. Full-time status for the purposes of financial aid eligibility was based on 12 credit hours, unless the awarding institution employed a different standard. Stu-dents attended for a full year if they were enrolled 9 or more months during the academic year. Months did not have to be contiguous and students did not have to be enrolled for a full month in order to be considered enrolled for that month. For-profit institutions include less-than-2-year, 2-year, and 4-year institutions. Estimates include students enrolled in Title IV eligible postsecondary institutions in the 50 states and the District of Columbia. Prior cycles of NPSAS included sampled insti-tutions from Puerto Rico. Standard error tables are available at http://nces.ed.gov/pubsearch/pubsinfo.asp?pubid=2015165. SOURCE: U.S. Department of Education, National Center for Education Statistics, 2011–12 National Postsecondary Student Aid Study (NPSAS:12).
13
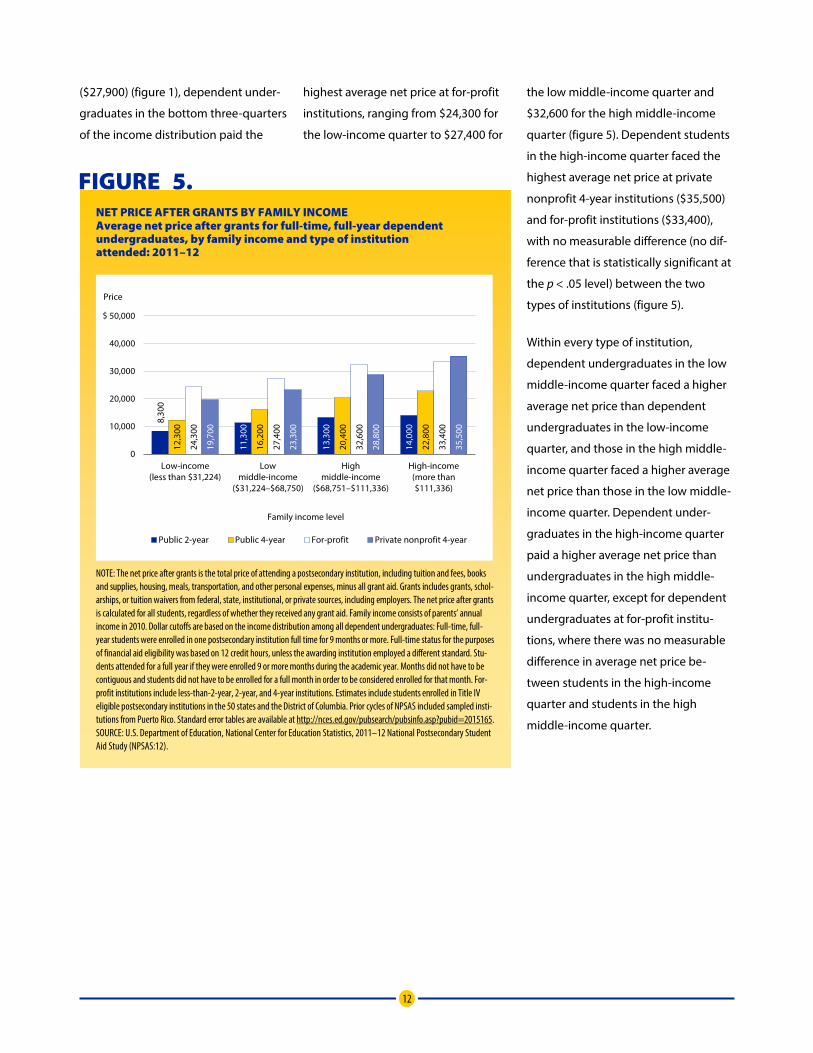
Overall, public 2year students paid the
lowest out-of-pocket net price ($9,900)
(figure 1). Among dependent under-
graduates, those in the bottom quarter
of the income distribution had the
lowest average out-of-pocket net price
at public 4year institutions ($7,100)
and public 2year institutions ($7,500),
with no measurable difference be-
tween the two groups (figure 6).
Dependent undergraduates in the low
middle-income quarter also had the
lowest average out-of-pocket net price
at public 4year institutions ($9,900)
and public 2year institutions
($10,200), with no measurable differ-
ence between the two groups. For
dependent undergraduates in the top
two quarters of the income distribu-
tion, public 2year students had the
lowest average out-of-pocket net price
at $11,900 and $13,100, respectively.
Although undergraduates in general
faced the highest average out-of-
pocket net price of $18,100 at private
nonprofit 4year institutions (figure 1),
dependent undergraduates in the
low-income and low middle-income
quarters paid the highest average out-
of-pocket net price if they attended
for-profit institutions ($15,000 and
$14,700, respectively) (figure 6).
Dependent undergraduates in the
high middle-income quarter faced the
highest average out-of-pocket net
price at private nonprofit 4year
institutions ($18,200) and for-profit
institutions ($18,100), with no measur-
able difference between those at the
two types of institutions. Finally,
among dependent undergraduates in
the high-income quarter, those who
attended private nonprofit 4year
institutions paid the highest average
out-of-pocket net price ($26,600).
FIGURE 6. OUT-OF-POCKET NET PRICE BY FAMILY INCOME Average out-of-pocket net price for full-time, full-year dependent undergraduates, by family income and type of institution attended: 2011–12
7,50
0
10,2
00
11,9
00
13,1
00
7,10
0
9,90
0
13,9
00
16,8
00
15,0
00
14,7
00
18,1
00
22,3
00
11,0
00
12,9
00
18,2
00
26,6
00
0
10,000
20,000
30,000
40,000
50,000
Low-income(less than $31,224)
Low middle-income
($31,224–$68,750)
High middle-income
($68,751–$111,336)
High-income(more than$111,336)
Price
Family income level
Public 2-year Public 4-year For-profit Private nonprofit 4-year
$
NOTE: The out-of-pocket net price is the total price of attending a postsecondary institution, including tuition and fees, books and supplies, housing, meals, transportation, and other personal expenses, minus all financial aid. Financial aid includes grants, student loans, Direct PLUS Loans to parents of dependent undergraduates, work-study, job training bene-fits, Veterans’ benefits, and any other type of aid. The out-of-pocket net price is calculated for all students, regardless of whether they received any aid. Family income consists of parents’ income in 2010. Dollar cutoffs are based on the income distribution among all dependent undergraduates: Full-time, full-year students were enrolled in one postsecondary insti-tution full time for 9 months or more. Full-time status for the purposes of financial aid eligibility was based on 12 credit hours, unless the awarding institution employed a different standard. Students attended for a full year if they were enrolled 9 or more months during the academic year. Months did not have to be contiguous and students did not have to be enrolled for a full month in order to be considered enrolled for that month. For-profit institutions include less-than-2year, 2year, and 4year institutions. Estimates include students enrolled in Title IV eligible postsecondary institutions in the 50 states and the District of Columbia. Prior cycles of NPSAS included sampled institutions from Puerto Rico. Standard error tables are available at http://nces.ed.gov/pubsearch/pubsinfo.asp?pubid=2015165. SOURCE: U.S. Department of Education, National Center for Education Statistics, 2011–12 National Postsecondary Student Aid Study (NPSAS:12).
14
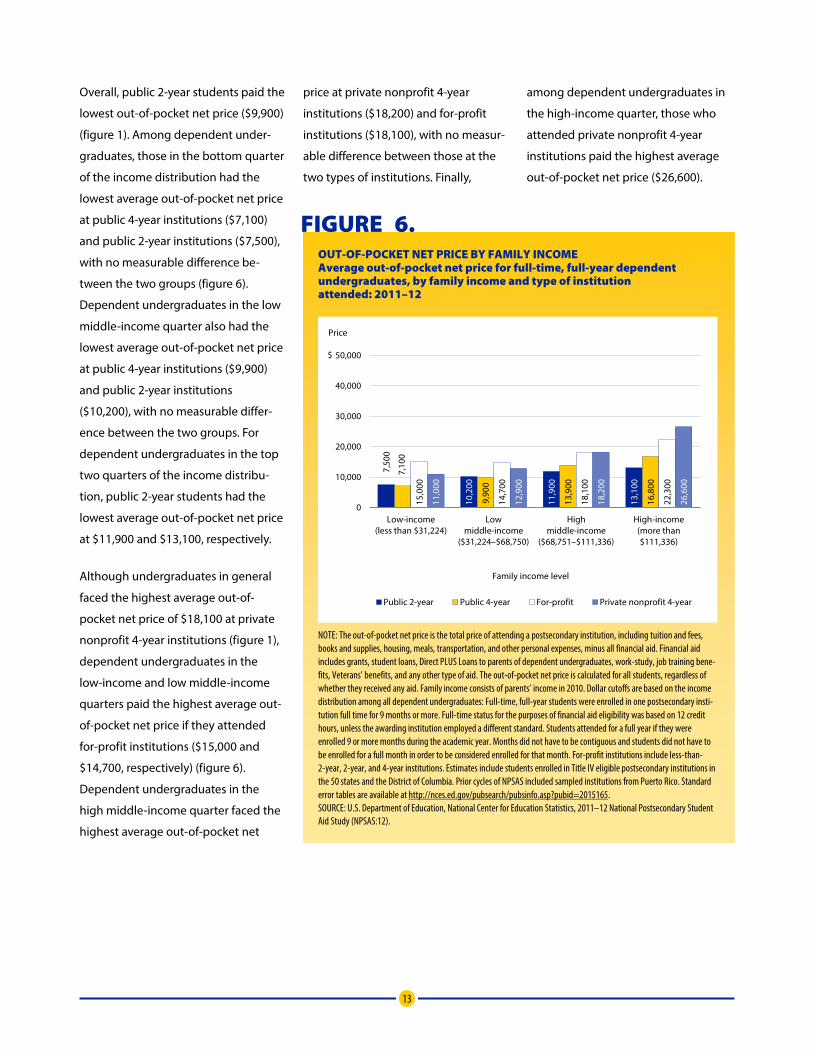
Independent Undergraduates Like dependent undergraduates and
undergraduates overall, independent
undergraduates in every quarter of the
income distribution who enrolled full
time faced the lowest average net price
after grants at public 2year institutions,
from $11,400 for the low-income
quarter and $12,100 for the low middle-
income quarter to $12,400 for the high
middle-income quarter and $14,100 for
the high-income quarter (figure 7).
Independent undergraduates across
the income distribution faced the
highest average net prices after grants
at private nonprofit institutions
(ranging from $23,400 to $27,600) and
for-profit institutions (ranging from
$24,100 to $25,100), with no
measurable difference in the average
net price after grants between the two
types of institutions in any quarter of
the income distribution.
FIGURE 7. NET PRICE AFTER GRANTS BY STUDENT INCOME Average net price after grants for full-time, full-year independent undergraduates, by student income and type of institution attended: 2011–12
11,4
00
12,1
00
12,4
00
14,1
00
15,3
00
16,1
00
18,3
00
20,1
00
24,5
00
24,1
00
24,6
00
25,1
00
24,6
00
23,4
00
25,7
00
27,6
00
0
10,000
20,000
30,000
40,000
50,000
Low-income(less than $4,510)
Low middle-income
($4,510–$14,489)
High middle-income
($14,490–$29,096)
High-income(more than $29,096)
Price
Student income level
Public 2-year Public 4-year For-profit Private nonprofit 4-year
$
NOTE: The net price after grants is the total price of attending a postsecondary institution, including tuition and fees, books and supplies, housing, meals, transportation, and other personal expenses, minus all grant aid. Grants includes grants, scholarships, or tuition waivers from federal, state, institutional, or private sources, including employers. The net price after grants is calculated for all students, regardless of whether they received any grant aid. Student income includes the student’s income (and the income of a spouse if the student is married) in 2010. Dollar cutoffs are based on the income distribution among all independent undergraduates: Full-time, full-year students were enrolled in one postsecondary institution full time for 9 months or more. Full-time status for the purposes of financial aid eligibility was based on 12 credit hours, unless the awarding institution employed a different standard. Students attended for a full year if they were enrolled 9 or more months during the academic year. Months did not have to be contiguous and students did not have to be enrolled for a full month in order to be considered enrolled for that month. For-profit institutions include less-than-2year, 2year, and 4year institutions. Estimates include students enrolled in Title IV eligible postsecondary institutions in the 50 states and the District of Columbia. Prior cycles of NPSAS included sampled institutions from Puerto Rico. Standard error tables are available at http://nces.ed.gov/pubsearch/pubsinfo.asp?pubid=2015165. SOURCE: U.S. Department of Education, National Center for Education Statistics, 2011–12 National Postsecondary Student Aid Study (NPSAS:12).
15
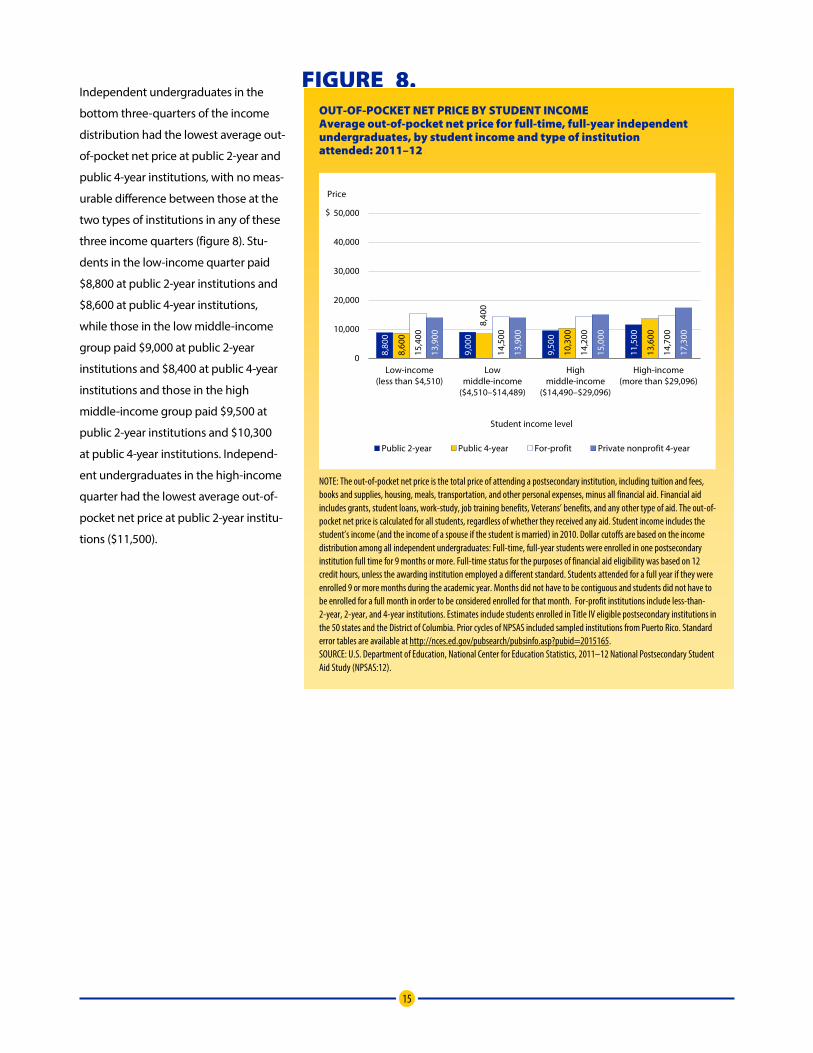
Independent undergraduates in the
bottom three-quarters of the income
distribution had the lowest average out-
of-pocket net price at public 2year and
public 4year institutions, with no meas-
urable difference between those at the
two types of institutions in any of these
three income quarters (figure 8). Stu-
dents in the low-income quarter paid
$8,800 at public 2year institutions and
$8,600 at public 4year institutions,
while those in the low middle-income
group paid $9,000 at public 2year
institutions and $8,400 at public 4year
institutions and those in the high
middle-income group paid $9,500 at
public 2year institutions and $10,300
at public 4year institutions. Independ-
ent undergraduates in the high-income
quarter had the lowest average out-of-
pocket net price at public 2year institu-
tions ($11,500).
FIGURE 8. OUT-OF-POCKET NET PRICE BY STUDENT INCOME Average out-of-pocket net price for full-time, full-year independent undergraduates, by student income and type of institution attended: 2011–12
8,80
0
9,00
0
9,50
0
11,5
00
8,60
0
8,40
0
10,3
00
13,6
00
15,4
00
14,5
00
14,2
00
14,7
00
13,9
00
13,9
00
15,0
00
17,3
00
0
10,000
20,000
30,000
40,000
50,000
Low-income(less than $4,510)
Low middle-income
($4,510–$14,489)
High middle-income
($14,490–$29,096)
High-income(more than $29,096)
Price
Student income level
Public 2-year Public 4-year For-profit Private nonprofit 4-year
$
NOTE: The out-of-pocket net price is the total price of attending a postsecondary institution, including tuition and fees, books and supplies, housing, meals, transportation, and other personal expenses, minus all financial aid. Financial aid includes grants, student loans, work-study, job training benefits, Veterans’ benefits, and any other type of aid. The out-of-pocket net price is calculated for all students, regardless of whether they received any aid. Student income includes the student’s income (and the income of a spouse if the student is married) in 2010. Dollar cutoffs are based on the income distribution among all independent undergraduates: Full-time, full-year students were enrolled in one postsecondary institution full time for 9 months or more. Full-time status for the purposes of financial aid eligibility was based on 12 credit hours, unless the awarding institution employed a different standard. Students attended for a full year if they were enrolled 9 or more months during the academic year. Months did not have to be contiguous and students did not have to be enrolled for a full month in order to be considered enrolled for that month. For-profit institutions include less-than-2year, 2year, and 4year institutions. Estimates include students enrolled in Title IV eligible postsecondary institutions in the 50 states and the District of Columbia. Prior cycles of NPSAS included sampled institutions from Puerto Rico. Standard error tables are available at http://nces.ed.gov/pubsearch/pubsinfo.asp?pubid=2015165. SOURCE: U.S. Department of Education, National Center for Education Statistics, 2011–12 National Postsecondary Student Aid Study (NPSAS:12).
16
FIND OUT MORE For questions about content or to order additional copies of this Statistics in Brief or view this report online, go to:
http://nces.ed.gov/pubsearch/pubsinfo.asp?pubid=2015165
More detailed information on prices of attendance
for 2011–12 undergraduates can be found in
Web Tables produced by the National Center for
Education Statistics (NCES) using 2011–12 National
Postsecondary Student Aid Study (NPSAS:12) data.
These Web Tables are a comprehensive source of
information on tuition and fees, total and net prices,
and financial aid awarded by type of institution and
by demographic and enrollment characteristics.
Web Tables—Undergraduate Financial Aid Estimates by
Type of Institution in 2011–12 (NCES 2014-169)
http://nces.ed.gov/pubsearch/pubsinfo.asp?
pubid=2014169.
Web Tables—Student Financing of Undergraduate
Education: 2011–12 (NCES 2015-173)
http://nces.ed.gov/pubsearch/pubsinfo.asp?
pubid=2015173.
Readers may also be interested in the following NCES
products related to the topic of this Statistics in Brief:
2011–12 National Postsecondary Study Aid Study
(NPSAS:12): Price Estimates for Attending Postsecondary
Education Institutions (NCES 2014-166)
http://nces.ed.gov/pubsearch/pubsinfo.asp?
pubid=2014166.
2011–12 National Postsecondary Student Aid Study
(NPSAS:12): Student Financial Aid Estimates for
2011–12 (NCES 2013-165)
http://nces.ed.gov/pubsearch/pubsinfo.asp?
pubid=2013165.
Data Point—Out-of-Pocket Net Price for College
(NCES 2014-902)
http://nces.ed.gov/pubsearch/pubsinfo.asp?
pubid=2014902.
Web Tables—College Costs—A Decade of Change:
2002–03 to 2011–12 (NCES 2013-170)
http://nces.ed.gov/pubsearch/pubsinfo.asp?
pubid=2013170.
Web Tables—Trends in Student Financing of
Undergraduate Education: Selected Years, 1995–96
to 2011–12 (NCES 2014-013)
http://nces.ed.gov/pubsearch/pubsinfo.asp?
pubid=2014013.
Web Tables—What Do Students Pay for College?
(NCES 2012-263)
http://nces.ed.gov/pubsearch/pubsinfo.asp?
pubid=2012263.
17
TECHNICAL NOTES Survey Methodology The estimates provided in this Statistics
in Brief are based on data collected
through the 2011–12 National Postsec-
ondary Student Aid Study (NPSAS:12).
NPSAS covers broad topics concerning
student enrollment in postsecondary
education and how students and their
families finance their education. In
2012, students provided data through
instruments administered over the
Internet or by telephone. In addition to
student responses, data were collected
from the institutions that sampled stu-
dents enrolled and from other relevant
databases, including U.S. Department
of Education records on student loan
and grant programs and student finan-
cial aid applications.
NPSAS:12 is the eighth administration of
NPSAS, which has been conducted every
3 to 4 years since the 1986–87 academic
year. The NPSAS:12 target population
includes students enrolled in Title IV post-
secondary institutions in the United
States at any time between July 1, 2011,
and June 30, 2012.9
9 The target population of students was limited to those enrolled in an academic program, at least one course for credit that could be applied toward an academic degree, or an occu-pational or vocational program requiring at least 3 months or 300 clock hours of instruction to receive a degree, certificate, or other formal award. The target population excluded students who were also enrolled in high school or a high school comple-tion (e.g., GED preparation) program. Prior cycles of NPSAS included institutions from Puerto Rico.
This population
included about 23 million undergradu-
ates and 4 million graduate students
enrolled in postsecondary education.
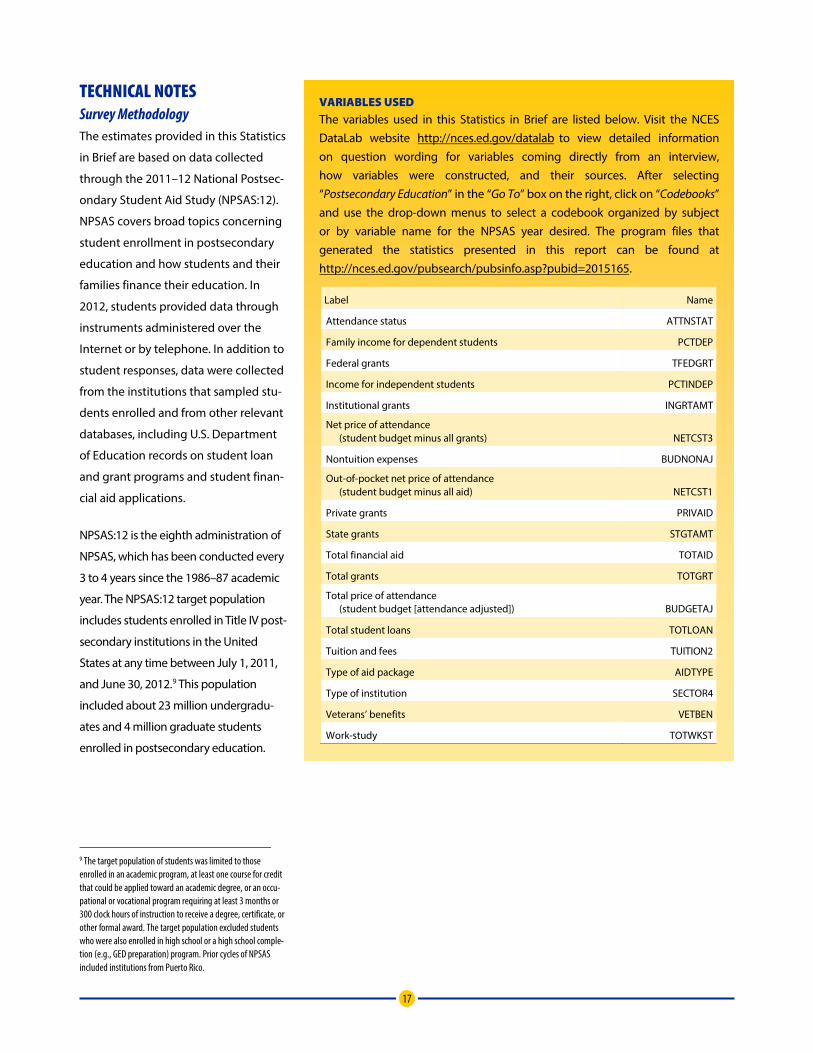
VARIABLES USED The variables used in this Statistics in Brief are listed below. Visit the NCES DataLab website http://nces.ed.gov/datalab to view detailed information on question wording for variables coming directly from an interview, how variables were constructed, and their sources. After selecting “Postsecondary Education” in the “Go To” box on the right, click on “Codebooks” and use the drop-down menus to select a codebook organized by subject or by variable name for the NPSAS year desired. The program files that generated the statistics presented in this report can be found at http://nces.ed.gov/pubsearch/pubsinfo.asp?pubid=2015165.
Label Name
Attendance status ATTNSTAT
Family income for dependent students PCTDEP
Federal grants TFEDGRT
Income for independent students PCTINDEP
Institutional grants INGRTAMT
Net price of attendance (student budget minus all grants) NETCST3
Nontuition expenses BUDNONAJ
Out-of-pocket net price of attendance (student budget minus all aid) NETCST1
Private grants PRIVAID
State grants STGTAMT
Total financial aid TOTAID
Total grants TOTGRT
Total price of attendance (student budget [attendance adjusted]) BUDGETAJ
Total student loans TOTLOAN
Tuition and fees TUITION2
Type of aid package AIDTYPE
Type of institution SECTOR4
Veterans’ benefits VETBEN
Work-study TOTWKST
18
The institution sampling frame for
NPSAS:12 was constructed from the
2008–09 and 2009–10 Institutional
Characteristics, Fall Enrollment, and
Completions files of the Integrated
Postsecondary Education Data System
(IPEDS). NPSAS:12 employed a two-
stage sampling design, first selecting
from among eligible institutions and,
within sampled institutions, from indi-
vidual students. Institutions were
selected with probabilities propor-
tional to a composite measure of size
based on expected 2011–12 enroll-
ment. With approximately 1,500
institutions participating in the study,
the weighted institution unit response
rate was 87 percent. Eligible sampled
students were defined as study
respondents if a subset of key data
elements was available from any data
source. Sample members also must
have had valid data for at least one key
variable from at least one other data
source other than the U.S. Department
of Education’s Central Processing
System. Approximately 95,000 under-
graduates and 16,000 graduate
students were study respondents, and
the weighted student unit response
rate for undergraduates was 91
percent. Estimates were weighted to
adjust for unequal probability of selec-
tion for the sample, for nonresponse,
and for poststratification to known
population totals.
Key variables used in this report in-
clude tuition (TUITION2), total price of
attendance (BUDGETAJ), net price after
grants (NETCST3), and out-of-pocket
net price (NETCST1). These composite
variables are derived from multiple
sources of data including IPEDS, the
Free Application for Federal Student
Aid (FAFSA), the National Student Loan
Data System (NSLDS), institution rec-
ords, and the student interview.
Two broad categories of error occur in
estimates generated from surveys:
sampling and nonsampling errors.
Sampling errors occur when observa-
tions are based on samples rather than
on entire populations. The standard
error of a sample statistic is a measure
of the variation due to sampling and
indicates the precision of the statistic.
The complex sampling design used in
NPSAS:12 must be taken into account
when calculating variance estimates
such as standard errors. NCES’s web-
based software application, PowerStats,
which generated the estimates in this
report, uses the balanced repeated rep-
lication (BRR) method to adjust
variance estimation for the complex
sample design (Wolter 1985).
Nonsampling errors can be attributed
to several sources: incomplete infor-
mation about all respondents (e.g.,
some students or institutions refused
to participate, or students participated
but answered only certain items); dif-
ferences among respondents in
question interpretation; inability or un-
willingness to give correct information;
mistakes in recording or coding data;
and other errors of collecting, pro-
cessing, sampling, and imputing
missing data.
For more information on NPSAS:12
methodology, see the 2011–12 National
Postsecondary Student Aid Study
(NPSAS:12) Data File Documentation
(NCES 2014-182)
(http://nces.ed.gov/pubsearch/
pubsinfo.asp?pubid=2014182).
Response Rates NCES Statistical Standard 441 states
that “[a]ny survey stage of data collec-
tion with a unit or item response rate
less than 85 percent must be evalu-
ated for the potential magnitude of
nonresponse bias before the data or
any analysis using the data may be re-
leased” (U.S. Department of Education
2012). In the case of NPSAS:12, this
means that nonresponse bias analysis
could be required at any of three
levels: institutions, study respondents,
or items. Because the institutional and
study respondent response rates were
88 and 91 percent, respectively, nonre-
sponse bias analysis was not required
at those levels.
The student interview response rate,
however, was 69 percent, and therefore
nonresponse bias analysis was required
for those variables based in whole or
in part on student interviews. In this
Statistics in Brief, nine variables required
nonresponse bias analysis: AIDTYPE
(68 percent), BUDGETAJ (40 percent),
BUDNONAJ (63 percent), NETCST1
(29 percent), NETCST3 (30 percent),
PCTDEP (68 percent), PCTINDEP
(60 percent), TOTAID (68 percent), and
TUITION2 (63 percent). For each of these
variables, nonresponse bias analyses
were conducted to determine whether
19
respondents and nonrespondents
differed on the following characteristics:
institution sector, region, and total
enrollment; student type, sampled as a
first-time beginner (FTB), and age group;
whether the student had FAFSA data,
was a federal aid recipient, was a state
aid recipient, was an institution aid
recipient, was a Pell Grant recipient,
or borrowed a Direct Loan; and the
amount, if any, of a student’s Pell Grant
or Direct Loan (table A1). Differences be-
tween respondents and nonrespondents
on these variables were tested for statis-
tical significance at the 5 percent level.
Nonresponse bias analyses of the
variables in this report with response
rates less than 85 percent indicated
that respondents differed from non-
respondents on 67 to 75 percent of the
characteristics analyzed, indicating that
there may be bias in these estimates.
Any bias due to nonresponse, however,
is based upon responses prior to
stochastic imputation in which missing
data were replaced with valid data
from the records of donor cases that
matched the recipients on selected
demographic, enrollment, institution,
and financial aid related variables
(Krotki, Black, and Creel 2005).10
10 NCES Statistical Standard 4-1-2 requires all key variables to be imputed prior to data release (U.S. Department of Education 2012), so all the findings in this report are based on data after missing values have been imputed. Wine, Bryan, and Siegel (2013, pp. 156-157) offer additional details on the imputation process used for NPSAS:12.
The
potential for bias in these estimates is
tempered by two factors.
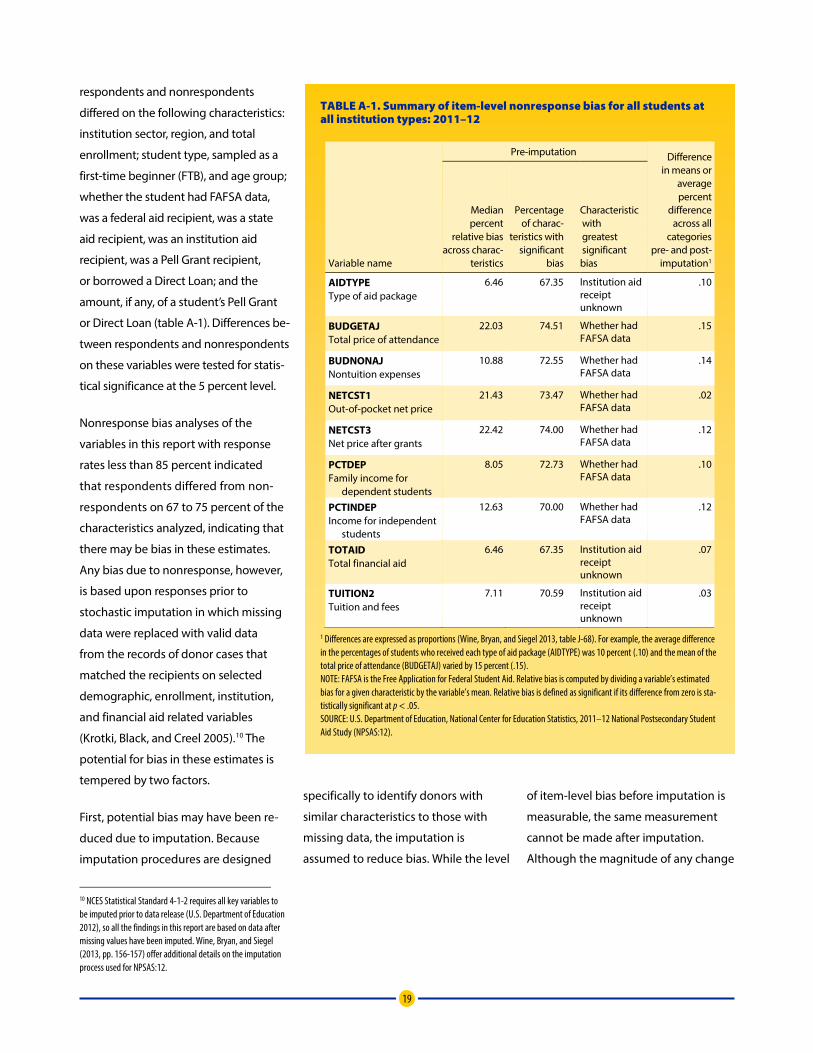
TABLE A-1. Summary of item-level nonresponse bias for all students at all institution types: 2011–12
Variable name
Pre-imputation Difference in means or
average percent
difference across all
categories pre- and post-
imputation1
Median percent
relative bias across charac-
teristics
Percentage of charac-
teristics with significant
bias
Characteristic with greatest significant bias
AIDTYPE Type of aid package
6.46 67.35 Institution aid receipt unknown
.10
BUDGETAJ Total price of attendance
22.03 74.51 Whether had FAFSA data
.15
BUDNONAJ Nontuition expenses
10.88 72.55 Whether had FAFSA data
.14
NETCST1 Out-of-pocket net price
21.43 73.47 Whether had FAFSA data
.02
NETCST3 Net price after grants
22.42 74.00 Whether had FAFSA data
.12
PCTDEP Family income for
dependent students
8.05 72.73 Whether had FAFSA data
.10
PCTINDEP Income for independent
students
12.63 70.00 Whether had FAFSA data
.12
TOTAID Total financial aid
6.46 67.35 Institution aid receipt unknown
.07
TUITION2 Tuition and fees
7.11 70.59 Institution aid receipt unknown
.03
1 Differences are expressed as proportions (Wine, Bryan, and Siegel 2013, table J-68). For example, the average difference in the percentages of students who received each type of aid package (AIDTYPE) was 10 percent (.10) and the mean of the total price of attendance (BUDGETAJ) varied by 15 percent (.15). NOTE: FAFSA is the Free Application for Federal Student Aid. Relative bias is computed by dividing a variable’s estimated bias for a given characteristic by the variable’s mean. Relative bias is defined as significant if its difference from zero is sta-tistically significant at p < .05. SOURCE: U.S. Department of Education, National Center for Education Statistics, 2011–12 National Postsecondary Student Aid Study (NPSAS:12).
First, potential bias may have been re-
duced due to imputation. Because
imputation procedures are designed
specifically to identify donors with
similar characteristics to those with
missing data, the imputation is
assumed to reduce bias. While the level
of item-level bias before imputation is
measurable, the same measurement
cannot be made after imputation.
Although the magnitude of any change
20
in item-level bias cannot be deter-
mined, the item estimates before and
after imputation were compared to
determine whether the imputation
changed the biased estimate as an in-
dication of a possible reduction in bias.
For continuous variables, the difference
between the mean before imputation
and the mean after imputation was es-
timated. For categorical variables, the
estimated difference was computed for
each of the categories as the percent-
age of students in that category before
imputation minus the percentage of
students in that category after imputa-
tion. These estimated differences were
tested for statistical significance at the
5 percent level. A significant difference
in the item means after imputation
implies a reduction in bias due to
imputation. A nonsignificant difference
suggests that imputation may not have
reduced bias, that the sample size was
too small to detect a significant differ-
ence, or that there was little bias to be
reduced. The number in the first row,
last column of table A1 indicates that
the average difference, before and after
imputation, in the percentages of stu-
dents who received each type of aid
package was one percent. The number
in the second row of the last column
indicates that the mean of the total
price of attendance varied by 15
percent between the pre- and
postimputation estimates. Statistical
tests of the differences between the
means or average percent differences
across all categories before and after
imputation for seven variables
(AIDTYPE, BUDGETAJ, BUDNONAJ,
NETCST3, PCTDEP, PCTINDEP, and
TOTAID) were significant, indicating
that the nonresponse bias was reduced
through imputation.
Second, for some composite variables,
the components of the variables from
which the composites are constructed
often constitute a very small propor-
tion of the total variable, attenuating
the potential bias introduced by non-
response. For example, most of the
components of TOTAID (total amount
of all financial aid received) were
obtained from federal databases and
institutional records and have very
high response rates. Some components
of TOTAID, however, are types of finan-
cial aid that are often disbursed
directly to students and not through
institutions (e.g., employer aid and pri-
vate loans). Because the primary
source of information about such
types of aid is the student interview,
these variables were missing for inter-
view nonrespondents.
In the case of missing information from
the student interview, values were
stochastically imputed and the imputed
values used to construct the composite
variables. In the example cited above,
both employer aid and private loans
were received by relatively few students
and were small components of the total.
For example, 59 percent of all under-
graduates received any grants (TOTGRT),
a primary component of TOTAID, and
the average among all undergraduates
(including those who did not receive
grants) was $3,600. In comparison,
6 percent received any employer aid
(EMPLYAM3), with an average among
all undergraduates of $200. Therefore,
despite the low response rates of these
components, any bias they contribute is
likely to be minimal.
For more detailed information on non-
response bias analysis and an overview
of the survey methodology, see the
2011–12 National Postsecondary
Student Aid Study (NPSAS:12) Data File
Documentation (NCES 2014182)
(http://nces.ed.gov/pubsearch/
pubsinfo.asp?pubid=2014182).
Statistical Procedures Comparisons of means and propor-
tions were tested using Student’s
t statistic. Differences between
estimates were tested against the
probability of a Type I error11
11 A Type I error occurs when one concludes that a difference observed in a sample reflects a true difference in the population from which the sample was drawn, when no such difference is present.
or signifi-
cance level. The statistical significance
of each comparison was determined
by calculating the Student’s t value for
the difference between each pair of
means or proportions and comparing
the t value with published tables of
significance levels for two-tailed
hypothesis testing. Student’s t values
were computed to test differences
21
between independent estimates using
the following formula:
−=
+1 2
2 21 2
E Et
se se
where E1 and E2 are the estimates to be
compared and se1 and se2 are their cor-
responding standard errors.
There are hazards in reporting statisti-
cal tests for each comparison. First,
comparisons based on large t statistics
may appear to merit special attention.
This can be misleading because the
magnitude of the t statistic is related
not only to the observed differences in
means or percentages but also to the
number of respondents in the specific
categories used for comparison. Hence,
a small difference compared across a
large number of respondents would
produce a large (and thus possibly
statistically significant) t statistic.
A second hazard in reporting statistical
tests is the possibility that one can
report a “false positive” or Type I error.
Statistical tests are designed to limit
the risk of this type of error using a
value denoted by alpha. The alpha level
of .05 was selected for findings in this
report and ensures that a difference of
a certain magnitude or larger would be
produced when there was no actual
difference between the quantities in
the underlying population no more
than 1 time out of 20.12
12 No adjustments were made for multiple comparisons.
When analysts
test hypotheses that show alpha
values at the .05 level or smaller, they
reject the null hypothesis that there is
no difference between the two
quantities. Failing to reject a null
hypothesis (i.e., detect a difference),
however, does not imply the values
are the same or equivalent.
22
REFERENCES Archibald, R.B., and Feldman, D.H. (2011).
Why Does College Cost So Much? New
York: Oxford University Press.
Ehrenberg, R.G. (2012). American Higher
Education in Transition. Journal of
Economic Perspectives, 26(1): 193–216.
Ginder, S., and Sykes, A. (2013). Web
Tables—College Costs—A Decade of
Change: 2002–03 to 2011–12 (NCES
2013170). National Center for
Education Statistics, Institute of
Education Sciences, U.S. Department
of Education. Washington, DC.
Hart Research Associates. (2013, January).
College Is Worth It. Retrieved June 24,
2013, from http://hcmstrategists.com/
americandream2-0/report/FINALHart
PublicOpinionResearch.pdf.
Higher Education Act of 1965, P.L. 89-329,
79 Stat. 1219 (1965).
Higher Education Opportunity Act of 2008,
P.L. 110-315, 122 Stat. 3078 (2008).
Hopkins, K. (2011, July 27). How to Qualify
for Out-of-State Tuition Breaks. U.S.
News & World Report. Retrieved October
25, 2013, from
http://www.usnews.com/education/
articles/2011/07/27/how-to-qualify-for-
out-of-state-tuition-breaks.
Horn, L., and Paslov, J. (2014a). Data
Point—Out-of-Pocket Net Price for
College (NCES 2014-902). National
Center for Education Statistics, Institute
of Education Sciences, U.S. Department
of Education. Washington, DC.
Horn, L., and Paslov, J. (2014b). Web
Tables—Trends in Student Financing of
Undergraduate Education: Selected
Years, 1995–96 to 2011–12 (NCES
2014013). National Center for
Education Statistics, Institute of
Education Sciences, U.S. Department of
Education. Washington, DC.
Ingels, S.J., Dalton, B., Holder, T.E., Lauff, E.,
and Burns, L.J. (2011). High School
Longitudinal Study of 2009 (HSLS:09):
A First Look at Fall 2009 Ninth-Graders
(NCES 2011327). National Center for
Education Statistics, Institute of
Education Sciences, U.S. Department of
Education. Washington, DC.
Krotki, K., Black, S., and Creel, D. (2005).
Mass Imputation. Proceedings of the
American Statistical Association, Section
on Survey Research Methods.
Alexandria, VA: American Statistical
Association. Retrieved April 14, 2014,
from http://www.amstat.org/
sections/srms/Proceedings/y2005/
Files/JSM2005-000931.pdf.
LoGerfo, L., Christopher, E.M., and
Flanagan, K.D. (2011). High School
Longitudinal Study of 2009 (HSLS:09). A
First Look at Fall 2009 Ninth-Graders’
Parents, Teachers, School Counselors,
and School Administrators (NCES 2011-
355). National Center for Education
Statistics, Institute of Education
Sciences, U.S. Department of
Education. Washington, DC.
Lumina Foundation and Gallup. (2013).
America’s Call for Higher Education
Redesign: The 2012 Lumina Foundation
Study of the American Public’s Opinion
on Higher Education. Indianapolis and
Washington, DC. Retrieved September
13, 2013, from
http://www.luminafoundation.org/files
/resources/americas-call-for-higher-
education-redesign.pdf.
National Center for Education Statistics
(NCES). (2014a). Undergraduates in
Public Institutions: Average Tuition and
Fees and Average Total Price of
Attendance, by Institution Level and
Residency Status: 2011–12. Institute of
Education Sciences, U.S. Department of
Education. Washington, DC. Retrieved
July 9, 2014, from
http://nces.ed.gov/datalab/tableslibrary
/viewtable.aspx?tableid=9486.
National Center for Education Statistics
(NCES). (2014b). Dependency Status:
Percentage Distribution of
Undergraduates by Dependency Status,
Within Type of Institution: 2011–12.
Institute of Education Sciences, U.S.
Department of Education. Washington,
DC. Retrieved
July 9, 2014, from http://nces.ed.gov/
datalab/tableslibrary/viewtable.aspx?
tableid=9484.
Paslov, J., and Skomsvold, P. (2014). Web
Tables—Student Financing of
Undergraduate Education: 2011–12
(NCES 2015-173). National Center for
Education Statistics, Institute of
Education Sciences, U.S. Department of
Education. Washington, DC.
23
Radwin, D., Wine, J., Siegel, P., and Bryan,
M. (2013). 2011–12 National
Postsecondary Student Aid Study
(NPSAS:12): Student Financial Aid
Estimates for 2011–12 (NCES 2013-
165). National Center for Education
Statistics, Institute of Education
Sciences, U.S. Department of
Education. Washington, DC.
Rampell, C. (2013, September 24).
Freebies for the Rich. New York Times.
Retrieved October 14, 2013, from
http://nytimes.com/2013/09/29/
magazine/freebies-for-the-rich.html.
Simone, S., Radwin, D., Wine, J., Siegel, P.,
and Bryan, M. (2013). 2011–12
National Postsecondary Student Aid
Study (NPSAS:12): Price Estimates for
Attending Postsecondary Education
Institutions (NCES 2014-166).
National Center for Education
Statistics, Institute of Education
Sciences, U.S. Department of
Education. Washington, DC.
Skomsvold, P. (2014). Web Tables—Profile
of Undergraduate Students: 2011–12
(NCES 2015-167). National Center for
Education Statistics, Institute of
Education Sciences, U.S. Department
of Education. Washington, DC.
Skomsvold, P., Radford, A.W., and Berkner,
L. (2011). Web Tables—Six-Year
Attainment, Persistence, Transfer,
Retention, and Withdrawal Rates of
Students Who Began Postsecondary
Education in 2003–04 (NCES 2011-152).
National Center for Education
Statistics, Institute of Education
Sciences, U.S. Department of
Education. Washington, DC.
Snyder, T.D., and Dillow, S.A. (2013). Digest
of Education Statistics 2013 (NCES 2014-
015). National Center for Education
Statistics, Institute of Education
Sciences, U.S. Department of
Education. Washington, DC.
Supiano, B. (2009, April 14). Locked-In
Tuition Is a Win for Families but a
Tough Sell for Colleges. Chronicle of
Higher Education. Retrieved
February 11, 2014, from
http://chronicle.com/article/Locked-
In-Tuition-Is-a-Win-for/47180.
Taylor, P., Parker, K., Fry, R., Cohn, D., Wang,
W., Velasco, G., and Dockterman, D.
(2011, May 16). Is College Worth It?
College Presidents, Public Assess Value,
Quality and Mission of Higher Education.
Pew Research Center. Retrieved
December 13, 2013, from
http://www.pewsocialtrends.org/files/
2011/05/Is-College-Worth-It.pdf.
U.S. Department of Education. (2012).
NCES Statistical Standards (NCES 2014-
097). Washington, DC: National Center
for Education Statistics. Retrieved
November 8, 2013, from
http://nces.ed.gov/pubsearch/pubsinfo
.asp?pubid=2014097.
Wei, C.C. (2010). What Is the Price of College?
Total, Net, and Out-of-Pocket Prices in
2007–08 (NCES 2011-175). National
Center for Education Statistics, Institute
of Education Sciences, U.S. Department
of Education. Washington, DC.
Wine, J., Bryan, M., and Siegel, P. (2013).
2011–12 National Postsecondary
Student Aid Study (NPSAS:12) Data File
Documentation (NCES 2014-182).
National Center for Education
Statistics, Institute of Education
Sciences, U.S. Department of
Education. Washington, DC.
Wolter, K. (1985). Introduction to Variance
Estimation. New York: Springer-Verlag.
Woo, J., and Choy, S. (2011). Merit Aid for
Undergraduates: Trends From 1995–96
to 2007–08 (NCES 2012-160). National
Center for Education Statistics, Institute
of Education Sciences, U.S. Department
of Education. Washington, DC.
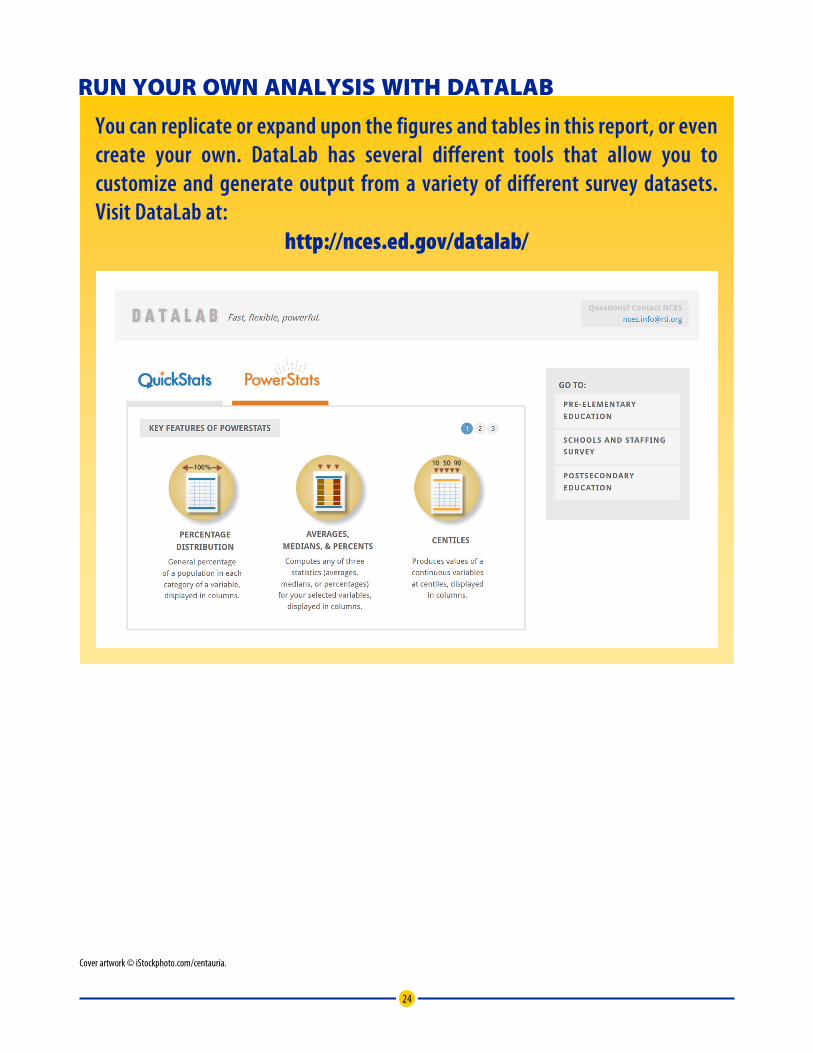
24
RUN YOUR OWN ANALYSIS WITH DATALAB
You can replicate or expand upon the figures and tables in this report, or even create your own. DataLab has several different tools that allow you to customize and generate output from a variety of different survey datasets. Visit DataLab at:
http://nces.ed.gov/datalab/
Cover artwork © iStockphoto.com/centauria.