Embed Size (px)
Citation preview
Copyright 0 1992 by the Genetics Society of America
Turnover of R1 (Type I) and R2 (Type 11) Retrotransposable Elements in the Ribosomal DNA of Drosophila melanogaster
John L. Jakubczak,* Michael K. Zenni,* R. C. Woodruff+ and Thomas H. Eickbush* *Department of Biology, University of Rochester, Rochester New York 14627, and TDepartment of Biological Sciences,
Bowling Green State University, Bowling Green, Ohio 43403 Manuscript received September 18, 199 1
Accepted for publication January 27, 1992
ABSTRACT R1 and R2 are distantly related non-long terminal repeat retrotransposable elements each of which
inserts into a specific site in the 28s rRNA genes of most insects. We have analyzed aspects of R1 and R2 abundance and sequence variation in 27 geographical isolates of Drosophila melanogaster. The fraction of 28s rRNA genes containing these elements varied greatly between strains, 17-67% for R1 elements and 2-28% for R2 elements. The total percentage of the rDNA repeats inserted ranged from 32 to 77%. The fraction of the rDNA repeats that contained both of these elements suggested that R1 and R2 exhibit neither an inhibition of nor preference for insertion into a 28s gene already containing the other type of element. Based on the conservation of restriction sites in the elements of all strains, and sequence analysis of individual elements from three strains, nucleotide divergence is very low for R1 and R2 elements within or between strains (<0.6%). This sequence uniformity is the expected result of the forces of concerted evolution (unequal crossovers and gene conversion) which act on the rRNA genes themselves. Evidence for the role of retrotransposition in the turnover of R1 and R2 was obtained by using naturally occurring 5’ length polymorphisms of the elements as markers for independent transposition events. The pattern of these different length 5’ truncations of R1 and R2 was found to be diverse and unique to most strains analyzed. Because recombination can only, with time, amplify or eliminate those length variants already present, the diversity found in each strain suggests that retrotransposition has played a critical role in maintaining these elements in the rDNA repeats of D. melanogaster.
R 1 and R2 (formerly called type 1 and type I1 insertions) are two sequence-specific retrotran-
sposable elements that were first discovered inter- rupting a fraction of the 28s rRNA genes of Drosoph- ila melanogaster (GLOVER and HOGNESS 1977; PELLE- GRINI, MANNING and DAVIDSON 1977; WELLAUER and DAWID 1977; WHITE and HOGNESS 1977). Each ele- ment has a specific insertion site approximately two- thirds of the length from the 5‘ end of the 28s rRNA gene with the R1 site located 74 base pairs (bp) downstream of the R2 site (DAWID and REBBERT 198 1 ; ROIHA et al. 198 1 ; RAE 198 1). Transcripts from rDNA repeats that contain R1 or R2 insertions are absent or are present at greatly reduced levels relative to the level of transcription from uninserted rDNA repeats (LONG and DAWID 1979; KIDD and GLOVER 1981; JAMRICH and MILLER 1984). Any rRNA tran- scripts that could be produced by inserted rDNA repeats are presumably defective because small dupli- cations or deletions associated with insertion of R1 and R2 would render the rRNA transcript nonfunc- tional, even if the insertions were somehow spliced out. R1 and R2 elements have also been found in the 28s rRNA genes of other dipteran species (RAE, Ko- HORN and WADE 1980; SMITH and BECKINGHAM
Genetics 131: 129-142 (May, 1992)
1984; KERREBROCK, SRIVASTAVA and GERBI 1989), of the lepidopteran Bombyx mori (FUJIWARA et a l . 1984; EICKBUSH and ROBINS 1985) and more recently in over 90% of insect species examined from nine orders (JAKUBCZAK, BURKE and EICKBUSH 199 1).
Nucleotide sequence analysis of full-length R1 and R2 elements from B. mori (BURKE, CALALANG and EICKBUSH 1987; XIONG and EICKBUSH 1988a) and Drosophila melanogaster (JAKUBCZAK, XIONG and EICK- BUSH 1990) revealed the presence of open reading frames with amino acid similarity to the gag gene and the reverse transcriptase domain of the pol gene of retroviruses and other retrotransposable elements. The amino acid sequence similarity of the reverse transcriptase domain and the absence of long terminal repeats (LTRs) place R1 and R2 in the non-LTR group of retrotransposable elements (XIONG and EICKBUSH 1988b, 1990). The open reading frame of the R2 element from B. mori has been expressed in Escherichia coli and shown to encode a sequence-spe- cific endonuclease (XIONG and EICKBUSH 1988~) . The endonuclease recognizes a DNA region of the 28s rRNA gene approximately 30 bp in length and gen- erates a double-stranded cut precisely at the R2 inser- tion site.
130 J. L. Jakubczak et al.
The evolutionary genetics of R1 and R2 differ from that of mobile elements that insert essentially at ran- dom in the genome. The recombination events which are known to result in large variations in the number of rRNA genes among different individuals in a spe- cies (LYCKEGAARD and CLARK 1989, 199 1) also influ- ence the number of 28s genes that contain R1 and R2. It was originally suggested by DOVER and COEN (1 98 1) that these recombinations should stochastically lead either to the elimination or fixation of the ele- ments within the rDNA locus. Because R1 and R2 inactivate the rDNA repeats, they should be elimi- nated from the rDNA locus in the long term. A balancing force that could maintain these insertions within the rDNA locus is the ability of R1 and R2 to increase their number by replicative transposition. To date there are no data that specifically address how dynamic this turnover of R1 and R2 can be within a species or the frequency with which retrotransposition is occurring.
In this report we have investigated the level and sequence divergence of R1 and R2 elements in 27 strains of D. melanogaster. Because the rRNA genes of D. melanogaster are located on the X and the Y chro- mosomes and the number of R1 elements varies sig- nificantly between these two loci (TARTOF and DAWID 1976; WELLAUER, DAWID and TARTOF 1978), we have simplified our analysis by limiting our study to only those rDNA repeats on the X chromosome.
MATERIALS AND METHODS
Strains: The strains of D. melanogaster used in this analysis are listed in Table 3.Oregon-R and Canton-S were obtained from E. STEPHENSON. All other lines were originally estab- lished as isofemale lines. Netherlands-163 (1982), Raleigh North Carolina CAM 105 (1 984), France V2-1 (1 980), Japan QD18 (1980) and Australia BL-17 (1982) were obtained from C. AQUADRO (dates in parentheses indicate year col- lected). Lines from Kenya were collected from various sites during the summer of 1988 (WOODRUFF et al. 1990); lines with the same date designation were collected from the same site.
Genomic DNA isolation: Genomic DNA was isolated from whole adult females of each strain (50- 100 individuals) according to ASHBURNER (1989) or CARRAMOLINO et al. (1982).
Cloning and DNA sequencing: R1 and R2 nucleotide sequences were obtained by polymerase chain reaction (PCR) amplification of genomic DNA sequences. R1 se- quences were amplified with an R1-specific degenerate primer of the sequence 5"CTGAGAATTCGGNT- GYCCNCARGGNTC-3' (where N equals any nucleotide, R equals a purine and Y equals a pyrimidine). This primer anneals to the DNA sequence encoding the amino acids GCPQGS in the 4th domain of the reverse transcriptase region of R1 elements from both D. melanogaster and B. mori (XIONG and EICKBUSH 1990). I t was designed to specif- ically amplify R1 elements from most insect species (D. EICKBUSH, unpublished data). R2 elements were amplified with the primer 5'-CTAAGTCGACGCNTWYGCNGAY- GAY-3' (where W equals A or T). This degenerate primer
anneals to the DNA sequence encoding the amino acids A(Y/F)ADD in the fifth domain of the reverse transcriptase region of either R1 or R2 elements of D. melunoguster and B. mori (XIONC and EICKBUSH 1990) and is designed to amplify R1 and R2 elements from most insects. Both degen- erate primers were used in combination with a 28s rRNA gene primer, 5'-CTTAGGATCCAAGAGCCGACATC GAAGGATC-3', which is complementary to a region 600 bp downstream of the R1 and R2 insertions sites. The PCR reactions were performed with Taq DNA polymerase (Pro- mega), 200 PM of each dNTP, and 1.5 mM MgCIz, for 30 cycles at an annealing temperature of 60 O . Each PCR primer contained a restriction site (underlined nucleotides in each primer sequence) used in cloning the amplified products. The amplified products contained the 3' half of the R1 or R2 elements and 600 bp of the 28s sequence downstream of the insertion site. Restriction fragments from these prod- ucts were cloned into M 13 mp18 or M 13 mp19 vectors (YANISH-PERRON, VIEIRA and MESSING 1985) and sequenced (United States Biochemical). For R1, this involved digesting the PCR product at the EcoRI site in the R1 primer and at the BamHI site at nucleotide position 4487 of the RlDm element (JAKUBCZAK, XIONG and EICKBUSH 1990). For R2, the PCR product was digested with EcoRI to obtain the 700- bp EcoRI fragment between nucleotide positions 2438 and 3169 of the R2 element (JAKUBCZAK, XIONC and EICKBUSH
Genomic DNA blot analysis: For each sample, 2-3 r g of genomic DNA were digested, fractionated on 0.7-1 .O% (w/v) agarose gels and transferred to nitrocellulose filter paper. The blots were hybridized overnight with one of the probes described below at 65" in 0.6 M NaCI, 0.12 M Tris- HCI (pH 8), 4 mM EDTA, 0.1 % (w/v) bovine serum albumin, 0.1% (w/v) Ficoll, 0.1 % (w/v) polyvinylpyrrolidone, 0.1 % (w/v) SDS, and 250 pg denatured calf thymus DNA/ml. The blots were washed in 1 X SSC at 65". The 28s gene probe used in quantitating R1 and R2 levels was the same 280-bp fragment immediately 3' of the R1 insertion site used in JAKUBCZAK, BURKE and EICKBUSH (1 99 1). The R 1 probe was a 853 bp BamHl fragment near the 3' end of the element, nucleotide position 4488-5341, obtained from clone a56 (JAKUBCZAK, XIONG and EICKBUSH 1990). The R2 probe was a 345-bp EcoRIISphI fragment near the 3' end of the element, nucleotide 3 170-35 15, obtained from clone p303 (JAKUBCZAK, XIONG and EICKBUSH 1990). The 28s gene probe used to determine rDNA copy number was a 954 bp HindIII fragment, nucleotide 6254-7208 (TAUTZ et al. 1988), from the 3' end of the 28s gene obtained from clone 235 (LONG, REBBERT and DAWID 1980). The alcohol dehydrogenase gene probe was a 1.5-kb HindIII/SpeI frag- ment containing the major exons of the gene derived from clone p5'Xba3.2 (AYER and BENYAJATI 1990) (gift of C. BENYAJATI). All fra ments were purified from agarose gels and labelled with [3 PIdATP by random priming.
Quantitation of R1 and R2 frequency: Bands on auto- radiographs, exposed within the linear range of preflashed film at -70°, were scanned by a laser densitometer. The areas of the peaks on the chart output were then measured by a digitizing tablet. The calculation of the fraction of rDNA containing R1 alone, R2 alone and both R1 and R2 are described in the results section. The data reported represents the average of two experiments. The standard error for the fraction of rDNA repeats in each strain aver- aged 0.03 of the total rDNA units for the R1 determina- tions, and 0.02 of the total rDNA units for the R2 deter- minations.
Quantitation of relative rDNA levels: Genomic DNA was digested with EcoRI and HindIII, fractionated on a
1990).
B
Turnover of R1 and R2 131
1.0% (w/v) agarose gel, and transferred to nitrocellulose filter paper. The blots were hybridized as described above. Filters were incubated with two probes simultaneously, the 954-bp Hind111 fragment from the 3' end of the D. mela- nogaster 28s gene, and the 1.5-kb HindIII/SpeI fragment from the D. melanogaster alcohol dehydrogenase gene. In order to minimize the difference in signal intensities be- tween the bands hybridized by the two probes, the ratio of radioactivity in the Adh and 28s probes used was 15O:l or 300: 1 . For each line, the 0.9-kb band representing the 28s genes and the 2.7-kb band representing the Adh gene were scanned by laser densitometery and the peak areas measured by a digitizing tablet. The ratio of the 28s to Adh peak areas represented the relative rDNA content for that line.
RESULTS
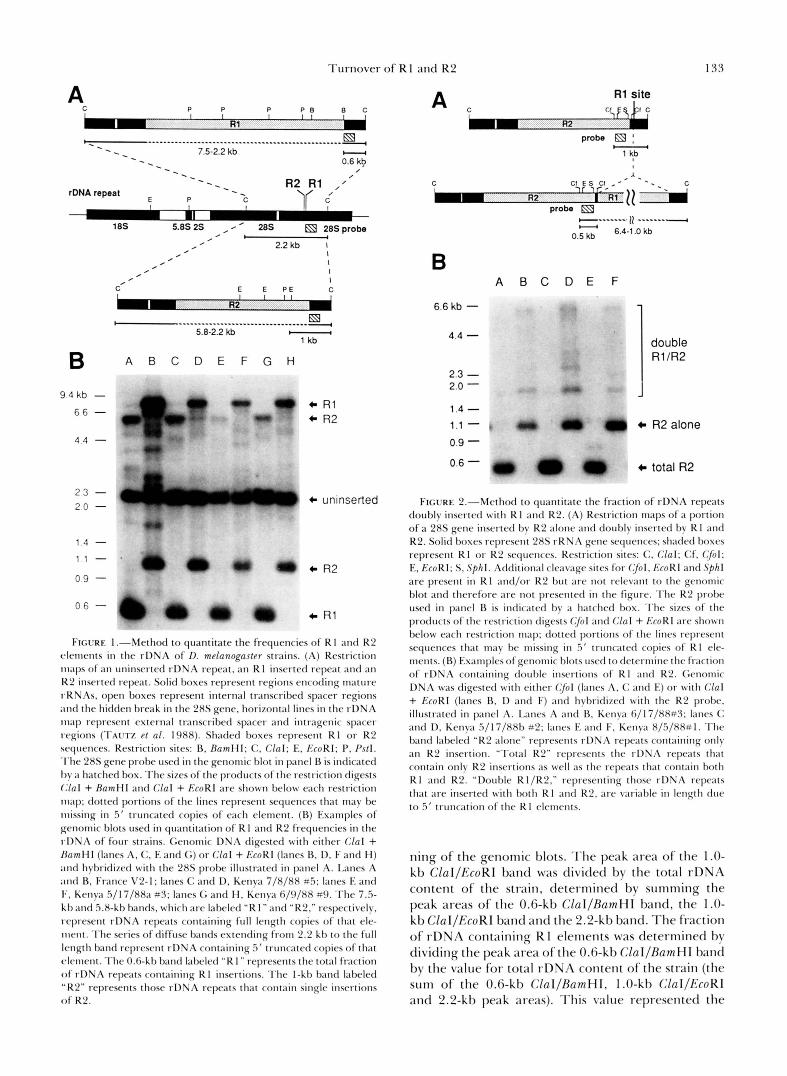
Sequence variation of R1 and R2 in D. melano- gaster: Based on restriction enzyme digestions and the comparison of short nucleotide sequences at the 5' and 3' ends, high sequence identity exists between individual copies of R1 or R2 elements in the estab- lished laboratory strain of D. melanogaster, Oregon R (DAWID and REBBERT 198 1 ; ROIHA et al. 198 1 ; JAK- UBCZAK, XIONG and EICKBUSH 1990). T o more di- rectly estimate the level of nucleotide sequence vari- ation of R1 and R2 within the species, we have com- pared the sequence of R1 and R2 elements obtained from Oregon R with those derived from two different geographical locations: Japan, and Kenya. R1 and R2 DNA sequences were amplified by the polymerase chain reaction method (PCR) from total genomic DNA and specific restriction fragments were se- quenced from three independent clones derived from each of the three strains (see MATERIALS AND METH- ODS). The sequences were amplified with one primer complementary to the elements and one primer com- plementary to the 28s genes; thus only those copies located in rDNA repeats were amplified. The segment sequenced from each element corresponded to an approximately 540-bp region encoding part of the carboxyl terminal half of the single open reading frame of R2 and of the second open reading frame of R 1 (nucleotides 26 15-3 154 and nucleotides 3635- 4 170, respectively, see JAKUBCZAK, XIONG and EICK-
Nucleotide positions that varied in the different sequenced copies of the elements are given in Tables 1 (Rl) and 2 (R2). Average nucleotide sequence di- vergence among the nine R 1 elements was 0.58%. Sequence divergence among R1 elements from the same strain was slightly lower at 0.45%. Average nucleotide sequence divergence among the nine R2 elements was 0.41% both between strains and within a strain. A significant component of this variation could be the result of the PCR protocol itself since cumulative error frequencies as high as 0.25% have been reported after 30 cycles of amplification (SAIKI et al. 1988). In our experiments we have used low
BUSH 1990).
nucleotide and Mg2+ concentrations which are re- ported to significantly reduce this error frequency (see review by GELFAND and WHITE 1990). Because we have not attempted to estimate the error rate in our PCR amplifications, the values presented here must be regarded as upper estimates of the actual sequence variation present in the R 1 and R2 elements in D. melanogaster.
Of the 18 R 1 and R2 elements partially sequenced, only one contained a mutation that destroyed the open reading frame. A single nucleotide frameshift muta- tion was found in one of the R2 elements from Oregon R. This element was identical to the consensus R2 sequence at all other positions. No amplified copy of R1 and R2 was found to be significantly divergent in sequence from the other copies. The degenerate oli- gonucleotide primers that were used in the PCR re- actions were designed to amplify R1 and R2 elements from a wide variety of insects. They can successfully amplify the elements from a number of Drosophila species as well as from B. mori (data not presented). Since the amplified elements from these different species are highly divergent in nucleotide sequence (Jakubczak, Xiong and Eickbush 1990), it is unlikely that only a closely related subset of the R1 or R2 elements of D. melanogaster have been selectively am- plified. The uniformity in sequence among R1 and among R2 elements in these three strains, as well as the conservation of restriction sites seen in the ge- nomic blots described in the following sections, indi- cates that these elements are evolving in concert, similar to the rDNA repeats themselves.
Quantitation of the fraction of 28s genes contain- ing R1 and R2: The fraction of 28s rRNA genes inserted by R 1 and R2 was determined by quantitative genomic blot analyses of DNA isolated from 27 strains of D. melanogaster. There are four types of rDNA repeats based on the presence or absence of R1 and R2 insertions: uninserted rDNA repeats, repeats con- taining R1, repeats containing R2, and double in- serted repeats that contain both R1 and R2 (LONG, REBBERT and DAWID 1980; ROIHA et al . 1981). Re- striction maps of these rDNA repeats indicating the location of restriction sites used in our analysis are shown in Figures 1A and 2A. It should be noted that a large percentage of R1 and R2 are not full-length (LONG, REBBERT and DAWID 1980; ROIHA et al. 198 1; DAWID and REBBERT 198 1 ; JAKUBCZAK, XIONG and EICKBUSH 1990). Similar to other non-LTR elements (reviewed in HUTCHISON et al. 1989) these truncated R1 and R2 elements retain their 3' ends and extend variable distances toward the 5' end.
T o determine the fraction of rDNA that contained R1 and R2 in each strain, two genomic blots were performed utilizing restriction sites near the 3' end of each element to reduce all full-length and truncated
132 J. L. Jakubczak et al.
TABLE 1
Nucleotide substitutions in the R1 elements of D. melanogaster strains
Nucleotide position"
Strain (clone No.) 3653 3753 3821 3917 3937 3950 3973 3983 4020 4037 4072
Oregon-R (a56)" C C Oregon-R ( 2 ) C C Oregon-R ( 3 ) C C Japan QDl8 (1) C C Japan QD18 ( 2 ) C C Japan QD18 (3) C C Kenya 5/15/88#a ( 1 ) C C Kenya 5/15/88#a (2) T C Kenya 5/15/88#a ( 3 ) C T
T T T A T T T T C T C T T T T T T T
T A T T T A T A T A T A C A T A C A
~~~~~ ~
C T C C C C C C C
" From JAKUBCZAK, XIONC and EICKBUSH (1990). Reanalysis of this clone indicated two mistakes in the published sequence; there is no A a t position 3823 and there is an additional G after position 3828.
TABLE 2
Nucleotide substitutions in the R2 elements of D. melanogaster strains
Nucleotide position"
Strain (clone No.) 2742 2744 2751 2848 2887 2893 2898 2907 2921 3050
Oregon-R (p303)" G Oregon-R (2) A Oregon-R ( 3 ) A Japan Q D 18 (1) A Japan Q D l 8 ( 2 ) A Japan QD18 ( 3 ) A Kenya 5/15/88#a (1) A Kenya 5/15/88#a ( 2 ) A Kenya 5/15/88#a ( 3 ) A
G G - G G G G G G
" From JAKUBCZAK, XIONC and EICKBUSH (1990).
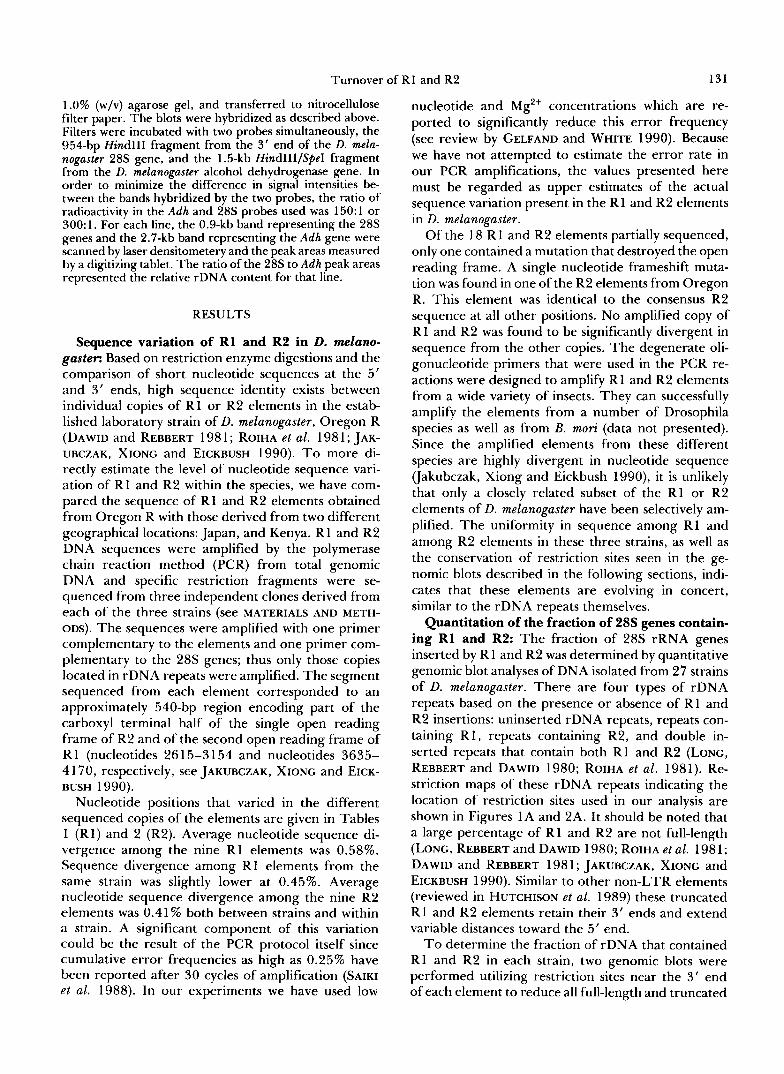
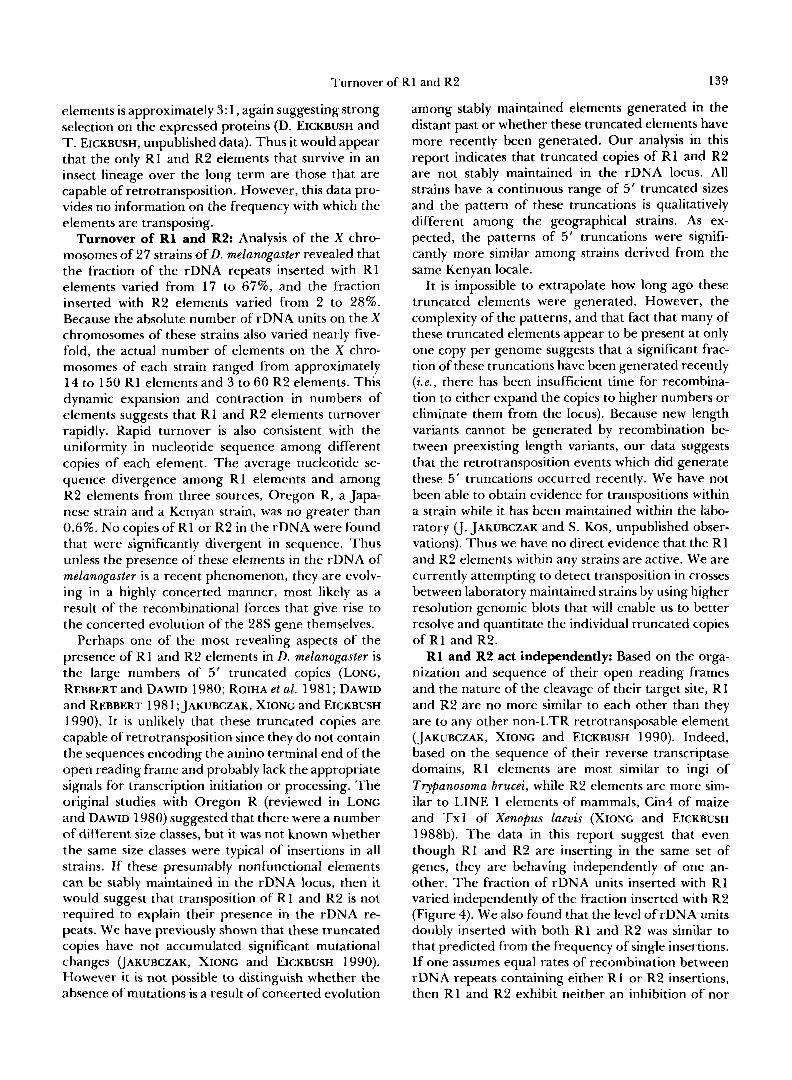
size classes to a single quantifiable restriction frag- ment. The first genomic blot (Figure 1) measured the total fraction of rDNA repeats containing R 1 (repeats containing R1 alone and repeats with both R1 and R2 insertions) and the fraction of repeats containing R2 alone. The second blot (Figure 2) measured the fraction of rDNA repeats that contained both R1 and R2. The fraction of rDNA containing R1 alone was then calculated by subtracting the fraction containing double insertions from the total fraction of rDNA containing R 1 insertions.
Shown in Figure 1 are examples of genomic DNA from individual strains digested with two sets of en- zymes (ClaI + BamHI and ClaI + EcoRI), blotted, and hybridized with a 280-bp fragment taken from the 28s rRNA gene immediately 3' of the insertion sites (JAKUBCZAK, BURKE and EICKBUSH 1991). The ex- pected sizes of the cleavage products of these diges- tions are shown schematically in Figure 1A. CZaI cleaved all 28s genes on either side of the R1 and R2 insertion sites, generating a 2.2-kb fragment for un- inserted rDNA repeats. ClaI did not cleave R1 or R2; thus fragments greater than 2.2 kb in length corre- sponded to 28s genes inserted with R1 and/or R2.
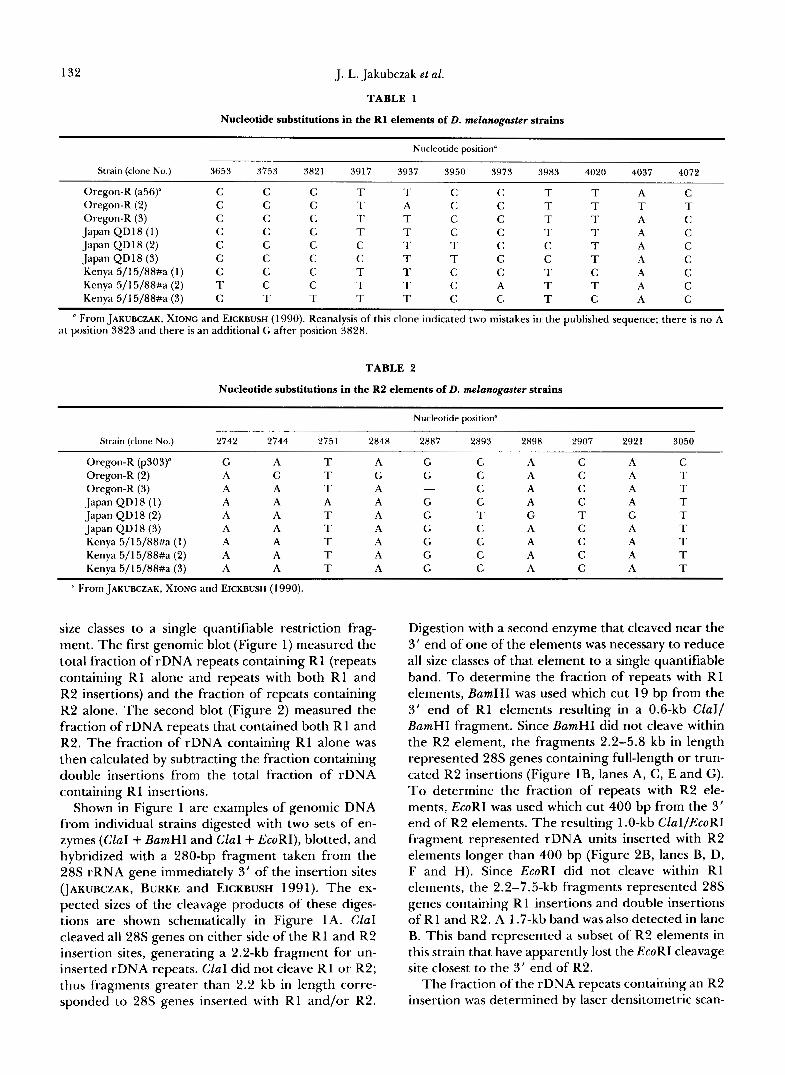
Digestion with a second enzyme that cleaved near the 3' end of one of the elements was necessary to reduce all size classes of that element to a single quantifiable band. T o determine the fraction of repeats with R1 elements, BamHI was used which cut 19 bp from the 3' end of R1 elements resulting in a 0.6-kb CZal/ BamHI fragment. Since BamHI did not cleave within the R2 element, the fragments 2.2-5.8 kb in length represented 28s genes containing full-length or trun- cated R2 insertions (Figure lB, lanes A, C, E and G). T o determine the fraction of repeats with R2 ele- ments, EcoRI was used which cut 400 bp from the 3' end of R2 elements. The resulting 1 .O-kb ClaI/EcoRI fragment represented rDNA units inserted with R2 elements longer than 400 bp (Figure 2B, lanes B, D, F and H). Since EcoRI did not cleave within R1 elements, the 2.2-7.5-kb fragments represented 28s genes containing R1 insertions and double insertions of R1 and R2. A 1.7-kb band was also detected in lane B. This band represented a subset of R2 elements in this strain that have apparently lost the EcoRI cleavage site closest to the 3' end of R2.
The fraction of the rDNA repeats containing an R2 insertion was determined by laser densitometric scan-
Turnover of R1 and R2 133
A
~"""""""""""""""""..."""......"~ Ea . . 7.5-2.2 kb " c-( . 0.6 kb -. / -. /
" rDNA repeat E
R2 R1 ,/ - P C I I f r
18s 5.8s 2s , ' ' 28s a 285 probe
B 9 4 k b -
6 6 - 4.4 -
2 3 - 2 0 -
1 4 - 1 1 - 0 9 - 06 -
. , . I , , 2.2 kb 1
""""""""""""""...."" tn 5.8-2.2 kb -
1 kb
A B C D E F G H
m
c R2
c R1
FIGURE 1 .--Method to quantitate the frequencies of R 1 and K 2 c*lenlents i n the rDNA of D. melanogaster strains. (A) Restriction maps of at1 uninscrted rDNA repeat, an R1 inserted repeat and an K2 inserted repeat. Solid hoxes represent regions encoding mature rRNAs, open boxes represent internal trmscribed spacer regions and the hidden break i n the 28s gene. horizontal lines in the rDNA Inap represent external transcrihed spacer and intragenic sptcer tx~gions (I'AL~TL et al. 1988). Shaded boxes represent R I or K2 scquences. Restriction sites: B, Raml-Il: C . Clal: E, GcoRI: P, P s f l . .l'he 28s gene prohe used i n the genomic blot i n panel B is inclicated I)y ;I hatched box. The sizes of the products of the restriction digests (,'la1 + RumHl and Clal + GcoRI are shown helow each restriction 1n;tp; dotted portions of the lines represent sequences that may be missing in 5 ' truncated copies of each element. (B) Examples of genomic hlots used i n quantitation of R 1 and R2 frequencies i n the rDNA of four strains. Genomic DNA digested with either Clal + h m H l (1;unes A, <:. E and G) or Clal + k h R I (lanes B. I), F and H) and hyhridi7etl with the 2% probe illustrated in panel ,4. I,;lnes A and 13, France V2-1; lanes C and D, Kenya 7/8/88 #5: lanes E and 1;. Kenya 5/17/88a #J: lanes G and H , Kenva 6/9/88 #9. The 7.5- k h and 5.8-kh hands, which are labelctl "R I " and "K2." respectively. represent rDNA repeats cont;tining full length copies of that ele- ment. The series of diffuse hands extending from 2.2 kt) to the full length band represent rDNA containing .5' truncated copies of that elenlent. The 0.6-kb hand labeled "Kt" represents the total fraction o f rDNA repeats cont;lining R I insertions. The I-kb band labeled "K2" represents those rDNA repeats that cont;lin single insrrtions o f K2.
A
C
""- "-. 11 .""" - U o.5 kb 6.4-1.0 kb
B A B C D E F
6.6 kb - 4.4 -
2.3 - 2.0 - 1.4 - 1.1 - 0.9 - 0.6 -
1
i double RlIR2
c R2 alone
c total R2
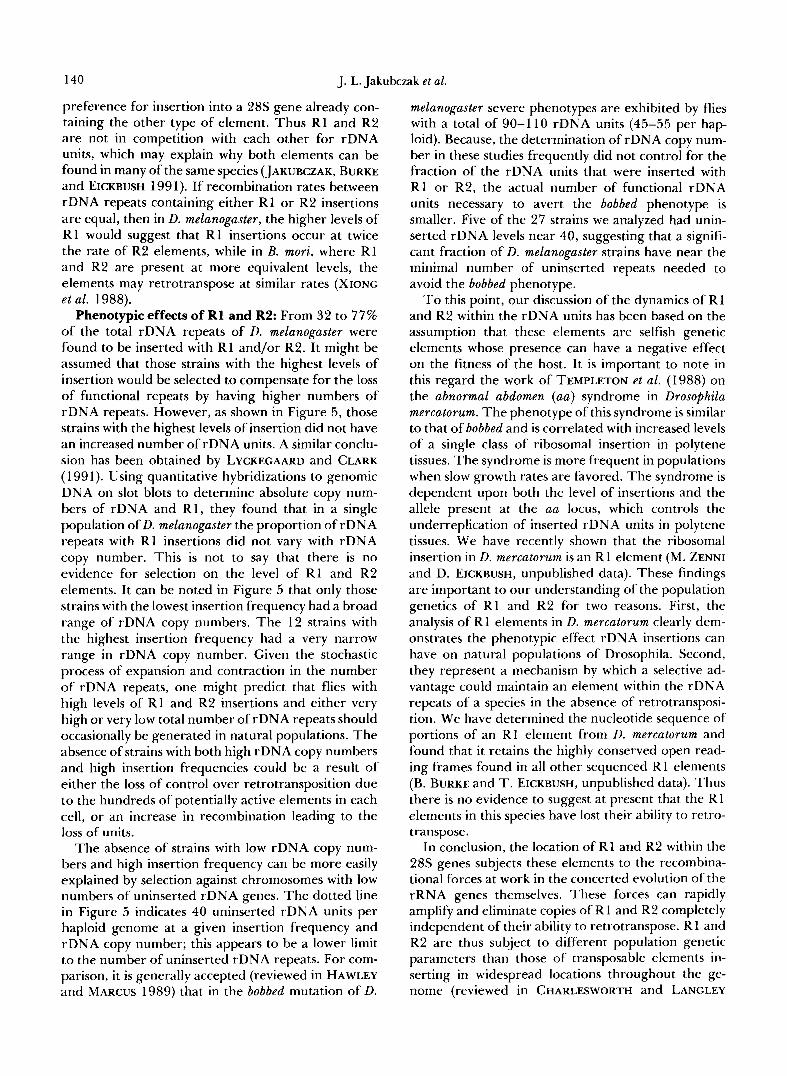
FIGURE 2."Method to quantitate the fraction of rDNA repeats doubly inserted wi th K I ;~nd R2. (A) Restriction maps of a portion of a 28s gene inserted hy R2 alonc and douhlv inserted by R1 and R2. Solid hoses rel>resent 28s rKNA gene sequences; shaded boxes represent K1 or K 2 sequences. Restriction sites: C. Clal: Cf, (701; E, RroKI; S , S p h l . Additiotxll cleavage sites for (701. I:'roRI and Sphl are present i n KI and/or K2 but arc not relevant t o the genomic blot and tllerefore are not presented i n the figure. The K2 prnhe used in Imnel R is indicated hy a h;ltched box. The sizes of the products of the restriction digests ($01 ;wtl Clal + f:'roRI are shown hclow carh restriction map; dottrd portions of the lines represent sequences that tnay bc missing i n 5' trutvxted copies of KI ele- ments. (B) Exatnples of genomic blots used to drtcrtnine the frxtion of rDNA cont;lining tlouhle insertions of K I and K2. Genomic DNA MUS digested with either ($1 (lanes A. C and E) or with Clal + GroRl (lanes R, 1) and F) ;and hybridized with the K 2 probe. illustrated i n panel A. I.;lnes A and 1%. Kenya 6/17/8X#J: lanes C and D, Kenya 5/17/88h #2; lanes E and F, Kenya 8/.5/88#1. The h;lnd laheletl "K2 alone" represents rDN.4 repeats containing only an K2 insertion. "Total K2" reprrsents the rDNA repeats t11;tt contain only K 2 inscrtions a s well a s the repeats t h a t contain both K I and R2. "1)ouhle K 1/K2." representing those rDNA rcpcats that are inserted with both R I ; t n d K2. arc variahle i n length due to 5' truncation of the R I elements.
ning of the genomic blots. The peak area of the 1 .O- kb ClaI/EcoKI band was divided by the total rDNA content of the strain, determined by summing the peak areas of the 0.6-kb ClaI/RumHI band, the 1.0- kb ClaI/EcoRI band and the 2.2-kb band. The fraction of rDNA containing R I elements was determined by dividing t.he peak area of t.he 0.6-kb ClaI/RamHI band by the value for total rDNA content of the strain (the sum of the 0.6-kb ClaI/BamHI, 1.0-kb ClaI/EcoRI and 2.2-kb peak areas). This value represented the
134 J. L. Jakubczak et al.
fraction of rDNA repeats containing an R1 insertion as well as those double inserted with R1 and R2. T o obtain the level of rDNA containing only R1 inser- tions, the fraction of double insertions was subtracted from this value.
T o determine the fraction of rDNA inserted with both R1 and R2, a second genomic blot was per- formed, as shown in Figure 2. Genomic DNA from each line was digested with CfoI (lanes A, C, E) and with ClaI + EcoRI (lanes B, D and F), blotted and hybridized with an EcoRI/SphI fragment from the 3' end of the R2 element. The expected sizes of the cleavage products of these digests are shown schemat- ically in Figure 2A. In the case of the CluI + EcoRI digest, EcoRI cuts in the 3' end of the R2 element and ClaI cleaves downstream in the 28s gene. If only an R2 element was present in the 28s gene, the size of the band hybridizing to the R2 probe was 1.0 kb. If there was also an R1 insertion in this 28s gene, the hybridizing fragment was between 1 .O and 6.4 kb in length, depending on the extent of 5' truncation of the R1 element. In the case of the CfoI digest, CfuI cleaved in the 3' end of the R2 element and in the 28s gene between the R1 and R2 insertion sites. The resulting 0.5-kb CfiI fragment represented both rDNA units that contained a single R2 insertion and those that contained double insertions of R1 and R2. The relative fraction of R2 containing 28s genes that also contain R1 elements was then determined by the ratio in hybridization signal between the 0.5-kb CfoI and the 1.0-kb EcuRI/CluI bands. The fraction of rDNA containing R2 alone, calculated from the 1.0- kb EcoRIIClaI band in Figure lB, was then multiplied by this ratio to arrive at a value for the frequency of 28s genes containing double insertions.
The rDNA repeats containing R1 or R2 can be differentially underreplicated relative to the unin- serted rDNA during polytenization (ENDOW and GLOVER 1979; KALUMUCK, WETZEL and PROCUNIER 1990). The percentage of polytene DNA in the ge- nomic DNA isolated from the adults of each strain in this study should be small since the only tissue to remain polytene in D. melanogaster adults is the Mal- phigian tubules (ASHBURNER 1989). We have directly determined whether polytene chromosomes in adult tissues have caused us to underestimate the fraction of R1 and R2 elements in diploid tissues by isolating genomic DNA from the heads of adult Oregon R flies. The fraction of the rDNA repeats inserted with R1 and/or R2 in this DNA was identical, within experi- mental error (0.03), to that determined for DNA isolated from total adult animals (data not shown).
Frequency of R1 and R2 in the rDNA of different strains: The fraction of 28s rRNA genes containing R1 alone, R2 alone and both R1 and R2 in 27 strains of D. melanogaster is summarized in Table 3. Based
TABLE 3
Frequency of R1 and R2 in the rDNA of strains of D. melanogaster
Fraction of rDNA containing
R1 alone R2 alone R1 + R 2 inserted Strain Total fraction
Oregon-R 0.43 Canton-S 0.23 Netherlands 163 0.54" Raleigh NC CAM 105 0.46 France V2-1 0.60 Japan QD 18 0.37 Australia BL-17 0.54 Kenya 511 5/88#a 0.35 Kenya 5/17/88a#3 0.36" Kenya 5/17/88a#4 0.37 Kenya 5/17/88b#2 0.27 Kenya 6/7/88b#8 0.24 Kenya 6/7/88b#9 0.20 Kenya 6/9/88#2 0.15 Kenya 6/9/88#8 0.26 Kenya 6/9/88#9 0.19 Kenya 611 7/88#3 0.45 Kenya 6/29/88#E 0.25 Kenya 7/2/88#2 0.33 Kenya 7/8/88#3 0.23 Kenya 7/8/88#5 0.13 Kenya 7/9/88#3 0.26 Kenya 7/9/99#4 0.28 Kenya 7/15/88#4 0.34 Kenya 7/21/8813#1 0.54 Kenya 7/30/88#1 0.34 Kenya 8/5/88#1 0.29
0.08 0.03 0.08 0.06 0.12 0.02 0.10 0.13 0.12
0.17 0.07
0.10 0.05 0.13 0.07 0.06 0.10 0.12 0.20 0.10 0.10 0.13 0.06 0.14 0.16
0.08
0.08
0.09 0.06 ND
0.04 0.04 0.00 0.13 0.12
0.10 0.1 1 0.06 0.06 0.09 0.01 0.04
ND
0.08 0.01 0.13 0.0 1 0.04 0.02 0.04 0.07 0.03 0.02 0.07
0.60 0.32 0.62 0.56 0.76 0.39 0.77 0.60
0.55 0.55 0.37 0.34 0.34 0.32 0.36 0.60 0.32 0.56 0.36 0.37
0.48
0.38 0.42 0.54 0.63 0.50 0.52
R2.
upon heteroduplex mapping of rDNA repeats of the Oregon R strain, DAWID and co-workers determined that approximately 50% of the rDNA units on the X chromosome contained R1 insertions, and 15% con- tained R2 insertions (DAWID, WELLAUER and LONG 1978; WELLAUER and DAWID 1978; WELLAUER, DAWID and TARTOF 1978). The fraction of the rDNA repeats containing RI and R2 determined here for the Oregon R strain agreed with these numbers: 52% R1 (R1 alone plus double inserted) and 17% R2 (R2 alone plus double inserted). However, the insertion frequencies found for Oregon R are clearly not rep- resentative of all strains of D. melanoguster. The data in Table 3 are presented as a frequency distribution for the total fraction of rDNA containing R1 elements (R1 alone and R1/R2 double inserts) in Figure 3A, and as a frequency distribution for the total fraction of rDNA containing R2 elements (R2 alone and R1/ R2 double inserts) in Figure 3B. The range in R1 insertion frequency varied fourfold, from 17 to 67% of the 28s rRNA genes with an average of 38%. The range of R2 insertions varied over 10-fold, from 2 to 28% of the 28s genes with an average of 16%. The total percentage of rDNA inserted with R1 and/or R2 varied from 32 to 77%.
Represents fraction of rDNA containing R1 alone and R1 +
Turnover of R1 and R2 135
A 'I '701 .MI . '
Fraction inurtad by R1
B l o r
. o s . ~ o . ~ s z o ~ a ~ a s . 4 o . ~ . 5 o . ~ . 6 o . ~ . 7 o . 7 ~
Fnctlon imrtad by R2
FIGURE 3,"Frequency distribution of R1 (A) and R2 (B) in the rDNA of the X chromosomes of D. melanogaster strains. Values plotted on the x-axis represent the sum of the fraction of rDNA repeats with single insertions of the indicated element and the fraction with double insertions of R1 and R2, derived from Table 3.
The differences in insertion frequency illustrated in Table 3 were most pronounced between strains from different locales. Among the Kenyan strains, less variation in insertion frequency was seen between lines that were collected from the same site (indicated in Table 3 by identical date designations) than among lines collected from different sites in Kenya. We have also determined the variation within individual strains. DNA was isolated from 12 individual females from both the Oregon R and France V2-1 strains and the level of R1 and R2 quantitated. Within experi- mental error, the fraction of the rDNA repeats in- serted with R1 and/or R2 was identical in each female from a strain suggesting little variation within the inbred lines (data not shown).
The percentage of rDNA repeats doubly inserted with R1 and R2 ranged from 0 to 16%, with an average of 6%. This value is identical to the value predicted if most of the double inserts represented the independent insertion of R1 and R2 elements into 28s genes regardless of whether that gene already contained the other insertion [0.38 (mean level of R1) X 0.16 (mean level of R2) = 0.06 (mean level doubly inserted)]. This similarity between the observed and
0 ' .10 .20 3 0
Fraction in6Med by R2
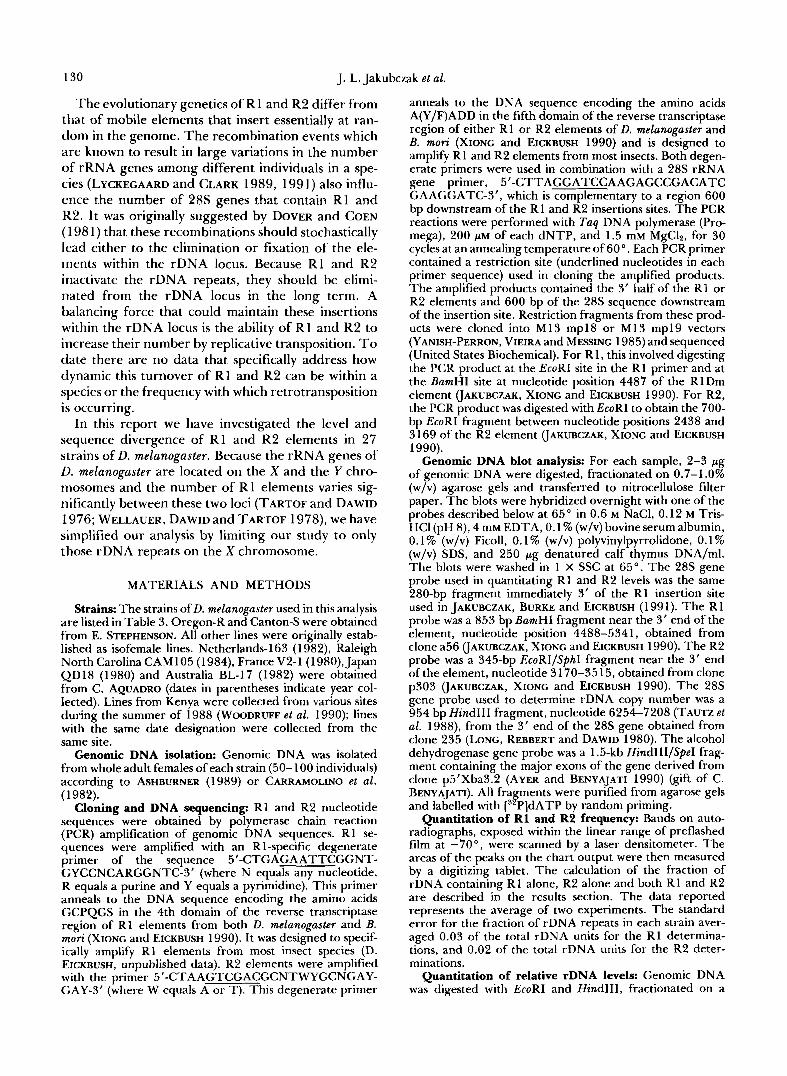
FIGURE 4.-Relationship between fraction of rDNA repeats that contain R 1 insertions and the fraction of rDNA repeats that contain R2 insertions. Graph represents data for 25 strains. Values plotted represent the sum of the fraction of rDNA repeats with single insertions of that element and the fraction with double insertions of R1 and R2, derived from Table 3.
predicted levels of double insertions was found for most of the strains (20 of 25). Only two strains (Canton S and Kenya 6/9/88#2) had a higher level of double insertions than what would be predicted (see Table 3), and only three strains (France V2-1, Kenya 7/30/ 88#1, Kenya 7/8/88#3) had a lower than predicted level of double insertions. Thus the fraction of 28s genes containing both elements is close to that ex- pected for random selection of 28s genes during integration, indicating that Rl and R2 exhibit neither an inhibition of nor preference for insertion into a 28s gene already containing the other type of ele- ment. It also suggests that the unequal crossover events expanding and contracting the number of re- peats are not substantially biased by the presence of either or both insertions.
Two factors contribute to the variation in the frac- tion of rDNA units containing R1 or R2 elements: retrotransposition and recombination events between rDNA repeats. If both of these events occur randomly, then the fraction of the repeats occupied by R 1 would be expected to vary independently of the fraction occupied by R2 elements. A plot of the fraction of rDNA containing R1 insertions vs. the fraction of rDNA containing R2 insertions is shown in Figure 4. There is no statistical correlation between the inser- tion frequencies of R1 and R2 elements (R2 = 0.031). Thus the mechanisms responsible for generating the frequency distributions for R1 and R2 (unequal cross- overs and retrotransposition) appear to be acting in- dependently on each element.
Relationship between R1 and R2 insertion fre- quencies and rDNA copy number: The number of rDNA units per haploid genome can vary five- to sixfold in wild-type strains of D. melunoguster (LYCKE- GAARD and CLARK 1989, 199 1). Because R1 and R2 elements inactivate the rDNA units, it might be as- sumed that those strains with the highest insertion percentages also contained higher numbers of rDNA
136 J. L. Jakubczak et al.
2.0 3.01 . . . .. . , .
” - .
. . m . - =.. . . . ’
600
] 400
0 s 200 2
D a
100 3 c
F 60
0.2 - 30 .40 .SO 60 .70 .EO
Fraction inserted by R1 and/or A2
FIGURE 5.-Relationship between the fraction of rDNA contain- ing R1 and R2 and rDNA copy number. Values on the left-hand y- axis represent ratios in hybridization intensity between a rDNA probe and an Adh probe (see MATERIALS AND METHODS). Values on the right-hand y-axis represent estimated rDNA copy number based on their being approximately 200 rDNA genes per haploid genome in D. melanogaster (HAWLEY and MARCUS 1989). Graph represents data for 22 lines. The dotted line illustrates, at a given rDNA level, the insertion frequency at which there are 40 functional (unin- serted) rDNA repeats.
units in order to compensate for the loss of functional units. T o determine whether there was a correlation between rDNA copy number and R1 and R2 insertion frequency, the relative rDNA copy number was cal- culated from genomic blots for twenty of the D. mel- anogaster strains by comparing the intensity of an rDNA probe with that of a single copy DNA sequence. Genomic DNA was digested with Hind111 and EcoRI, blotted and hybridized with two probes simultane- ously, a 28s probe and an alcohol dehydrogenase gene (Adh) probe (see MATERIALS AND METHODS). The ratio between the intensity of the 28s gene band and the Adh band, measured from autoradiographs by laser densitometery, represented the relative rDNA con- tent for that strain. These ratios were then normalized to 1 .O and plotted against the total fraction of rDNA containing R1 and/or R2 in each strain.
As shown in Figure 5, a fivefold variation in rDNA copy number was detected among the strains tested. Surprisingly, those strains with the highest frequency of R1 and R2 did not correspond to those lines with the highest number of rDNA repeats. There was no statistical correlation between the relative rDNA lev- els and total R1 and R2 insertion frequency (R2 = 0.007). It should be noted, however, that only those strains with the lowest insertion frequency had a broad range of rDNA copy numbers. The 12 strains with the highest insertion frequency had only a twofold range in rDNA copy number. Further discussion of the absence of strains with high R1 and R2 insertion frequencies and either very high or very low total rDNA copy number will be presented in the DISCUS-
The use of 5’ truncations to monitor the turnover SION.
of R1 and R2: The variation in the insertion frequen- cies of R1 and R2 among strains does not by itself indicate how quickly the elements are turning over in the rDNA locus. The ability to trace individual copies of R1 and R2 among different strains would provide additional data necessary to better estimate these turn- over rates. Individually marked R1 and R2 elements do exist in each strain as naturally occurring restric- tion fragment length polymorphisms between differ- ent copies of R1 and of R2. A significant fraction of both R1 and R2 elements of D. melanogaster contain 5’ truncations (LONG, REBBERT and DAWID 1980; ROIHA et al. 1981; DAWID and REBBERT 198 1 ; JAK- UBCZAK, XIONG and EICKBUSH 1990). No mechanism is known whereby these 5‘ truncations could be gen- erated by recombination between rDNA repeats. Rather R1 and R2 are believed to generate these 5’ truncations during retrotransposition, as do most other members of the non-LTR group of retrotrans- posons (reviewed in HUTCHISON et al. 1989). These 5’ truncations are believed to result from reverse transcriptase (polymerizing from the 3’ end of the RNA transcript to the 5‘ end) incompletely convert- ing the RNA genome into DNA. We have utilized these 5’ truncated copies of R1 and R2 as restriction fragment length polymorphisms, to study the turn- over of R 1 and R2 elements within the rDNA repeats.
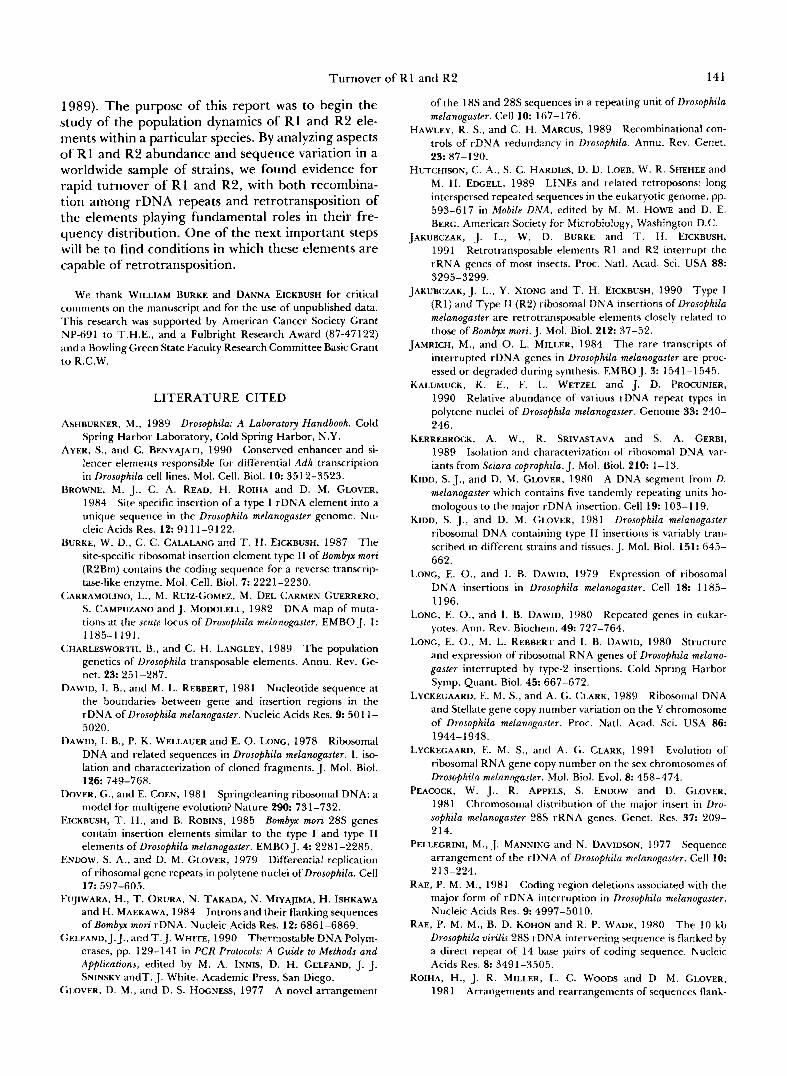
Truncated copies of R1 and R2 were visible on long autoradiographic exposures of the same genomic blots used to determine the level of R1 and R2 insertions in Figure 1B. As described for the experiments in Figure 1, ClaI + EcoRI digestion of genomic DNA resulted in a 1.0-kb band representing R2 elements and a 2.2-kb band representing uninserted rDNA repeats. Full-length and 5’ truncated R1 elements were represented by bands between 2.2 and 7.5 kb, the exact length of which was dependent upon the degree of 5’ truncation. Examples of such blots from 12 different strains are shown in Figure 6A. T o reveal the pattern of truncated copies of R2 elements present within a strain, ClaI + BamHI digestions were used to reduce all R1 elements to a 0.6-kb band, leaving the full-length and 5’ truncation pattern of the R2 ele- ments visible as bands between 2.2 and 5.8 kb (Figure 6B). Rehybridization of the blot in Figure 6B with the probe from the 3’ end of the R2 element used in Figure 2A, confirmed that the bands greater than 2.2 kb represent 5’ truncated versions of R2 and not simply restriction site polymorphisms in the 28s genes (data not shown). A similar experiment, using an R1 probe, could not be conducted with the blot in Figure 6A because of cross-hybridization of this probe with the many divergent copies of R1 elements present in the chromocenter (see Figure 7).
It is clear from the genomic blots in Figure 6, A and B, that the truncated copies correspond to a wide
Turnover of R1 and R2 137
A A B C D E F G H I J K L
4 4 - I 1 truncated
23 - 2 0 - c uninseRe
B A B C D E F G H I J K L
66kb- c R2
FIGURE 6.-5’ truncation pattern of R1 and R2 elements within the rDNA repeats of different strains. Genomic DNA was digested with either ClaI + EcoRI (A) or Clal + BamHI (B) and hybridized with the 28s gene probe illustrated in Figure 1A. (A) 5’ truncations o f R1. (B) 5’ truncations of R2. Lane A, Oregon R; B, Canton S ; C. Netherlands 163; D, Raleigh NC CAM 105; E. France V2-1; F, Japan QD18; G . Australia BL-17; H, Kenya 7/9/88#3; I , Kenya 7/ 15/88#4; J, Kenya 7/21/88b#1; K, Kenya 5/15/88a; L, Kenya 6/ 9/88#9.
variety of length classes. The only band present in all lanes in Figure 6A was 6.4 kb in length and this represented double inserted repeats containing R2 and full length R1. Each strain had a large number of truncated elements which we estimate for most strains corresponds to at least 50% of the total number of elements. In a few strains (for example Figure 6B, lane K) over 90% of the R2 elements were truncated. On the other hand, no strain was found that did not contain at least one full-length R1 and R2 element. Except for a few cases described below, no attempt has been made to more accurately quantitate the fraction of truncated R1 and R2 in each strain due to the difficulty in quantitating the hybridization in a series of diffuse bands.
Each strain shown in Figure 6 had a distinctive 5’ truncation pattern for its R1 and R2 elements. Differ- ences in these 5’ truncation patterns were most pro- nounced in comparisons between strains from differ- ent geographic locales. There was more similarity among the Kenyan strains than to the highly distinct patterns seen in each of the other geographical strains. Patterns of 5’ truncation among Kenyan strains col- lected from the same site showed even less variation (data not shown). Little variation appears to be present within the strains. The 5’ truncation patterns were determined for individual flies from two strains, Or- egon R and France V2-1. Little or no differences were
seen in the pattern of 5’ truncations or the intensity of any single band (data not shown).
Using the values for the total number of rDNA repeats (determined as in Figure 5) and the fraction that is inserted with R1 and R2 elements (determined as in Table 3), it was possible to estimate the number of R1 and R2 insertions in each strain. In some strains, comparison of the number of R 1 or R2 elements with its 5’ truncation profile (Figure 6) enabled us to more accurately estimate the number of full-length and 5’ truncated copies in that strain. This was particularly true for the R2 insertions because of the lower num- ber of copies in most strains. For example, the X chromosomes in the Japanese strain contained on average only three R2 elements. As can be seen in Figure 6B, lane F, this corresponds to two full-length and one truncated element. The X chromosomes in the French strain contained approximately 18 R2 elements. Based on the genomic blot in Figure 6B, lane E, this corresponds to 6 copies truncated by different lengths (bands from 2.6 to 5.6 kb of approx- imately equal intensity) and approximately 12 full- length elements. Because the same amount of genomic DNA was loaded in each lane in Figure 6B, those bands in the other lanes that are similar in intensity to the truncated bands in lanes E and F can also be assumed to correspond to one copy per X chromo- some. Bands of higher intensity represent multiple copies expanded by recombination and bands of weaker intensity represent copies present on only a fraction of the X chromosomes in the strain.
In the case of the R1 truncations (Figure 6A), the large number of elements present per chromosome (average 80) makes it more difficult to visualize which bands correspond to individual truncated copies. The bands in Figure 6A corresponding to individual trun- cated copies form a diffuse smear in most strains (the exposure time of Figure 6A is only one-third that of Figure 6B). All bands clearly visible in the smear represent multiple truncated copies of the same length, probably expanded in number by recombina- tions.
The most striking result from the genomic blots shown in Figure 6 was the diversity of truncated copies of R1 and R2 present in each strain and the qualita- tive, not just quantitative, differences in the pattern of 5‘ truncations for many strains. Although the turn- over of full-length elements cannot be measured on the genomic blots shown in Figure 6, we assume their rate of elimination from the rDNA locus by unequal crossovers would be similar to that of the truncated copies. The analysis of truncated copies is thus the strongest data indicating a rapid turnover of R1 and R2 elements within the rDNA locus. R1 elements in the chromocenter: All R2 elements
of D. melunoguster are present in the rDNA locus
138 J. L. Jakubclak et al.
A B C D E F
4.4 kb - .-."-
1.1 - . . 14
FIGURE 7.-RI elements inserted outsidr of the rDNA repeats of different strains. Genomic DNA was digested with Clal + Psi1 + KroRI and hybridized to the 900-bp RamHI fragment of the R1 element (see Figure 1 A). The ma-jor 1.7-kh hybridizing band r e p resents R1 elements within the rDNA repeats. Lane A, Oregon R; 13, France V2-1; C, Raleigh North Carolina CAM105; D. Japan Q D I 8; E, Kenya 7/9/88#3; F, Kenya 7/15/88#4.
(LONG, RERRERT and DAWID 1980; see also the CfoI digestion in Figure 2B). However in the case of R1, a significant number of elements have been found out- side of the rDNA in the chromocentric heterochro- matin (KIDD and GLOVER 1980; PEACOCK et al . 198 l), and a highly truncated element has been found in the euchromatin of chromosome 4 (BROWNE et al. 1984). The chromocentric R1 elements that have been char- acterized to date are arranged in a tandem head to tail array with a short 28s gene sequence between each element (KIDD and GLOVER 1980; ROIHA et a l . 198 1). We have attempted to analyze the chromocen- tric R1 elements in a number of strains to determine if these chromocentric elements could serve as a source of elements generating copies for insertion into the rDNA repeats.
Genomic DNA from a number of different strains was digested with three restriction enzymes (ClaI, PstI and EcoRI), blotted, and hybridized with the 0.9-kb Ram H 1 fragment from the 3' end of R1 (see Figure 1A). An example of the results is shown in Figure 7. In each strain the most intensely hybridizing fragment was the 1.7-kb band corresponding to the PstIIClaI fragment of R1 elements located in the rDNA repeats (see Figure 1A). In each strain there was also a large number of weaker hybridizing bands ranging from about 1.1 to 3.5 kb. T o confirm that most of these weaker bands represented R1 elements not in the rDNA, the blot in Figure 7 was rehybridized with the 28s gene probe as described in Figure 1A (data not shown). In addition to the 1.7-kb band, a few bands between 2.5 and 3.1 kb also hybridized to the 28s gene probe. These bands are of an appropriate length to represent R1 elements in the 28s genes that were 5' truncated before the PstI site at the 3' end of the element. Therefore, most of the bands in Figure 7
other than the 1.7-kb band represent R1 elements located outside of the rDNA repeats. Precise deter- mination of the number of copies of R1 in the chrom- ocenter relative to the rDNA was difficult because of this level of restriction site polymorphism; however, we estimate that all strains tested had between 50 and 100 copies of R1 elements present outside the rDNA repeats. This value is similar to what has been re- ported for Oregon R by in situ analysis (PEACOCK et al . 198 1 ; ROIHA et al . 198 1). The pattern of restriction site polymorphisms among the chromocentric R1 ele- ments shown in Figure 7 were quite similar among the different strains. This similarity in number and restriction site polymorphisms suggests that these chromocentric R1 elements are not subject to rapid turnover by recombination.
Finally, using the 0.9-kb BamHI fragment of the R1 as a hybridization probe, we have tested a number of additional restriction enzymes that generate frag- ments near the 3' end of the R1 elements (data not shown). The R1 elements in the chromocenter con- tained extensive restriction fragment length polymor- phisms for all restriction enzymes tested, suggesting that compared to the R1 elements within the rDNA repeats they represented relatively old copies that have accumulated extensive sequence changes. Con- sistent with this suggestion, the nucleotide sequence of the 5' and 3' ends of one of these chromocentric R1 elements (ROIHA et al . 1981) contained 4.6% nu- cleotide sequence divergence from R1 elements in- serted in the rDNA repeats. It seems unlikely that these highly divergent chromocentric R1 elements could represent a source of R1 elements for insertion into the rDNA repeats. This is in agreement with the data from B. mori in which all non-28s R1 insertions have been sequenced and shown to be defective (XIONG et a l . 1988).
DISCUSSION
Nucleotide sequence comparisons of R1 and R2 elements from B. mori and D. melanogaster revealed open reading frames encoding a series of highly con- served amino acid motifs typical of gag-like and pol- like proteins (JAKURCZAK, XIONG and EICKRUSH 1990). These same motifs have also been identified in the R 1 and R2 elements of Hymenopteran and Coleopteran species (JAKURCZAK, BURKE and EICKRUSH 1991; B. BURKE and D. EICKRUSH, unpublished data). This history of selection on R1 and R2 at the protein level indicates that these elements have remained active for long periods of time in many insect lineages. On a shorter evolutionary time scale, sequence analysis of R1 and R2 elements from multiple species within the melanogaster subgroup of Drosophila has indicated that the ratio of synonymous to replacement substi- tutions within the protein encoding regions of the
Turnover of R1 and R2 139
elements is approximately 3: 1, again suggesting strong selection on the expressed proteins (D. EICKBUSH and T . EICKBUSH, unpublished data). Thus it would appear that the only R1 and R2 elements that survive in an insect lineage over the long term are those that are capable of retrotransposition. However, this data pro- vides no information on the frequency with which the elements are transposing.
Turnover of R1 and R2: Analysis of the X chro- mosomes of 27 strains of D. melanogaster revealed that the fraction of the rDNA repeats inserted with R1 elements varied from 17 to 67%, and the fraction inserted with R2 elements varied from 2 to 28%. Because the absolute number of rDNA units on the X chromosomes of these strains also varied nearly five- fold, the actual number of elements on the X chro- mosomes of each strain ranged from approximately 14 to 150 R1 elements and 3 to 60 R2 elements. This dynamic expansion and contraction in numbers of elements suggests that R1 and R2 elements turnover rapidly. Rapid turnover is also consistent with the uniformity in nucleotide sequence among different copies of each element. The average nucleotide se- quence divergence among R1 elements and among R2 elements from three sources, Oregon R, a Japa- nese strain and a Kenyan strain, was no greater than 0.6%. N o copies of R1 or R2 in the rDNA were found that were significantly divergent in sequence. Thus unless the presence of these elements in the rDNA of melanogaster is a recent phenomenon, they are evolv- ing in a highly concerted manner, most likely as a result of the recombinational forces that give rise to the concerted evolution of the 28s gene themselves.
Perhaps one of the most revealing aspects of the presence of R1 and R2 elements in D. melanogaster is the large numbers of 5’ truncated copies (LONG, REBBERT and DAWID 1980; ROIHA et al. 198 1 ; DAWID and REBBERT 198 1; JAKUBCZAK, XIONG and EICKBUSH 1990). It is unlikely that these truncated copies are capable of retrotransposition since they do not contain the sequences encoding the amino terminal end of the open reading frame and probably lack the appropriate signals for transcription initiation or processing. The original studies with Oregon R (reviewed in LONG and DAWID 1980) suggested that there were a number of different size classes, but it was not known whether the same size classes were typical of insertions in all strains. If these presumably nonfunctional elements can be stably maintained in the rDNA locus, then it would suggest that transposition of R1 and R2 is not required to explain their presence in the rDNA re- peats. We have previously shown that these truncated copies have not accumulated significant mutational changes (JAKUBCZAK, XIONC and EICKBUSH 1990). However it is not possible to distinguish whether the absence of mutations is a result of concerted evolution
among stably maintained elements generated in the distant past or whether these truncated elements have more recently been generated. Our analysis in this report indicates that truncated copies of R1 and R2 are not stably maintained in the rDNA locus. All strains have a continuous range of 5‘ truncated sizes and the pattern of these truncations is qualitatively different among the geographical strains. AS ex- pected, the patterns of 5’ truncations were signifi- cantly more similar among strains derived from the same Kenyan locale.
It is impossible to extrapolate how long ago these truncated elements were generated. However, the complexity of the patterns, and that fact that many of these truncated elements appear to be present at only one copy per genome suggests that a significant frac- tion of these truncations have been generated recently ( i . e . , there has been insufficient time for recombina- tion to either expand the copies to higher numbers or eliminate them from the locus). Because new length variants cannot be generated by recombination be- tween preexisting length variants, our data suggests that the retrotransposition events which did generate these 5’ truncations occurred recently. We have not been able to obtain evidence for transpositions within a strain while it has been maintained within the labo- ratory 0. JAKUBCZAK and S. Kos, unpublished obser- vations). Thus we have no direct evidence that the R1 and R2 elements within any strains are active. We are currently attempting to detect transposition in crosses between laboratory maintained strains by using higher resolution genomic blots that will enable us to better resolve and quantitate the individual truncated copies of R1 and R2. R1 and R2 act independently: Based on the orga-
nization and sequence of their open reading frames and the nature of the cleavage of their target site, R1 and R2 are no more similar to each other than they are to any other non-LTR retrotransposable element ( JAKUBCZAK, XIONG and EICKBUSH 1990). Indeed, based on the sequence of their reverse transcriptase domains, R1 elements are most similar to ingi of Trypanosoma brucei, while R2 elements are more sim- ilar to LINE 1 elements of mammals, Cin4 of maize and T x l of Xenopus Zaevis (XIONG and EICKBUSH 1988b). The data in this report suggest that even though R1 and R2 are inserting in the same set of genes, they are behaving independently of one an- other. The fraction of rDNA units inserted with R1 varied independently of the fraction inserted with R2 (Figure 4). We also found that the level of rDNA units doubly inserted with both R1 and R2 was similar to that predicted from the frequency of single insertions. If one assumes equal rates of recombination between rDNA repeats containing either R1 or R2 insertions, then R1 and R2 exhibit neither an inhibition of nor
140 J. L. Jakubczak et al.
preference for insertion into a 28s gene already con- taining the other type of element. Thus R1 and R2 are not in competition with each other for rDNA units, which may explain why both elements can be found in many of the same species ( JAKUBCZAK, BURKE and EICKBUSH 1991). If recombination rates between rDNA repeats containing either R1 or R2 insertions are equal, then in D. melanogaster, the higher levels of R1 would suggest that R1 insertions occur at twice the rate of R2 elements, while in B. mori, where R1 and R2 are present at more equivalent levels, the elements may retrotranspose at similar rates (XIONG et al. 1988).
Phenotypic effects of R1 and R2: From 32 to 77% of the total rDNA repeats of D. melanogaster were found to be inserted with R1 and/or R2. It might be assumed that those strains with the highest levels of insertion would be selected to compensate for the loss of functional repeats by having higher numbers of rDNA repeats. However, as shown in Figure 5, those strains with the highest levels of insertion did not have an increased number of rDNA units. A similar conclu- sion has been obtained by LYCKECAARD and CLARK (1 99 1). Using quantitative hybridizations to genomic DNA on slot blots to determine absolute copy num- bers of rDNA and R1, they found that in a single population of D. melanogaster the proportion of rDNA repeats with R1 insertions did not vary with rDNA copy number. This is not to say that there is no evidence for selection on the level of R1 and R2 elements. It can be noted in Figure 5 that only those strains with the lowest insertion frequency had a broad range of rDNA copy numbers. The 12 strains with the highest insertion frequency had a very narrow range in rDNA copy number. Given the stochastic process of expansion and contraction in the number of rDNA repeats, one might predict that flies with high levels of R1 and R2 insertions and either very high or very low total number of rDNA repeats should occasionally be generated in natural populations. The absence of strains with both high rDNA copy numbers and high insertion frequencies could be a result of either the loss of control over retrotransposition due to the hundreds of potentially active elements in each cell, or an increase in recombination leading to the loss of units.
The absence of strains with low rDNA copy num- bers and high insertion frequency can be more easily explained by selection against chromosomes with low numbers of uninserted rDNA genes. The dotted line in Figure 5 indicates 40 uninserted rDNA units per haploid genome at a given insertion frequency and rDNA copy number; this appears to be a lower limit to the number of uninserted rDNA repeats. For com- parison, it is generally accepted (reviewed in HAWLEY and MARCUS 1989) that in the bobbed mutation of D.
melanogaster severe phenotypes are exhibited by flies with a total of 90-1 10 rDNA units (45-55 per hap- loid). Because, the determination of rDNA copy num- ber in these studies frequently did not control for the fraction of the rDNA units that were inserted with R1 or R2, the actual number of functional rDNA units necessary to avert the bobbed phenotype is smaller. Five of the 27 strains we analyzed had unin- serted rDNA levels near 40, suggesting that a signifi- cant fraction of D. melanogaster strains have near the minimal number of uninserted repeats needed to avoid the bobbed phenotype.
T o this point, our discussion of the dynamics of R1 and R2 within the rDNA units has been based on the assumption that these elements are selfish genetic elements whose presence can have a negative effect on the fitness of the host. It is important to note in this regard the work of TEMPLETON et al. (1 988) on the abnormal abdomen ( a a ) syndrome in Drosophila mercatorum. The phenotype of this syndrome is similar to that of bobbed and is correlated with increased levels of a single class of ribosomal insertion in polytene tissues. The syndrome is more frequent in populations when slow growth rates are favored. The syndrome is dependent upon both the level of insertions and the allele present at the aa locus, which controls the underreplication of inserted rDNA units in polytene tissues. We have recently shown that the ribosomal insertion in D. mercatorum is an R1 element (M. ZENNI and D. EICKBUSH, unpublished data). These findings are important to our understanding of the population genetics of R1 and R2 for two reasons. First, the analysis of R1 elements in D. mercatorum clearly dem- onstrates the phenotypic effect rDNA insertions can have on natural populations of Drosophila. Second, they represent a mechanism by which a selective ad- vantage could maintain an element within the rDNA repeats of a species in the absence of retrotransposi- tion. We have determined the nucleotide sequence of portions of an R1 element from D. mercatorum and found that it retains the highly conserved open read- ing frames found in all other sequenced R1 elements (B. BURKE and T . EICKBUSH, unpublished data). Thus there is no evidence to suggest at present that the R1 elements in this species have lost their ability to retro- transpose.
In conclusion, the location of R1 and R2 within the 28s genes subjects these elements to the recombina- tional forces at work in the concerted evolution of the rRNA genes themselves. These forces can rapidly amplify and eliminate copies of R 1 and R2 completely independent of their ability to retrotranspose. R1 and R2 are thus subject to different population genetic parameters than those of transposable elements in- serting in widespread locations throughout the ge- nome (reviewed in CHARLESWORTH and LANGLEY
Turnover of R1 and R 2 141
1989). The purpose of this report was to begin the study of the population dynamics of R1 and R2 ele- ments within a particular species. By analyzing aspects of R1 and R 2 abundance and sequence variation in a worldwide sample of strains, we found evidence for rapid turnover of R1 and R2, with both recombina- tion among rDNA repeats and retrotransposition of the elements playing fundamental roles in their fre- quency distribution. One of the next important steps will be to find conditions in which these elements are capable of retrotransposition.
We thank WILLIAM BURKE and DANNA EICKBUSH for critical comments on the manuscript and for the use of unpublished data. This research was supported by American Cancer Society Grant NP-691 to T.H.E., and a Fulbright Research Award (87-47122) and a Bowling Green State Faculty Research Committee Basic Grant t o R.C.W.
LITERATURE CITED
ASHBURNER, M., 1989 Drosophila: A Laboratory Handbook. Cold Spring Harbor Laboratory, Cold Spring Harbor, N.Y.
AYER, S., and C. BENYAJATI, 1990 Conserved enhancer and si- lencer elements responsible for differential Adh transcription in Drosophila cell lines. Mol. Cell. Biol. 10: 3512-3523.
BROWNE, M. J., C. A. READ, H. ROIHA and D. M. GLOVER, 1984 Site specific insertion of a type I rDNA element into a unique sequence in the Drosophila melanogaster genome. Nu- cleic Acids Res. 12: 91 11-9122.
BURKE, W. D., C. C. CALALANG and T. H. EICKBUSH, 1987 T h e site-specific ribosomal insertion element type I1 of Bombyx mori (R2Bm) contains the coding sequence for a reverse transcrip- tase-like enzyme. Mol. Cell. Biol. 7: 2221-2230.
S. CAMPUZANO and J. MODOLELL, 1982 DNA map of muta- tions at the scute locus of Drosophila melanogaster. EMBO J. 1:
CHARLESWORTH, B., and C. H. LANGLEY, 1989 T h e population genetics of Drosophila transposable elements. Annu. Rev. Ge- net. 23: 251-287.
DAWID, I . B., and M. L. REBBERT, 1981 Nucleotide sequence at the boundaries between gene and insertion regions in the rDNA of Drosophila melanogaster. Nucleic Acids Res. 9 501 1 - 5020.
DAWID, I . B., P. K. WELLAUER and E. 0. LONG, 1978 Ribosomal DNA and related sequences in Drosophila melanogaster. I . iso- lation and characterization of cloned fragments. J. Mol. Biol. 126 749-768.
DOVER, G., and E. COEN, 1981 Springcleaning ribosomal DNA: a model for multigene evolution? Nature 290: 731-732.
KICKBUSH, T. H., and B. ROBINS, 1985 Bombyx mori 28s genes contain insertion elements similar to the type I and type I1 elements of Drosophila melanogaster. EMBO J. 4: 2281-2285.
ENDOW, S. A., and D. M. GLOVER, 1979 Differential replication of ribosomal gene repeats in polytene nuclei of Drosophila. Cell 17: 597-605.
FUJIWARA, H., T. ORURA, N. TAKADA, N. MIYAJIMA, H. ISHKAWA and H. MAEKAWA, 1984 Introns and their flanking sequences of Bombyx mori rDNA. Nucleic Acids Res. 12: 6861-6869.
C,ELFAND, J. J., and T. J. WHITE, 1990 Thermostable DNA Polym- erases, pp. 129-1 41 in PCR Protocols: A Guide to Methods and Applications, edited by M. A. INNIS, D. H. GELFAND, J. J. SNINSKY andT. J . White. Academic Press, San Diego.
(:ARRAMOLINO, L., M. RUIZ-GOMEZ, M. DEL CARMEN GUERRERO,
1185-1 191.
GLOVER, D. M., and D. S. HOGNE~S, 1977 A novel arrangement
of the 18s and 28s sequences in a repeating unit of Drosophila melanogaster. Cell 10: 167-176.
HAWLEY, R. S., and C. H. MARCUS, 1989 Recombinational con- trols of rDNA redundancy in Drosophila. Annu. Rev. Genet. 23: 87-120.
HUTCHISON, C. A,, S. C. HARDIES, D. D. LOEB, W. R. SHEHEE and M. H. EDGELL, 1989 LINES and related retroposons: long interspersed repeated sequences in the eukaryotic genome, pp. 593-617 in Mobile DNA, edited by M. M. HOWE and D. E. BERG. American Society for Microbiology, Washington D.C.
JAKUBCZAK, J. L., W. D. BURKE and T . H . EICKBUSH, 1991 Retrotransposable elements R1 and R2 interrupt the rRNA genes of most insects. Proc. Natl. Acad. Sci. USA 88:
JAKUBCZAK, J. L., Y. XIONG and T . H . EICKBUSH, 1990 Type I (RI) and Type I 1 (R2) ribosomal DNA insertions of Drosophila melanogaster are retrotransposable elements closely related to those of Bombyx mori. J. Mol. Biol. 212: 37-52.
JAMRICH, M., and 0. L. MILLER, 1984 The ra re transcripts of interrupted rDNA genes in Drosophila melanogaster are proc- essed or degraded during synthesis. EMBO J. 3: 154 1-1 545.
KALUMUCK, K. E., F. L. WETZEL and J. D. PROCUNIER, 1990 Relative abundance of various rDNA repeat types in polytene nuclei of Drosophila melanogaster. Genome 33: 240- 246.
KERREBROCK, A. W., R. SRIVASTAVA and S. A. GERBI, 1989 Isolation and characterization of ribosomal DNA var- iants from Sciara coprophila. J. Mol. Biol. 210: 1-13.
KIDD, S. J., and D. M. GLOVER, 1980 A DNA segment from D. melanogaster which contains five tandemly repeating units ho- mologous to the major rDNA insertion. Cell 1 9 103-1 19.
KIDD, S. J., and D. M. GLOVER, 1981 Drosophila melanogaster ribosomal DNA containing type I 1 insertions is variably tran- scribed in different strains and tissues. J. Mol. Biol. 151: 645- 662.
LONG, E. O., and 1. B. DAWID, 1979 Expression of ribosomal DNA insertions in Drosophila melanogaster. Cell 18: 1185- 1196.
LONG, E. O., and I . B. DAWID, 1980 Repeated genes in eukar- yotes. Ann. Rev. Biochem. 49: 727-764.
LONG, E. O., M. L. REBBERT and I . B. DAWID, 1980 Structure and expression of ribosomal RNA genes of Drosophila melano- gaster interrupted by type-2 insertions. Cold Spring Harbor Symp. Quant. Biol. 45: 667-672.
LYCKEGAARD, E. M. S., and A. G. CLARK, 1989 Ribosomal DNA and Stellate gene copy number variation on the Y chromosome of Drosophila melanogaster. Proc. Natl. Acad. Sci. USA 86:
LYCKEGAARD, E. M. S., and A. G. CLARK, 1991 Evolution of ribosomal RNA gene copy number on the sex chromosomes of Drosophila melanogaster. Mol. Biol. Evol. 8: 458-474.
PEACOCK, W. J., R. APPELS, S. ENDOW and D. GLOVER, 1981 Chromosomal distribution of the major insert in Dro- sophila melanogaster 28s rRNA genes. Genet. Res. 37: 209- 214.
PELLEGRINI, M., J. MANNING and N. DAVIDSON, 1977 Sequence arrangement of the rDNA of Drosophila melanogaster. Cell 1 0 21 3-224.
RAE, P. M. M., 1981 Coding region deletions associated with the major form of rDNA interruption in Drosophila melanogaster. Nucleic Acids Res. 9: 4997-5010.
RAE, P. M. M., B. D. KOHON and R. P. WADE, 1980 The 10 kb Drosophila uirilis 28.5 rDNA intervening sequence is flanked by a direct repeat of 14 base pairs of coding sequence. Nucleic Acids Res. 8: 3491-3505.
ROIHA, H., J. R. MILLER, L. C. WOODS and D. M. GLOVER, 1981 Arrangements and rearrangements of sequences flank-
3295-3299.
1944-1948.
142 J. L. Jakubczak et al.
ing the two types of rDNA insertion in D. melanogaster. Nature 290: 749-753.
SAIKI, R. K. , D. H. GELFAND, S. STOFFEL, S. J. SCHARF, R. HIGUCHI, G . T. HORN, K. B. MULLIS and H. A. ERLICH, 1988 Primer- directed enzymatic amplification of DNA with a thermostable DNA polymerase. Science 2 3 9 487-491.
SMITH, V. L., and K. BECKINGHAM, 1984 The intron boundaries and flanking rRNA coding sequences of Calliphora erythroce- phala rDNA. Nucleic Acids Res. 12: 1707-1724.
TARTOF, K. D., and I. B. DAWID, 1976 Similarities and differences in the structure of X and Y chromosome rRNA genes of Drosophila. Nature 263: 27-30.
T A U T Z . D., J. M. HANCOCK, D. A. WEBB, C. TAurZ and G. A. DOVER, 1988 Complete sequences of the rRNA genes of Dro- sophila melanogaster. Mol. Biol. Evol. 5: 366-376.
TEMPLETON, A. R., H. HOLLOCHER, S. LAWLER and J. S. JOHNSTON,
1989 Natural selection and ribosomal DNA in Drosophila. Genome 31: 296-303.
WEILAUER, P. K . , and I . B. DAWID, 1977 The structural organi- zation of ribosomal DNA in Drosophila melanogaster. Cell 10: 193-212.
WELLAUER, P. K . , and I . B. DAWID, 1978 Ribosomal DNA in Drosophila melanogaster. 11. Heteroduplex mapping of cloned and uncloned rDNA. J . Mol. Biol. 126: 769-782.
WELLAUER, P. K., I . B. DAWID and K. D. TARTOF, 1978 X and Y chromosomal ribosomal DNA of Drosophila: comparison of spacers and insertions. Cell 14: 269-278.
WHITE, K. L., and D. S. HOGNESS, 1977 R loop mapping of the
18s and 28s sequences in the long and short repeating units of Drosophila melanogaster rDNA. Cell 10 177-192.
WOODRUFF, R. C., J. N. THOMPSON, JR., H. N. B. GOPALAN, W. A. NGURE, E. S. NORRIS and A. A. SZEKELY, 1990 Genetic and molecular analyses of P DNA elements sampled from natural populations of Drosophila melanogaster in Kenya, pp. 1 17- 125 in Molecular Evolution, edited by M. T . CLEGG and S. J. O'BRIEN. Wiley-Liss, New York.
XIONG, Y., and T . H. EICKBUSH, 1988a The site-specific ribosomal DNA insertion element RlBm belongs to a class of non-long- terminal-repeat retrotransposons. Mol. Cell. Biol. 8: 114-123.
XIONG, Y. , and T. H. EICKBUSH, 1988b Similarity of reverse transcriptase-like sequences of viruses, transposable elements, and mitochondrial introns. Mol. Biol. Evol. 5: 675-690.
XIONG, Y . , and T. H. EICKBUSH, 1988c Functional expression of a sequence-specific endonuclease encoded by the retrotranspo- son R2Bm. Cell 55: 235-246.
XIONG, Y., and T . H. EICKBUSH, 1990 Origin and evolution of retroelenrents based upon their reverse transcriptase se- quences. EMBO J . 9 3353-3362.
XIONG, Y., W. D. BURKE, J. L. JAKUBCZAK and T. H. EICKBUSH, 1988 Ribosomal DNA insertion elements RlBm and R2Bm can transpose in a sequence specific manner to locations outside the 28s genes. Nucleic Acids Res. 1 6 10561-10573.
YANISCH-PERRON, D., J. V~EIRA and J. MESSING, 1985 Improved M 13 phage cloning vectors and host strains: nucleotide se- quences of the M 13 mp18 and pUCl9 vectors. Gene 33: 103- 119.
Communicating editor: A. G. CLARK