Embed Size (px)
Citation preview
Full Terms & Conditions of access and use can be found athttp://www.tandfonline.com/action/journalInformation?journalCode=hlns20
Download by: [Northwestern University] Date: 09 May 2016, At: 12:22
Journal of the Learning Sciences
ISSN: 1050-8406 (Print) 1532-7809 (Online) Journal homepage: http://www.tandfonline.com/loi/hlns20
Patterns, Probabilities, and People: Making Senseof Quantitative Change in Complex Systems
Michelle Hoda Wilkerson-Jerde & Uri J. Wilensky
To cite this article: Michelle Hoda Wilkerson-Jerde & Uri J. Wilensky (2015) Patterns,Probabilities, and People: Making Sense of Quantitative Change in Complex Systems, Journal ofthe Learning Sciences, 24:2, 204-251, DOI: 10.1080/10508406.2014.976647
To link to this article: http://dx.doi.org/10.1080/10508406.2014.976647
Accepted author version posted online: 21Oct 2014.Published online: 22 Dec 2014.
Submit your article to this journal
Article views: 669
View related articles
View Crossmark data
Citing articles: 3 View citing articles
THE JOURNAL OF THE LEARNING SCIENCES, 24: 204–251, 2015Copyright © Taylor & Francis Group, LLCISSN: 1050-8406 print / 1532-7809 onlineDOI: 10.1080/10508406.2014.976647
ARTICLES
Patterns, Probabilities, and People: MakingSense of Quantitative Change in Complex
Systems
Michelle Hoda Wilkerson-JerdeDepartment of Education
Tufts University
Uri J. WilenskyDepartments of Learning Sciences and Computer Science
Northwestern University
The learning sciences community has made significant progress in understandinghow people think and learn about complex systems. But less is known about howpeople make sense of the quantitative patterns and mathematical formalisms oftenused to study these systems. In this article, we make a case for attending to and sup-porting connections between the behavior of complex systems, and the quantitativeand mathematical descriptions. We introduce a framework to examine how studentsconnect the behavioral and quantitative aspects of complex systems and use it to ana-lyze interviews with 11 high school students as they interacted with an agent-basedsimulation that produces simple exponential-like population growth. Although thestudents were comfortable describing many connections between the simulation’sbehavior and the quantitative patterns it generated, we found that they did notreadily describe connections between individual behaviors and patterns of change.Case studies suggest that these missed connections led students who engaged in
Correspondence should be addressed to Michelle Hoda Wilkerson-Jerde, Tufts University,Education, Paige Hall, 12 Upper Campus Road, Medford, MA 02155. E-mail: [email protected]
Color versions of one or more of the figures in the article can be found online at www.tandfonline.com/hmet.
Dow
nloa
ded
by [
Nor
thw
este
rn U
nive
rsity
] at
12:
22 0
9 M
ay 2
016
QUANTITATIVE CHANGE IN COMPLEX SYSTEMS 205
productive patterns of sense-making to nonetheless make errors interpreting quan-titative patterns in the simulation. These difficulties could be resolved by drawingstudents’ attention to the graph of quantitative change featured in the simulationenvironment and the underlying rules that generated it. We discuss implications forthe design of learning environments, for the study of quantitative reasoning aboutcomplex systems, and for the role of mathematical reasoning in complex systemsfluency.
Complex systems have been a major focus of current learning sciences research(Forrester, 1994/2009; National Research Council [NRC], 2012b; Wilensky &Jacobson, in press). This has yielded important insights into how people think andlearn about complex systems (Chi, 2005; Hmelo-Silver & Pfeffer, 2004; Jacobson,2001; Penner, 2000; Wilensky & Resnick, 1999) and how to make complex sys-tems principles more accessible to students (Chi, Roscoe, Slotta, Roy, & Chase,2012; Colella, 2000; Hmelo, Holton, & Kolodner, 2000; Wilensky & Reisman,2006; Wilensky & Stroup, 2000). But most such work focuses on students’ under-standing of the behavioral aspects of complex systems: their constituent elementsand interactions, and how these generate system-level outcomes. Less has focusedon whether or how students connect these understandings to quantitative patternsto make sense of the mathematical formalisms that describe such systems.
Exploring how learners make sense of such connections is important forboth theoretical and practical reasons. Across the K–12 curriculum, students areexpected to use quantitative data and mathematical representations to describeand make predictions about scientific systems and their constituent elements(Common Core State Standards Initiative, 2010; NRC, 2012b). Helping learnersunderstand these connections is a major challenge for mathematics and scienceeducators (Ganter, 2001; NRC, 2012a), especially in the context of complex sys-tems, in which mathematics may be used to measure or represent interconnected,indirect, or counterintuitive phenomena (Goldstone, 2006; Van Dyke Parunak,Savit, & Riolo, 1998). Despite these needs and difficulties, many learning envi-ronments designed to engage students in thinking about complex systems includemathematical representations such as graphs while taking for granted that stu-dents will make sense of them even when their connection to system behavior isnot transparent (Chi et al., 2012).
In this study we interviewed 11 high school precalculus students about the con-nections between the behavioral and quantitative aspects of a NetLogo simulation(Wilensky, 1999). In the simulation, “humans” each had a probabilistic chanceto reproduce, approximating an exponential pattern of growth. Drawing from theliterature on complex systems and math education, we analyzed what resources(graphs in the simulation, ideas about reproduction, etc.) students leveraged tomake sense of the individual behaviors, group interactions, patterns of change,and patterns of accumulation that together described the population system. Our
Dow
nloa
ded
by [
Nor
thw
este
rn U
nive
rsity
] at
12:
22 0
9 M
ay 2
016
206 WILKERSON-JERDE AND WILENSKY
goal was to articulate how students connected these aspects of the simulation andhow to support students in doing so. Our questions were as follows: (a) Whatresources did students use to describe the quantitative patterns generated by thesimulation? (b) What resources did students use to describe connections betweendifferent quantitative and behavioral aspects of the simulation? (c) What connec-tions did students hesitate or struggle to describe, and how were such strugglesresolved?
Our analysis reveals that even when asked exclusively about quantitative pat-terns, students cited resources that spoke to both quantitative and behavioralaspects of the simulation. Yet although they cited both aspects, many hesitatedto describe the specific connections between individual behavior and patterns ofchange in the simulation. These difficulties led students to make errors similarto those documented in the complex systems thinking literature but that arosespecifically with respect to mathematical representations in the simulation. Casestudies further suggest that these difficulties could be resolved by drawing stu-dents’ attention to the jagged nature of the graph of quantitative change featuredin the simulation environment. Our findings suggest that although many studiesin the complex systems literature focus on understanding the behavior of complexsystems and their qualitative impact on system dynamics, learners may also beable to explore formal mathematical descriptions of those systems with carefullydesigned supports. Our study has direct implications for the design of learn-ing environments, contributes analytic tools and baseline data for the study ofstudents’ quantitative reasoning about complex systems, and illustrates the impor-tance of attending to quantitative and mathematical issues as a key component ofcomplex systems fluency.
BACKGROUND
Complex systems are dynamic: Their behavior, interlevel structure, and outcomesof interest unfold over time. Although most complex systems education literaturefocuses on how learners make sense of the behavioral aspects of complex systemsand their organization, mathematics also plays an important role in describ-ing such properties (Bar-Yam, 2003; Holland, 2000). Many complex systemsare characterized by quantitative patterns of change over time, such as oscilla-tion, escalation, and equilibration (American Association for the Advancement ofScience, 1993; Mitchell, 2009). Because of this, studying how learners make senseof patterns exhibited by complex systems requires attending to learners’ think-ing about both the behavior of complex systems and the mathematics of change.We situate our work at the intersection of these two literatures. We then describewhy computer simulation environments make an especially well-suited contextfor exploring student thinking at this intersection.
Dow
nloa
ded
by [
Nor
thw
este
rn U
nive
rsity
] at
12:
22 0
9 M
ay 2
016
QUANTITATIVE CHANGE IN COMPLEX SYSTEMS 207
Thinking and Learning About Complex Systems
Neither the scientific community nor the educational community has converged ona formal definition of complex systems (Guckenheimer & Ottino, 2008; Holland,2000; Kolodner, 2006; Wilensky & Jacobson, in press). However, there is generalconsensus that reasoning about complex systems can be difficult for a numberof reasons. These systems are unpredictable and have a variety of potential out-comes (Chinn & Malhotra, 2002); involve multiple interacting elements, whichcan task working memory (Feltovich, Coulson, & Spiro, 2001; Hmelo-Silver &Azevedo, 2006); and exhibit counterintuitive behavior and relationships becauseevents at one level of the system can have unexpected consequences at another(Casti, 1994; Penner, 2000). Correspondingly, there are a number of perspec-tives for exploring learners’ understanding of complex systems. These include thestructure–behavior–function framework, which emphasizes the roles and interde-pendencies of heterogeneous components in a system (Hmelo-Silver & Pfeffer,2004; Vattam et al., 2011); mindset theories, which focus on learners’ attentionto the decentralized and stochastic nature of complex systems (Jacobson, 2001;Resnick & Wilensky, 1998); and analytic approaches that explore students’ under-standing of the different types of causal relationships that exist within a system(Chi, 2005; Perkins & Grotzer, 2005).
Our study adopts an emergence-based perspective toward complex systems(Bar-Yam, 2003; Chi, 2005; Wilensky & Resnick, 1999). Complex systemsexhibit emergence when many entities at a micro level interact locally and simul-taneously to produce behavior at a global or macro level of observation. Forexample, the movement and collision of molecules in a gas at the micro levelcollectively create what is observed to be air pressure at the macro level (Holland,2000; Wilensky, 2003). Emergent phenomena are interesting from a quantitativeperspective precisely because of these different levels. Mathematical and quantita-tive measures can describe the dynamics of these systems at one level of analysis,but those dynamics are indirectly generated by collective elements and interac-tions that occur at a different level. Moreover, mathematics does not distinguishamong these levels. For example, the ideal gas law PV = nRT is used to describeand predict patterns in air pressure (P) by articulating relationships between thenumber of particles in the gas (n), the volume of the container (V), and the tem-perature of the gas (T). These factors describe both macro-level attributes such asthe volume of a container and micro-level elements such as the number of parti-cles in the gas, as well as emergent effects such as pressure, which results fromthe frequency of collisions between particles and their container.
Research suggests that students’ difficulties in making sense of emergence incomplex systems stem from a confusion, or slippage, between these different lev-els of analysis (Sengupta & Wilensky, 2009; Wilensky & Resnick, 1999). Studentsmay not explicitly consider a system’s behavior at more than one level of analysis
Dow
nloa
ded
by [
Nor
thw
este
rn U
nive
rsity
] at
12:
22 0
9 M
ay 2
016
208 WILKERSON-JERDE AND WILENSKY
or may incorrectly assign behavior at one level to dynamics at a different one. Onecommon example of such “levels confusion” (Wilensky & Resnick, 1999, p. 3) isunderstanding of traffic jams. Each car in a traffic jam moves forward, but the jamitself does not move forward; in fact, it propagates backward. Even after studentsunderstand the different levels of analysis in an emergent system, they may stillstruggle to understand the causal relationships that link behaviors at one level tooutcomes at another (Penner, 2000). To understand these causal links between lev-els, students must consider the aggregated and simultaneous effects of individualbehavior. Research suggests that this might be accomplished by considering howthese individual behaviors relate to the net effects of group interactions withinsubsets of entities (Levy & Wilensky, 2008) or an entire collection of entitiesconsidered simultaneously (Chi et al., 2012).
Thinking and Learning About the Mathematics of Change
Mathematics education research suggests that there are two important factors inunderstanding patterns of quantitative change. First, students need to understandlinkages between the particular parameters and relationships highlighted by amathematical model or set of data and the corresponding dynamic situation theydescribe (Keene, 2007; Roth & Bowen, 2003; Thompson, 1994). This helpsstudents interpret mathematical patterns and make inferences or predictions aboutthe underlying system. It also enables them to leverage what they may knowabout the situation to understand how they should expect quantities or parametersto covary (Carlson, Jacobs, Coe, Larsen, & Hsu, 2002; Doerr, 2000; White &Mitchelmore, 1996). Envisioning bacteria iteratively splitting, for instance, canhelp students better understand the structure of exponential growth (Confrey &Smith, 1994, 1995).
Second, students must disentangle which aspects of a system correspond tothe rate of change of the system versus which correspond to the accumulation orsummation of those changes over time. These two ideas are closely intertwinedmathematically and conceptually (Johnson, 2012; Piaget, 1970; Schwartz, 1988).For example, a bicyclist who starts from a standstill and steadily increases herspeed by 1 mph for every minute she pedals is travelling faster as time goes onand covering more distance as time goes on. When she decides to slow down, shewill cover less distance from moment to moment, but she will still be adding tothe total distance she has travelled during her trip. If this bicyclist’s total distancetravelled were graphed relative to time, values plotted on the graph would alwaysrise relative to time. However, the slope of the graph at different points wouldreflect relative increases or decreases in speed during the trip. In this case, the rateof change is the bicyclist’s speed, and the accumulation is distance. These quanti-ties and their relationship to each other are the foundation of reasoning about themathematics of dynamic systems (Kaput, 1994; Nemirovsky, 1994; Stroup, 2002).
Dow
nloa
ded
by [
Nor
thw
este
rn U
nive
rsity
] at
12:
22 0
9 M
ay 2
016
QUANTITATIVE CHANGE IN COMPLEX SYSTEMS 209
Learning With Agent-Based Simulations
One way in which educators have successfully engaged learners in making senseof complex systems is through simulation (Clark, Nelson, Sengupta, & D’Angelo,2009; Hmelo-Silver & Azevedo, 2006; Klopfer & Yoon, 2004; Repenning,Ioannidou, & Zola, 2000; Wilensky & Jacobson, in press). Agent-based simu-lation environments such as NetLogo (Wilensky, 1999), AgentSheets (Repenninget al., 2000) and StarLogo TNG (Begel & Klopfer, 2005) are especially well suitedfor students to explore how many interacting agents can produce unexpectedemergent outcomes.
But although there is evidence that agent-based simulations can help studentsunderstand the behavior of complex systems, not much is known about how stu-dents understand the mathematical representations that often accompany them.Some studies claim that agent-based simulations are effective because they pro-vide an alternative to formal mathematical representations (Goldstone & Janssen,2005; Sengupta & Wilensky, 2009; Tan & Biswas, 2007; Wilensky & Reisman,2006) and highlight mechanisms that mathematical formulas may not (Goldstone& Wilensky, 2008). Others indicate that agent-based simulations can help studentsdevelop a conceptual grounding for scientific formulae or mathematical patternsbut focus on qualitative trends rather than measurable relationships (Blikstein &Wilensky, 2009; Wilensky, 2003; Wilensky & Stroup, 2000). Still others claim thatinteracting with agent-based simulations can help students make sense of mathe-matical ideas such as statistical variation or probability (Abrahamson & Wilensky,2005; Wilensky, 1997) but not explore how these ideas might connect back to aparticular mathematical model or scientific context.
The relationship between agent-based simulations and mathematical represen-tations of complex systems is nuanced. Like mathematical models, simulationshighlight the quantities, relationships, and changes over time that define a system.Simulations execute and record these relationships as quantitative data, whereasmathematical models encode them symbolically. Moreover, agent-based simula-tions define relationships in terms of individual behaviors rather than in termsof aggregate measures like mathematical models (Holland, 2000). These nuancedrelationships, combined with the established potential for agent-based simulationsto engage students in constructing scientific knowledge, make agent-based simu-lation an ideal context in which to explore how students connect quantitative andmathematical knowledge to complex systems behavior.
CONCEPTUAL FRAMEWORK: THE CALCULUS OF COMPLEXSYSTEMS
To make sense of the quantitative change exhibited by complex systems, webring together the literature on complex systems thinking and reasoning about
Dow
nloa
ded
by [
Nor
thw
este
rn U
nive
rsity
] at
12:
22 0
9 M
ay 2
016
210 WILKERSON-JERDE AND WILENSKY
quantitative change to argue that learners need to understand and constructconnections across four interrelated aspects. To make sense of the emergent pat-terns that are characteristic of complex systems, learners need to identify howmicro-level Individual Behaviors within the system generate Group Interactionsevident at a macro-level of observation. Learners must also understand how quan-titative patterns generated by the system are substantively connected to theseindividual and group-level behaviors. To build these connections, they need todistinguish between the Patterns of Change and Patterns of Accumulation that arereflected in a given quantitative pattern and what each measure illustrates aboutthe complex system’s behavior. We call these four aspects (and the connectionsbetween them) the calculus of complex systems (CCS) framework.
The CCS framework highlights Individual Behaviors, Group Interactions,Patterns of Change, and Patterns of Accumulation as mutually informative lev-els of description. By levels, we do not refer to a developmental trajectory forunderstanding complex systems. Instead, we refer to descriptions that highlightsome aspects of a system of interest, such as individual interactions, that constrain(but may not entirely illuminate) aspects at a different level, such as mathematicalpatterns (Holland, 2000; Stroup & Wilensky, 2014). For example, describing themicro-level physical relationship between gas particles and their container high-lights what sort of behavior might emerge from an air pressure system. However,the mathematical formula PV = nRT that describes a macro-level aspect ofthe system highlights how air pressure is affected by changes in particle count,temperature, or volume.
We are interested in whether and how students learn to navigate across theselevels of description as they interact with simulation-based learning environ-ments. Therefore, our theoretical orientation focuses on how students make useof and build connections between their existing knowledge and the mediatingtools with which they are engaged. We draw from theories of learning that focuson learners’ existing resources for sense making and the role those resourcesplay in helping learners build connections across different representations, expe-riences, and bodies of knowledge (diSessa, 1993; diSessa & Sherin, 1998; Noss& Hoyles, 1996; Wagner, 2010). By resources, we draw from Pratt and Noss’s(2002) notion of resources as “both external tools and internal knowledge”(p. 456) that learners leverage in activity to coordinate existing understand-ings and construct new knowledge. By connections, we are interested in thelinks students are constructing between the levels of description in the CCSframework. This allows us to explore “the complementary roles played in inter-nal (cognitive) and external (physical or virtual) sources of meaning making”(Pratt & Noss, 2002, p. 456) that are the basis for simulation-based educationalenvironments.
Dow
nloa
ded
by [
Nor
thw
este
rn U
nive
rsity
] at
12:
22 0
9 M
ay 2
016
QUANTITATIVE CHANGE IN COMPLEX SYSTEMS 211
An Example: The Case of Population Growth
To illustrate the CCS framework, we consider the example of population growthdynamics. Mathematical models of population growth are part of most highschool math and science curricula (American Association for the Advancementof Science, 1993; Common Core State Standards Initiative, 2010; NRC, 2012b).But the study of population growth also includes attention to the behaviors thatcause populations to fluctuate, such as birth, death, immigration, competition forresources, or population density (NRC, 2003; Sandholm, 2010).
Mathematical models of population growth typically focus on describingdynamics in terms of a Pattern of Accumulation of total population. A logis-tic model represents the growth of a population that is eventually limited byresource or space constraints. It is often represented with a graph of populationover time that follows a characteristic logistic S shape or by the Verhulst equation
P (t) = KP0ert
K+P0(ert−1). These two external resources—the graph and the equation—
focus on descriptions of Patterns of Accumulation. They can also be used to findinformation about Patterns of Change: Examining the slope of the graph indi-cates how many members are added to the population during a given intervalof time. Population models also incorporate assumptions about what importantIndividual Behaviors and Group Interactions underlie a system and constrain itsglobal behavior. Certain implicit information about these levels might also appearin resources that deal primarily at a different level of description. The Verhulstequation, for instance, assumes that there is some carrying capacity K after whichmore reproduction cannot occur because of the competition for space or resourcesintroduced by Group Interactions.
Depending on what resources learners leverage to make sense of different lev-els of description, they might arrive at either contradictory or logically consistentunderstandings of the system as a whole. Recalling our example, a logistic patternof population growth does not necessarily mean that each member of the popu-lation reproduces slowly, then quickly, then slowly again over the duration of thepopulation’s existence. Therefore, resources that describe the population’s Patternof Accumulation might not be the most appropriate ones to leverage to make senseof Individual Behavior. However, learners may also have some implicit knowl-edge of how Individual Behaviors such as reproducing or dying might combineto generate Patterns of Change—the total number of births and deaths per year.This in turn might help them build a connection between Individual Behavior andPatterns of Accumulation.
In this study, we focused on exponential population growth as a first step towardunderstanding how students identify relevant resources and use those resources tobuild connections across different levels of description. However, we anticipatethat the insights drawn from the example we explore here illustrate how theCCS framework can accommodate phenomena that involve more behaviors andinteractions, as do many complex systems.
Dow
nloa
ded
by [
Nor
thw
este
rn U
nive
rsity
] at
12:
22 0
9 M
ay 2
016
212 WILKERSON-JERDE AND WILENSKY
METHODS
Our research questions were as follows: (a) What resources did students use todescribe the quantitative patterns generated by the simulation? (b) What resourcesdid students use to describe connections between the individual behaviors, groupinteractions, patterns of change, and patterns of accumulation in the simulation?(c) What connections did students hesitate or struggle to describe, and how wasthis resolved?
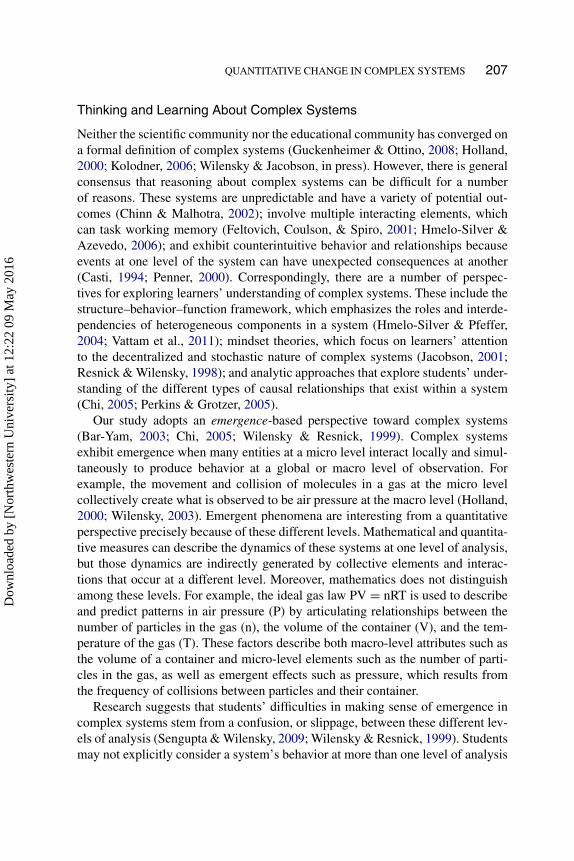
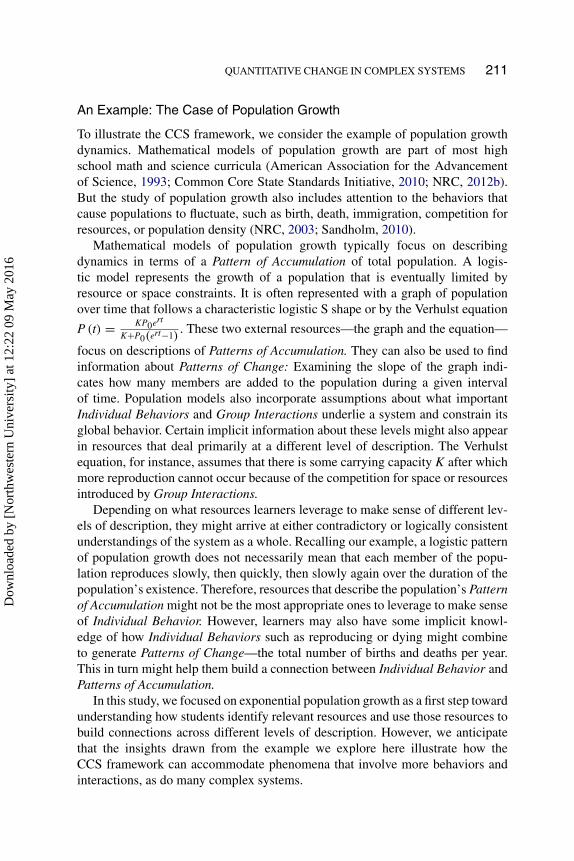
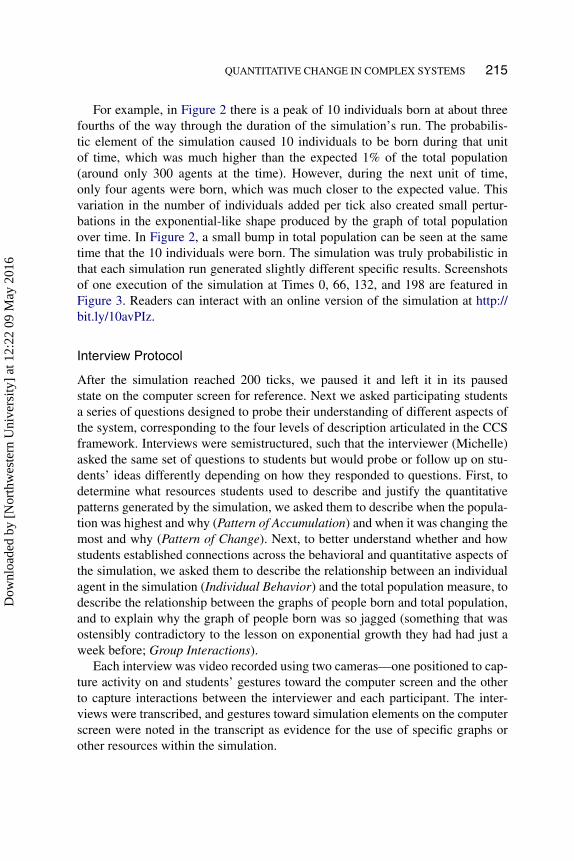
We conducted 11 one-on-one semistructured clinical interviews (Clement,2000; Ginsburg, 1997) with six male and five female 11th- and 12th-gradestudents enrolled in a summer preparatory calculus program at a large urban mid-western public high school. The students had completed a lesson on exponentialgrowth and its rate of change a week earlier in class. We introduced a NetLogo(Wilensky, 1999) agent-based simulation as an alternative way to explore pop-ulation growth (Figure 1). The simulation is based on individual probabilitiesrather than the overall growth rates used for exponential models. Participatingstudents did not have experience using NetLogo or other agent-based modelingenvironments. Each interview lasted between 30 and 45 min.
FIGURE 1 NetLogo simulation interface used during student interviews.
Dow
nloa
ded
by [
Nor
thw
este
rn U
nive
rsity
] at
12:
22 0
9 M
ay 2
016
QUANTITATIVE CHANGE IN COMPLEX SYSTEMS 213
The simulation focused specifically on simple exponential population growth.The pattern produced in the simulation was generated by probabilistic individ-ual reproduction. It intentionally featured human agents so that students werelikely to have existing commonsense expectations about individual behavior thatmight inform their interpretation of the simulation. This combination of studydesign and student educational background allowed us to focus specifically onwhat new challenges and relationships might arise when students work to makesense of quantitative change in the context of complex systems dynamics, evenwhen they have considerable background from which to draw. Our introductionof the NetLogo simulation explicitly prompted students to explore the relationshipbetween a complex systems treatment of population growth (i.e., the explicit link-ages between individual and group behavior), how that pattern is expressed usingthe simulation, and the familiar mathematical models traditionally used to makepredictions about population.
Simulation
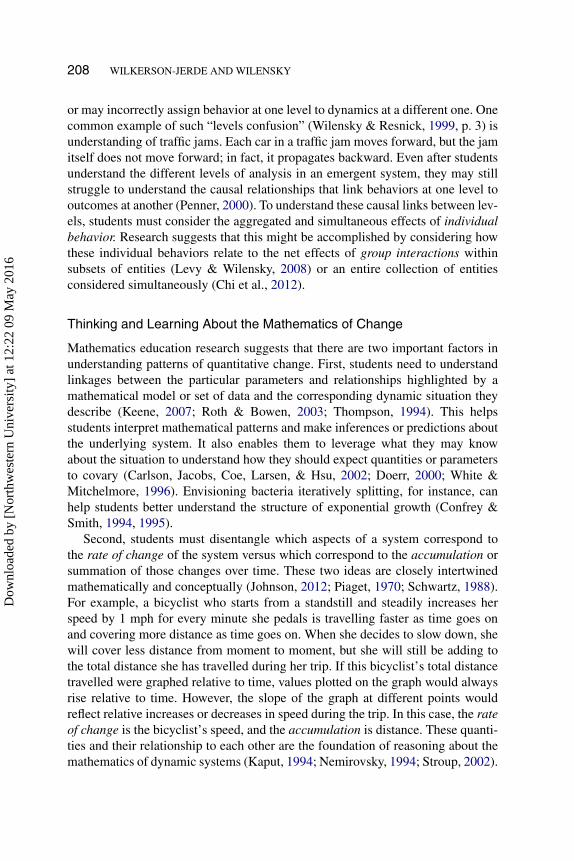
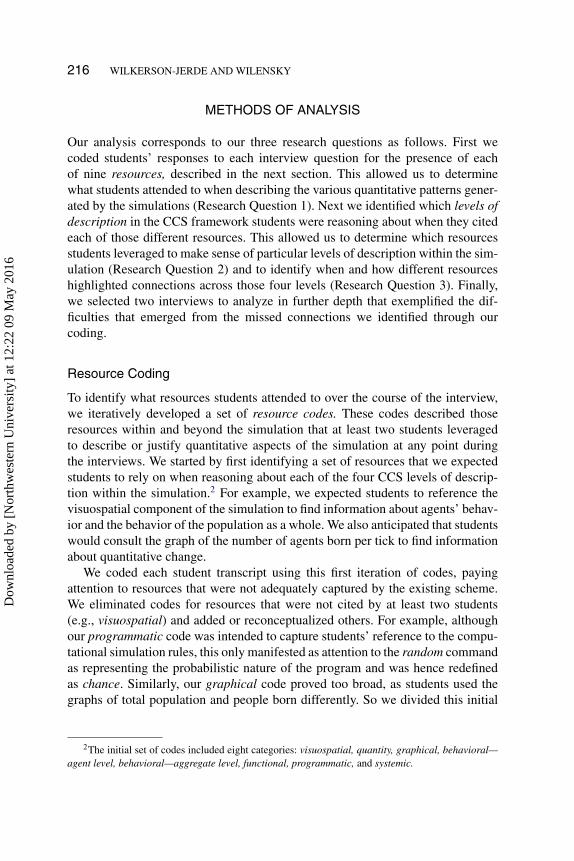
We first introduced participants to the simulation paused in its initial state, with100 people (computational agents) randomly distributed in the visualization win-dow. We explained that agents would move within the window a small amount in arandom direction1 and would have a .01 probability of cloning themselves duringeach unit of time (or tick, as we refer to them in this article). The simulation inter-face also featured two graphs: One, labeled population, would dynamically plotthe total number of simulated agents during each tick while the simulation ran;the other, labeled people born, would plot the number of new agents in the worldeach tick (see Figure 2). These graphs were vertically aligned with the populationgraph on top, so that each point along the time axes was aligned vertically.
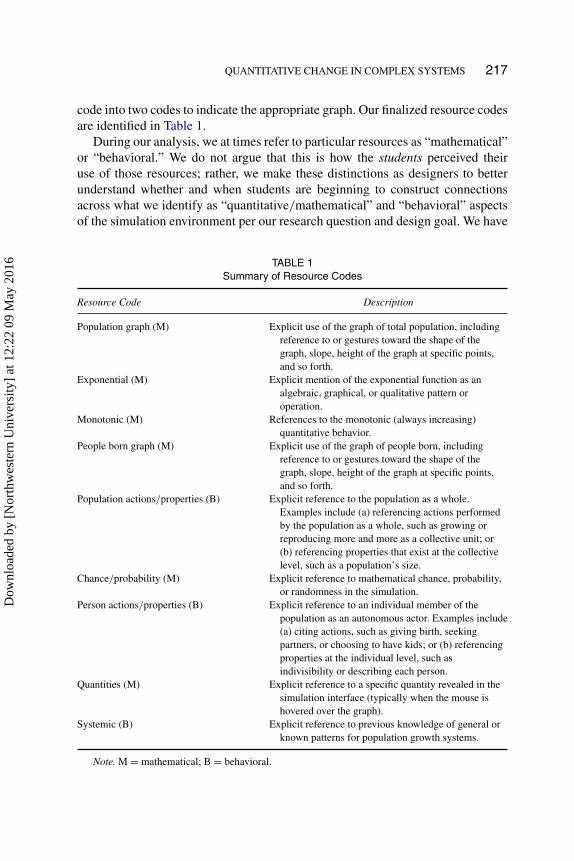
Next we ran the model for approximately 200 ticks, during which the simu-lated agents moved about and replicated in the visualization window. The graphsof population and people born were plotted over time as the simulation ran (seeFigure 3). Because each simulated agent was known to have a .01 probability ofreproducing during each tick, approximately 1% of the total population wouldreproduce and be added to the original population during each tick, creating anexponential-like pattern of growth. The number of individuals added to the pop-ulation would be plotted in the people born graph, whereas the total number ofindividuals (including those recently added) would be plotted on the total pop-ulation graph. The probabilistic rule in the simulation introduced variability in
1Movement was not important mathematically. However, if agents did not move the simulationwould “stack” them in the visualization so that the population did not appear to grow. Therefore, weintroduced a rule to make them move so that students could use the visualization to observe changesin the number of agents over time.
Dow
nloa
ded
by [
Nor
thw
este
rn U
nive
rsity
] at
12:
22 0
9 M
ay 2
016
214 WILKERSON-JERDE AND WILENSKY
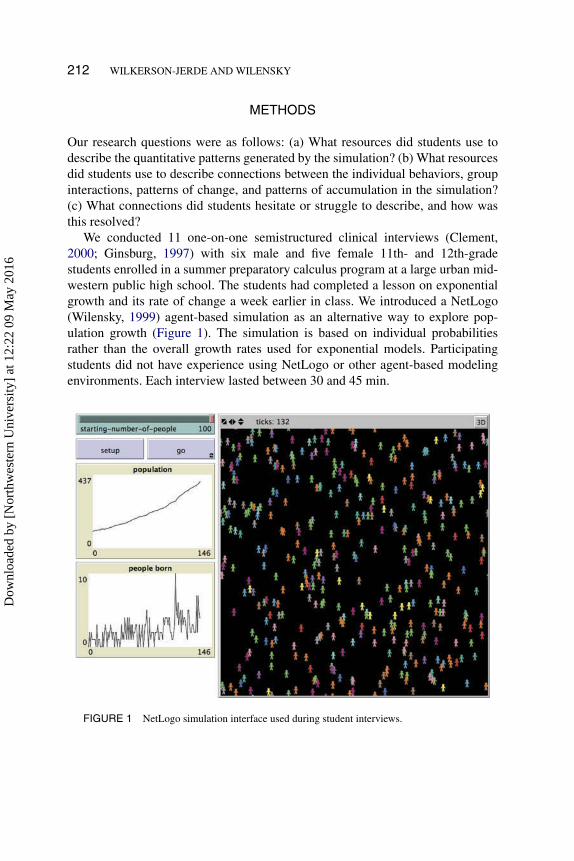
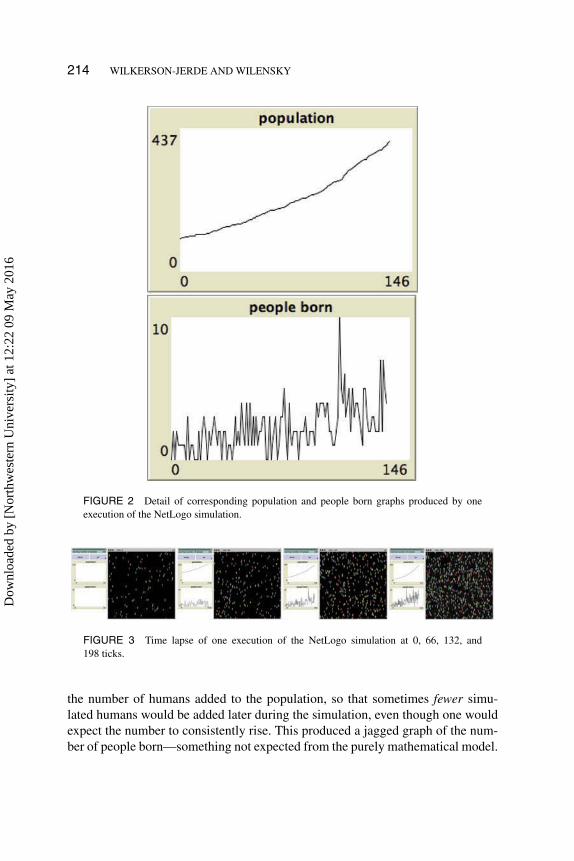
FIGURE 2 Detail of corresponding population and people born graphs produced by oneexecution of the NetLogo simulation.
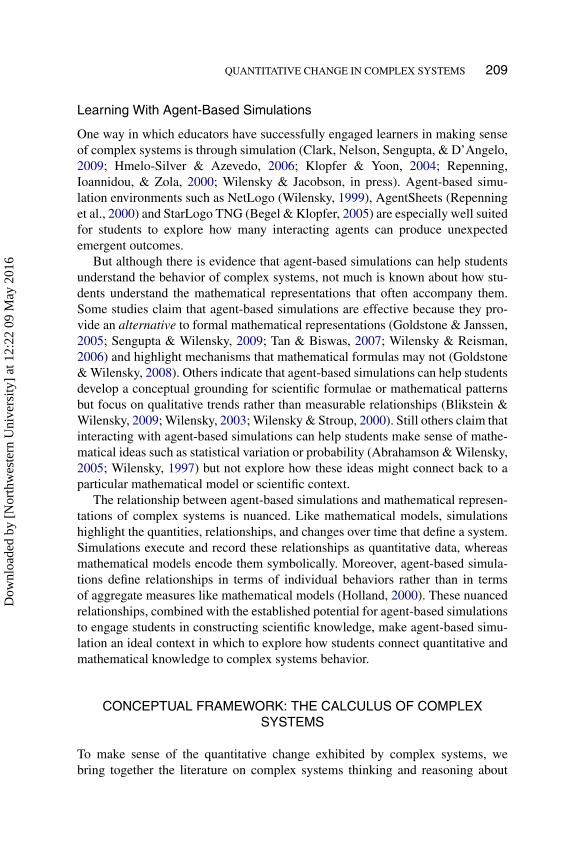
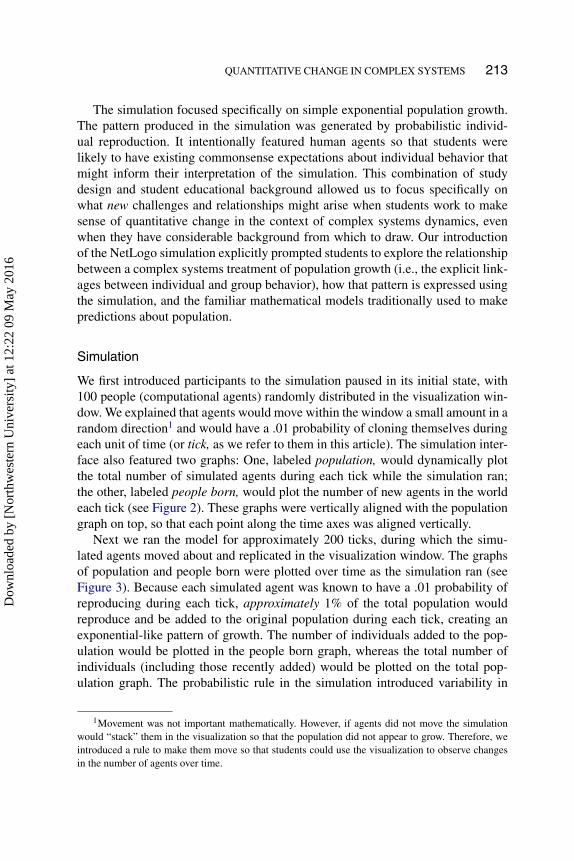
FIGURE 3 Time lapse of one execution of the NetLogo simulation at 0, 66, 132, and198 ticks.
the number of humans added to the population, so that sometimes fewer simu-lated humans would be added later during the simulation, even though one wouldexpect the number to consistently rise. This produced a jagged graph of the num-ber of people born—something not expected from the purely mathematical model.
Dow
nloa
ded
by [
Nor
thw
este
rn U
nive
rsity
] at
12:
22 0
9 M
ay 2
016
QUANTITATIVE CHANGE IN COMPLEX SYSTEMS 215
For example, in Figure 2 there is a peak of 10 individuals born at about threefourths of the way through the duration of the simulation’s run. The probabilis-tic element of the simulation caused 10 individuals to be born during that unitof time, which was much higher than the expected 1% of the total population(around only 300 agents at the time). However, during the next unit of time,only four agents were born, which was much closer to the expected value. Thisvariation in the number of individuals added per tick also created small pertur-bations in the exponential-like shape produced by the graph of total populationover time. In Figure 2, a small bump in total population can be seen at the sametime that the 10 individuals were born. The simulation was truly probabilistic inthat each simulation run generated slightly different specific results. Screenshotsof one execution of the simulation at Times 0, 66, 132, and 198 are featured inFigure 3. Readers can interact with an online version of the simulation at http://bit.ly/10avPIz.
Interview Protocol
After the simulation reached 200 ticks, we paused it and left it in its pausedstate on the computer screen for reference. Next we asked participating studentsa series of questions designed to probe their understanding of different aspects ofthe system, corresponding to the four levels of description articulated in the CCSframework. Interviews were semistructured, such that the interviewer (Michelle)asked the same set of questions to students but would probe or follow up on stu-dents’ ideas differently depending on how they responded to questions. First, todetermine what resources students used to describe and justify the quantitativepatterns generated by the simulation, we asked them to describe when the popula-tion was highest and why (Pattern of Accumulation) and when it was changing themost and why (Pattern of Change). Next, to better understand whether and howstudents established connections across the behavioral and quantitative aspects ofthe simulation, we asked them to describe the relationship between an individualagent in the simulation (Individual Behavior) and the total population measure, todescribe the relationship between the graphs of people born and total population,and to explain why the graph of people born was so jagged (something that wasostensibly contradictory to the lesson on exponential growth they had had just aweek before; Group Interactions).
Each interview was video recorded using two cameras—one positioned to cap-ture activity on and students’ gestures toward the computer screen and the otherto capture interactions between the interviewer and each participant. The inter-views were transcribed, and gestures toward simulation elements on the computerscreen were noted in the transcript as evidence for the use of specific graphs orother resources within the simulation.
Dow
nloa
ded
by [
Nor
thw
este
rn U
nive
rsity
] at
12:
22 0
9 M
ay 2
016
216 WILKERSON-JERDE AND WILENSKY
METHODS OF ANALYSIS
Our analysis corresponds to our three research questions as follows. First wecoded students’ responses to each interview question for the presence of eachof nine resources, described in the next section. This allowed us to determinewhat students attended to when describing the various quantitative patterns gener-ated by the simulations (Research Question 1). Next we identified which levels ofdescription in the CCS framework students were reasoning about when they citedeach of those different resources. This allowed us to determine which resourcesstudents leveraged to make sense of particular levels of description within the sim-ulation (Research Question 2) and to identify when and how different resourceshighlighted connections across those four levels (Research Question 3). Finally,we selected two interviews to analyze in further depth that exemplified the dif-ficulties that emerged from the missed connections we identified through ourcoding.
Resource Coding
To identify what resources students attended to over the course of the interview,we iteratively developed a set of resource codes. These codes described thoseresources within and beyond the simulation that at least two students leveragedto describe or justify quantitative aspects of the simulation at any point duringthe interviews. We started by first identifying a set of resources that we expectedstudents to rely on when reasoning about each of the four CCS levels of descrip-tion within the simulation.2 For example, we expected students to reference thevisuospatial component of the simulation to find information about agents’ behav-ior and the behavior of the population as a whole. We also anticipated that studentswould consult the graph of the number of agents born per tick to find informationabout quantitative change.
We coded each student transcript using this first iteration of codes, payingattention to resources that were not adequately captured by the existing scheme.We eliminated codes for resources that were not cited by at least two students(e.g., visuospatial) and added or reconceptualized others. For example, althoughour programmatic code was intended to capture students’ reference to the compu-tational simulation rules, this only manifested as attention to the random commandas representing the probabilistic nature of the program and was hence redefinedas chance. Similarly, our graphical code proved too broad, as students used thegraphs of total population and people born differently. So we divided this initial
2The initial set of codes included eight categories: visuospatial, quantity, graphical, behavioral—agent level, behavioral—aggregate level, functional, programmatic, and systemic.
Dow
nloa
ded
by [
Nor
thw
este
rn U
nive
rsity
] at
12:
22 0
9 M
ay 2
016
QUANTITATIVE CHANGE IN COMPLEX SYSTEMS 217
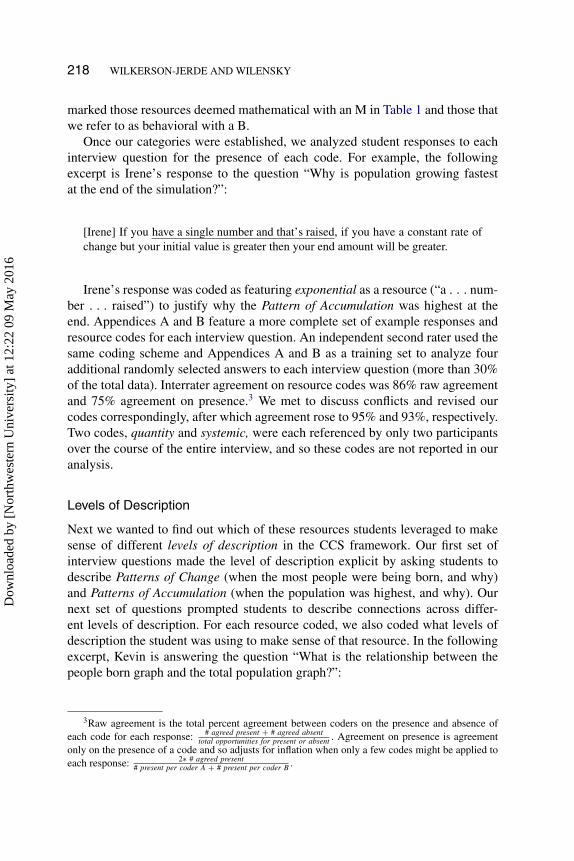
code into two codes to indicate the appropriate graph. Our finalized resource codesare identified in Table 1.
During our analysis, we at times refer to particular resources as “mathematical”or “behavioral.” We do not argue that this is how the students perceived theiruse of those resources; rather, we make these distinctions as designers to betterunderstand whether and when students are beginning to construct connectionsacross what we identify as “quantitative/mathematical” and “behavioral” aspectsof the simulation environment per our research question and design goal. We have
TABLE 1Summary of Resource Codes
Resource Code Description
Population graph (M) Explicit use of the graph of total population, includingreference to or gestures toward the shape of thegraph, slope, height of the graph at specific points,and so forth.
Exponential (M) Explicit mention of the exponential function as analgebraic, graphical, or qualitative pattern oroperation.
Monotonic (M) References to the monotonic (always increasing)quantitative behavior.
People born graph (M) Explicit use of the graph of people born, includingreference to or gestures toward the shape of thegraph, slope, height of the graph at specific points,and so forth.
Population actions/properties (B) Explicit reference to the population as a whole.Examples include (a) referencing actions performedby the population as a whole, such as growing orreproducing more and more as a collective unit; or(b) referencing properties that exist at the collectivelevel, such as a population’s size.
Chance/probability (M) Explicit reference to mathematical chance, probability,or randomness in the simulation.
Person actions/properties (B) Explicit reference to an individual member of thepopulation as an autonomous actor. Examples include(a) citing actions, such as giving birth, seekingpartners, or choosing to have kids; or (b) referencingproperties at the individual level, such asindivisibility or describing each person.
Quantities (M) Explicit reference to a specific quantity revealed in thesimulation interface (typically when the mouse ishovered over the graph).
Systemic (B) Explicit reference to previous knowledge of general orknown patterns for population growth systems.
Note. M = mathematical; B = behavioral.
Dow
nloa
ded
by [
Nor
thw
este
rn U
nive
rsity
] at
12:
22 0
9 M
ay 2
016
218 WILKERSON-JERDE AND WILENSKY
marked those resources deemed mathematical with an M in Table 1 and those thatwe refer to as behavioral with a B.
Once our categories were established, we analyzed student responses to eachinterview question for the presence of each code. For example, the followingexcerpt is Irene’s response to the question “Why is population growing fastestat the end of the simulation?”:
[Irene] If you have a single number and that’s raised, if you have a constant rate ofchange but your initial value is greater then your end amount will be greater.
Irene’s response was coded as featuring exponential as a resource (“a . . . num-ber . . . raised”) to justify why the Pattern of Accumulation was highest at theend. Appendices A and B feature a more complete set of example responses andresource codes for each interview question. An independent second rater used thesame coding scheme and Appendices A and B as a training set to analyze fouradditional randomly selected answers to each interview question (more than 30%of the total data). Interrater agreement on resource codes was 86% raw agreementand 75% agreement on presence.3 We met to discuss conflicts and revised ourcodes correspondingly, after which agreement rose to 95% and 93%, respectively.Two codes, quantity and systemic, were each referenced by only two participantsover the course of the entire interview, and so these codes are not reported in ouranalysis.
Levels of Description
Next we wanted to find out which of these resources students leveraged to makesense of different levels of description in the CCS framework. Our first set ofinterview questions made the level of description explicit by asking students todescribe Patterns of Change (when the most people were being born, and why)and Patterns of Accumulation (when the population was highest, and why). Ournext set of questions prompted students to describe connections across differ-ent levels of description. For each resource coded, we also coded what levels ofdescription the student was using to make sense of that resource. In the followingexcerpt, Kevin is answering the question “What is the relationship between thepeople born graph and the total population graph?”:
3Raw agreement is the total percent agreement between coders on the presence and absence ofeach code for each response: # agreed present + # agreed absent
total opportunities for present or absent . Agreement on presence is agreementonly on the presence of a code and so adjusts for inflation when only a few codes might be applied toeach response: 2∗ # agreed present
# present per coder A + # present per coder B .
Dow
nloa
ded
by [
Nor
thw
este
rn U
nive
rsity
] at
12:
22 0
9 M
ay 2
016
QUANTITATIVE CHANGE IN COMPLEX SYSTEMS 219
[Kevin] To, um, I mean you could simply like we already related how thisgraph’s irregular [indicates people born graph] and so is this [indicates populationgraph] but um, simply putting um, this [population graph] isn’t going to modeldips in population nearly as well as this [people born graph], so you could simply Iguess say that this graph is simply almost like a best fit line of this graph so it takeslike the top points are the most important pertinent points of the bottom graph and itsimply shows up on the top.
This response was coded as involving the people born graph (“bottom graph”),the population graph (“top graph”), and the actions or properties of the populationas an entity (“dips in population”) as resources. In terms of levels of description,Kevin describes the population graph as a best fit line that reproduces impor-tant points of the people born graph, implying that he is using both graphs tospeak to the Pattern of Accumulation of the population. Kevin is also referring toactions/properties of the population to describe both the Pattern of Accumulationand the Group Interactions those patterns reflect (“dips in population”).
Appendix B features a more complete set of example responses and level ofdescription codes for each interview question. Interrater agreement on level ofdescription codes was 89% agreement on the presence or absence of each leveland 82% agreement on presence (Smith, Feld, & Franz, 1992). We met to discussconflicts and revise our codes correspondingly, after which agreement rose to 93%and 90%, respectively.
RESULTS
As we describe in further detail below, we found that although students lever-aged both behavioral and mathematical resources to make sense of quantitativechange in complex systems, they made some connections across levels of descrip-tion more readily than others. It is noteworthy that most students did not articulateconnections between Individual Behaviors and Patterns of Change, even thoughthey were comfortable describing the relationships between a single agent inthe simulation (Individual Behavior) and overall population growth (Pattern ofAccumulation), and between the graph of population (Pattern of Change) andgraph of people born in the simulation (Pattern of Accumulation). In fact, moststudents only connected Individual Behaviors and Patterns of Change when theywere explicitly asked to explain why the graph of people born was jagged.
To better understand the implications of this missed connection, we presenttwo more detailed case studies (complemented with data from other interviews).These case studies reveal that missed connections between Individual Behaviorsand Patterns of Change led participating students to experience difficulty whendescribing the mathematical relationships that underlay the simulation. In both
Dow
nloa
ded
by [
Nor
thw
este
rn U
nive
rsity
] at
12:
22 0
9 M
ay 2
016
220 WILKERSON-JERDE AND WILENSKY
cases, these difficulties were resolved once students’ attention was drawn to thejagged nature of the people born graph.
Part 1: Resources Cited By Participants
Our first objective is to describe what resources in the simulation students citedwhen answering questions specifically about quantitative change. We do this byexploring students’ responses to our first set of interview questions: “When ispopulation highest in this simulation?” and “Why is population highest then?”(Pattern of Accumulation) and “When is population growing the most in thissimulation?” and “Why is it growing the most then?” (Pattern of Change).
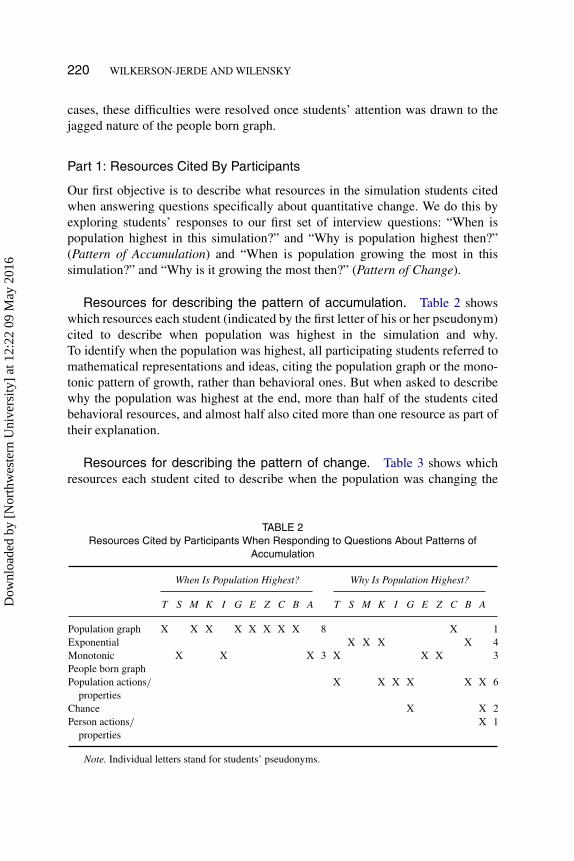
Resources for describing the pattern of accumulation. Table 2 showswhich resources each student (indicated by the first letter of his or her pseudonym)cited to describe when population was highest in the simulation and why.To identify when the population was highest, all participating students referred tomathematical representations and ideas, citing the population graph or the mono-tonic pattern of growth, rather than behavioral ones. But when asked to describewhy the population was highest at the end, more than half of the students citedbehavioral resources, and almost half also cited more than one resource as part oftheir explanation.
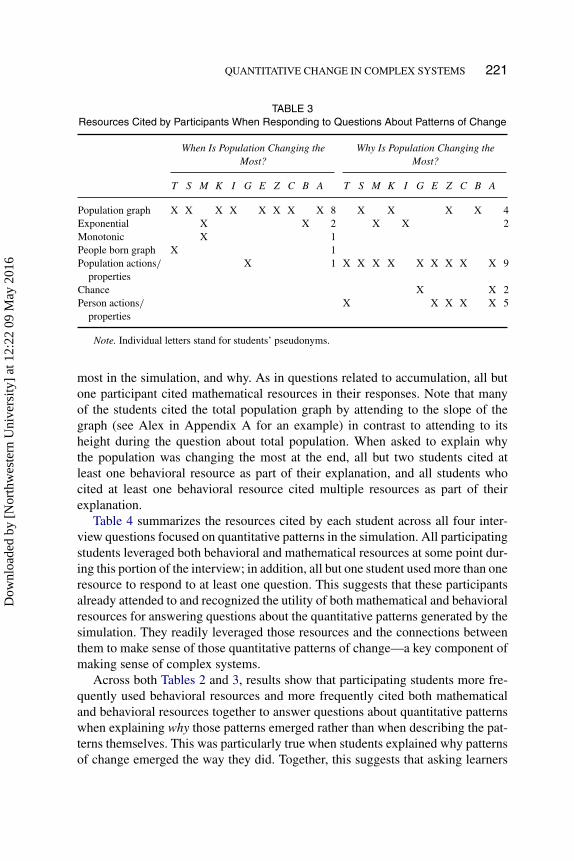
Resources for describing the pattern of change. Table 3 shows whichresources each student cited to describe when the population was changing the
TABLE 2Resources Cited by Participants When Responding to Questions About Patterns of
Accumulation
When Is Population Highest? Why Is Population Highest?
T S M K I G E Z C B A T S M K I G E Z C B A
Population graph X X X X X X X X 8 X 1Exponential X X X X 4Monotonic X X X 3 X X X 3People born graphPopulation actions/
propertiesX X X X X X 6
Chance X X 2Person actions/
propertiesX 1
Note. Individual letters stand for students’ pseudonyms.
Dow
nloa
ded
by [
Nor
thw
este
rn U
nive
rsity
] at
12:
22 0
9 M
ay 2
016
QUANTITATIVE CHANGE IN COMPLEX SYSTEMS 221
TABLE 3Resources Cited by Participants When Responding to Questions About Patterns of Change
When Is Population Changing theMost?
Why Is Population Changing theMost?
T S M K I G E Z C B A T S M K I G E Z C B A
Population graph X X X X X X X X 8 X X X X 4Exponential X X 2 X X 2Monotonic X 1People born graph X 1Population actions/
propertiesX 1 X X X X X X X X X 9
Chance X X 2Person actions/
propertiesX X X X X 5
Note. Individual letters stand for students’ pseudonyms.
most in the simulation, and why. As in questions related to accumulation, all butone participant cited mathematical resources in their responses. Note that manyof the students cited the total population graph by attending to the slope of thegraph (see Alex in Appendix A for an example) in contrast to attending to itsheight during the question about total population. When asked to explain whythe population was changing the most at the end, all but two students cited atleast one behavioral resource as part of their explanation, and all students whocited at least one behavioral resource cited multiple resources as part of theirexplanation.
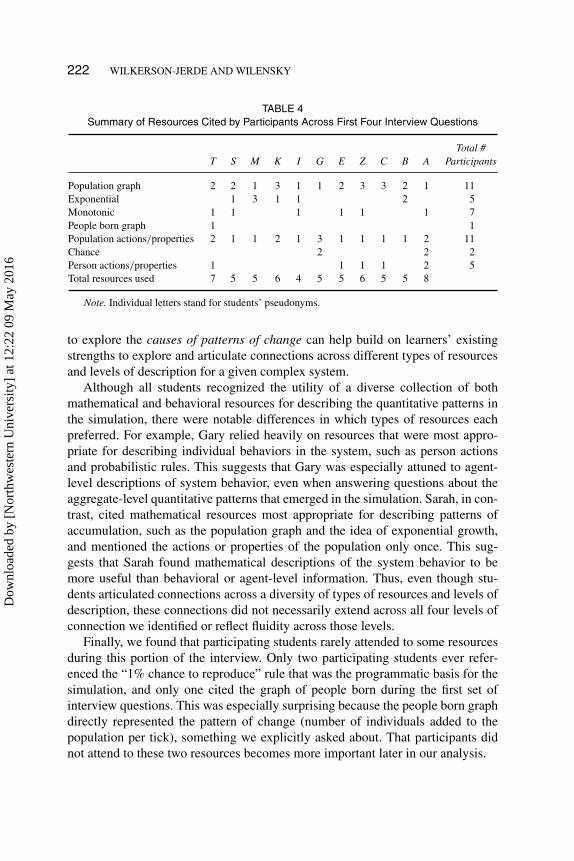
Table 4 summarizes the resources cited by each student across all four inter-view questions focused on quantitative patterns in the simulation. All participatingstudents leveraged both behavioral and mathematical resources at some point dur-ing this portion of the interview; in addition, all but one student used more than oneresource to respond to at least one question. This suggests that these participantsalready attended to and recognized the utility of both mathematical and behavioralresources for answering questions about the quantitative patterns generated by thesimulation. They readily leveraged those resources and the connections betweenthem to make sense of those quantitative patterns of change—a key component ofmaking sense of complex systems.
Across both Tables 2 and 3, results show that participating students more fre-quently used behavioral resources and more frequently cited both mathematicaland behavioral resources together to answer questions about quantitative patternswhen explaining why those patterns emerged rather than when describing the pat-terns themselves. This was particularly true when students explained why patternsof change emerged the way they did. Together, this suggests that asking learners
Dow
nloa
ded
by [
Nor
thw
este
rn U
nive
rsity
] at
12:
22 0
9 M
ay 2
016
222 WILKERSON-JERDE AND WILENSKY
TABLE 4Summary of Resources Cited by Participants Across First Four Interview Questions
T S M K I G E Z C B ATotal #
Participants
Population graph 2 2 1 3 1 1 2 3 3 2 1 11Exponential 1 3 1 1 2 5Monotonic 1 1 1 1 1 1 7People born graph 1 1Population actions/properties 2 1 1 2 1 3 1 1 1 1 2 11Chance 2 2 2Person actions/properties 1 1 1 1 2 5Total resources used 7 5 5 6 4 5 5 6 5 5 8
Note. Individual letters stand for students’ pseudonyms.
to explore the causes of patterns of change can help build on learners’ existingstrengths to explore and articulate connections across different types of resourcesand levels of description for a given complex system.
Although all students recognized the utility of a diverse collection of bothmathematical and behavioral resources for describing the quantitative patterns inthe simulation, there were notable differences in which types of resources eachpreferred. For example, Gary relied heavily on resources that were most appro-priate for describing individual behaviors in the system, such as person actionsand probabilistic rules. This suggests that Gary was especially attuned to agent-level descriptions of system behavior, even when answering questions about theaggregate-level quantitative patterns that emerged in the simulation. Sarah, in con-trast, cited mathematical resources most appropriate for describing patterns ofaccumulation, such as the population graph and the idea of exponential growth,and mentioned the actions or properties of the population only once. This sug-gests that Sarah found mathematical descriptions of the system behavior to bemore useful than behavioral or agent-level information. Thus, even though stu-dents articulated connections across a diversity of types of resources and levels ofdescription, these connections did not necessarily extend across all four levels ofconnection we identified or reflect fluidity across those levels.
Finally, we found that participating students rarely attended to some resourcesduring this portion of the interview. Only two participating students ever refer-enced the “1% chance to reproduce” rule that was the programmatic basis for thesimulation, and only one cited the graph of people born during the first set ofinterview questions. This was especially surprising because the people born graphdirectly represented the pattern of change (number of individuals added to thepopulation per tick), something we explicitly asked about. That participants didnot attend to these two resources becomes more important later in our analysis.
Dow
nloa
ded
by [
Nor
thw
este
rn U
nive
rsity
] at
12:
22 0
9 M
ay 2
016
QUANTITATIVE CHANGE IN COMPLEX SYSTEMS 223
Part 2: Identifying Connections Across Levels
Our second objective is to understand which resources students used to describeconnections across different levels of description as outlined in the CCSframework. In this section, we report patterns in student responses to three ques-tions designed to probe their understandings of various connections across levelsof description. For each question, we feature a table that shows what resourceswere leveraged to describe the relationship between an individual person agentin the simulation and overall population growth and at what level(s) of descrip-tion those resources were used. Each cell in the matrix includes the first initial ofeach student who used a particular combination of resource and level. Initials arealigned across cells to make it easier to track the responses of each student.
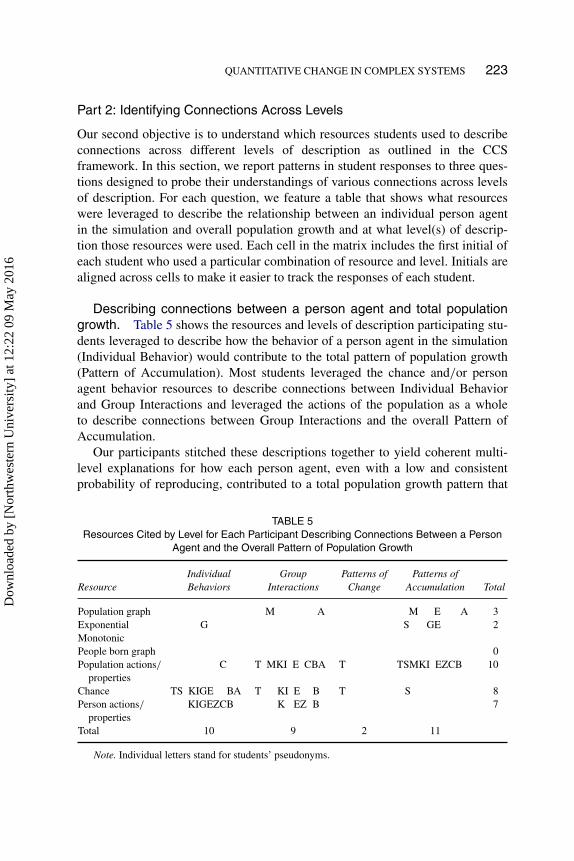
Describing connections between a person agent and total populationgrowth. Table 5 shows the resources and levels of description participating stu-dents leveraged to describe how the behavior of a person agent in the simulation(Individual Behavior) would contribute to the total pattern of population growth(Pattern of Accumulation). Most students leveraged the chance and/or personagent behavior resources to describe connections between Individual Behaviorand Group Interactions and leveraged the actions of the population as a wholeto describe connections between Group Interactions and the overall Pattern ofAccumulation.
Our participants stitched these descriptions together to yield coherent multi-level explanations for how each person agent, even with a low and consistentprobability of reproducing, contributed to a total population growth pattern that
TABLE 5Resources Cited by Level for Each Participant Describing Connections Between a Person
Agent and the Overall Pattern of Population Growth
ResourceIndividualBehaviors
GroupInteractions
Patterns ofChange
Patterns ofAccumulation Total
Population graph M A M E A 3Exponential G S GE 2MonotonicPeople born graph 0Population actions/
propertiesC T MKI E CBA T TSMKI EZCB 10
Chance TS KIGE BA T KI E B T S 8Person actions/
propertiesKIGEZCB K EZ B 7
Total 10 9 2 11
Note. Individual letters stand for students’ pseudonyms.
Dow
nloa
ded
by [
Nor
thw
este
rn U
nive
rsity
] at
12:
22 0
9 M
ay 2
016
224 WILKERSON-JERDE AND WILENSKY
increased at an increasing rate. Most participants described qualitative connec-tions across levels rather than more precise mathematical connections. Indeed, theonly mathematical resource that was heavily leveraged by participants during thisportion of the interview was chance. Even this was not usually used quantitativelybut rather as evidence that individual behavior was probabilistic in general. Thisexcerpt from Irene’s interview is an example:
[Irene] Because there’s so many people like the, it, you eventually have, let’s say100 people there and so someone’s bound to have another person or have anotherreproduce and so that why, that’s why you have a population growth because, as, asthe population grows there’s more chances of people being born.
Although nearly all participants made productive qualitative connectionsacross three of the four main levels of description identified in our framework—Individual Behaviors, Group Interactions, and Patterns of Accumulation—fewexplicitly talked about Patterns of Change during this portion of the interview.
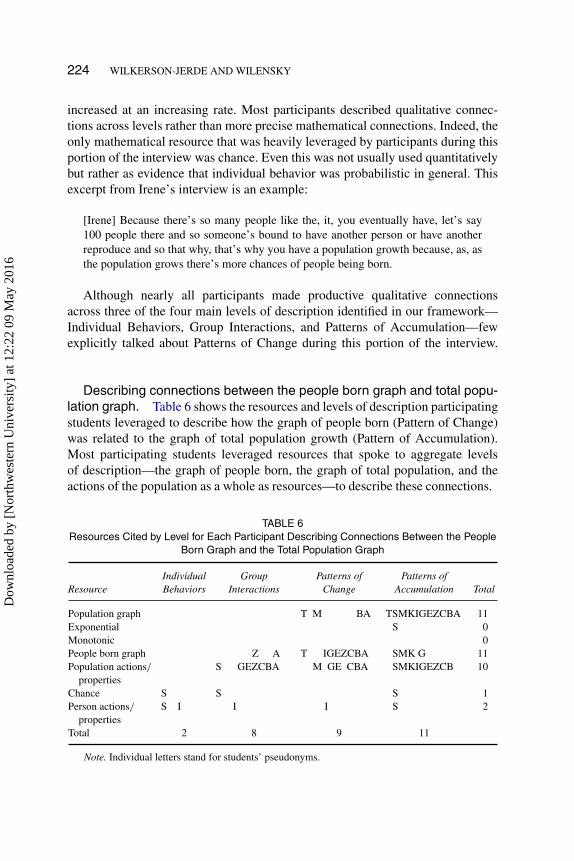
Describing connections between the people born graph and total popu-lation graph. Table 6 shows the resources and levels of description participatingstudents leveraged to describe how the graph of people born (Pattern of Change)was related to the graph of total population growth (Pattern of Accumulation).Most participating students leveraged resources that spoke to aggregate levelsof description—the graph of people born, the graph of total population, and theactions of the population as a whole as resources—to describe these connections.
TABLE 6Resources Cited by Level for Each Participant Describing Connections Between the People
Born Graph and the Total Population Graph
ResourceIndividualBehaviors
GroupInteractions
Patterns ofChange
Patterns ofAccumulation Total
Population graph T M BA TSMKIGEZCBA 11Exponential S 0Monotonic 0People born graph Z A T IGEZCBA SMK G 11Population actions/
propertiesS GEZCBA M GE CBA SMKIGEZCB 10
Chance S S S 1Person actions/
propertiesS I I I S 2
Total 2 8 9 11
Note. Individual letters stand for students’ pseudonyms.
Dow
nloa
ded
by [
Nor
thw
este
rn U
nive
rsity
] at
12:
22 0
9 M
ay 2
016
QUANTITATIVE CHANGE IN COMPLEX SYSTEMS 225
Whereas the connections participants described between Individual Behaviorsand Total Population Growth were typically qualitative, many participantsdescribed mathematical connections between change, accumulation, and groupinteractions by noting that the number of people born is added to the populationand hence changes it. This makes sense given that participants leveraged moremathematical than behavioral resources in general to describe these connections.An excerpt from Zoe’s interview provides one example of how students identifiedthe actions or properties of the population as the underlying cause for quanti-tative connections between Group Interactions and the Patterns of Change andAccumulation:
[Zoe] Um, well, you see the, an increase of people born [indicates people born graph]and that’s because as the population’s growing, you have more population [indicatespopulation graph] to have more kids you’re gonna have more kids born, (okay) sothat’s like the correlation.
Though many students made productive quantitative connections across GroupInteractions, Patterns of Change, and Patterns of Accumulation, few studentsincluded any description of Individual Behaviors as part of their responses. Thisis especially notable because the graphs were generated by the behaviors of theseindividual person agents. Similarly, few students leveraged resources that spokedirectly to individual levels of description, such as chance or person actions.
Across Tables 5 and 6, results reveal that although participating students notedconnections across most levels of description, including levels that were notexplicitly part of the question asked, they rarely leveraged connections betweenIndividual Behaviors and Patterns of Change. Although participants’ connectionsbetween Individual Behavior and Patterns of Accumulation were qualitative andfocused on connections between individual-level and population-level behavior,their connections between Patterns of Change and Patterns of Accumulation werequantitative but did not include the agent level.
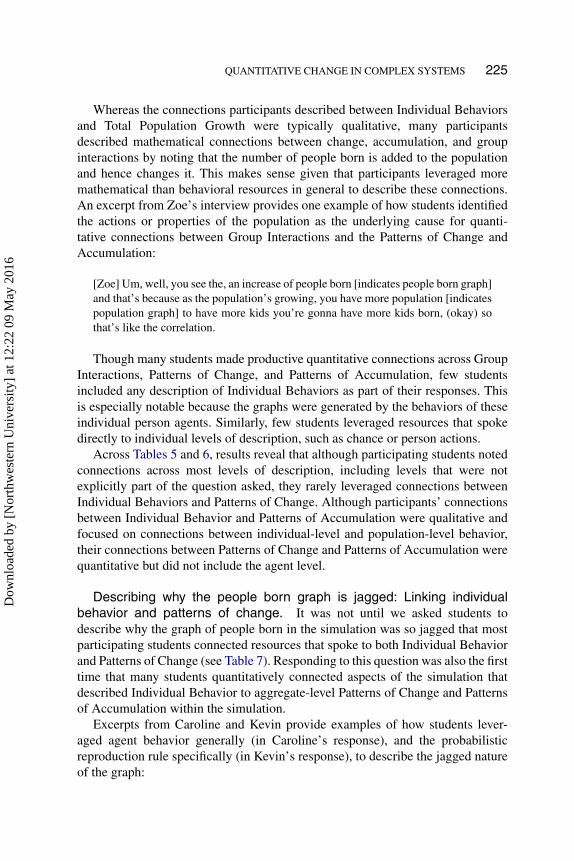
Describing why the people born graph is jagged: Linking individualbehavior and patterns of change. It was not until we asked students todescribe why the graph of people born in the simulation was so jagged that mostparticipating students connected resources that spoke to both Individual Behaviorand Patterns of Change (see Table 7). Responding to this question was also the firsttime that many students quantitatively connected aspects of the simulation thatdescribed Individual Behavior to aggregate-level Patterns of Change and Patternsof Accumulation within the simulation.
Excerpts from Caroline and Kevin provide examples of how students lever-aged agent behavior generally (in Caroline’s response), and the probabilisticreproduction rule specifically (in Kevin’s response), to describe the jagged natureof the graph:
Dow
nloa
ded
by [
Nor
thw
este
rn U
nive
rsity
] at
12:
22 0
9 M
ay 2
016

226 WILKERSON-JERDE AND WILENSKY
TABLE 7Resources Cited by Level for Each Participant Describing Why the People Born Graph Is
Jagged
ResourceIndividualBehaviors
GroupInteractions
Patterns ofChange
Patterns ofAccumulation Total
Population graph B B G B B 2Exponential 0Monotonic 0People born graph TS Z TS KIGEZCB KIG BA T A 10Population actions/properties
A MKIGEZCBA MK G A T 10
Chance S K BA S K B 4Person actions/properties
TSMK EZCBA TSMK EZCB M 9
Total 9 11 6 4
Note. Individual letters stand for students’ pseudonyms.
[Caroline] Um, well, there are, there could be years where no one was born becausethey were wandering around or whatever so they couldn’t reproduce.
[Kevin] Like you said that um, they have a 1% chance of reproducing and forinstance, at the spikes maybe here and here, the, just at that moment of that 1%chance actually occurred, so, they had a higher of reproducing, while at the dips overhere it just didn’t come through and then, um, the other chances of not reproducingkicked in and just right there they didn’t reproduce as much.
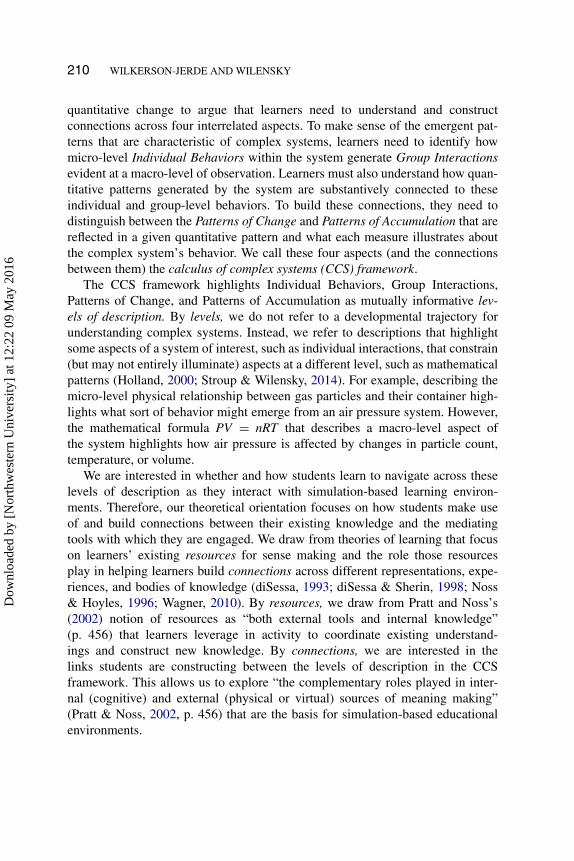
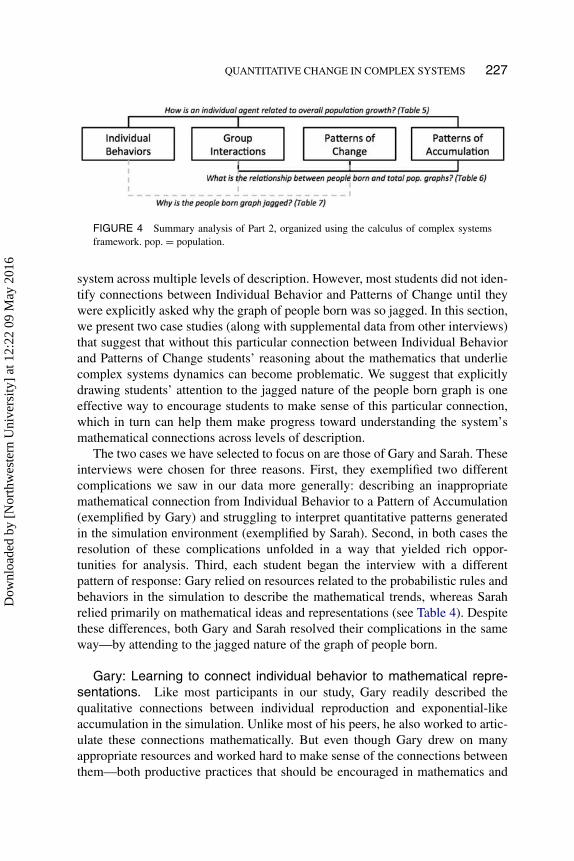
Before being asked about the jagged nature of the people born graph, eventhough they leveraged both mathematical and behavioral resources to make senseof many aspects of the behaviors and quantitative patterns in the simulation,most participating students did not articulate a quantitative connection betweenspecifically individual behavior and quantitative patterns. Figure 4 provides adiagrammatic summary of these findings, using the CCS framework as an organiz-ing device. In the next section, we argue that strengthening connections betweenthe individual behaviors in a system and the patterns of change that result fromthose behaviors is critical for learners to develop fluency with the mathematics ofcomplex systems.
Part 3: Missed Connections, Complications, and Resolutions
Part 2 reveals that the students in our study were adept at making sense of thepopulation growth simulation using both mathematical and behavioral resources.They readily identified many connections across these resources to describe the
Dow
nloa
ded
by [
Nor
thw
este
rn U
nive
rsity
] at
12:
22 0
9 M
ay 2
016
QUANTITATIVE CHANGE IN COMPLEX SYSTEMS 227
FIGURE 4 Summary analysis of Part 2, organized using the calculus of complex systemsframework. pop. = population.
system across multiple levels of description. However, most students did not iden-tify connections between Individual Behavior and Patterns of Change until theywere explicitly asked why the graph of people born was so jagged. In this section,we present two case studies (along with supplemental data from other interviews)that suggest that without this particular connection between Individual Behaviorand Patterns of Change students’ reasoning about the mathematics that underliecomplex systems dynamics can become problematic. We suggest that explicitlydrawing students’ attention to the jagged nature of the people born graph is oneeffective way to encourage students to make sense of this particular connection,which in turn can help them make progress toward understanding the system’smathematical connections across levels of description.
The two cases we have selected to focus on are those of Gary and Sarah. Theseinterviews were chosen for three reasons. First, they exemplified two differentcomplications we saw in our data more generally: describing an inappropriatemathematical connection from Individual Behavior to a Pattern of Accumulation(exemplified by Gary) and struggling to interpret quantitative patterns generatedin the simulation environment (exemplified by Sarah). Second, in both cases theresolution of these complications unfolded in a way that yielded rich oppor-tunities for analysis. Third, each student began the interview with a differentpattern of response: Gary relied on resources related to the probabilistic rules andbehaviors in the simulation to describe the mathematical trends, whereas Sarahrelied primarily on mathematical ideas and representations (see Table 4). Despitethese differences, both Gary and Sarah resolved their complications in the sameway—by attending to the jagged nature of the graph of people born.
Gary: Learning to connect individual behavior to mathematical repre-sentations. Like most participants in our study, Gary readily described thequalitative connections between individual reproduction and exponential-likeaccumulation in the simulation. Unlike most of his peers, he also worked to artic-ulate these connections mathematically. But even though Gary drew on manyappropriate resources and worked hard to make sense of the connections betweenthem—both productive practices that should be encouraged in mathematics and
Dow
nloa
ded
by [
Nor
thw
este
rn U
nive
rsity
] at
12:
22 0
9 M
ay 2
016

228 WILKERSON-JERDE AND WILENSKY
science education—he still struggled to develop a coherent explanation of themathematical connections between individual probabilistic behavior and over-all exponential patterns of accumulation in the simulation. After Michelle drewGary’s attention to the jagged nature of the graph of people born in the simula-tion, however, he began to draw more clear and coherent connections betweenquantitative descriptions of Individual Behaviors, their influence on Patterns ofChange, and resulting Patterns of Accumulation he would expect to see in thesimulation.
In the following excerpt, Michelle had just asked Gary to describe the con-nections between how people agents behaved and the resulting patterns ofaccumulation generated in the simulation. When Gary mentioned that peopleagents had more of a chance of reproducing, Michelle asked him to clarify whathe meant:
1 M: So when you say they have more chance of reproducing if we’re2 talking about that blue guy right there does he have more chance of3 reproducing?4 G: He starts at 1%, right? And it’s 1% every tick isn’t, then isn’t it that5 af—there’s 1% every tick then for every tick that goes his chance6 like increases? or does it, like, I think, yeah.7 M: Can you talk more about that?8 G: If it’s, can I write on?9 M: Yeah, oh yeah, that’s why there’s paper here.
10 G: So there’s, hold on, 1% chance for every tick right? So for, if it’s11 1%, wait, let me think in my head real quick.12 M: Yeah that’s fine, if you can say what you’re thinking, too, you know13 [laughs]14 G: So I’m trying to remember how I do this, if it’s 1% probability per15 tick, over the span of five ticks, I think the probability increases, you16 multiply this, oh wait no, it decreases, I think. Cause it’s .01 to the fifth17 power cause it’s for every tick you multiply again by .01.18 M: I see, so you’re saying for like the blue guy, since, since each tick19 it’s a .01 chance that for five ticks altogether it’s—20 G: .01 times .01 five times. Which is actually smaller then, yeah I think21 it’s smaller.22 M: Does that make sense?23 G: Yeah24 M: Okay, why is that? Like if you just think about a person in the world,25 you know?26 G: Because as they get older, their uh reproduction system it like, it’s27 not as healthy because it peaks at a certain point and then like, as you28 age, it becomes harder to produce like you know, like29 reproduce.
Dow
nloa
ded
by [
Nor
thw
este
rn U
nive
rsity
] at
12:
22 0
9 M
ay 2
016
QUANTITATIVE CHANGE IN COMPLEX SYSTEMS 229
In many ways, what Gary did here was evidence of productive reasoning. Heleveraged a number of relevant resources: his understanding of person behaviorssuch as reproduction and aging, his understanding of the 1% chance simulationrule, and the mathematical idea of exponentials—likely because this was the shapemade by the total population graph and exponential population growth models hadrecently been discussed in class. He also worked to connect these resources in away that was coherent and connected to his understanding of real phenomena.
During the exchange, Gary first noted the individual behavior embodied by thesimulation—that the “blue guy,” an agent within the visualization featured in thesimulation environment, starts at and maintains a 1% chance of reproducing (lines1–3). But in the same turn of talk, Gary also suggested that “every tick that goeshis chance like increases?” (line 4). One possible explanation for this is that Garywas attributing behavior at one level of observation (exponential growth at thepopulation level, P[t] = P0ert) to behavior at another level (individual agents)—that is, exhibiting “slippage between levels” (Wilensky & Resnick, 1999, p. 3).
Next, when Michelle asked Gary to elaborate, he wrote the expression “(.01)5”
to describe what he understood to be an individual agent’s probability of reproduc-ing over 5 units of time (lines 14–17). This is not the exponential growth formulaapplied to an individual but rather a formula that includes an exponential term andcalculates the probability of repeated independent events.4 However, as he wroteand worked through this new mathematical description, Gary realized that thissolution implies that an individual’s likelihood of reproducing would decrease astime increases, in contrast to his initial prediction. Michelle asked him to explainhis calculation again, and he confirmed that an individual’s probability of repro-ducing will decrease over time (lines 20–21) and seemed to accept this descriptionof individual behavior. Michelle asked Gary to make sure that his claim madesense, as it conflicted with what he proposed in lines 4–6 of the excerpt, that anagent’s chance to reproduce should stay the same or increase. Gary responded thata decreasing probability of reproducing makes sense, as it can represent decreasedfertility with age.
One interpretation for the inconsistencies in Gary’s explanation is that indescribing the connection between an individual agent’s behavior and the overallpattern of population growth, Gary actively worked to reconcile the 1% proba-bilistic behavior of individual agents with the exponentially growing behavior ofthe overall population. To do this, he leveraged a formula that included both prob-abilistic and exponential elements: a formula used to calculate probabilities over
4The formula for calculating the probability of repeated independent events is P(e1 and e2 . . . en)= P(e1) × P(e2) . . . P(en), where ex represents an event. In this case the probability for each event,individual reproduction during each successive tick in the simulation, is the same at 1%. This reducesto .01 × .01 × .01 . . . n times, or (.01)n—(.01)5 if one were to seek the probability of five birthshappening in a row.
Dow
nloa
ded
by [
Nor
thw
este
rn U
nive
rsity
] at
12:
22 0
9 M
ay 2
016
230 WILKERSON-JERDE AND WILENSKY
multiple event trials (or in Gary’s case, over multiple ticks) that included an expo-nential term. However, neither the exponential growth formula nor the formula forcalculating the probability of repeated independent events can be applied to indi-vidual behaviors in a way that illuminates how those behaviors connect to overallpopulation growth patterns. We argue that this exchange provides clear evidencethat even though he leveraged appropriate resources and pieced those resourcestogether in creative and locally coherent ways, Gary experienced difficulty cre-ating broadly coherent mathematical connections across Individual Behavior toPatterns of Accumulation.
Later during the same interview, Gary continued to assign this exponential rep-resentation to agent behavior in this way. When at one point he suggested that theexponential trend in population growth resulted from multiplying 1% by smallerversus larger numbers (rather than individual behavior), Michelle asked him howthis corresponded to his earlier claim that individuals had less of a chance toreproduce. Gary said,
Um I think this [pointing to written .015] is uh only counting one person, becauseit’s just one person’s probability, (mhm) but then you also have to take into accountthat there’s multiple people that have that .1, .01 percent chance.
It seems that although here Gary described mathematical patterns in the simulationas they related to Group Interactions rather than Individual Behaviors, he stillapplied the exponential idea directly to Individual Behavior as well.
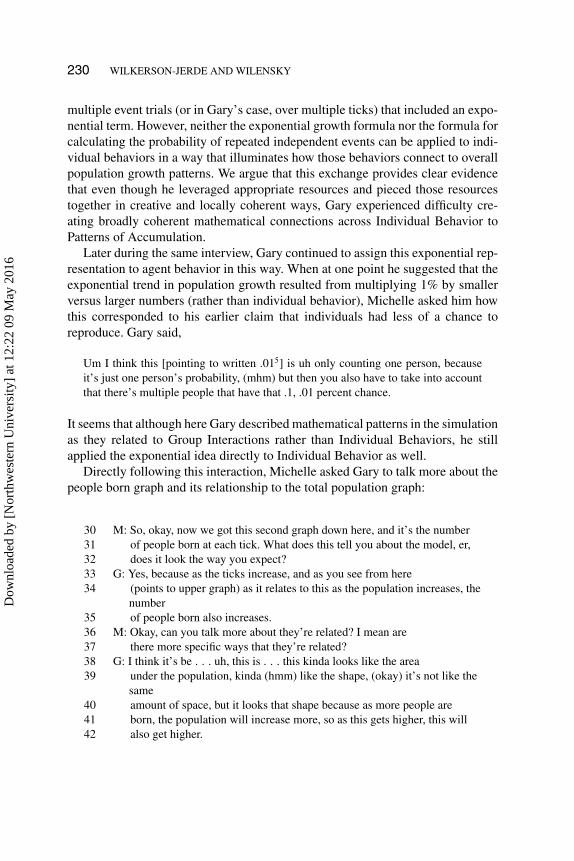
Directly following this interaction, Michelle asked Gary to talk more about thepeople born graph and its relationship to the total population graph:
30 M: So, okay, now we got this second graph down here, and it’s the number31 of people born at each tick. What does this tell you about the model, er,32 does it look the way you expect?33 G: Yes, because as the ticks increase, and as you see from here34 (points to upper graph) as it relates to this as the population increases, the
number35 of people born also increases.36 M: Okay, can you talk more about they’re related? I mean are37 there more specific ways that they’re related?38 G: I think it’s be . . . uh, this is . . . this kinda looks like the area39 under the population, kinda (hmm) like the shape, (okay) it’s not like the
same40 amount of space, but it looks that shape because as more people are41 born, the population will increase more, so as this gets higher, this will42 also get higher.
Dow
nloa
ded
by [
Nor
thw
este
rn U
nive
rsity
] at
12:
22 0
9 M
ay 2
016

QUANTITATIVE CHANGE IN COMPLEX SYSTEMS 231
This time, Gary related both graphs to the system’s behavior at the level ofGroup Interactions—that the number of people born was dependent on the num-ber that were already present in the population (lines 33–34). As he continuedto explain, Gary also articulated the relationship between the people born graphand the total population graph in terms of the mathematical relationship betweenPatterns of Change and Patterns of Accumulation, stating that “ . . . if we start offat fifty and four people are born, then it’s gonna be fifty-four.” However, Gary stilldid not relate the graphs specifically to Individual Behaviors in the simulation.
Next Michelle drew Gary’s attention to the jagged nature of the people borngraph:
43 M: Does it makes sense that this is as jagged as it is?44 G: Um, kinda because, I’m kinda confused by why peaks to45 nothing, like is this over like, is this like just squished amount the ticks,
like is this46 one year at the bottom or is this, like within one— is this one tick47 exactly or is it in between two?
To address Gary’s question, Michelle reran the simulation so that he could seeit draw on the screen. The interview continued:
48 M: If I kept running this model we already predicted what this49 [points to total population graph] would look like, but what would50 this one [points to people born graph] look like you think?51 G: I think it would um, it would either increase or stabilize because,52 does, does this program, uh, uh factor in how old each, like person is?53 M: That’s a good question. It doesn’t now but you can add that later if you54 want.55 G: Cause um if it doesn’t, then it should start to increase because it won’t56 factor in how each person’s probability of 1% will decrease over time,57 but if you do include that then uh the pop— the people born should58 either close to level off because the older people will not produce as59 much while the younger people will produce the same amount and60 since they produce more younger people, it starts, it starts to balance61 out for the people, the older people who are not producing.62 M: Okay I gotcha, okay. Would there, do you think it’d still be as jagged or63 would it smooth out?64 G: I still think it would be jagged because this is just, is this random is it?65 How is it determined, it just does the math based on like the 1%66 chance for people born?
Dow
nloa
ded
by [
Nor
thw
este
rn U
nive
rsity
] at
12:
22 0
9 M
ay 2
016
232 WILKERSON-JERDE AND WILENSKY
In the first excerpt of this case, Gary attempted to directly connect IndividualBehavior to mathematical formalisms in ways that did not maintain the coherenceof agent-level and aggregate-level behavior in the simulation. However, afterattending specifically to the jagged nature of the people born graph, Gary beganto connect his understanding of Individual Behavior (such as the probability ofreproduction; line 56) to the people born graph as a description of the Pattern ofChange in the simulation instead of directly to resources that described Patternsof Accumulation. He then considered how those interactions would produce theresultant quantitative patterns he would expect in mathematical representations inthe simulation (lines 57–61). We return to Gary’s case at the end of this sectionto explore why attending to the jagged nature of the graph might have promptedthis shift.
Sarah: Learning to connect patterns of change to simulationbehavior. During early portions of her interview, Sarah was hesitant to con-nect the mathematical aspects of the simulation to other resources—she rarelycited behavioral resources when responding to questions and never cited resourcesthat spoke specifically to the individual level of behavior. Instead, Sarah reliedon mathematical ideas, procedures, and manipulations of quantitative data to talkabout rate of change and accumulation. Later during the interview, Sarah noticedand started questioning why the graph of people born in the simulation includedunexpected “dips.” With prompting from Michelle, she began to explain the causeof those dips as the probabilistic individual behavior in the simulation—a level ofdescription she had not attended to before describing and working to understandthe dips in the people born graph. After making this connection between individ-ual behavior and patterns of change in the simulation, Sarah was able to interpretthe mathematical ideas she relied on early in the interview in terms of what theyimplied for individual and group-level behavior in the simulation.
In the following excerpt Sarah used the graph of total population and itsexponential nature to describe how she might measure change for one tick inthe simulation. Even when Michelle prompted Sarah to consider other possibleresources available within the simulation, Sarah suggested that she was “stuck” ina mathematical way of thinking:
1 M: Okay, and then one tick, to find the rate of change, what would you2 measure?3 S: You could use derivatives.5 [laughs].
5A mathematical derivative measures how much a function f (x) will change as x changes. HereSarah was proposing to find the derivative of a function that describes total population growth overtime, which would reveal specifically how much the population is changing at a particular time.
Dow
nloa
ded
by [
Nor
thw
este
rn U
nive
rsity
] at
12:
22 0
9 M
ay 2
016
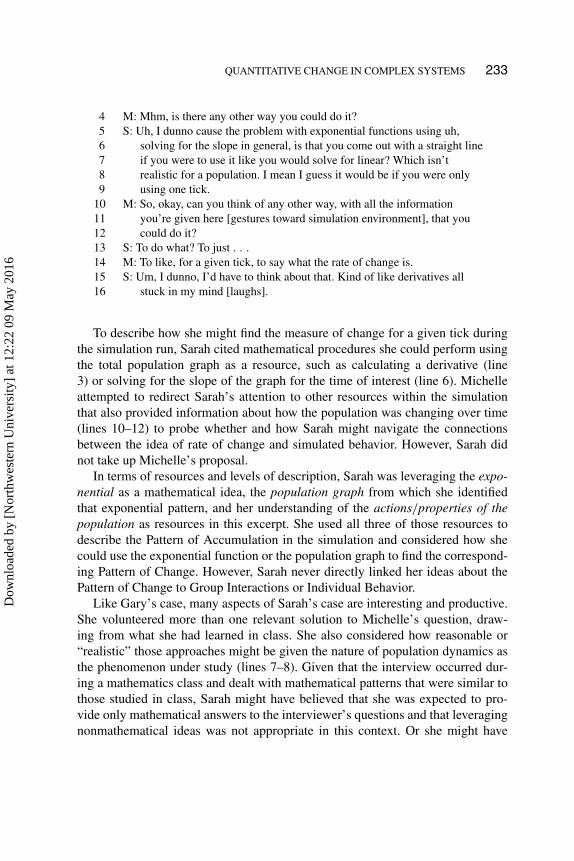
QUANTITATIVE CHANGE IN COMPLEX SYSTEMS 233
4 M: Mhm, is there any other way you could do it?5 S: Uh, I dunno cause the problem with exponential functions using uh,6 solving for the slope in general, is that you come out with a straight line7 if you were to use it like you would solve for linear? Which isn’t8 realistic for a population. I mean I guess it would be if you were only9 using one tick.
10 M: So, okay, can you think of any other way, with all the information11 you’re given here [gestures toward simulation environment], that you12 could do it?13 S: To do what? To just . . .
14 M: To like, for a given tick, to say what the rate of change is.15 S: Um, I dunno, I’d have to think about that. Kind of like derivatives all16 stuck in my mind [laughs].
To describe how she might find the measure of change for a given tick duringthe simulation run, Sarah cited mathematical procedures she could perform usingthe total population graph as a resource, such as calculating a derivative (line3) or solving for the slope of the graph for the time of interest (line 6). Michelleattempted to redirect Sarah’s attention to other resources within the simulationthat also provided information about how the population was changing over time(lines 10–12) to probe whether and how Sarah might navigate the connectionsbetween the idea of rate of change and simulated behavior. However, Sarah didnot take up Michelle’s proposal.
In terms of resources and levels of description, Sarah was leveraging the expo-nential as a mathematical idea, the population graph from which she identifiedthat exponential pattern, and her understanding of the actions/properties of thepopulation as resources in this excerpt. She used all three of those resources todescribe the Pattern of Accumulation in the simulation and considered how shecould use the exponential function or the population graph to find the correspond-ing Pattern of Change. However, Sarah never directly linked her ideas about thePattern of Change to Group Interactions or Individual Behavior.
Like Gary’s case, many aspects of Sarah’s case are interesting and productive.She volunteered more than one relevant solution to Michelle’s question, draw-ing from what she had learned in class. She also considered how reasonable or“realistic” those approaches might be given the nature of population dynamics asthe phenomenon under study (lines 7–8). Given that the interview occurred dur-ing a mathematics class and dealt with mathematical patterns that were similar tothose studied in class, Sarah might have believed that she was expected to pro-vide only mathematical answers to the interviewer’s questions and that leveragingnonmathematical ideas was not appropriate in this context. Or she might have
Dow
nloa
ded
by [
Nor
thw
este
rn U
nive
rsity
] at
12:
22 0
9 M
ay 2
016

234 WILKERSON-JERDE AND WILENSKY
been struggling to understand how the mathematical notions of rate of change thatshe was considering were connected to the specific behavior of the simulation (aproblem not uncommon in mathematics education). We argue that regardless ofwhether it was because of her expectations from the interview or her understand-ing of the simulation, Sarah was clearly not leveraging all of the resources shehad available to connect Patterns of Change to the Individual Behavior or GroupInteractions within the simulation during this exchange, and this interfered withthe degree to which she could describe the system and constituent parts across alllevels of description.
Later Michelle asked Sarah to explain whether the people born graph was whatshe expected in terms of its appearance and trajectory. Sarah responded that shehad previously thought that the graph was “another version of population” thatwould “take the highest and lowest points and find the average between them andthat would somehow equal this [population graph].” Once this became clear, Sarahspontaneously noticed the “dips” in the graph:
17 S: Okay, um, then it’s saying as incre—, as time increases more and more18 are being born throughout the population. It’s kind of easy to look at it19 with these numbers, um, cause you can watch as time increases uh20 people increases cause sometimes like you can see these kind of dips21 um, yeah.22 M: Why do you think those dips are there?23 S: Uh, cause those are the dips that are just like I don’t know how24 to really word it but the, the, I don’t know how to say it, like I can’t say the25 minimum people born [laughs]26 M: Oh yeah I know, I think I know what you’re talking about.27 S: Uh yeah, but, as like opposed to here where the highest peak would be,28 you know what is it, one person? But then most people would have29 zero?
During this exchange, Sarah was beginning to connect her understanding ofthe actions/properties of individual people (people being born) and of the pop-ulation as an entity (more and more people born over time) as resources to thepeople born graph. This allowed her to describe connections between the lev-els of Individual Behavior and Group Interactions. However, it is unclear fromthis excerpt whether at this point Sarah understood that the graph of peopleborn related to the Pattern of Accumulation generated by the simulation, or evenwhether people born represented a Pattern of Change in the simulation.
Given that Sarah understood the graph of people born in a new way, Michelledecided to run the simulation again for her. Sarah responded as follows:
Dow
nloa
ded
by [
Nor
thw
este
rn U
nive
rsity
] at
12:
22 0
9 M
ay 2
016

QUANTITATIVE CHANGE IN COMPLEX SYSTEMS 235
30 S: So um, as time kind of like increases some people won’t be having, like31 people born at certain times, more people won’t be born at certain32 times.33 M: And does that make sense knowing what you know about how this34 works?
35 S: Yeah36 M: And why is that?37 S: Because if they only have a .01 chance of reproducing, it doesn’t mean38 they’re gonna be doing it every second.
During this exchange, Sarah maintained the connections she had articulatedbefore between Individual Behavior and Group Interactions, but this time alsocited the specific probabilistic rules of the simulation as a new resource to describethese levels. Soon afterward, Michelle decided to ask Sarah to articulate the rela-tionship between the graphs of total population and people born again, now thatshe had a better understanding of the latter:
39 S: Um [points at lower graph, then top graph] okay our original40 population is taking this [points to lower graph] added to uh people41 that there were, that there were beforehand, before they were the people42 were born. Um so it’s taking in account to adding to the uh population43 beforehand, which is kind of the deal of exponents which is multiplying44 and multiplying and multiplying from the original45 M: And so does that help you talk about rate of change at all?46 S: In terms of population or in terms of . . . ?47 M: In terms of population.48 S: People weren’t, um, then I guess, oh, I guess this could be the rate of49 change.50 M: And why’s that?51 S: Uh, because, well this divide, is it, yeah, because their rate of52 change is saying like oh, well this is how many people were added to the
original53 population over a period of time54 M: Mhm and how does that relate to kind of like the ideas you learned in55 class?56 S: Um, about derivatives and stuff?57 M: Yeah.58 S: Um, that derivatives is basically taking like an exact point divided by59 another exact point finding the exact um, like change, but this gives us60 the exact change over the exact time. It gives us the exact number of61 people born at a certain time which is what derivatives is, is solving for.
Dow
nloa
ded
by [
Nor
thw
este
rn U
nive
rsity
] at
12:
22 0
9 M
ay 2
016
236 WILKERSON-JERDE AND WILENSKY
In the first excerpt of this case, Sarah was unable or unwilling to articulate theconnection between her understanding of the Pattern of Change in the simulation(which she thought of as derived mathematically from an exponential) and theIndividual Behavior or Group Interactions in the simulation. After attending toand making sense of the jagged nature of the people born graph, however, Sarahwas able to use that graph to describe Individual Behaviors and Group Interactionswithin the simulation (lines 17–38). She then related those behaviors to the totalpopulation graph by noting that the number of people who are born are addedto the total population (lines 39–42). It is important to note that this means thatSarah was implicitly using a measure of the population as an entity—the totalborn during a tick of time—as a resource to describe a Pattern of Change. Becausethe number of people born depends on the size of the existing population, Sarahwas also able to coordinate her understanding of the actions/properties of thepopulation as a Pattern of Change with her understanding of how exponentialgrowth describes a Pattern of Change as “multiplying and multiplying from theoriginal” (line 44).
It appears that it is not until lines 48–49 that Sarah referred to the graph ofpeople born itself as an expression of the Pattern of Change exhibited by the sim-ulation. However, by this point she had added behavioral descriptions of Patternsof Change, based on the collective sum of agent births over time, to her previousmathematically based understandings of Patterns of Change that were based onher ideas about derivative. This time, Sarah was able to articulate this notion ofderivative in terms of the specific behaviors and interactions in the simulation thatgenerate population growth.
Synthesis of the case studies: Connecting individual behavior and pat-terns of change. We claim that although the two complications exhibited byGary and Sarah seem different, both emerged because these students did not attendto the connections between Individual Behavior and Patterns of Change in thesimulation. For this reason, both were resolved by drawing Gary and Sarah’sattention explicitly to the jagged graph of people born. This prompted each stu-dent to attend to how the probabilistic and agent-based resources that describedIndividual Behavior (probabilistic reproduction) also emerged within mathemati-cally based descriptions of Patterns of Change (making the graph of people bornjagged even though it was mathematically unexpected). Once this happened, theconnection between Individual Behavior and Pattern of Change enabled learnersto construct coherent quantitative understandings across all levels of descriptionillustrated within the simulation.
In Gary’s case, the lack of a connection between Individual Behavior andPatterns of Change led him to connect descriptions of Individual Behavior in thesimulation directly to Patterns of Accumulation without considering that mul-tiple individuals should be aggregated first. Even when asked to describe the
Dow
nloa
ded
by [
Nor
thw
este
rn U
nive
rsity
] at
12:
22 0
9 M
ay 2
016
QUANTITATIVE CHANGE IN COMPLEX SYSTEMS 237
relationship between the graph of people born and the graph of total population,Gary did not describe either graph as representing only a collective measure ofmany individuals. However, once he was asked to attend to why the graph ofpeople born was jagged, Gary linked this graph to the probabilistic behavior ofmultiple individual agents in the simulation. This provided Gary with a way toconsider the role of multiple individuals collectively contributing to quantitativepatterns, rather than those patterns being assigned to a particular agent.
In Sarah’s case, the lack of a connection between Individual Behavior andPatterns of Change led her to ignore the relationship between mathematicaldescriptions of Patterns of Change (such as the idea of a derivative, or a rate ofchange) and what those ideas represented within the simulation itself. Like Gary,Sarah began to connect the idea of probabilistic behavior to the graph of peopleborn once she was asked to explain why that graph was so jagged. Once this con-nection was made, Sarah recognized the graph of people born both as a measureof change in the mathematical descriptions of population as well as a measure ofthe results of the probabilistic reproduction behavior the simulation was based on.
Although Gary and Sarah were the clearest examples of the complications thatcan emerge from a missed connection between Individual Behavior and Patternsof Change, there was evidence that other students experienced similar difficulties.In addition to Gary, four other students (including Sarah) explicitly attempted toconnect individual behavior directly to the graph of population or the idea of anexponential. These attempts led to statements like “even though it stays at .01 itseems it’s becoming exponential” (Eddie) or “I don’t know, but it is increasingexponentially, so uh, each person you said has a 1% chance of reproducing, solike, I dun, I don’t know how to explain it” (Caroline). In addition to Sarah, threeother students referenced the people born graph as though it were a measure oftotal population or a representation of raw population data from which the totalpopulation graph was determined using a line of best fit and struggled to connectit to other aspects of the simulation.
It is interesting that the two complications we explored here emerged fromtwo different sides of the Individual Behavior to Pattern of Change connection:Gary struggled to connect Individual Behavior to other resources in the simula-tion, whereas Sarah struggled to connect Patterns of Change to other resourcesin the simulation. In both cases, it is unclear whether Sarah or Gary made theseerrors based on their actual understandings of the system or because they thoughttheir task was to focus on mathematical relationships of the sort they had studiedin class. In other words, Gary and Sarah might not have known the connectionsbetween Individual Behavior and Patterns of Change or might not have thoughtthat those connections were relevant for this particular class. Either way, attendingto the jagged nature of the people born graph helped them privilege those connec-tions so that they could better understand the relationships between the behavioraland quantitative aspects of the population growth simulation.
Dow
nloa
ded
by [
Nor
thw
este
rn U
nive
rsity
] at
12:
22 0
9 M
ay 2
016
238 WILKERSON-JERDE AND WILENSKY
DISCUSSION
Interacting with agent-based simulations is a promising way to engage students inthinking about complex scientific systems. However, little is known about whetheror how students make sense of the mathematical representations that accompanythose simulations. In this article, we take a first step toward understanding howstudents make sense of the mathematical aspects of agent-based simulations, whatdifficulties they may experience doing so, and how to support students in build-ing those connections. Drawing from research on how students think and learnabout complex systems and the mathematics of change and variation, we devel-oped the CCS framework as an analytic tool. The CCS framework highlights theimportance of understanding and connecting the (a) Individual Behaviors thatmake up a complex system, (b) Group Interactions that emerge within that sys-tem, (c) Patterns of Change the system exhibits over time, and (d) Patterns ofAccumulation that are often used to describe and track the system’s dynamicsin order to fluently make sense of a complex system and its quantitative aspects.We used this framework to analyze how students who had recently studied themathematics of exponential growth made sense of an agent-based simulationthat generated simple exponential-like population growth from probabilistic rules.This allowed us to focus on what new ways of reasoning and challenges arosespecifically when learners worked to make sense of complex systems, in whichmathematical patterns are often generated by multiple, simultaneous, probabilisticunderlying events.
Our analysis suggests that students were adept at describing many connec-tions between simulation behavior and the mathematical patterns it producedacross most levels of description identified in the CCS framework. For exam-ple, when asked to explain why particular quantitative patterns emerged withinthe simulation (Patterns of Accumulation), almost all of the students we inter-viewed cited the behavior of the simulated population (Group Interactions) in themodel at least once. When asked to explain why the quantitative pattern in thesimulation changed the way it did (Patterns of Change), nearly all students citedagent behaviors or the probabilistic nature of the simulation (Individual Behavior).Similarly, when asked to describe the connections between different resourceswithin the simulation (such as the available graphs, visuospatial rendering of thesimulation, simulation rules, and mathematical ideas), most students generatedexplanations that incorporated multiple levels of description, including predomi-nantly behavioral aspects such as Individual Behaviors or Group Interactions aswell as predominantly mathematical ones such as Patterns of Change or Patternsof Accumulation.
However, although our participants clearly understood the mutual relevance ofbehavioral and mathematical resources for making sense of the simulation as awhole, there were some missing connections in their descriptions. Although they
Dow
nloa
ded
by [
Nor
thw
este
rn U
nive
rsity
] at
12:
22 0
9 M
ay 2
016
QUANTITATIVE CHANGE IN COMPLEX SYSTEMS 239
could provide mathematically sophisticated descriptions and specific quantitativeexamples of the connections between Group Behavior, Patterns of Change, andPatterns of Accumulation, Individual Behaviors were not part of those descrip-tions. Instead, connections between Individual Behaviors, Patterns of Change, andPatterns of Accumulation were described qualitatively, with a focus on generaltrends rather than measurable mathematical aspects. Students did not engage withthe mathematical contributions of Individual Behaviors in the simulation, eventhough the quantitative patterns within the simulation were generated exclusivelyby those behaviors (i.e., the 1% probability for reproduction that translated to anapproximate, though jagged, 1% rate of population growth). When they did, theyoften experienced difficulties or inconsistencies.
Our analysis suggested one possible source for this problem in connectingmathematical aspects of individual behaviors to the quantitative patterns gener-ated by the simulation. Looking across students’ responses to different interviewquestions, we found that most students did not attend to connections specificallybetween Individual Behavior and Patterns of Change. When they talked about oneof these levels of description, they did not talk about the other. Participating stu-dents only began to articulate these connections when we asked them specificallywhy the graph of people born (which represented the Pattern of Change) was sojagged (a result of Individual Behavior—the probabilistic reproduction rule in thesimulation—that was much more exaggerated than it was in the graph of totalpopulation growth). We conjectured that attending to this graph’s jagged naturehelped engage students in constructing connections across Individual Behaviorsand Patterns of Change that could then address the errors and difficulties theyexperienced when describing the mathematical influence of individual behavior.
We explored this conjecture further through two case studies that reflectedbroader patterns in our data. One student, Gary, attempted to directly attach anexponential formula to individual behavior, which led him to a contradictory inter-pretation of individual behavior in the simulation. After attending to the jaggedpeople born graph, he more clearly articulated how he expected individual patternsof reproduction to quantitatively contribute to change in the population, ultimatelychanging overall patterns of growth. Another student, Sarah, relied mainly onmathematical procedures to describe patterns of change in the simulation but washesitant to interpret what those procedures meant in the context of the simulation.After noticing and working to make sense of unexpected dips in the people borngraph, Sarah connected the probabilistic reproduction of individual agents in thesimulation to this quantitative representation of change. She later meaningfullyinterpreted taking the derivative of population growth as finding the change in thenumber of people in the simulation. We argue that in both of these cases, Gary andSarah already possessed productive resources for making sense of the simulationand productive dispositions. However, the jagged nature of the people born graphprovided an organizing device that helped them connect those resources into a
Dow
nloa
ded
by [
Nor
thw
este
rn U
nive
rsity
] at
12:
22 0
9 M
ay 2
016
240 WILKERSON-JERDE AND WILENSKY
meaningful, coherent understanding of the simulation, its quantitative output, andrelated mathematical ideas.
These findings have implications for research on complex systems thinkingand the design of learning environments. In terms of complex systems thinking,our findings highlight nuances in what it means to understand the relationshipbetween levels of observation (or levels of thinking, as described in Levy &Wilensky, 2008; Wilensky & Resnick, 1999) and their relationship to measurablepatterns and mathematical formalisms. Often, simulation-based learning environ-ments for complex systems include quantitative patterns such as the emergenceof dynamic equilibrium in ecological systems (Wilensky & Reisman, 2006) orcanonical mathematical formulas such as the Maxwell-Boltzmann distribution law(Wilensky, 2003) as part of their learning objectives. However, these quantitativepatterns are calculated through aggregation mechanisms that are not readily appar-ent to students, and little work has been done to explore what reasoning is neededfor learners to build those connections (Chi et al., 2012).
Our findings suggest that even if students are quite comfortable describing rela-tionships between levels of the behavior of the system, and even between somequantitative and mathematical aspects of those same systems, they still may notattend to the relationship between the agent-level behaviors that comprise a sys-tem and their measurable contributions to those quantitative patterns. This in turncan lead to specifically quantitative forms of complex systems difficulties, such asslippage between (mathematical) levels. It also limits the degree to which learn-ers might be able to interpret the implications of those quantitative patterns, andtheir corresponding mathematical representations and predictions, for constituentagents in the system and hence the complex system as a whole.
For participating students in our study, building these connections was notparticularly difficult or inaccessible. When we drew learners’ attention to math-ematical resources that emphasized the ongoing probabilistic contributions ofindividual agents, learners began to identify new connections across resourcesthey were already using that helped them navigate the quantitative and measur-able contributions of individual agent behaviors. In our case, the graph of peopleborn helped learners recognize this connection because it featured dramatic andunexpected jags or dips that could only be reasonably explained by connecting itto the probabilistic aspect of the simulation rules.
Together, these findings have important implications for the design ofsimulation-based environments for learning about complex systems. Designerscannot assume that simply including quantitative descriptions of systems such asgraphs alongside visuospatial and programmatic representations of those systemsimplies that students will automatically work to make sense of how the system,its constituent members, and its behavior are reflected in those graphs. However,encouraging students to attend to and make sense of resources at the intersectionof Individual Behavior and Patterns of Change that illustrate clearly how nuances
Dow
nloa
ded
by [
Nor
thw
este
rn U
nive
rsity
] at
12:
22 0
9 M
ay 2
016
QUANTITATIVE CHANGE IN COMPLEX SYSTEMS 241
of agent-level behavior contribute to and are recorded within larger quantita-tive measures can help foster such connections. We have also been exploringthe potential of allowing students themselves to construct agent-based simula-tions and linked quantitative representations using high-level descriptions of agentbehaviors, with the goal of foregrounding the connections between individualbehaviors, their quantitative manifestations, and how the result of those behaviorscan be measured over time (Wilkerson-Jerde, 2012; Wilkerson-Jerde & Wilensky,2010).
This study also illustrates the utility of the CCS framework we introduce asan analytic tool and guide for environment design. The framework allowed usto identify what resources students relied on for different patterns of quantitativechange. It also brought students’ inattention to the connections between IndividualChange and Patterns of Change to the surface as a potential reason why somestudents struggled to make mathematical connections in the simulation. Althoughour current study dealt with relatively simple emergent behavior in the particularcontext of agent-based simulations, we believe that the framework holds promisefor informing the study of student reasoning about quantitative change in complexsystems more generally.
Finally, this study illustrates the importance of explicitly attending to quantita-tive and mathematical issues in the context of complex systems reasoning. Thereare nuanced and powerful connections between the individual agents that makeup a complex system and the quantitative and mathematical methods that thoseagents generate together over time. Exploring these connections is not currentlyemphasized in curricula, has not been explored much in the literature, and wasnot spontaneously undertaken by students in our study. However, these connec-tions were certainly accessible to learners and led Gary and Sarah to engage inmeaningful and sophisticated reasoning that allowed them to clarify and elabo-rate their understandings of the system more generally. Given the prevalence ofmathematical representations in the study of science, complex systems, and eveneducational simulations, we argue that mathematical and quantitative reasoningshould be considered key components of complex systems fluency.
ACKNOWLEDGMENTS
This research is based on portions of Michelle Wilkerson-Jerde’s doctoral disser-tation, completed at Northwestern University under the guidance of Uri Wilensky(chair), Richard Noss, Bruce Sherin, and David Uttal. An earlier version of thisarticle was presented at the 2010 annual meeting of the American EducationalResearch Association. This work would not have been possible without thecollaboration of the school, teacher, and students who participated. We thankCaroline Hagen, Jessica Watkins, Rosemary Russ, Christopher Macrander, Janet
Dow
nloa
ded
by [
Nor
thw
este
rn U
nive
rsity
] at
12:
22 0
9 M
ay 2
016

242 WILKERSON-JERDE AND WILENSKY
Walkoe, and Jenna Conversano for their feedback and help. We also thank IrisTabak, Cindy Hmelo-Silver, and our anonymous reviewers for their careful andconstructive reviews of prior drafts of this article.
ORCID
Michelle Hoda Wilkerson-Jerde http://orcid.org/0000-0001-8250-068X
FUNDING
This work was supported by the National Science Foundation under Grant No.DRL-1020101 (principal investigator: Wilensky). Any opinions, findings, andconclusions or recommendations are our own and do not necessarily reflect theviews of the National Science Foundation.
REFERENCES
Abrahamson, D., & Wilensky, U. (2005). ProbLab goes to school: Design, teaching, and learning ofprobability with multi-agent interactive computer models. In M. Bosch (Ed.), Proceedings of theFourth Congress of the European Society for Research in Mathematics Education. (pp. 570–579).San Feliu de Gixols, Spain: Universitat Ramon Llull, FUNDEMI IQS.
American Association for the Advancement of Science. (1993). Benchmarks for science literacy. NewYork, NY: Oxford University Press.
Bar-Yam, Y. (2003). Dynamics of complex systems. Reading, MA: Perseus Books.Begel, A., & Klopfer, E. (2005). StarLogo: A programmable complex systems modeling environment
for students and teachers. In A. I. Adamatzky & M. Komosinski (Eds.), Artificial life models insoftware (pp. 187–210). London, England: Springer-Verlag.
Blikstein, P., & Wilensky, U. (2009). An atom is known by the company it keeps: A constructionistlearning environment for materials science using agent-based modeling. International Journal ofComputers for Mathematical Learning, 14(2), 81–119.
Carlson, M., Jacobs, S., Coe, E., Larsen, S., & Hsu, E. (2002). Applying covariational reasoningwhile modeling dynamic events: A framework and a study. Journal for Research in MathematicsEducation, 33(5), 352–378.
Casti, J. L. (1994). Complexification: Explaining a paradoxical world through the science of surprise.New York, NY: HarperCollins.
Chi, M. T. H. (2005). Commonsense conceptions of emergent processes: Why some misconceptionsare robust. Journal of the Learning Sciences, 14, 161–199.
Chi, M. T. H., Roscoe, R. D., Slotta, J. D., Roy, M., & Chase, C. C. (2012). Misconceived causalexplanations for emergent processes. Cognitive Science, 36(1), 1–61.
Chinn, C. A., & Malhotra, B. A. (2002). Epistemologically authentic inquiry in schools: A theoreticalframework for evaluating inquiry tasks. Science Education, 86(2), 175–218.
Clark, D., Nelson, B., Sengupta, P., & D’Angelo, C. (2009, September). Rethinking science learn-ing through digital games and simulations: Genres, examples, and evidence. Presentation at the
Dow
nloa
ded
by [
Nor
thw
este
rn U
nive
rsity
] at
12:
22 0
9 M
ay 2
016
QUANTITATIVE CHANGE IN COMPLEX SYSTEMS 243
Learning Science: Computer Games, Simulations, and Education workshop sponsored by theNational Academy of Sciences, Washington, DC.
Clement, J. (2000). Analysis of clinical interviews: Foundations and model viability. In A. Kelly &R. Lesh (Eds.), Handbook of research design in mathematics and science education (pp. 547–589).Mahwah, NJ: Erlbaum.
Colella, V. (2000). Participatory simulations: Building collaborative understanding through immersivedynamic modeling. Journal of the Learning Sciences, 9, 471–500.
Common Core State Standards Initiative. (2010). Common Core State Standards for mathematics.Retrieved from http://www.corestandards.org/assets/CCSSI_Math%20Standards.pdf
Confrey, J., & Smith, E. (1994). Exponential functions, rates of change, and the multiplicative unit.Educational Studies in Mathematics, 26(2), 135–164.
Confrey, J., & Smith, E. (1995). Splitting, covariation, and their role in the development of exponentialfunctions. Journal for Research in Mathematics Education, 26(1), 66–86.
diSessa, A. A. (1993). Toward an epistemology of physics. Cognition and Instruction, 10(2–3),105–225.
diSessa, A. A., & Sherin, B. L. (1998). What changes in conceptual change? International Journal ofScience Education, 20, 1155–1191.
Doerr, H. M. (2000). How can I find a pattern in this random data? The convergence of multiplicativeand probabilistic reasoning. Journal of Mathematical Behavior, 18, 431–454.
Feltovich, P. J., Coulson, R. L., & Spiro, R. J. (2001). Learners’ (mis)understanding of importantand difficult concepts. In K. D. Forbus & P. J. Feltovich (Eds.), Smart machines in education: Thecoming revolution in educational technology (pp. 349–375). Cambridge, MA: MIT Press.
Forrester, J. W. (1994, June). Learning through system dynamics as preparation for the 21st cen-tury. Keynote paper presented at the Systems Thinking and Dynamic Modeling Conference forK–12 Education, Concord, MA.
Ganter, S. L. (2001). Changing calculus: A report on evaluation efforts and national impact from1988–1998. Washington, DC: Mathematical Association of America.
Ginsburg, H. (1997). Entering the child’s mind: The clinical interview in psychological research andpractice. Cambridge, England: Cambridge University Press.
Goldstone, R. L. (2006). The complex systems see-change in education. Journal of the LearningSciences, 15, 35–43.
Goldstone, R. L., & Janssen, M. A. (2005). Computational models of collective behavior. Trends inCognitive Sciences, 9, 424–430.
Goldstone, R. L., & Wilensky, U. (2008). Promoting transfer by grounding complex systemsprinciples. Journal of the Learning Sciences, 17, 465–516.
Guckenheimer, J., & Ottino, J. (2008). Foundations for complex systems research in the physicalsciences and engineering. Washington, DC: National Science Foundation.
Hmelo, C. E., Holton, D. L., & Kolodner, J. L. (2000). Designing to learn about complex systems.Journal of the Learning Sciences, 9, 247–298.
Hmelo-Silver, C. E., & Azevedo, R. (2006). Understanding complex systems: Some core challenges.Journal of the Learning Sciences, 15, 53–61.
Hmelo-Silver, C. E., & Pfeffer, M. G. (2004). Comparing expert and novice understanding of a com-plex system from the perspective of structures, behaviors, and functions. Cognitive Science, 28(1),127–138.
Holland, J. H. (2000). Emergence: From chaos to order. Oxford, England: Oxford University Press.Jacobson, M. J. (2001). Problem solving, cognition, and complex systems: Differences between
experts and novices. Complexity, 6(3), 41–49.Johnson, H. L. (2012). Reasoning about variation in the intensity of change in covarying quantities
involved in rate of change. Journal of Mathematical Behavior, 31(3), 313–330.
Dow
nloa
ded
by [
Nor
thw
este
rn U
nive
rsity
] at
12:
22 0
9 M
ay 2
016
244 WILKERSON-JERDE AND WILENSKY
Kaput, J. J. (1994). Democratizing access to calculus: New routes to old roots. In A. H. Schoenfeld(Ed.), Mathematical thinking and problem solving (pp. 77–156). Hillsdale, NJ: Erlbaum.
Keene, K. A. (2007). A characterization of dynamic reasoning: Reasoning with time as parameter.Journal of Mathematical Behavior, 26(3), 230–246.
Klopfer, E., & Yoon, S. (2004). Developing games and simulations for today and tomorrow’s techsavvy youth. TechTrends, 49(3), 33–41.
Kolodner, J. L. (Ed.). (2006). Introduction to special strand on complex systems [Special issue].Journal of the Learning Sciences, 15(1).
Levy, S. T., & Wilensky, U. (2008). Inventing a “mid level” to make ends meet: Reasoning betweenthe levels of complexity. Cognition and Instruction, 26(1), 1–47.
Mitchell, M. (2009). Complexity: A guided tour. New York, NY: Oxford University Press.National Research Council. (2003). Bio2010: Transforming undergraduate education for future
research biologists. Washington, DC: National Academies Press.National Research Council. (2012a). Discipline-based education research: Understanding and
improving learning in undergraduate science and engineering. Washington, DC: NationalAcademies Press.
National Research Council. (2012b). A framework for K-12 science education: Practices, crosscuttingconcepts, and core ideas. Washington, DC: National Academies Press.
Nemirovsky, R. (1994). On ways of symbolizing: The case of Laura and the velocity sign. Journal ofMathematical Behavior, 13, 389–422.
Noss, R., & Hoyles, C. (1996). Windows on mathematical meanings: Learning cultures and computers.Dordrecht, The Netherlands: Kluwer.
Penner, D. E. (2000). Explaining systems: Investigating middle school students’ understanding ofemergent phenomena. Journal of Research in Science Teaching, 37, 784–806.
Perkins, D. N., & Grotzer, T. A. (2005). Dimensions of causal understanding: The role of complexcausal models in students’ understanding of science. Studies in Science Education, 41, 117–165.
Piaget, J. (1970). The child’s conception of movement and speed. London, England: Routledge &Kegan Paul.
Pratt, D., & Noss, R. (2002). The microevolution of mathematical knowledge: The case of randomness.Journal of the Learning Sciences, 11, 453–488.
Repenning, A., Ioannidou, A., & Zola, J. (2000). AgentSheets: End-user programmable simulations.Journal of Artificial Societies and Social Simulation, 3(3). Retrieved from http://jasss.soc.surrey.ac.uk/3/3/forum/1.html
Resnick, M., & Wilensky, U. (1998). Diving into complexity: Developing probabilistic decentralizedthinking through role-playing activities. Journal of the Learning Sciences, 7, 153–172.
Roth, W. M., & Bowen, G. M. (2003). When are graphs worth ten thousand words? An expert-expertstudy. Cognition and Instruction, 21, 429–473.
Sandholm, W. H. (2010). Population games and evolutionary dynamics. Cambridge, MA: MIT Press.Schwartz, J. (1988). Intensive quantity and referent transforming arithmetic operations. In J. Hiebert
& M. Behr (Eds.), Number concepts and operations in the middle grades (pp. 41–52). Reston, VA:National Council of Teachers of Mathematics.
Sengupta, P., & Wilensky, U. (2009). Learning electricity with NIELS: Thinking with electrons andthinking in levels. International Journal of Computers for Mathematical Learning, 14(1), 21–50.
Smith, C. P., Feld, S. C., & Franz, C. E. (1992). Methodological considerations: Steps in researchemploying content analysis systems. In C. P. Smith, J. W. Atkinson, D. C. McClelland, & J. Veroff(Eds.), Motivation and personality: Handbook of thematic content analysis (pp. 515–536). NewYork, NY: Cambridge University Press.
Stroup, W. M. (2002). Understanding qualitative calculus: A structural synthesis of learning research.International Journal of Computers for Mathematical Learning, 7(2), 167–215.
Dow
nloa
ded
by [
Nor
thw
este
rn U
nive
rsity
] at
12:
22 0
9 M
ay 2
016
QUANTITATIVE CHANGE IN COMPLEX SYSTEMS 245
Stroup, W. M., & Wilensky, U. (2014). On the embedded complementarity of agent-based and aggre-gate reasoning in students’ developing understanding of dynamic systems. Technology, Knowledgeand Learning, 19(1–2), 19–52.
Tan, J., & Biswas, G. (2007). Simulation-based game learning environments: Building and sustain-ing a fish tank. In J. S. Sichman, R. Conte, & N. Gilbert (Eds.), Proceedings of the First IEEEInternational Workshop on Digital Game and Intelligent Toy Enhanced Learning (DIGITEL’07)(pp. 73–80). Piscataway, NJ: IEEE Press.
Thompson, P. W. (1994). Images of rate and operational understanding of the fundamental theorem ofcalculus. Educational Studies in Mathematics, 26(2), 229–274.
Van Dyke Parunak, H., Savit, R., & Riolo, R. (1998). Agent-based modeling vs. equation-basedmodeling: A case study and users’ guide. In Proceedings of Multi-Agent Systems and Agent-BasedSimulation (MABS ‘98) (pp. 10–25). Berlin, Germany: Springer.
Vattam, S. S., Goel, A. K., Rugaber, S., Hmelo-Silver, C. E., Jordan, R., Gray, S., & Sinha, S.(2011). Understanding complex natural systems by articulating structure-behavior-function models.Educational Technology & Society, 14(1), 66–81.
Wagner, J. F. (2010). A transfer-in-pieces consideration of the perception of structure in the transfer oflearning. Journal of the Learning Sciences, 19, 443–479.
White, P., & Mitchelmore, M. (1996). Conceptual knowledge in introductory calculus. Journal forResearch in Mathematics Education, 27(1), 79–95.
Wilensky, U. (1997). What is normal anyway? Therapy for epistemological anxiety. EducationalStudies in Mathematics, 33, 171–202.
Wilensky, U. (1999). NetLogo [Computer software]. Evanston, IL: Northwestern University, Centerfor Connected Learning and Computer-Based Modeling. Available at http://ccl.northwestern.edu/netlogo/
Wilensky, U. (2003). Statistical mechanics for secondary school: The GasLab multi-agent modelingtoolkit. International Journal of Computers for Mathematical Learning, 8(1), 1–41.
Wilensky, U., & Jacobson, M. (in press). Complex systems in the learning sciences. In R. K. Sawyer(Ed.), The Cambridge handbook of the learning sciences (2nd ed.). Cambridge, England: CambridgeUniversity Press.
Wilensky, U., & Reisman, K. (2006). Thinking like a wolf, a sheep, or a firefly: Learning biol-ogy through constructing and testing computational theories—An embodied modeling approach.Cognition and Instruction, 24(2), 171–209.
Wilensky, U., & Resnick, M. (1999). Thinking in levels: A dynamic systems approach to making senseof the world. Journal of Science Education and Technology, 8(1), 3–19.
Wilensky, U., & Stroup, W. (2000). Networked gridlock: Students enacting complex dynamic phe-nomena with the HubNet architecture. In B. Fishman & S. O’Connor-Divelbiss (Eds.), Proceedingsof the Fourth Annual International Conference for the Learning Sciences (pp. 282–289). Mahwah,NJ: Erlbaum.
Wilkerson-Jerde, M. H. (2012). The deltatick project: Learning quantitative change in complex sys-tems with expressive technologies (Doctoral dissertation). Available from ProQuest Dissertationsand Theses database. (Order No. AAI3499652)
Wilkerson-Jerde, M. H., & Wilensky, U. (2010). Restructuring change, interpreting changes: Thedeltatick modeling and analysis toolkit. In J. Clayson & I. Kalas (Eds.), Proceedings of theConstructionism 2010 Conference (pp. 97–107). Bratislava, Slovakia: Library and PublishingCentre, Faculty of Mathematics, Physics and Informatics, Comenius University.
Dow
nloa
ded
by [
Nor
thw
este
rn U
nive
rsity
] at
12:
22 0
9 M
ay 2
016
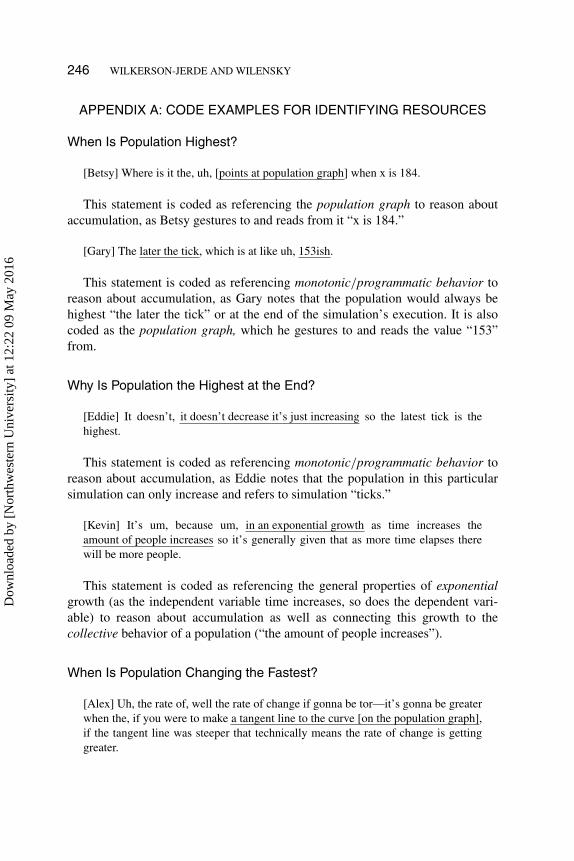
246 WILKERSON-JERDE AND WILENSKY
APPENDIX A: CODE EXAMPLES FOR IDENTIFYING RESOURCES
When Is Population Highest?
[Betsy] Where is it the, uh, [points at population graph] when x is 184.
This statement is coded as referencing the population graph to reason aboutaccumulation, as Betsy gestures to and reads from it “x is 184.”
[Gary] The later the tick, which is at like uh, 153ish.
This statement is coded as referencing monotonic/programmatic behavior toreason about accumulation, as Gary notes that the population would always behighest “the later the tick” or at the end of the simulation’s execution. It is alsocoded as the population graph, which he gestures to and reads the value “153”from.
Why Is Population the Highest at the End?
[Eddie] It doesn’t, it doesn’t decrease it’s just increasing so the latest tick is thehighest.
This statement is coded as referencing monotonic/programmatic behavior toreason about accumulation, as Eddie notes that the population in this particularsimulation can only increase and refers to simulation “ticks.”
[Kevin] It’s um, because um, in an exponential growth as time increases theamount of people increases so it’s generally given that as more time elapses therewill be more people.
This statement is coded as referencing the general properties of exponentialgrowth (as the independent variable time increases, so does the dependent vari-able) to reason about accumulation as well as connecting this growth to thecollective behavior of a population (“the amount of people increases”).
When Is Population Changing the Fastest?
[Alex] Uh, the rate of, well the rate of change if gonna be tor—it’s gonna be greaterwhen the, if you were to make a tangent line to the curve [on the population graph],if the tangent line was steeper that technically means the rate of change is gettinggreater.
Dow
nloa
ded
by [
Nor
thw
este
rn U
nive
rsity
] at
12:
22 0
9 M
ay 2
016
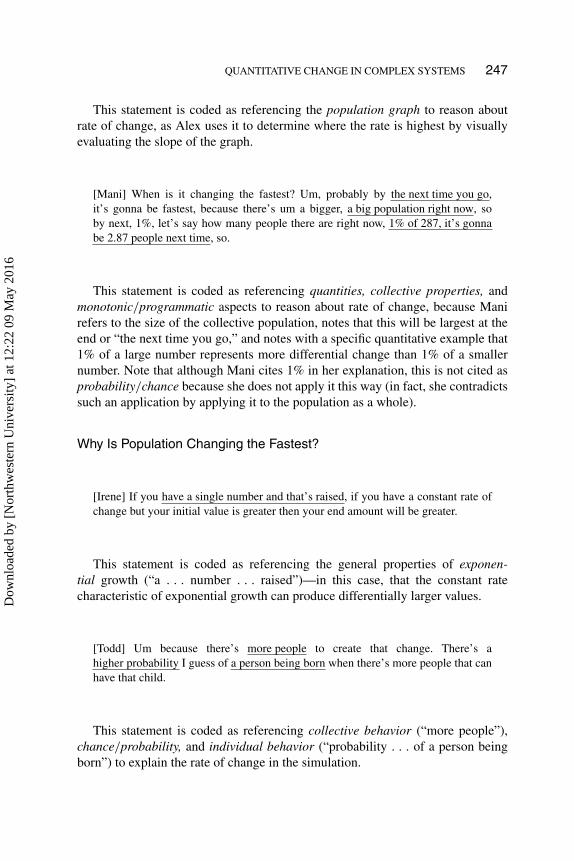
QUANTITATIVE CHANGE IN COMPLEX SYSTEMS 247
This statement is coded as referencing the population graph to reason aboutrate of change, as Alex uses it to determine where the rate is highest by visuallyevaluating the slope of the graph.
[Mani] When is it changing the fastest? Um, probably by the next time you go,it’s gonna be fastest, because there’s um a bigger, a big population right now, soby next, 1%, let’s say how many people there are right now, 1% of 287, it’s gonnabe 2.87 people next time, so.
This statement is coded as referencing quantities, collective properties, andmonotonic/programmatic aspects to reason about rate of change, because Manirefers to the size of the collective population, notes that this will be largest at theend or “the next time you go,” and notes with a specific quantitative example that1% of a large number represents more differential change than 1% of a smallernumber. Note that although Mani cites 1% in her explanation, this is not cited asprobability/chance because she does not apply it this way (in fact, she contradictssuch an application by applying it to the population as a whole).
Why Is Population Changing the Fastest?
[Irene] If you have a single number and that’s raised, if you have a constant rate ofchange but your initial value is greater then your end amount will be greater.
This statement is coded as referencing the general properties of exponen-tial growth (“a . . . number . . . raised”)—in this case, that the constant ratecharacteristic of exponential growth can produce differentially larger values.
[Todd] Um because there’s more people to create that change. There’s ahigher probability I guess of a person being born when there’s more people that canhave that child.
This statement is coded as referencing collective behavior (“more people”),chance/probability, and individual behavior (“probability . . . of a person beingborn”) to explain the rate of change in the simulation.
Dow
nloa
ded
by [
Nor
thw
este
rn U
nive
rsity
] at
12:
22 0
9 M
ay 2
016
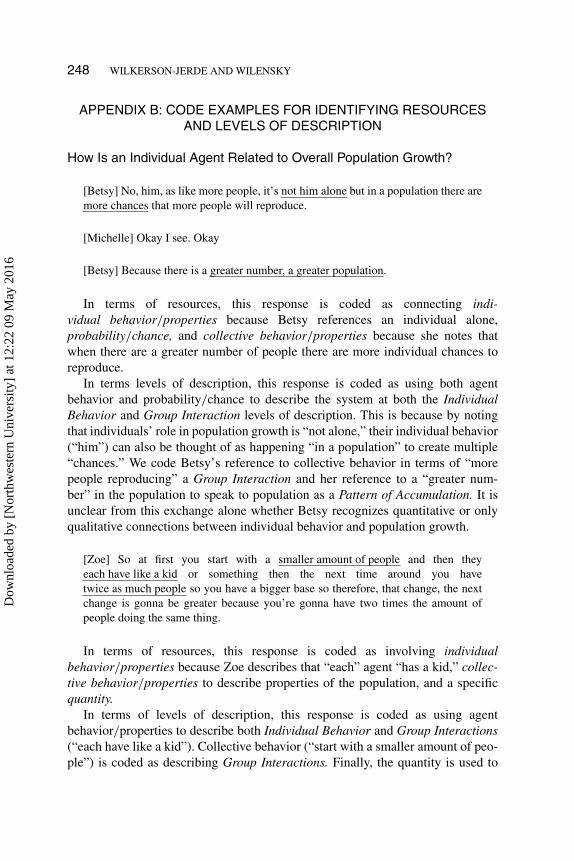
248 WILKERSON-JERDE AND WILENSKY
APPENDIX B: CODE EXAMPLES FOR IDENTIFYING RESOURCESAND LEVELS OF DESCRIPTION
How Is an Individual Agent Related to Overall Population Growth?
[Betsy] No, him, as like more people, it’s not him alone but in a population there aremore chances that more people will reproduce.
[Michelle] Okay I see. Okay
[Betsy] Because there is a greater number, a greater population.
In terms of resources, this response is coded as connecting indi-vidual behavior/properties because Betsy references an individual alone,probability/chance, and collective behavior/properties because she notes thatwhen there are a greater number of people there are more individual chances toreproduce.
In terms levels of description, this response is coded as using both agentbehavior and probability/chance to describe the system at both the IndividualBehavior and Group Interaction levels of description. This is because by notingthat individuals’ role in population growth is “not alone,” their individual behavior(“him”) can also be thought of as happening “in a population” to create multiple“chances.” We code Betsy’s reference to collective behavior in terms of “morepeople reproducing” a Group Interaction and her reference to a “greater num-ber” in the population to speak to population as a Pattern of Accumulation. It isunclear from this exchange alone whether Betsy recognizes quantitative or onlyqualitative connections between individual behavior and population growth.
[Zoe] So at first you start with a smaller amount of people and then theyeach have like a kid or something then the next time around you havetwice as much people so you have a bigger base so therefore, that change, the nextchange is gonna be greater because you’re gonna have two times the amount ofpeople doing the same thing.
In terms of resources, this response is coded as involving individualbehavior/properties because Zoe describes that “each” agent “has a kid,” collec-tive behavior/properties to describe properties of the population, and a specificquantity.
In terms of levels of description, this response is coded as using agentbehavior/properties to describe both Individual Behavior and Group Interactions(“each have like a kid”). Collective behavior (“start with a smaller amount of peo-ple”) is coded as describing Group Interactions. Finally, the quantity is used to
Dow
nloa
ded
by [
Nor
thw
este
rn U
nive
rsity
] at
12:
22 0
9 M
ay 2
016
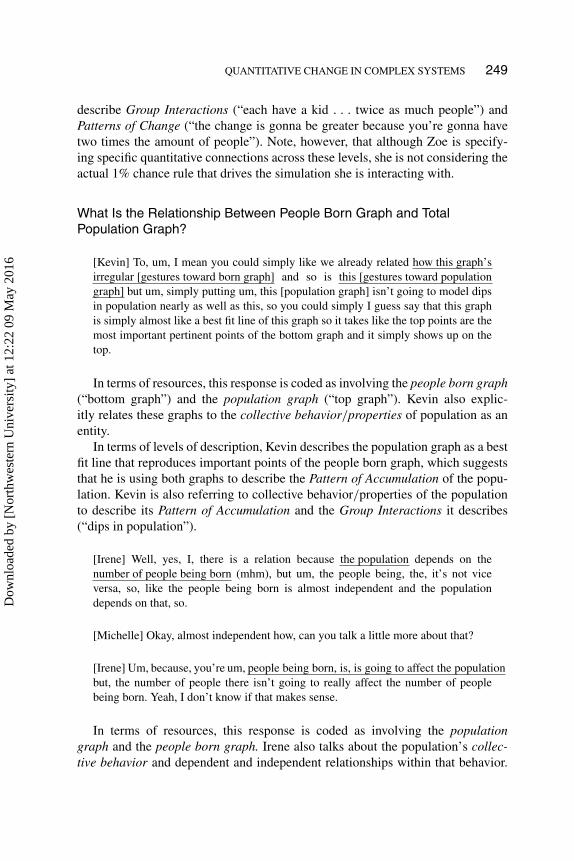
QUANTITATIVE CHANGE IN COMPLEX SYSTEMS 249
describe Group Interactions (“each have a kid . . . twice as much people”) andPatterns of Change (“the change is gonna be greater because you’re gonna havetwo times the amount of people”). Note, however, that although Zoe is specify-ing specific quantitative connections across these levels, she is not considering theactual 1% chance rule that drives the simulation she is interacting with.
What Is the Relationship Between People Born Graph and TotalPopulation Graph?
[Kevin] To, um, I mean you could simply like we already related how this graph’sirregular [gestures toward born graph] and so is this [gestures toward populationgraph] but um, simply putting um, this [population graph] isn’t going to model dipsin population nearly as well as this, so you could simply I guess say that this graphis simply almost like a best fit line of this graph so it takes like the top points are themost important pertinent points of the bottom graph and it simply shows up on thetop.
In terms of resources, this response is coded as involving the people born graph(“bottom graph”) and the population graph (“top graph”). Kevin also explic-itly relates these graphs to the collective behavior/properties of population as anentity.
In terms of levels of description, Kevin describes the population graph as a bestfit line that reproduces important points of the people born graph, which suggeststhat he is using both graphs to describe the Pattern of Accumulation of the popu-lation. Kevin is also referring to collective behavior/properties of the populationto describe its Pattern of Accumulation and the Group Interactions it describes(“dips in population”).
[Irene] Well, yes, I, there is a relation because the population depends on thenumber of people being born (mhm), but um, the people being, the, it’s not viceversa, so, like the people being born is almost independent and the populationdepends on that, so.
[Michelle] Okay, almost independent how, can you talk a little more about that?
[Irene] Um, because, you’re um, people being born, is, is going to affect the populationbut, the number of people there isn’t going to really affect the number of peoplebeing born. Yeah, I don’t know if that makes sense.
In terms of resources, this response is coded as involving the populationgraph and the people born graph. Irene also talks about the population’s collec-tive behavior and dependent and independent relationships within that behavior.
Dow
nloa
ded
by [
Nor
thw
este
rn U
nive
rsity
] at
12:
22 0
9 M
ay 2
016
250 WILKERSON-JERDE AND WILENSKY
Irene’s insistence that people being born is “almost independent” from the popu-lation provides some evidence that Irene is aware of behavior at something otherthan the collective level of population. This excerpt represents an example ofwhen looking at other portions of Irene’s transcript is useful. Returning to herinterview, we can say that Irene’s responses to the previous questions indicatedthat she was aware the individuals have a “one percent chance” and that whenthere are more people “someone’s bound to have another person.” Therefore, weinterpret the claim for independence in this excerpt as also implying individualbehavior/properties.
In terms of levels of description, Irene is using the population graph to describePatterns of Accumulation and using the people born graph to describe Patterns ofChange. Although she knows the two are interdependent, she does not articulatehow these resources embody information at different levels of description. Ireneuses agent behaviors to describe Individual Behaviors and Group Interactions(“people being born”). She also connects agent behavior to Patterns of Changeand population behavior to Patterns of Accumulation.
Why Is the People Born Graph Jagged?
[Mani] I think so, cause you can’t have half a person or .8 person.
[Michelle] Mmkay. So sometimes it’s, it gets kind of lower and then it goes back up,does that make sense?
[Mani] Well uh, [pause] I guess so, uh.
[Michelle] It’s okay to say no.
[Mani] Um, cause, I don’t know if this simulation is like, perfect like, cause peo-ple may not choose to have kids. So some years there might be less and some yearsthere might be more. But it evens out since it’s an average 1, .01%, er 1%.
In terms of resources, this exchange is coded as citing individualbehavior/properties and quantities to justify a feature of the people born graph,as people cannot be reasonably treated as divisible entities. After further probing,Mani cites more individual behavior (“people may not choose to have kids”) andasserts that individuals born comprise a collective behavior/property. However,there is no more evidence in the interview that Mani identifies mathematicallyrandom or probabilistic behavior as an element of the simulation—instead, sheidentifies the 1% as resultant average.
In terms of levels of description, Mani is using chance to describe GroupInteractions. She considers agent behavior/properties that “you can’t have half a
Dow
nloa
ded
by [
Nor
thw
este
rn U
nive
rsity
] at
12:
22 0
9 M
ay 2
016
QUANTITATIVE CHANGE IN COMPLEX SYSTEMS 251
person,” specific quantities, and the people born graph as resources for describingthe Pattern of Change exhibited by the simulation. She also considers differ-ent agent behaviors, that “people may not choose to have kids,” to describe theIndividual Behaviors in the simulation.
[Kevin] Like you said that um, they have a 1% chance of reproducing and forinstance, at the spikes maybe here and here, the, just at that moment of that 1%chance actually occurred, so, they had a higher uh reproducing, while at the dipsover here it just didn’t come through and then, um, the other chances of notreproducing kicked in and just right there they didn’t reproduce as much.
In terms of resources, this statement is coded as involving individualbehavior/properties, as Kevin is referencing the chance individuals have toreproduce, as well as collective behavior/properties, as he suggests the collec-tive “they” reproduce more or less at different points in time, to describe thepeople born graph. Although this excerpt could be interpreted as Kevin claim-ing that the population as a whole (rather than each individual) has a chanceto increase by 1% at any point in time, we code the except as also involvingprobability/chance because there are other moments in the interview when Kevinrefers to the 1% chance as belonging to an individual, and he specifically mentions1% chance “like you said” (when the interviewer described the agent-based rulesof the simulation).
In terms of levels of description, Kevin is relating agent behavior/properties(“reproducing”) to the 1% reproduction chance rule and is using both of theseresources to describe Individual Behavior and Group Interactions. He also con-nects this agent behavior and chance to Patterns of Change by describing how theydirectly affect the graph of people born, which also measures Patterns of Change.
Dow
nloa
ded
by [
Nor
thw
este
rn U
nive
rsity
] at
12:
22 0
9 M
ay 2
016