Embed Size (px)
Citation preview

CityFiscal Conditions
NATIONALLEAGUEOF CITIES
2017
About the National League of Cities
The National League of Cities (NLC) is the nation’s leading advocacy organization devoted to strengthening and promoting cities as centers of opportunity, leadership and governance. Through its membership and partnerships with state municipal leagues, NLC serves as a resource and advocate for more than 19,000 cities and towns and more than 218 million Americans. NLC’s Center for City Solutions provides research and analysis on key topics and trends important to cities, creative solutions to improve the quality of life in communities, inspiration and ideas for local officials to use in tackling tough issues, and opportunities for city leaders to connect with peers, share experiences and learn about innovative approaches in cities.
About the Authors
Christiana McFarland is Research Director at NLC’s Center for City Solutions.
Michael A. Pagano is Dean of the College of Urban Planning and Public Affairs and Professor of Public Administration at the University of Illinois at Chicago (UIC).
Acknowledgements
The authors would like to acknowledge the respondents to this year’s fiscal survey. The commitment of these finance officers to the project is greatly appreciated. The authors are also grateful to Farhad Kaab Omeyr, a doctoral student in the Department of Public Administration at University of Illinois at Chicago, and Trevor Langan and Anita Yadavalli in NLC’s Center for City Solutions, for their assistance in collecting General Fund data on the nation’s largest 100 cities and for their overall survey and research support.
Photo credits: All photo images credited to Getty Images, 2017.
NATIONALLEAGUEOF CITIES
© 2017 National League of Cities. All Rights Reserved.

Table of Contents
Executive Summary
Meeting Fiscal Needs
Revenue and Spending Trends
Tax Revenues
Fiscal Policy Actions
Beyond 2017
City Fiscal Conditions
1
2
6
10
14
16
2017

CLEVELAND, OHIO
Several major findings taken together signal a slowdown on the horizon.
“
////////////////////////////////

1NATIONAL LEAGUE OF CITIES
Although the majority of finance officers (69%) are confident in the fiscal position of their cities, widespread optimism hit its peak in 2015.
General Fund revenues are slowing, with a rate of 2.61% in 2016. Expenditures followed a similar trend, with 2.18% growth rate in 2016. Revenues are projected to stagnate with just 0.9% growth in 2017. Expenditures are anticipated to increase by 2.1%.
Property tax revenues grew by 4.3% in 2016 owing to the strengthening real estate market in recent years. Both sales and income tax revenues also grew in 2016 (by 3.7% and 2.4%, respectively), albeit at a slower pace than property tax revenues. For
2017, finance officers have budgeted for much lower rates of growth in property tax revenues (1.6%) and project a decline in sales and income tax revenues (by −0.2% and −2.7%, respectively).
Cities’ General Fund revenues still have not fully recovered from the recession and stand at less than 98% of 2006 levels.
These indicators of slowing local fiscal growth come on the heels of continued national economic expansion. Divergence between fiscal conditions and national economic indicators calls into question the alignment between city fiscal structures and the drivers of the economy, as well as the sustainability of the continued patchwork of solutions to cities’ most pressing issues—namely, infrastructure.
Executive Summary
The City Fiscal Conditions Survey is a national mail and online survey of finance officers in U.S. cities conducted in the spring-summer of each year. This is the 32nd annual edition of the NLC survey, which began in 1986.
What is the City Fiscal Conditions Survey?
The 2017 City Fiscal Conditions survey of city finance officers reveals the start of fiscal contraction in the municipal sector following several years of post-recession growth. Several major findings taken together signal a slowdown on the horizon, including waning confidence of city finance officers, slowing local revenue and spending trends and insufficient post-recession revenue recovery.

Meeting Fiscal Needs
BINGHAMTON, NEW YORK

3NATIONAL LEAGUE OF CITIES
Although the majority of city finance officers are confident in the fiscal position of their cities, a downward trend is beginning to emerge. Sixty-nine percent of city finance officers report that their cities are better able to meet the financial needs of their communities in 2017 than in 2016 (see Figure 1).1 Last year, 81% reported “better able,” and in 2015, the most widespread level of optimism in the history of the survey, 82% made the same assertion.
Although this is a simple perception indicator, it represents the informed opinion of those who manage budgets year-round. Finance officers see firsthand the fluctuations in revenues and expenditures and the impacts that budget decisions have on residents.
Their response to “ability to meet fiscal needs” has historically tracked well with more quantitative fiscal measures. This year’s results point to the potential start of a contraction in the municipal sector after optimism about growth hit a peak in 2015.
Finance officers see firsthand
the impacts that budget decisions
have on residents.
Figure 1 Percent of Cities “Better Able/Less Able” to Meet Financial Needs
1990 1995 2000 2005 2010 2017
Less Able (%)
BetterAble (%)
6779 78
66
46 4235 32 31 31
25 27
4455
81
63
37 35 30
64
88 87
57
43
2820 18 19
3321 22
34
54 5865 68 69 69
75 73
5645
19
37
63 6570
36
12 13
43
57
7280 82 81
NATIONAL LEAGUE OF CITIES
City Fiscal Conditions 2017
4
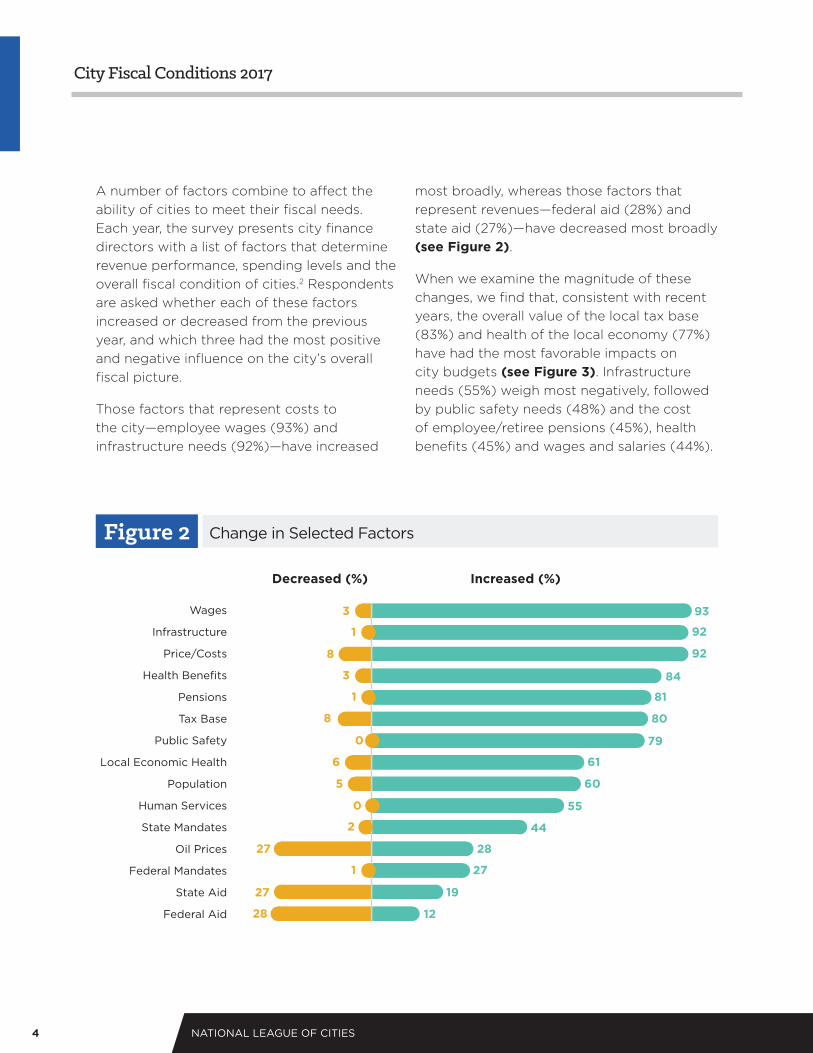
A number of factors combine to affect the ability of cities to meet their fiscal needs. Each year, the survey presents city finance directors with a list of factors that determine revenue performance, spending levels and the overall fiscal condition of cities.2 Respondents are asked whether each of these factors increased or decreased from the previous year, and which three had the most positive and negative influence on the city’s overall fiscal picture.
Those factors that represent costs to the city—employee wages (93%) and infrastructure needs (92%)—have increased
most broadly, whereas those factors that represent revenues—federal aid (28%) and state aid (27%)—have decreased most broadly (see Figure 2).
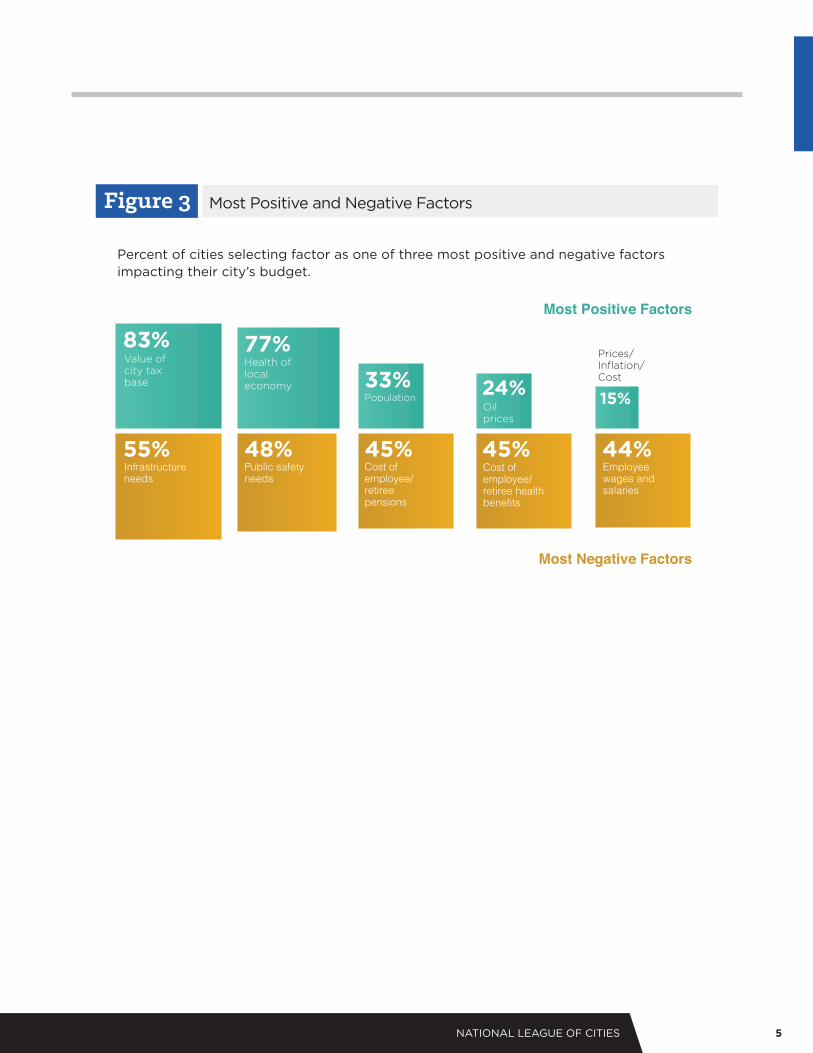
When we examine the magnitude of these changes, we find that, consistent with recent years, the overall value of the local tax base (83%) and health of the local economy (77%) have had the most favorable impacts on city budgets (see Figure 3). Infrastructure needs (55%) weigh most negatively, followed by public safety needs (48%) and the cost of employee/retiree pensions (45%), health benefits (45%) and wages and salaries (44%).
Figure 2 Change in Selected Factors
Decreased (%) Increased (%)
Wages
Infrastructure
Price/Costs
Public Safety
Health Benefits
Tax Base
Pensions
Population
Local Economic Health
Human Services
State Mandates
Federal Mandates
State Aid
Federal Aid
Oil Prices
93
92
92
84
81
80
79
61
60
55
44
28
27
19
12
3
3
1
1
1
2
27
27
28
0
0
8
8
6
5
5NATIONAL LEAGUE OF CITIES
Percent of cities selecting factor as one of three most positive and negative factors impacting their city’s budget.
Figure 3 Most Positive and Negative Factors
Most Positive Factors
Most Negative Factors
83% 77%
55% 48% 44%45% 45%
33% 24% 15%
Infrastructure needs
Public safety needs
Cost of employee/retiree pensions
Cost of employee/retiree health benefits
Employee wages and salaries
Value of city tax base
Health of local economy
Oil prices
Prices/Inflation/Cost
Population

NATIONAL LEAGUE OF CITIES
City Fiscal Conditions 2017
6
Revenue andSpending Trends
TULSA, OKLAHOMA

7NATIONAL LEAGUE OF CITIES
Revenue and spending trends also point to a slowdown in fiscal growth. Each year, we ask city finance officers to provide information about the portion of their city’s budget referred to as the General Fund. General Fund revenues are derived from property, sales, utility and other taxes, user fees and shared revenues. They provide funding to cities’ general operations and constitute on average more than 55% of total city spending, most of which is discretionary.
In constant dollars, General Fund revenues grew by 2.61% in 2016 over 2015 (see Figure 4).3 Post-recession trends indicate that revenue growth is starting to slow following the highest post-recession growth of 3.26% in 2015. The more significant drop in revenue growth in 2014 was largely due to higher inflation at that time (2.3%), followed by significantly lower inflation in 2015 (0.5%) and 2016 (0.9%).
Cities have budgeted for a 0.9% increase in 2017 revenues. This minimal growth projection is the result of slowing revenue growth overall, a return to higher levels of inflation in 2017 (2.1%) and the typical conservative approach that finance officers take for revenue estimates. For these reasons, actual 2017 revenues will likely be somewhat greater than
Post-recession trends indicate
that revenue growth is
starting to slow.
Figure 4 Year-to-Year Change in General Fund Revenue and Expenditures
% Change in Constant Dollar Revenue (General Fund) % Change in Constant Dollar Expenditures (General Fund)
1990 1995 2000 2005 2010 2015 2017 1986
RECESSIONTROUGH 06/2009
RECESSIONTROUGH 11/2001
RECESSIONTROUGH 03/1991
2.1
2.1
0.9
2.6
-6
-5
-4
-3
-2
-1
0
1
2
3
4
5
} Budgeted

NATIONAL LEAGUE OF CITIES
City Fiscal Conditions 2017
8
estimates. For the same reasons, once the fiscal year ends, actual expenditures will likely be less than budgeted expenditures. Expenditure growth for 2017 is budgeted at 2.1%.
Additionally, over the past two years when cities closed their books on the fiscal year, a trend of stronger revenue over expenditure growth emerged. This may indicate that cities are shoring up ending balances to help stabilize their fiscal position.

9NATIONAL LEAGUE OF CITIES
RICHMOND, VIRGINIA

NATIONAL LEAGUE OF CITIES
City Fiscal Conditions 2017
10
Tax Revenues
HOUSTON, TEXAS

11NATIONAL LEAGUE OF CITIES
Changes in General Fund revenues typically reflect the changing economic and fiscal environments within which cities operate. However, differences in the composition and collection of property, sales and income taxes affect how each revenue stream responds to economic conditions.4 While nearly all cities have access to a local property tax, more than half are also authorized to collect local sales taxes, and some cities (fewer than 10% nationally) are authorized to collect local income or wage taxes.
This year, we find robust growth in property tax revenues and a significant weakening of sales and income tax revenue growth.
Property Taxes. Local property tax revenues are driven by the value of residential and
commercial property, with property tax bills determined by local governments’ assessment of property values. Property tax revenues are considered more inelastic, or less responsive, to economic changes than other tax sources. It typically takes longer for economic shifts to affect housing values and property tax collections. Also, assessment practices are such that property tax revenues typically reflect the value of a property anywhere from 18 months to several years prior to collection. (For more on the lag which takes place between economic changes and city revenues, see page 20.)
Although 2016 witnessed strong property tax revenue growth at 4.3%, this source of revenue is anticipated to slow to 1.6% in 2017 (see Figure 5).
Figure 5 Year-to-Year Change in General Tax Receipts
Sales Tax (%) Property Tax (%) Income Tax (%)
20001996 2005 2010 2015 2017
2.43.74.3
-10
-8
-6
-4
-2
0
2
4
6
8%
1.6
-2.7
-0.2 Budgeted
NATIONAL LEAGUE OF CITIES
City Fiscal Conditions 2017
12
According to Harvard’s Joint Center for Housing Studies, “housing markets continued to strengthen in recent years, with new and existing home sales, prices and construction levels all on the rise. Still, single-family construction, traditionally the largest source of residential investment, remains well below historical levels. As a result, low inventories of homes for sale are driving prices above pre-recession peaks in many cities.”5 These findings bode well for property tax revenues but introduce both immediate and longer-term concerns regarding housing affordability.
Sales Taxes. While property tax revenues are considered a lagged indicator, sales taxes are more elastic. Consumer sales respond more quickly to economic shifts so that when consumer confidence is high, people spend more on goods and services. Historically, city governments with sales tax authority then reap the benefits through increases in sales tax collections.
With the strengthening of the economy and improved employment and housing landscape, consumer confidence has been on the rise in recent years.6 In 2016, sales tax revenues grew by 3.7%. Indeed, Moody’s upgraded its outlook for the retail sector from stable to positive last year.7
Importantly, however, the growth that has occurred in the retail sector has been driven largely by online sales, with poorer performance shown by brick-and-mortar stores.8 Since local governments do not reap as much revenues from online sales, they cannot capture this growth. This lack of interstate e-commerce taxing authority is making its presence felt in city budgets across the country. For 2017, city finance officers predict a slight decline or leveling off (by -0.2%) of sales tax receipts.
Income Taxes. Like sales taxes, income taxes are a more elastic source of revenue as they respond more quickly to local economic circumstances. At the city level, income tax revenues are driven primarily by income and wages, rather than by capital gains (with the exception of New York City).
Cities realized a 2.4% increase in income tax receipts in 2016 but anticipate a significant decline of -2.7% in 2017.
Income tax revenue is a fiscal indicator to watch as it captures local labor market nuances that may be missed by broad national economic trends. For example, despite gains in national employment, there is still a significant number of individuals—approximately 3.6 million—who are currently out of work and looking to reenter the labor market.9 Even for those who are working, nominal wage growth since the recovery officially began in mid-2009 has been low and flat.10 Gradual employment gains and slow wage growth, widening income inequality and a lack of expansion of middle-income jobs continue to contribute to the decline and volatility of income tax revenues.
General Fund revenues still have not fully recovered from the recession.

13NATIONAL LEAGUE OF CITIES
Figure 6 General Fund Revenue Recovery During Recent Recessions
2007 Recession (%)2001 Recession (%)1990 Recession (%)
Year 0 Year 1 Year 2 Year 3 Year 4 Year 5 Year 6 Year 7 Year 8 Year 9 Year 11(BUDGETED)Years since start of recession
100.6 100.5
86
88
90
92
94
96
98
100
102%
97.7
Year 10
In a broader context, this slowdown, stagnation or decline of all three primary sources of city revenues comes when General Fund revenues still have not fully recovered from the recession. Revenues stand at less than 98% of what they were in 2006 (see Figure 6).11 Given other indicators of fiscal challenge in the municipal sector, it is possible that revenues may not return to prerecession levels during this economic cycle.

NATIONAL LEAGUE OF CITIES
City Fiscal Conditions 2017
14
Fiscal Policy Actions
MINNEAPOLIS, MINNESOTA

15NATIONAL LEAGUE OF CITIES
Despite these challenges, cities must anticipate changes, actively adjust revenues and expenditures throughout the year and balance their budgets on an annual basis. To better understand local fiscal policy responses, we asked city finance officers about specific revenue and spending actions taken in 2017.
As has been the case for much of the past two decades, the most common action taken to boost city revenues, regardless of broader economic trends, has been to increase fees charged for services. Two in five (42%) city finance officers report that their cities raised fee levels (see Figure 7). Approximately one in four cities increased the number of fees that are applied to city services (26%).
Twenty-seven percent of cities increased their local property tax rates in 2017. Since the mid-1990s, irrespective of economic conditions, the percentage of city finance officers reporting increases in property taxes in any given year has been reported at about this same level, reflecting state- and voter-imposed restrictions on local property tax authority as well as the political challenges of raising property tax rates. Increases in sales, income or other types of tax rates are even less common, and this has continued to be the case in 2017.
When asked about expenditure actions taken in 2017, most cities report increased spending on employee wages (86%), public safety expenditures (75%) and infrastructure (74%) (see Figure 8).
Figure 7
Figure 8
City Revenue Actions
City Spending Actions
1% Decrease (%) Increase (%)
Fee Levels 2 42Property Tax Rate 7 27
# of Fees 1 26Level of Impact Fees 3 23
Other Tax Rate 2 9Sales Tax Rate 1 8
Tax Base 2 6# of Other Taxes 2 5Income Tax Rate 1 2
Decrease (%) Increase (%)
Employee Wages 1 86Public Safety 2 75Infrastructure 4 74
Capital Projects 6 61Size - Municipal Workforce 8 46
Pension Plans 3 41Other City Services 7 38
Human Services 3 35Health Plans 6 35
Inter-Local Agreements 1 22Contracting Sevices 4 20
Education 4 17

NATIONAL LEAGUE OF CITIES
City Fiscal Conditions 2017
16
Beyond 2017
BOISE, IDAHO

17NATIONAL LEAGUE OF CITIES
This year, the municipal sector may experience its second post-recession year-over-year contraction in revenues if our expectations about budgeted revenues and expenditures for FY17 are generally accurate. This slowdown is fueled primarily by declining, or at best, stagnating sales and income tax collections, but it is also buoyed by growth in property tax revenues. Costs that can no longer be delayed, such as those for infrastructure and for employees and retirees, as well as cuts from federal and state partners, will continue to contribute to the fiscal uncertainty facing cities.
Moving forward, although national economic indicators are on the uptick, fiscal challenges in the local and state government sectors will materialize in downward pressure on gross domestic product (GDP). State and local government spending comprise about 20% of GDP. According to the most recent Bureau of Economic Analysis estimates, positive contributions to GDP made by personal consumption, nonresidential fixed investments, exports and federal government spending have begun to be offset by negative contributions from state and local government spending.
Additionally, drastic economic and technological changes occurring in the most recent recovery period, as well over the past 30 years, point to the imperative to reexamine the field’s conventional thinking about the ability of city finances to buffer against economic downturns and to capture revenue growth during periods of economic expansion. This is probably most obvious in the restructuring of the retail industry and the legal challenges for cities of capturing retail sales tax on all online transactions. While consumer spending on online goods
and services has increased, cities have limited capacity to collect online sales taxes.
Also, widespread and increasing state constraints on local property taxes are encouraging cities to search for other revenues. A recent study of cities across the country found that the most common fiscal policy action taken when a city approaches the ceiling of property taxes is to increase sales taxes.12 Within their limited taxing authority, however, cities are stuck between a rock (property tax caps) and a hard place (limited online sales tax authority), often resulting in the increase of fees for services.
At the end of the day, local governments will balance their budgets and make the hard choices needed to serve their communities. These forced choices, however, have consequences and threaten the competitiveness and quality of life of our nation’s drivers of economic and social vitality: its cities.
Local governments will make the hard
choices needed to serve their communities.

NATIONAL LEAGUE OF CITIES
City Fiscal Conditions 2017
18
We often refer to the lag between changes in the economic cycle and the impact on city fiscal conditions.
What does this mean? The lag refers to the amount of time between the point when economic conditions change and the point when those conditions have an impact on reported city revenue collections. In fact, cities likely feel the impacts of changing economic conditions quite early. However, because reporting of city fiscal conditions occurs in most cases on an annual basis, whether through annual budget reporting or NLC’s annual survey, those impacts tend to not become evident until some point after they have started to occur.
How long is the lag? The lag is typically anywhere from 18 months to several years, and it is related in large part to the timing of property tax collections. Property tax bills represent the value of the property in some previous year, when the value of the property was last assessed. A downturn in real estate prices may not be noticed for one to several years after the downturn begins because property tax assessment cycles vary across jurisdictions; some reassessments occur annually while others occur every few years. Consequently, property tax collections, as reflected in property tax assessments, lag behind economic changes (both positive and negative) by some period of time. Sales and income tax collections also exhibit lags owing
to collection and administration issues, but such lags are typically no more than a few months.
Figure 4 shows year-to-year changes in city General Fund revenues and expenditures, and it includes markers for the official U.S. recessions from 1991, 2001 and 2007, with low points, or “troughs,” occurring in March 1991, November 2001 and June 2009, according to the National Bureau of Economic Research. Comparing the dates of the recessions to the low points in city revenues and expenditures as reported in NLC’s annual survey (typically conducted between April and June of every year), the low point for city revenues and expenditures after the 1991 recession occurred in 1993, approximately two years after the trough of the U.S. economic recession (March 1991 to March 1993). After the 2001 recession, that low point occurred in 2003, approximately 18 months after the trough
Lag Between Economic and City Fiscal Conditions
HomeValues
CityRevenue
Home Values Decrease Lag Period
Lag time of 18 - 24 months due to property assessment schedules
Property TaxCollection
$
The Lag Between Economic & City Fiscal Conditions
19NATIONAL LEAGUE OF CITIES
of the U.S. economic recession (November 2001 to April 2003). Our reporting on this lag depends upon when the annual NLC survey is conducted, meaning that there is some degree of error in the length of the lag; for instance, had the survey been conducted in November of 1992 rather than in April of 1993, we might have seen the effects of changing economic conditions earlier. Nevertheless, the evidence suggests that the effects of changing economic conditions tend to take 18-24 months to be reflected in city budgets.

NATIONAL LEAGUE OF CITIES
City Fiscal Conditions 2017
20
The City Fiscal Conditions Survey is a national email survey of finance officers in U.S. cities conducted annually from May to July. Surveys were emailed to city finance officers for a sample of 1,018 cities with populations greater than 10,000, asking for their assessments of fiscal status, actions taken and factors affecting their fiscal conditions. The survey also requested budget and finance data from all cities with the exception of the 100 largest cities by population; such data from those cities were collected directly from online city budget documents. In total, the 2016 data are drawn from 261 cities for a response rate of 26%. The data allow for generalizations about the fiscal condition of cities.
The number and scope of governmental functions influence both revenues and expenditures. For example, many northeastern cities are responsible not only for general government functions but also for public education. Some cities are required by their states to assume more social welfare responsibilities than other cities. Some assume traditional county functions.
Cities also vary according to their revenue-generating authority. Some states—notably Kentucky, Michigan, Ohio and Pennsylvania—allow their cities to tax earnings and income. Other cities—notably those in Colorado, Louisiana, New Mexico and Oklahoma—depend heavily on sales tax revenues. Moreover, state laws may require cities to account for funds in a manner that varies from state to state. Therefore, much of the statistical data presented here must also be understood within the context of cross-
state variation in tax authority, functional responsibility and state laws. City taxing authority, functional responsibility and accounting systems vary across the states.
When we report on fiscal data such as General Fund revenues and expenditures, we are referring to all responding cities’ aggregated fiscal data included in the survey. As a consequence, the data are influenced by the relatively larger cities that have larger budgets and that deliver services to a preponderance of the nation’s cities’ residents.
When we report on nonfiscal data (such as finance officers’ assessment of their ability to meet fiscal needs, fiscal actions taken or factors affecting their budgets), we are referring to percentages of responses to a particular question on a one-response-per-city basis. Thus, the contribution of each city’s response to these questions is weighted equally.
About the Survey
Categories Survey Responses %
TOTAL 261 100
Population
>300,000 54 21
100,000-299,999
72 28
50,000-99,999 79 30
10,000-49,999 56 21
21NATIONAL LEAGUE OF CITIES
1 When asking for fiscal data, we ask city finance officers to provide information about the fiscal year for which they have most recently closed the books (and therefore have verified the final numbers), which we generally refer to as FY 2016; we refer to the prior year as FY 2015 and to the current fiscal year for budgeted (estimated) amounts as FY 2017.2 The factors include infrastructure needs/costs, public safety needs/costs, human service needs/costs, wages, pension costs, health benefit costs, prices and service costs, federal aid, state aid, federal mandates, state mandates, city population, city tax base, the health of the local economy, and gas and oil prices.3 “Constant dollars” refers to inflation-adjusted dollars. “Current dollars” refers to non-inflation-adjusted dollars. Constant dollars are a more accurate source of comparison over time because the dollars are adjusted to account for differences in the costs of state and local government. To calculate constant dollars, we adjust current dollars using the U.S. Bureau of Economic Analysis National Income and Product Account estimate for inflation in the state and local government sector. 4 National League of Cities. (2015). Cities and State Fiscal Structure. Retrieved from www.nlc.org/resource/cities-and-state-fiscal-structure-2015 5 Joint Center for Housing Studies of Harvard University. (2017). The State of the Nation’s Housing 2017. Retrieved from www.jchs.
harvard.edu/research/state_nations_housing6 Mitchell, J. & Zumbrun, J. (2017, Aug. 15). Consumer Spending Gives Some Retailers a Lift, But Risks Abound. The Wall Street Journal. Retrieved from https://www.wsj.com/articles/happy-consumers-ramp-up-spending-but-risks-abound-1502817081 7 Moody’s Investor Service. (2016, Jun. 30). Moody’s: Outlook for US retail industry changed to stable from positive. Retrieved from https://www.moodys.com/research/Moodys-Outlook-for-US-retail-industry-changed-to-stable-from--PR_351500 8 Tu, J. I. (2017, Aug. 10). Nordstrom has strong online growth, while brick-and-mortar sales lag. The Seattle Times. Retrieved from http://www.seattletimes.com/business/retail/nordstrom-has-strong-online-growth-while-brick-and-mortar-sales-lag/ 9 U.S. Census Bureau. (2016). American Community Survey [Data file]. Retrieved from https://www.census.gov/programs-surveys/acs/ 10 Economic Policy Institute. (2017, Aug. 4). Nominal Wage Tracker. Retrieved from http://www.epi.org/nominal-wage-tracker/#chart1 11 This estimate is calculated from the compounded year-over-year decline/growth in constant dollar General Fund revenues for each recession, with the year prior to the start of each recession (1989, 2000, 2006) as the base year (i.e., Year 0 in figure 5). 12 Wang, S. (2015). The effect of state-imposed tax and expenditure limits on municipal revenue structure: A legal approach (Doctoral dissertation).
Endnotes

NATIONAL LEAGUE OF CITIES
City Fiscal Conditions 2017
22
DATA TABLES
Change in Constant Dollar Revenue (General Fund), Percent
1986 1987 1988 1989 1990 1991 1992 1993 1994 1995 1996 1997 1998 1999 2000 2001
4.18% 0.34% 4% 0.55% -0.21% -0.53% -0.18% 0.55% 0.93% 1.25% 2.85% 1.43% 2.14% 0.11% 0.97% -0.58%
2002 2003 2004 2005 2006 2007 2008 2009 2010 2011 2012 2013 2014 2015 2016 2017
0.25% -1.01% -1.59% 1.58% 1.85% -0.22% -1.18% -2.75% -4.50% -1.79% -1.53% 2.08% 0.86% 3.26% 2.61% 0.9%
Change in Constant Dollar Expenditures (General Fund), Percent
1986 1987 1988 1989 1990 1991 1992 1993 1994 1995 1996 1997 1998 1999 2000 2001
3.77% -0.11% 1.97% -0.46% 2.04% 0.78% -0.73% -0.77% 0.54% 1.52% 3.86% 1.37% 1.31% 1.09% 0.76% 1.96%
2002 2003 2004 2005 2006 2007 2008 2009 2010 2011 2012 2013 2014 2015 2016 2017
3.33% -1.49% -1.03% 0.04% 1.88% 2.64% 0.37% 0.50% -5.10% -3.49% -0.84% 1.46% 1.17% 3.10% 2.18% 2.1%
1990 Recession
Year 0 Year 1 Year 2 Year 3 Year 4 Year 5
1 99.79% 99.26% 99.08% 99.63% 100.57%
2001 Recession
Year 0 Year 1 Year 2 Year 3 Year 4 Year 5 Year 6
1 99.42% 99.66% 98.66% 97.07% 98.65% 100.50%
2007 Recession
Year 0 Year 1 Year 2 Year 3 Year 4 Year 5 Year 6 Year 7 Year 8 Year 9 Year 10 Year 11
1 99.78% 98.60% 95.86% 91.36% 89.57% 88.07% 90.04% 91.27% 94.24% 96.85% 97.72%
Sales Tax, Percent
1996 1997 1998 1999 2000 2001 2002 2003 2004 2005 2006 2007 2008 2009 2010
3.6% 3.4% 6.0% 2.4% 2.8% -5.3% -3.4% -3.2% 1.0% 0.5% 3.0% -0.3% 2.3% -6.6% -8.4%
2011 2012 2013 2014 2015 2016 2017
1.6% 6.2% 5.9% 3.1% 5.0% 3.7% -0.2%
Income Tax, Percent
1996 1997 1998 1999 2000 2001 2002 2003 2004 2005 2006 2007 2008 2009 2010
-0.1% 1.2% 4.2% 0.9% -0.1% -0.2% -5.1% -4.7% -2.3% -1.1% 2.3% -2.5% 2.2% 1.3% -1.0%
2011 2012 2013 2014 2015 2016 2017
-2.5% 4.4% 3.6% -1.7% 5.4% 2.4% -2.7%
Property Tax, Percent
1996 1997 1998 1999 2000 2001 2002 2003 2004 2005 2006 2007 2008 2009 2010
1.3% 2.0% 1.5% 1.4% 1.0% 2.0% 4.4% 0.6% 3.3% 2.2% 4.0% 6.3% 6.2% 4.2% -2.0%
2011 2012 2013 2014 2015 2016 2017
-3.9% -0.4% 0.8% 2.4% 3.3% 4.3% 1.6%
FIGURE 4: Year-to-Year Change in General Fund Revenue and Expenditures
FIGURE 6: General Fund Revenue Recovery During Recent Recessions
FIGURE 5: Year-to-Year Change in General Tax Receipts

23NATIONAL LEAGUE OF CITIES

NATIONALLEAGUEOF CITIES