Embed Size (px)
Citation preview
RELATIONSHIP OF FATIGUE TO THE TENSILE STIFFNESSOF ASPHALTIC CONCRETE
Final Report on Phase 1: Laboratory Investigation
by
G" Wo Maupin, JroHighway Research Engineer
(The opinions, findings, and conclusions expressed in this report are those of theauthor and not necessarily those of the sponsoring agencies 0 )
Virginia Highway Research Council(A Cooperative Organization Sponsored -Iointly by the Virginia
Department of Highways and the University of Virginia)
In Cooperation with the U 0 So Department of TransportationFederal Highway Administration
Charlottesville, Virginia
May 1971VHRC 70<=R41

ABSTRACT
The correlation between asphaltic concrete tensile stiffness and fatigue life was determined in the laboratory° Constant strain fatigue tests were utilized and indirect tensile tests were selected because of their simplicity and applicability° Four asphaltic concrete mixes of different stiffnesses were tested under constant strain fatigue and indirect tension,
Each mix was fatigue tested at several strain levels in order that a strain fatigue life relationship could be developed° This enabled the correlation of tensile stiffness and fatigue life at any of the strain levels used in the tests. A correlation between tensile stiffness and fatigue life was plotted at a 150 x 10 -6 ino/ino strain level° The information gathered indicates that it may be possible to predict the fatigue susceptibility of a mixture with a simple indirect tension test,
The fatigue life of a surface mixture was reduced by artificial aging and was altered by using asphalt cements of different hardnesseso

RELATIONSHIP OF FATIGUE TO THE TENSILE STIFFNESS OF ASPHALTIC CONCRETE
Final Report on Phase I. Laboratory Investigation
by
Go Wo Maupin, Jr Highway Research Engineer
INTRODUCTION
For many years flexible pavement systems have been designed with the purpose of providing a satisfactory service lifeo The designs are usually based on empirical charts developed from the results of pavement performance surveys, and the charts are used to select the structural cross section of the pavemento In some instances, pavements have developed cracking at an early age due to fatigue distress° These occurrences of early cracking prompted investigations to determine the factors that affect fatigue of asphaltic concretes Also a fatigue design sub- system for flexible pavement design has been developed in which a proposed pave- ment can be analyzed lor its •atigue serviceability° (I) If the fatigue analysis predicts an early failure of the pavement due to fatigue then the structural cross section must be changed or more fatigue resistant mixes used°
Basically, in order to predict the latigue lailure of a pavement system one must know both the strain•atigue cycles relationship and the strain that the asphaltic concrete will undergo in the roadway under a design loading° The strain of the as- phaltic concrete can be computed or measured, but the strain=fatigue cycles relation- ship is very difficult to obtain since it is influenced by many things° For instance, the lield pavement may be subjected to cyclic loading at different temperatures caused primarily by seasonal changes° Also, the load strains will not be constant because of different load magnitudeso The best estimate o• the strain•fatigue relation- ship is obtained by testing fatigue specimens in the laboratory at various strain levels, and at a temperature representing a median lield temperature°
Rather complicated and. expensive equipment •s required for the fatigue tests and the tests are quite lengthy• therefore, it would be difficult for typical field or district laboratories to perform these tests on mix designs° In order to provide some insight into the fatigue durability o• an asphaltic mixture at the field level, a quick test for predicting fatigue failure with some degree of reliability is neededo A summary of previous investigations(2) of this problem indicates that there is a correlation between mix stiffness and •atigue lifeo When mix stillness is increased, the fatigue life decreases in a controlled strain mode° This correlation indicates that a simple stiffness test might possibly be used to predict •atigue •ailureo
In the investigation reported here an attempt was made to correlate the indirect tensile test with fatigue failure° The indirect tensile test does not re- quire elaborate equipment and results can be obtained quickly; therefore, the potential benefits warranted the investigation°
PURPOSE
The purpose of this investigation was to determine if a correlation could be developed between fatigue life and indirect tensile stiffness for several asphaltic mixtures° The intent of this work was to develop a correlation that might possibly be used to predict the suitability of asphaltic mixes from a fatigue standpoint.
SCOPE
Controlled strain tests were used to develop strain=fatigue relationships for four mixes possessing different stiffness values. The mixes were selected from those allowed under Virginia specifications with slight modifications° All stiffness and fatigue tests were performed in the laboratory°
PROCEDURE
• T echni•
Since fatigue failures are the result of cyclic tensile strains or stresses it was postulated that tensile stiffness would correlate best with fatigue° The tests that may be used to obtain the tensile characteristics of a material are:
1o Direct tensile tests
2o Indirect tensile tests
3. Bending tests
Hudson and Kennedy (3) summarize each test and list the difficulties with
each one. They point out that it is difficult to apply pure tensile force to the direct tensile specimen, and the gripping procedure is rather tedious° The disadvantages of the bending test are the undefined stress distribution across the specimen and the influence of surface irregularities° The advantages of the indirect tensile test seem to outnumber the disadvantages, therefore, it was used to evaluate the tensile prop- erties of highway materials including asphaltic concrete
It was realized that the indirect tensile test deviates from ideal conditions for which it was intended in three respects as follows:
1o The test material is not homogeneous;
2• the theory assumes a line loading on the cylinder when in practice the load is distributed with a loading strip• and
3. stress is not proportional to strain in the test material°
Although these three conditions can not be met the test does measure tensile char• acteristics of an asphaltic concrete°
This work resulted in recommendations for future testing' of asphaltic concrete in indirect tension if determinations of tensile characteristics are desired° Since results of the initial work by Hudson and Kennedy(3) and subsequent work by Hadley et al (4, 5• 6) appeared very promising it was decided to use the indirect tensile test for this investigation• Standard Marshall specimens were used in the indirect tensile tests because of the ease of fabrication and the fact that no special equipment was necessary°
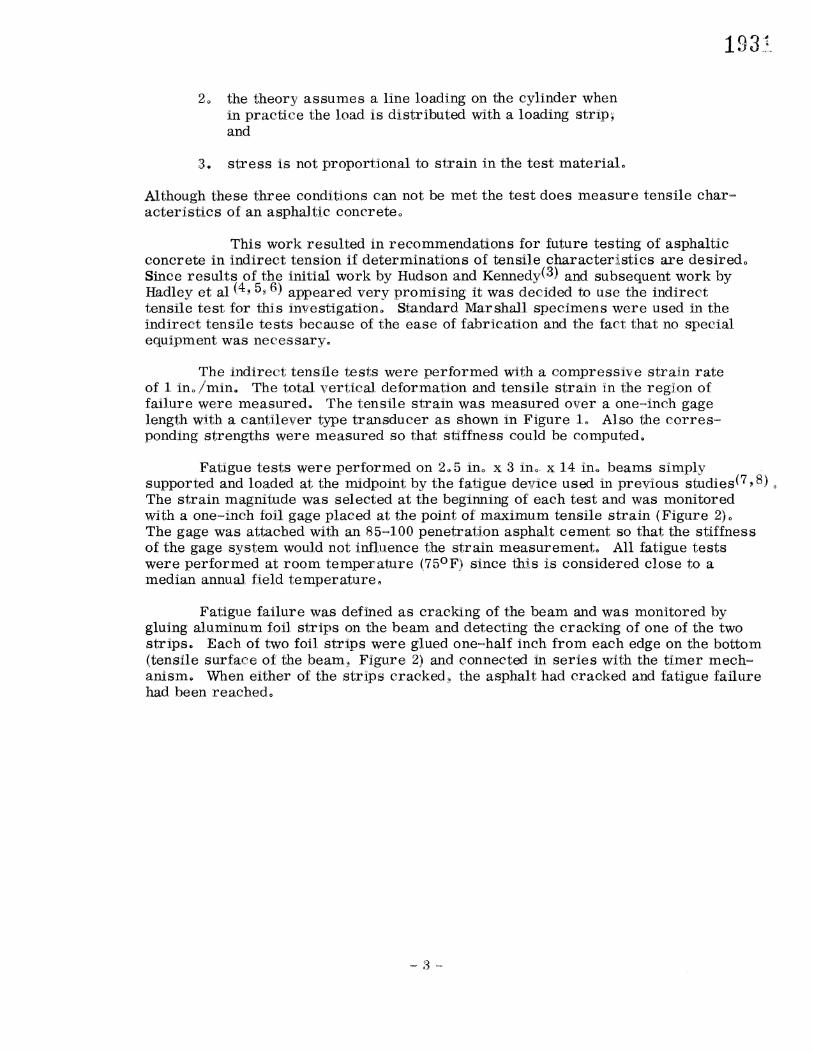
The indirect tensile tests were performed with a compressive strain rate of 1 ino/rain, The total vertical deformation and tensile strain, in the region of failure were measured, The tensile strain was measured over a one-inch gage length with a cantilever type transducer as shown in Figure Io Also the corres• ponding strengths were measured so that stiffness could, be computed°
Fatigue tests were performed on 2.o.5 ino x 3 in x 14 ino beams simply supported and loaded at the midpoint by the fatigue device used • previous studies (7, 8) The strain magnitude was selected at the beginning of each test and. was monitored with a one=inch foil gage placed at the point of maximum tensile strain (Figure 2)° The gage was attached with an 85=I00 penetration asphalt cement so that the stiffness of the gage system would not influence the strain measurement° All fatigue tests were performed at room temperature (75°F) since this is considered close to a median annual field temperature°
Fatigue failure was defined as cracking of the beam and was monitored by gluing aluminum, foil strips on the beam and detecting the cracking of one of the two strips. Each. of two foil strips were glued one=ohalf inch from each edge on the bottom (tensile surface of the beam• Figure 2) and connected • series with the timer mech• anismo When either of the strips cracked• the asphalt had cracked and fatigue failure had been reachedo
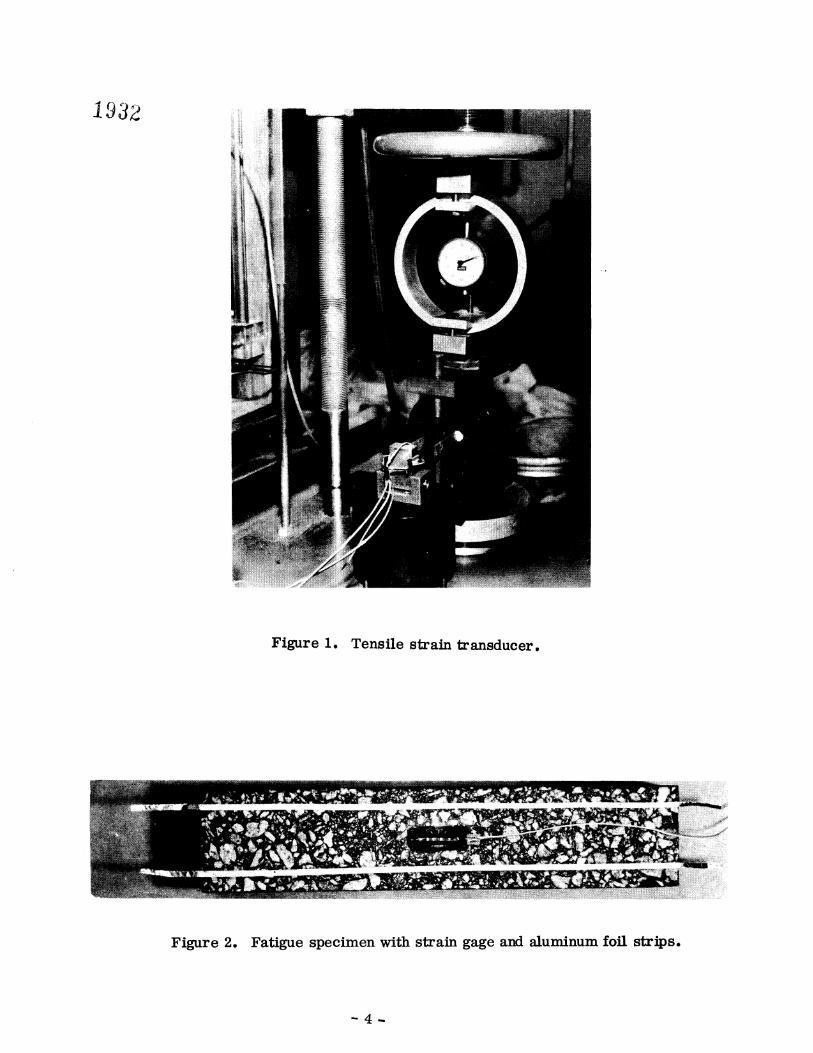
Figure 1o Tensile strain transducer,
Figure 2. Fatigue specimen with strain gage and aluminum foil strips.
-4-
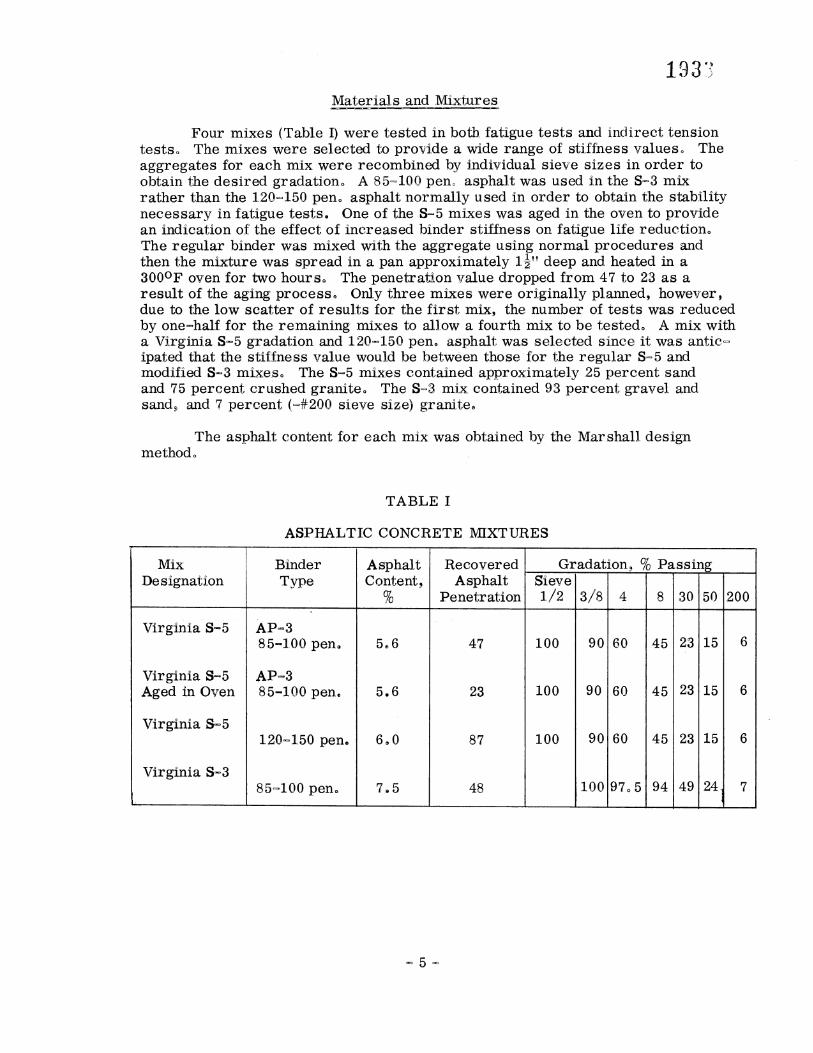
Materials and Mixtures
Four mixes (Table I) were tested in both •atigue tests and indirect tension tests° The mixes were selected to provide a wide range of stiffness values° The aggregates for each mix were recombined by individual sieve sizes in order to obtain the desired gradation° A 85-100 pen° asphalt was used in the S-3 mix rather than the 120-•150 pen° asphalt normally used in order to obtain the stability necessary in fatigue tests. One o• the S-5 mixes was aged in the oven to provide an indication of the effect of increased binder stiffness on fatigue life reduction° The regular binder was mixed with the aggregate using normal procedures and then the mixture was spread in a pan approximately 1½" deep and heated in a 300°F oven for two hours° The penetration value dropped from 47 to 23 as a result of the aging process° Only three mixes were originally planned, however, due to the low scatter of results for the first mix, the number of tests was reduced by one-half for the remaining mixes to allow a fourth mix to be tested° A mix with a Virginia S-5 gradation and 120-150 pen° asphalt was selected since it was antic= ipated that the stiIIness value would be between those for the regular S=5 and modified S-3 mixes° The S=5 mixes contained approximately 25 percent sand and 75 percent crushed granite° The S=3 mix contained 93 percent gravel and sand• and 7 percent (=#200 sieve size) granite°
The asphalt content ior each mix was obtained by the Marshall design method°
TABLE I
ASPHALTIC CONCRETE MIXTURES
Mix Designation
Virginia S-5
Vir ginia $-5 Aged in Oven
Virginia S-5
Virginia S-3
Binder Type
AP=,3 8 5-].00 pen•
AP-,3 85-100 pen,
120•o150 pen.
85=1.00 pen°
Asphalt Content,
%
Recovered Asphalt
Penetration,
47
23
87
48
Gradation, % Passing Siev
100
i00
i00
3/8 4 8
9O
9O
9O
100
60 45
60 45
60 45
970 5 94
30 50 200
23
23
23
49
15
15
15
24 7
RESULTS
Fatigue Tests
It has been found that the general relationship between cycles of load to failure and strain is
1 n N (-•) (2)
in which:
cycles to failure
a constant depending on mix properties
the magnitude of the applied strain
n a constant
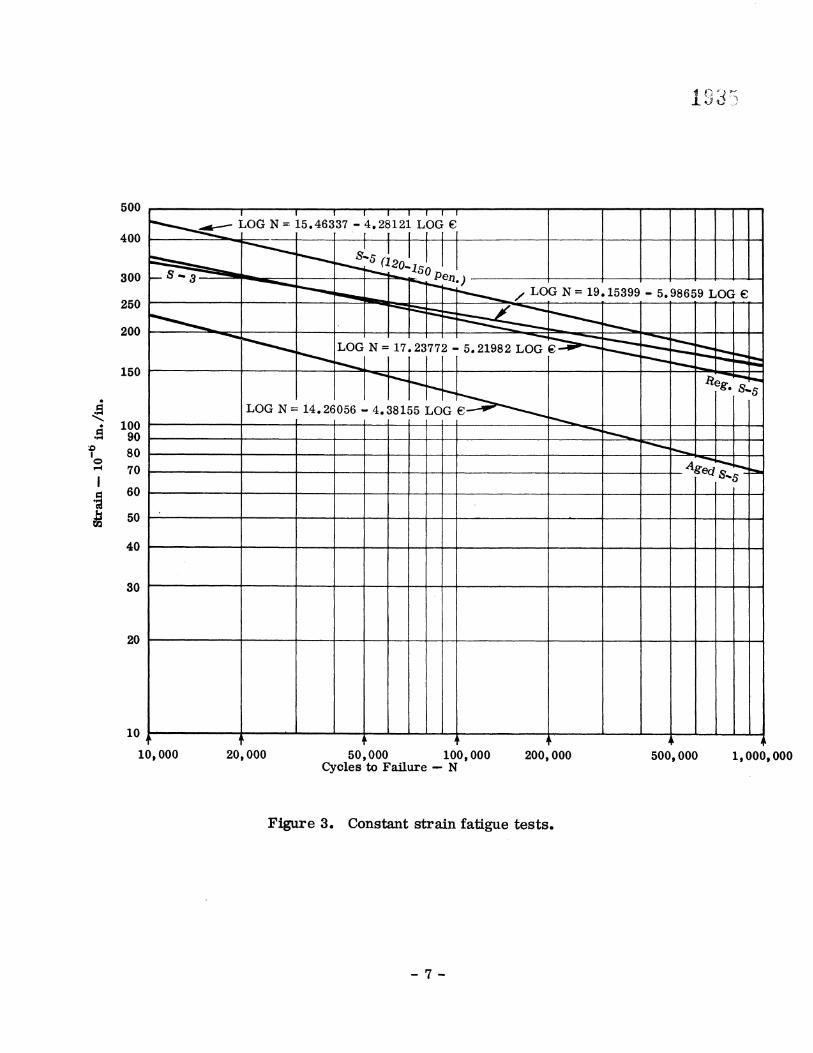
This relationship is linear between the log of applied strain, •, and the log of loading cycles, No If the constants and applied strain for a mix are known, then it is possible to predict the fatigue life of the pavement. It was necessary to develop fatigue-strain relationships for the mixes tested in order that the effect of stiffness could be determined° The Appendix contains the data for each fatigue test that was used to develop the relationships.
Figure 3 illustrates a log-log plot of the relationship for each mixture and gives the equation for each relationship. The K values range from 1o 7 x
1014 to 1o4 x
1019, and the n values from 4o 3 to 6o 0 for the four mixes tested. Santucci and Schmidt(9) found n values (slopes) ranging from 2.5 to 5o 9 for constant strain laboratory fatigue tests, which are consistent with the values obtained in this in- vestigation. The curve for the aged S•5 mix is located below the curve for the regular S-5 mix, indicating a lower fatigue life for the aged mix at equivalent strain levels.
Kasianchuk and Monismith (1) consider 150 x 10 -6 ino/in, strain magnitude
as the maximum value acceptable in California. This strain level should provide more than one million loading cycles before failure. At a 150 x 10 -6 in./in, strain level the S-3 mix and S-5 mixwith 120-150 penetration asphalt had fatigue lives of 1,340,000 cycles and 1,400,000 cycles respectively° The regular S-5 mix with a recovered asphalt penetration of 47 had a fatigue life of 750,000 and the aged S-5 mix with a recovered asphalt penetration of 23 had a fatigue life of 50,000 cycles. These results substantiate the past field observations that mixes containing asphalts with penetration values less than 30 will experience premature failures.
50O
400
300
250
200
150
• 100 90 80
"• 70
o• 60
• 50
15399 5. 98659 LOG •
LOG N 17. 23772 5.21982 LOG
3O
2O
10
10,000 50,000 100,000 200,000 Cycles to Failure N
500,000 1,000,000
Figure 3. Constant strain fatigue tests,
-7-
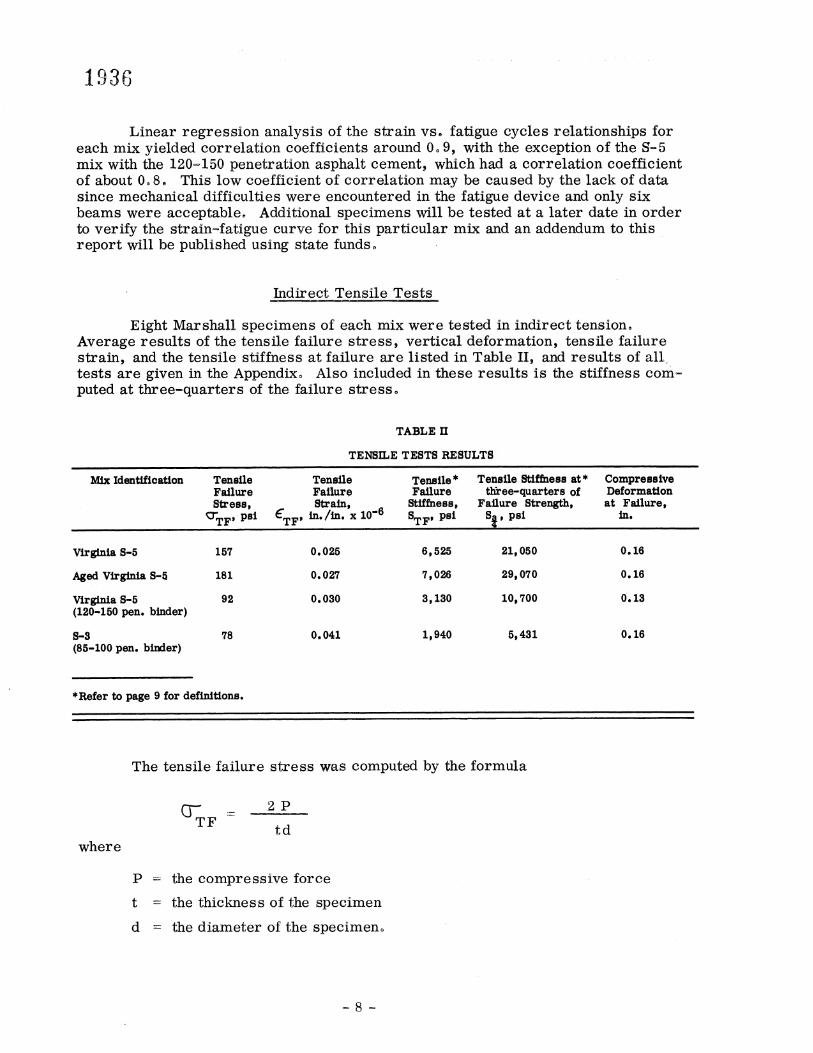
Linear regression analysis of the strain vs. fatigue cycles relationships for each mix yielded correlation coefficients around 0o 9, with the exception of the S-5 mix with the 120-150 penetration asphalt cement, which had a correlation coefficient of about 0o 8. This low coefficient of correlation may be caused by the lack of data since mechanical difficulties were encountered in the fatigue device and only six beams were acceptable. Additional specimens will be tested at a later date in order to verify the strain=fatigue curve for this particular mix and an addendum to this report will be published using state funds°
Indirect Tensile Tests
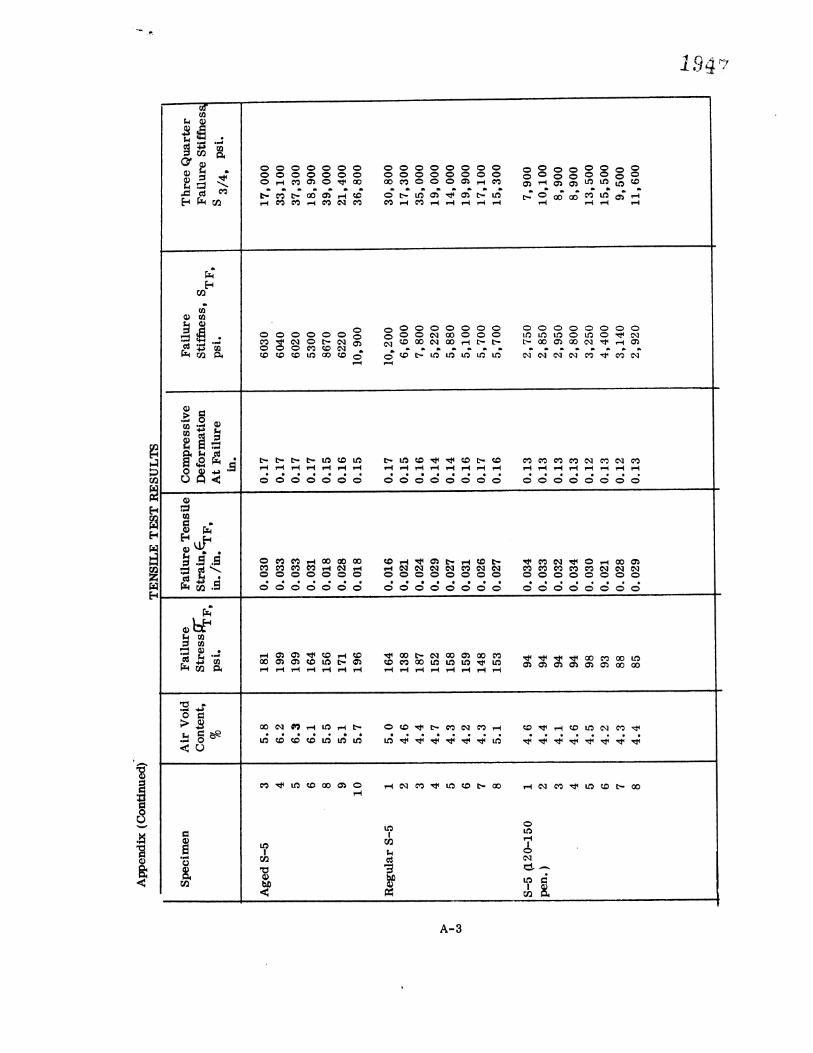
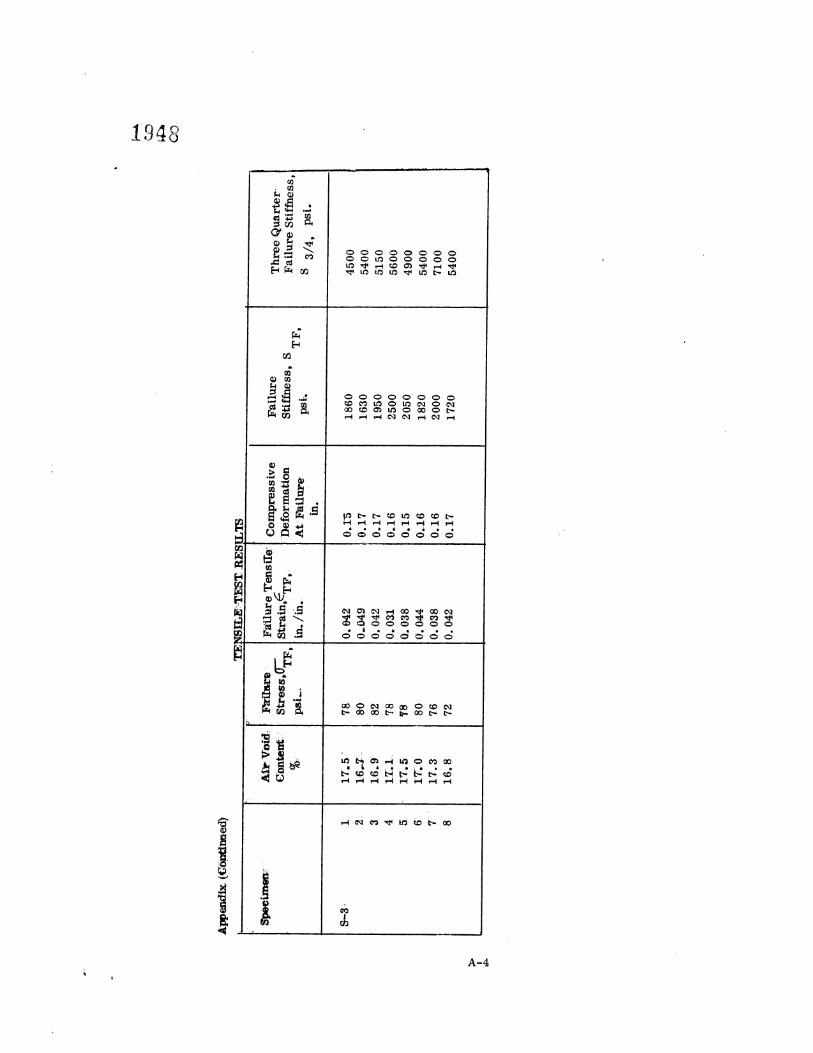
Eight Marshall specimens of each mix were tested in indirect tension° Average results of the tensile failure stress, vertical deformation, tensile failure strain, and the tensile stiffness at failure are listed in Table II, and results of aIl•, tests are given in the Appendix° Also included in these results is the stiffness com- puted at three-quarters of the failure stress°
Mix Identification
TABLE II
TENSILE TESTS RESULTS
Tensile Tensile Tensile * Tensile Stiffness at* Compressive Failure Failure Failure three-quarters of Deformation Stress, Strain, Stiffness, Failure Strength, at Failure,
Virginia S-5 157
Aged Virginia S-5 181
Virginia S-5 92 (120-150 pen. binder)
S-3 78 (85-100 pen. binder)
0.025 6,525 21,050 0.16
0.027 7,026 29,070 0.16
O. 030 3,130 I0,700 0. 13
O. 041 I, 940 5,431 O. 16
*Refer to page 9 for definitions.
The tensile failure stress was computed by the formula
where
TF td
P the compressive force
t the thickness of the specimen d the diameter o• the specimen°
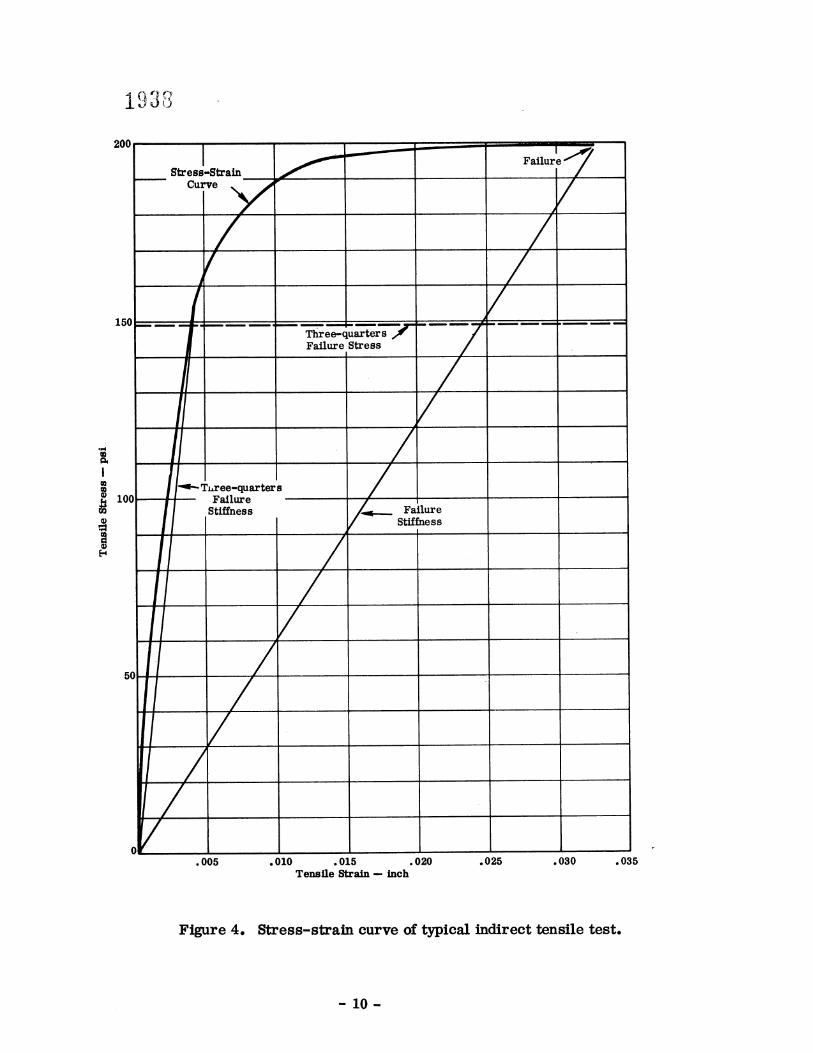
A typical tensile stress=strain curve for the aged S=5 mix is shown in Figure 4o The initial portion of thi_s curve is almost linear, however, due to the viscoelastic nature o• asphaltic concrete the curve flattens and failure occurs
in a nonlinear portion of the curve° The stiffness at three-quarters of the failure stress was used for comparison with reference to fatigue failure because the stress=strain curve is linear in this region and the results are more consistent°
The tensile failure strength ranged from 78 psi for the "flexible" mix to 181 psi for the. stiff mix° The regular S=5 surface mix, which would be considered a typical Virginia mix, had a tensile failure strength, of 157 psi which compares very well with Hadley•s work at this strain rateo
In general the average tensile strain at failure was less for the stiffer mixes than for the "flexible" mixeso The tensile strain at failure ranged from 025 ino/in. to 041 ino/ino Similarly, strain values corresponding.to thr.ee=quarters fail•re strength ranged from 005 ino/in,, to 011 ino/ino There appears to be no significant difference in the vertical (compressive) deformations at failure between the mixes tested
Tensile stii'fimss was computed both for failure and three-quarters failure conditions by the respective formulas
q:•TF •: TF STF
• and S.•_
T F 4 4
where"
the tensile stillness
TF the tensile stress
the tensile strain
the tensile strain at •C•TF
The stiffness at three=quarters failure strength, S•_, is used f•or the stiff•ness comparison since it is in the region of the stress•strain relationship that is nearly linear and should be more applicable to fatigue failures than ultimate failure stiffness° As expected, the mixture that had been aged in the oven until the bitumen penetration dropped to 23 had the highest three=quarter stiffness, o• 29,070 psi compared to 21,050 psi •or the regular mixture° A similar mixture with a 120=150 pen. bitumen (recovered penetration 87) had a three=quarter stiffness of I0., 700 psi. The mixture had a low three•quarter stiffness of 5,430 psi,which would be expected •or a fine mixture ol this type. These results illustrate that stiffness at this strain rate can differ to a large extent •or different types of mixes° Also the stiffness can be altered by using a bitumen w}th a dilferent hardness° Although strain rates of tensile strains in pavements are much higher than those used in this test the same relative differences for stiffnesses of different mixes should exist, making this information valuable for pawement design°
2OO
150
100
Stress-Strain Curve
Failure
Tnr ee-qu ar ter s Failure Stiffness
Tl•ree-quart•r s /• //
Failure Stress
ilure / Stiffness
/ /-
005 .010 .015 .020 .025 .030 Tensile Strain-- inch
.035
Figure 4. Stress-strain curve of typical indirect tensile test.
10-
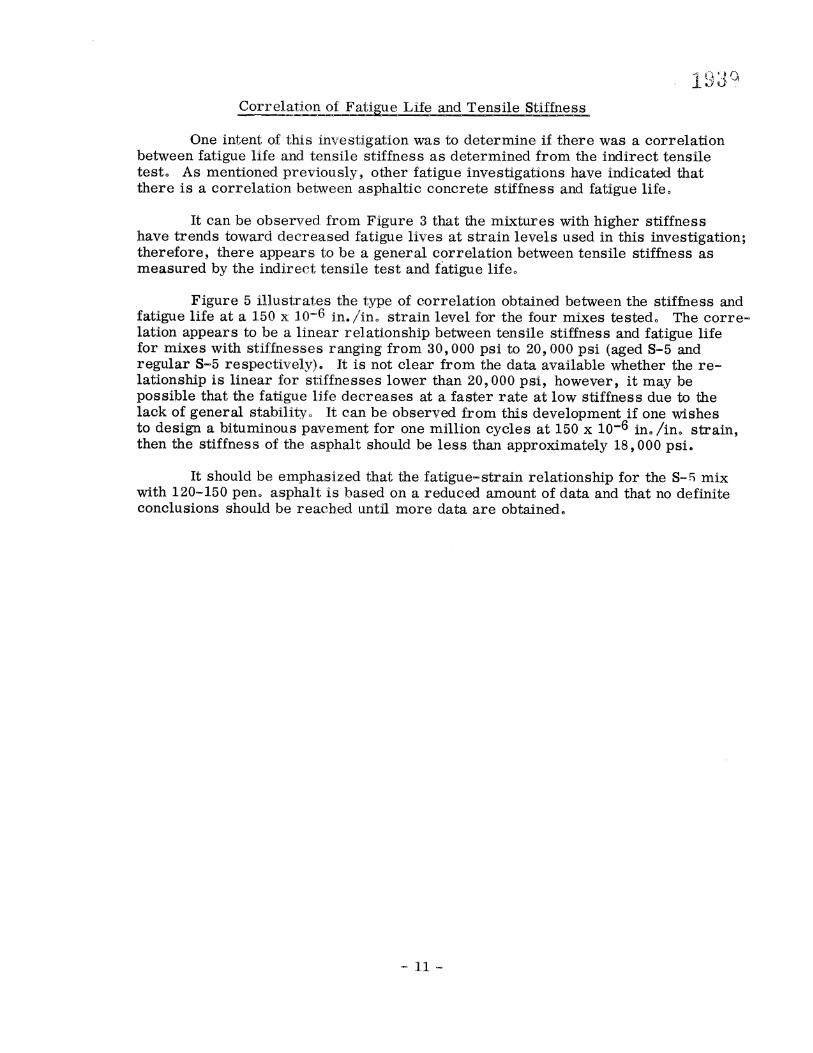
Corr e_____•l•at_ip_n__?i_•..•_a_t_i_gu_e Life_and T ePsile Stj•ffn•ss_
One intent of this investigation was to determine if there was a correlation between fatigue li•e and. tensile stiffness as determined from the indirect tensile test° As mentioned previously, other fatigue investigations have indicated that there is a correlation between asphaltic concrete stiffness and fatigue lifeo
It can be observed from Figure 3 that the mixtures with higher stiffness have trends toward decreased fatigue lives at strain levels used in this investigation; therefore, there appears to be a general correlation between tensile stiffness as measured by the indirect tensile test and fatigue lifeo
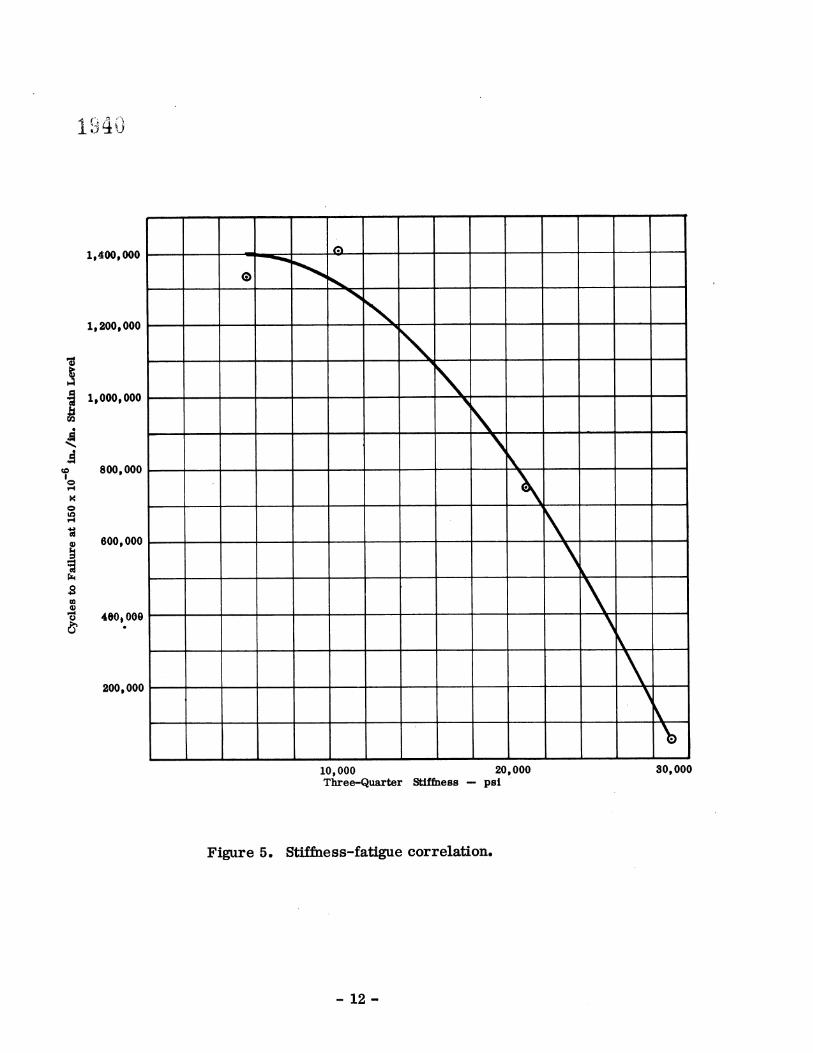
Figure 5 illustrates the type of correlation obtained between the stiffness and fatigue life at a 150 x 10 •6 in./ino strain level £or the four mixes tested° The corre- lation appears to be a linear relationship between tensile stiffness and fatigue life for mixes with stiffnesses ranging from 30,000 psi to 20,000 psi (aged S-5 and regular S-5 respectively). It is not clear from the data available whether the re- lationship is linear for stiffnesses lower than 20,000 psi, however, it may be possible that the fatigue life decreases at a faster rate at low stiffness due to the lack of general stability° It can be observed from this development if one wishes to design a bituminous pavement for one million cycles at 150 x 10 -6 ino/ino strain, then the stiffness of the asphalt should be less than approximately 18,000 psi.
It should be emphasized that the fatigue-strain relationship for the S•.• mix with 120-150 pen° asphalt is based on a reduced amount of data and that no definite conclusions should be reached until more data are obtained°
1,.•00,000
200,000
000,000
800,000
600,000
4eO• 000,
200,000
10,000 20,000 Three-Quarter Stiffness- psi
30,000
Figure 5. Stiffness-fatigue correlation.
12-
CONCLUSIONS
The indirect tensile test can be used to evaluate the stiffness of an asphaltic concrete°
2. The tensile strain at failure appears to increase for mixes with lower stiffness.
3o Artificial aging of an asphaltic mixture decreases the tatigue lifeo
4• From the data available the mixture with the 120•150 penetration asphalt cement appeared to have a longer fatigue life than the mixture with the 85•100 penetration asphalt cement.
There appears to be a general correlation between, tensile stiffness and fatigue life at reasonable strain, levels°
RE CO MME NDAT IO NS
The strain-fatigue relationships have been derived experimentally for a number of mixes° They indicate the magnitude of strain that may result in. a shortened pave- ment life due to fatigue cracking°
It would be beneficial to determine if flexible pavements in, general are under- going strain cycles in sufficient magnitude and quantity to cause fatigue damage° This could be done by monitoring strains induced by traffic on actual pavements°
Also the possibility of predicting fatigue susceptibility of a mix from indirect tensile test results should be investigated further, This investigation, would involve fatigue testing and indirect tensile testing of additional mixes and, ultimately, using the field strain data and fatigue stiffness correlation to predict the fatigue suscep- tibili ,ty of mixes° It is anticipated that this information will be gathered in subsequent investigations so that the indirect tensile test can be used to indicate the potential fatigue life of an asphaltic concrete°

Io
2•
9•
REFERENCES
Kasianchuk, Do A., Co Lo Monismith, and Wo Ao Garrison, "Asphalt Concrete Pavement Design Subsystem to Consider the Fatigue Mode
" Hi••earch Record Noo 291. Highway Research of Distress, Board, Washington• D. C.• (1969)ppo 159•172.
Finn, Fred No, "Factors Involved in the Design. of Asphaltic Pavement Surfaces, •'• National Cooperative Hih•' Research Program Report Noo 39, Highway Research Board• Washington, Do Co, (1,967) po 66•
Hudson, Wo Ron.ald, and Thomas Wo Kennedy, 'rAn Indirect Tensile Test for Stabilized Materials•" Research Report 98=I• Center for Highway Research, The University of Texas at Austin, January 1968•
Hadley, William Oo Wo Ronald Hudson, Thomas Wo Kennedy, and Virgil Lo Anderson, "A S2;atistical Experiment to Evaluate Tensile Properties of Asphalt- Treated Materials• •'• Proceedin•, Association of Asphalt Paving Technologists, Volo 38• 1969o
'•Correlation. of Tensile Properties with Stability and Cohesiometer Values for Asphalt=Treated Materials• '' Research Report 98•6• Center for Highway Research• The University of Texas at Austin, June 19700
"A Method of Estimating Tensile Properties of Materials Tested in Indirect Tension, '• Research Report Noo 98•7• Center for Highway Research, The University oll Texas at Austin, July I•970o
Maupin, Go Wo Jro "Effects of Aggregate Shape on the Fatigue Behavior of an Asphaltic Surface Mixture," Virginia Highway Research Council• Charlottes- ville, Virginia• June 1968o
"Ef•iect of Some Aggregate Characteristics on the Fatigue Behavior of an
Asphaltic Concrete Mixture• " Virginia Highway Research Council, Charlottesville• Virginia,, July 19•70o
Santucci, L. E o,
and R. Jo Schmidt• "The Effect of Asphalt Properties on the Fatigue Resistance of Asphalt Pa•ing Mixtures," Proceedings, Association of Asphalt Paving Technologists, Volo 38, 1969o

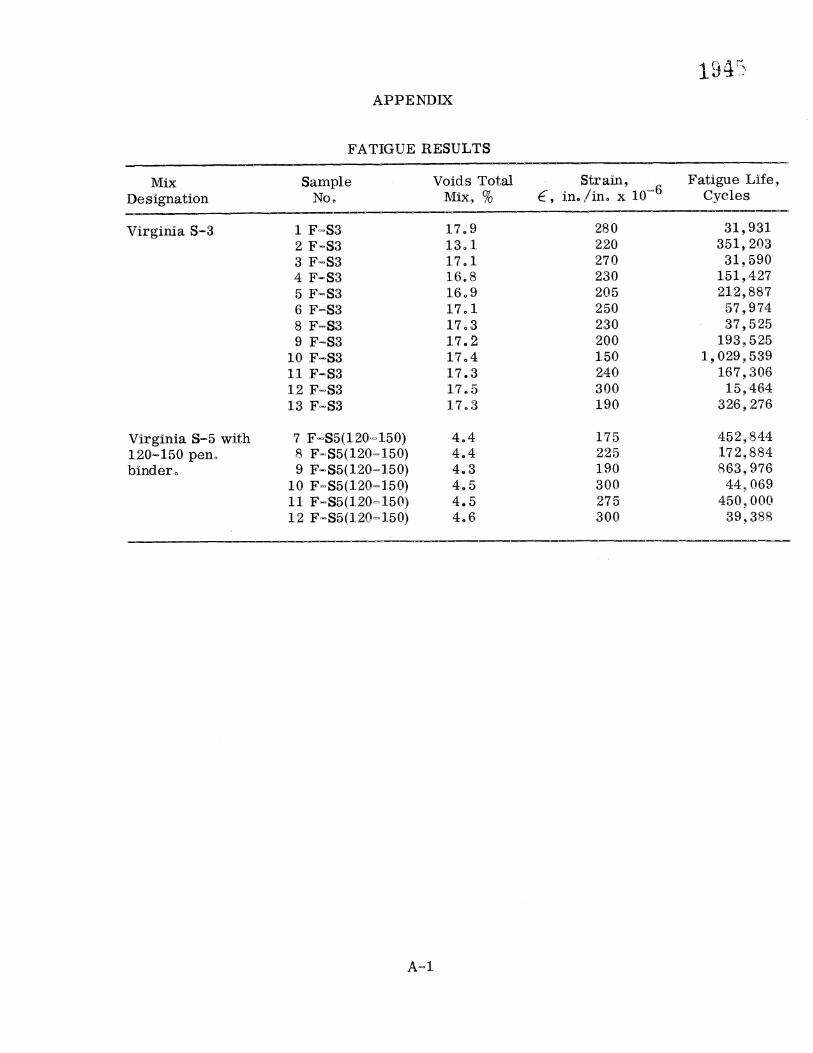
APPENDIX
Mix Designation
Virginia S-3
FATIGUE RESULTS
Sample Voids Total. Strain, No. Mix, % £', in./in, x 10 =6
1 F=S3 17.9 280 2 F-S3 13.1 220 3 F-S3 17o I 270 4 F-S3 16.8 230 5 F-S3 16.9 205 6 F=S3 17ol 250 8 F=S3 17o3 230 9 F-S3 17.2 200
10 F-S3 17o4 150 11 F•S3 17.3 240 12 F=S3 17•5 300 13 F-S3 17o3 190
Virginia S-5 with 120-150 pen° binder°
4.4 175 4.4 225 4.3 190 4.5 300 4.5 275 4.6 300
Fatigue Life, Cycles
31,931 351• 203 31,590
151,427 212,887 57,974 37,525
193,525 I, 029,539
167,306 15,464
326,276
452,844 172•884 9;63,976 44 069
450•000 39,388
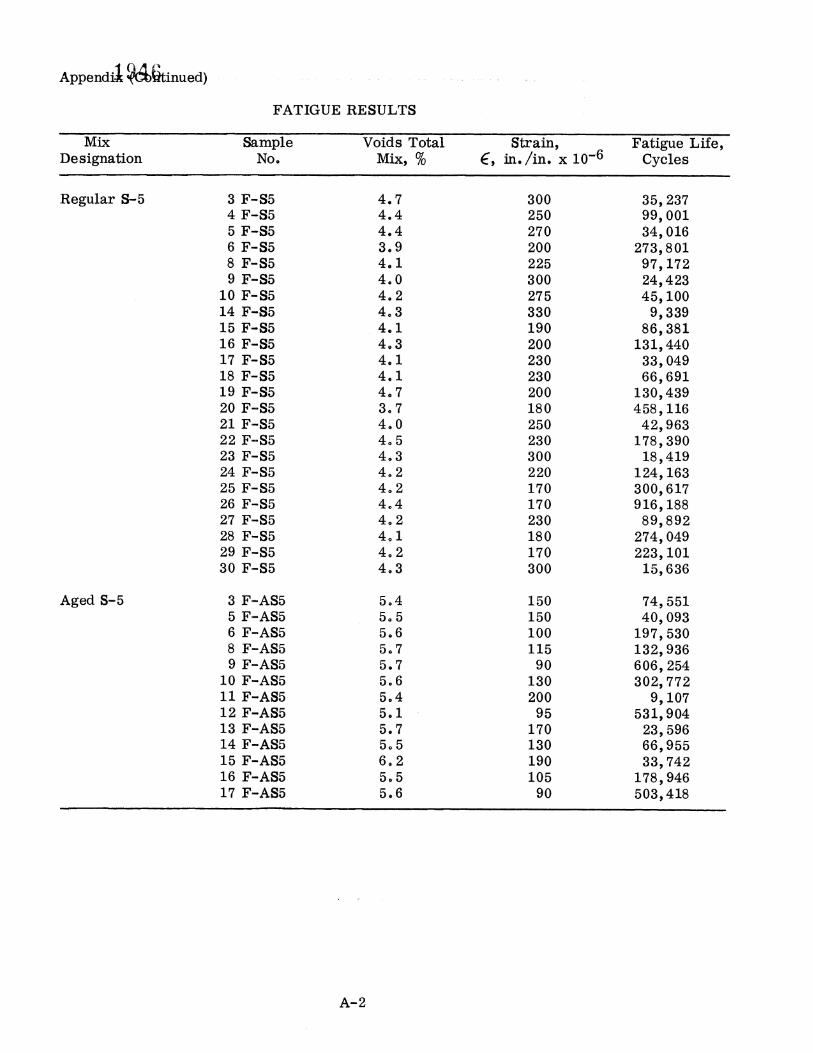
Appendi• ••tinued) FATIGUE RESULTS
Mix Designation
Regular S-5
Aged S-5
Sample No.
3 F-S5 4 F-S5 5 F-S5 6 F-S5 8 F-S5 9 F-S5
10 F-S5 14 F-S5 15 F-S5 16 F-S5 17 F-S5 18 F-S5 19 F-S5 20 F-S5 21 F-S5 22 F-S5 23 F-S5 24 F-S5 25 F-S5 26 F-S5 27 F-S5 28 F-S5 29 F-S5 3O F-S5
3 F-AS5 5 F-AS5 6 F-AS5 8 F-AS5 9 F-AS5
10 F-AS5 11 F-AS5 12 F-AS5 13 F-AS5 14 F-AS5 15 F-AS5 16 F-AS5 17 F-AS5
Voids Total Mix, %
4.7 4.4 4.4 3.9 4.1 4.0 4.2 4.3 4.1 4.3 4.1 4.1 4.7 3,7 4.0 4°5 4.3 4.2 4.2 4°4 4.2 4.1 4.2 4.3
5.4 5,5 5.6 5.7 5.7 5.6 5.4 5.1 5.7 5.5 6,2 5.5 5.6
Strain, in./in, x 10 -6
300 250 270 200 225 300 275 330 190 200 230 230 200 180 250 230 3O0 220 170 170 230 180 170 3OO
150 150 100 115 90
130 200 95
170 130 190 105 90
Fatigue Lff•, Cycles
35• 237 99• 001 34• 016
273•801 97• 172 24• 423 45• 100 9•339
86•381 131• 440 33• 049 66•691
130,439 458,116 42•963
178•390 18,419
124,163 300•617 916,188 89,892
274• 049 223• I01 15,636
74,551 40,093
197,530 132,936 606,254 302,772
9,107 531,904 23,596 66,955 33,742
178,946 503,418