Embed Size (px)
Citation preview
CT&F Ciencia, Tecnología y Futuro
ISSN: 0122-5383
ECOPETROL S.A.
Colombia
Villabona-Camacho, Jhoao; Orozco-Orozco, Sergio; Calderón-Carrillo, Zuly; Saavedra, Néstor-F.
Assembly of a methodology for determination of membrane efficiency in preserved shales
CT&F Ciencia, Tecnología y Futuro, vol. 3, núm. 5, diciembre, 2009, pp. 67-84
ECOPETROL S.A.
Bucaramanga, Colombia
Available in: http://www.redalyc.org/articulo.oa?id=46519036005
How to cite
Complete issue
More information about this article
Journal's homepage in redalyc.org
Scientific Information System
Network of Scientific Journals from Latin America, the Caribbean, Spain and Portugal
Non-profit academic project, developed under the open access initiative
ASSEMBLY OF A METHODOLOGY FOR DETERMINATION OF MEMBRANE EFFICIENCY IN PRESERVED SHALES
CT&F - Ciencia, Tecnología y Futuro - Vol. 3 Núm. 5 Dic. 2009 67
ASSEMBLY OF A METHODOLOGY FOR DETERMINATION OF MEMBRANE EFFICIENCY IN PRESERVED SHALES
Jhoao Villabona-Camacho1*, Sergio Orozco-Orozco2*, Zuly Calderón-Carrillo3 and Néstor-F. Saavedra4
1.3 Universidad Industrial de Santander, UIS, Bucaramanga, Santander, Colombia 2, 4 Ecopetrol S.A. - Instituto Colombiano de Petróleo, A.A. 4185 Bucaramanga, Santander, Colombia
e-mail: [email protected] e-mail: [email protected]
(Received April 16, 2009; Accepted Nov. 19, 2009)
D etermination of Membrane Efficiency (ME) is a very useful tool in the study of the chemical component of wellbore stability since it is a variable input in chemical-elastic models (Lomba, Chenevert & Sharma, 2000). This article presents a novel methodology for the determination of ME using the Electrochemical Potential
Test (EPT) in shale rocks. This method is based on the development of correlations with Ionic Selectivity (IS) values in presence of NaCl, KCl and CaCl2 at diverse solution concentrations. The correlation, not reported previously in the literature, depends on the type of salt used. The EPT is a generic test easily applied to any rock type from any well or basin. It is simpler and quicker than other tests used for the ME determination, like the Pressure Transmission Test (PTT). Correlations between ME and IS are applicable to any type of argillaceous rock. Samples of unperturbed plugs with diverse properties belonging to different Colombian formations were used. The results obtained with the application of the proposed methodology indicate that it is possible to obtain IS and ME values through EPT in any type of argillaceous rock by applying the developed correlations.
Keywords: membrane efficiency, ionic selectivity, electrochemical potential test, wellbore stability, chemical interaction, osmosis, shales, water activity.
Ciencia, Tecnología y Futuro
*To whom correspondence may be addressed
CT&F - Ciencia, Tecnología y Futuro - Vol. 3 Núm. 5 Dic. 2009
JHOAO VILLABONA CAMACHO et al.
68
La determinación de la Eficiencia de Membrana (EM) constituye una herramienta útil en el estudio del componente químico en la estabilidad de pozo, ya que es una variable de entrada en el de-sarrollo del modelamiento químico elástico (Lomba et al., 2000). En este artículo se propone una
metodología novedosa para la determinación de la EM de rocas arcillosas utilizando una Prueba de Po-tencial Electroquímico (PPE), mediante el desarrollo de correlaciones no reportadas con anterioridad en la literatura y dependientes del tipo de sal usada, con los valores de Selectividad Iónica (SI), en presencia de soluciones de NaCl, KCl y CaCl2 de diversas concentraciones. La PPE es una prueba genérica que puede ser aplicada fácilmente a cualquier tipo de roca, de cualquier pozo, cuenca o campo, y es más sencilla y rápida que otras pruebas usadas en la determinación de la EM como la Prueba de Transmisión de Presión (PTP). Las correlaciones obtenidas entre la EM y la SI son aplicables a cualquier tipo de roca arcillosa. Para la aplicación de la metodología propuesta se utilizaron muestras de roca de diversas propiedades de for-maciones Colombianas. Los resultados obtenidos con la aplicación de la metodología propuesta muestran que es posible obtener valores de SI y valores de EM a través de la PPE en cualquier tipo de roca arcillosa, por medio de las correlaciones desarrolladas.
Palabras Clave: eficiencia de membrana, selectividad iónica, prueba de potencial electroquímico, estabilidad de pozo, interacción química, ósmosis, rocas arcillosas, actividad acuosa.
ASSEMBLY OF A METHODOLOGY FOR DETERMINATION OF MEMBRANE EFFICIENCY IN PRESERVED SHALES
CT&F - Ciencia, Tecnología y Futuro - Vol. 3 Núm. 5 Dic. 2009 69
INTRODUCTION
One of the most expensive problems in oil well drilling operations is related to formation stability in the face of the well. Regarding shale formations only, these wellbore stability events cost the industry between 900 and 1000 million US dollars worldwide (Mody, Tare, Tan, Drummond & Wu, 2002). Furthermore, it has been calculated that shale rocks are the major source for wellbore instability in 75% of drilling operations in the world (Frydman & Da Fontoura, 2001). Instability wellbore problems are generated from rock variation during the drilling process as a consequence of the stress experienced due to their varied and complex mineral composition, as well as the composition of the drilling fluids utilized in the operation (variations are caused not only by physical but also by chemical media). There are many factors causing instability problems and most of them are related to shale formations and their physicochemical interaction with the drilling mud, such as chemical osmosis due to the membrane behavior exhibited by shale rocks (Pérez, 2002). Shale rocks are not ideal semipermeable membranes and this is the reason why their behavior is evaluated through the determination of their ME (AL-Bazali, 2003).
A1 Formation fluid activityA2 Drilling fluid water activity CIC Cationic Interchange CapacityEM Membrane EfficiencyDL Detection LimitQL Quantification Limit EPT Electrochemical Potential TestPTT Pressure Transmission TestSD Standard Deviation SI Ionic Selectiviy
NOMENCLATURE
Osmosis has long been acknowledged as a means to take water out of rocks when the aqueous acti-vity of the formation is greater that the drilling fluid. When a hydraulic pressure gradient is not present, the movement of mud inside the rock is determined by the chemical potential difference between the pore fluid and the drilling fluid (Ewy & Stankovich, 2000). However, it has been recently demonstrated that the osmotic potential generated between the rock and the drilling fluid is influenced by ion flow inside or outside the rock due to ionic concentration imbalance (Zhang, Chenevert, AL-Bazali & Sharma, 2004). This has resulted in an interest for the quantification of the impact of ionic flow on osmotic potential, based on the ME or osmotic efficiency concepts (Kemper & Rollins, 1966). Several factors influencing ME have been presented in the literature (Lomba et al., 2000; AL-Bazali, Zhang, Chenevert & Sharma, 2005; Da Fontoura, Rabe & Lomba, 2002) such as temperature, pressure, and membrane properties, among others. Nevertheless, it has been demonstrated that the most influencing aspects are: 1) Ratio between the effective ion radius / hydrated solute and the pore gore average radius in the clay. 2) Electrostatic interactions between negatively - charged clay plates and ionic solutes (Van Oort, Hole, Mody & Roy, 1996).
CT&F - Ciencia, Tecnología y Futuro - Vol. 3 Núm. 5 Dic. 2009
JHOAO VILLABONA CAMACHO et al.
70
Among ME publications, it is worth mentioning Staverman’s (1952), who presented a model demons-trating that the osmotic pressure values obtained using non-ideal membranes are different to the values deter-mined by thermodynamics, and that such values depend on permeability. Then, Van Oort et al. (1996) used PTT to measure ME. These authors determined that ME depends on fluid parameters such as the size of solute hydration and rock parameters such as the Cationic In-terchange Capacity (CIC) and the superficial area. On the other hand, Lomba et al. (2000) evaluated ME in native shale rocks by measuring the Electrochemical Potential (EP). Then, AL-Bazali et al. (2005) develo-ped a rig-site test for the determination of membrane potential on drill cuttings. ME was determined by PTT and IS was measured using EPT. These authors established that ME and IS show the same tendency in the same type of samples. Furthermore, AL-Bazali, Zhang, Chenevert and Sharma (2006) determined rock ME when interacting with water-based muds (WBM) and with oil-based muds (OBM). They established a dependence of rock ME according to the type and concentration of ions in the fluids by using different cations and anions on a concentration range.
Unlike the above mentioned studies, this article proposes a novel methodology for the indirect deter-mination of ME by the development of correlations between ME and IS measured with EPT in shale plugs with aqueous solutions of NaCl, KCl and CaCl2, whose concentrations are expressed based on water activities (values of 0,96, 0,93 and 0,85). The methodology pre-sented was developed in two general phases: the first phase consisted in the design and construction of an elec-trochemical potential cell and in the design of a protocol for sample preparation. The second phase consisted in the determination of a protocol for the measurement of IS and ME and the establishment of correlations between IS and ME. The proposed methodology is simple and quick compared to other methodologies proposed in the literature such as PTT, that compares the measured or real drop in osmotic pressure to the theoretical osmotic pressure in order to estimate ME in a direct manner. The PTT is conducted at a laboratory by analyzing a duly pre-served plug, using specialized equipment and simulating bottom well pressures. The sample is submitted to both an osmotic gradient and a hydraulic gradient in direct exposure with OBM or WBM drilling fluids in this test.
This test takes approximately 72 hours (Schlemmer, et al., 2002). EPT takes approximately 15 minutes. Among other characteristics, it does not require an electrical source, and the equipment required is small and easily portable, (AL-Bazali et al., 2005).
Four plug samples unperturbed by drilling fluids were selected in order to apply the methodology proposed. These samples from different Colombian formations and with diverse properties were pre-served, cut, fitted and characterized appropriately. Then, their IS values were determined with EPT and, finally, their ME values were determined by establi-shing correlations with IS. 135 tests were conducted for the application. Furthermore, an evaluation on the effect of the salt type and concentration on IS values was completed.
THEORETICAL FRAMEWORK
This paper includes basic concepts related to the osmotic phenomenon and membrane behavior in shale rocks since it focuses on the study and determination of shale membrane properties, such as ME and IS through EPT.
Chemical Osmosis
Chemical osmosis is the process by which two solutions at different concentrations, separated by a semipermeable membrane, exhibit solvent interchange by generating a flow from the area of low concentration (greater water activity) toward the area of high concen-tration (less water activity) (Chenevert & Pernot, 1998). In shale rocks, osmosis is the process by which water can flow through the pores between two points with different activities, while hydrated ions cannot or are substantially incapable of doing so (Fam & Dusseault, 1998). The pressure generated on the permeable membrane as a result of the flow across is known as theoretical osmotic potential (∆µ), which can be calculated through the fo-llowing general equation:
ASSEMBLY OF A METHODOLOGY FOR DETERMINATION OF MEMBRANE EFFICIENCY IN PRESERVED SHALES
CT&F - Ciencia, Tecnología y Futuro - Vol. 3 Núm. 5 Dic. 2009 71
Where: R = gas constant; T = absolute temperature; = molar volume of water; A1 = formation water activity; A2 = drilling fluid water activity. This expression can be applied to calculate the osmotic pressure generated in the rock when it comes in contact with a drilling fluid (AL-Bazali et al., 2006).
The determination of the values corresponding to water activity of solutions in relation to their concen-tration can be conducted by using the approximations reported in the literature. The correlations between the concentration values (expressed in % or w/w) and the water activity values (expressed in ratios) in KCl, NaCl and CaCl2 solutions are reported by Hale, Mody and Sallsbury (1993). The determination of water activity in preserve rock samples can be completed through the isothermal adsorption test in which relative humidity values related to water activity are determined (Che-nevert, 1970).
The osmosis process in the wellbore face generates the invasion of ions and water. This might increase pore pressure, swelling of shale formations, and cationic interchange reactions altering rock structure. All of these uncontrolled modifications bring about instabi-lity problems and operation delays (Fam & Dusseault, 1998). Several studies have demonstrated that, when using OBM, the oil film acts as a semipermeable mem-brane in the wellbore face thus preventing the passage of ions from the mud water phase to the rock. On the other hand, when WBM is used, the rock itself acts as a semipermeable membrane due to its small pore size and the superposition of electrical fields in the clay plates (Simpson & Dearing, 2000).
Ionic Selectivity (SI)An electrical potential is developed when two aque-
ous solutions with different concentration are separated by a porous medium permeable to cations and anions. This electrical potential is responsible for ionic motion through the membrane and this migration depends on the molecular size and the polar nature of ions, as well as on the concentration difference between the solutions (Frydman & Da Fontoura, 2001). IS or anionic exclusion is the ability of some rocks to prevent the passage of anions and allow the passage of cations. It is determined by measuring the drop of potential in an electrochemi-
cal potential cell using the general equation below. This equation can only by applied to the solutions with the same salt type (AL-Bazali et al., 2005):
Where: VM = potential measured through EPT; VLJ = Difusion potential or liquid bonding potential produced in non-selective membranes; VN = modified Difusion potential or Nerst potential produced in selec-tive membranes.
If an IS value is equal to 1 (100%), it indicates that it is a cationically perfect selective membrane (it allows the passage of cations and not anions). SI values between 0 and 1 indicate that it is a cationically imperfect selec-tive membrane. An IS value equal to 0 indicates that the membrane is not ionically selective (it allows the flow of all types of ions with no restrictions).
The liquid bonding potential or diffusion potential (VLJ) is the potential produced in non-ideal, non-selective membranes. It is determined through the following general equation: (AL-Bazali et al., 2005):
Where: t+ and t- = transportation number of cations and anions in solution.; R = Gas constant; T = Absolute temperature; F = Faraday constant; A1 and A2 = ionic activities.
The calculation of the transportation numbers is conducted by using the following general mathematical expressions (Castellan, 1998):
CT&F - Ciencia, Tecnología y Futuro - Vol. 3 Núm. 5 Dic. 2009
JHOAO VILLABONA CAMACHO et al.
72
Where: i and j = present ionic species; Z i, j = ion charge i, j; ui = absolute motion (uk = Dk / R*T, being Dk the diffu-sion coefficient) and Ci = concentration (mol/ cm3).
The diffusion coefficient (Dk) is specific for each type of ion and is reported in the literature as part of the specific properties of each ion. These values vary in the same type of ions because it depends on the ions to which they are bonded (Hale et al., 1993). Once the values co-rresponding to the charge, concentration and diffusion coefficient are known, the value corresponding to the transportation number is calculated for each ion.
The Nerst Potential or modified diffusion potential (VN) is the potential produced in ionically selective membranes. It is determined with the following general equation:
Where: R = Gas constant; T = Absolute temperature; F = Faraday constant; A1 and A2 = Ionic activities. The Nerst equation is a special case of the liquid bonding equation (Equation (3)), where the anion transporta-tion number is equal to 0 and the cation transportation number is equal to 1 (AL-Bazali et al., 2005).
Potential of AsymmetryThe potential of asymmetry is a small potential gene-
rated when identical solutions and reference electrodes are placed at both sides of the membrane, respectively. In this case, the theoretical potential difference must be zero. This potential is possibly generated by a me-chanical or chemical attack to the surface of the cell and electrodes or due to pollution of the external surface du-ring the usage (Henquin, Paslawski & Tozzi, 1999). The asymmetry potential is used as a correction factor in the potential readings with regard to the other concentrations employed during EPT in SI determination.
Membrane Efficiency (ME)ME measures how shale rocks can prevent ionic
movement. It is a function of both drilling fluid proper-ties and formation properties. ME is calculated using the following general equation (AL-Bazali et al., 2006):
Where: σ = membrane efficiency; ΔP = drop of real pressure; Δµ = theoretical osmotic pressure. The deter-mination of ΔP is generally completed through PTT. Δµ is defined in the equation 1.
PROPOSED METHODOLOGY
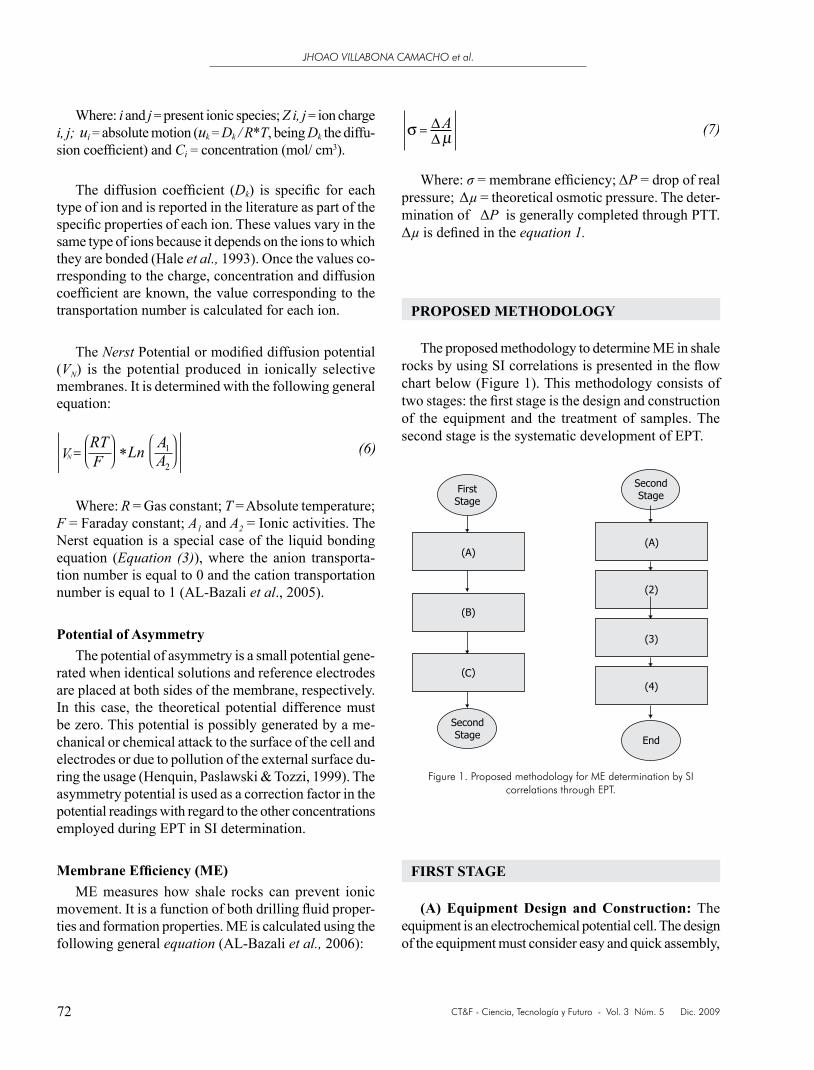
The proposed methodology to determine ME in shale rocks by using SI correlations is presented in the flow chart below (Figure 1). This methodology consists of two stages: the first stage is the design and construction of the equipment and the treatment of samples. The second stage is the systematic development of EPT.
Figure 1. Proposed methodology for ME determination by SI correlations through EPT.
FIRST STAGE
(A) Equipment Design and Construction: The equipment is an electrochemical potential cell. The design of the equipment must consider easy and quick assembly,
ASSEMBLY OF A METHODOLOGY FOR DETERMINATION OF MEMBRANE EFFICIENCY IN PRESERVED SHALES
CT&F - Ciencia, Tecnología y Futuro - Vol. 3 Núm. 5 Dic. 2009 73
correct location of the sample and great hermetic cha-racter. Its construction must be completed by using glass, teflon, and stainless steel since these materials conform to the characteristics required for test development.
(B) Preparation of Saline Solutions: The use of saline solutions of NaCl, KCl and CaCl2 at different concentrations (% or w/w) is recommended. The con-centrations commonly used in the literature in the IS and ME evaluation processes correspond to water activities of 0,96, 0,93 and 0,85 (Lomba et al., 2000). The relation between the concentration values represented in % w/w and the aqueous activity values can be conducted with the data reported in the literature (Hale et al., 1993).
(C) Sample Treatment: Selected samples are stored at room temperature and pressure, covered with resin and cut in small disks (disk thickness depends on the size of the sample holder). Samples are also submitted to a fitting process to eliminate the water present in the porous space. This process consists in submerging the sample in a solution with an aqueous activity equivalent to the pore fluid during 60 minutes (in each salt to be used separately) and drying them with absorbent paper. Then, the samples are exposed to a controlled aqueous activity environment (0,96 approximately) for 24 hours. This is the necessary time for the samples to reach the equilibrium in this environment thus obtaining an activi-ty close to 0,96, according to Fernández (2008). Samples must be characterized through laboratory tests in order to determine their properties such as: permeability, catio-nic interchange capacity, aqueous activity and mineral composition. The laboratory tests recommended in the literature for the characterization of samples before ME determination are the isothermal adsorption test, the methylene blue test, the DRX mineral composition test, among others (AL-Bazali et al., 2005).
SECOND STAGE
(1) Determination of the Asymmetry Potential: Two semi-cells must be filled with solutions of 0,96 concentra-tion for each salt. Potential drop throughout time must be measured considering that the solutions must be agitated continuously. Potential drop readings between the two
solutions are recorded every 30 s up to 15 minutes. No significant variation in readings is observed after this time (Lomba et al., 2000; Sharma, AL-Bazali, Zhang & Chen-evert, 2005). These readings are taken with an electronic multimeter connected to silver/silver chloride reference electrodes that are put inside each solution.
(2) Determination of Detection Limits (DL) and Quantification Limits (QL): The determination of DL and QL of IS values must be completed by using blank samples, measuring the variation of potential throughout time for each salt (NaCl, KCl and CaCl2) and activity combinations (0,96 - 0,93 and 0,96-0,85). Then, it is necessary to determine the IS values generated based on the relation to the potential drop values measured (deter-mination of diffusion potentials depends exclusively on the ionic species used and not on sample composition). Finally, for each determination, the general expressions shown in equations 8 and 9 are used.
(3) Determination of Ionic Selectivity: Fill two semi-cells simultaneously with the same volume of so-lution of the same salt with activities of 0,96, 0,93 and 0,85. Asymmetry potential values must be determined initially. Then, the potential generated by the solutions with activities of 0,93 and 0,85 must be measured by locating solutions with activity 0,96 always in the semi-cell 1, and the solutions with activities 0,93 and 0,85 in the semi-cell 2. IS values are determined with the equa-tion 2. Table 1 illustrates the matrix of tests required for each sample and blank to be employed.
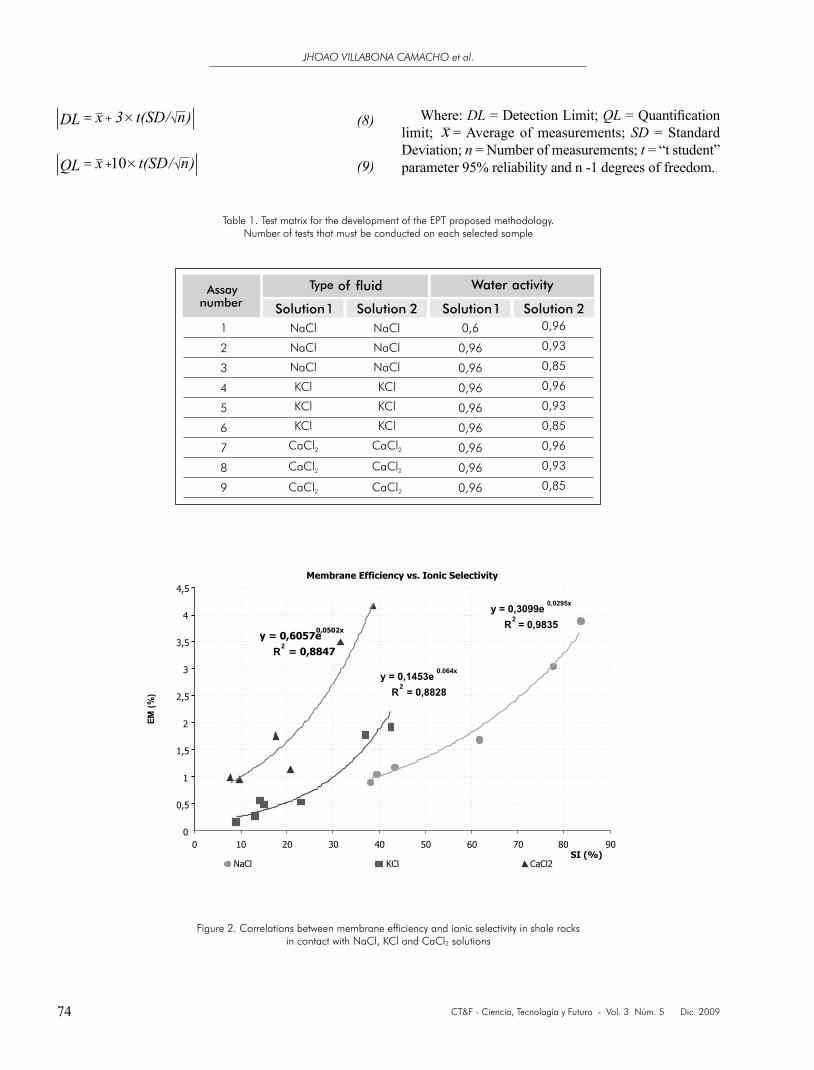
(4) Determination of Membrane Efficiency: De-termination of ME can be accomplished by finding the correlations between EM and IS values. These correla-tions were established as a contribution to this work and correspond to the tendency line equations drawn on the measurement values found by AL-Bazali et al., (2005). The process consisted initially in the construction of ME graphs vs. IS for each salt used in the tests. Then, tendency lines were established for the points generated (established according to the values of the correlation coefficient R2) and such line equations were obtained (Figure 2). These equations are only dependent on the type of salt used and, therefore, they can be applied to any type of shale rock sample from different wells, fields or basins.
CT&F - Ciencia, Tecnología y Futuro - Vol. 3 Núm. 5 Dic. 2009
JHOAO VILLABONA CAMACHO et al.
74
Where: DL = Detection Limit; QL = Quantification limit; x = Average of measurements; SD = Standard Deviation; n = Number of measurements; t = “t student” parameter 95% reliability and n -1 degrees of freedom.
Table 1. Test matrix for the development of the EPT proposed methodology. Number of tests that must be conducted on each selected sample
1
2
3
4
5
6
7
8
9
NaCl
NaCl
NaCl
KCl
KCl
KCl
CaCl2
CaCl2
CaCl2
0,6
0,96
0,96
0,96
0,96
0,96
0,96
0,96
0,96
0,96
0,93
0,85
0,96
0,93
0,85
0,96
0,93
0,85
Assay number
Type of fluid Water activity
Solution 1 Solution 2 Solution 1 Solution 2
NaCl
NaCl
NaCl
KCl
KCl
KCl
CaCl2
CaCl2
CaCl2
y = 0,1453e0.064x
R2 = 0,8828
y = 0,3099e0,0295x
R2 = 0,9835
y = 0,6057e0,0502x
R2 = 0,8847
0
0,5
1
1,5
2
2,5
3
3,5
4
4,5
0 10 20 30 40 50 60 70 80 90SI (%)
EM
(%)
NaCl KCl CaCl2
Membrane Efficiency vs. Ionic Selectivity
Figure 2. Correlations between membrane efficiency and ionic selectivity in shale rocks in contact with NaCl, KCl and CaCl2 solutions
ASSEMBLY OF A METHODOLOGY FOR DETERMINATION OF MEMBRANE EFFICIENCY IN PRESERVED SHALES
CT&F - Ciencia, Tecnología y Futuro - Vol. 3 Núm. 5 Dic. 2009 75
APPLICATION EXAMPLE
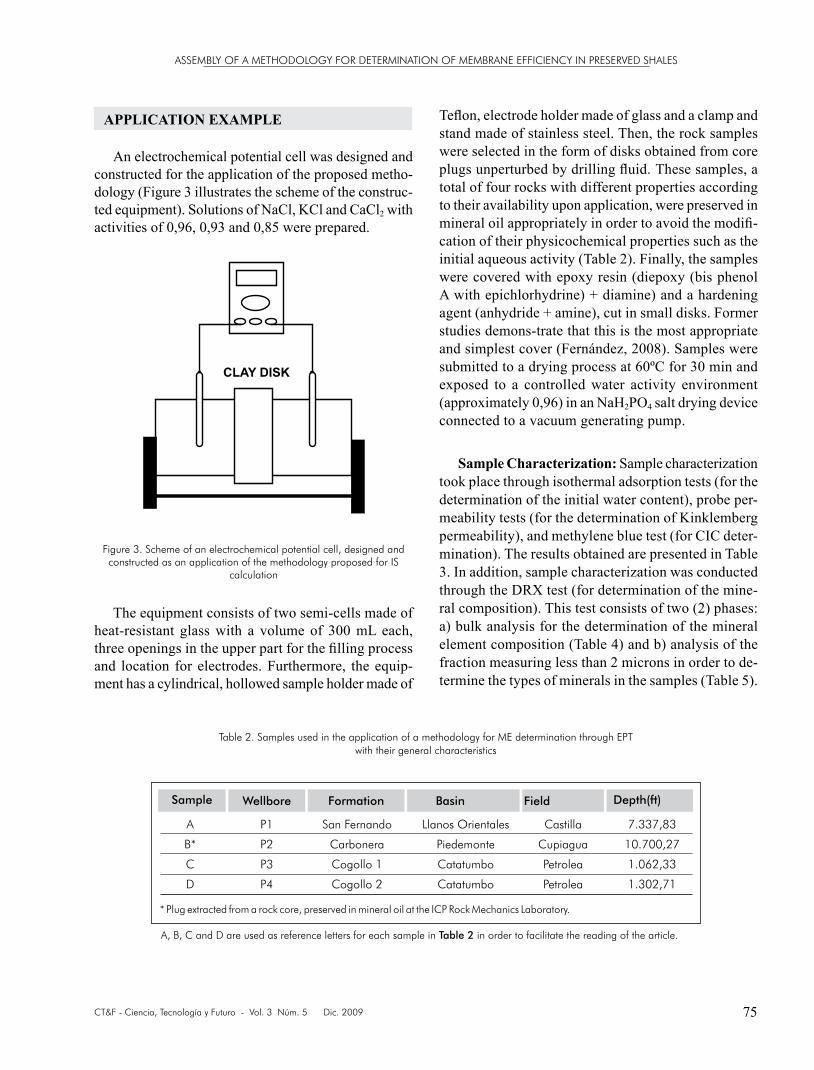
An electrochemical potential cell was designed and constructed for the application of the proposed metho-dology (Figure 3 illustrates the scheme of the construc-ted equipment). Solutions of NaCl, KCl and CaCl2 with activities of 0,96, 0,93 and 0,85 were prepared.
CLAY DISK
Figure 3. Scheme of an electrochemical potential cell, designed and constructed as an application of the methodology proposed for IS
calculation
The equipment consists of two semi-cells made of heat-resistant glass with a volume of 300 mL each, three openings in the upper part for the filling process and location for electrodes. Furthermore, the equip-ment has a cylindrical, hollowed sample holder made of
Teflon, electrode holder made of glass and a clamp and stand made of stainless steel. Then, the rock samples were selected in the form of disks obtained from core plugs unperturbed by drilling fluid. These samples, a total of four rocks with different properties according to their availability upon application, were preserved in mineral oil appropriately in order to avoid the modifi-cation of their physicochemical properties such as the initial aqueous activity (Table 2). Finally, the samples were covered with epoxy resin (diepoxy (bis phenol A with epichlorhydrine) + diamine) and a hardening agent (anhydride + amine), cut in small disks. Former studies demons-trate that this is the most appropriate and simplest cover (Fernández, 2008). Samples were submitted to a drying process at 60ºC for 30 min and exposed to a controlled water activity environment (approximately 0,96) in an NaH2PO4 salt drying device connected to a vacuum generating pump.
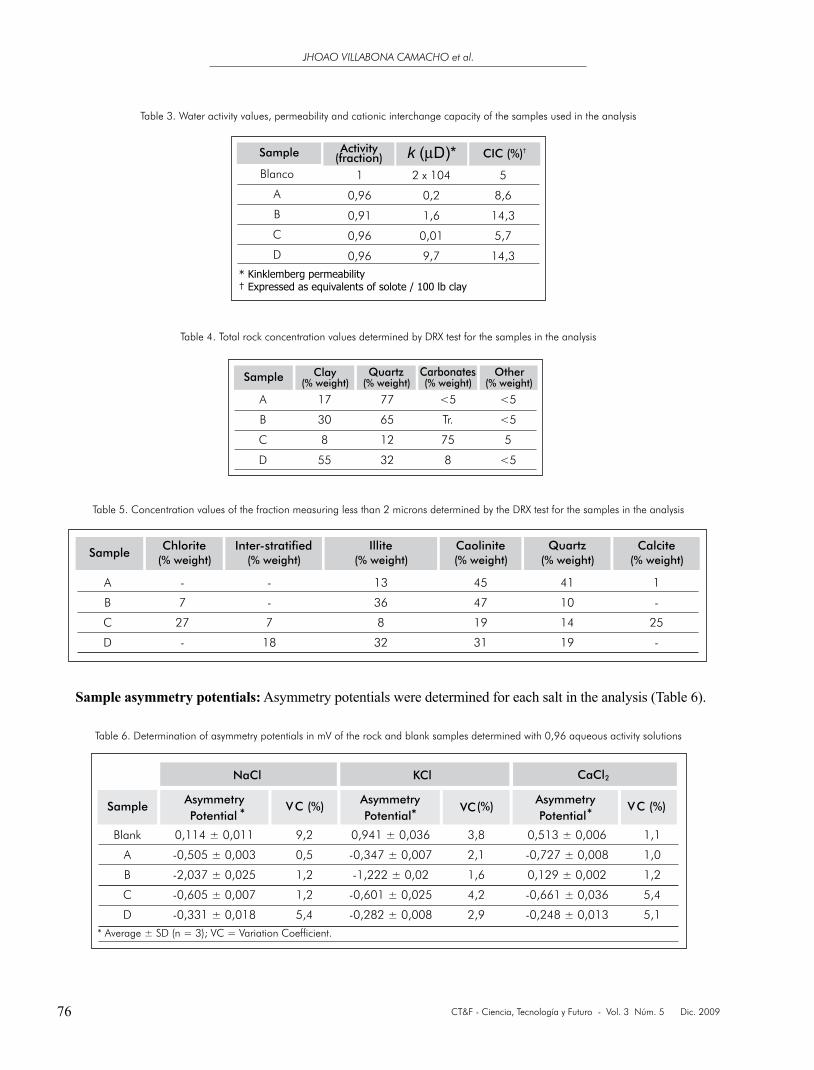
Sample Characterization: Sample characterization took place through isothermal adsorption tests (for the determination of the initial water content), probe per-meability tests (for the determination of Kinklemberg permeability), and methylene blue test (for CIC deter-mination). The results obtained are presented in Table 3. In addition, sample characterization was conducted through the DRX test (for determination of the mine-ral composition). This test consists of two (2) phases: a) bulk analysis for the determination of the mineral element composition (Table 4) and b) analysis of the fraction measuring less than 2 microns in order to de-termine the types of minerals in the samples (Table 5).
Table 2. Samples used in the application of a methodology for ME determination through EPT with their general characteristics
CT&F - Ciencia, Tecnología y Futuro - Vol. 3 Núm. 5 Dic. 2009
JHOAO VILLABONA CAMACHO et al.
76
Table 3. Water activity values, permeability and cationic interchange capacity of the samples used in the analysis
kPa
Blanco
A
B
C
D
1
0,96
0,91
0,96
0,96
2 x 10⁴
0,2
1,6
0,01
9,7
5
8,6
14,3
5,7
14,3
* Kinklemberg permeability† Expressed as equivalents of solote / 100 lb clay
Sample Activity(fraction) k (µD)* CIC (%)†
Table 4. Total rock concentration values determined by DRX test for the samples in the analysis
Table 5. Concentration values of the fraction measuring less than 2 microns determined by the DRX test for the samples in the analysis
Sample asymmetry potentials: Asymmetry potentials were determined for each salt in the analysis (Table 6).
Table 6. Determination of asymmetry potentials in mV of the rock and blank samples determined with 0,96 aqueous activity solutions
ASSEMBLY OF A METHODOLOGY FOR DETERMINATION OF MEMBRANE EFFICIENCY IN PRESERVED SHALES
CT&F - Ciencia, Tecnología y Futuro - Vol. 3 Núm. 5 Dic. 2009 77
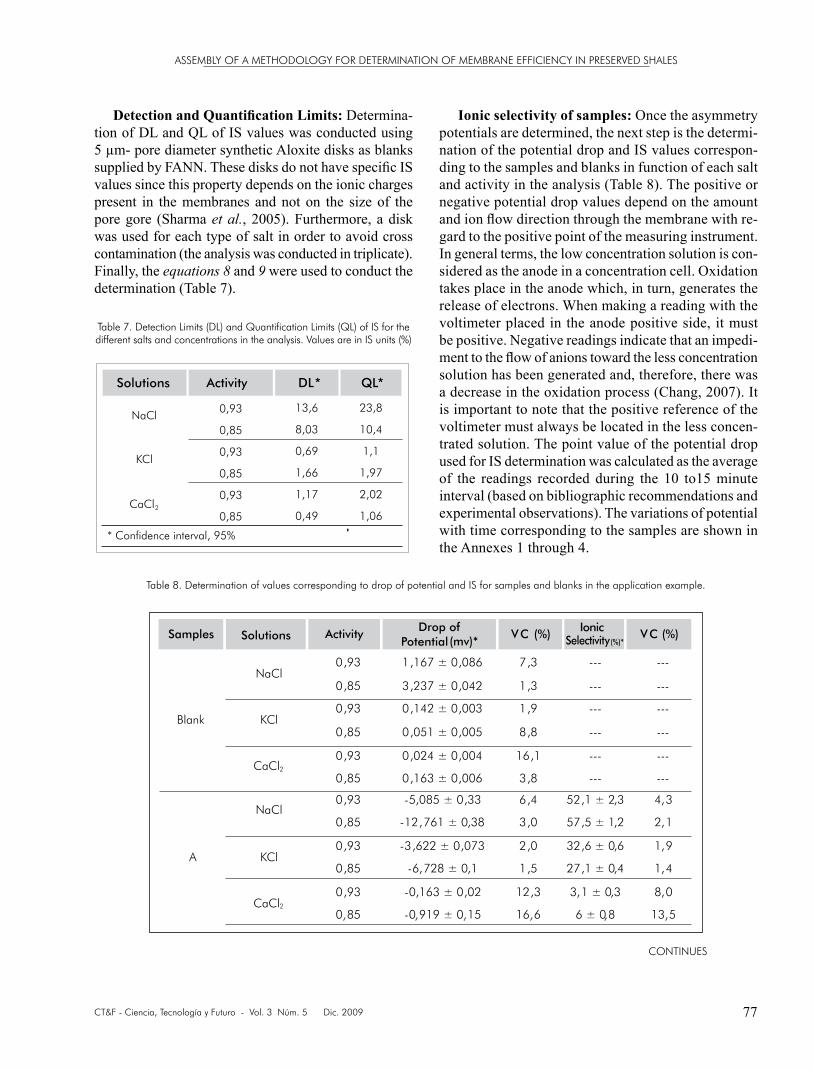
Detection and Quantification Limits: Determina-tion of DL and QL of IS values was conducted using 5 µm- pore diameter synthetic Aloxite disks as blanks supplied by FANN. These disks do not have specific IS values since this property depends on the ionic charges present in the membranes and not on the size of the pore gore (Sharma et al., 2005). Furthermore, a disk was used for each type of salt in order to avoid cross contamination (the analysis was conducted in triplicate). Finally, the equations 8 and 9 were used to conduct the determination (Table 7).
Table 7. Detection Limits (DL) and Quantification Limits (QL) of IS for the different salts and concentrations in the analysis. Values are in IS units (%)
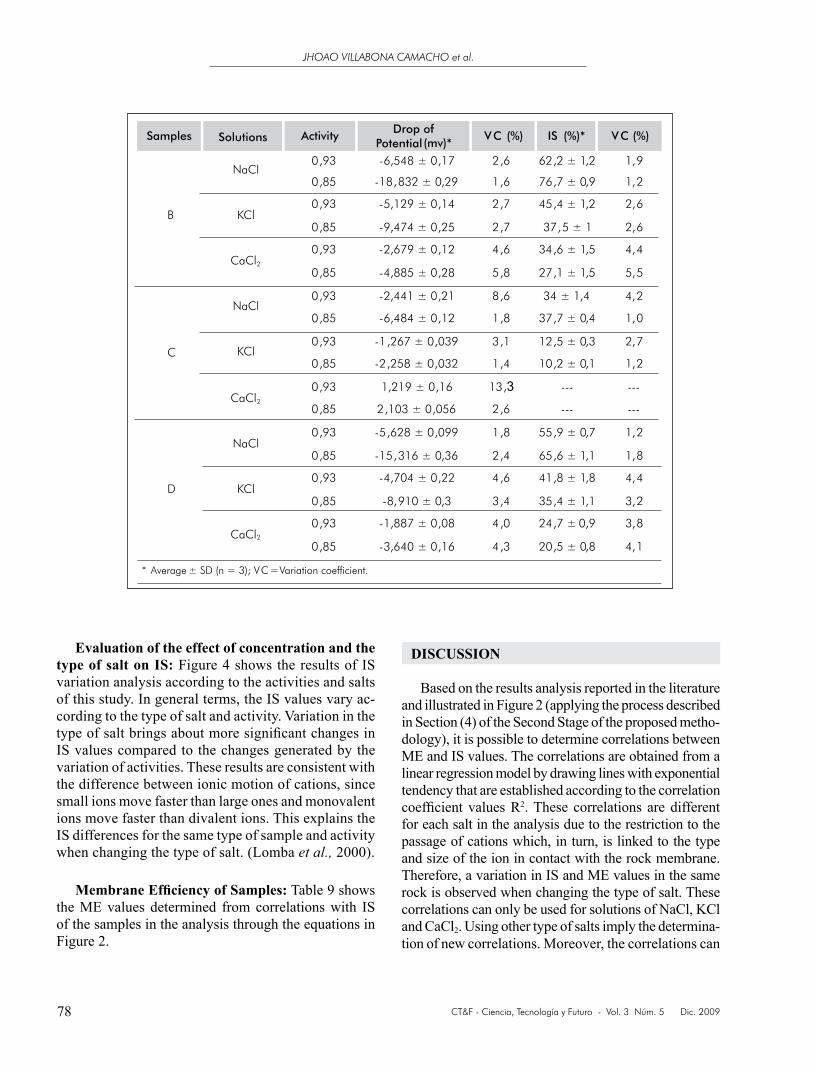
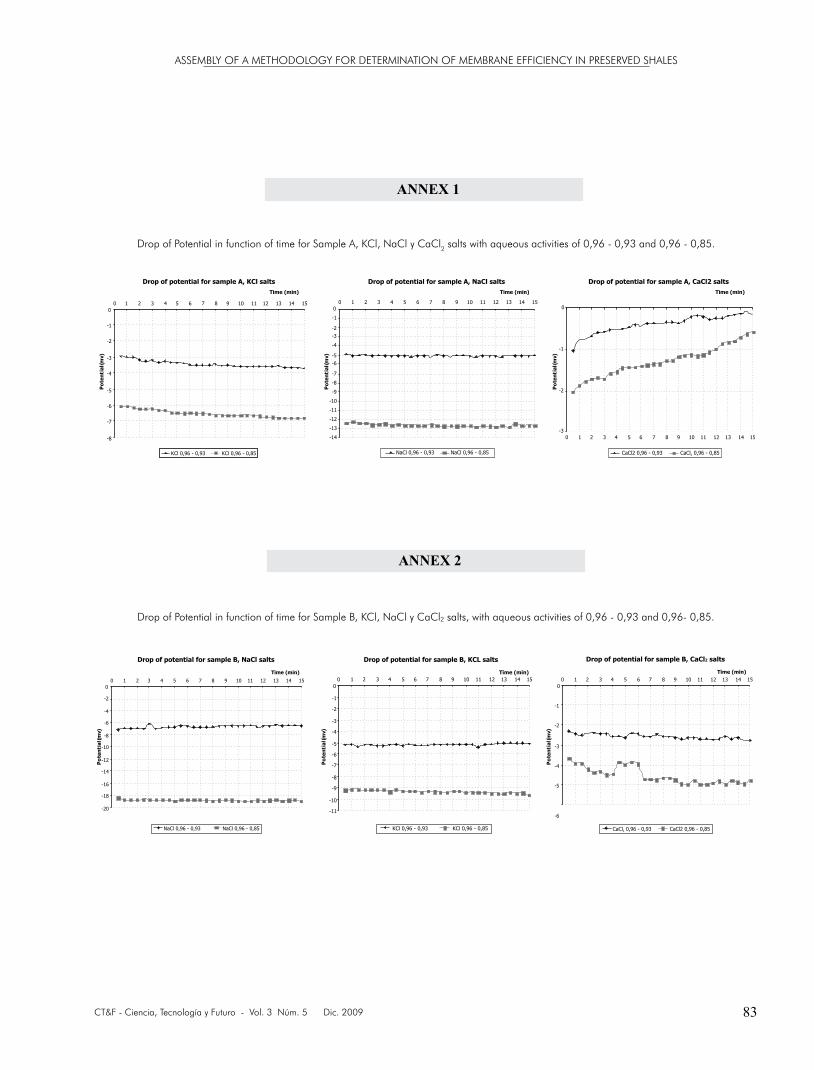
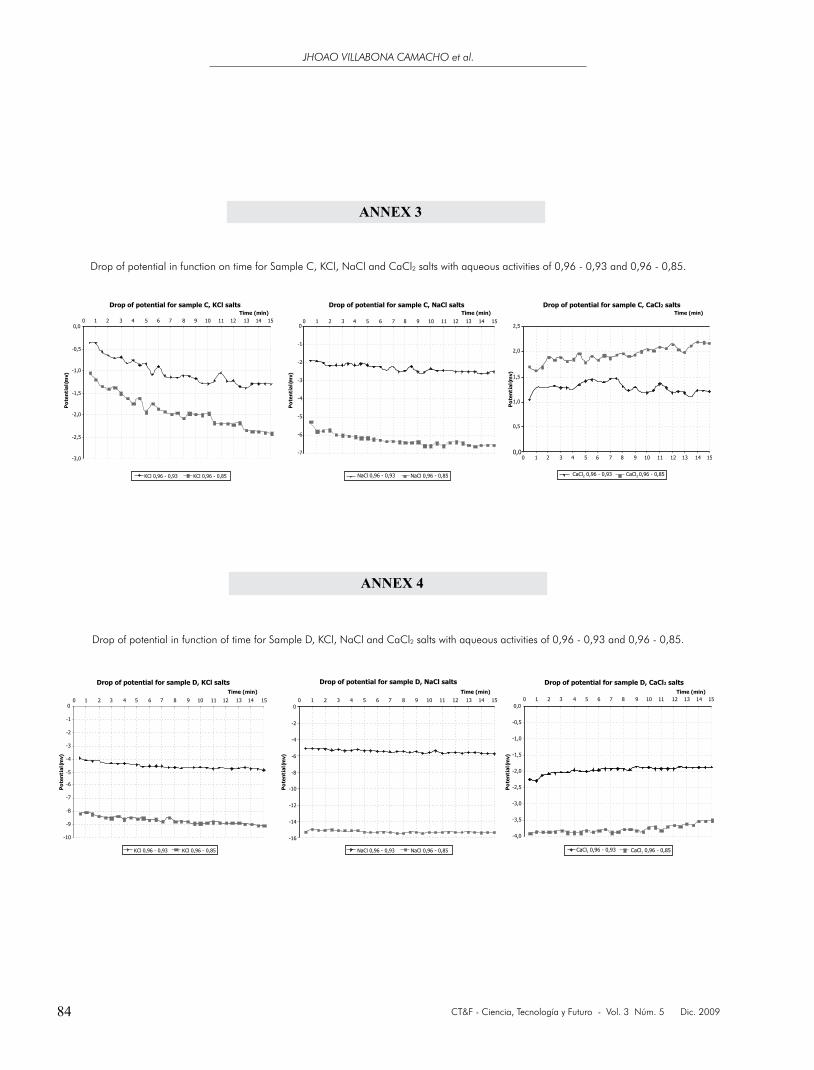
Ionic selectivity of samples: Once the asymmetry potentials are determined, the next step is the determi-nation of the potential drop and IS values correspon-ding to the samples and blanks in function of each salt and activity in the analysis (Table 8). The positive or negative potential drop values depend on the amount and ion flow direction through the membrane with re-gard to the positive point of the measuring instrument. In general terms, the low concentration solution is con-sidered as the anode in a concentration cell. Oxidation takes place in the anode which, in turn, generates the release of electrons. When making a reading with the voltimeter placed in the anode positive side, it must be positive. Negative readings indicate that an impedi-ment to the flow of anions toward the less concentration solution has been generated and, therefore, there was a decrease in the oxidation process (Chang, 2007). It is important to note that the positive reference of the voltimeter must always be located in the less concen-trated solution. The point value of the potential drop used for IS determination was calculated as the average of the readings recorded during the 10 to15 minute interval (based on bibliographic recommendations and experimental observations). The variations of potential with time corresponding to the samples are shown in the Annexes 1 through 4.
Table 8. Determination of values corresponding to drop of potential and IS for samples and blanks in the application example.
CONTINUES
CT&F - Ciencia, Tecnología y Futuro - Vol. 3 Núm. 5 Dic. 2009
JHOAO VILLABONA CAMACHO et al.
78
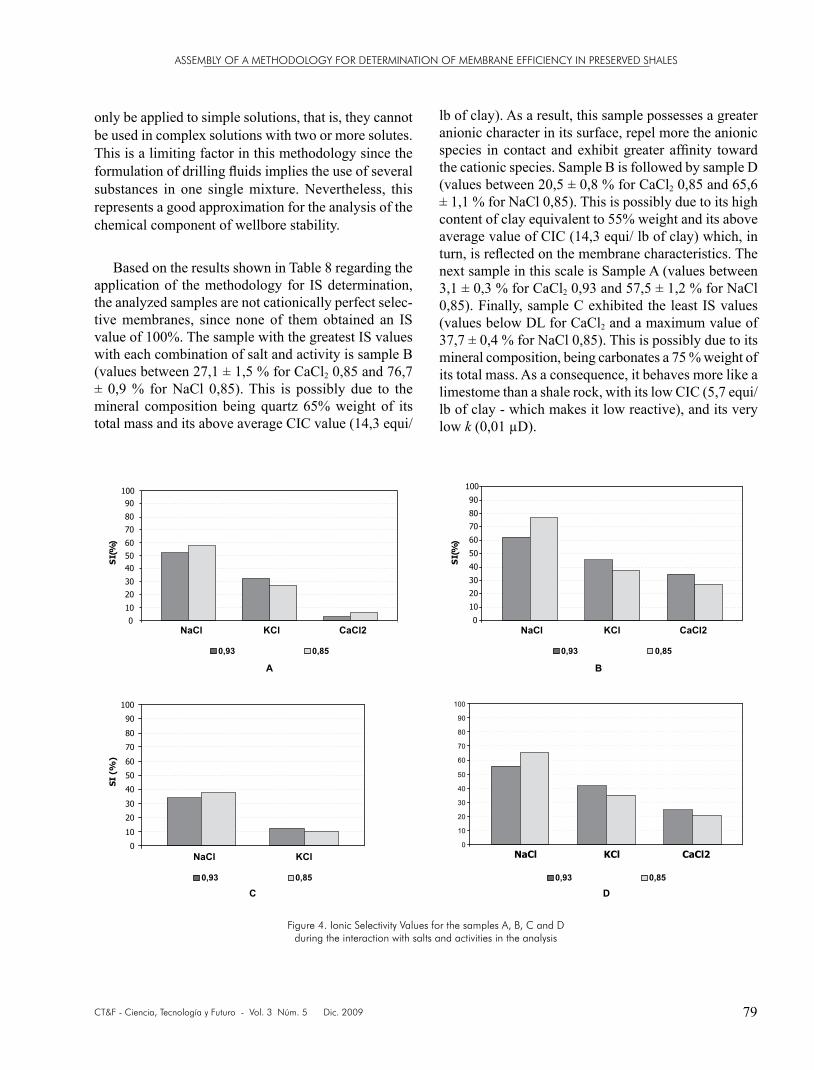
Evaluation of the effect of concentration and the type of salt on IS: Figure 4 shows the results of IS variation analysis according to the activities and salts of this study. In general terms, the IS values vary ac-cording to the type of salt and activity. Variation in the type of salt brings about more significant changes in IS values compared to the changes generated by the variation of activities. These results are consistent with the difference between ionic motion of cations, since small ions move faster than large ones and monovalent ions move faster than divalent ions. This explains the IS differences for the same type of sample and activity when changing the type of salt. (Lomba et al., 2000).
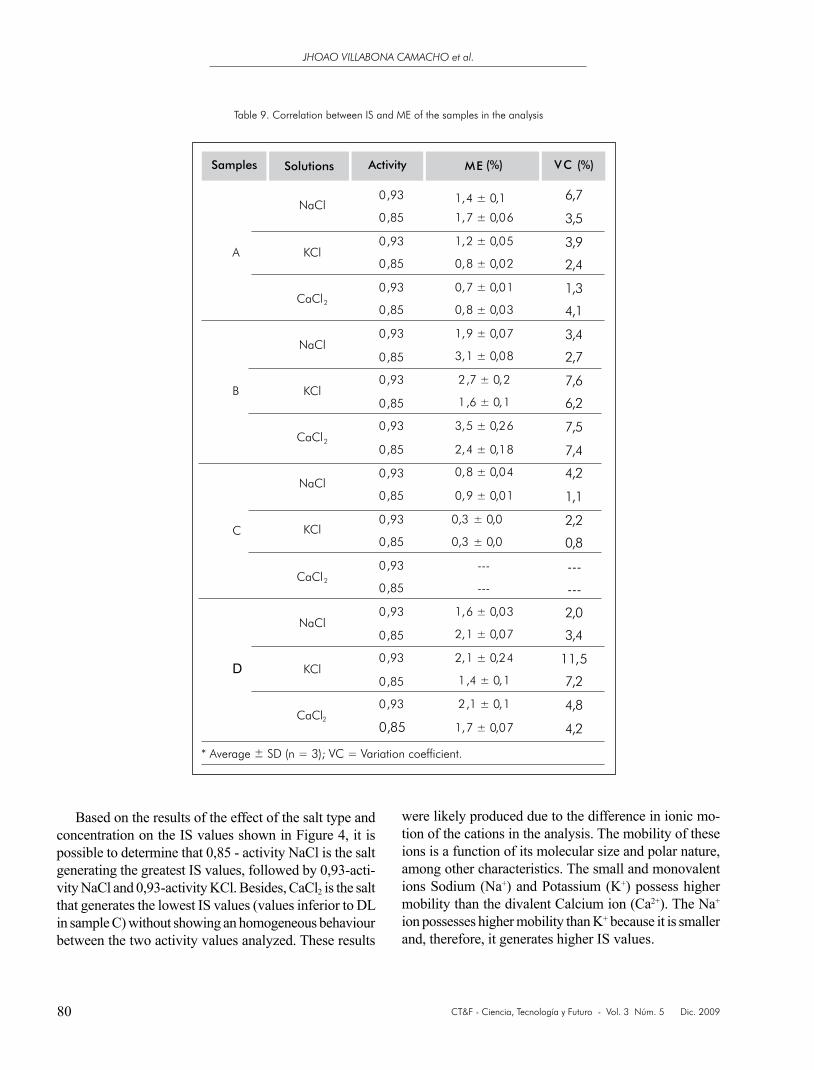
Membrane Efficiency of Samples: Table 9 shows the ME values determined from correlations with IS of the samples in the analysis through the equations in Figure 2.
DISCUSSION
Based on the results analysis reported in the literature and illustrated in Figure 2 (applying the process described in Section (4) of the Second Stage of the proposed metho-dology), it is possible to determine correlations between ME and IS values. The correlations are obtained from a linear regression model by drawing lines with exponential tendency that are established according to the correlation coefficient values R2. These correlations are different for each salt in the analysis due to the restriction to the passage of cations which, in turn, is linked to the type and size of the ion in contact with the rock membrane. Therefore, a variation in IS and ME values in the same rock is observed when changing the type of salt. These correlations can only be used for solutions of NaCl, KCl and CaCl2. Using other type of salts imply the determina-tion of new correlations. Moreover, the correlations can
ASSEMBLY OF A METHODOLOGY FOR DETERMINATION OF MEMBRANE EFFICIENCY IN PRESERVED SHALES
CT&F - Ciencia, Tecnología y Futuro - Vol. 3 Núm. 5 Dic. 2009 79
only be applied to simple solutions, that is, they cannot be used in complex solutions with two or more solutes. This is a limiting factor in this methodology since the formulation of drilling fluids implies the use of several substances in one single mixture. Nevertheless, this represents a good approximation for the analysis of the chemical component of wellbore stability.
Based on the results shown in Table 8 regarding the application of the methodology for IS determination, the analyzed samples are not cationically perfect selec-tive membranes, since none of them obtained an IS value of 100%. The sample with the greatest IS values with each combination of salt and activity is sample B (values between 27,1 ± 1,5 % for CaCl2 0,85 and 76,7 ± 0,9 % for NaCl 0,85). This is possibly due to the mineral composition being quartz 65% weight of its total mass and its above average CIC value (14,3 equi/
lb of clay). As a result, this sample possesses a greater anionic character in its surface, repel more the anionic species in contact and exhibit greater affinity toward the cationic species. Sample B is followed by sample D (values between 20,5 ± 0,8 % for CaCl2 0,85 and 65,6 ± 1,1 % for NaCl 0,85). This is possibly due to its high content of clay equivalent to 55% weight and its above average value of CIC (14,3 equi/ lb of clay) which, in turn, is reflected on the membrane characteristics. The next sample in this scale is Sample A (values between 3,1 ± 0,3 % for CaCl2 0,93 and 57,5 ± 1,2 % for NaCl 0,85). Finally, sample C exhibited the least IS values (values below DL for CaCl2 and a maximum value of 37,7 ± 0,4 % for NaCl 0,85). This is possibly due to its mineral composition, being carbonates a 75 % weight of its total mass. As a consequence, it behaves more like a limestome than a shale rock, with its low CIC (5,7 equi/ lb of clay - which makes it low reactive), and its very low k (0,01 µD).
0
10
20
30
40
50
60
70
80
90
100
NaCl KCl CaCl2
SI(
%)
0,93 0,85
A
0
10
20
30
40
50
60
70
80
90
100
B
SI(
%)
NaCl KCl CaCl2
0,93 0,85
0
10
20
30
40
50
60
70
80
90
100
SI
(%)
NaCl KCl
0
10
20
30
40
50
60
70
80
90
100
NaCl KCl CaCl2
0,93 0,85
C
0,93 0,85
D
Figure 4. Ionic Selectivity Values for the samples A, B, C and D during the interaction with salts and activities in the analysis
CT&F - Ciencia, Tecnología y Futuro - Vol. 3 Núm. 5 Dic. 2009
JHOAO VILLABONA CAMACHO et al.
80
Table 9. Correlation between IS and ME of the samples in the analysis
Based on the results of the effect of the salt type and concentration on the IS values shown in Figure 4, it is possible to determine that 0,85 - activity NaCl is the salt generating the greatest IS values, followed by 0,93-acti-vity NaCl and 0,93-activity KCl. Besides, CaCl2 is the salt that generates the lowest IS values (values inferior to DL in sample C) without showing an homogeneous behaviour between the two activity values analyzed. These results
were likely produced due to the difference in ionic mo-tion of the cations in the analysis. The mobility of these ions is a function of its molecular size and polar nature, among other characteristics. The small and monovalent ions Sodium (Na+) and Potassium (K+) possess higher mobility than the divalent Calcium ion (Ca2+). The Na+ ion possesses higher mobility than K+ because it is smaller and, therefore, it generates higher IS values.
ASSEMBLY OF A METHODOLOGY FOR DETERMINATION OF MEMBRANE EFFICIENCY IN PRESERVED SHALES
CT&F - Ciencia, Tecnología y Futuro - Vol. 3 Núm. 5 Dic. 2009 81
The results of the application of the methodology for ME determination shown in Table 9 indicate that the ME values varied between 0,3 ± 0,002 % (sample C with 0,85 KCl solutions) and 3,5 ± 0,26% (sample B with 0,93 CaCl2 solutions). In general terms, the highest ME values were generated by NaCl 0,85 and 0,93 salts, respectively. The results obtained show that the highest ME values are linked to high CIC values, responsible for the anionic exclusion of the membrane which, in turn, generates high IS values.
CONCLUSIONS
● An assembly of a methodology for ME and IS de-termination in preserved shale rock samples unper-turbed by mud, in contact with aqueous solutions of NaCl, KCl and CaCl2 at different concentrations through EPT, was conducted. This is a simple, quick and easy - to - apply technique compared to other tests reported in the literature. This methodology contributes to the solution of problems related to wellbore stability and drilling fluids optimization.
● Correlations between ME and IS values are proposed through EPT for NaCl, KCl and CaCl2 solutions at different concentrations. These correlations depend on the type of salt used in the analysis and corres-pond to exponential-type equations obtained from tendency lines in literature data. These correlations are applicable to any type of shale rock samples from different fields, basins, and wellbores. Furthermore, they represent the first approximation for the deter-mination of ME values when no data from other test are available.
● IS values varied between 3,1 % (sample A with 0,93 CaCl2 solution) and 76,7 % (sample B with 0,85 NaCl solution). Low DL and QL were obtained, between 0,49 and 1,06 (sample D with 0,85 CaCl2 solution) and 13,6 and 23,8 (sample A with 0,93 NaCl solu-tion). IS values of blanks and sample C with CaCl2 solutions were below DL. Measurements were taken with high precision (VC below 9 %, except sample A with 0,85 CaCl2 solution that exhibited a value of 13,5 %). In general terms, none of the samples is
a cationically perfect selective membrane since no IS values equal to 100 % were reported.
● ME values determined by correlation with IS are very low compared to the IS values of samples. Such values varied between 0,3 % (sample C with the 0,85 KCl solution) and 3,5 % (sample B with 0,93 CaCl2 solution). The sample C with CaCl2 solutions did not report ME values because its IS values were below DL. The determination was conducted with a high precision level (VC below 12%),
● The 0,85 NaCl solution generated the highest IS va-lues in all samples. Sample B showed the highest IS values (76,7%), followed by sample D (65,6%), then sample A (57,5%) and finally sample C (37,7%). IS values are directly affected by the type of salt and the concentration, although the concentration value has a less evident influence as compared to the generated by the type of salt.
ACKNOWLEDGMENTS
The authors express their most sincere feelings of gratitude to Universidad Industrial de Santander (UIS), Instituto Colombiano del Petróleo (ICP - ECOPETROL S.A.) and to the Wellbore Stability Research Team (UIS - ICP Agreement) for their economic and technical su-pport during the development of this work.
REFERENCES
AL-Bazali, T. M. (2003). Membrane efficiency behavior of shales. Thesis Master Science, University of Texas at Austin, Texas, USA.
AL-Bazali, T. M., Zhang, J., Chenevert, M. E. & Sharma, M. (2005). A rapid rigsite-deployable electrochemical test for evaluating the membrane potential of shales. Presented at the 2005 SPE Annual Technical Conference and Exhibi-tion, Dallas, Texas. SPE 96098.
AL-Bazali, T. M., Zhang, J., Chenevert, M. E. & Sharma, M. (2006). Factors controlling the membrane efficiency of
CT&F - Ciencia, Tecnología y Futuro - Vol. 3 Núm. 5 Dic. 2009
JHOAO VILLABONA CAMACHO et al.
82
shales when interacting with water-based and oil-based muds. Presented at the 2006 SPE International Oil & Gas Conference and Exhibition, Beijing, China. SPE 00735.
Castellan, G. W. (1998). Fisicoquímica. (Segunda edición). México: Addison Wesley Longman de México S.A. de C.V., 816-819.
Chang, R. (2007). Química. (Novena edición). México D. F.: McGraw Hill Interamericana, 1100pp.
Chenevert, M. (1970). Shale control with balanced - activity oil - continuos muds. SPE 2559.
Chenevert, M. & Pernot, V. (1998). Control of shale swelling pressures using inhibitive water-base Muds. SPE 49263.
Da Fontoura, S. A., Rabe, C. & Lomba, R. F. (2002). Cha-racterization of shales for drilling purposes. SPE/ISRM Rock Mechanics Conference, Irving, Texas. SPE/ISRM 78218.
Ewy, R. T. & Stankovich, R. J. (2000). Pore pressure change due to shale-fluid interactions: Measurements under simu-lated wellbore conditions. Fourth North American Rock Mechanics Symposium, Seattle, Balkema, Rotterdam. Proceedings Pacific Rocks 2000 (3), 147-154.
Fam, M. & Dusseault, M. (1998). Borehole stability in shales: A physic-chemical perspective. SPE 47301.
Fernández, W. A. (2008). Determinación de la eficiencia de membrana en rocas arcillosas a partir de la selectividad iónica para la obtención del gradiente de presión osmótico efectivo. Tesis de pregrado, Universidad Industrial de Santander, Bucaramanga, Colombia, 175pp.
Frydman, M. & Da Fontoura, S. A. (2001). Modeling aspects of wellbore stability in shales. PUC-Rio and SPE. SPE 69529.
Hale, A. H., Mody, F. K. & Sallsbury, D. P. (1993). The in-fluence of Chemical Potential on Wellbore Stability. SPE Drilling and Completion. SPE 23885.
Henquin, E., Paslawski, F. & Tozzi, E. (1999). Movilidad de iones en solución. [Consultada en diciembre de 2008], Disponible en Internet: http://www.visionlibros.com
Kemper, W. D. & Rollins, J. B. (1966). Osmotic efficiency coefficients across compacted clays. Proc. Soil Sci. Soc. Am. 30 (5), 529-534.
Lomba, R. F., Chenevert, M. E. & Sharma, M. (2000). The ion-selective membrane behavior of native shales. Journal of Petroleum Science and Engineering, 9-23.
Mody, F. K. Tare, U. A. Tan, C. P., Drummond, C. J. & Wu, B. (2002). Development of novel membrane efficient water-based drilling fluids through fundamental understanding of osmotic membrane generation in shales. Presented at the SPE Annual Technical Conference and Exhibition, San Antonio, Texas. SPE 77447.
Pérez, N. (2002). Desarrollo de un algoritmo para evaluar el suministro de agua subterránea, Tesis de pregrado, Universidad Veracruzana, México.
Schlemer, R., Friedheim, J. E., Growcock, F. B., M-I, L. L., Bloys, J. B., Headley, J. A. & Polnaszek, S. C. (2002). Chemical osmosis, shale and drilling fluids. Presented at the Conference of Drilling, Dallas, Texas. SPE/IADC 86912.
Sharma, M. M., AL-Bazali, T. M., Zhang, J. & Chenevert, M. E. (2005). Measurement of the sealing capacity of shale cap rocks. Prepared for presentation at the 2005 SPE Annual Technical Conference, Dallas, Texas. SPE 96100: 1-13.
Simpson, J. P. & Dearing, H. L. (2000). Diffusion Osmosis - An unrecognized cause of shale instability. Society of Petroleum Engineers Journal, 2000 IADC/SPE Drilling Conference, New Orleans. IADC/SPE 59190: 1-14.
Staverman, A. J. (1952). Apparent osmotic pressure of solu-tions of heterodisperse polymers. Rec. Trav. Chim. 71, 623-633.
Van Oort, E., Hole, A. H., Mody, F. K. & Roy, S. (1996). Transport in shales and the design of improved water-based shale drilling fluids. SPE Drilling & Completion. SPE 28309: 137-146.
Zhang, J., Chenevert, M. E., AL-Bazali, T. M. & Sharma, M. (2004). A new gravimetric-swelling test for evalua-ting water and ion uptake in shales. Presented at the SPE Annual Technical Conference, Houston, Texas. SPE 89831.
ASSEMBLY OF A METHODOLOGY FOR DETERMINATION OF MEMBRANE EFFICIENCY IN PRESERVED SHALES
CT&F - Ciencia, Tecnología y Futuro - Vol. 3 Núm. 5 Dic. 2009 83
ANNEX 1
ANNEX 2
Drop of Potential in function of time for Sample A, KCl, NaCl y CaCl2 salts with aqueous activities of 0,96 - 0,93 and 0,96 - 0,85.
Drop of Potential in function of time for Sample B, KCl, NaCl y CaCl2 salts, with aqueous activities of 0,96 - 0,93 and 0,96- 0,85.
CT&F - Ciencia, Tecnología y Futuro - Vol. 3 Núm. 5 Dic. 2009
JHOAO VILLABONA CAMACHO et al.
84
ANNEX 3
ANNEX 4
Drop of potential in function on time for Sample C, KCl, NaCl and CaCl2 salts with aqueous activities of 0,96 - 0,93 and 0,96 - 0,85.
Drop of potential in function of time for Sample D, KCl, NaCl and CaCl2 salts with aqueous activities of 0,96 - 0,93 and 0,96 - 0,85.