Embed Size (px)
Citation preview

119
1. DRUG PROFILE
1.1. Telmisartan
Telmisartan [Figure 4.1], is an angiotensin-II receptor blocker (ARB) used in the
management of hypertension [1]. Generally, angiotensin II receptor blockers (ARBs)
such as Telmisartan bind to the angiotensin II type 1 (AT1) receptors with high affinity,
causing inhibition of the action of angiotensin II on vascular smooth muscle, ultimately
leading to a reduction in arterial blood pressure [2]. Recent studies suggest that
Telmisartan may also have PPAR-gamma agonistic properties that could potentially
confer beneficial metabolic effects [3-4].
Figure 4.1: Molecular structure of Telmisartan
Molecular formula : C33H30N4O2
Molecular weight : 514.63
Chemical name : 4'-[(1,4'-dimethyl-2'-propyl[2,6'-bi-1H-benzimidazol]-1'-
yl)methyl]-[1,1'-biphenyl]-2-carboxylic acid.
Solubility : Telmisartan is insoluble in water and in the pH range of 3
to 9, sparingly soluble in strong acid except in hydrochloric
acid and soluble in strong base.
120
Table 4.1: List of brand names of formulations of Telmisartan [5-6]
S. No Brand names Formulation Available strength
Address of Manufacturer
1 MACSART Tablet 20 mg
40 mg
80 mg
Macleods
Pharmaceuticals
2 TELISTA Tablet 20 mg
40 mg
Lupin
Pharmaceuticals
3 TELMA Tablet 20 mg
40 mg
80 mg
Glenmark
Pharmaceuticals
4 TELMICHEK Tablet 40 mg Indoco
Pharmaceuticals
5 TELMISAT Tablet 20 mg
40 mg
80 mg
Biocon
Pharmaceuticals
6 TELPRES Tablet 20 mg
40 mg
80 mg
Abbott Healthcare
Private Limited
7 TELSAR Tablet 20 mg
40 mg
80 mg
Unichem
Pharmaceuticals
8 TELSAT Tablet 40 mg Sain
Pharmaceuticals
9 TELSITE Tablet 20 mg
40 mg
80 mg
Sanofi
Pharmaceuticals
10 TEMAX Tablet 20 mg
40 mg
80 mg
Wockhardt
Pharmaceuticals
121
2. LITERATURE SURVEY
Several analytical methods have been reported for the determination of
Telmisartan in pure drug, pharmaceutical dosage forms and in biological samples using
spectrophotometry [7-9], HPLC [10-18] and LC-MS [19-21] have been reported for the
determination of Telmisartan in dosage forms.
Sunil et al [7] developed UV first derivative spectrophotometric methods for the
determination of Telmisartan in pharmaceutical formulation. The solutions of standard
and sample were prepared in 0.1 M sodium hydroxide. In the UV spectrophotometric
method, the quantitative determination of the drug was carried at 295 nm and the linearity
range was found to be 4-20 µg/mL. For the first order derivative spectrophotometric
method, the drug was determined at 311 nm with the linearity ranges 4-20 µg/mL. The
calibration graphs constructed at their wavelength of determination were found to be
linear for UV and derivative spectrophotometric methods. The proposed methods have
been extensively validated. There was no significant difference between the performance
of the proposed method regarding the mean values and standard deviations. The
described method can be readily utilized for analysis of pharmaceutical formulation.
Kalyankar et al [8] developed a simple, accurate, cost efficient and reproducible
spectrophotometric method for the estimation of ammonia in Telmisartan in bulk and
pharmaceutical dosage form. UV spectrophotometric method, which is based on
measurement at maximum wavelength λmax 425 nm shows linearity in a concentration
range of 12.5-37.5 µg/mL and in aqueous solutions presents a square correlation
coefficient (r2) of 0.9999. The mean % recovery was found to be 100.03 to 99.92 and the
precision expressed as relative standard deviation (%R.S.D.) 0.1044%. In addition, the

122
proposed method was simple, easy to apply, low-cost, does not use polluting reagents and
requires relatively inexpensive instruments. Results of the analysis were validated
statistically and by recovery study.
Palled [9] developed difference spectrophotometric method for the estimation of
Telmisartan in bulk drug and in pharmaceutical formulations. Telmisartan exists in two
different forms in acidic and basic mediums that differ in their UV spectra. Difference
spectrum, obtained by keeping Telmisartan in 0.01 N NaOH in reference cell and
Telmisartan in 0.01 N HNO3 in sample cell, showed two characteristic peaks at 295 nm
and 327 nm with positive and negative absorbance respectively. Difference of absorbance
between these two maxima was calculated to find out the amplitude, which was plotted
against concentration. The method was found to be linear in the range of 2-12 µg/mL.
Gupta et al [10] developed a simple, rapid, precise, sensitive and reproducible
reverse phase high performance liquid chromatographic (RP-HPLC) method for
determination of Telmisartan in tablet dosage form and validated. Chromatographic
separation was achieved on a 250 × 4.6 mm, 5µ, Waters symmetry column in gradient
mode, with mobile phase consisting of a mixture of solution (10 mM potassium
dihydrogen phosphate, pH 3.5 ± 0.01): acetonitrile (64:40 v/v) was used. The quantitation
performed at flow rate of 1.0 mL/min at 230 nm and run time was 12 min. The analytical
method was validated as per ICH guideline for linearity, accuracy, precision, specificity,
limit of detection, limit of quantification, robustness and stability and method can be
extended to the analysis of Telmisartan in tablet formulations. The relative standard
deviation values for precision was less than 2% and % recovery was greater than 98% for
Telmisartan.

123
Varma et al [11] developed a simple, fast and precise reverse phase, isocratic
HPLC method for the separation and quantification of Telmisartan and
Hydrochlorothiazide in pharmaceutical dosage form. The quantification was carried out
using ProntoSIL C18 EPS 150 X 4.6 mm, 3µm enhanced polar selectivity column and
mobile phase comprised of potassium dihydrogen phosphate buffer pH adjusted to 3.2 ±
0.5 with orthophosphoric acid and acetonitrile in proportion of ratio 55:45 v/v and
degassed under ultrasonication. The flow rate was 0.8 mL/min and the effluent was
monitored at 271 nm. The retention time of Telmisartan and Hydrochlorothiazide were
5.01±0.5 min and 2.94±0.5 min respectively. The method was validated in terms of
linearity, precision, accuracy, specificity, limit of detection and limit of quantitation.
Linearity of Telmisartan and Hydrochlorothiazide were in the range of 15.01 to 75.05
µg/mL and 5.02 to 25.10 µg/mL respectively. The percentage recoveries of both the
drugs were 100.8% and 99.5% for Telmisartan and Hydrochlorothiazide respectively
from the tablet formulation. The proposed method is suitable for simultaneous
determination of Telmisartan and Hydrochlorothiazide in pharmaceutical dosage form.
Alankar et al [12] developed a RP-HPLC method for the simultaneous estimation
of Ramipril and Telmisartan in tablet dosage forms, using UV-detector. The developed
method was validated as per ICH guidelines and specificity, linearity & range, accuracy,
precision and robustness was performed. Specificity was determined by comparing the
results obtained by running the placebo solution with that of standard and method was
found to be specific due to no interference between placebo peaks and drugs peaks.
Linearity range was found to be 4 to16 µg/mL and 32 to128 µg/mL of Ramipril and
Telmisartan respectively. In the linearity study, regression equation and coefficient of

124
correlation for Ramipril and Telmisartan were found to be (Y = 924480X - 151831, r
=0.9997) and (Y = 2901878.3558X + 3803877, r = 0.9996) respectively. This developed
method was successfully utilized for the simultaneous estimation of Ramipril and
Telmisartan in pharmaceutical tablet dosage forms.
Anand kumar et al [13] developed a simple, sensitive and specific liquid
chromatographic method with UV detection for the simultaneous estimation of
Hydrochlorothiazide, Ramipril and Telmisartan in tablet dosage form and Bisoprolol as
internal standard. Separation was achieved with an Phenomenex luna 5µ C18, 250 X 4.6
mm 5µm size column, ambient temperature with a low pressure gradient mode with
mobile phase containing acetonitrile, 0.5% of potassium dihydrogen phosphate buffer pH
3.5 adjusted with orthophosphoric acid (50:50 v/v). The flow rate was 1 mL/min and
eluent was monitored at 220 nm. The selected chromatographic conditions were found to
effectively separate Hydrochlorothiazide, Ramipril and Telmisartan with retention time
of 3.1, 5.0 and 13.8 min respectively. The linearity range of Hydrochlorothiazide,
Ramipril and Telmisartan found in the range of 2-10 µg/mL, 5-25 µg/mL and 10-50
µg/mL respectively. The proposed method was found to be accurate, precise,
reproducible and specific and can also be used for routine quality control analysis of
these drugs in combination tablets.
Kurade et al [14] developed a rapid high performance liquid chromatographic
method and validated for the estimation of Ramipril and Telmisartan simultaneously in
combined dosage form. A Genesis C18 column having dimensions of 250 × 4.6 mm and
particle size of 5 µm in isocratic mode, with mobile phase containing a mixture of 0.01 M
potassium dihydrogen phosphate buffer (adjusted to pH 3.4 using orthophosphoric acid):
125
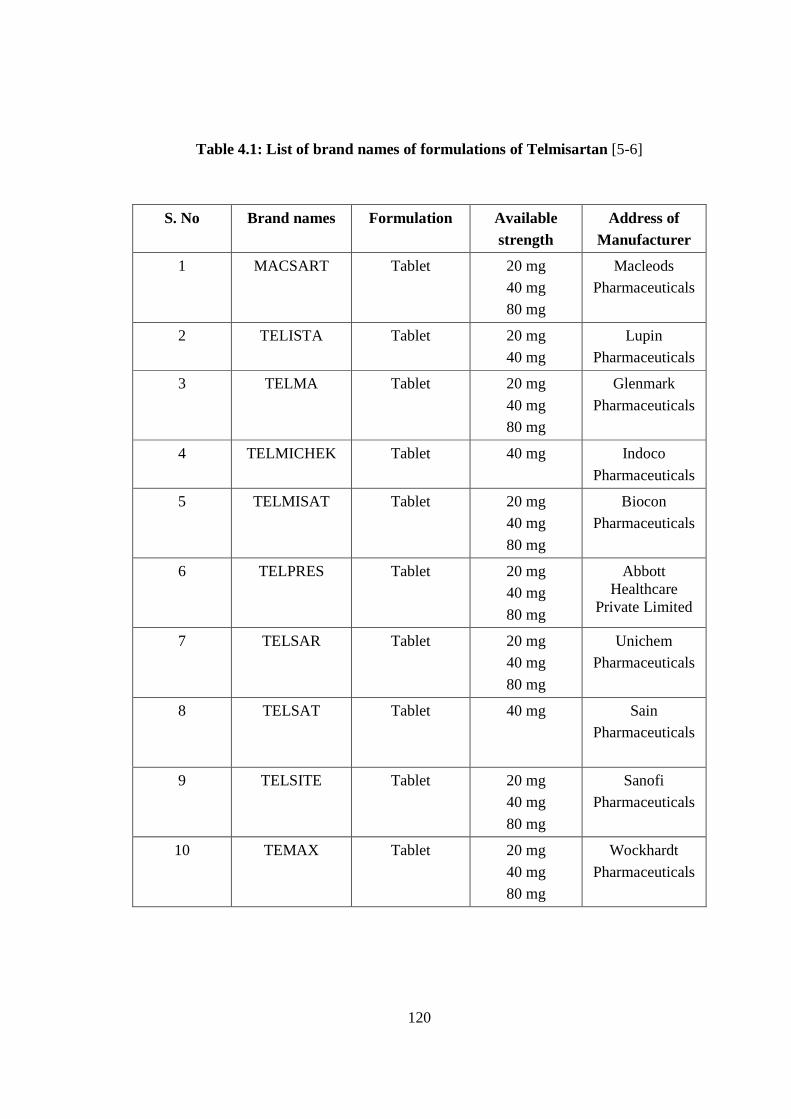
methanol:acetonitrile (15:15:70 v/v/v) was used. The mobile phase was pumped at a flow
rate of 1.0 mL/min and the eluents were monitored at 210 nm. The selected
chromatographic conditions were found to effectively separate Ramipril (Rt: 3.68 min)
and Telmisartan (Rt: 4.98 min) having a resolution of 3.84. The method was validated in
terms of linearity, accuracy, precision, specificity, limit of detection and limit of
quantitation. Linearity for Ramipril and Telmisartan were found in the range of 3.5-6.5
µg/mL and 28.0-52.0 µg/mL, respectively. The percentage recoveries for Ramipril and
Telmisartan ranged from 99.09-101.64% and 99.45-100.99%, respectively. The limit of
detection and the limit of quantitation for Ramipril was found to be 0.5 µg/mL and 1.5
µg/mL respectively and for Telmisartan was found to be 1.5 µg/mL and 3.0 µg/mL
respectively. The method was found to be robust and can be successfully used to
determine the drug content of marketed formulations.
Ramesh et al [15] developed an accurate, precise, simple and economical High
Performance Liquid Chromatographic method for the estimation of Telmisartan and
Hydrochlorothiazide and validated. The method so developed is Reverse Phase High
Performance Liquid Chromatographic method using Inertsil ODS column (Length: 250
mm, Diameter: 4.6 mm, Particle size: 5 µm) with a simple Trifluoro acetic acid buffer.
Buffer and acetonitrile were mixed in a proportion of 70:30 v/v as mobile phase. The
method so developed was validated in compliance with the National, Regional and
International Regulatory Guidelines by using very well developed analytical method
validation tool which comprises with the analytical method validation parameters like
specificity , forced degradation, system suitability, method precision, linearity, accuracy,
range, robustness, ruggedness, solution stability, filter validation. The results obtained

126
were well with in the acceptance Criteria.
Shen [16] developed a sensitive, simple, and accurate HPLC method was
developed for the assay of Telmisartan in human plasma using Naproxen as internal
standard, the assay involved liquid-liquid extraction of the compound from acidified
plasma into organic solvent and reversed-phase chromatography with fluorescence
detection. The assay was shown to be linear from 0.5 to 1000 ng/mL. In 24 healthy
volunteers, the plasma concentrations of the drug were determined after a single oral dose
of 160 mg.
Palled [17] developed a simple fast and precise reverse phase high performance
liquid chromatographic method was developed for the determination of Telmisartan from
tablet dosage forms. The column used was Hypersil C18 BDS (250 x 4.6 mm) from
Thermo. In isocratic mode, mobile phase used was acetonitrile: methanol (60:40 v/v) was
used. The flow rate was 1.2 mL/min, and eluent monitored at 245 nm.
Torrealday et al [18] developed a high performance liquid chromatographic
method with fluorimetric detection has been developed for the quantitation of the
angiotensin II receptor antagonist (ARA II) 4-((2-n-propyl-4-methyl-6-(1-
methylbenzimidazol-2-yl)-benzimidazol-1-yl)methyl)biphenyl-2-carboxylic acid
(Telmisartan) in urine, using a Novapak C18 column 150 x 3.9 mm, 4 µm. The mobile
phase consisted of a mixture acetonitrile-phosphate buffer (pH 6.0, 5 mM) (45:55, v/v)
pumped at a flow rate of 0.5 mL/min. Effluent was monitored at excitation and emission
wavelengths of 305 and 365 nm, respectively. Separation was carried out at room
temperature. Chromatographic variables were optimised by means of experimental
design. A clean-up step was used for urine samples consisting of a solid-phase extraction

127
procedure with C8 cartridges and methanol as eluent. This method proved to be accurate
(RE from -12 to 6%) and precise (intra- and inter-day coefficients of variation (CV) were
lower than 8%) to be applied to the determination of the active drug in urine samples
obtained from hypertensive patients. Concentration levels of Telmisartan at different time
intervals (from 0 up to 36 h after oral intake) were monitored.
Chen et al [19] developed a sensitive liquid chromatographic–electrospray
ionization mass spectrometric method and validated for fast determination of Telmisartan
in human plasma. Plasma of 0.1 mL was deprotienated with methanol, centrifugation,
evaporation to dryness and dissolving in mobile phase, samples were separated using a
Hypersil-Keystone C18 reversed-phase column (150 × 2.1 mm i.d., 5 µm), together with
a mobile phase containing of acetonitrile:10mM ammonium acetate (42:58, v/v), 0.2%
acetic acid and was isocratically eluted at a flow rate of 0.2 mL/min. Telmisartan and its
internal standard, Valsartan, were measured by electrospray ion source in positive
selective ion monitoring mode. The method demonstrated linearity from 1 to 2000 ng/mL
(r = 0.9988). The limit of quantification for Telmisartan in plasma was 1 ng/mL with
good accuracy and precision. The mean sample extract recovery of the method was
higher than 82% and 78% for Telmisartan and internal standard (IS), respectively. The
within-run and between-run precision ranged from 3.4 to 8.9% and 5.9 to 11.2% (relative
standard deviation, R.S.D.), respectively.
Li et al [20] developed a rapid, selective and sensitive method for the
determination of the angiotensin II receptor antagonist, Telmisartan, in human plasma has
been developed. Telmisartan and the internal standard, Diphenhydramine, were extracted
from plasma using diethyl ether–dichloromethane (60:40, v/v), and separated on a Zorbax

128
extend C18 column using methanol: 10 mM ammonium acetate (85:15, v/v) adjusted to
pH 4.5 after mixing with formic acid as mobile phase. Detection was carried out by
multiple reaction monitoring on a Q-trap™ LC–MS/MS system with an ESI interface.
The assay was linear over the range 0.5–600.0 ng/ml with a limit of quantitation of
0.5 ng/mL and a limit of detection of 0.05 ng/mL. Intra- and inter-day precision were
<6.7% and <8.1%, respectively, and the accuracy was in the range 88.9–111.0%. The
assay was applied to a pharmacokinetic study of Telmisartan given as a single oral dose
(80 mg) to healthy volunteers.
3. EXPERIMENTAL
3.1. Instrumentation
The author had attempted to develop and validate a liquid chromatographic
method for determination of Telmisartan using an isocratic Waters HPLC system on an
Xterra C8 column (150 mm x 4.6 mm, 3 µm). The instrument is equipped with a 2695
binary pump with inbuilt degasser, 2487 Dual absorbance detector and Rheodyne injector
with 20 µL sample loop. A 20 µL Hamilton syringe was used for injecting the samples.
Data was analysed using Waters Empower 2 software. A double-beam Elico SL-159 UV-
Visible spectrophotometer was used for spectral studies. Degassing of the mobile phase
was done by using an ultrasonic bath sonicator. A Shimadzu balance was used for
weighing the materials.
3.2. Chemicals and Solvents
The reference sample of Telmisartan (API) was obtained from Sun
Pharmaceutical Industries Ltd., Borada, India. The branded formulations (tablets)
(TELMA and TELISTA tablets containing 40 mg of Telmisartan) were procured from the

129
local market. HPLC grade acetonitrile and analytical grade potassium dihydrogen
Phosphate was obtained from Qualigens Fine Chemicals Ltd, Mumbai, India.
Hydrochloric acid, sodium hydroxide, hydrogen peroxide and triethyl amine of analytical
grade were obtained from Merck Chemicals Ltd, Mumbai, India. Milli-Q water was used
throughout the experiment dispensed through 0.22 µ filter of the Milli-Q water
purification system from Millipore, Merck KGaA, Darmstadt, Germany.
3.3. The Phosphate buffer solution
Weigh about 7.0 grams of Potassium dihydrogen Phosphate and transfer to 1000
mL standard flask, add 400 mL of Milli-Q water mix and dilute to volume with Milli-Q
water, sonicate for five minutes and cool to room temperature, measure the pH of above
buffer solution and finally adjusted the pH to 3.0±0.05 with Triethyl amine solution and
filtered through 0.45 µ nylon filter.
3.4. The mobile phase
A mixture of potassium dihydrogen phosphate buffer pH 3.0 and acetonitrile in
the ratio of 40:60 v/v was prepared and used as mobile phase.
3.5. The diluent
The potassium dihydrogen phosphate buffer pH 3.0 and acetonitrile mixture in the
ratio of 40:60 v/v was used as diluent.
3.6. Preparation of standard solution of the drug
About 40 mg of Telmisartan was accurately weighed and transferred into a 100
mL clean dry volumetric flask containing 50 mL of diluent. The solution was sonicated

130
for 5 min and then volume was made up to the mark with a further quantity of the diluent
to get a concentration of 400 µg/mL for Telmisartan (Stock solution). Further pipette 1
mL of the above stock solution into a 10 mL volumetric flask and the volume was made
up to the mark with the diluent.
3.7. Preparation of sample (tablet) solution
Twenty tablets were weighed and finely powdered. An accurately weighed
portion of powder sample equivalent to 40 mg of Telmisartan was transferred to a 100
mL volumetric flask containing 50 mL of the diluent. The contents of the flask were
sonicated for about 10 min for complete solubility of the drug and volume made up with
further quantity of diluent. Then this mixture was filtered through 0.45 µ membrane
filter. Pipette 1 mL of the above stock solution into a 10 mL volumetric flask and the
volume was made up to the mark with the diluent.
4. METHOD DEVELOPMENT
For developing the method, a systematic study of the effect of various factors was
undertaken by varying one parameter at a time and keeping all other conditions constant.
Method development consists of selecting the appropriate wave length and choice of
stationary and mobile phases. The following studies were conducted for this purpose.
4.1. Detection wavelength
The spectrum of diluted solution of the Telmisartan in diluent was recorded on
UV spectrophotometer. The peak of maximum absorbance was observed. The spectra of
Telmisartan showed that a balanced wavelength was found to be 229 nm.

131
4.2. Choice of stationary phase
Preliminary development trials have performed with octadecyl columns and octyl
columns with different types, configurations and from different manufacturers. Finally
the expected separation and shapes of peak was succeeded in Xterra C8 column.
4.3. Selection of the mobile phase
In order to get sharp peak and base line separation of the components, the author
has carried out a number of experiments by varying the composition of various solvents
and its flow rate. To effect ideal separation of the drug under isocratic conditions,
mixtures of solvents like water, methanol and acetonitrile with or without different
buffers in different combinations were tested as mobile phases on a C8 stationary phase.
A mixture of Potassium di hydrogen phosphate buffer pH 3.0 and acetonitrile in the ratio
of 40:60 v/v was proved to be the most suitable of all the combinations since the
chromatographic peaks obtained were better defined and resolved and almost free from
tailing.
4.4. Flow rate
Flow rates of the mobile phase were changed from 0.5-2.0 mL/min for optimum
separation. A minimum flow rate as well as minimum run time gives the maximum
saving on the usage of solvents. It was found from the experiments that 0.9 mL/min flow
rate was ideal for the successful elution of the analyte.

132
4.5. Run time
No interference in blank and placebo solutions for the drug peak in the trail
injections with a runtime of 6.0 min.
4.6. Optimized chromatographic conditions
Chromatographic conditions as optimized above were shown in Table 4.2. These
optimized conditions were followed for the determination of Telmisartan in bulk samples
and its combined tablet formulations. The chromatogram of standard and sample
solutions of Telmisartan was shown in Figure 4.2 and Figure 4.3. The chromatograms of
stability studies of Telmisartan were shown from in Figure 4.7 to Figure 4.10.

133
Table 4.2: Optimized chromatographic conditions for the estimation of Telmisartan
in tablet dosage form
Mobile phase : Potassium di hydrogen phosphate buffer pH 3.0:acetonitrile,
40:60 v/v
Pump mode : Isocratic
pH of Buffer : 3.0±0.05
Diluent : Potassium di hydrogen phosphate buffer:acetonitrile, 40:60 v/v
Column : Xterra C8 column, 150 mm x 4.6 mm, 3 µm
Column Temp : Ambient
Wavelength : 229 nm
Injection Volume : 20 µl
Flow rate : 0.9 mL/min
Run time : 6 min
Typical tR :-
Telmisartan : 2.736±0.5 min

134
Figure 4.2: Chromatogram of standard solution of Telmisartan
Figure 4.3: Chromatogram of sample solution of Telmisartan
5. VALIDATION OF THE PROPOSED METHOD
The proposed method was validated as per ICH [21-22] guidelines. The
parameters studied for validation were specificity, linearity, precision, accuracy,
robustness, system suitability, limit of detection, limit of quantification, and solution
stability.
5.1. Specificity
A study conducted to establish specificity of the proposed method involved
injecting blank and placebo using the chromatographic conditions defined for the
135
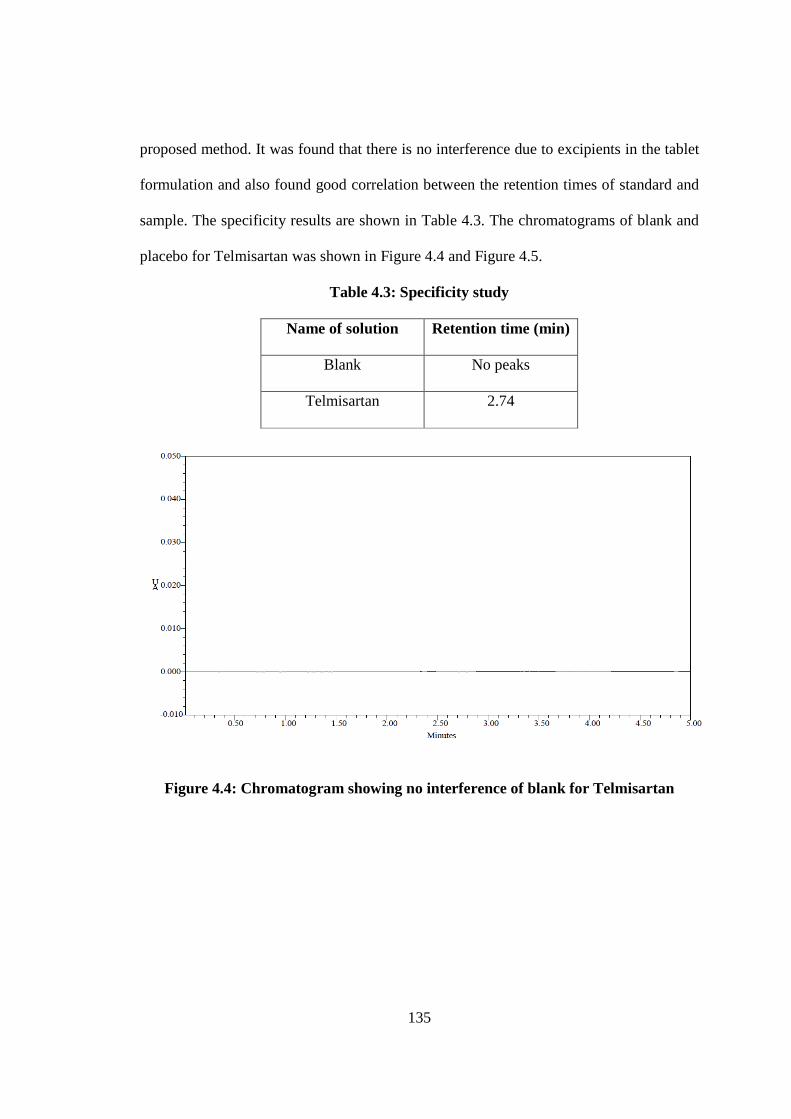
proposed method. It was found that there is no interference due to excipients in the tablet
formulation and also found good correlation between the retention times of standard and
sample. The specificity results are shown in Table 4.3. The chromatograms of blank and
placebo for Telmisartan was shown in Figure 4.4 and Figure 4.5.
Table 4.3: Specificity study
Name of solution Retention time (min)
Blank No peaks
Telmisartan 2.74
Figure 4.4: Chromatogram showing no interference of blank for Telmisartan

136
Figure 4.5: Chromatogram showing no interference of placebo for Telmisartan
5.2. Linearity
Linearity was performed by preparing standard solutions of Telmisartan at
different concentration levels including working concentration mentioned in experimental
condition from 20.0 to 60.0 µg/mL Twenty micro litres of each concentration was
injected in duplicate into the HPLC system. The response was read at 229 nm and the
corresponding chromatograms were recorded. From these chromatograms, the mean peak
areas were calculated and linearity plots of concentration over the mean peak areas were
constructed individually. The regressions of the plots were computed by least square
regression method. Linearity results were presented in Table 4.4 and linearity plots are
shown in Figure 4.6.

137
Table 4.4: Linearity study of Telmisartan
Figure 4.6: Linearity plot of Telmisartan
Level Concentration of Telmisartan (µg/mL) Mean peak area
Level-1 20 2395392
Level-2 30 3474808
Level-3 40 4677202
Level-4 50 5699253
Level-5 60 6937725
Slope 113091
Intercept 11323
Correlation Coefficient 0.9996

138
5.3. Precision
Precision is the degree of repeatability of an analytical method under normal
operational conditions. Precision of the method was performed as system precision,
method precision and intermediate precision.
5.3.1. System precision
To study the system precision, five replicate standard solutions of Telmisartan
was injected. The percent relative standard deviation (% RSD) was calculated and it was
found to be 0.04 for Telmisartan, which is well within the acceptable criteria of not more
than 2.0. Results of system precision studies are shown in Table 4.5.
Table 4.5: System precision
Injection number
Area of Telmisartan
Acceptance criteria
1 4700148
The %RSD of peak area
of Telmisartan should
not be more than 2.0
2 4696685
3 4700823
4 4699330
5 4700718
Mean 4699541
SD 1703
%RSD 0.04

139
5.3.2. Method precision
The method precision study was carried out on five preparations from the same
tablet samples of Telmisartan and percent amount of both were calculated. The %RSD of
the assay result of five preparations for Telmisartan in method precision study was found
to be 0.74 which is well within the acceptance criteria of not more than 2.0. The results
obtained for assay of Telmisartan is presented in Table 4.6.
Table 4.6: Method precision
Sample number %assay
Telmisartan
1 99.37
2 100.7
3 99.85
4 101.3
5 100.4
Mean 100.3
SD 0.7474
%RSD 0.74
5.3.3. Intermediate precision
The intermediate precision study was carried out by different analysts, different
columns, different reagents using different HPLC systems from the same tablet of
Telmisartan and the peak area of Telmisartan was calculated. The %RSD of the peak
areas of five preparations in intermediate precision study of Telmisartan was 0.39 which
is well within the acceptance criteria of not more than 2.0. The results of intermediate
precision study are reported in Table 4.7.
140
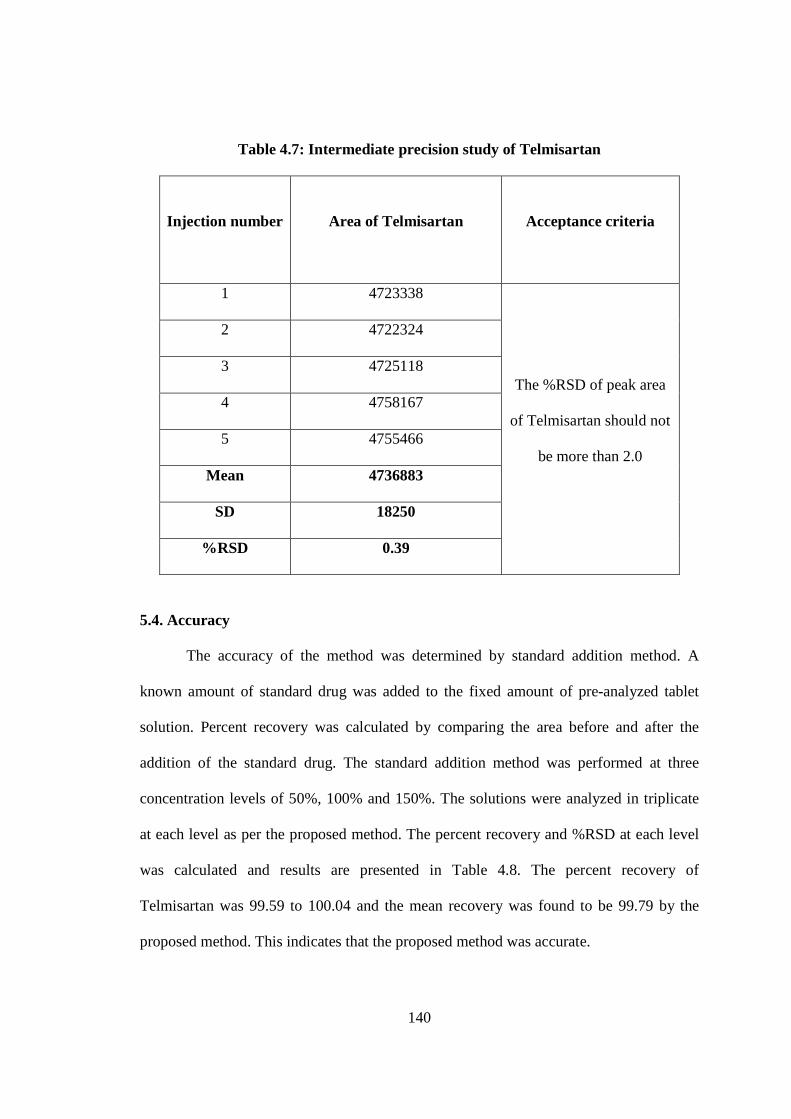
Table 4.7: Intermediate precision study of Telmisartan
Injection number
Area of Telmisartan
Acceptance criteria
1 4723338
The %RSD of peak area
of Telmisartan should not
be more than 2.0
2 4722324
3 4725118
4 4758167
5 4755466
Mean 4736883
SD 18250
%RSD 0.39
5.4. Accuracy
The accuracy of the method was determined by standard addition method. A
known amount of standard drug was added to the fixed amount of pre-analyzed tablet
solution. Percent recovery was calculated by comparing the area before and after the
addition of the standard drug. The standard addition method was performed at three
concentration levels of 50%, 100% and 150%. The solutions were analyzed in triplicate
at each level as per the proposed method. The percent recovery and %RSD at each level
was calculated and results are presented in Table 4.8. The percent recovery of
Telmisartan was 99.59 to 100.04 and the mean recovery was found to be 99.79 by the
proposed method. This indicates that the proposed method was accurate.

141
Table 4.8: Recovery study for Telmisartan
%Concentration(at specification
Level)
Mean peak area
Amount of Telmisartan
spiked (mg)
Amount of Telmisartan recovered
(mg)
%Recovery Mean
Recovery
50% 2379254 20.1 20.05 99.75%
99.79% 100% 4719780 40.0 40.10 100.04%
150% 6858762 59.80 59.55 99.59%
5.5. Robustness
The robustness study was performed by slight modification in flow rate of the
mobile phase and composition of the mobile phase. Sample of Telmisartan at 40 µg/mL
concentration were analyzed under these changed experimental conditions. It was
observed that there were no marked changes in chromatograms, which demonstrated that
the developed method was robust in nature. The results of robustness study are shown in
Table 4.9.

142
Table 4.9: Robustness study for Telmisartan
Condition Mean Peak
area %assay %difference
Unaltered 4676205 99.8 -
Flow rate at 0.7 mL/min
Flow rate at 1.1 mL/min
4679623
4593681
100.1
98.4
0.3
1.4
Mobile phase:
• Buffer(45):Acetonitrile(55)
• Buffer(35):Acetonitrile(65)
4598964
4763582
98.3
101.8
1.5
2.0
5.6. System suitability
System suitability was studied under each validation parameters by injecting six
replicates of the standard solution. The system suitability parameters are given in Table
4.10.
Table 4.10: System suitability for Telmisartan
Parameter Tailing factor Theoretical plates
Specificity study 1.20 2347
Linearity study 1.16 2465
Precision study 1.18 2581
Robustness study
Flow rate at 0.7 mL/min
Flow rate at 1.1 mL/min
Mobile phase:
• Buffer(45):Acetonitrile(55)
• Buffer(35):Acetonitrile(65)
1.12
1.32
1.06
1.16
2201
2095
2156
2316

143
5.7. Limit of detection and Limit of quantification
Limit of detection (LOD) is defined as the lowest concentration of analyte that
gives a detectable response. Limit of quantification (LOQ) is defined as the lowest
concentration that can be quantified reliably with a specified level of accuracy and
precision. For this study six replicates of the analyte at lowest concentration were
measured and quantified. The LOD and LOQ of Telmisartan are given in Table 4.11.
Table 4.11: LOD and LOQ of Telmisartan
Parameter Measured value (µg/mL)
Limit of detection 0.010
Limit of quantification 0.033
5.8. Solution stability
To determine the stability of Telmisartan in solution, the standard and sample
solution were observed under room temperature. Any change in the retention time, peak
shape and variation in response was compared to the pattern of chromatogram of freshly
prepared solution. The solution stability results are shown in the Table 4.12.
Table 4.12: Solution stability of Telmisartan
Standard solution Sample solution
Time
(hours) Response % variation
Time
(hours) Response % variation
Initial 4700148 - Initial 4699527 -
12 4657824 0.9 12 4652389 1.1
24 4625315 1.6 24 4618546 1.8
144
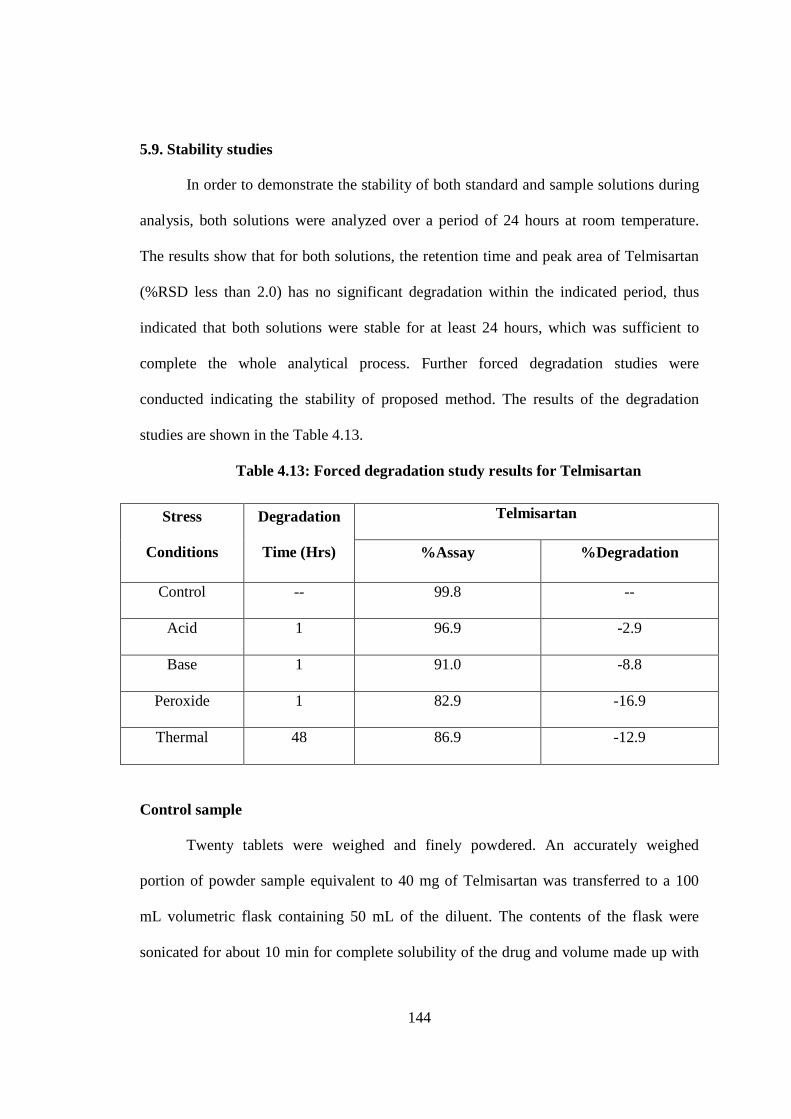
5.9. Stability studies
In order to demonstrate the stability of both standard and sample solutions during
analysis, both solutions were analyzed over a period of 24 hours at room temperature.
The results show that for both solutions, the retention time and peak area of Telmisartan
(%RSD less than 2.0) has no significant degradation within the indicated period, thus
indicated that both solutions were stable for at least 24 hours, which was sufficient to
complete the whole analytical process. Further forced degradation studies were
conducted indicating the stability of proposed method. The results of the degradation
studies are shown in the Table 4.13.
Table 4.13: Forced degradation study results for Telmisartan
Stress
Conditions
Degradation
Time (Hrs)
Telmisartan
%Assay %Degradation
Control -- 99.8 --
Acid 1 96.9 -2.9
Base 1 91.0 -8.8
Peroxide 1 82.9 -16.9
Thermal 48 86.9 -12.9
Control sample
Twenty tablets were weighed and finely powdered. An accurately weighed
portion of powder sample equivalent to 40 mg of Telmisartan was transferred to a 100
mL volumetric flask containing 50 mL of the diluent. The contents of the flask were
sonicated for about 10 min for complete solubility of the drug and volume made up with

145
further quantity of diluent. Then this mixture was filtered through 0.45 µ membrane
filter. 5.0 mL of this filtrate was further diluted to 50 mL with mobile phase.
Acid degradation sample
Twenty tablets were weighed and finely powdered. An accurately weighed
portion of powder sample equivalent to 40 mg of Telmisartan was transferred to a 100
mL volumetric flask containing 50 mL of the diluent. The contents of the flask were
sonicated for about 10 min for complete solubility of the drug. Then 10 mL of 5N acid
(Hydrochloric acid) was added, refluxed for 60 minutes at 60°C, then cooled to room
temperature, neutralized with 5N base (Sodium hydroxide) and diluted to volume with
diluent. Filtered about 25 mL of the above sample solution through 0.45 µ membrane
filter. Pipetted 5 mL of the above filtered sample solution into a 50 mL volumetric flask
and diluted to volume with diluent. Typical chromatogram of acid degradation for
Telmisartan is shown in Fig. 4.7.
Figure 4.7: Chromatogram of acid degradation showing Telmisartan

146
Base degradation sample
Twenty tablets were weighed and finely powdered. An accurately weighed
portion of powder sample equivalent to 40 mg of Telmisartan was transferred to a 100
mL volumetric flask containing 50 mL of the diluent. The contents of the flask were
sonicated for about 10 min for complete solubility of the drug. Then 10 mL of 5N base
(Sodium hydroxide) was added, refluxed for 60 minutes at 60°C, then cooled to room
temperature, neutralized with 5N acid (Hydrochloric acid) and diluted to volume with
diluent. Filtered about 25 mL of the above sample solution through 0.45 µ membrane
filter. Pipetted 5 mL of the above filtered sample solution into a 50 mL volumetric flask
and diluted to volume with diluent. Typical chromatogram of base degradation for
Telmisartan is shown in Fig. 4.8.
Figure 4.8: Chromatogram of base degradation showing Telmisartan
147
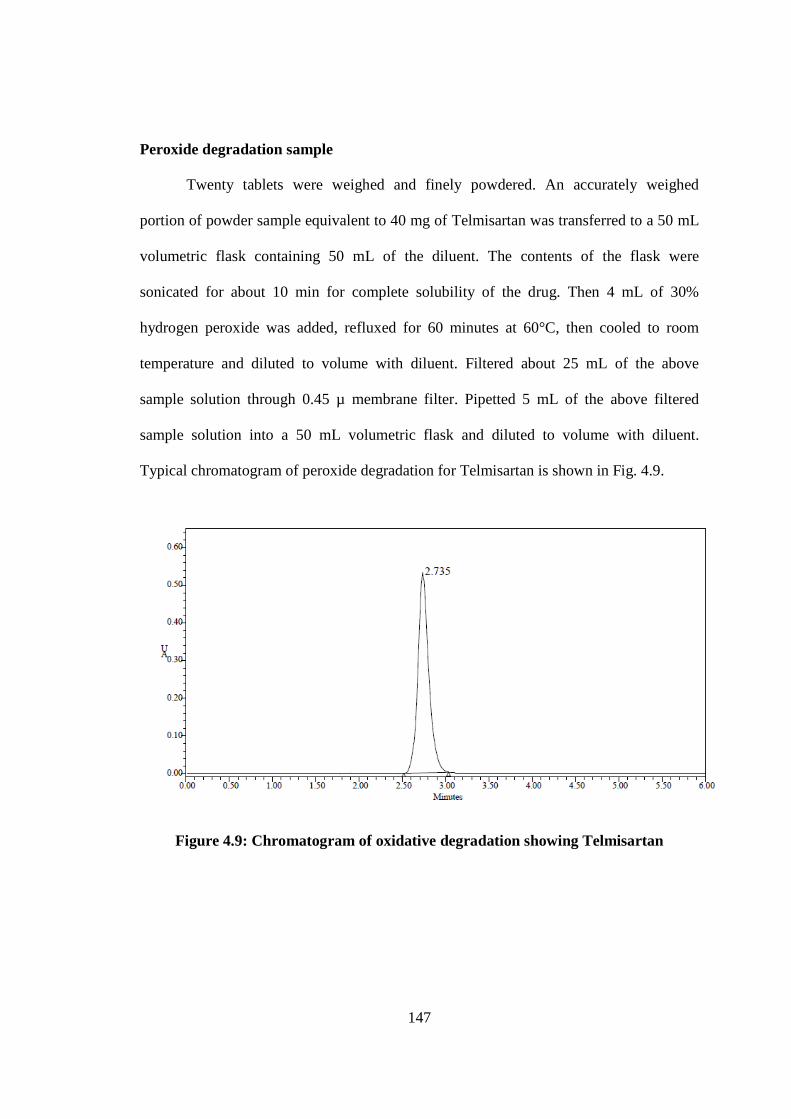
Peroxide degradation sample
Twenty tablets were weighed and finely powdered. An accurately weighed
portion of powder sample equivalent to 40 mg of Telmisartan was transferred to a 50 mL
volumetric flask containing 50 mL of the diluent. The contents of the flask were
sonicated for about 10 min for complete solubility of the drug. Then 4 mL of 30%
hydrogen peroxide was added, refluxed for 60 minutes at 60°C, then cooled to room
temperature and diluted to volume with diluent. Filtered about 25 mL of the above
sample solution through 0.45 µ membrane filter. Pipetted 5 mL of the above filtered
sample solution into a 50 mL volumetric flask and diluted to volume with diluent.
Typical chromatogram of peroxide degradation for Telmisartan is shown in Fig. 4.9.
Figure 4.9: Chromatogram of oxidative degradation showing Telmisartan

148
Thermal degradation sample
Twenty tablets were weighed and finely powdered. The powder was exposed to
heat at 105°C for about 2 days. An accurately weighed portion of powder sample
equivalent to 40 mg of Telmisartan was transferred to a 100 mL volumetric flask
containing 50 mL of the diluent. The contents of the flask were sonicated for about 10
min for complete solubility of the drug. Filtered about 25 mL of the above sample
solution through 0.45 µ membrane filter. Pipetted 5 mL of the above filtered sample
solution into a 50 mL volumetric flask and diluted to volume with diluent. Typical
chromatogram of thermal degradation for Telmisartan is shown in Fig. 4.10.
Figure 4.10: Chromatogram of thermal degradation showing Telmisartan

149
6. RESULTS AND DISCUSSION
The present study was aimed at developing a simple, sensitive, precise and
accurate HPLC method for the estimation of Telmisartan from bulk samples and tablet
dosage forms. A non-polar C8 analytical chromatographic column was chosen as the
stationary phase for the separation and determination of Telmisartan. Mixtures of
commonly used solvents like water, methanol and acetonitrile with or without buffers in
different combinations were tested as mobile phases. The choice of the optimum
composition is based on the chromatographic response factor, a good peak shape with
minimum tailing. A mixture of buffer and acetonitrile in the ratio of 60:40 v/v was
proved to be the most suitable of all the combinations since the chromatographic peak
obtained was well defined, better resolved and almost free from tailing. The retention
time of Telmisartan was found to be 2.74 min.
The linearity was found satisfactory for the drug in the range 20.0-60.0 µg/mL
(Table 4.4). The regression equation of the linearity curve of Telmisartan between
concentrations over its peak areas was found to be Y=113091X+113232 (where Y is the
peak area and X is the concentration of Telmisartan in µg/mL). Precision of the method
was studied by repeated injection of tablet solution and results showed lower %RSD
values (Table 4.5-4.7). This reveals that the method is quite precise. The percent
recoveries of the drug solutions were studied at three different concentration levels. The
percent individual recovery and the %RSD at each level were within the acceptable limits
(Table 4.8). This indicates that the method is accurate. The absence of additional peaks in
the chromatogram indicates non-interference of the commonly used excipients in the
tablets and hence the method is specific.

150
The deliberate changes in the method have not much affected the peak tailing,
theoretical plates and the percent assay. This indicates that the present method is robust
(Table 4.9). The system suitability studies were carried out to check various parameters
such as theoretical plates and tailing factor (Table 4.10). The lowest values of LOD and
LOQ as obtained by the proposed method indicate that the method is sensitive (Table
4.11). The solution stability studies indicate that the drug was stable up to 24 hours
(Table 4.12). The forced degradation studies indicate that the drug was stable in stability
studies (Table 4.13).
7. CONCLUSION
The proposed stability-indicating RP-HPLC method was simple, specific,
sensitive, accurate and precise and can be used for analysis of Telmisartan in bulk
samples and its tablet dosage forms.
8. REFERENCES
1. Martindale: The Complete Drug Reference, 34th Edn, pharmaceutical press, p. 1010.
(2005).
2. The Merck Index, 13th Edn., Merck Research Laboratories, Merck & Co., White
House Station, NJ, USA, p. 1628. (2001).
3. Wilson and Gisvolds, Text book of organic medicinal and pharmaceutical chemistry,
11th Edn, lipippinccott-williams & Wilkins, Philadelphia. U.S.A, p. 649. (2004).
4. H.L.Sharma & K.K.Sharma, principles of pharmacology, 2nd Edn, Paras medical
publishers, Delhi, p. 256. (2012).
5. CIMS (Current Index of Medical Specialities), UBM Medica India Pvt. Limited,
Bangalore, p. 102, Apr-Jul, (2012).

151
6. IDR Drug Triple i Compendium (Indian Drug Review), UBM Medica India Pvt.
Limited, Bangalore, p. 207, 5, (2012).
7. Sunil. S, Ajit kumar. Y and Hamendra. G. First order derivative spectroscopic
determination of Telmisartan in pharmaceutical formulation. Bulletin of
Pharmaceutical Research Institute, 2(2), 83-86 (2012).
8. Kalyankar. T.M, Mubeena. K and Nalanda. R. A rapid calorimetric method for the
estimation of Ammonia in Telmisartan in bulk and solid dosage form. International
Journal of Pharma World Research, 1(2), 1-9 (2010).
9. Palled. M.S. Difference spectrophotometric determination of Telmisartan in tablet
dosage forms. Indian Journal of Pharmaceutical Sciences, 68(5), 685-686 (2006).
10. Gupta. A, Charde. R.M and Charde. M.S. Determination of Telmisartan and forced
degradation behaviour by RP-HPLC in tablet dosage form. International Journal of
Pharmaceutical Chemistry, 2(3), (2012).
11. Varma. D, Lakshmana Rao. A and Dinda. S.C. Stability indicating RP-HPLC
method for the simultaneous determination of Telmisartan and Hydrochlorthiazide in
pharmaceutical dosage form. International Journal of Pharmaceutical, Chemical and
Biological Sciences, 2(3), 382-391 (2012).
12. Alankar. S. and Yogesh. G. Isocratic RP-HPLC-UV method development and
validation for the simultaneous estimation of Ramipril and Telmisartan in tablet
dosage form. Asian Journal of Pharmaceutical and Clinical Research, 2(4), 104-111
(2009).
13. Anand Kumar. T.R, Gurupadayya. B.M, Neeraj. S and Chandan. R.S. RP-HPLC
method for the simultaneous estimation of Hydrochlorothiazide, Ramipril and

152
Telmisartan in tablet dosage form. Journal of Pharmacy Research, 5(3), 1290-1293
(2012).
14. Kurade. V.P, Pai. M.G and Gude. R. RP-HPLC estimation of Ramipril and
Telmisartan in tablets. International Journal of Pharm Tech Research, 71(2), 148-
151 (2009).
15. Ramesh. M, Girish. G. and Vasanth. P.M. Development and validation of rapid RP-
HPLC method for simultaneous determination of Telmisartan and
Hydrochlorthiazide in tablet dosage form. International Journal of Chemical and
Analytical Science, 3(8), 1503-1505 (2012).
16. Shen. J. HPLC determination of Telmisartan in human plasma and its application to
a pharmacokinetic study. Pharmazie, 60(6), 418-20 (2005).
17. Palled. M.S. RP-HPLC determination of Telmisartan in tablet dosage forms, Indian
Journal of Pharmaceutical Science, 67, 108-110 (2005).
18. Torrealday. N, Gonzalez. L, Alonso. R.M, Jimenez. R.M and Lastra. E.O.
Experimental design approach for the optimisation of a HPLC-fluorimetric method
for the quantitation of the angiotensin-II receptor antagonist Telmisartan in urine.
Journal of Pharmaceutical and Biomedical Analysis, 32, 847-857 (2003).
19. Chen. B, Liang. Y, Wang. Y, Deng. F, Zhou. P, Guo. F and Huang. L. Development
and validation of liquid chromatography–mass spectrometry method for the
determination of Telmisartan in human plasma. Analytica Chimica Acta, 540, 367-
373 (2005).
20. Koseki. N, Kawashita. H, Hara. H, Niina. M, Tanaka. M, Kawai. R, Nagae. Y and
Masuda N. Development and validation of a method for quantitative determination
153
of Telmisartan in human plasma by liquid chromatography-tandem mass
spectrometry. Journal of Pharmaceutical and Biomedical Analysis, 43, 1769-74
(2007).
21. Li. P, Wang. Y, Wang. Y, Tang. Y, Fawcett. J.P, Cui. Y and Gu. J. Determination of
Telmisartan in human blood plasma Part II: Liquid chromatography-tandem mass
spectrometry method development, comparison to immunoassay and
pharmacokinetic study. Journal of Chromatography B, 828, 126-129 (2005).
22. ICH Harmonised Tripartite Guideline. Validation of Analytical Procedures: Text and
Methodology, Q2(R1), USA, 1-13 (2005).
23. ICH Harmonised Tripartite Guideline. Stability Testing of New Drug Substances and
Products, Q1A(R2), USA, 1-18 (2003).


![1. DRUG PROFILE - Shodhgangashodhganga.inflibnet.ac.in/bitstream/10603/32325/19/19_chapter 13.… · 1. DRUG PROFILE 1.1 Perindopril Perindopril [Figure 13.1], is an ACE inhibitor](https://img.pdfslide.us/doc/110x75/5f0703bf7e708231d41adece/1-drug-profile-13-1-drug-profile-11-perindopril-perindopril-figure-131.jpg)


![1. DRUG PROFILE in the patients of type II diabetesshodhganga.inflibnet.ac.in/bitstream/10603/32325/11/11_chapter 5.pdf · 1. DRUG PROFILE 1.1. Lisinopril Lisinopril [Figure 5.1],](https://img.pdfslide.us/doc/110x75/5e8671bfe718ee09e7747754/1-drug-profile-in-the-patients-of-type-ii-5pdf-1-drug-profile-11-lisinopril.jpg)


![Synthesis of Hydroxyapatite from egg shell and preparation ... · Ahmed M. Saeed [6] have worked on synthesis of calcium hydroxyapatite powder from hen’s eggshell and orthophosphoric](https://img.pdfslide.us/doc/110x75/603a19cdd92f8913c757fb39/synthesis-of-hydroxyapatite-from-egg-shell-and-preparation-ahmed-m-saeed-6.jpg)


![Dermatology Online Journal - praxis-schuster.ch · Prontosil in 1935. [18,19] This represented the great achievement of Gerhard Domagk who discovered that certain sulfonamides that](https://img.pdfslide.us/doc/110x75/5e7948ee629c485e8e1f23fb/dermatology-online-journal-praxis-prontosil-in-1935-1819-this-represented.jpg)