Embed Size (px)
Citation preview

05/09/07
1 of 42
Copyright © 2008 Pearson Education Canada
Chapter 19
What Macroeconomics Is
All About

05/09/07
2 of 42
Copyright © 2008 Pearson Education Canada
In this chapter you will learn
1. the meaning and importance of the key macroeconomic variables, including national income, unemployment, inflation, interest rates, exchange rates, and trade flows.
2. that most macroeconomic issues are about either long-run trends or short-run fluctuations, and that government policy is relevant for both.

05/09/07
3 of 42
Copyright © 2008 Pearson Education Canada
Output and Income
This gives nominal national income.
With base-period prices, we get real national income.
The production of output generates income.
To measure total output in dollars, we add up the values of the many different goods produced.
19.1 KEY MACROECONOMIC VARIABLES

05/09/07
4 of 42
Copyright © 2008 Pearson Education Canada
Real vs. Nominal: Does it matter?An example: Nominal Values Real Values GDP GDP (bill. of current $'s) (bill. of 1992 $'s)
1982 374.9 544.4
1992 691.2 691.2
% change 84.4% 26.9 %
% change p.a. 8.4% 2.7%
NOTE: about 70% of the increase in nominal GDP was due to price increases and not growth in real output.
MFC 41-111 MFC 41-111 MFC 41-111 MFC41-111MFC2007

05/09/07
5 of 42
Copyright © 2008 Pearson Education Canada

05/09/07
6 of 42
Copyright © 2008 Pearson Education Canada
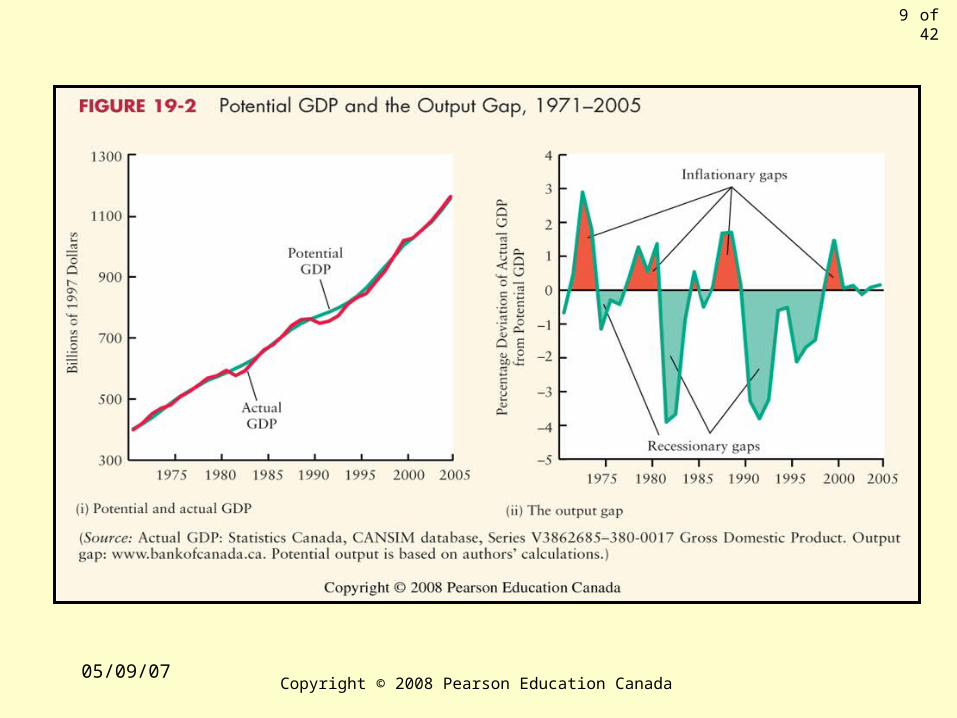
Real GDP fluctuates around a rising trend:
- the trend shows long-run economic growth
- the short-run fluctuations show the business cycle
APPLYING ECONOMIC CONCEPTS 19-1
The Terminology of Business Cycles

05/09/07
7 of 42
Copyright © 2008 Pearson Education Canada
The output gap measures the difference between potential output (denoted Y*) and actual output (denoted Y).
Output Gap = Y-Y*
When Y > Y*, there is an inflationary gap.
When Y < Y* , there is a recessionary gap.
Potential output (denoted Y*) is what the economy could produce if all resources were employed at their normal levels of utilization
- often called full-employment output
MFC 41-111 MFC 41-111 MFC 41-111 MFC41-111MFC2007

05/09/07
8 of 42
Copyright © 2008 Pearson Education Canada
Trough
Recession
RecoveryPeak
Potential GDP
Time
Recessionary Gap
Inflationary Gap
Peak
Actual GDP
Re
al G
DP
NOTE: GDP and Y are the same quantity for the aggregate economy
MFC 41-111 MFC 41-111 MFC 41-111 MFC41-111MFC2007
05/09/07
9 of 42
Copyright © 2008 Pearson Education Canada

05/09/07
10 of 42
Copyright © 2008 Pearson Education Canada
Employment, Unemployment, and the Labour Force
Employment: the number of workers (15+) who hold jobs.
Unemployment: the number who are not employed but are actively looking for a job.
Labour force: the total number of employed + unemployed.
The unemployment rate is the number of unemployed expressed as a percentage of the labour force.

05/09/07
11 of 42
Copyright © 2008 Pearson Education Canada
Unemployment Rate
= Number of people unemployed
Number of people in the labour force
X 100
• frictional unemployment
Even when Y = Y*, some unemployment exists:
• structural unemployment

05/09/07
12 of 42
Copyright © 2008 Pearson Education Canada
Employment, Unemployment, the Labour Force Participation Rate and Unemployment Rate: An example - Windsor CMA Second Quarter of 2006Population (POP): 270,200 (15+)
Unemployed (UN): 15,300
Labour force (LF): = E + UN = 163,100 + 15,300 = 178,400
Unemployment rate (UR): UN / LF = 15,300 / 178,400 = 8.58%
Employment (E): 163,100
Employment rate (ER): E / POP = 163,100 / 270,200 = 60.36%
We can also calculate the following variables of interest (not in text)
Participation rate (PR): LF / POP = 178,400 / 270,200 = 66.25%
MFC 41-111 MFC 41-111 MFC 41-111 MFC41-111MFC2007

05/09/07
13 of 42
Copyright © 2008 Pearson Education Canada

05/09/07
14 of 42
Copyright © 2008 Pearson Education Canada
A longer history of labour force and employment growth:What happened after the 1950’s?
MFC 41-111 MFC 41-111 MFC 41-111 MFC41-111MFC2007

05/09/07
15 of 42
Copyright © 2008 Pearson Education Canada
The unemployment rate when Y=Y* is called:
- the natural rate of unemployment (or NAIRU)
What is the NAIRU?- some estimates suggest that it is now below 7%
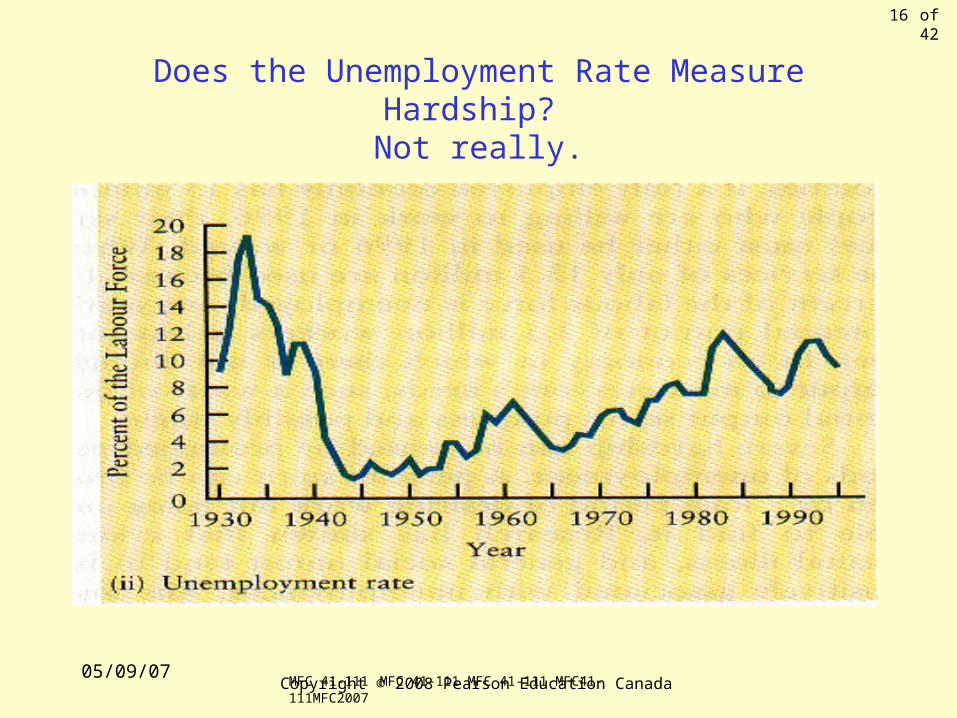
Why Does Unemployment Matter?
Some unemployment is desirable, as it reflects the time required for workers and firms to “find” each other so that good matches are made. But some unemployment is associated with human hardship, especially for those individuals with skills that are not in high demand by firms.
05/09/07
16 of 42
Copyright © 2008 Pearson Education Canada
Does the Unemployment Rate Measure Hardship? Not really.
MFC 41-111 MFC 41-111 MFC 41-111 MFC41-111MFC2007

05/09/07
17 of 42
Copyright © 2008 Pearson Education Canada
Productivity
Productivity: a measure of output per unit of input
- often measured as GDP per worker
- or GDP per hour of work
Increases in productivity are probably the single largest determinant of long-run increases in material living standards.

05/09/07
18 of 42
Copyright © 2008 Pearson Education Canada
Real GDP per worker is measured in thousands of dollars!

05/09/07
19 of 42
Copyright © 2008 Pearson Education Canada
Inflation and the Price Level
The price level: the average level of all prices in the economy.
Inflation: the rate at which the price level is changing.
The CPI is based on the price of a typical “consumption basket,” relative to the price in some base year:
10000
0
QP
QPCPI t
t

05/09/07
20 of 42
Copyright © 2008 Pearson Education Canada
An Example
MFC 41-111 MFC 41-111 MFC 41-111 MFC41-111MFC2007
The value of the CPI in January 2006 was 128.8. In January 2007, it was 130.3 (1992 base year)
The year-over-year inflation rate can be found by dividing the CPI for 2007 by that for 2006, subtracting 1 and multiplying by 100 — it is 1.2 percent.
[(130.3 / 128.8) - 1] x 100 = 1.2%
That is, the price level increased by 1.2 percent between January 2006 and January 2007 — an inflation rate of 1.2 percent.

05/09/07
21 of 42
Copyright © 2008 Pearson Education Canada
APPLYING ECONOMIC CONCEPTS 19-2
How the CPI Is ConstructedWhy Inflation Matters
The purchasing power of money is negatively related to the price level.
Also, because it is hard to forecast accurately, inflation adds to the uncertainties of economic life. Highly variable inflation rates cause great uncertainty.
If all financial contracts are written to incorporate a fully-anticipated inflation, then inflation will have no real effects.
MFC 41-111 MFC 41-111 MFC 41-111 MFC41-111MFC2007
An unanticipated inflation benefits anyone who has an obligation to pay money, and harms anyone who is entitled to receive money.

05/09/07
22 of 42
Copyright © 2008 Pearson Education Canada
In 1970 could you have predicted whatinflation would be
during the 1980’s?
In 1980 could you have predicted whatinflation would be
during the 1990’s?

05/09/07
23 of 42
Copyright © 2008 Pearson Education Canada
Inflation over the longer term
CPI
Rate of inflation
MFC 41-111 MFC 41-111 MFC 41-111 MFC41-111

05/09/07
24 of 42
Copyright © 2008 Pearson Education Canada
Your 1980 plan for buying a house based on expected inflation of 10%
Year 1 Year 2 ... Year 10
Monthly earnings $5,000 $5,500 $12,969 (increases with inflation)Mortgage payment (15%) $3,200 $3,200 $ 3,200 (fixed in nominal terms)Other expenditures $1,800 $2,300 $ 9,769(increases with inflation)
Real value of other expend. $1,800 $2,091 $ 3,766
Value of your house $250,000 $275,000 $648,435
(increases with inflation)
GREAT PLAN!MFC 41-111 MFC 41-111 MFC 41-111 MFC41-111

05/09/07
25 of 42
Copyright © 2008 Pearson Education Canada
What actually happens when inflation turns out to be 2% instead of your predicted 10%
Year 1 Year 2 ... Year 10
Monthly earnings $5,000 $5,100 $6,095 (increases with inflation)Mortgage payment (15%) $3,200 $3,200 $3,200 (fixed in nominal terms)Other expenditures $1,800 $1,900 $2,895(increases with inflation)
Real value of other expend. $1,800 $1,863 $2,375
Value of your house $250,000 $255,000 $304,749
(increases with inflation)
NOT SO GREAT OUTCOME! MFC 41-111 MFC 41-111 MFC 41-111 MFC41-111

05/09/07
26 of 42
Copyright © 2008 Pearson Education Canada
Interest Rates
The interest rate is the price of borrowing funds — the percentage amount per period.
The burden of borrowing depends on the real interest rate.
Nominal interest rate: the rate expressed in money terms.
Real interest rate: the rate expressed in terms of purchasing power.
05/09/07
27 of 42
Copyright © 2008 Pearson Education Canada
Interest rates vs. the interest rate
There are many different interest rates. Each reflects the cost of borrowing in a particular financial market
There are numerous financial markets (specific set of borrowers and lenders)
Each market is characterize by ‘risk’, ‘liquidity’, ‘term’ of loans, etc.
Each gives rise to a unique rate of interest
MFC 41-111 MFC 41-111 MFC 41-111 MFC41-111

05/09/07
28 of 42
Copyright © 2008 Pearson Education Canada
Examples of interest rates
TD - Canada Trust, Jan. 17, 2005
TD charges Prime 4.50% 1 year 'open' mortgage 7.00 1 year 'fixed' mortgage 4.85 10 year 'fixed' mortgage 7.50 Unsecured consumer loan 9.50 Student loans 4.50 (??) VISA 18.50 TD pays 1 yr GIC 2.10 5 yr GIC 3.00 Long term G of C bond 4.75
MFC 41-111 MFC 41-111 MFC 41-111 MFC41-111

05/09/07
29 of 42
Copyright © 2008 Pearson Education Canada

05/09/07
30 of 42
Copyright © 2008 Pearson Education Canada
The International Economy
Exchange rate: the number of Canadian dollars required to purchase one unit of foreign currency.
A depreciation of the Canadian dollar means that it is worth less on the foreign-exchange market
a rise in the exchange rate
Foreign exchange: foreign currencies or claims on foreign currencies.

05/09/07
31 of 42
Copyright © 2008 Pearson Education Canada

05/09/07
32 of 42
Copyright © 2008 Pearson Education Canada
Impact of Changes in the exchange rate : an example
Exchange rate 1 US $ = 1.17 Cdn $'s June 1990
P of a Meal in Windsor $10.00 CdnP of same meal in Detroit $ 8.00 US
P of Detroit meal for Windsorite $9.36 in Cdn $’s ($8.00 US x 1.17 = $9.36 Cdn)
Now what if the exchange increases (Canadian dollar depreciates) to 1 US $ = 1.65 Cdn $'s as it did by Jan. 2003
P of Detroit meal for Windsorite $13.20 in Cdn $’s ($8.00 US x 1.65 = $13.20 Cdn)
What is your prediction about Windsorites dining out in Detroit?
MFC 41-111 MFC 41-111 MFC 41-111 MFC41-111

05/09/07
33 of 42
Copyright © 2008 Pearson Education Canada
From the Detroiter’s perspective Exchange rate 1 US $ = 1.17 Cdn $'s
P of a Meal in Windsor $10.00 CdnP of same meal in Detroit $ 8.00 US
P of Windsor meal for a Detroiter $8.50 US ($10.00 Cdn x 0.85 = $8.50 US)
Recall an exchange rate of 1 US $ = 1.17 Cdn $'s implies an exchange rate of 1Cdn $ = 0.85 US $'s
Now what if the exchange rate increases (Canadain dollar depreciates) to
1 US $ = 1.65 Cdn $'s as it did by Jan. 2003
P of Windsor meal for a Detroiter $6.10 US ($10.00 Cdn x 0.61 = $6.10 US)
What is your prediction about Detroiters eating in Windsor?MFC 41-111 MFC 41-111 MFC 41-111 MFC41-111

05/09/07
34 of 42
Copyright © 2008 Pearson Education Canada
NOTE: as of January 2007 the situation has reversed (the Canadian dollar has appreciated)
Exchange rate 1 US $ = 1.18 Cdn $'sor 1Cdn $ = 0.85 US $'s
The situation has reverted to what it was in June 1990.
Why are the Erie Street restaurants, Casino Windsor and the local manufacturing industry doing so poorly? Work out the numbers.
Why are you shopping in Detroit again!
MFC 41-111 MFC 41-111 MFC 41-111 MFC41-111

05/09/07
35 of 42
Copyright © 2008 Pearson Education Canada
The balance of payments accounts record all payments made in international transactions — goods, services, and assets.
- trade balance- current account balance- capital account balance
For Canada, exports and imports are both very large —roughly 40% of GDP — but the trade balance is usually small.

05/09/07
36 of 42
Copyright © 2008 Pearson Education Canada

05/09/07
37 of 42
Copyright © 2008 Pearson Education Canada
19.2 GROWTH VERSUS FLUCTUATIONS
Long-Term Economic Growth
Long-term growth is considerably more important for a society’s living standards from decade to decade than short-term fluctuations.
There is considerable debate regarding the ability of government to influence the economy’s long-run growth rate.
05/09/07
38 of 42
Copyright © 2008 Pearson Education Canada
Long-term growth and increases in productivity
We will see that one of the most important determinants of long-term growth is increased productivity
One measure of productivity is output per person hour
Output per person hour is determined by many factors (capital, technology, regulations, etc.)
MFC 41-111 MFC 41-111 MFC 41-111 MFC41-111

05/09/07
39 of 42
Copyright © 2008 Pearson Education Canada
Why Productivity Growth Matters
Annual growth Change in ouput Number of yrs rate in pph after 40 yrs req'd to doubleproductivity (1 working life) output pph
1.0% 49% 70 yrs
1.5% 81% 47 yrs
2.0% 121% 35 yrs
2.5% 168% 28 yrs
3.0% 226% 23 yrs
MFC 41-111 MFC 41-111 MFC 41-111 MFC41-111

05/09/07
40 of 42
Copyright © 2008 Pearson Education Canada
Short-term fluctuations are often called business cycles.
Economists debate the effectiveness of monetary and fiscal policy in influencing these fluctuations.
Some economists argue that despite the power of policy to affect the economy, governments should not attempt “fine-tuning.”
Short-Term Fluctuations

05/09/07
41 of 42
Copyright © 2008 Pearson Education Canada
To organize our thinking about macroeconomics, we must develop some tools. These will include:
• discussing the measurement of national income
• building a simple model of the economy
• modifying the model to make it more realistic
• using our model to analyze some pertinent economic issues
What Lies Ahead?

05/09/07
42 of 42
Copyright © 2008 Pearson Education Canada