Embed Size (px)
Citation preview

NMBMMR OPEN FILE 96
HYDROCARBON SOURCE ROCK EVALUATION STUDY
ORGANIC GEOCHEMICAL ANALYSES OF CANNED CUTTINGS
KCM NO. 1 COCHISE - STATE A WELL
HIDALGO COUNTY, NEW MEXICO
(250ot- - Feet to 5300+ - Feet)
Prepared
for
New Mexico Bureau of
Mines and Mineral Resources
March, 1976
1143- C BRITTMORE ROAD, HOUSTON, TEXAS 77043
-€#MPAW+RQFmBTM Y

SOURCE ROCK EVALUATION CRUDE OIL-SOURCEROCK CORRELATION PROSPECnNG CRUDE OIL CHARACTERIZATION
1143-C BRllTMORE ROAD' HOUSTON, TEXAS 77043 713/467-7011
' March 9, 1976
Mr. Sam Thompson ItI Petroleum Geologist New Mexico Bureau of Mines
Socorro, New Mexico 87801
Dear Sam:
& Mineral Resources
Please find enclosed the results of the organic geochemical analyses carried out on seventeen (17) canned cuttings samples retrieved from the KCM No. 1 Cochise - State A Well which is located in Hidalgo County, New Mexico.. Instructions for geo- chemical analyses to be performed on these samples were transmitted in your letter of October 29, 1975.
Upon ar r iva l at GeoChem Laboratories, Inc., the samples were assigned the GeoChem Job No. 553- with ea.ch sample being further identified by a sequential number -001 through -017.
The C1-C7 hydrocarbon content of al l seventeen (17) cuttings samples was determined by analyzing both a sample of the cuttings and the a i r spa.ce a t the top of the can (Table I-A, I-B, and I-C;. Figure 1). The .cuttings samples were washed, dried and individually picked to exclude any obvious cavings. After making a. gross lithological description of the picked cuttings, al l seventeen (17) samples were analyzed for total organic carbon richness (Table il; Figure 1). Utilizing these data. and incorporating the information and suggestions from your letter of October 29, 1975, only nine (9) samples were selected for detailed, organic geochemical analyses.
The organic geochemical.analyses performed on samples 553-002, -004, -005, -006, -007, -009, -011, -012, -014 and -016 comprised C15+ soxhlet extraction, deasphal- tening and quantitative liquid chromatographic analyses (Tables m-A, III-B and Iil-C), C15+ paraffin-naphthene (P-N) analysis by gas chromatography (Table IV; Figure 2) and visual assessment of kerogen type and degree of maturation (Table V).
A l l remaining used and unused, picked and unpicked cuttings material, a set of glass miscroscope slides of the kerogen, and the C15+ hydrocarbon and nonhydrocarbon chromat fractions will be retained at.GeoChem until advised about their disposition.

RESULTS AND INTERPRETATIONS I
A. Geological Zonation
The sedimentary sequence penetrated by the KCM No. 1 Cochise - State A Well ha.s not, a t this time, been divided into a. number of discrete geological formations or lithologic units over the gross well interval 0 to 5300+ feet. The gra.yish bla.ck carbona.ceous shale from 2350+ - feet to 3850+ feet hasbeen suggested by Mr. Sam Thompson to be:
-
-ST+ 1) "Qwmkn-ha+%@&d-
or,% the Ringbone Formation \~ ~ ~
7 h - 4 or 3) -the -Gol.orado=-Mancosl
The samples from 3900+ feet to 5300+ feet are thought to represent the Cretaceous Mojado Formation.
- -
B. Geochemical Zonation
The stratigraphic section, penetrated by the KCM No. 1 Cochise - State A Well, can be subdivided into two (2) major zones ba.sed primarily on the C1-C7 light hydrocarbon contents, the organic carbon contents and the type and abundance of kerogen types found in the various samples. The geochemical zonation, which is independent of the forma- tion tops, is as follows:
ZoneA-------------------- 2400+ feet to 3850+ feet Zone B-------------------- 38505 feet to 5300; feet - -
In general, the grayish black carbonaceous shales of Zone A (2400+ feet to 3850+ feet) .are characterized by _ . low amounts of C2-C4 "wet" g a s (19 ppm to 144 ppm, mean 94 ppm; Table I-C; Figure l), by zero amounts of C5-C7 gasoline-range hydrocarbons ~ ~
(Table I-C; Figure l), by f a i r organic carbon contents (0.29% to 0.98%, mean 0.58%; Table II; Figure 1) by very low C15+ solvent extractable bitumen contents (70 ppm to 193 ppm, mean 123 ppm; Table III-B), and by a predominance of the Wooay and @ type kerogens.
The predominantly igneous rocks (with tra.ces of the Cretaceous Mojado Formation) of Zone B (3850+ - feet to 5300+ - feet) are characterized by " low'to fair amounts of C2-Cq "wet'' gas and C 5 4 7 gasoline-range hydrocarbons (26 ppm to 541 ppm, mean 231 ppm and 0 ppm to 479 ppm, mean 216 ppm,respectively; Table.1-C; Figure 1) by the poor organic carbon contents (0.06% to 0.16%, mean 0.10%; Table II; Figure 1) and by the lack of any meaningful amount of in place kerogens.
- -
-2-

C. Thermal Maturity and Hydrocarbon Source Character of Sediments
1.
2.
Zone A Sediments (2400+ feet to 3850ir feet)
The grayish black carbonaceous shales of Zone A (2400+ - feet to 3850+ feet) have an extremely mature, very poor oil source character, a very poor to poor 11wetTf
and,condensate source character, and a fair , t o possibly good, h3.r~" ga.s source'character. With the exception..of possibly the shallowest sample at 2400+ feet, the entire section has been thermally matured beyond the liquid generating stage. The Zone A sediments have experienced an advanced geo- thermal history by the fact the C15+ solvent extractable bitumen contents are very low (70 ppm to 193 ppm, mean 123 ppm; Table KC-B), the C15+ total hydrocarbon contents are extremely low (Table KC-B), the C15+ paraffin- naphthene hydrocarbons ha.ve a mature character (see ga.s chromatograms 553-002, -004, -005, -006, -007, -009, and -011;.Table IV; Figure 2) and because the predominately ..~. ~ black coloration of the recognizable plant cuticle contained in the kerogen isolated from these sediments (Table V) is consistent with severely altered Maturation Indices of Stage 4-.
The - f a i r organic carbon contents (0.29% to 0.98%, mean 0.58%; Table II; Figure l), which consists of predominately woody and coaly type kerogens, suggests that I t d r y 1 1 methane gas should be the only objective within the Zone A sediments. The methane (C1) gas content of these sediments is overall fajr (avera.ge 1377 ppm with the exception of the sample at 3200+ feet; Table I-C; Figure 1). This - fair amount of methane gas, and in partic&z-, the very good amouut of methane gas (35,360 ppm; Table I-C; Figure 1) in the sample a t 3200+ feet leads the author to conclude that Zone A sediments have moderate to possibly good (?) prospectiveness for indigenously generated, thermal methane gas.
Zone A sediments offer encouragement for I'dry" thermal methane gas reserves in the local area of the KCM No. 1 Cochise - State A Well, provided that a reservoir and trap are available. I want to caution the reader that only one sample contained very good amounts of methane gas. Obviously, ga.s pros- pectiveness would be enhanced considerably had most of the shale samples contained greater than 35,000 ppm of methane ga.s.
Zone B Sediments (3850+ feet to 5300+ feet)
-
. .-
-
The samples from Zone B (3850+ feet to 5300+ feet) are made up predominately of igneous rocks and some pieces of shale (cafrings?) which ha.ve no oil source character because of their advanced maturity caused by proximity to igneous activity. The poor oil source character is defined by the poor organic carbon
-3-

contents (0.06% to 0. IS%, mean 0.10%; Table II; Figure l), the very low C15+ solvent extractable bitumen contents (61 ppm and 100 ppm) and by the - lack of any meaningful amount of in place kerogens.
It should be pointed out that " low to f a i r amounts of C5-C7 gasoline-range hydrocarbons (0 ppm to 479 ppm, mean 216 ppm respectively; Table I-C; Figure 1) are found in Zone B section. It is interpreted that the quantities of c 5 - C ~ and C2-C4. gases a re too lav to warrant "wetfl gas or condensate prospectiveness in this section. -The prospectiveness of this section, a s well as Zone A section, would be enhanced if encountered distant to the igneous activity in the local area of the KCM No. 1 Cochise - State A Well.
Sam, I feel that these results, although discouraging for Hidalgo County, are optimistically encouraging from a fldrfT" methane gas standpoint. If you would like to discuss the results of this study further, please conta.ct me.
T o u r s very truly,
c /
Paul J. Cernock Chief Geologist GEOCHEM LABORATORIES, INC.
P JC :bt Enclosures

GeoChem Sample Number
553-001 553-002 553-003 553-004 553-005 553-006 553-007 553-008 553-009 553-010 553-01 1 553-012 553-013 553-014 553-01 5 553-01 6 553-01 7
*In Feet
We1 1 Interval*
2400 2500 2600 2700 2800
3000 2900
3200 31 00
3300 3500 3700 3900 4200 4500 5000 5300
Methane c1 PPM
623.7 460. G 607.1 581.5
1367.6 272.2
1822.1
34006.9 2716.1
540.8 332.7 635.8
230.4 890.4
927.1 246.9
196.1
Ethane c2 PPM
47.7 G4.9
105.7 03.7
12.3
103.7 73.8
90.7 73.5
77.1
9G.8 51.1
92.2
110.4 5.3
265.2 27.5
TABLE I-A
Cl-C7 IIYDROCARBON ANALYSES OF AIR SPACE
Propane c 3 PPtl
9.8 10.G 21.2 17.4 0.0 9.7
13.2 6.4
12.3 30.4
44.3 10.7
122.7 5.9
148.9 70.3
14.5
[sobutane
P PM i C4
0.0 0.G.
0.0 0.0
0.0 0.0
0.0 0.0 0.0
0.0 0.0
0.0 0.0
14.8 25.5
122.5 94.7
Butane Total nC4 PPI4
c5-c7 PPI4
0.0 0.0
0.0 0.0
0.0 0.0
0.0 0.0
0.0 0.0 0.0
0.0 0.0 OIO 0.0 0.0 0.0 0.0 0.0 0.0 0.0 0;o 0.0 0.0
0.0 0.0
0.0 339.2 21.4 47913 0.0 242.3 0.0 18.G
Total c1 -c4
P P 1.1
681.0 536.1 712.0 704. G 284.5
1939.0 1451.1
34928.0 2796.0
630.2 394.5
1105.3 777.5
256.4 474.5
1463.7 332.3
Total C2-C4
PPI4
58.1
104.9 75.5
123.1 12.3
116.9 83.5
121.1 79.9
89.4 61.8
141.7 214.9
227.G 21, ,O
536.G 136.7
Gas Wetness
% iC4/nC4
8.5 - 14.7 14.1 - 17.5 - e - 4.3 - 5:0 - 6.0 2.9 0.3 -
- - 14.2 15.7 - 18.2 - 19.4 - 10.1 48.0 36.7
1.19
41.1
- - -
ppm valves expressed as volumes of gas per million volumes of sediment.

GeoChem Sample Number
553-001 553-002 553-003 553-004 553-005 553-006 553-007 553-008 553-009 553-010 553-01 1 553-012 553-01 3 553-014 553-015 553-01 6 553-01 7
*In Feet
We1 1 I n t e r v a l "
2400 2500 2600
2000 2700
2900 3000 31 00 3200 3300 3500 3700 3900 4200 4500 5000 5300
Methane Ethane c1 PPI4
c2 PPI4
147.6 302.3 5.5'
2.5
649.8 5Gl.9
,5.9
527.9 7.4 5.3
549.1 4.8 037.2 6.5 432.5 553.0
4.0 3.9
487.4 4.0 355.6 2.2 300.0 1.9 205.0 1.9
80.4 253.3
0.0 2.7
138.1 97.3
2.1 0.0
TABLE I - B
Cl-C7 HYDROCARBON AIIALYSES OF CUTTItlGS GAS
Propane c3 PPI4
1.4 1.8 1.2 1 .o 0.0 0.0 0.9 0.0 1 .G 0.0 0.0 1.3
0.0 1 .o
0.9 1 .0 0.0
Isobutane i C4 PPM
0.0 0.0 0.0
0.0 0.0
0.0 0.0 0.0 0.0 0.0 0.0 0.0 0.0 0.0 0.0 0.9 2.6
Butane nC4 PPI4
0.0 0.0 0.0 0.0 0.0 0.0
0.0 0.0
0.0 0.0
0.0 0.0
0.0 0.0 0.0 0.0 0.0
'Tota l c5-c7
P PM
0.0 0.0 0.0 0.0 0.0 0.0 0.0 0.0 0.0 0.0 0.0 0.0 0.0 0.0 0.0 0.0 0.0
T o t a l C1 -C4
PPM
151.5 309. 6 656.9 568.2 535.3 553.9 844. 6 436.5 558.5 491.4 357.8 303.2 207.9
80.4 256.9 142.9
99.9
T o t a l C2-C4
PPM
3.9 7.3 7.1 6.3 7.4 4.0 7.4 4.0
4.0 5.5
2.2 3.2 2.9 0.0
4.8 3.6
2.6
Gas Irletness
% iC4/nC4
2.6 2.4 1.1 1.1 1.4 0.9 0.9 0.9 1 .o 0.3 0.G 1.1 1.4 0.0 1.4
2.6 3.4
ppm valves expressed as volumes of gas per million volumes of sediment.
I

GeoChem
Number Sample
553-002 553-001
553-003 553-004 553-005 553-006 553-007 553-008 553-009 553-010 553-01 1 553-01 2
553-014 553-01 3
553-01 5 553-016 553-017
*In Feet
We1 1 Interval*
2400 2500 2600 2700 2800
3000 2900
31 00 3200 3300 3500 3700 3900 4200 4500 5000 5300
Methane C1 PPI4
771 . 3 762.9
1256.9 1143.4
191.6.7 800.1
2659.3 3148.6
35359.9 1028.2 688.3
1095.4 935.8
310.8
1065.2 293.4
500.2
Ethane c2 PPI4
50.2 70.4 09.G
111.0 19.7 78.G
110.2 77.5
81.1 94.G
53.3 98.7 94.1
113.1 5.3
2G7.3 27.5
Propane Isohutane c3 PPI4
i C4 PPt4
12.4 11.2 0.G
0.0 . 22.4 0.0 18.4 0.0
- 0.0 .~
OIO 9.7 0.0
14.1 0.0
TABLE I-C
Cl-C7 HYDROCARBON ANALYSES OF AIR SPACE AND CUTTINGS GAS
6.4 0.0 32.0 0.0 12.3 0.0
46.2 10.7 0.0
0.0 12317 OIO
5.9 14.8 71.2 25.5
150.7 , 123.4 14.5 97.3
Butane nC4 PPI4
0.0 0.0
0.0 0.0
0.0 0.0 0.0 0.0 0.0 0.0 0.0 0.0 0.0
21.4 0.0
0.0 0.0
Totai c5-c7
PPM
0.0 0.0 0.0 0.0 0.0 0.0 0.0 0.0 0.0 0.0 0.0 0.0 0.0
339.2 479.3 242.3
18.G
Total Cl-C4
PPM
833.3 845.7
1368.9 1272.8 819.8
2005.0 2783. G
35486.5 3232.5
1121.G 752.3
1080.7 1313.2
336.3 731.4
1606.G 432.7
Total c2-c4
PPI4
62.0 82.8
129.4 112.0
19.7
124.3
12G.G 83.9
93.4
144.9 64.0
21 7.8
231.2 26.0
541.4 139.3
88.3
Wetness Gas
% iC4/nC4
7.4 9.8 - 8.2
10.2
4.4 2.4 - 4.5 2.G 0.4 8.3 3.5
13.4 16.6
7.7 31 .G 33.7
1.19
32.2 -
- - - - - - - - - - - -
ppm valves expressed as volumes of gas per million volumes of sediment.

Table I1
Organic Carbon Analyses and Gross Lithological Description
GeoChem We1 1 Gross Lithological Oescription GSA Total Organic Sample Interval Color Carbon Number Code (% o f Rock)
553-001 2400' -A -B
90% Igneous , main ly s i l i ca tes 10% Shale , carbonaceous, s l ight ly calcar-
eous, nonsil ty, blocky, moderately hard, grayish black N2 Trace o f f r ac tu re s f i l l ed w i t h c a l c i t e
0.29*
553-002 2500' -A -B
553-003 2600' -A -B
553-004 2700' -A -B
553-005 2800' -A -B
553-006 2900' -A -B
553-007 3000' -A -B
553-008 3100' -A -B
553-009 3200' -A -B
553-010 3300' -A -B
70% Igneous 30% Shale , same a s 553-0018
70% Igneous 30% Shale, same a s 553-0018
60% Igneous 40% Shale , same a s 553-0016
70% Shale, same a s 553-001B 30% Igneous
80% Shale, same a s 553-0018 20% Igneous
80% Shale , same a s 553-0018 20% Igneous
70% Shale , same a s 553-001B 30% Igneous
70% Shale, same as 553-001B 30% Igneous
60% Shale, same as 553-001B 40% Igneous
0.43*
0.46*
0.61*
0.98*; 0.99*R
0.91*
0.81*
0.65"
0.63*
0.42*; 0.47*R
* Organic carbon value of gross sample used f o r C15+ ex t r ac t ion .

e Table I1
Organic Carbon Analyses and Gross Lithological Description
GeoChem We1 1 Gross Lithological Description GSA Total Organic Sample Interval Color Carbon Number Code (% o f Rock)
553-011 -A -B
553-012 -A
-B
553-013 -A
553-014 -A
553-015 -A
553-016 -A
553-017 -A
3500'
3700'
3900'
4200'
4500'
5000'
5300'
0.37* 60% Shale , same as 553-001B 40% Igneous
80% Shale , s l igh t ly ca lcareous , nons i l ty ,
20% Igneous
0.40*
blocky, moderately hard, dark gray N3
100% Igneous, mainly s i l icates Trace of shale
0.13*
0.06* 100% Igneous
100% Igneous 0.05*; 0.06*R
0.16* 100% Igneous
100% Igneous 0.11"
* Organic carbon value of gross sample used for C15+ ex t r ac t ion .
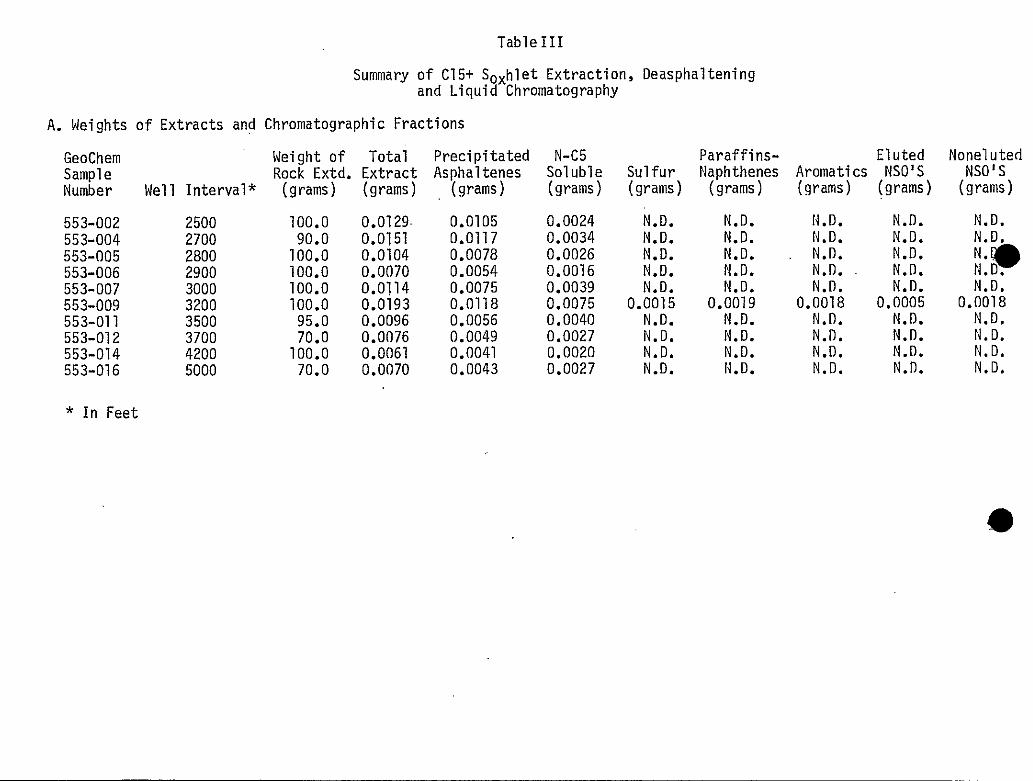
Table111
Summary o f C15+ Soxhlet Extraction, Oeasphaltening and Liquid Chromatography
A. Weights of Extracts and Chromatographic Fractions
GeoChem
Number Sample
553-002 553-004 553-005 553-006 553-007 553-009 553-01 1 553-01 2 553-014 553-016
We1 1 Interval*
2500 2700 2800 2900
3200 3000
3500 3700 4200 5000
Weight o f Total Prec ip i ta ted N-C5 Rock Extd. Extract Asnhaltenes Soluble
(grams)
100.0 90.0
100.0 100.0 100.0 100.0 95.0
100.0 70.0
70.0
(grams ~~~ ~
0.0129- 0.0151 0.0104
0.0114 0.0070
0.0193 0.0096 0.0076 0.0061 0.0070
i grams) (grams
0.0105 0.0024 0.0117 0.0034 OI0078 0.0026 0.0054 0.0016 0.0075 0.0039 0.0118 0.0075 0.0056 0.0040 0.0049 0.0027 0.0041 0.0020 0.0043 0.0027
Sul fur (grams 1
N.D. N.O. N.D. N.O. N.D.
0.0015 N.O. N.O. N.D. N.D.
Paraf f ins - Naphthenes Aromat
(grams) (grams
N.O. I4.D. N.D. N.O. N.D. N.D.
. N.D. N.D.
N.D. N.D.
N.D. N.D. N.O. N.D.
0.0019 0.0018 0.0005 N.D.
N.O. N.D. N.D. N.D. N.D. N.D. N.D. N.D. N.D. N.D. N.D. N.D.
None1 uted N S O ' S
(grams
N.O.
;: * N.D.
0.0018 N.D.
N.O. N. 0. N.O. N.D.
* In Feet
c

Table I11 (Continued)
B. Concentration of Extracted Materials i n Rock
GeoChem
Number Well Interval* Sample
553-002 2500 553-004 2700 553-005 2800 553-006 2900 553-007 3000 553-009 3200 553-01 1 3500 553-01 2 3700 553-014 4200 553-016 5000
Total Extract
( P P d
129 160 104
114 70
193 101 109 61
100
* In Feet
ppm values on a Weight/Weight Basis
"-""" Paraff in-
Hydrocarbons-------
Naphthene Aromatic Total ( P P 4 ( P P d ( PPm)
- - - - - -
""-"""" Preciptd.
Nonhydrocarbons------------
Asphaltene llS0"S Eluted None1 uted
N S O ' S Total ( P P d ( P P 4 ( P W ) (PPm)
105 130
- - - - 78
- - 54 - - - - -

Table I11 (Continued)
C. Composition o f Extracts
GeoChem Sample Number
553-002 553-004 553-005 553-006
553-009 553-007
553-01 1 553-01 2 553-014 553-016
Well Interval*
2500 2700 2800 2900 3000 3200 3500 3700 4200 5000
_"""""- Nonhydrocarbons------------ Eluted Noneluted .Precipitd.
Sul fur . NSO'S NSO'S Asphaltene HC'S % % % % Asph/NSO % HC/Non H C
81.4 - 77.5 - 75.0 - 77.1 - 65.8 - 61.1 5.13 58.3 64.5 67.2 61.4 -
- - - 19.2 - (I:*
* In Feet

Table IY-A
I Sa tura te Hydrocarbon Analyses
Summary of Paraffin-Naphthene Distribution
GeoChem Sample % % % c- P c-P Number Well Interval* Paraff in Isoprenoid Naphthene Index A Index B ip19/ip20
553-002 2500 553-004 553-005
2700 2800
553-006 2900 553-007 3000 553-009 3200 553-01 1 3500 553-012 3700 553-014 4200 553-016 5000
7.1 2.0 90.8 11.4 4.0
1.17 84.6
2.27 0.58
9.5 0.96
3.3 87.2 1.33 0.22
0.96 9.5 1 .o
1.50 0.27 1.35
89.4 1.06 5.3
1.52 86.4
0.60
29.6 43.5 27.0 1.67 - 0.43
10.9 6.9 82.2 0.94 - 0.11 - 0.37
6.4 9.6
1.4 5.6 84.8 0.95
92.2 1.02 1.65 0.07 0.42
89.5 1.04 1.35 a. 3 2.4 a. 3 -
-
* In Feet

GeoChem
Number Sample
553-002 553-004 553-005 553-006 553-007 553-009
553-01 2 553-01 1
553-014 553-016
* In Feet
We1 1 Interval * 2500 2700 2800 2900 3000 3200 3500 3700 4200 5000
Saturate Hydrocarbon Analyses I
Normalized Paraffin Distribution
% % % % % % % % % % % % . % X % % % nC15 nC16 nC17 ip19 nC18 ip20 nC19 nC20 nC21 nC22 nC23 nC24 nC25 nC26 nC27 nC28 nC29
1.0 0.5 3.0 8.1 14.0 13.8 9.4 8.8 4.8 6.5 7.1 5.2 6.0 2.8 3.7 1.0 215 0.5 1.2 0.1 0.1 0.0 0.0 0.1 0.2 4.6 4.7 17.2 21.4 17.0 12.0 4.9 3.6 3.5 3.5 3.1 1.9 1.0 0.4 0.4 0.1 0.2 0.1 0.0 0.0 0.0 0.2 0.4 4.6 5i5 15.5 20.1 13.4 9.2 3.5 4.0 4.7 514 5.4 3.1 2.1 0.7 1.0 0.4 0.5 0.1 0.1 0.0' 0.0 0.2 0.2 0.6 5.5 6.7 4.1 5.6 7.7 5.0 7.8 12.9 14.0 12.8 7.9 4.6 1.7 1.3 0.5 0/6 0.1 0.1 0.0 -0.0 0.2 0.4 6.8 8.3 16.4 13.8 12.3 11.2 7.9 7.2 5.8 3.4 2.6 1.2 0.8 0.3 0.6 0.2 0:3 0.1 0.0 0.0 0.0 0.2 2.2 12.3 11.7 22.0 27.5 13.8 6.1 1.3 1.1 0.9 0.6 0.4 0.0 0.0 0.0 0.0 0.0 O ! O 0.0 0.0 0.0 0.0 0.0 2.3 4.1 5.7 0.9 53.9 2.9 2.6 2.3 5.4 6.9 1.6 4.6 0.8 3.0 2.3 0.8 0.0 0.0 0.0 0.0 0.0 0.0 0.2 0.4 8.9 10.4 23.8 28.3 14.2 5.9 1.6 1.8 .2.0 1.0 0.6 0.2 0.2 0.2 0.2 0.0 0.0 0.0 0.0 0.0 0.0 0.2 0.4 9.1 11.0 20.7 25.9 12.9 7.0 2.5 2.5 3.0 2.1 1.3 0.6 0.4 0.2 0.2 0.0 040 0.0 0.0 0.0 0.0 0.4 0.4 0.4 1.1 9.4 16.5 17.6 13.8 5.6 6.2 7.6 6.7 6.0 2.9 2.4 0.7 0.9 0.4 0.7 0.2 0.0 0.0 0.0


APPENDIX A
Brief Description of Organic Geochemical Analyses Performed in This Studx
- Cl,C, Hydrocarbon
The C1-C7 hydrocarbon content and composition of sediments reflects source type, source quality and thermal maturity.
The C1-C7 hydrocarbon content of well cuttings is determined by analyzing both a sample of the cuttings and the air space at the top of the can. The results of the two analyses are summed to give an inventory of the C1-C7 hydrocarbon content of the well cuttings prior to any losses from the cuttings during the lapsed time period be- tween collection at the wellsite and laboratory analysis. .
The air space C1-C7 hydrocarbon analysis involves taking a measured volume of the air space gas out of the can with a syringe and injecting same into a gas chromato- ,.
graph. GeoChem uses a Varian Aerograph Model 1400 instrument equipped with a porapac Q column. The gas sample is taken through the column by a carrier gas and before reaching the detector is separated into its various C 1 (methane), C2 (ethane), C3 (propane), iC4 (isobutane), nC4 (normal butane), and C5, c6, C7 hydrocarbon com- ponents.
This particular analysis gives a complete separation of the C1-C4 gas-range hydrocar- bons and a partial separation of the (2547 gasoline-range hydrocarbons. (A detailed C4-C7 analysis, to be discussed later, involving a capillary column, effects a complete separation of this molecular range into its several individual molecular species).
The electrical response 'of the various hydrocarbons as they reach the detector is re- corded on a paper strip chart as a peak. This response is simultaneously fed to an integrator which computes the area of each peak. The concentration of C1-C7 hydro- carbons in the air space, expressed as volumes of gas per million volumes of cuttings, is determined by a calculation involving the volume of cuttings, volume of air space in the can, volume of sample injected, volume of standard gas sample used in the calibra- tion, calibration factor for C1, C2,C3 etc. determined by gc analysis of a standard gas sample, and the gc peak response.
The C1-C7 hydrocarbon content of the cuttings is determined by degasification of a mea- sured volume of cuttings (in a medium of a measured volume of water) in a closed blender, sampling of the air space at the top of the blender, and injection of a measured volume of gas into the gas chromatograph. The results of the C1-C7 air space and cuttings an- alyses are shown in Tables IA and IB.
. .
i

The C1-C7 hydrocarbon data from the air space and cuttings gas analyses are summed to give a llrestoredll C1-C7'hydrocarbon content of the cuttings. This data is recorded in TableLC and plotted on the well profile of Figure 1.
Organic Carbon
The total organic carbon content of a rock is a measure of its total organic richness. This data is used, in conjunction with visual kerogen and C1-C7 and G 1 s hydrocarbon content of a rock, to indicate the hydrocarbon source quality of rocks.
The procedure for determining the total organic carbon content of a rock involves dry- ing the sample, grinding to a powder, weigh- out 0.2729 gram sample into a crucible, acidizing with hot and cold hydrochloric acid to remove calcium and magnesium car- bonate, and carbon analysis by combustion in a Leco carbon analyzer.
We run several blank crucibles, standards (iron rings of known carbon content) and duplicate rock samples. in this analysis at no additional charge to the client for pur- poses of data quality control.
The organic carbon data is recorded in Table I1 and plotted in Figure 1.
CIS Soxhlet Extraction, Deasphaltening and Chromatographic Separation
The amount and composition of the organic matter which can be solvent-extracted from a rock, reflects source quality and source type. C13/C12 carbon isotopic, hi& mass spectrometric and gc analyses of the paraffin-naphthene and aromatic hydrocarbon fractions of the soluble extract gives data which is used in crude oil "parent rock correlations.
This analysis involves grinding of a dry rock sample to a powder and removal of the soluble organic matter by soxhlet extraction using a benzene-methanol solvent.. .Where the amount of available sample material permits, we like to use at least 100 grams of rock for this analysis.
The extracted bitumen is separated into an asphaltene (Asph) and a pentane soluble fraction by normal pentane precipitation. The pentane soluble components are separated into a saturate hydrocarbon (P-N), aromatic hydrocarbon (AROM) and nitrogen-sulfur- oxygen containing fraction (NSO) by adsorption chromatography on a silica gel-alumina column. Unfortunately, non-quantitative micro-chromatographic analyses had to be performed on all but one of the samples since they contained an insufficient amount of n-Cg soluble extract suitable for quantitative liquid chromatography.
All (31% compositional data is reported in Table JII.
ii

GC Analysis of CIS Paraffin-Naphthene Hydrocarbons
The content and molecular composition of the heavy CIS paraffin-naphthene hydrocarbons of rocks, as determined by gc analysis, reflects source quality, source type and degree of thermal maturation.
In this analysis, we subject a very small fraction of the total amount of the P-N fraction extracted from a rock sample to gc analysis. The gas chromatograph.is a Varian Aero- graph Model 1400 equipped with a solid rod injection system and a eutectic column.
The chromatographic traces are shown in Figure 2 and the compositional data obtained for the C15+ saturate hydrocarbon is reported in Table IV.
In this study, the calculated C. P. I. (carbon preference index) values for the normal paraffin data, is defined as the mean of two ratios which are determined by dividing the sum of concentrations of odd-carbon nnmbered n-paraffins by the sum of even-carbon numbered n-paraffins. The C. P. Indices A and B were obtained by the formulas:
These C. P. I. values are recorded in Table N.
Visual Kerogen
A visual study of kerogen, the insoluble organic matter in rocks, can indicate the rela- tive abundance, size, and state of preservation of the various recognizable kerogen types and thereby indicate the hydrocarbon source character of a rock. The color of the kero- gen can be used to indicate the state of thermal maturity of the sediments (i. e. their time-termperature history). Thermal maturation plays an important role in the genera- tion of hydrocarbons from organic matter, and also affects the composition of reser- voired hydrocarbons.
Our procedure for visual kerogen slide preparation.involves isolation of.the organic matter of a rock by removal of the rock material with hydrochloric and hydrofluoric acid treatment and heavy liquid separation. This procedure is comparable to that used
iii

by the palynologist except it does not include an oxidation stage. (The oxidation treat- ment is deleted from our procedure because it removes a great deal of kerogen and blanches any remaining kerogen to an extent whereby it is useless for our kerogen color observations). The kerogen residue is mounted on a glass slide and is examined visually under a high power microscope. The kerogen assessment is noted in Table V.
iv

FIGURE 1
SUMMARY OF ORGANIC ANALYSES
CI-CT HYDROCARBON ORGANIC CARBON CONTENT E ~ E C T R ~ C A L L O G Cl-Cq HYDROCARBON %WETNESS C5-C7 HYDROCARBON
I I
I I
I
1
A
B
00
25 50 15 - I I I I
' I I I I
1 I
I
I I I I -
25 50 75
I I I
I I
I I I ' I I I I I I I
I I

FlGURT2- ~
I -005 -006 N
A
Is- -014
-016
I . -009 -011
B.
t - NO (IUANTITATIVE DATA
-014 -016
* "~ "