Embed Size (px)
Citation preview

A CRITICAL ANALYSIS OF THE 1,9-DIMETHYLM ETHYLENE BLUE ASSAY
FOR SULFATED GLYCOSAMINOGLYCANS IN SYNOVIAL FLUID
A Thesis
Presented to
The Faculty of Graduate Studies
of
The University of Guelph
bv
STACEY WARREN
In pam'al fulfillment of requirernents
for the degree of
Master of Science
August 2000
@ Stacey Warren, 2000

National Library 1*1 of Canada Bibliothèque nationale du Canada
Acquisitions and Acquisitions et Bibliographie Services sewices bibliographiques 395 Wellington Street 395. rue Wellington Ottawa ON K1A ON4 ûitawaON K1A ON4 Canada Canada
YOM fik Votm dferenœ
Our lYe Nom réfdrence
The author has granted a non- L'auteur a accordé une licence non exclusive licence allowing the exclusive permettant à la National Library of Canada to Bibliothèque nationale du Canada de reproduce, loan, distribute or sell reproduire, prêter, distribuer ou copies of this thesis in microform, vendre des copies de cette thèse sous paper or electronic formats. la forme de microfiche/nùn, de
reproduction sur papier ou sur format électronique.
The author retains ownership of the L'auteur conserve la propriété du copyright in this thesis. Neither the droit d'auteur qui protège cette thèse. thesis nor substantial extracts fkom it Ni la thèse ni des extraits substantiels may be printed or otherwise de celle-ci ne doivent être imprimés reproduced without the author's ou autrement reproduits sans son permission. autorisation.

A CRITICAL ANALYSIS OF THE 1,9-DIMETHYLMETHYLENE BLUE ASSAY FOR SULFATED GLYCOSAMINOGLYCANS I N SYNOWAL FLUID
Stacey Warren University of Guelph, ZOO0
Advisor: Dr. Mark. B. Hurtig
Joint disease in racehorses, specifically osteoarthritis, has been under
intense scrutiny for the past decade in an attempt to identify clinical marken of
disease. While much information has been colleded concerning the biochemical
composition of articular cartilage and synovial fluid (SF) in normal and diseased
joints, no pathognomonic marker for cartilage breakdown has been found to
date. A cornrnon test performed on synovial fluid is the 1,9-dimethylmethylene
blue (DMMB) assay, which is used to estimate the amount of proteoglycan (PG)
by measuring sulfated glycosarninoglycans @GAG). Preliminary experimentation
found the DMMB assay to be problematic. This study was therefore designed to
analyze three variants of the DMMB assay (the Farndale method, the microplate
DMMB assay, and the indirect DMMB assay), and to introduce a new, solid phase
DMMB assay. With this new assay, a simple biochemical characterization of
equine synovial fluid sarnples from diseased and non-diseased joints was
perforrned to begin creating a "synovial fluid profile".
ACKNOWLEGEMENTS
1 could not have completed this project without the assistance of many people. 1
would first like to thank the large animal surgeons at the University of Guelph for
colleding synovial fiuid samples; Dr. Don Trout, Dr. Nathalie Coté, Dr. Simon Pearce,
Dr. Antonio Cruz, and Dr. L. Bouré. 1 would also like to thank Dr. Robert McMartin and
staff from McMaitin, Duncan, and Associates, Dr. Darryl Bonder and staff from the
Toronto Equine Hospital, and Dr. Marc Desjardins, and Dr. Bernard Kretrxhmar and
staff frorn the Ilderton Equine Hospital for providing synovial fiuid samples during
a rthroscopic surgery.
Thank you Dr. Jon LaMarre and Ms. Patsy Heuther for use of the laboratory and
equiprnent, and Dr. Brenda Coomber, Mr. Robert Braham, and Mr. John Burger for use
of their microplate readers. 1 would like to thank Mr. William Sears, Ms. Anne Valiant,
and Ms. Gabrielle Monteith for their assistance with rny statistical analyses. Thank you
Dr. Stephen Kruth, Ms. lennifer Wright, Mr. James Mastin, and Dr. Physick-Sheard for
your assistance.
1 sincerely thank Dr. Rory Todhunter from the Department of Clinical Science,
College of Veterinary Medicine, Cornell University, and his technician Ms. Margaret
Vernier-Singer, and Dr. Nancy 1 Burton-Wurster from the Baker Institute of Animal
Health, Cornell University for allowing me to visit their laboratory, and for their ongoing
assistance over the past year.

I would also like to thank Dr. Chris iittle from the Connective Tissue Biology
Laboratories, Cardiff School of Biosciences, Cardiff University for his assistance, and the
generous gift of CSC standards and the antibodies.
Finally, 1 would like to thank my committee rnembers, Dr. Robert A. Keates, and
Dr. JH (Tim) Lumsden for their insight, and assistance. Most importantly, 1 would like
to thank my supervisor, Dr. Mark Hurtig, for his unfailing guidance, assistance, and
encouragement over the past several years. 1 would not have achieved this goal
without his support.

DECLAMIION OF WORK PERFORMED
I declare that al1 work presented in this thesis was performed by rnyself, with the
exception of the response test in Chapter 2, which was performed by Jennifer Wright.
iii

TABLE OF CONTENTS
ABSTRACT ACKNOWLEDGEMENTS DECLAMON OF WORK PERFORMED TABLE OF CONTENTS LIST OF TABLES LIST OF FIGURES LIST OF ABBREVIATIONS
CHAPTER 1: INTRODUCTïON AND LITERATURE R M E W 1.0 Introduction 1.1 Sumrnary of goals and hypothesis 1.2 Literature review
Diarthroidal joints Normal hyaline articular cartilage The extracellular rnatrix
A. Collagen B. Glycosaminoglycans
Chondroitin sulfate (CS) Keratan sulfate (KS) Hyaluronic acid (HA)
C. Proteoglycans Large proteoglycans Srnal l proteog lycans
D. Non-collagenous proteins of the ECM The chondrocytes Tissue turnover in the equine joint Synovial fluid Osteoarthritis/degenerative joint disease Intra-articular chip fractures Articular cartilage and synovial fiuid changes in diseased joints Sig nificance
References
CHAPTER 2: MANUSCRIPT 1
A Comprehensive Analysis of the 1,9-dimethylmethylene Blue Assay
Abstract Introduction Materiais and Methods
PAGE
i iii iv viii lx xiii
2 4 5 6 7 10 10 13 14 14 15 17 17 18 19 21 21 25 25 26 27
28 29
32
33 34 40

Materials Sample collection and preparation Dye preparation Farndale method (spectrophotornetric assay) Microplate DMMB assay Indirect DMMB assay Reaction of DMMB with various standards DMMB saturation assay Response test Nucleic acids as interfering substances Enzymatic digestion of synovial fluid sam ples Assay variability Sta tistical analysis
Results Reaction of DMMB with various standards DMMB saturation assay Response test Nucleic acids as interfering substances Enzymatic digestion of synovial fluid samples Assay vanability
Discussion Reaction of DMMB with various standards DMMB saturation assay Response test Effect of nucleic acids on the DMMB assays Enzymatic digestion of synovial fluid samples Assay variability
References
CHAPTER 3: MANUSCRIPT 2
Introduction and Validation of A New, Solid Phase 1,9- dimethylmethylene Blue Assay
Abstract Introduction Materials and Methods
Materials Sample collection and preparation Dye preparation Development of a solid phase DMMB assay Preparation of a standard curve Reaction of DMMB with various standards DMMB saturation assay Response test

Nucleic acids as interfering substances Enzymatic digestiam of synovial fluid samples Assay varia bility Farndale method Cspectrophotornetric assay) Microplate DMMB assay Statistical analysis
Results Development of a solid phase DMMB assay Preparation of a standard curve Reaction of DMMB. with various standards DMMB saturation assay Response test N ucleic acids as interfering substances Enzyrnatic digestiom of synovial fluid samples Assay variability
Discussion Development of a solid phase DMMB assay Preparation of a standard curve Reaction of DMMB with various standards DMMB saturation assay Response test Nucleic acids as interfering substances Enzymatic digestioin of synovial fluid samples Aaay variability
References
CHAPTER 4: MANUSCRIPT 3
Analysis of Equine Synovial Fluid From Diseased and Mon-Diseased Joints
Summary Introduction Materials and Methods
Materials Sarnple collection and preparation Measurement of GAG Solid Phase DMMB assay Microplate DMMB assay Farndale DMMB assay Protein concentratiton Statistical analysis
Resu I b Sample Collection Measurement of sGAG

Protein concentration Nucleated cell counts
Discussion Sample collection Measurement of sGAG Protein concentration Nucleated cell counts
References
CHAPTER 5: GENERAL DISCUSSION, CONCLUSIONS, AND 174 FUTURE STUDIES
MASTER REF ERENCE LIST 178
vii

LIST OF TABLES
Page CHAPTER 2:
Table 1: Source of equine synovial fluid sarnples. 43
Tabie 2: Equation of lines, and R' values for each standard curve 56 that was created by altering sample to dye volume ratios.
Table 3: Equations of the lines for curves generated by adding 60 known amounts of CSC to two synovial fiuid samples, and a papain bla n k.
CHAPTER 4:
Table 1: Details concerning the equine synovial fluid samples 138 included in this study
Table 2: Composition of the equine synovial fluid sarnples, 156 including protein (determined by hand refractometer, and the BioRad protein assay), and nucleated ceIl counts (NCC).
Table 3: Summary of information from seven studies measuring 165 the amount of sGAG, white blood cells (WBC), and total protein (TP) in equine synovial fluid samples from joints with various disease conditions, and normal joints.

LIST OF FIGURES
CHAPTER 1 Page
Figure 1: Structure of a synovial joint.
Figure 2: Cross section of articular cartilage illustrating the 4 histological zones, and the tidemark.
Figure 3: Structure of type II collagen.
Figure 4: Structure of chondroitin sulfate C (CSC, chondroitin-6- sulfate), and chondroitin sulfate A (CSA, chondroitin-4-sulfate).
Figure 5: Structure of keratan sulfate.
Figure 6: Structure of hyaluronic acid.
Figure 7: Structure of an aggregating proteoglycan.
Figure 8: Detailed stricture of the proteoglycan core protein with covalently linked glycosaminoglycan side chains.
Figure 9: Factors influencing the turnover of articular cartilage in response to trauma or inflammation.
CHAPTER 2
Figure 1: Chernical structure of 1,9-dimethylmethylene blue.
Figure 2: Titration of DMMB with CSC to illustrate the change in the absorption spectra from 450 to 750 nm.
Figure 3A: Standard curves for CSC, CSA, and KS as determined by the Farndale method.
Figure 38: Standard curves for CSC, CSA, and KS as determined by the microplate DMMB assay.
Figure 3C: Standard curves for CSC, CSA, and KS as determined by the indirect DMMB assay.

Figure 4A: Effed of adding a known amount of CSC to synovial fluid samples and a papain blank, as deterrnined by the Farndafe method.
Figure 48: Effect of adding a known amount of CSC to synovial fiuid samples and a papain blank, as determined by the rnicroplate DMMB assay.
Figure 4C: Effect of adding a known amount of CSC to synovial fluid samples and a papain blank, as determined by the indirect DMMB assay.
Figure 5: The effed of digesting samples of equine synovial fluid with DNase and RNase to determine if nucleic acids are important interfering substances.
Figure 6: The effed of enzymatic digestion of equine synovial fluid samples with hyaIuronidase, and papain.
Figure 7: A 4-20% linear SDS-PAGE was used to separate sarnples of SF that had been digested with various enzymes.
Figure 8: A 4-20% linear SDS-PAGE used to separate sarnples of SF that had been digested with various enzymes.
CHAPTER 3
Figure 1: Illustration of the line scan measurement (Northern Eclipse imaging program) that was utilized to determine the density of the dots.
Figure 2: Series of dots prepared from CSC by a new, solid phase DMMB assay to determine the linear range of the assay.
Figure 3: Standard curve prepared from CSC by the solid phase DMMB assay to make a standard curve for ensuing experimentation.
Figure 4: Comparison of the standard curves obtained by the solid phase DMMB assay aRer the dots were scanned in colour, or in black and white (B&W).

Figure 5: Comparison of the standard curves obtained by the solids phase DMMB assay immediately after preparation (lom of May), and again foilowing a two month period of time (20" of July
Figure 6: Standard curve prepared with a subset of CSC standards that was used in ensuing experirnentation.
Figure 7: Standard curves for CSC, CSA, and Kç as determined by the solid phase DMMB assay.
Figure 8: Effed of altering the sample to dye volume ratio in the solid phase DMMB assay.
Figure 9: Correlatîon between exogenous administration of CSC and the amount of sGAG measured in the sample.
Figure 10: Comparison of the effect of DNase and RNase digestion on equine synovial fiuid samples, as determined by three variants of the DMMB assay.
Figure 11: Measurement of sGAG in two synovial fluid sarnples (1 and 2) that had been digested with Strepomyces hyaluronidase (hence Hl and HZ), papain (Pl and PZ), or both enzymes sequeniially (BI and 82).
CHAPTER 4
Figure 1: A chip fracture of the distal lateral radius of a hone. The severity of this lesion is somewhat representative of the types of lesions included in this study.
Figure 2A: sGAG concentration of equine SF sarnples #1-17 as determined by the solid phase DMMB assay, the Farndale method, and the microplate DMMB assay.
Figure 28: sGAG concentration of equine SF samples #18-34 as determined by the solid phase DMMB assay, the Farndale method, ,
and the microplate DMMB assay.
Figure 3: sGAG in equine SF samples presented according to disease status.

Figure 4: sGAG concentration of equine synovial fluid samples 152 presented according to the joint frorn which the samples were collected.
Figure 5: sGAG concentration in horses with various joint 153 pathologies.
Figure 6: sGAG concentration in the four non-diseased control 154 horses.
Figure 7: Correlation between the hand refractometer and BioRad 157 protein assay: Two methods that were used to determine protein concentrations in synovial fiuid.
Figure 8: Cornparison of the protein (BioRad protein assay) 158 concentrations of synovial fluid samples from diseased and non- diseased joints.
Figure 9: Relationship behiveen protein and sGAG content of 159 synovial fluid.
Figure 10: Nucleated cell counts in diseased and non-diseased 161 joints.
xii

LIST OF ABBREVïATïONS
h Pg PI A AC AI K(S04)2- 1 2H20 B&W C6S CBC COMP CPII CS c4s CS846 CS A CSC C DJD dl DMMB DNA DNase E.C. ECM EDTA G Gl,2,3 GAG gai galNAc glcUA GIY H20 HA HABR IL-1 KDa KS L
wavelength (lambda) micrograms microlitres absorbance articular cartilage aluminum monopotassiurn sulfate dodecahydrate black and white chondroitin-6-sulfate complete blood count cartilage oligorneric protein type II collagen propeptide chondroitin sulfate chondroitin-4-sulfate chondroitin sulfate epitope 846 chondroitin sulfate A chondroitin sulfate C carboxy degenerative joint disease decalitres 1,9-dimethylmethylene blue deoxyri bonucleic acid deoxyri bon uclease enzyme commission number extracellular matrix ethylenediamine tetraacetate grams globular domain 1, 2, 3 g lycosam inog lycan galactose galactosamine g lucuronic acid glycine Water hyaluronic acid hyaluronic acid binding region interleu kin-1 kitodalton keratan sulfate litres
xiii
M mA mg mJ ml MMP Mr NCC NCP nm OA OCD PG PGE2 PMN Proc mixed RNA r Pm SAS SDS SDS-PAGE SF sGAG s0q2- T2C TEMED TïMP TNFa TP U UV v/v w/v WBC
molar rnilliangstromes milligrarns milliJoules millilitres matrix metalloproteinase rnean relative mass nucleated cell counts nitrocellulose paper nanometer osteoarthritis Osteochondritis disecans proteolgycan prostaglandin E2 polymorphonuclear cell Procedure mixed model ANOVA ri bonucteic acid revolutions per minute Statistical Analysis Systern sodium dodecyl sulfate sodium dodecyl suflate polyacrylamide electrophoresis synovial fluid sulfated glycosaminoglycan sulfate type II collagen tetramethylethylenediamine tissue in hibitor of metalloproteinases tumour necrosis factor alpha total protein units (enzyme) ultraviolet volume per volume weight per volume white blood cell
xiv

CHAPTER 1: INTRODUCTION AND LIïERATURE R M E W
1.0 INTRODUrnON
Joint disease in racehorses, specificaily osteoarthritis (OA), has been
under intense scrutiny for the past decade by a myriad of research groups.
These groups are not only attempting to elucidate the underlying mechanisms of
the disease process, but they are also endeavoring to identify markers to be
used as diagnostic tools for joint disease. While a substantial arnount of
information has been collected concerning the biochernical composition of
articular cartilage and synovial fluid (SF) in both normal and diseased joints, no
definitive marker of OA has been acknowledged to date.
This project was initially designed to characterize the biochemical
constituents of synovial fluid, with an emphasis on immunological assays.
Antibodies against chondroitin sulfate, keratan sulfate, link protein, cartilage
oligorneric protein, type 1 and II collagen, and decorin were included in this
proposed project. We aspired to answer the question "are there any changes in
the concentrations of these molecules in synovial fluid collected from diseased or
healthy joints?" It was also proposed that synovial Ruid could be examined by
mass spectrornetry: A novel technique in the field of connedive tissue research.
Not unlike other research groups, we began Our analysis by rneasuring
sulfated glycosaminoglycans (GAG) as a basic first step toward characterizing
Our equine SF samples. It soon became obvious, however, that the underlying
mechanism of the widely used 1,9-dimethylmethylene (DMMB) dye binding assay
was not well understood, and that differing opinions concerning interfering
substances, and enzymatic digestion were ubiquitous. The question of the
suitability of the DMMB assay for estimating sGAG in biological fluids was put
forth. Therefore, our new objective was directed towards validating currently
employed variants of the DMMB assay. Moreover, the persistent instability of the
sGAG-dye complexes (even in the rnost recently modified versions of the DMMB
assay) proved to be the stimulus for the development of a new, more convenient
method of measuring sGAG.
A further concern regarding our initial proposal was the notion that no
single marker of joint disease is useful in the analysis of SF sarnples for the
estimation of health versus disease. Instead, we propose that a synovial fluid
profile, akin to a complete blood count (CBC) or blood biochernistry profile would
be a more meaningful way to define biochemical parameters. This synovial fluid
profile would enable researchers to more accurately, and univenally assess the
disease status of a joint. This theory is substantiated by the fact that no clear
association increases or decreases in any one component of SF has been
identified to date, even after years of intensive research.
This thesis presents a basic review of joint anatomy and physiology,
concentmting on the biochemical composition of equine articular cartilage and .
synovial fluid. I n first series of experiments, three commonly used variants of
the DMMB (the Farndale method, the microplate DMMB assay, and the indirect
DMMB assay) are critically assessed. This was accomplished by measuring the

response of DMMB to various sGAG standards, altering sample to dye volume
ratios, performing a response test, and measuring sGAG in synovial ffuid samples
that had been digested with various enzymes (including nucleases, papain, and
hyaluronidase). I n chapter 3, a new solid phase DMMB assay is presented. This
assay was validated and critically assessed (using the same experiments as
outlined in Chapter 2), and compared to the Farndale method and microplate
DMMB assay. In the final chapter, va rious biochemical parameters (total sGAG,
total protein, and nucleated cell counts) of equine synovial fluid samples that
have been collected from both healthy and diseased joints were measured. The
results of these studies are interesting, and further contribute to the
understanding of joint disease.
1.1 STATEMENT OF GOALS AND HYPOTHESIS
Quantitation of proteog lycans (PG) in biolog ical fluids, including synovial
fluid, is typically achieved by measuring sulfated glycosarninoglycans (GAG): a
routine laboratory test. While some research groups have identified an increase
in sGAG in diseased joints, in general, no clear association between the sGAG
content of synovial fluid (SF) and joint pathology has been identified to date.
This frustrating result may, in part, be explicated by the fact that the
DMMB assay is problematic. Preliminary studies perforrned by this laboratory
(not included in this thesis) identified discrepancies between three variants of the
DMMB assay in their ability to quantifying sGAG. Moreover, some of the basic
features of the assay (such as reaction with control reagents, identification and
management of interfering substances in SF, and the enzymatic digestion of SF-
samples prior to addition of DMMB) do not appear to have a clear scientific basis
warranting their widespread use. Thus, the objectives of this project are three
fold. First, three DMMB protocols (the Farndale method, the microplate DMMB
assay, and the indirect DMMB assay) will be evaluated and their ability to
quantitate sGAG in equine synovial fluid samples will be assessed. Second, a
new solid phase 1,9-dimethylmethylene blue assay will be presented and
critically assessed in a analogous fashion to the three other DMMB assays
presented in this thesis. Finally, the solid phase assay will be applied to clinical
samples of synovial fluid to measure total sGAG.
1.2 LXTERATUREREVIEW
Equine arthritis is a generic term commonly used
of entities such as developmental (osteochondrosis),
in reference to a nurnber
traumatic, or infectious
conditions. Osteoarthritis (OA), or degenerative joint disease (DJD), refers to a
groups of disorders characterized by alterations in articular cartilage metabolism,
leading to a physical degeneration of the cartilage, accompanied by changes in
the bone, and soft tissues of the joint (McIlwraith 1996; Todhunter et al. 1993;
Todhunter e t al. 1997). The study of OA is important in veterinary medicine
since joint injury and joint disease are major causes of lameness in athletic
horses. Lameness, in turn, is the most important cause of attrition in these
horses (Rossdale etal 1985; Fuller etal. 1996; Mdlwraith 1996; Brama etal
1999) .
D/arthroida/ Juin&
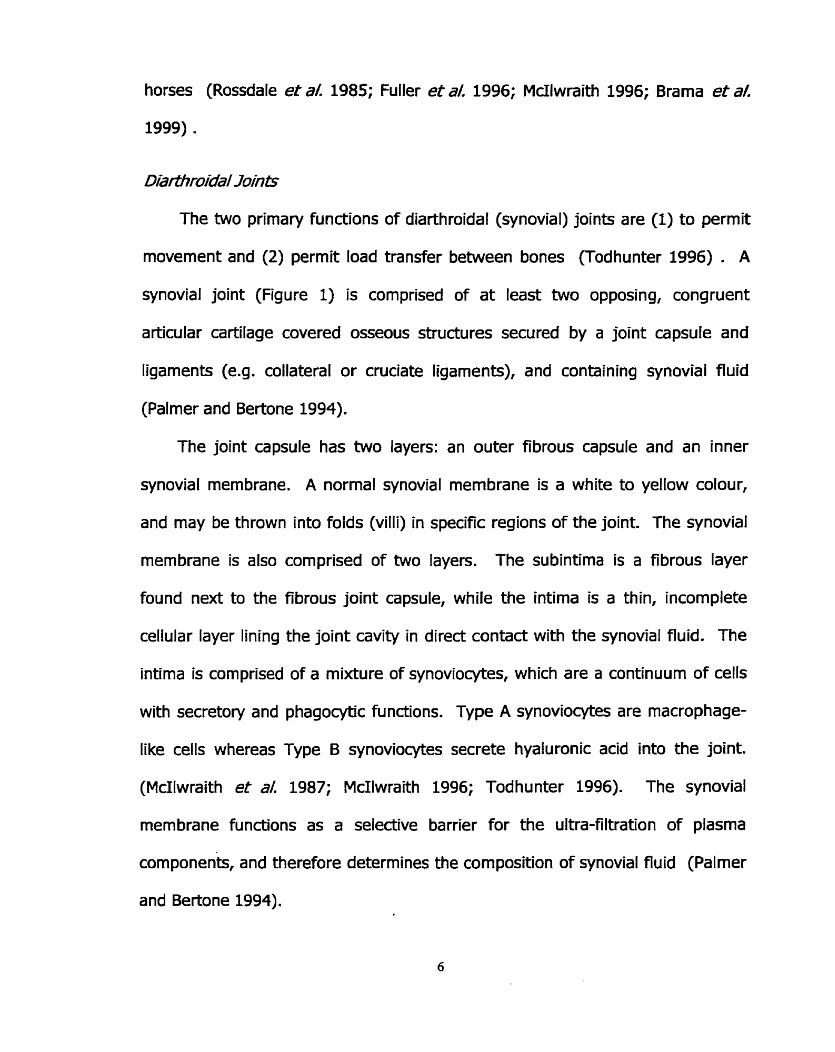
The two primary functions of diarthroidal (synovial) joints are (1) to permit
movement and (2) permit load transfer between bones (Todhunter 1996) . A
synovial joint (Figure 1) is comprised of at least two opposing, congruent
articular cartilage covered osseous structures secured by a joint capsule and
ligaments (e.g. coilateral or cruciate ligaments), and containing synovial fiuid
(Palmer and Bertone 1994).
The joint capsule has two layers: an outer fibrous capsule and an inner
synovial membrane. A normal synovial membrane is a white to yellow colour,
and may be thrown into folds (villi) in specific regions of the joint. The synovial
membrane is also cornprised of two layers. The subintima is a fibrous layer
found next to the fibrous joint capsule, while the intima is a thin, incomplete
cellular layer lining the joint cavity in direct contact with the synovial fluid. The
intima is comprised of a mixture of synoviocytes, which are a continuum of cells
with secretoty and phagocytic functions. Type A synoviocytes are macrophage-
like cells whereas Type B synoviocytes secrete hyaluronic acid into the joint.
(McIlwraith et al. 1987; McIlwraith 1996; Todhunter 1996). The synovial
membrane fundions as a selective barrier for the ultra-filtration of plasma
components, and therefore determines the composition of synovial fluid (Palmer
and Bertone 1994).
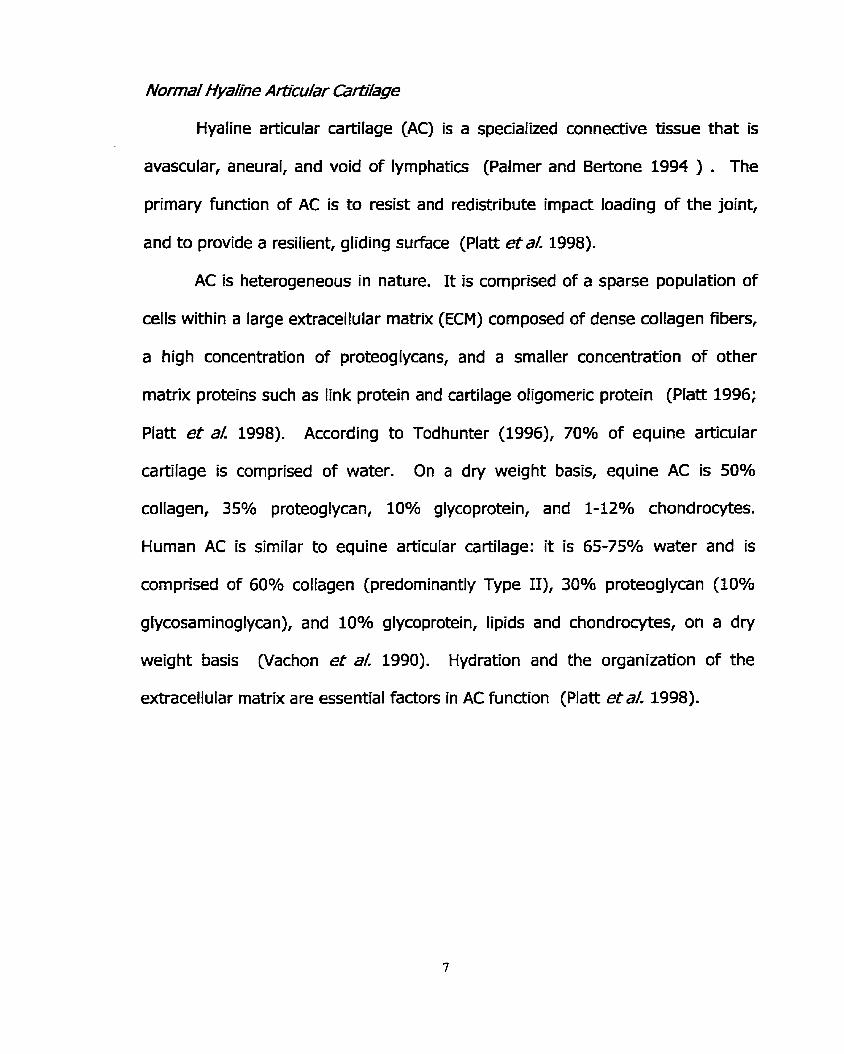
Nurma/ HyaKne Arücu/ar adage
Hyaline artïcular cartilage (AC) is a specialized connective tissue that is
avascular, aneural, and void of lymphatics (Palmer and Bertone 1994 ) . The
primary function of AC is to resist and redistribute impact loading of the joint,
and to provide a resilient, gliding surface (Platt etal. 1998).
AC is heterogeneous in nature. It is cornprised of a sparse population of
cells within a large extracellular rnatrix (ECM) composed of dense collagen fibers,
a high concentration of proteoglycans, and a smaller concentration of other
matrix proteins such as Iink protein and cartilage oligomeric protein (Platt 1996;
Platt et al: 1998). According to Todhunter (1996), 70% of equine articular
cartilage is comprised of water. On a dry weight basis, equine AC is 50%
collagen, 35% proteoglycan, 10% glycoprotein, and 1-12% chondrocytes.
Hurnan AC is similar to equine articular cartilage: it is 65-75% water and is
comprised of 60% collagen (predominantly Type II), 30% proteoglycan (10%
glycosaminoglycan), and 10% glycoprotein, lipids and chondrocytes, on a dry
weight basis (Vachon e t a/. 1990). Hydration and the organization of the
extracellular matrix are essential factors in AC function (Platt e t a/. 1998).
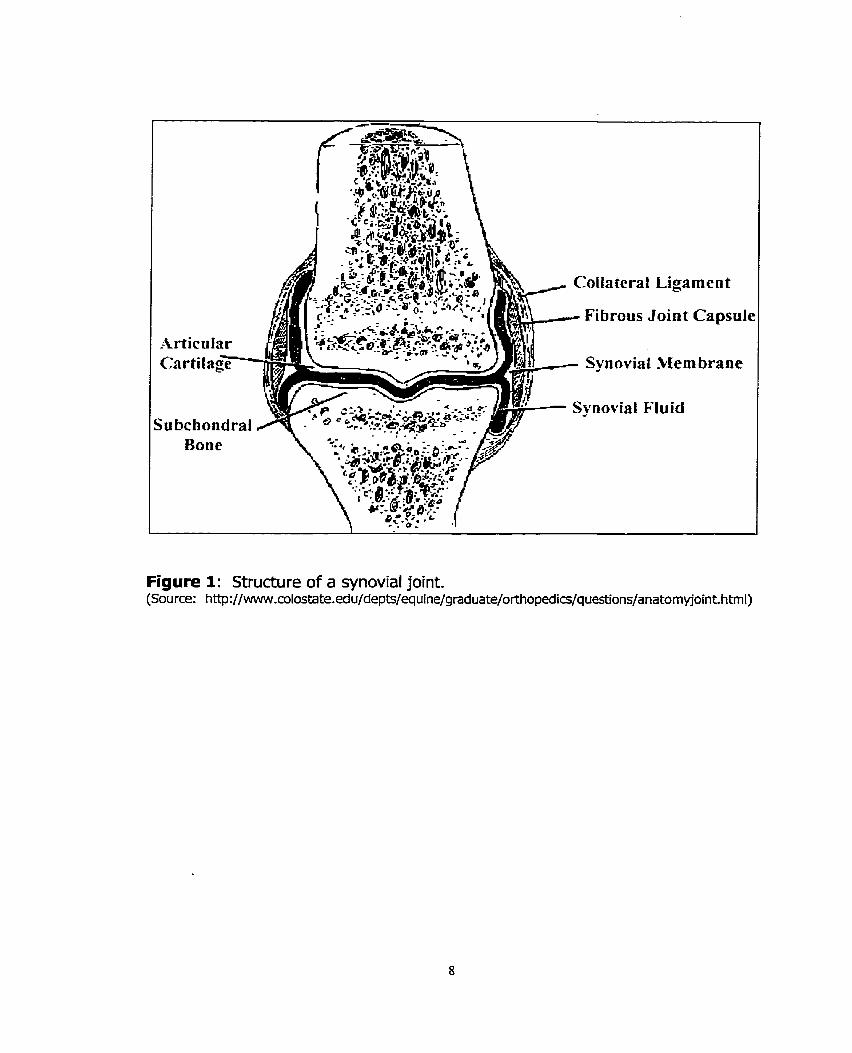
Figure 1: Structure of a synovial joint. (Source: http: //www.colostate.edu/depts/equine/graduate/orthopedics/queçtions/anatomyjoint. html)

As illustrated in Figure 2, AC is divided into four distinct histoiogical zones
(McIlwraith 1987; Palmer and Bertone 1994). The first three are unmineralized
zones, while zone N is a deeper, calcified cartilage layer separated from the first
three zones by a tidemark that is observable on histological sections (Todhunter
1996). The lower portion of zone IV, the cernent Iine (not illustrated in Figure
2), is formed during endochondml ossification of the articular epiphyseal growth
plate.
Zone 1, the superficial or tangential zone, has the highest cell density.
The cells are Rat, small, and their long axis lay parallel to the articular surface.
The collagen fibrils also appear predominantly tangential to the surface. Zone II,
the transitional or intermediate zone, has larger and rounder cells. The intricate
three-dimensional network of collagen is obvious, with many fibrils oriented
perpendicular to the surface. In zone III, the radiate zone, the cells are larger
still and lay with their long axis perpendicular to the surface. The large collagen
fibrils in both zones III and N lay perpendicular to the surface and form a rigid
mesh (Todhunter 1996). According to Todhunter (1996), these differences are
not clearly demarcated. Rather, a gradua1 change from one zone to another
occurs. Furthermore, the structural changes that occur from the superficial to
deeper cartÎlage layen represent functional changes. For example, the
superficial layer is proposed to be a wear-resistant, protective "dia ph rag m" to
withstand tension in the plane of the articular cartilage surface. The deeper
zones, however, are believed to be important in resisting compressive loading .

Thus, the cells and collagen fibrils are oriented perpendicular to the articular
surface. Other zona1 changes include the composition of specific
rnacromolecules. For example, the concentration of PGs increases with
increasing depth of the cartilage, whereas collagen is more concentrated at the
surface (Todhunter 1996).
The E&%xe//u/a/ar Ma fnir
A. Co//agen
The collagen family is a diverse group of glycoproteins cornprised of 16
genetically distinct molecules encoded by more than 30 genes. Despite their
genetic diversity, al1 collagens have a unique triple helix structure in common,
and are al1 an integral part of the extracellular matrix (Ayad 1994).
The primary function of this collagen is to afford tensile strength to
articular cartilage (Todhunter 1996; Brama et a/. 1999). Approximately 85 to
90% of the total collagen found in equine AC is type II, while the balance is
comprised of type VI, IX, XI, XII, and XN. Type II collagen (TZC) is a
homotrimer, designated 3 ai(II), with each polypeptide chain having
approxirnately 1000 amino acid residues (Platt 1996; Todhunter 1996). As
illustrated in Figure 3, each al chain has a left-handed helical configuration, but
the three chains wrap around each other to forrn a right-handed super helix
(Ayad 1994). R C has a 67 nm repeat banded fibril structure, and resembles
other fibril forming collagens, including Type 1.

Tidc litic-
Figure 2: Cross section of articular cartilage illustrating the 4 histological zones, and the tidemark. [Source: http://www.colostate.edu/depts/equine/gmduate/orthopedi~~/questions/anatomoint. htm]

Figure 3: Structure of type II collagen. This figure, presented as a bal1 and stick model, illustrates the three al chains (orange, green, and blue), each having a lefk handed helical configuration. The three individual chains wind around each other to form a right handed superhelix. [Source: http://www.rcsb.org/pdb/cgi/expIore.cgi?pid=lO77696~85892~age=O~bId=lBB~

Like al1 collagens, equine R C has a primary sequence of Gly-X-Y where
22% of the X and Y are proline and/or hydroxyproline, respectively (Platt 1996).
Every third arnino acid in the primitive helix (glycine) faces the core of the triple
helix structure. Additionally, the high content of hydroxyproline is important
since it is responsible for the stabilization of the triple helix via formation of
hydrogen bonds (Ayad 1994). During synthesis of TZC, proline and lysine
residues are hydroxylated to form hydroxyproline, and hydroxylysine,
respectively. These are important in the production of hydroxylysylpyridinoline
and lysylpyridinoline crosslinks (Brama etal. 1999).
Differences between various collagens exist in the degree of glycosylation
at hydroxylysyl residues, the length of the triple helix, and whether the triple
helix is continuous or interrupted by one or more non-helical domains (Ayad
1994).
B. Glycosaminog lycans (GAG)
GAGs are a family of linear polymers of repeating disaccharides. Keratan
sulfate, chondroitin-4-sulfate, chondroitin-6 sulfate, and hyaluronic acid are
important GAGs in articular cartilage
The sulfated GAGs consist of two structural regions: a linkage region to
attach to a protein core (via glycosidic linkage between the carbohydrate
polymers and serine or threonine residues of the core protein), and a repeating
disaccharide region. This latter region is typicaliy heterogeneous due to

variations in sulfation patterns (Lehninger et al. 1993). Most GAGS contain
uronic acid, and are highly sulfated, which irnparts a high negative charge to the
moiecules. Glycosaminoglycans fundion to draw water into articular cartilage
and expand the collagen rnatrix (Palmer and Bertone 1994).
Chondroitin Sulfate (CS)
CS is a repeating polymer of D-glucuronic acid and D-galactosarnine
(g lcUA-p l,3-galNAc) where the disaccharides are joined by P-1,4 g lycosidic
linkages (Figure 4). This molecule can be sulfated at either the 4 or 6 position of
galactosamine via an O-sulphate linkage. Typically, a single chain has stretches
of 4-sulfation (hence chondroitin-4-sulfate, or chondroitin sulfate A) followed by
stretches of 6-sulfation (hence chondroitin-6-sulfate, or chondroitin sulfate C),
however, there may be regions where no sulfation occurs, or other regions that
have both 4- and 6-sulfation. The mean relative rnass (Mr) of CS is ZOkDa,
which is equivalent to approximately 20-60 disaccharide units (Wright et al:
1991; Lehninger et& 1993; Ayad 1994). Chondroitin sulfate C is predominantly
found in adult cartilage whereas chondroitin sulfate A is found in immature
cartilage (McIlwraith 1987).
Keratan Sulfate (US)
KS (Figure 5) is cornprised of a repeating disaccharide of D-galactose and
D-glucosamine (gal-P-1,4-glcNAc), with each disaccharide joined by a P-1,3

glycosidic linkage. Sulfàtion occurs at the sixth carbon of the galactosamine ring
via an O-sulfate linkage. Since uronic acid is absent, KS must connect to a core
protein either by attaching to aspartic acid via N- linked glycosidic linkages, or to
serine or threonine via 0- linked glycosidic linkages. The Mr of keratan sulfate is
SkDa, which is equivalent to 25 disaccharide units per chain (Wright et a/. 1991;
Ayad 1994).
Hyaluronic Acid (HA)
HA (Figure 6) is a polymer of B-D-glucuronic acid and N-acetyl-B-D-
glucosamine residues linked at the 1,3 and 1,4 positions, respedively (Saari et
al. 1989). Hyaluronic acid (HA) is a unique GAG because (1) it is not synthesized
attached to a core protein, and (2) it is not sulfated. Hyaluronic acid is an
integral component of both articular cartilage and synovial fluid (Saari et al.
1989). Synovial HA is produced by type 6 synoviocytes while chondrocytes
synthesize the hyaluronic acid found in articular cartilage (Mdlwraith 1996). HA
in AC has a Mr of approximately 3 x 10² to 2 x lo3 kDa (approximately 750-5000
disaccharide units) and accounts for 0.5 - 2.5% of the wet weight of AC. A large
arnount of HA is associated with aggrecan where roughly 100 aggrecan
molecules associate with a single HA chain (Todhunter 1996). The function of
HA in synovial fluid is discussed in more detail in an ensuing section.

Chondroitin 6 sulfate /
Chondroitin 4 sulfate
\
Figure 4: Structure of chondroitin sulfate C (CSC, chondroitin-6-sulfate), and - chondroitin sulfate A (CSA, chondroitin-4-sulfate).
Figure 5: Structure of keratan sulfate.
Figure 6: Structure of hyaluronic acid.
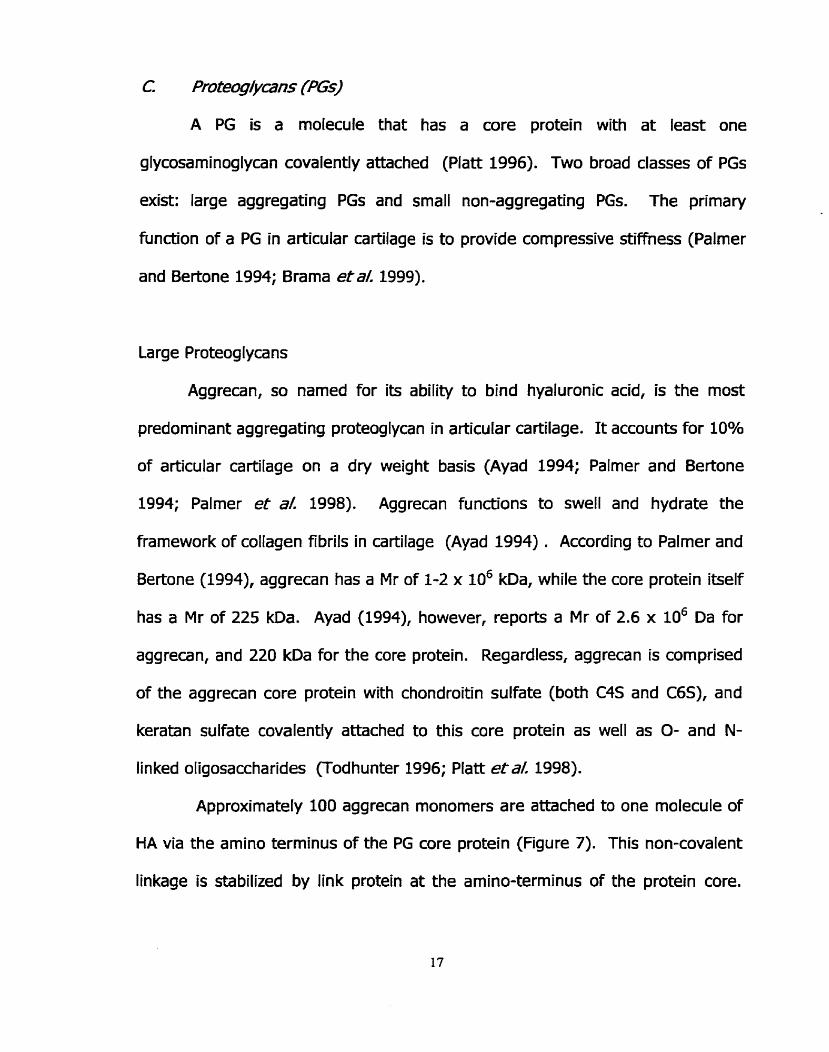
c Profeog/vwcs (PGs]
A PG is a molecule that has a core protein with at least one
g lycosaminog lycan covalent1 y attached (Platt 1996). Two broad classes of PGs
exist: large aggregating PGs and small non-aggregating PGs. The primary
fundion of a PG in articular cartilage is to provide compressive stifhess (Palmer
and Bertone 1994; Brama etaL 1999).
Large Proteog lycans
Aggrecan, so named for its ability to bind hyaluronic acid, is the most
predorninant aggregating proteoglycan in articular cartilage. It accounts for 10%
of artÏcular cartilage on a dry weight basis (Ayad 1994; Palmer and Bertone
1994; Palmer e t a/. 1998). Aggrecan fundions to swell and hydrate the
framework of collagen fibrils in cartilage (Ayad 1994) . According to Palmer and
Bertone (1994), aggrecan has a Mr of 1-2 x 10⁶ kDa, while the core protein itself
has a Mr of 225 kDa. Ayad (1994), however, reports a Mr of 2.6 x 10⁶ Da for
aggrecan, and 220 kDa for the core protein. Regardless, aggrecan is comprised
of the aggrecan core protein with chondroitin sulfate (both C4S and C6S), and
keratan sulfate covalently attached to this core protein as well as 0- and N-
linked oligosaccharïdes (Todhunter 1996; Platt etal. 1998).
Approximately 100 aggrecan monomers are attached to one molecule of
HA via the amino terminus of the PG core protein (Figure 7). This non-covalent
linkage is stabilized by link protein at the amino-terminus of the protein core.

This region is typically referred to as the hyaluronic acid binding region, HABR
uodhunter 1996; Platt etal 1998).
The aggrecan core protein is divided into several regions (Figure 8). Three
globular domains (G1 -4 are separated by "extended" protein domains. G1 and
Gz are located at the amino terminus, while Gj is located at the carboxy
terminus. G2 and G3 are separated by an extended region where sGAG side
chains are attached in one of three regions: the keratan sulfate-rich region, the
random CS-rich region, or the clustered CS-rich region (Tripple and Mankin
1993; Vilirn and Fosang 1993). Ayad (1994) reports that 87% of aggrecan is CS,
6% is KS, and 7% is protein on a dry weight basis by mass.
Small Proteog lycans
I n contrast to aggrecan, the small proteoglycans are non-aggregating PGs
that have a Mr of Iess than 200 kDa. Decorin, biglycan, and fibromodulin are
mernbers of this group. Biglycan, the major fetal srnall PG, has a core protein
(Mr 38 kDa) with one or two chondroitin or dermatan sulfate molecules bound to
the amino terminus (Palmer and Bertone 1994). The core protein of decorin (Mr
36.5 kDa), the predominant small PG in adult cartilage, has a single GAG chain of
either CS or DS at the amino terminus (Palmer and Bertone 1994; Platt et a/.
1998). Fibromodulin has KS chains in the central region of the molecule and has
highly sulfated tyrosine residues at the amino terminus (Palmer and Bertone
1994).

According to Todhunter (1996), there is a limited understanding of the
function of these small PGs in AC. Todhunter does agree with Platt et& (1998),
however, that decorin and fibrornodulin may bind type 1 and II collagens, and
may play a role in regulating fibrillogenesis, fibril diameter, and collagen
organization.
D. Non-co//agenous pro feins of the ECM
A significant nurnber of non-collagenous proteins exist, although the
function of most remains unclear. The most widely understood non-collagenous
protein is the link protein. Three forms of this protein have been identified, with
apparent molecular weights of 48, 44, and 41 kDa. As previously discussed, the
function of link protein is to bind non-covalently to a specific site near the amino
terminus of the aggrecan core protein, and to hyaluronic acid in order to stabilize
the interaction between these two molecules. This is especially important with
extreme conditions (pH, temperature, mechanical forces), and in the presence of
dissociating agents (Dudhia and Platt 1995). Other non-collagenous, non-
proteoglycan ECM proteins include chondronectin (Mr 180), fibronedin (Mr 220),
and various structural proteins ranging in molecular weight from 36-69 kDa
(Todhunter 1996).

Figure 7: An aggregating proteoglycan is comprised of a hyaluronic acid backbone that is non-covalently Iinked to approximately 100 proteoglycan molecules. [Source: http://www.colostate.edu/depts/equine/graduate/orthopedics/questions/anatomyjoint.htm]
Ke ratan Sulfafe - Rich
Reg ion Hyolurcmic Acid
1 rn I Chondroitin Sulfate-Rich Region
Binding Region
H yoluronic, Acid Link DoC'n~in
? rote in T 7
Figure 8: Detailed structure of the proteoglycan core protein with covalently linked glycosaminoglycan side chains. The core protein interacts with the hyaluronic acid backbone through the hyaluronic acid binding region (HABR). This interaction is stabilized by link protein. [Source: Trippel and Mankin 19931

The Chondrocyfes
The properties of articular cartilage are derived from the composition and
structure of the extracellular matrix (Todhunter 1996). The chondrocytes, which
make up a very srnaIl percentage of AC, regulate the composition of the entire
extracellular matrix (ECM) by modulating the synthesis and catabolism of
proteoglycans and collagen. ECM turnover is crucial for rnaintaining an optimal
composition of ECM components (Platt et a/. 1998). Since AC is devoid of
vasculature, nerves, and lymphatics, the chondrocytes obtain nutrients (e.g.
oxygen, glucose, amino acids), receive chemical and hormonal stimuli, and
remove waste produN by diffusion to and from the synovial fluid. The size,
shape, charge, and PG concentration in AC affect the rate of diffusion of
nutrients into the articular cartilage from the synovial Ruid; molecules larger than
hemoglobin (>69 kDa) are typically excluded from cartilage. The pumping action
of weight bearing is also believed to facilitate diffusion (Todhunter 1996).
ir/ssue Turnover in Me Equine Joint
Articular cartilage undergoes continual remodeling involving degradation
and synthesis of the pericellular, territorial, and interterritorial matrix (Todhunter
1996). While the turnover of collagen in adult human AC is 350 years, turnover
of aggrecan is rnuch faster: approxirnately 1800 days (Todhunter 1996).
The slow turnover of collagen may be related to its structure since fibril
formation and cross-linking provide few sites for enzymatic cleavage. Matrix

metalloproteinases (MMP) 1 and 2 are the only enzymes known to cleave the
triple helix of type II collagen. I n contrast to collagen, aggrecan is sensitive to
enzyrnatic cleavage, especially between the G1 and G2 globular domains. This
cleavage results in the loss of the carboxy (C) terminal region of the molecule,
which diffuses out of the cartilage into the synovial fluid (Todhunter 1996, Little
etal 1999).
Two factors that appear to accelerate turnover of matrix components are
(1) dynamic load and (2) the action of cytokines such as interleukin-1 (IL-1) and
tumor necrosis factor alpha (TNFa). These factors influence the production or
activation of chondrocytïc enzymes that degrade the ECM. In contrast, inhibitors
of matrix metalloproteinases [referred to as tissue inhibitors of rnatrix
metalloproteinases (TIMP), such as TIMP 1 and 21, and up-regulation of growth
factors counter balance dynamic loading and the action of cytokines (Mdlwraith
1996). The sequence of molecular events involved in the synthesis,
organization, and turnover of the ECM of AC is tightly controlled by the
chondrocytes. I n response to pathologie processes, there is a failure in the
maintenance of normal homeostatic mechanisrns of the ECM (Platt 1996).
The cornplex interaction of the factors involved in articular cartilage
turnover is illustrated in Figure 9. Trauma or inflammation of synovial
membrane, articular cartilage, or subchondral bone results in the release of IL-1
and TNFa, important mediators of joint disease. In turn, these cytokines result
in the up-reguiation of the matrix-degrading enzymes matrix metalloproteinases.

Prostaglandin (PGE2) and free radicals are also released in infiamed joints due to
IL-1 stimulation (McIlwraith 1996).
As alluded to previously, MMPs are important components in the
degeneration of the AC matrix, especially MMP-3 and MMP-1. MMP-3
(stromelysin), produced by chondrocytes and the synovium, can act upon a wide
range of substrates, including aggrecan, decorin, fibromodulin, link protein, and
procollagens. MMP-1 (collagenase) is synthesized by macrophages, fibroblasts,
synoviocytes, chondrocytes, and endothelial cells. The primary substrates of
MMP-1 are type 1, II, II, VII, and X collagens (Mdlwraith 1996). MMPs are
secreted as latent pro-enzymes that require protease activation. For example,
plasmin, a serine protease, can activate stromelysin, which can then adivate
collagenase (Mdlwraith 1996).

novia1 membrane
Articuiar cartilage
Figure 9: Factors influencing the turnover of articular cartilage in response to trauma or inflammation [Source: http: //www.colostate.edu /depts/equine/g/oint. htm]
Synov/a/ F/uM
Synovial Ruid (SF) is an ultrafiltrate of the plasma that normally contains
less than 500 nucleated cells per microlitre, and a high concentration of
hyaluronic acid (0.5 mgfml). Due to the high concentration of HA, synovial fluid
is viscous in nature. The primary fundions of synovial fluid are to lubricate and
proted the joint, and to supply nutrients to articular cartilage (Palmer and
Bertone 1994; Todhunter 1996).
Within the SFf the prirnary roles of hyaluronic acid include: space-filling,
lubrication, absorption of some of the energy generated by movement, and to
support transient sheer stresses (Todhunter 1996). Other proposed fundions of
HA include: rnodulating chernotactic, proliferative, and phagocytic responses of
inflammatory ceils, inhibiting the release of PGs from cartilage, regulating
oxidative damage, endogenous stimulation of interleukin-1, and the regulation of
the rate of proliferation of endothelial celis and fibrobiasts (Saari e t a/. 1989;
Tulamo et& 1994).
OsteoaTtiF7rris//oesmtive JoiM Dkedse (OA/DJD)
As previously defined, osteoarthritis refen to a group of disorders
characterïzed by a progressive and permanent deterioration of articular cartilage.
The changes in AC are typically accompanied by changes in the subchondral
bone as well as the soft tissues of the joint (McIlwraith 1996; Tularno e t a/.
1996).

Whife acute injuries in athletic horses do not, by definition, fall under the
category of osteoarthritis, the traumatic injury in conjunction with inflammation
of the synovial membrane, joint capsule and ligaments cornrnoniy lead to OA
(McIlwraith 1996). Traumatic joint injuries represent one of the most cornmon
problems in horses and include synovitis, capsulitis, articular cartilage and bone
fractures, and ligament tearing (McIlwraith 1996). These injuries lead to
osteoarth ritis if left u ntreated or are treated inadequately.
InPa-artïcu/ar ch@ fracfures
Intra-articular chip fractures represent one of the prevailing reasons for
arthroscopie surgery (McIlwraith and Bramlage 1996). The most commonly
affected joints include the carpus and fetlock, and less commonly the pastern,
coffin, and hock (Rossdale et a/. 1985; Brama et a/. 1999). Within the carpus,
the most commun fracture sites appear to be the dorsal boarder of the radial
facet of the third carpal bone and its opposing surface, the distal radiocarpal
bone (Firth e t a/. 1999; Lucas et a/. 1999). Chip fractures are problematic
within the joint due to physical disruption of the articular surface, release of bone
debris at the fracture site causing synovitis, formation of 'kissing lesions' on the
opposing articular surface, and via release of inflammatory mediators
(McIlwraith 1996). Again, if leR untreated, or in response to an inadequate
treatment, intra-articular fractures may lead to the development of OA
(Mdlwraith and Bramlage 1996).
Alticu//ar Càm7age and Synovial F/uid Changer in Diseased Joints
The analysis of changes occurring in articular cartilage and synovial fiuid
in OA affected joints has been of great interest for several years due to
widespread agreement that the equine industry is in need of a sensitive, specific,
and reproducible method of measuring disease activity. Armed with these
'markers" of joint disease, clinicians would then be able to assess the severity of
disease, select an appropriate treatrnent regime and monitor the response to
these treatments, prevent the development of OA, predid future athletic
performance, and identify mechanisms of OA at the rnolecular level (Okumura
and Fujinaga 1998; Todhunter etal. 1997).
KS, CS, Type II collagen propeptide, link protein, and cartilage oligomeric
protein have al1 been clairned to be markers of disease activity in OA affected
joints (Myers et a/. 2000). Total sGAG, total protein, total white blood cell
counts, and HA concentration of synovial fluid have also been evaluated as
markers of joint disease (Saari et al. 1989; Alwan et a/. 1990; Alwan et a/. 1991;
Todhunter et al. 1993; Tulamo et al. 1994; Palmer et a/. 1995; Fuller et al. 1996;
Todhunter et a/. 1997; Tulamo etal. 1996; Frisbie et a/. 1999). To date, findings
remain controversial, and no ciear marker of osteoarthritis has been
acknowledged.

As previously explained, there is a need for laboratory rnarkers of the
disease processes related to the underlying pathological mechanisms. To date,
no reliable method for measuring disease adivity related to the degree of joint
damage exists. By analyzing several cartilage breakdown produds in synovial
fiuid, a 'synovial fiuid profile' can be created for both normal and diseased
joints. The advent of rapid, reliable, and non-invasive methods of analyzing
synovial fluid for abnormal components to evaluate equine OA is of paramount
importance. This would impact the field of veterinary medicine immensely since
lameness, osteoarthritis in particular, is the major cause of attrition in athletic
horses.
*

REFERENCES
Alwan WH, Carter SD, Bennett D, Edwards GB. 1991. Glycosaminoglycans in horses with osteoarthritis. Equine Vet 3 23:44-7.
Alwan WH, Carter SD, Bennett D, May SA, Edwards GB. 1990. Cartilage breakdown in equine osteoarthritis: measurement of keratan sulphate by an EUSA system. Res Vet Sci 49:56-60.
Ayad S. 1994. The Extracelluar Matrix Factsbook. Toronto, Academic Press.
Brama PA, TeKoppele 3M, Bank RA, van Weeren PR, Barneveld A. 1999. Influence of site and age on biochemical characteristics of the collagen network of equine articular cartilage. Am 3 Vet Res 60:341-5.
Dudhia J, Platt D. 1995. Complete primary sequence of equine cartilage link protein deduced from complernentary DNA. Am J Vet Res 56:959-65.
Firth EC, Delahunt 3, Wichtel JW, Birch HL, Goodship AE. 1999. Galloping exercise induces regional changes in bone density within the third and radial carpal bones of Thoroughbred horses. Equine Vet J 31: 111-5.
Frisbie DD, Ray CS, Ionescu M, Poole AR, Chapman PL, McIlwraith CW. 1999. Measurement of synovial fluid and serum concentrations of the 846 epitope of chondroitin sulfate and of carboxy propeptides of type II procollagen for diagnosis of osteochondral fragmentation in horses. Am J Vet Res 60:306-9.
Fuller Cl, Barr AR, Dieppe PA, Sharif M. 1996. Variation of an epitope of keratan sulphate and total glycosarninoglycans in normal equine joints. Equine Vet J 28:490-3.
Lehninger A.L., Nelson D. N., Cox M. M Eds 1993. Principles of Biochemistry 2nd edition. New York, Worth Publishers.
Little CB, Flannery CR, Hughes CE, Mort JS, Roughley PJ, Dent Cr Caterson B. 1999. Aggrecanase versus matrix metalloproteinases in the catabolism of the interglobular domain of aggrecan in vitro. Biochem 3 344 Pt 1:61-8.
Lucas JM, Ross MW, Richardson DW. 1999. Post operative performance of racing Standardbreds treated arthroscopically for carpal chip fractures: 176 cases (1986-1993). Equine Vet J 31:48-52.

Mdlwraith C.W. 1996. General Pathobiology of the Joint and Response to Injury. In: Mdlwraith C.W., Trotter G.W Eds. Joint Disease in the Horse. Philadelphia, W.B. Saunders Company.
Mdlwraith CW. 1987. In: Adams OR, Stashak TS. Adam's Lameness in Horses. Philadelphia, Lea and Febiger.
Mdlwraith C.W., Bramlage L.R. 1996. Surgical Treatment of Joint Injury. In: Mdlwraith C.W., Trotter G.W. Eds. Joint Disease in the Horse. Philadelphia, W.B. Saunden Company.
Mdlwraith CW, Yovich JV, Martin GS. 1987. Arthroscopic surgery for the treatment of osteochondral chip fractures in the equine carpus. 3 Am Vet Med Assoc 191:531-40.
Myers SL, Brandt KD, Albrecht ME. 2000. Synovial fluid glycosaminoglycan concentration does not correlate with severity of chondropathy or predict progression of osteoarthritis in a canine cruciate deficiency model. J Rheumatol 27:753-63.
Okumura M, Fujinaga T. 1998. Establishment of a monoclonal antibody (1/14/16H9) for detedion of equine keratan sulfate. Am J Vet Res 59: 1203-8.
Palmer JL, Bertone AL. 1994. Joint structure, biochemistry and biochemical disequilibrium in synovitis and equine joint disease. Equine Vet 3 26:263-
Palmer 31, Bertone AL, Malemud Ur Mansour 3. 1998. Changes in third carpal bone articular cartilage after synovectomy in normal and inflamed joints. Vet Surg 27:321-30.
Palmer JL, Bertone AL, McClain H. 1995. Assessrnent of glycosaminogIycan concentration in equine synovial fiuid as a market of joint disease. Can J Vet Res 59:205-12.
Platt D. 1996. Isolated Chondrocyte and Cartilage Explant Culture Systems as Techniques to Investigate the Pathogenesis of Equine Joint Disease. In: McIlwraith C.W., Trotter G.W. Eds. Joint Disease in the Horse. Philadelphia, W.B.Saunders Company.
Platt D, Bird JL, Bayliss MT. 1998. Ageing of equine articular cartilage: structure and composition of aggrecan and decorin. Equine Vet 3 30:43-52.
Rossdale PD, Hopes R, Digby NJ, offord K. 1985. Epidemiological study of wastage among racehorses 1982 and 1983. Vet Rec 116:66-9.

Saari H, Konttinen YT, Tulamo RM, Antti-Poika 1, Honkanen V. 1989. Concentration and degree of polymerization of hyaluronate in equine synovial fluid. Am J Vet Res 50:2060-3.
Todhunter RJ. 1996. Anatomy and Physiology of Synovial Joints. In: Mdlwraith C.W., Trotter G.W. Eds. Joint Disease in the Horse. Philadelphia, Pennsylvania, W.B.Saunders Company.
Todhunter R1, Fubini SL, Freeman KP, Lust G. 1997. Concentrations of keratan sulfate in plasma and synovial Ruid from clinically normal horses and horses with joint disease. J Am Vet Med Assoc 210:369-74.
Todhunter RJ, Yeager AE, Freeman KP, Parente EJ, Lust G. 1993. Keratan sulfate as a marker of articular cartilage catabolism and joint treatment in ponies. Am J Vet Res 54: 1007-16.
Tripple SB, Mankin Hl. 1993. Articular Cartilage Healing. In: Bojrab MJ. Ed. Disease Mechanisms in Srnall Animal Surgery 2nd edition. Pennsylvania, Lea and Febiger.
Tularno RM, Heiskanen T, Salonen M. 1994. Concentration and rnolecular weight distribution of hyalumnate in synovial fiuid from clinically normal horses and horses with diseased joints. Am 3 Vet Res 55:710-5.
Tulamo RM, Houttu 3, Tuparnaki A, Salonen M. 1996. Hyaluronate and large molecular weig ht proteoglycans in synovial fiuid from horses with va rious arthritides. Am 3 Vet Res 57:932-7.
Vachon AM, Keeley MI, Mdlwraith CW, Chapman P. 1990. Biochemical analysis of normal articular cartilage in horses. Am 3 Vet Res 51:1905-11.
Vilim V, Fosang AJ. 1993. Characterization of proteoglycans isolated from associative extracts of human articular cartilage. Biochem J 293 : 165-72.
Wright TN, Heinegard DK, Hascall V.C. 1991. Proteoglycans: Structure and Function. In: Hay E. D. Ed. Cell Biology of Extracellular Matrix 2nd edition. New York, Plenum Press.

CHAPTER 2: MANUSCRIPT 1
A Comprehensive Analysis of the 1,9-dimethylmethylene Blue Assay
To be su bmitted to Anaf'jdfii Biochemistry

ABSTRACT
The 1,9-dimethylmethylene blue (DMMB) assay is widely used to measure
sulfated glycosaminoglycans (sGAG) in a variety of tissues (such as articular
cartilage), and body fluids. Initial attempts of employing the DMMB assay were
thwarted due to dye instability and precipitation of sGAG-dye complexes out of
solution. Over the past twenty years, several variants of the DMMB assay have
been developed, and include the spedrophotometric assay (the Farndale
method), a microplate DMMB assay, and an indirect DMMB assay. The purpose
of this study was to compare the three different DMMB assays in their ability to
measure sGAG in synovial fluid (SF). Ali three assays were similar in their
reaction with chondroitin sulfate A and Cf and keratan sulfate, response to
altering sample volume to dye ratios, and recovery studies. I n contrast to other
findings, it was found that DNA and RNA are not important interfering substances
in SF, and that papain and hyaluronidase digestion are not interchangeable. The
sGAG in identical SF samples digested with papain were significantly higher
compared to hyaluronidase digested samples (p=0.029). Furthermore, al1 three
assays afforded different measures of sGAG in identical SF samples (P<
0.00028). I n light of these findings, it is clear that a new DMMB is required that
accurately measures sGAG in SF.

INTRODUCTION
Proteoglycans (PGs) are a family of macromolecuies that contain a core
protein, with one or more covalently bound glycosarninoglycan (GAG) chains
(33). GAGs are a f'amily of linear disaccharide polyrners localized in the
extracellular matrix of articular cartilage attached to a core protein (i.e. in the
form of a proteoglycan), or found free within synovial fluid (16). Chondroitin
sulfate (CS) and keratan sulfate (KS) are sulfated glycosarninoglycans (sGAG),
and, therefore, highly negatively charged. Hyaluronic acid (HA) is a non-sulfated
g lycosaminoglycan. Not surprisingly, great structural diversity exists among
GAGs due to variations in chain length, and sulfation pattern. The function of
sGAG is to draw water into the cartilage and expand the collagen matrix resulting
in the ability of the tissue to resist compression in weight bearing joints (4;16).
CS is the predominant sGAG on a single proteoglycan rnolecule. There are
about 100 chains per core protein concentrated along approximately 60% of the
polypeptide chain in the "CS-rich region". In contrast, the KS chains are
concentrated in the "KS-rich region" which is limited to the amino terminus of the
core protein. Both KS and CS are attached to the core protein via covalent
linkages (33).
Since collagen and proteog lycans (PG), and therefore glycosarninoglycans,
are major targets of degradative enzymes in diseases such as osteoarthritis (41,
it is imperative that researchers possess the means to precisely quantify
proteoglycans in both healthy and diseased joints. This can be achieved by

rneasurhg sGAG in articular cartilage, or in a variety of body fluids such as
synovial fluid, blood, or urine (15).
Historically, PGs were measured by their uronic acid content via the
carbazole method (4;25). According to Gold (9), this was deemed an
inconvenient assay because it is both labour intensive and time consurning.
Other methods of quantifying sGAG also proved to be time consuming and
tedious. For example, sGAG content could be quantified by rnixing samples with
the dye alcian blue, and measuring the copper content of the sGAG-dye
complexes by atomic absorption spectroscopy (9).
I n an attempt to rneet researchers' demands for a rapid, simple assay
using readily available equipment, many groups undertook the onerous task of
creating an easy, sensitive, and repeatable assay to quantify PG as sGAG. For
this purpose, researchers' attention was directed to spedrophotometric assays,
including the dimethylmethylene blue assay.
1,9-dimethylrnethylene blue (DMMB) was introduced as a new thiazine
dye by Taylor and Jeffree in 1969 (Fig. 1). While initially intended for
histochemistv, DMMB was rapidiy recruited for rneasuring sGAG by adding the
positively charged dye to a solution containing negatively charged sGAG, and
rneasuring the absorbance of the resultant sGAG-dye complexes at 525-535 nm
(4-6).

FIG. 1. Chemical structure of 1,9-dimethylrnethylene blue.
beta
Wavelength (nm)
FIG. 2. Titration of DMMB with CSC to illustrate the change in the absorption spectra frorn 450 to 750 nrn. Legend indicates micrograms of CSC added to DMMB dye. This figure was created using data reported by.Templeton (1988), and confirmed by laboratory experimentation by S. Warren.

The DMMB assay is based on the property of metachromasia, which is the
colour change (from blue to pink) produced by combining thiazine dyes with
polyanions in biological tissues or fiuids (25). Thiazine dyes (i.e. a group of
biological blue dyes) Vary in their sensitivity to induction of metachromasia by
various chromotropes (24;25). Interestingly, DMMB was found to give a more
intense metachromasia than other thiazine dyes (such as Toluidine blue,
Methylene blue, and Azur B), and was therefore exploited for this characteristic.
As illustrated in Figure 2, a Kan of the DMMB dye from 450 to 750 nm reveals
two maxima: one at 648 nm, and the other at 593 nm (25). These are referred
to as the a, and p bands, respectively. The a band is believed to represent dye
monomer, while the P band represents dye dimer. Addition of any sGAG to
DMMB results in a decrease in intensity of these bands, and the appearance of a
new band (the mu band in Figure 2) at 525 nm. Upon addition of the non-
sulfated GAG hyaluronic acid, however, no mu band was produced, but a slight
quenching of the other two bands was observed (25).
Despite the f a d that connective tissue researchers use the DMMB assay
the world over in both human and animal research, the mechanism of the
reaction remains poorly understood. I n the study by Templeton (1988), three
expianations of the rnechanisms of metachromasia were provided. First,
metachromasia may be produced as a result of dye-dye interactions adjacent to
the polyanion. Secondly, it may be caused by electrostatic interactions between
chromophore and polyanion sites. Finally, disruption of the chromophore at the
nitrogen atom of the ring may be responsible for producing the phenornenon of
metachromasia. Templeton (1988) further suggests that an equilibrium exists
between the dye rnonomer and dimer and that interam-on of the dye with sGAG
produces a new absorbing species. This dye-sGAG complex removes dye from
the bulk solution phase, resulting in the dye monomer-dimer equilibrium to be
re-established at lower levels (which explains the decrease in the a and P bands
as the p band becornes more prominent). If this theory were correct, the alpha
and beta bands would decrease at the same rate. This theory was found to hold
true for CS and KS, but not HA. I n the case of HA, the P band decreases at a
faster rate than the a band (25).
Instability of the DMMB dye and precipitation of the sGAG-dye complexes
initially limited the usefulness of the DMMB assay until Farndale et a/. (1982)
stabilized the dye and sGAG-dye complex by replacing the dibasic
citrate/phosphate buffer with a formate buffer. The Farndale method was widely
accepted as a simple, reliable, reproducible, and sensitive assay for measuring
the sGAG content of tissues and Ruids (4;5;25). Unfortunately, the assay
remained problematic due to persistent instability of the sGAG-dye complexes.
Even under the new conditions, these complexes precipitated as soon as the
sGAG and dye were mixed, resulting in a slow, progressive fall in absorbance a t
535 nm during the first 10 minutes of the assay. Furthermore, the dye also
binds to the cuvettes requiring the use of disposable cuvettes or thorough rinsing
with methanol between each sample (5).

Among othen, Müller and Hanschke (1996) recognized the problems
inherent in the standard DMMB assay, and therefore developed an indirect
spectrophotornetric assay for GAG. This involved adding the DMMB dye to the
GAG solution, and allowing the sGAG-dye complexes to precipitate at room
temperature for thirty minutes. The sGAG concentration was determined by
measuring the change in absorbance of the DMMB solution at 595 nm.
I n addition to sGAG-dye complex instability, another problem reported by
Farndale et a/. (1982) was the identification of DNA, RNA, and hyaluronic acid
(HA) as interfering substances. Since these substances only resulted in
approximately a 20% change in absorbance (for a given mass) cornpared to the
chondroitin sulfate standard, it was concluded that these substances were
unlikely to significantly affect the samples. Similarly, the research group of Dey
et& (1992) reported that hyaluronic acid in concentrations less than 40 pg/ml
did not interfere in the DMMB assay. While hyaluronic acid does not impact on
sGAG measurements in articular cartilage or tissue extracts, the hyaluronic acid
concentration in synovial fluid is an important consideration since the
concentration of HA in SF is typically 0.5 mglm1 (26). If DMMB is added directly
to SF that has not been treated with hyaluronidase, a purple stringy precipitate is
observed, thereby rendering spectrophotometric analysis impossible. Thus,
treatment of samples with hyaluronidase or papain is required to quantitate
sGAG accurately in synovial Ruid (4). Interference by other polyanionic
molecules in biological fluids is also an important concern in the DMMB assay.

According to Dey e t a/. (1992), and Farndale et a/. (1982, 1986), high salt (0.5
M), and low pH (3.0) can be used to eliminate interference from DNA, and
hyaluronic acid. In synovial fluid, however, proteins and HA were found to
interfere in the assay even in these stringent conditions.
Discrepancies in the literature concerning the use of the DMMB assay as a
measure of G A G in biological fiuids are plentiful. The major issues involve
whether digestion of synovial fluid samples should be perforrned with either
papain or Saeptomyces hyaluronidase, and if nucleic acids are important
interfering substances. Secondary issues pertain to the effect of hyaluronidase in
SF: does HA actually read with dye or is it simply an interfering substance? In
order to address these issues, three published methods of quantifying sulfated
glycosarninoglycans in equine synovial fluid were evaluated. These include the
DMMB assay described by Farndale e t d (19821, the microplate DMMB assay of
Goldberg and Kolibas (1990), modified by Nancy Burton-Wurster (persona1
communication), and the indirect DMMB assay of Müller and Hanschke (1996).
MATERIALS AND METHODS
Ma terhk
Papain, N-acetyl-L-cysteine, chondroitin sulfate C, chondroitin sulfate A,
keratan sulfate, alcian blue 8GX, and 50% glutaraldehyde were purchased from
Sigma Chernical Company. The SmartSpec 3000, Mini Protean II electrophoresis
unit, sodium dodecyl sulfate (SDS), TEMED, and Precision prestained protein

marker were purchased from BioRad laboratories. Sôeptomycces hyaluronidase
was from Calbiochem. Sodium phosphate monobasic, formic acid, sodium
hydroxide, 4.5 mL spectrophotometry cuvettes, 96 well flat bottom plates
(Corning), sodium acetate, acrylamide, bis-acrylamide, ammonium persulfate,
glycine, glycerol, glacial acetic acid, silver nitrate, sodium carbonate, and
formaldehyde were purchased from Fisher Scientific. EDTA (disodium and
tetrasodium salts), and Tris ultra pure were purchased frorn ICN Biochemicals.
95% ethanol was from Commercial Alcohol, Inc., and the 1,9-dimethylmethylene
blue was from Aldrich Chemical Company. From Roche Diagnostics, DNase Type
1, grade II from bovine pancrease, and RNase A were purchased. EDTA coated
VACUTAINERS@ were from Becton Dickinson VACUTAINERS Systerns.
readers were used in this study. For the indirect DMMB assay,
Two plate
a Bio-Tek
Instruments Inc. modei EL311 (with a 600 nm filter) from Mandel Scientific was
used, while a Titertek Multiskan MCC microplate reader with a 540 nm filter from
Flow Laboratories was used for the microplate DMMB assay.
Samp/e Co//eeCun and PreparObn
Synovial fluid samples from diseased and non-diseased joints (Table 1)
were collected aseptically in EDTA-coated vacutainers. I n total, 4 samples from
3 horses frorn diseased joints were collected. These samples were collected
from patients undergoing arthroscopie surgery for various types of joint diseases.
The synovial fluid samples were centrifuged at 3,500 rpm for 30 minutes at 4OC,

the supernatants were decanted from the pellet, and stored in aliquots at -80°C
until tirne of analysis. Unless othenvise stated, al1 synovial fluid samples were
digested with an equal volume of papain (1 mg/ml) in papain digestion buffer
(0.69 g sodium phosphate monobasic, 0.0326 g N-acetyl cysteine, 0.076 g EDTA
tetrasodium salt, made up to 100 ml, pH 6.5) at 65°C for three hours.

TABLE 1. Source of equine synovial fluid samples.
1 14 1 TB 1 Mc 1 UC. Fracture of Ci.
Sample # 1 Age 1 Breed I
2 l 3 l T B I Mc 1 LIC. Chip fracture of Cr with kissing
Sex
4 11 1 SB 1 F 1 LH. OCD.
Description
3
Legend: TB = Thoroughbred; SB= Standardbred; Mc= male, castrated; F = filly; Ci = intermediate carpal bone; Cr = radiocarpal bone; C3= third carpal bone; RH = right hock; LH = left hock; RIC = right intercarpal joint; U C = left i n te rca r pa l joi nt; OCD = OsfeochondriOs disewns.
1 SB F lesiûn on C3. RH. OCD.

Dye Prepara~on The dye was prepared according to the method of Farndale e t a/. (1982).
5 ml of 95% ethanol was added to 16 mg of 1,9-dimethylmethylene blue for 30
minutes a t room temperature. 2 ml of formate buffer (1.54 ml formic acid, 2.94
ml 5N NaOH: made up to 500 ml, pH 3.5) was added, and the volume was made
up to 1 L with water. The resultant dye (A535 = 0.34) was stored protected from
light at room temperature for 2 months. While some groups maintain the dye at
4OC, Farndale et al. (1986) report that the dye colour fades at this low
temperature.
Farnd/e Me&?& (Spectropho foometc DMMB A s -
Equine synovial Ruid samples that had been digested with papain (or
other enzymes, if specified) were typically diluted 1:s with water (1 part synovial
fluid added to 4 parts water). A total volume of 250 pl was placed in 1.5 ml
eppendorf tubes. Directly prior to measuring the absorbance at 525 nrn on a
Smartspec 3000, the samples were transferred from the eppendorf to a
disposable spectrophotometry cuvette, and 2.5 ml dye was added. The samples
were gently mixed by inverting the cuvette 2-3 times. The sGAG content of each
synovial fluid sample was determined by comparison to a standard curve that
was prepared with each assay. The calibration curve was created by preparing
solutions containing O to 25 pg of CSC (from a 100 pg/ml stock solution in water)
in a final volume of 250 pl. All standards and samples were prepared and
assayed in triplicate, and appropriate blanks were included. For example, the
papain blank was prepared by making a 1:l dilution of papain (1 mg/ml) in
papain digestion buffer which was further diluted 1:s with water, and 250 pl was
mixed with 2.5 ml of DMMB dye.
Microp/ate DMMB Assay
This method is based on the method of Goldberg and Kolibas (1990), and
modified by Dr. Burton-Wurster (persona1 com munication). Samples of synovial
fluid were diluted with water 1:10 or 1:20 (i.e. 1 part SF added to 9 parts water,
or added to 19 parts water). 50 pl aliquots of diluted synovial fluid samples were
applied in triplicate to a 96 well flat bottom plate. Direbly prior to reading the
absorbance at 540 nrn on a 96 well microplate reader, 200 pL of DMMB dye was
added to each well. A calibration curve was prepared with every set of samples
by applying 50 pl solutions of CSC (containing O to 2 pg of CSC prepared from a
100 mg/ml stock solution in water), and applied to the microplate in triplicate.
Appropriate blanks were included, as described above.
Indirect SpectirophoOnefric Assay
I n 1.5 ml eppendorf tubes, synovial fluid sarnples were diluted (typically
1:5) with water to achieve a final volume of 100 pl. Standards were prepared in
a final volume of 100 pl ranging from O to 10 pg CSC (prepared from a 100
pg/rnl stock solution in water). 1.25 ml dye was added to each eppendorf tube,
and the resultant solution was vortexed thoroughly. After standing at room

temperature for 30 minutes, the tubes were centrifbged at 10, 000 rpm for 15
minutes. 200 pi of the supernatant from each sample and standard were applied
in triplicate to a 96 well ffat bottorn plate. The absorbance of the supernatant
was measured against the appropriate blanks at 600 nm on a 96 well microplate
reader.
ReaCaon ofDMM8 wifiFI Sfandards
The dye reaction in each of the three DMMB assays was calibrated by
reaction with a concentration series of standard sGAGs. Standards used were
CSC, CSA, and KS. 100 pg/ml stock solutions in water were prepared for each of
the three standards. O to 25 pg of each standard was assayed by the Farndale
method. The indirect assay was used to measure each standard from O to 10
pg, while the microplate assay was used to rneasure the standards in increasing
amounts ranging from O to 2 pg. Each concentration of each standard was
measured in triplicate for al1 three assays.

DMMB Saturation &y
This experiment was designed to evaluate if the sample to dye volume
ratios were important in the DMMB assay. Calculations for the standard curves
were prepared to determine specific sarnple volume to dye volume ratios, which
were 0.222, 0.1, and 0.038. I n the case of the Farndale method, the original
assay ratio was 0.1 while the original assay ratios of the indirect and microplate
DMMB assays were 0.08 and 0.25, respectively. A 100 pg/ml stock solution of
CSC in water was prepared. 0-25 pg CSC was assayed by the Farndale method.
The indirect DMMB assay was used to measure 1-10 pg CSC, while the
microplate DMMB assay was used to measure 0-2 pg CSC for each sample
volume to dye ratio. Each concentration of CSC a t each ratio was measured in
tri plicate.
Response Test
Appropriate dilutions of two synovial fluid digests (samples 1 and 2) were
determined for each assay so the readings would fall in the low-end of the
standard curve. Predetermined amountç of CSC from a 100 pg/ml stock solution
in water were added to the synovial fluid dilutions and papain blank, and the
sGAG content was measured. The sGAG rneasured in each sample and the
papain blank was plotted against the pg of CSC added and the equations of the
lines were determined. The slope and shape of the resultant curves were
assessed for interference and saturation, respectively.

Nuc/eÏc Ac-ds as InteHering Subsfancpc
Two synovial fluid samples (sample 3 and 4) were selected and divided
into two aliquots. One aliquot of each sample was digested with 100 pl of a 1
mg/ml stock solution of DNase per 1.5 ml of synovial fluid, and 100 pl of a 0.1
mg/ml stock solution of RNase per 1.5 ml of synovial fluid at 25OC for 30 to 60
minutes. This digestion was followed by papain digestion. The sGAG content of
the digests was then measured by each of the three DMMB methods. The
nuclease digested sGAG concentrations were compared to the non-nuclease
digested sGAG concentrations. Each sample was assayed three tirnes in triplicate
by each rnethod.
Enzymatr;~ DIgesfirün of SynovW F/uid Samp/pc
Two samples of equine synovial Ruid (sarnples 3 and 4) were each divided
into four aliquots. One aliquot was digested with 10 U/mI of Sfrepoomyces
hyaluronidase at 34OC for 1 hour, while the second aliquot was digested with an
equal volume of papain (1 mg/ml papain in papain digestion buffer) at 6S°C for 3
houn. The third aliquot was first digested with Sfrepfomyces hyaluronidase for 1
hour at 34OC foilowed by digestion with papain a t 6S°C for three hours, while the
fourth aliquot of each sarnple was digested with 100 pl of a 100 U/ml solution of
hyaluronidase at 37OC for 1 hour, then 65°C for three houn. The resultant
digests were measured by each of the three DMMB assays to determine their
sGAG concentration.

I n order to further compare the effects of the different enzymes on the
synovial fluid sain ples, both the digested and undigested samples u nderwent
analysis by sodium dodecyl sulphate polyacrylamide electrophoresis (SDS-PAGE),
followed by a stringent staining regime using alcian blue and silver stain. Briefly,
a 4-20% polyacrylamide gradient separating gel was prepared using a rnini-
PROTEAN II system. The gradient gel was created by hand by layering 1 ml
(from bottom to top) of 20941, 15%, 10% and 4% acrylamide solutions. Partial
mixing of the layers prior to polymerization linearized the gradient. Each
acrylarnide solution was prepared in 1.0 ml of 1.5 M Tris-HCI pH 8.8, 40p1 of
10% SDS, 20 pl of 10% ammonium petsulfate (APS), and 2p1 of TEMED. The
gradient gel was prepared in conjunction with a 3.6% stacking gel which
contained 3.1 ml HzO, 1.25 ml 0.5M Tris HCi pH 6.8, 600 pl Acrylamide/Bis-
acrylarnide (30% T, 2.67% C), 50 pl 10% SDS, 30 pl 10% APS, and 5 pl TEMED.
Equal volumes of sample each containing 4 pg of sGAG were loaded in 4x sample
buffer, after heating at 100°C for 10 minutes. 10 pl of Precision pre-stained
rnarker was run with every gel. SDS-PAGE was carried out at a constant current
of 40 mA for approximately 45 minutes, until the dye front had migrated off the
end of the gel. l x running buffer was prepared from a 5x stock (7.5 g Tris Base,
36 g glycine, 3 g SDS, made up to 500 ml, pH 8.3).
The gel was stained sequentially with alcian blue dye and silver stain, as
described by Maller e t a/. (1993). The alcian blue binds to the proteoglycans,
while silver stain visualizes proteins. For practical purposes, times and

temperatures recommended by Mdler et a/. (1993) were not stridly adhered to.
If the suggested temperature was >30°C, then the stain/wash solutions were
warrned in a microwave oven, and the exact temperatures were not deterrnined.
Thus, the solutions used in steps 1-15 were warmed briefly in a rnicrowave,
while the rernaining steps were carried out at room temperature. The
development step was not timed. Instead, the gel was transferred to the stop
solution once the gel had visibly developed to the desired extent. During al1
staining/washing steps described in the table below, only slight agitation was
provided since vigorouç agitation consistently damaged the gels. Transfer of the
gel from one staining chamber to another was achieved by the use of a spatula.
Assay Variabilify
Since the two proceeding experiments (Le. nucleic acids as interfering
substances, and enzymatic digestion of SF) were each performed three times in
triplicate, both the intra-assay variability (i.e. variability between the three trials),
and the inter-assay variability (variabiiity between the three DMMB protocols)
could be evaluated.
Staf;istirstirw/ Ana/ysk
Data were analyzed for norrnality using SAS Proc univariate. After
logarithmic transformation, data were then subjected to analyses using a mixed
mode1 analysis of variance (SAS Proc Mixed) to test for real differences due to
enzymes (nucleases, and papain or hyaluronidse) and assays (solid phase DMMB
assay, Farndale method, microplate DMMB assay). P < 0.05 was considered
significant. Adjusted mean differences were considered insignificant if the 95%
confidence intervals on the rneans captured zero (22).
RESULTS
Rea- of D M with Various Conbol Reagents
Figures 3A-C illustrate typical standard curves for KS, CSC, and CSA as
determined by each of the three DMMB assays. These figures reveal that the
three standard curves were different: CSC consistently resulted in most intense
metachrornasia (Le. CSC had the largest slope), whereas KS invariably had the
smallest slope, and CSA was intermediate. The ratios of the slope of CSA/CSC
were 0.93, 0.89, 0.92 for the Farndale rnethod, microplate, and indirect DMMB
assays, respectively. Likewise, the ratios of the slope of KS/CSC were 0.78, 0.87,
and 0.83.
All standard curves showed strong linearity within the given range ( R ~ >
0.99). The Farndale rnethod was found to be linear between O and 25 pg of
sGAG, which was the widest linear range of the four assays. The microplate
DMMB assay was linear between O and 2.0 pg of sGAG, while the indirect DMMB
assay was linear between 1 and 10 pg of sGAG. The Farndale, and indirect
assays each have a large scale on the y-axis, whereas the y-axis of the
micropiate assay is quite narrow: it only ranges from O to 0.3 absorbance un&.

DMMB SafuratKon Assy
With the exception of the indirect assay, altering the sarnple to dye
volume ratio had no effect on the standard curves. All other assays were similar
in their ability to induce metachromasia. These findings are made obvious in the
data provided below by examining the magnitude of the slopes (Table 2).
Response Test
The lines generated by plotting the sGAG measured in each synovial Ruid
sample and papain blank against the pg of CSC added al1 appeared linear
(Figures 4A-C). Table 3 provides the equations of each curve illustrated in
Figures 4A-C. The slope for each sample and papain blank were al1 less than 1,
indicating a reduced assay response in the presence of interfering compounds
present in clinical samples.

0 CSC CSA
e KS
5 10 15 20 25
Standard (micrograms)
Fig. 3A. Standard curves for CSC, CSA, and KS as deterrnined by the Farndale method.

* CSC CSA
0 KS
Fig. 38. Standard curves for CSC, CSA, and KS as determined by the microplate DMMB assay.

0 CSC n CSA
' e K S ;
Standard (micrograrns)
Fig. 3C. Standard curves for CSC, CSA, and KS as determined by the indirect DMMB assay.
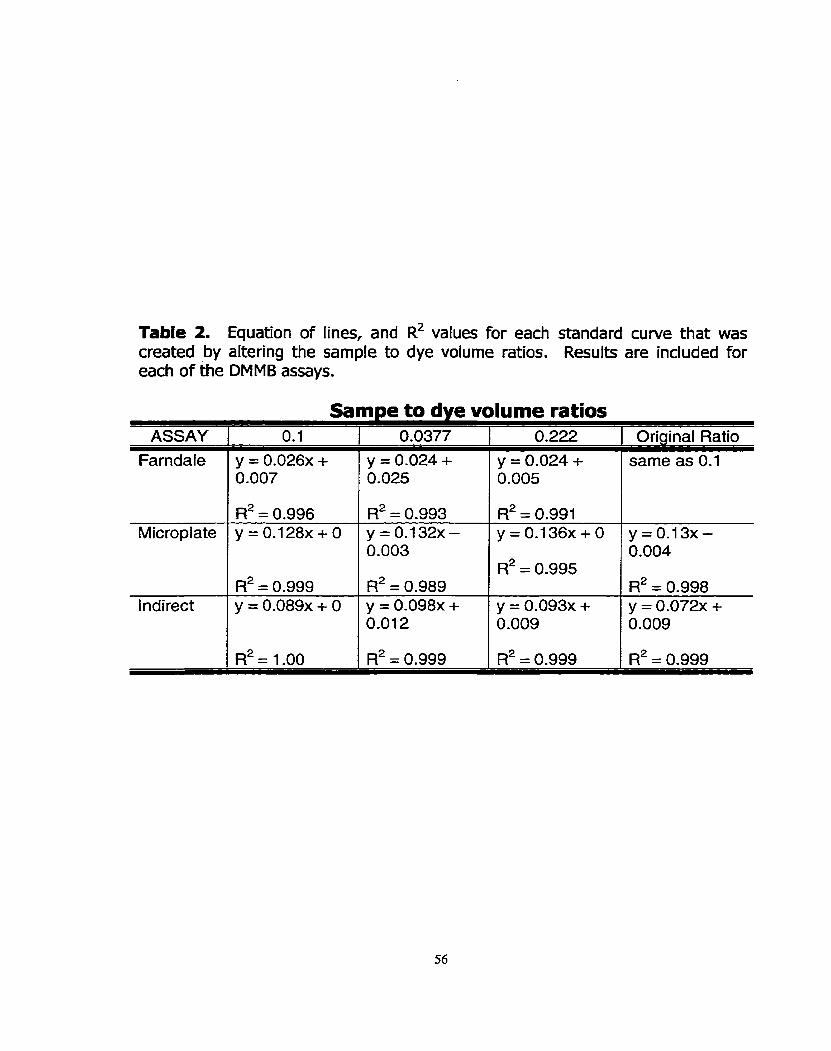
Table 2. Equation of lines, and R~ values for each standard curve that was created by altering the sample to dye volume ratios. Results are included for each of the DMMB assays.
Samne to dve volume ratios ASSAY 1 0.1 1 0.0377 1 0.222 1 Original Ratio
Farndale
Microplate
y = 0.026~ + 0.007
l ndirect
R2 = 0.996 y=0.128x+O
y = 0.024 + 0.025
R~ = 0.999 y = 0.089~ + O
y = 0.024 + 0.005
R2 = 0.993 y=0.132x- 0.003
Fi2 = 0.989 y = 0.098~ + 0.012
R~ = 0.991 y = 0 . 1 3 6 ~ + 0 p 0 . 1 3 ~ -
R2 = 0.995
y = 0.093~ + 0.009
0.004
R~ = 0.998 y = 0.072~ + 0.009

CSC added (miaograms)
Fig. 4A. Effed of adding a known amount of chondroitin sulfate C to synovial fluid sarnples and a papain blank. sGAG concentrations of the resultant solutions were determined using the Farndale method. The solid black line represents a perfect correlation between the amount of CSC added (pg) and the pg of sGAG rneasured (slope = 1).

- * Papain EI Sarnple 1
- . -- -- -- ---. . . -@-- -- .-. . .
,/ y --- A Sarnple 2
CSC added (micrograms)
Fig. 48. Effect of adding a known amount of chondroitin sulfate C to synovial fluid samples and a papain blank. sGAG concentrations of the resultant solutions were determined using the microplate DMMB assay. The solid black line represents a perfect correlation between the amount of CSC added (pg) and the pg of sGAG measured (slope = 1).

CSC added (microaramsl
Fig. 4C. Effect of adding a known amount of chondroitin sulfate C to synovial fluid samples and a papain blank. sGAG concentrations of the resultant solutions were determined using the indirect DMMB asçay. The solid black line represents a perfect correlation between the amount of CSC added (pg) and the pg of sGAG measured (slope = 1).

Table 3. Equations of the lines for Cumes generated by adding known amounts of CSC to two synovial fluid samples, and a papain blank.
ASSAY Farndale
Papain
Microplate
y = 0.98~ + 0.40
1 ndi rect
Sample 1
y = 0 .88~ + 0.12
Sample 2
y = 0.89~ + 10.73 y = 0.98~ + 11.73
y = 0.66~ + 0.97
y = 0.82~ + 4.24 y = 0.95~ + 0.39
y = 0.75~ + 0.96
y = 0.76~ + 4.46

Nucfeic aciis as hterfening SuOsfancnces
Figure 5 shows that there was no difference in sGAG concentrations between
synovial fluid sarnples that had, or had not, been digested with nucleases (p =
O. 19).
EnqmaOic D/gpCfion of Synov/a/ Huid
Samples of synovial fluid digested with papain alone gave higher values of
sGAG than the same samples digested with either hyaluronidase alone, or with
both enzymes sequentially. SF samples digested with both hyaluronidase and
papain typically gave intermediate results, while the SF samples digested with
hyaluronidase alone showed the lowest amount of sGAG (Figure 6). Sample 1
had a higher sGAG concentration in each assay, regardless of which enzyme was
employed. Samples digested with hyaluronidase at 34OC for 1 hour then 65OC
for three hours al1 had a stringy precipitate that persisted in the solution. This
data was therefore elirninated from al1 analyses. sGAG concentrations could not
be rneasured in undigested synovial fluid samples, due to the presence of a
stringy precipitate.
For each of the three assay methods, there was a significant difference
between hyaluronidase and papain digested samples (p = 0.029), and between
papain-digested samples or samples sequentially digested with both enzymes (p
= 0.043). There is no difference between hyaluronidase-digested samples or
samples digested with both enzymes sequentially (p = 0.391). i
Each synovial fluid sample was separated on a 4-20% linear SDS-PAGE,
followed by staining with alcian blue and silver. Typical results are provided
below in Figures 7 and 8. These figures show that the banding pattern for
undigested synovial fluid, and hyaluronidase digested synovial fluid yield similar
banding patterns after both alcian blue and silver staining. While the papain
digested SF sarnples also stained with alcian blue, only a single band was noted
(as opposed to the double band produced by the SF and HA digested samples).
Interestingly, there were no alcian blue staining bands in samples that were
digested with both hyaluronidase and papain.
As expected, few low molecular weight bands were produced by
hyaluronidase digestion. I n contrast, both the papain digested samples, and the
sample digested with both enzymes had numerous low molecular weight bands
that stained with silver. I n fact, the banding pattern between these two samples
appeared very similar, except for the absence of the high molecular weight alcian
blue staining band in the samples digested with both enzymes.

l d 1 2d
Sam ple
--- O Farndale O Microplate Ed Indirect
Fig. 5: The effect of digesting sarnples of equine synovial fluid with DNase and RNase to determine if nucleic acids are important intefiering substances. Two sarnples were divided into two aliquots. One aliquot of each sample was digested with the nucleases ( Id and Zd), while the other two aliquots were not (1 and 2). sGAG concentrations were measured by the Farndale rnethod, the microplate DMMB assay, and the indirect DMMB assay. Values indicate mean * standard deviation.
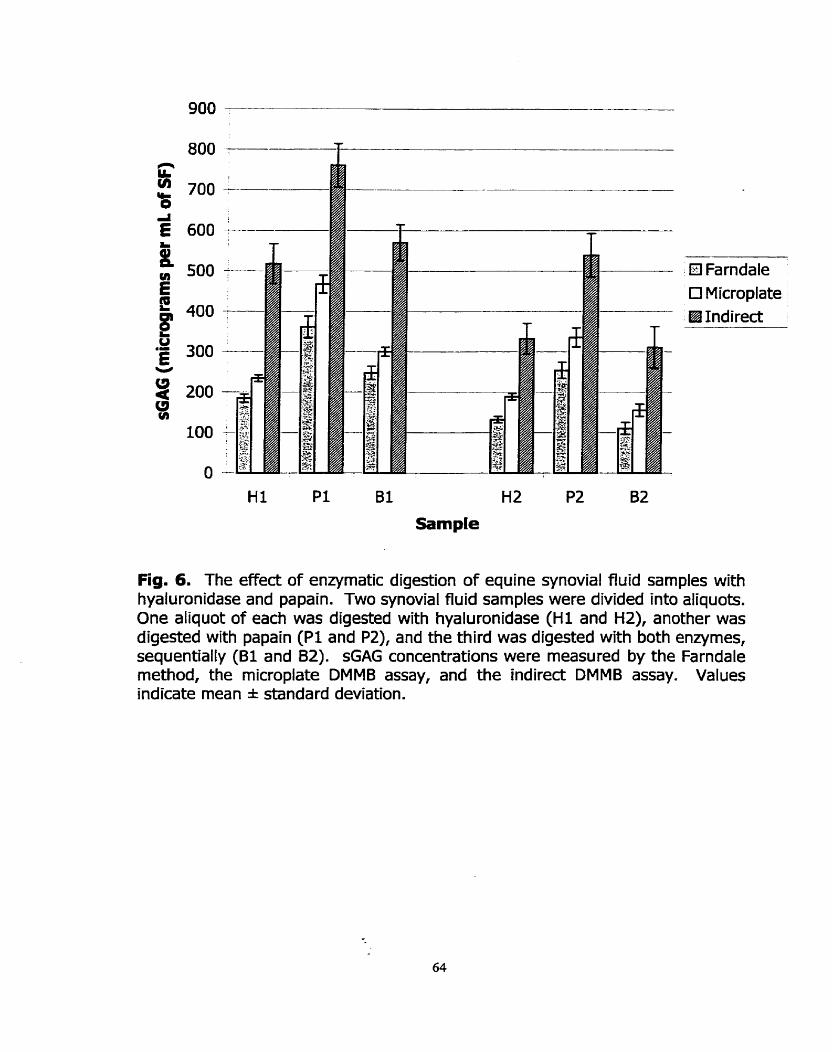
Ei Farndale O Microplate €El Indirect
Hl Pl Bl H2 P2 B2
Sample
Fig. 6. The effect of enzymatic digestion of equine synovial fluid samples with hyaluronidase and papain. Two synovial fluid sarnples were divided into aliquots. One aliquot of each was digested with hyaluronidase ( H l and HZ), another was digested with papain ( P l and PZ), and the third was digested with both enzymes, sequentially ( B I and 82). G A G concentrations were rneasured by the Farndale method, the microplate DMMB assay, and the indirect DMMB assay. Values indicate mean * standard deviation.

Fig. 7. A 4-20% linear SDS-PAGE was used to separate samples of SF that had k e n digested with various enzymes. Lane 1 = rnolecular weight marker (Mr indicated in left margin); Lane 2 = undigested SF; Lane 3 = blank; Lane 4 = SF digested with hyaluronidase; Lane 5 = hyaluronidase blank; Lane 6 = SF digested with papain; Lane 7 = papain blank; Lane 8 = SF digested with both papain and hyaluronidase; Lane 9 = blank containing the hyaluronidase, and papain-digested blank. sGAG were stained with alcian blue: the first step in a sequential staining procedure.

Fig. 8: A 4-20% linear SDS-PAGE used to separate samples of SF that had been digested with various enzymes. Lane 1 = molecular weight marker (Mr indicated in left margin); Lane 2 = undigested SF; Lane 3 = blank; Lane 4 = SF digested with hyaluronidase; Lane 5 = hyalruonidase blank; Lane 6 = SF digested with papain; Lane 7 = papain blank; Lane 8 = SF digested with both papain and hyaluronidase; Lane 9 = blank containing the hyaluronidase, and papain- digested blank. Proteins were stained with silver: the second step in a sequential staining procedure.

Assay VarÏabi/i?y
Each of the three assays was found to be consistently repeatable, yet
none of the three assays gave similar measures of sGAG. The Farndale method,
microplate and indirect DMMB assays were compared in Figures 5 and 6. The
sGAG concentration in equine synovial fluid samples was consistently lowest
when measured by the Farndale assay. The microplate DMMB assay always
yielded intermediate results, while the indirect DMMB assay afforded the highest
apparent measure of sGAG. AU pair-wise tests were significant (p < 0.00028).
DISCUSSION
ReacOon of DMMB witb Various Sfandards
Regardless of the assay used, the intensity of the metachromasia caused
by CSC was consistently greater than that of CSA, and KS. This confirms the
findings of Farndale et al. (1982), Farndale et al. (1986), Chandrasekhar e t al.
(1987), Templeton (1988), Goldberg and Kolibas (1990), and Alwan et al.
(1991). The research groups of Farndale, Goldberg, or Chandrasekhar provided
no explanation of this observation. Templeton (1988), however, suggested that
the difference in colour development rnay be due to differences in extinction co-
efficients of the p bands and due to shifts in the absorption maxima. He
supported this view by showing that the most intense absorbance reading
(Imax) differed between each standard. The maximum wavelength for CSA was

the lowest at 523 nm, while limax for CSC was 525 (25). According to Bjornsson
(1998), an equal response with al1 the different types of GAGs is required in
order to quantitate samples with unknown types of GAGs. Gold (1979),
however, states that if the composition of the samples is unknown, CSC serves
as a good standard. Bjornsson also suggests that the observed differences
reflect differences in charge density of the different types of GAGs, and that both
the carboxyl and sulfate groups are important. This is an interesting fact since
chondroitin sulfate is an uronic acid containing GAG, while W is not. Kç is a
repeating disaccharide of D-galactose and D-glucosamine (gal-P-1,4-glcNAc), and
therefore has one less ionizable group than chondroitin sulfate for the reaction
with DMMB dye (23). If this were the only factor involved in the decreased
intensity of the metachromasia, then one would not expect a difference between
CSC and CSA, since both possess the same number of carboxyl and sulfate
groups. Perhaps the difference in the intensity of rnetachromasia between CSC
and CSA is simply attributable to the inherent molecular heterogeneity of
glycosaminoglycans. For example, the commercial CSC and CSA are not pure:
CSC is 90% CSC, while the balance is CSA. Furthermore, CS chains are variable
in their sulfation. A single chah typically has stretches of 4-sulfation, followed by
6-sulfation, however, there may be regions where no sulfation occurs, or other
regions with both 4- and 6- sulfation (1;33).

Templeton (1988) found that sGAG are required to produce a
metachromatic shift (because HA does not produce a p band), but
rnetachromasia is not due to the interaction with sulfate alone. Indeed, no
change in the DMMB or heparin-DMMB spectra was observed when buffer anions
(~04") were present in a large excess of heparin.
To date, the mechanism of the reaction between the dye 1,9-
dimethylmethylene blue and sGAG remains unclear. I n order to understand the
reaction of the different GAG with DMMB, this rnechanism rnust be elucidated.
DMMB Saturation Assy
No other research group appean to have examined the effect of varying
the sample to dye volume ratio. Since many groups use different protocols, we
felt that this was an important aspect of the assay to examine. I n general, the
sample volume to dye ratio does not appear to be an important consideration in
the DMMB assay. Reasonable explanations as to why the original ratio of the
indirect assay differs from al1 other ratios continue to elude us.
Response T i
Since the slope value for the standard curves generated in Figures 4A-C
were al1 less than 1, there are substances present in the synovial fluid samples
and papain blank that interfere negatively in the assay by reducing the assay

response. All curves were linear indicating that there was no saturation for the
ratios and concentrations examined.
Nuc/eic Acids as Interfering Substances
Several research groups have found nucleic acids to cause a positive
interference in the DMMB assay, presumably because they are polyanionic
biornolecules found in biological samples. Dey et a/. (1992) prepared a standard
curve with chondroitin sulfate (O to 25 pg/ml) and measured the absorbance at
525 nm. Upon addition of 40 pgjrnl of DNA, a negative interference was
observed at concentrations greater than 10 pg CSC/rnl. Interference of DNA and
RNA was only observed at concentrations greater than 20 pg/ml. Alrnost 100%
interference was observed upon addition of 40 Clglml of both DNA and RNA.
This interference could be eliminated by the use of nucleases. The research
group of Dey does concede, however, that these are high concentrations of
nucleic acids that are unlikely to be found in biological fluids, except perhaps in
synovial fluid collected from patients with rheurnatoid arthritis. Dey et a/.
strongly suggested that the rnechanism for the negative interference caused by
polyanions is competition with GAG for binding to DMMB. This is an unlikely
explanation since there is probably an excess of dye in the readion mixture. The
DMMB saturation assays performed in this study support this view.
Ternpleton (1988) found that pyridine produced a rnarked increase in the
intensity of the alpha band, and a concomitant shift in the beta band to a lower

energy. This negative interference at 525 nrn was observed at concentrations of
0.4M pyridine.
I n contrast to the above groups, Farndale etal (1996), and Goldberg and
Kolibas (1990) did not find nucleic acids to interfere in the DMMB assay.
Farndale et a/. (1986) modified their original assay (Le. the
Farndale/spectrophotometric assay used in this current study) so that
interference by anions was eliminated. This involved decreasing the pH to 3.0
and increasing the salt concentration by making their dye with 16 mg of DMMB in
1 L of HzO) containing 3.06 g glycine, 2.37 g NaCI, and 95 ml of 1M HCI. I n
these conditions, colour yields produced by DNA in the presence of the new dye
were negligible. This group suggests that this decreased response is due to the
suppression of a relatively weak interaction of DNA with DMMB. Similarly, with
the Goldberg method (which involves stabilization of the dye with bovine serum
albumin), there was no increase in absorbance at 530 nm when increasing
amounts of DNA (O to 25 pg/ml) were mixed with the DMMB dye.
To Our knowledge, no other study has compared the effect of digesting
samples of synovial fluid with nucleases and measuring sGAG. This is a direct
means of determining the effect of endogenous nucleic acids, which may be a
more accurate measure of the importance of nucleic acids than studies that
involve measuring the effed of exogenous administration of nucleic acids. Even
though only two synovial fiuid samples were analyzed, no difference in sGAG
rneasurements was observed in samples that had been digested with nucleases
when compared to samples that had not been digested.
Since synovial fluid typically has fewer than 500 cells per ml (26), and is
therefore not a highly cellular fluid, and because most research groups centrifuge
their synovial fluid samples immediately upon acquisition, it is not surprising that
nucleic acids are not present in significant concentrations in synovial fluid.
Enzymüc Dg&on of Synovia/ Flua
This study confirms that synovial samples must be enzyrnatically treated
prior to addition of the DMMB dye, or a purpie stringy material will precipitate. It
is also shown that papain-digested synovial fiuid samples result in a higher
measured value of sGAG than samples digested with hyaluronidase, or sarnples
sequentially digested with hyaluronidase and papain.
Dey et a/. (1992) stated that synovial fluid samples must be treated with
either papain or hyaluronidase. Based upon the observations of these midies,
the suggestion by Dey et a/. appears to be scientifically unsound. Papain îs a
protease that hydrolyses protein, with a broad specificity for peptide bonds1. I n
synovial fiuid, papain is believed to release GAG from the core protein (17). I n
contrast, hyaluronidase2 is a hyaluronoglucosidase that randomly hydrolyses 1,4-
linkages between N-acetyl-P-D-glucosamine and D-glucuronate residues in

hyaluronic acid. I n SF, hyaluronidase is used to decrease interference caused by
hyaluronic acid. Since samples were successfully digested with hyaluronidase
alone at 37OC, for 1 hour (Le. no stringy precipitate formed), papain digestion is
not essential to release sGAG from core proteins in order to be analyzed.
Nonetheless, hyaluronidase digested samples may afford an inaccurate estimate
of sGAG. Indeed, sGAG are tightly packed along the length of the core protein.
This tight packing rnay result in a type of steric hindrance that does not enable
the DMMB molecule to bind fully to the sGAG along the full length of the
poly mers. Thus, hyaluronidase-digested samples may be an underestimation of
the true sGAG concentration. This theory is supported by the fact that sGAG
measurements were hig her in papain-digested sam ples as corn pared to sarn ples
digested with hyaluronidase. Thus, al1 of the sGAG are released from the core
protein, thereby exposing al1 polyanionic sites for binding with DMMB. The
sequential digestion of SF samples with hyaluronidase and papain resulted in a
decrease in the amount of sGAG that could be measured by the DMMB assay.
This difference could be attributed to the interference caused by the presence of
hyaluronic acid. These findings suggest that both hyaluronidase and papain
digestion are required to measure sGAG in synovial fluid samples: the
hyaluronidase is essential to eliminate interference caused by hyaluronidase, and
papain digestion is required to eliminate steric hindrance caused by sGAGs that
are bound to the core protein.
While this theory is interesting, the banding patterns observed by
separation of the sarnples by SDS-PAGE may not support this view since the
banding pattern between papain-digested samples, and samples digested with
both enzymes are different. Samples digested with both enzymes do not appear
to have any bands that stain with alcian blue. This suggests that the alcian blue
is not as sensitive as DMMB in measuring sGAGs, since the sGAGs were
quantified ea rlier by the DMMB assay. It is possible that sequentially-d igested
sarnples digest differently in corn parison to the sam ples digested with each
enzyme individually.
While results from only two synovial fiuid samples are presented here,
together with our prelirninary findings (not shown), there is strong evidence that
hyaluronidase and papain can not be used interchangeably, and that a sequential
digestion of hyaluronidase and papain may be the best way to digest synovial
fluid samples. Clearly more research involving the substrates and produds of
each enzyrnatic reaction is essential prior to recommending this protocol. Also, it
would be interesting to digest synovial fiuid sarnples with papain followed by
hyaluronidase to determine if enzyme order is important.
It is interesting that samples digested with hyaluronidase for 4 hours, first
at 37OC, then at 6S°C, could not be analyzed due to the persistence of a stringy
precipitate in the samples. The precipitate did not form in sarnples digested with
the hyaluronidase enzyme at 37OC for one hour, or in samples that were

digested with hyaluronidase at 37OC for one hour, then with papain at 6S°C for
three hours.
Assay Variabibty
While alf three DMMB assays had satisfactory precision, these studies do
not indicate which assay is most accurate. The indirect assay consistently
estimated sGAG concentrations that were higher than either the Farndale method
or microplate DMMB assay. Iniitially, al1 three assays appear to be based on the
same principle (Le. sGAG-dye interaction in proportion to the charge density). It
is more accurate to suggest, however, that the indirect assay does not measure
metachromasia like the Farndale or microplate assays since the sGAG-dye
complexes are not being measu red directly.
Theoretically, each of the three assays should still give the same result
because al1 involve sGAG-dye bfnding. Perhaps there are other molecules (other
than HA, or protein) that exist in synovial fluid that bind to the dye only after
prolonged contact (e.g. thirty minutes at room temperature) resulting in
spuriously increased measurement of sGAG. Such molecules might be
electrolytes, urea, or sulfated plasma components since synovial fluid is an
ultrafiltrate of plasma (26). Sinre the microplate DMMB assay is simply a scaled-
down version of the Farndale rnethod, it is surprising there is not better
agreement.

I n conclusion, the three most widely used DMMB assays provide different
esürnations of sGAG concentration for the same sample of synovial fiuid. In light
of these findings, it is not reasonable to compare observations of different
research groups using different versions of the DMMB assay. This seriously
hampers communication relating to connedive tissue research.

REFERENCES
1.
2.
3.
4.
5.
6.
7.
8.
9.
IO.
Ayad S. (1994) The Extracelluar Matrix Factsbook. Acedemic Press, Toronto.
Brama, P.A., TeKoppele, J.M., Bank, R.A., van Weeren, P.R., and Barneveld, A. (1999) Influence of site and age on biochemical characteristics of the collagen network of equine arb'cular cartilage. Am I Vet Res 60, 341-5.
Clark JM and Swibzer RL (1977) Experimental Biochemistn/, W.H.Freeman and Company, New York.
Dey, P., Saphos, C.A., McDonnell, J., and Moore, V.L. (1992) Studies on the quantification of proteoglycans by the dimethylmethylene blue dye-binding method. Specificity, quantitation in synovial lavage fluid, and automation. Connecf 71ssue Res 28,3 17-24.
Farndale, R.W., Buttle, D.J., and Barrett, A. 1. (1986) Improved quantitation and discrimination of sulphated glycosaminoglycans by use of dimethylmethylene blue. Biochim Biophys Acta 883, 173-7.
Farndale, R.W., Sayers, C.A., and Barrett, A.3. (1982) A direct spectrophotometric microassay for sulfated glycosaminoglycans in cartilage cultures. Cmect 77sue Res9, 247-8.
Frisbie, D.D., Ray, C.S., Ionescu, M., Poole, A.R., Chapman, P L , and Mdlwraith, C. W. (1999) Measurement of synovial fluid and serum concentrations of the 846 epitope of chondroitin sulfate and of carboxy propeptides of type II procollagen for diagnosis of osteochondral fragmentation in horses. Am I Vet Res 60, 306-9.
Fuller, C.J., Barr, A.R., Dieppe, P.A., and Sharif, M. (1996) Variation of an epitope of keratan sulphate and total glycosaminoglycans in normal equine joints. Equine Vet328, 490-3.
Gold, E.W. (1979) A simple spectrophotometric method for estimating glycosaminoglycan concentrations. AndBiochem 99, 183-8.
Goldberg R.1 and Kolibas L.M. (1990) An Improved Method for Determining Proteog lycans Synthesized By Chondrocytes in Culture. Connemve 7Issue Researcb 24,265-275.

11. Little, C.B., Flannery, C.R., Hughes, C.E., Mort, J.S., Roughley, P.J., Dent, C., and Catenon, B. (1999) Aggrecanase versus matrix metalloproteinases in the catabolisrn of the interglobular domain of aggrecan in vitro. Biochem J 344 (Pt l), 61-8.
12. Mdlwraith C.W. (1996) General Pathobiology of the Joint and Response to Injury. Ii7 Joint Disease in the Horse (Mdlwraith C.W. and Trotter G.W., Eds.) pp. 40770, W.B. Saunders Company, Philadelphia.
13. Myen, S.L., Brandt, K.D., and Albrecht, M.E. Synovial fluid glycosaminoglycan concentration does not correlate with severity of chondropathy or predid progression of osteoarthritis in a canine cruciate deficiency model. J Rheumatd 27, 753-63.
14. Okumura, M., Fujinaga, T., Urakawa, E., Tagami, M., and Tsukiyama, K. (1998) Evaluation of the catabolic activity of cartilage by measurement of serum keratan sulfate concentration in foals. Am 3 Vet R e . 58, 925-9.
15. Okumura, M., Tagami, M., and Fujinaga, T. (1998) Measurement of serurn and synovial fluid keratan sulphate and antibody to collagen type II in equ ine osteoa rth ritis. ZenWb/ Veterinarrned A 45, 5 13-6.
16. Palmer, J.L. and Bertone, A.L. (1994) Joint structure, biochernistry and biochernical disequilibriurn in synovitis and equine joint disease. Equine Vet -7 26,263-77.
17. Palmer, J . Bertone, A.L., and McClain, H. (1995) Assessrnent of glycosaminoglycan concentration in equine synovial fluid as a marker of joint disease. a n J Vet Raç 59, 205-12.
18. Platt, D., Bird, J. L., and Bayliss, M.T. (1998) Ageing of equine articular cartilage: structure and composition of aggrecan and decorin. Equine Vet/ 30,43-52.
19. Ray C.S., Poole A.R., and Mdlwraith C.W. (1996) In: Joint Disease in the Horse. (Mdlwraith C. W., and Trotter G. W., Eds.), pp. 203-216. W.B. Saunders, Philadelphia.
20. Rossdale, P.D., Hopes, R., Digby, N.J., and offord, K. (1985) Epidemiological study of wastage among racehorses 1982 and 1983. Vet Rec l16,66-9.
21. Saari, H., Konttinen, KT., Tulamo, R.M., Antti-Poika, I., and Honkanen, V. (1989) Concentration and degree of polymerization of hyaluronate in equine synovial fluid. Am J Vet R a 50,2060-3.

22. SAS Institute Inc, SAS STAT. (1997) Software: Changes and Enhancements through Release 6.12. 1167. Cary, NC, SAS Institute Inc.
23. Stone, J.E., Akhtar, N., Botchway, S., and Pennock, C.A. (1994) Interaction of 1,9-dimethylmethylene blue with glycosaminoglycans. Ann Ciin Biixhem 31 (Pt 2), 147-52.
24. Taylor, K.B. and Jeffree, G.M. (1969) A new basic metachromatic dye, I:9- dirnethyl methylene blue. Hisfochem J i, 199-204.
25. Templeton, D.M. (i988) The basis and applicability of the dirnethylmethylene blue binding assay for sulfated glycosarninoglycans. Connecf 7/ssue Res 17,23-32.
26. Todhunter R.J. (1996) In Joint Disease in the Horse (McIlwraith C.W. and Trotter G.W., Eds). pp. 1-28, W.B.Saunders Company, Philadelphia.
27. Todhunter, R.J., Fubini, S.L., Freeman, K.P., and Lust, G. (1997) Concentrations of keratan sulfate in plasma and synovial fluid from clinically normal horses and horses with joint disease. /Am Vet MedAssoc 210,369- 74.
28. Todhunter, RJ., Yeager, A.E., Freernan, K.P., Parente, E.J., and Lust, G. (1993) Keratan sulfate as a marker of articular cartilage catabolisrn and joint treatment in ponies. A m / Vet Res 54, 1007-16.
.9. Tulamo, R.M., Heiskanen, T., and Salonen, M. (1994) Concentration and molecular weight distribution of hyaluronate in synovial fluid from clinically normal horses and horses with diseased joints. Am / Vet ResS5, 710-5.
30. Tulamo, R.M., Houttu, JI Tupamaki, A., and Salonen, M. (1996) Hyaluronate and large molecular weight proteoglycans in synovial fluid from horses with various arthritides. A m / VetRes 57,932-7.
3 1. Vilim, V. and Fosang, AJ . (1993) Characterization of proteoglycans isolated from associative extracts of human articular cartilage. Biihem 3 293(Pt l), 165-72.
32. Warren S., Hurtig M.B., Wright J.R., Keates R.A., and Lurnsden J.H. (2000) Analysis and Application of the 1,9-dimethylmethylene Blue Assay for Sulfated Glycosaminog lycans in Synovial Fluid . Msc Thesis, University of Guelph.
33. Wright T.N., Heinegard, D. K., and Hascall V.C. (1991) In Cell Biology of Extracellular Matrix (Hay E.D. Ed.). pp. 45-78, Plenum Press, New York.

CHAPTER 3: MANUSCRIPT 2
Introduction and Validation of A New, Solid Phase 1,9-dimethylmethylene Blue Assay
To be su bm itted to Ana/yaic/ 6iochemiS.y

ABSTRACT
It has been shown that three widely used variants of the 1,9-
dirnethylrnethylene (DMMB) differ in their ability to measure sulfated
glycosarninoglycans (GAG). Here, a new solid phase DMMB assay is presented.
This assay involves mixing synovial fluid (SF) samples with DMMB, and
immediately applying the sGAG-dye solution to a nylon membrane using a BioDot
vacuum filtration apparatus. The resultant dots are then quantified by scanning
densitornetry. This study confirmed that DNA and RNA levels in SF are
insufficient to cause significant interference, and papain and hyaluronidase
digestions are not interchangeable. The solid phase assay affords sGAG
rneasurements different frorn those achieved by the microplate DMMB assay
(p<0.00025), but comparable to the Farndale spectrophotornetric assay
(p>0.9065). The solid phase assay is rapid, can detect nanogram quantities of
sGAG, and circumventç the problem of premature precipitation of sGAG-dye
complexes. It can be used quantitatively or qualitatively, requires small sarnple
volumes, and may provide a permanent record of the results.

INTRODUCTION
Proteog lycans (PGs) are large, corn plex molecules corn prised of a protein
core with covalently linked glycosaminoglycans (GAG), which are linear
polysaccharides (2;4). GAGS are typically sulfated, thereby imparting a high
negative charge to the molecule. Three of the most comrnon sulfated
glycosarninoglycans (sGAG) are chondroitin sulfate C (CSC), chondroitin sulfate A
(CSA), and keratan sulfate (KS). Chondroitin sulfate C and A are both repeating
polymers of D-glucuronic acid and D-galactosamine (glcUA-P-1,3-gIcNAc) with
the disaccharides joined by a P-1,4-glycosidic Iinkage. The only difference
between CSC and CSA is the sulfation pattern. The galactosamine moiety of the
chondroitin disaccharide is sulfated a t the C-4 or the C-6 via an O-sulfate linkage
to make chondroitin-4-sulfate (CSA), and chondroitin-6-sulfate (CSC),
respectively. Keratan sulfate (KS) is comprised of a repeating disaccharide of D-
glucosamine and D-galactose (gai-P-l-4-glcNAc) where each disaccharide is
attached by a P-1, 3 glycosidic linkage. Sulfation occurs at C-6 of the
galactosamine residue via an O-sulfate linkage (1; 10; 11).
PGs are widely dispersed throughout the body. Not only are PGs found in
the extracellular matrix of a wide variety of connective tissues such as articular
cartilage, and basement ' membranes, but also in biological fluids including
synovial fiuid, blood and unne (12). I n articular cartilage, PGs function to draw
water into the cartilage. The hydrated PGs swell against the collagen network,

which resists and redistributes loading of the joint, and provides a resilient
gliding surface (13).
Measurement of proteoglycans in tissue extracts and biological Ruids is a
common procedure. Classical methods of measuring PGs involved measuring the
carbohydrate content of the molecules such as uronic acid, galactosarnine, or
glucosamine (4). These methods were time consuming and tedious (9, so
alternative methods of measuring the carbohydrate rnoieties of PGs were sought
after. This work led to the application of colorimetric techniques in connective
tissue research. The m o t common dyes selected for these assays were alcian
blue, safaranin-O, and thiazine dyes such as 1,9-dimethylmethylene blue
- (DMMB), toluidine blue, methylene blue, and azur B (2-4;15). Each of the above
dyes are positively charged, and are thought to bind to the proteoglycan
molecules in proportion to the negative charges on the sGAG polymers resulting
in metachromatic shifts of the spectrum which can be measured
spectrophotometrically (2). Thus, these colorimetric assays ail estimate the PG
as a function of the sGAG content. 4'
While Bjornsson (1998) claims that the alcian blue assay is the only assay
that allows equal quantitation of al1 sulfated GAG in biological fluids without
protease treatment, the DMMB assay appears to be the more popular assay.
This is especially true in the areas of articular cartilage, and synovial fluid
research, probably because the DMMB assay is a less t h e consuming and labour
intensive procedure than the alcian blue assay.

Taylor and Jeffree introduced DMMB as a new thiazine dye in 1969.
Thiazine dyes Vary in their sensitivity to metachromasia by various chromotropes,
and DMMB was found to give a more intense metachromasia than other thiazine
dyes. DMMB was therefore exploited for this characteristic. The usefulnes of
the DMMB assay was initially lirnited due to the instability of the dye, and
because the sGAG-dye complexes precipitated out of solution during the assay.
Farndale et a/. (1982) attempted to stabilize the sGAG-dye complexes by
replacing the dibasic (citrate/phosphate) buffer with a formate buffer. This
DMMB assay, the Farndale method, was widely accepted as a simple, reliable,
reproducible assay for measuring the sGAG content of tissues and fluids
(6;7;16). Unfortunately, the assay rernained problematic due to the instability of
the system. The sGAG-dye complexes continued to aggregate and precipitate as
soon as the sGAG and dye were mixed, resulting in a slow, progressive fall in the
absorbance during the first ten minutes of the assay. Furthermore, the dye was
also found to bind to the cuvettes, requiring the use of disposable cuvettes or
thorough rinsing of the cuvette with methanol between samples (7).
Müller and Hanschke (1996) also recognized the problems inherent in the
Farndale method, and therefore developed an indirect spectrophotornetric assay
for sGAG. This involved mixing samples of sGAG with the DMMB dye, allowing
the sGAG-dye complexes to precipitate for thirty minutes at room temperature,
then centrifuging the samples for fifteen minutes. sGAG were then quantified by
measuring the decrease in absorbance of the supernatant at 595 nm.
Theoretically, this assay should yield the same measure of sGAG as the Farndale
method. It was found, however, that the indirect assay consistently gave higher
measures of sGAG than the Farndale method (18). Another common method of
rneasuring sGAG in tissue extracts and biological fluids is the microplate DMMB
assay, which is simply a scaled-down version of the Farndale method. The
microplate assay requires much srnaller sample volumes, and is substantially
more rapid since a large number of sarnples can be processed at once using a
96-well microplate reader. Interestingly, the microplate assay also gave
measurements of sGAG that were higher than the same samples analyzed by the
Farndale method (18).
Additional problerns attributed to the DMMB assay are the effects of
interfering substances on the quantification of sGAG, and the enzyrnatic digestion
of sarnples prior to analyses. DNA, RNA, and hyaluronic acid have been found to
cause a decrease in absorbance of sGAG-dye solutions (8). Since these
substances only caused a 20% change in absorbance cornpared to the CSC
standard for a given mass, Farndale et a/. (1982) concluded that these
substances were unlikely to significantly interfere with the estimation of sGAG.
Sirnilarly, Dey et a/. (1992) reported that hyaluronic acid (HA) in concentrations
less than 40 pg/ml did not interfere in the DMMB assay. Though the HA content
of tissue extracts is low, this is not true in synovial fluid where 0.5 mg/rnl of HA
is typical (17). In light of these findings, Bjomsson (1998) concluded that

routine quantification of glycosaminoglycans in biological fluids is not feasible
using the DMMB method of Farndale.
On a different note, Dey et a/. (1992) found that if DMMB was added
directly to synovial fluid that had not been treated with hyaluronidase, a purple
stringy precipitate formed. This precipitate prevents spectrophotornetric
analysis. Treatment of the samples with hyaluronidase or proteases (such as
papain) is therefore required to quantify sGAG in synovial fluid (2;3;6).
A comprehensive, critical analysis of the DMMB assay was conducted that
compared the Farndale method, the indirect DMMB assay, and the microplate
DMMB assay (18). In this study, it was determined that nucleic acids in SF were
insufficient to cause significant interference. It was also determined that papain-
digested synovial fluid samples resulted in a higher measurement of sGAG
compared to the same samples that had been digested with Sti'epfomyces
hyaluronidase or by a sequential digestion of hyaluronidase followed by papain.
Thus, different research groups ernploying different enzymatic treatments can
not reasonably compare their results.
A reliable and accurate measurement of G A G is essential for research
involving joint injury and joint disease. Since the three most commonly
employed DMMB assays (i.e. the Farndale, indirect, and microplate methods)
each result in a different measure of sGAG when applied to identical samples,
and because the instability of the sGAG-dye complexes remains problernatic (l8),
a new DMMB assay would be advantageous.
Membrane technologies are used increasingly in a variety of applications
where the molecule of interest can be detected via irnmunological means,
through hybridization with nucleic acid probes, or dye-binding techniques. For
example, a solid phase assay has been developed for the analysis of proteins
using the dye Coomassie brilliant blue R250 (9). Our laboratory has employed
this protocol of measuring protein. According to this protocol, 1 pl of sample and
standard are spotted in duplicate on Whatman 3M chrornatography paper. After
air-drying, the membranes are stained and de-stained Iike a SDS-PAGE (Le.
stained in 0.1% Coomassie blue R-250 in 40% methanol, and 10% acetic acid
for 1 hour, then de-stained in 40% methanol, and 10% acetic acid until
background staining was eliminated). Solid phase assays (also referred to as dot
blot assays) have also been developed to measure sGAG by the alcian blue
assay. For example, Heirner and Sampson (1987) performed dot blotting by
placing 100 pl samples of PG (dissolved in 5% acetic acid in the presence of
0.05% Tween 20) in a Minifold 1 apparatus under vacuum using Nylon 66
transblots as the support medium, and staining the sheets with alcian blue.
Alternatively, Buee et al. (1991) applied samples/standards, dissolved in a
loading buffer, to a BioDot microfiltration apparatus, and stained the positively
charged nylon membrane with alcian blue for twenty minutes. Finally, Bjornsson
(1998) altered the preceding method slightly in that the sampies/standards were
mixed with alcian blue, then applied to polyvinylidene fluoride using a 96 well
MilliBlotD apparatus.

A new solid phase DMMB assay is presented that employs scanning
densitometry for the quantitative analysis of proteoglycans as sulfated
glycosaminoglycans in synovial fluid. Sampies of synovial fiuid are mixed with
the DMMB dye, and imrnediately applied to a nylon membrane using a BioDot
vacuum filtration apparatus. The densities of the resultant dots are measured
and the values are compared to a calibration curve. This solid phase assay
requires pre-digesthg synovial fluid samples with enzymes prior to analysis, but
alleviates the concern of premature precipitation of the sGAG-dye complexes.
Furthermore, the solid phase assay can detect nanogram quantities of GAG, can
be used qualitatively or quantitaüvely, requires only small sample volumes, is
more rapid and less labour intensive than some other DMMB assays (especially
the Farndale rnethod), and may provide a permanent record of the results.
MATERIALS AND METHODS
Materials
EDTA-coated vacutainers@ are a product of Becton Dickinson
VACUTNNERS Systerns). 1,9-dimethylmethylene blue was purchased from
Aldrich Chernical Company. 95% ethanol was obtained from Commercial Alcohol
Inc. Formic acid, sodium hydroxide, sodium phosphate monobasic, sodium
chloride, potassium chloride, sodium phosphate, potassium phosphate, and the
96 well Rat bottom plates (Corning), Filter paper (Whatman No. 1 brand), and
the UV crosslinker (Fisher Biotecha FB-UVXL-10000) were purchased from
Fisher Scientific. Papain, N-acetyl-L-cysteine, chondroitin sulfate Cf chondroitin
sulfate A, and keratan sulfate were al1 purchased from Sigma Chemical
Corn pany. EDTA tetrasodiurn salt was from ICN Biochem icals. Sfrepfomyces
hyaluronidase was purchased from Calbiochem, and the microplate reader (with
a 540 nrn filter) used in this study was a Titertek Multiscan MC from Flow
Laboratories. The SmartSpec 3000, nitrocellulose paper, ~eta-probem, and the
BioDot apparatus were purchased from BioRad labomtories. S&S NytranB
SuPerCharge nylon membrane was from Mandel, while the Nytran-N was from
Amersham Pharmacia Biotech. Northern Eclipse Imaging Software is a product
of Empix Imaging, Inc., and the scanner used throughout the study was a
Hewlett Packard ScanJet 6100C. DNase type 1, grade II from bovine pancreas,
and the RNase A were from Roche Diagnostics.
Sampie Col'ea7on and Prepatat70n
Two synovial fluid samples were col lected aseptically in EDTA-coated
vacutainers directly prior to arthroscopie surgery at the Ontario Veterinary
College, University of Guelph. Both hones used in this study were yearling
Standardbred fillies diagnosed with ûsteochondriis disecans of the hock by the
attending surgeon. The samples were centrifuged at 3,500 rpm for 30 minutes
at 4°C. The synovial fluid supernatants were decanted from the pellets, and
stored in aliquots at -80°C until time of analysis.

Unless otherwise stated, the synovial fluid samples were digested with an
equal volume of 1 mg/ml papain in digestion buffer (0.69 g sodium phosphate
monobasic, 0.0326 g N-acetyl cysteine, 0.076 g EDTA tetrasodium salt, made up
to 100 ml, pH 6.5) at 65°C for 3 hours prior to analysis.
we Prepantion
The dye was prepared according to the method of Farndale etal. (1982).
5 mL of 95% ethanol was added to 16 mg of 1,9-dimethylmethylene blue for 30
minutes at room temperature. 2 ml of formate buffer (1.54 mL formic acid, 2.94
mL 5N NaOH: made up to 500 ml, pH 3.5) was added and the volume was
made up to 1 L with water. The resultant dye (Ans = 0.34) was stored proteded
from light at room temperature for 2 months.
Developmenf of a SOM Phase DMMB Assy
I n order to determine the most effective method of rneasuring sGAG in
synovial Ruid samples by a solid phase assay, several methods were attempted.
The first was based on the method of Ghosh etaL (1988). Here, 1.0 to 5.0 pl
samples of synovial fluid digests and chondroitin sulfate C (CSC) standards (frorn
a 100 pg/ml stock solution in water) were applied to various membranes [Filter
paper (Whatrnan No.l), nitrocellulose paper, two positively charged nylon
membranes, and a neutral nylon membrane used in this study]. Once the
membranes were air-dried, they were placed in a solution of DMMB to min .
Some samples were first washed in a solution of alurninurn rnonopotassiurn
sulfate dodecahydrate [AIK(SO& -12HzO] to promote linking of the negatively
charged sGAG molecules to the membrane. Other methods that were examined
to promote binding of sGAG to the membrane included UV cross-linking (120
rn3/cm2 total exposure) and baking of the membranes (1 hour at 80°C).
Next, a BioDot vacuum filtration apparatus was used to embed the sGAG
samples in the membrane. This was achieved by applying 50 or 100 pL of each
sample (diluted 1:10 in water, meaning 1 part SF added to 9 parts water) to a
membrane that had been briefly soaked in phosphate buffered saline (PBS: 8 g
NaCI, 0.2 g KCI, 1.44 g Na2HP04, 0.24 g KH2P04, made up to 1 LI pH 7.4) under
vacuum. Irnrnediately after applying the sample to the membrane, 100 pl of dye
was applied to each well. AI1 samples were applied in triplicate. The resultant
dots were completely air-dried before the sGAG content of the samples was
estimated by cornparing the colour density of the samples to a series of dots
containing known amounts of CÇC (prepared frorn a 100 pg/ml stock solution in
water). Only the neutral and positively charged nylon membranes were used in
this experiment.
Finally, a modification of the above BioDot apparatus vacuum filtration
method was attempted. Directly prior to being applied to the membrane, 50 pl
of the SF digest (diluted 1:5, 1:20, 1:25, 1:50) was mixed with 500 pL of DMMB
dye in a 1.5 ml eppendorf microcentrifuge tube. The contents of the tube were
then inverted 3-4 times. Irnrnediately after mixing, a 100 pl aliquot of the 550 pl
sample-dye mixture was applied to a single well of a 96 well BioDot apparatus,
using a membrane that had been briefly soaked in phosphate buffered saline. All
samples and standards were applied in triplicate, ensuring that air bubbles were
not introduced. Again, only neutral or positively charged nylon membranes were
utilized.
Once the nylon membranes were rernoved from the BioDot apparatus and
completely air-dried (the appearance of the dots changes dramatically when dry,
and can not be analyzed when wet), a rapid estirnate of sGAG in the test
sarnples could be obtained by visual cornparison with the standards. For
accurate quantitation, however, the sarnples and standards on the nylon
membrane were scanned, and densitornetry was performed. The line scan
measurement function in Northern Eclipse, an imaging software program,
measured the density of each dot by selecüng the peaks, and measured the area
under the curve (Fig. 1). Data were automatically transferred to a spreadsheet.
Any program capable of densitometric analysis, however, would be suitable at
this step.
A standard curve was prepared by plotting the density of the dots against
the total sGAG (pg), and the concentration of sGAG in each sample was
deterrnined from this standard curve.


Preparaüon of a Standard Cuwe
Standard curves were created (from a 100 pg/rnl stock solution of CSC in
water) by preparing a series of solutions containing known arnounts of
chondroitin sulfate C from shark cartilage. The total volume of each standard
was 50 pl. 500 pl of DMMB dye was added to each standard, the contents
mixed, and a 100 pl aliquot was applied to the membrane. All standards were
applied in triplicate with each set of sarnples.
Two methods were utilized to scan the resultant dots. The first rnethod
used the "sharp black and white photo" mode, while the second used the 'sharp
millions of colours" mode. The density of the dots was then measured for both
series of scanned dots. Standard curves were prepared using each rnethod to
determine the best way to scan the images.
The stability of the solid phase DMMB assay in terms of storage ability was
also evaluated. Stability of the stored membranes was deterrnined by re-
scanning the dots after a two-month storage period, and comparing the new
density values with the original density values.
ReacOon of D M with Various SLdndam!!
Typical standards used in connective tissue research are keratan sulfate
from bovine cornea, chondroitin sulfate C frorn shark cartilage, and chondroitin
sulfate A frorn bovine trachea. I n order to compare the reaction of these
reagents with the DMMB dye, calibration cuwes were created for each standard

by mixing a 50 pl sample with 500 pl of dye before applying the mixture to the
membrane using the BioDot apparatus. Each calibration curve was created from
a series of solutions containing 0, 0.2, 0.4, 0.8, 1.2, and 1.6 pg of standard
(prepared from 100 pg/rnl stock solutions in HzO).
DMMB Safurat7on Assay
This experiment was designed to evaluate if the sample ta dye volume
ratio was important in the solid phase DMMB assay. A series of standard curves
(from a 100 pg/ml CSC stock solution in water), each having a different sample
to dye volume ratio was prepared. The desired ratios were: 0.222, 0.1, and
0.0378. The sample to dye volume ratio for the solid phase DMMB assay
described in the preceding section was 0.1 (Le. 500 pl of DMMB dye added to 50
pl sample or standard).
Response Tèst
Two papain-digested synovial fluid samples were diluted with water so
that the density readings of the synovial Ruid would fall in the low end of the
linear range of the standard curve. To each synovial fiuid digest, increasing
amounts of CSC (from a 100 pg/ml stock solution in HzO) were added, and the
solid phase assay was performed. The final sample volume was maintained at
SOpl, even after addition of CSC. sGAG concentrations in each SF sample were
plotted against the arnount of exogenous CSC added to the samples. The dopes

of the lines were anessed to see if they differed from 1 (Le. a perfect
correlation), and the arnount of sGAG in the synovial Ruids was determined by
dividing the y-intercept by the slope. Each sample, plus a papain blank, were
assayed three times in triplicate.
Nuc/eic Acids as Interfeng Substances
The two synovial fluid samples were divided into two aliquots. One
aliquot of each sample was digested with IO0 pl of a 1 mg/ml stock solution of
DNase per 1.5 ml of synovial fluid, and 100 pl of a 0.1 mg/ml stock solution of
RNase per 1.5 ml of synovial fluid at 2S°C for 30 to 60 minutes. Ali aliquots were
then digested with papain (as described previously). The sGAG content of the
synovial fluid digests was measured by the solid phase DMMB assay, and the
nuclease digested sGAG concentrations were compared to the non-nuclease
digested sGAG concentrations. Al1 aliquots were rneasured three times, in
triplicate.
Ehymai7c DMesüon of Synuvia/ F/uid
The two samples of equine synovial fluid were each divided into four
aliquots. One aliquot was digested with 10 Ulm1 of Sbeptomyces hyaluronidase
at 34OC for 1 hour, while the second aliquot was digested with an equal volume
of papain (1 mg/ml papain in papain digestion buffer) at 65°C for 3 hours. The
third aliquot was first digested with SD-epomyces hyaluronidase for 1 hour at
34OC followed by digestion with papain at 65OC for three hours. The final aliquot
was digested with Streptomyces hyaluronidase (10 U/ml) at 34°C for 1 hour,
then at 65OC for three hours. The resultant digests were measured by the solid
phase DMMB assay to determine their sGAG content. Each sample was
measured in triplicate, and the entire experiment was performed three times.
AsSay Variabifity
Since the two experiments involving enzyrnatic digestions (Le. nucleic
acids as interfering substances, and the enzymatic digestion of synovial fiuid)
were each performed three tirnes, this data was also used to assess the
repeatability of the solid phase DMMB.
The solid phase DMMB assay was cornpared to the Farndale method and
the microplate DMMB assay by performing the nucleic acids as interfering
substances and enzymatic digestion of synovial fluid experiments. The protocol
for each method is described below.
Farndale MeUiod (Specficopho fometi'ic DDMB Assay)
This protocol is based on the method of Farndale et a/. (1982).
Appropriate dilutions of equine synovial fiuid samples (1:s was a typical dilution,
meaning 1 part SF was added to 4 parts water) were prepared in a total volume
of 250 pl, and placed in 1.5 ml eppendorf tubes. Directly prior to measuring the

absorbance at 525 nm on a spectrophotometer, the samples were transferred
from the eppendorf tube to a disposable specbophotometry cuvette. 2.5 ml of
dye was added, and the samples were gently mixed by inverting the cuvettes 2
to 3 times. A standard cunre was prepared with each assay. Solutions
containing O to 25 pg of CSC in a total volume of 250 pl were prepared from a
100 pg/ml stock solution in water.
Microp/ate Assay
This method is a scaled down version of the Farndale method described
above. It is based on the method of Goldberg and Kolibas (1990), and modified
by Dr. Burton-Wurster (persona1 communication). Briefly, 50 pl of each synovial
fluid sample was diluted with water (1:10 and 1:20 were typical dilution factors)
and applied to a 96 well flat bottom plate. 200 pL of DMMB dye was added to
each well directly before reading the absorbance at 540 nm on a 96 well
microplate reader. Sampie absorbance was compared to a standard curve
prepared by applying 50 pl solutions containing O to 10 pg of CSC (prepared
from a 100 pg/rnl stock solution in water). Synovial fluid samples and standards
were assayed in triplicate.
S&fi;SaCd/ Ana/y~k
Data were analyzed for norrnality using SAS Proc univariate, and a
logarithmic transformation was performed to make the data normal. Data were
subjected then to analyses using a rnixed model analysis of variance (SAS Proc
Mixed) to test for real differences due to enzymes (nucleases, and papain or
hyaluronidase) and assays (solid phase DMMB assay, Farndale rnethod,
microplate DMMB assay). P c 0.05 was considered significant. Adjusted mean
differences were considered insignificant if the 95% confidence intervals on the
means captured zero (14).
RESULTS
Deve/opment of Be S ' P h a s e Assay
The first attempts to create a solid phase assay using traditional dot blot
methodologies were unsuccessful. One to five pl aliquots of synovial fluid
digests and CSC standards were applied to a variety of membranes including
filter paper, nitrocellulose paper, and neutral and positively charged nylon
membranes. Since the samples and standards were washed from the membrane
immediately after contacting the dye, samples were unable to be analyzed.
All attempts to promote binding of the sGAG to the membrane (by soaking
in an aluminum cornpound, cross-linking with UV light, and baking) were
unsuccessful due to the samples washing off the membrane directly after
addition of the dye.
The first membranes used were the filter paper and the nitrocellulose
paper (NCP). The sarnples washed readily off the surface of both of these
membranes. The positively charged nylon membrane was initially selected with

the expectation that the positive charge would promote binding of the negatively
charged sGAG. While there was some irnprovement in binding of sarnples to the
nylon membrane (especially with extensive UV cross-linking) over the filter paper
and NCP, binding remained unsatisfàctary. Neutra1 nylon membrane yielded
similar results.
The second method that was attempted involved applying the sarnples
and standards to a membrane using a BioDot vacuum filtration apparatus, then
immediately applying the dye. Again, the results were unsatisfactory. While
some dots appeared to stain evenly, the vast rnajority of the samples did not.
Moreover, there was no obvious repeatability between sample replicates. That
is, identical samples would result in a wide range of colours, when a single colour
intensity was expected. No difference between the neutral or positively charged
nylon membranes was observed.
Once it was determined that the samples must be mixed with the dye
prior to application to the membrane, progress was rapid. Samples and
standards initially presented a bright pink colour (a brighter pink with higher
sGAG concentrations), which later changed to a blue colour when dry. There did
not appear to be any difference in the results between samples applied to
neutral or positively charged nylon membrane. NCP and filter paper were not
used in the experirnent due to their previous failure.
Prepamtion of a S'ndard Cime
The dye-sGAG complex solution was applied to the nylon membrane
under vacuum, and the resultant dots were analyzed by scanning densitometry
using appropriate imaging software after the membranes were completely air-
dried. In order to determine the linear range of the solid phase assay, various
arnounts of CSC were applied to the membrane ranging frorn O to 5 pg. Figure 2
shows the resultant dots frorn applying this series of standards, up to and
including 2.6 pg of CSC only, because al1 sarnples after this had very similar
densities. For adual analytical sarnples, it is desirable to include standards on
the same nylon sheet that is scanned. Thus, a subset of standards was included
in such cases (Figure 3).

Fig. 2. Series of dots prepared from CSC by a new, solid phase DMMB assay to determine the Iinear range of the assay. Samples were applied width-wise, in triplkate. For example, lane 1, row A-C = O pg CSC, lane 2, row A-C = 0.05 kg. After lane 12, row A-C (0.6 pg CSC), the next standard was applied to lane 1, row D-F (0.7 pg CSC). C).e final do& were applied to lane 12, row D-F (2.6 pg CSC) .
Fig. 3. Standard curve prepared From CSC by the solid phase DMMB asçay to make a standard curve for ensuing experimentation. Range is from O to 1.6 pg CSC. Samples were applied length-wise. Al-3 = O pg S C ; A4-6 = 0.2 pg; A7-9 = 0.4 pg; A10-12 = 0.8 pg; 81-3 = 1.2 pg; 84-6 = 1.6 m..
Scanning densitometry of the standard curves shown above was
atternpted in two ways. One was the "sharp black and white photo" mode, and
the second was the "sharp millions of colours mode". Figure 4 illustrates that
the black and white photo mode results in a standard curve that had a lower
than when using the colour mode (which includes the red, green, and blue
components). The equation of the line for the black and white curve was y =
964.22~ - 21.874, with an R~ value of 0.9859, while the equation of the line for
the colour dots was y = 2317x - 14.809 with an F t 2 value of 0.9895. For this
assay, the best Iinear range was deterrnined to be between 0.1 and 1.6 pg of
CSC. Both the black and white and colour curves were linear in this range, with
the colour analysis giving a better response, and less of a toe than the black and
white analysis.
There does not appear to be any difference in the standard curves after a
two-month storage period and rescanning of the membranes (Fig. 5). Within the
linear range (O to 1.6 pg CSC), the equation of the line for the original curve (10-
May) was y = 2252.4~ + 148.41 with an R~ value of 0.9901. This is very similar
to the equation obtained two months post-preparation (20-July), which was y =
2317x - 14.809 with an fX2 value of 0.9895 (as reported above).
The smaller standard curve that was used throughout the study is
provided in Figure 6. Although not obvious graphically, a slight toe still exists
since the y-intercept is -25.4.

CSC (micrograms)
Ag. 4. Comparison of the standard curves obtained by the solid phase DMMB assay after the dots were scanned in colour, or in black and white (B&W). Each point is the mean of each sample assayed in triplicate & standard deviation. In this and succeeding figures, density is expressed in arbitrary units.

Fig. 5.
CSC (micrograrns)
Cornparison of the standard curves obtained by the solid phase assay imrnediately after preparation (loth of May), and again following a two month period of time ( 2 0 ~ of July). Each point is the mean density of each sample assayed in triplicate f standard deviation .

CSC (micrograms)
Fig. 6. Standard curve prepared with a subset of CSC standards that was used in ensuing experirnentation. Each point is the mean density of each sample assayed in triplicate + standard deviation.

ReaBn of DMMB with Varbus Cinao/ Reagents
Figure 7 illustrates the difference in the standard curves obtained when
using the solid phase DMMB assay for analyzing keratan sulfate, chondroitin
sulfate C and chondroitin sulfate A standards. The most intense metachromasia
was obtained by SC, whiie the least intense was obtained by 6.
The equation for CSC, CSA, and KS linear curves were y=2780.7x + 20.6,
y=2434.9x - 51.3, and y=2279.1x - 82.8, respebively. Ail R~ values were
greater than 0.99. The ratio of the slopes of the curves for CSA/CSC was 0.88
while the ratio for KS/CSC was 0.82.
DMMB Saturation Assy
Altering the sarnple to dye volume ratio had no effect on the overall
standard curves. That is, the intensity of the metachromasia for each ratio in the
solid phase DMMB assay was similar (Figure 8). The equationç of the line for the
curve with a ratio of 0.1 was y = 2738.4~ - 17.9. For the ratio of 0.222, the
equation of the line was y = 2836.7~ - 131.6, and the equation of the line for
the ratio of 0.0377 was y = 2833.5~ - 85.9. AI1 R~ values were greater than
0.99. While al1 sample volume to dye ratios resulted in linear curves, a more
pronounced toe was observed within the iarger ratios, indicated by the large
intercept.

er CSA :
Standard (rnicrograms)
Fig. 7. Standard curves for CSC, CSA, and KS as deterrnined by the solid phase DMMB assay.

-- --- -- - - - .- O ratio = 0.1 -- --- ' ei ratio = 0.0377
- -- 2 --- ~7atio-=-Û;-222-
0.5 1
CSC (rnicrograms)
Fig. 8. Effed of altering the sample volume and dye volume ratio in the solid phase DMMB assay.

Rpcponse Test
The lines generated by plom-ng the sGAG measured in each synovial fluid
sample and papain blank against the pg of added CSC all appeared linear (Figure
9). The equation for the line for the papain blank is y = 1 . 2 1 ~ + 0.16. The
equation for Sample 1 is y = 0 . 8 8 ~ + 0.95, and the equation for Sample 2 is y
=0.11x + 0.97. The dope for sarnple 1 and the papain blank are greater than 1,
while the slope for Sample 2 is less than 1.

h A 8 E 1.75
2 A - m g' 1.5
L 0 .- eJ @
E 1-25 V i-i * Papain w 11 Sample 1 5 16 A SampIe 2 m H 0.75 -
CSC added (micrograms)
Fig. 9. Correlation between exogenous administration of CSC and the amount of sGAG measured in the samples. The solid black line represents the 'perfect' correlation that occun when the pg of CSC added equals the pg of sGAG measured by the solid phase DMMB assay.

Nudeic Acids as In ferfering SuOsfances
There was no difference in sGAG measurements between aliquots of
synovial fluid that had or had not been digested with DNase and RNase
(p=0.193). This is illustrated in Figure 10 below.
Enzymatï'c D@est?on of Synovia/ F/uid
As shown in Figure 11, the samples of synovial fluid digested with papain
alone (P) consistently had higher sGAG values (approximately 2 fold), than those
sample samples digested with Sfrepfomyms hyaluronidase alone (H), or
digested with hyaluronidase and papain (8) sequentially. There was a difference
between H and P (p = 0.027), and B and P (p = 0.043), but no difference
between B and H (p = 0.391). The sGAG concentration in Sarnple 1 was
consistently higher than in Sample 2. It is impossible to compare these values to
non-digested SF samples, since undigested SF forrns a stringy precipitate
immediately upon addition of the DMMB dye.
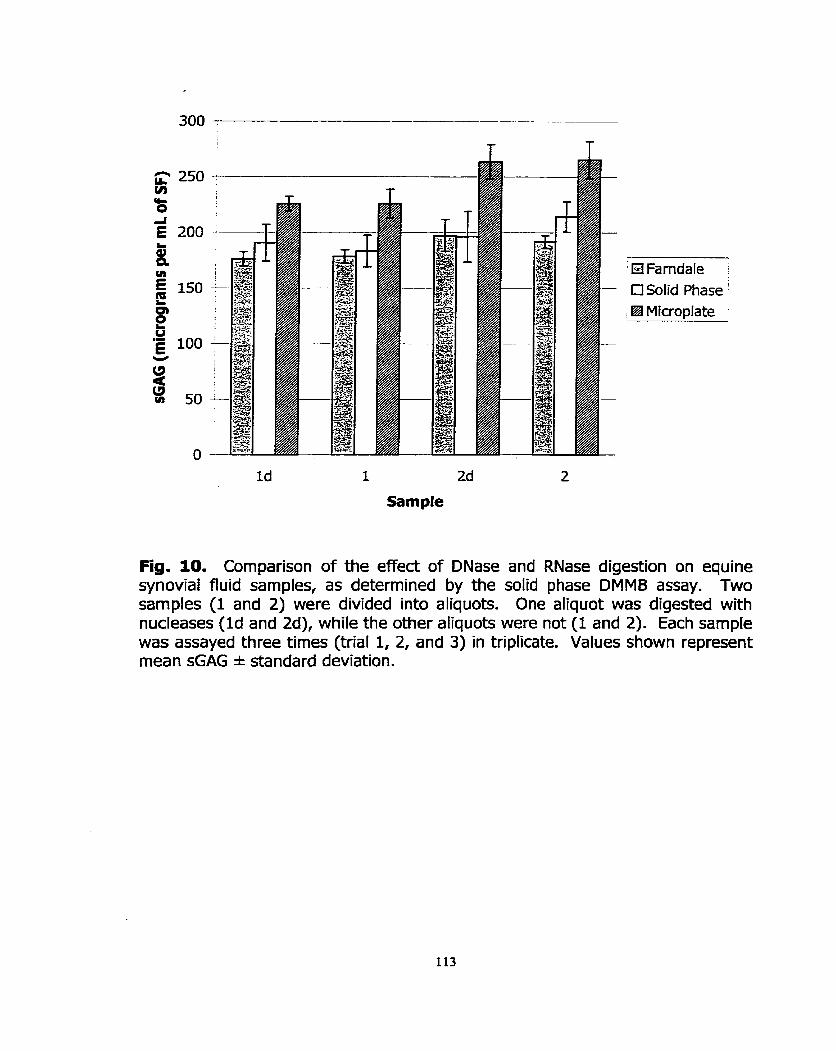
-
HFarndale :
Ci Solid Phase ' El Microplate
Fig. 10. Comparison of the effect of DNase and RNase digestion on equine synovial fluid samples, as determined by the solid phase DMMB assay. Two samples (1 and 2) were divided into aliquots. One aliquot was digested with nucleases (Id and Zd), while the other aliquots were not (1 and 2). Each sample was assayed three tirnes (trial 1, 2, and 3) in triplicate. Values shown represent mean sGAG * standard deviation.

' El Farndale [3 Solid Phase '
Microplate
Fig. 11. Solid phase DMMB measurement of sGAG in two synovial fluid samples (1 and 2) that had been digested with Sbepfmyces hyaluronidase (hence Hl and HZ), papain ( P l and PZ), and both enzymes sequentially (BI and B2). Each sample was rneasured by each assay three times (trials 1, 2 and 3) in triplicate. Values shown represent mean sGAG * standard deviation.
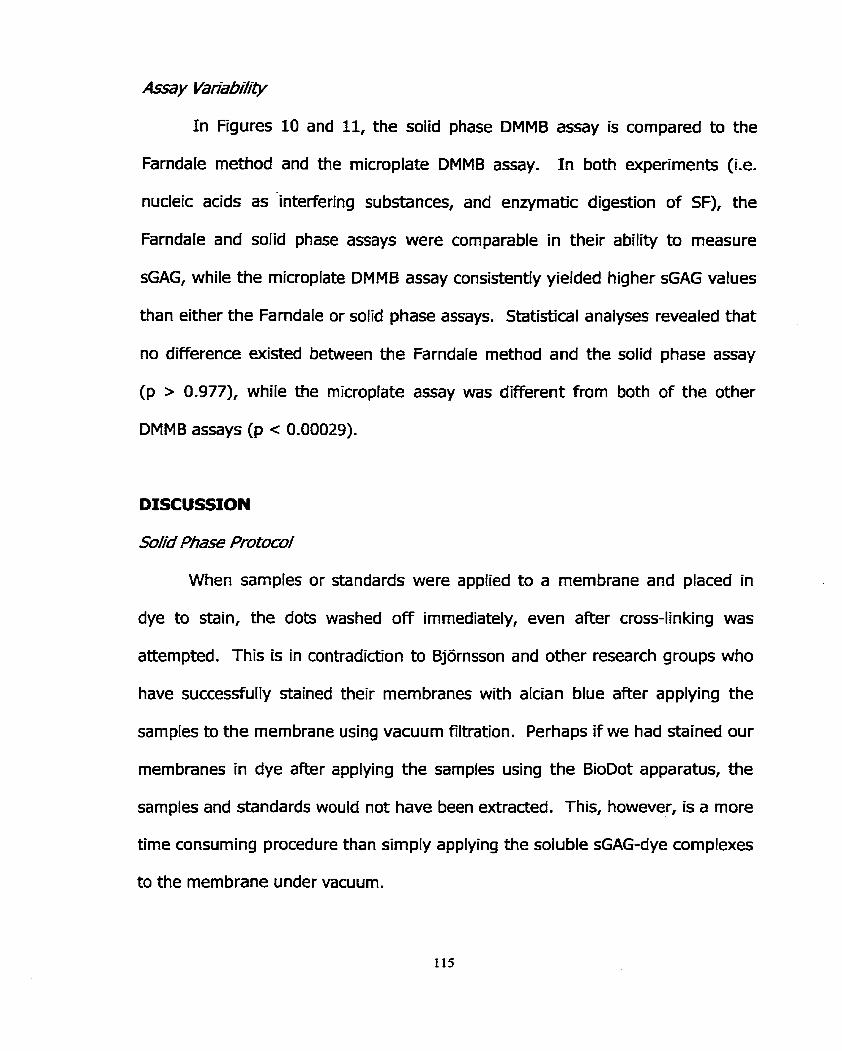
Assay Variabifity
I n Figures 10 and 11, the solid phase DMMB assay is compared to the
Farndale method and the microplate DMMB assay. I n both experiments (i.e.
nucleic acids as interfering substances, and enzymatic digestion of SF), the
Farndale and solid phase assays were comparable in their ability to measure
sGAG, while the microplate DMMB assay consistently yielded higher sGAG values
than either the Farndale or solid phase assays. Statistical analyses revealed that
no difference existed between the Farndale method and the solid phase assay
(p > 0.977), while the microplate assay was different from both of the other
DMMB assays (p < 0.00029).
DISCUSSION
SoHd Phase Protom/
When samples or standards were applied to a membrane and placed in
dye to stain, the dots washed off immediately, even after cross-linking was
attempted. This is in contradiction to Bjornsson and other research groups who
have successfully stained their membranes with alcian blue after applying the
samples to the membrane using vacuum filtration. Perhaps if we had stained Our
membranes in dye after applying the sarnples using the BioDot apparatus, the
samples and standards would not have been extracted. This, however, is a more
time consuming procedure than simply applying the soluble sGAG-dye complexes
to the membrane under vacuum.

If the dye was placed in the wells direcüy following application of the
samples, uniforrn coloured dots were not consistently created. Only by applying
the soluble sGAG-dye complexes to the membrane using the BioDot vacuum
filtration apparatus could reliable dots be formed and analyzed by scanning
densitometry.
The modified DMMB assay can be performed using various types of nylon
membranes ( S E Nytrana SuPerCharge, ~eta-probem, Hybond -N). Neither
filter paper nor nitrocellulose paper appear to be acceptable membranes as the
dye-sGAG complexes do not seem to bind well (the colour appears faded) or
there iç a substantial amount of lateral diffusion. Bjornsson used polyvinylidene
fiuoride membrane, but we did not attempt to use this membrane.
PreparaUon of a S&ndard Cuwe
A colour scanner must be employed for this assay. If the image is
scanned using the "sharp black and white photo" mode, the assay is not valid.
This is because it is not simply the density of the sGAG-dye complexes that is
being measured. Indeed, the individual colour components are important at
different concentrations of sGAG. At the lower concentrations, the red
component is predominant; green is intermediate, and blue does not contribute
to the density readings. As sGAG concentrations increase, the green component
increasingly contributes to the density readings. Red reaches a maximum
density at a much lower sGAG concentration than the green component. At high

sGAG concentrations, the green and red components have reached maximum
density values, while the blue plays only a small role in the overall density of the
sample. The green component shows the greatest contrast with increasing
concentrations of CSC.
The solid phase DMMB assay can accurately detect as low as 200
nanograms of sGAG. The linear range of the solid phase DMMB assay was
consistently found to be between 0.2 and 1.6 pg CSC, while the Farndale assay
was linear between 5 and 25 pg CSC.
Readlon of DMMB wim Varios Con&o/ Reagen fs
CSC resulted in a more intense rnetachromasia than observed for CSAI
which, had a more intense rnetachromasia than W. This confirms findings from
a plethora of studies including Warren et al. (2000), Farndale et aL (1982),
Farndale et a/. (1986), Chandrasekhar etaL (1987), Templeton (1988), Goldberg
and Kolibas (1990), and Alwan et aL (1991). The difference in intensity between
KS and the two chondroitin sulfate standards had been hypothesized as being
due to KS not containing glucuronic acid. KS therefore lacks one negative charge
compared to CSA or CSC (3). This theon/ is somewhat flawed, as it does not
explain the difference in intensity between CSC and CSA, which (theoretically)
possess the same charge density. Perhaps the difference in the intensity of
rnetachromasia between CSC and CSA iç sirnply attributable to the inherent

molecular heterogeneity of glycosaminoglycans, or accessibility of the dye to the
sulfate groups.
According to Bjornsson (1998), an equal response is required with al1 the
different types of GAGs in order to quantitate sarnples with unknown types of
GAGs. By convention, however, we chose to use CSC throughout this study.
Researchers, in general, deem this a suitable pradice since chondroitin sulfate
side chains are much more abundant on aggrecan than KS (1). One must bear
in mind, however, that in doing so, the KS content of the sarnples is being
underestimated. I n heaith, this may not be an important concern, but in disease
states where altered mechanisms exist, differing amounts of KS and CS may be
important.
To date, the mechanism of the reaction between the dye 1,9-
dirnethylrnethylene blue and sGAG remains unclear. In order to understand the
readion of the different GAGs with DMMB, this rnechanism must be elucidated.
DMMB Satura fion Asay
No other research group appean to have examined the effect of varying
the sample volume to dye ratio. Since different research laboratories are using a
rnyriad of protocols, each having different sample volume to dye rations, we felt
that this was an important aspect of the assay to examine. I n general, the
sarnple volume to dye ratio did not appear to be an important consideration in
the DMMB assay.

Repense T i
Since the slope for Sample 2 was iess than 1, there are substances
present in the synovial fiuid sample that are interfering in the DMMB assay.
Conversely, Sarnple 1 and the papain blank are overestïmating the sGAG
concentration in the samples. AI1 curves appeared linear, indicating that there
was no saturation.
Nudeic Acids as Intehiering Subs&aces
Polyanionic molecuies such as DNA and RNA are believed to interfere in
the DMMB assay. Dey et al. (1992) found that addition of 40 pgfml of DNA
caused a negative interference when the CSC concentration was greater than 10
pg/rnl. Interference was observed at concentrations greater than 20 pg of DNA
or RNA per ml. Almost 100% interference was observed upon addition of 40
pg/ml of both DNA and RNA, but this could be elirninated by the use of
nucleases. The research group of Dey does concede, however, that these high
concentrations of nucleic acids that are unlikely to be found in biological fluids,
except perhaps in synovial fluid collected from patients with rheumatoid arthritis.
I n contrast to Dey et al. (1992), the methods of Farndale et al. (1996),
and Goldberg and Kolibas (1990) did not find nucleic acids to interfere in the
DMMB assay, due to specific modifications (e.g. low pH and high salt
concentration, or addition of bovine serurn albumin). Under these reaction

conditions, the absorbance produced by DNA in the presence of the dye was
negligible.
Our results indicate the nucleic acids are not important interfering
substances in equine synovial fluid from non-septic joints. Synovial fluid typically
has fewer than 500 cells per ml (17). Since synovial fiuid is not highly cellular,
and since most research groups centrifuge their synovial fluid samples
immediately upon acquisition, it is not surprising that nucleic acids do not exist in
significant concentrations in SF.
EnzymaOë DDigeon of Synovia/ Nuid
Dey etaL (1992) stated that synovial fluid samples must be treated with
either papain or Sfjreptomyces hyaluronidase or a mass of purple precipitate
forrns upon addition of the DMMB dye. Our findings are in contradiction with this
staternent. Papain is a protease (E.C.3.4.22.2) that hydrolysis proteins with a
broad specificity of peptide bonds, with preference for residues bearing large
hydrophobic side-chains at P2, but does not accept Valine at PI'. I n synovial
fluid, papain is believed to release GAG from the core protein (Palmer et a/.
1995). In contrast, Sb-epomyces hyaluronidase (E.C. 3.2.1.35) is a
hyaluronoglycosaminidase that results in the random hydrolysis of 1,4-linkages
between N-acetyl-P-D-glucosamine and D-glucuronate residues in hyaluronic

acid2. I n synovial fiuid, hyaluronidase is used to decrease interference caused by
hig h concentrations of hyaluronic acid.
The findings of this current study confirm Our previous observations (18).
Regardless of the actual mechanism of the action of the enzymes (mentioned
above), these results clearly indicate that hyaluronidase and papain can not be
used interchangeably.
Assy Repeai%i/'ty
I n terms of repeatability between trials, the solid phase DMMB assay
appeared comparable to the Farndale rnethod and the microplate DMMB assay,
which were previously found to be highly repeatable (18).
The microplate DMMB assay consistently gives results that are statistically
higher than both the soiid phase DMMB assay and the Farndale method. I n
contrast, the sGAG rneasurements obtained by the solid phase assay are not
statistically different from those deterrnined by the Ferndale method. It was
unexpected that the Farndale method and the microplate DMMB would not yield
sirnilar sGAG concentrations since the only difference between the microplate
and solid phase assay are the sample volumes, and the sample to dye volume
ratios, which were shown to have no affect on the either assay. The difference
in response in the microplate DMMB assay may be attributable to a timing issue.
I n the Farndale method, samples are mixed with the dye and read immediately
at AN. I n the microplate DMMB assay, the time between addition o f the dye to
the samples, and rneasuring the absorbance at A540 k prolonged, due To the time
it takes to pipette the dye into al1 wells, and the sequential reading of the
samples by the rnicroplate reader.
The solid phase DMMB assay, compared to the Farndale method,
alleviates the concern of premature precipitation of the sGAG-dye complexes. It
can detect nanograrn quantities of sGAG in synovial fluid digests, and can be
used qualitatively or quantitatively. The solid phase DMMB assay req uires small
sample volumes (1 to 2 pl) cornpared to the Farndale DMMB assay (501 pl), and is
more rapid and less labour-intensive. Additionally, a large number of samples
can be processed by the solid phase DMMB assay in a fraction of the time that it
would take by the Farndale method assay. Finally, the solid phase assay may
provide a permanent record of the results; an attribute that no other DMMB
assay can claim.

REFERENCES
1.
2.
3.
4.
5.
6.
7.
8.
9.
10.
Il.
Ayad S. (1994) The Extracelluar Matrix Factsbook. Acedemic Press, Toronto.
Bjornsson, S. (1993) Simultaneous preparation and quantitation of proteoglycans by precipitation with alcian blue. Ana/Biochem 210, 282-91.
Bjornsson, S. (1998) Quantitation of proteoglycans as glycosaminoglycans in biological fluids using an alcian blue dot blot analysis. Ana/Biochem 256, 229-37.
Buee, L., Boyle, N. J., Zhang, L. B., Delacourte, A., and Fillit, H. M. (1991) Optimization of an alcian blue dot-blot assay for the detection of glycosarninoglycans and proteoglycans. Anal Biochem 195, 23842.
Chandrasekhar, S., Esterman, M. A., and Hoffman, H. A. (1987) Microdetermination of proteoglycans and glycosaminoglycans in the presence of guanidine hydrochloride. Ana/Biochem 161, 103-8.
Dey, P., Saphos, C. A., McDonnell, J., and ~oore, V. 1. (1992) Studies on the quantification of proteoglycans by the dirnethylrnethylene blue dye- binding method. Specificity, quantitation in synovial lavage fluid, and automation. Connecf 7ï.sue Res28, 317-24.
Farndale, R. W., Buttle, D. J., and Barrett, A. 3. (1986) Improved quantitation and discrimination of sulphated glycosarninoglycans by use of dimethylrnethylene blue. B/och/in Biophys Anfa 883, 173-7.
Farndale, R. W., Sayers, C. A., and Barrett, A. 3. (1982) A direct spectrop hotometric microassay for sulfated. glycosaminoglycans in cartilage cultures. Connecf ;r/ssue Res 9, 247-8.
Ghosh, S., Gepstein, S., Heikkila, J. J., and Dumbroff, E. B. (1988) Use of a scanning densitometer or an EUSA plate reader for measurement of nanogram amounts of protein in crude extracts from biological tissues. Ana/ B'ochem 169,227-33.
Hay E.D. (1991) in Cell Biology of Extracellular Matrix (Hay E.D., Ed.), Plenum Press, New York.
Lehninger A.L., Nelson D. N., and Cox M. M. (1993) Principles of Biochemistry, Worth Publishers, New York.
12. Okumura, M., Tagami, M., and Fujinaga, T. (1998) Measurement of serum and synovial fluid keratan sulphate and antibody to collagen type II in equine osteoarthritis. Zenfra/O/ VeterinarmmedA 45, 513-6.
13. Platt, D., Bird, J. L., and Bayliss, M. T. (1998) Ageing of equine articular cartilage: structure and composition of aggrecan and decorin. Eqoine Vet J 30,43-52.
14. SAS Institute Inc, SAS STAT. (1997) Software: Changes and Enhancements through Release 6.12. 1167. Cary, NC, SAS Institute Inc.
15. Taylor, K. B. and Jeffree, G. M. (1969) A new basic metachromatic dye, I:9- dirnethyl methylene blue. Hisfochem 3 1, 199-204.
16. Templeton, D. M. (1988) The basis and applicability of the dimethylmethylene blue binding assay for sulfated glycosarninoglycans. Connect 7/ssue Res 17/23-32.
17. Todhunter R.J. (1996) In Joint Disease in the Horse (Mdlwraith C.W. and Trotter G.W., Eds.), W.B.Çaunden Company, Philadelphia.
18. Warren S., Hurtig M.B., Wright J.R., Keates R.A., and Lumsden J.H. (2000) A Critical Analysis of the 1,9-dirnethylmethylene Blue Assay for Sulfated Glycosarninoglycans in Synovial Fluid. MSc thesis, University of Guelph.

CHAPTER 4: MANUSCRIPT 3
Analysis of Equine Synovial fluid from Diseased and Non-Diseased Joints

SUMMARY
Tmurnatic joint injuries and joint disease are major causes of lameness in
athletic horses. If untreated, these injuries will eventually lead to osteoarthritis
(OA). While many research groups have attempted to identify 'markers' of joint
disease, we propose that a 'synovial fiuid profile' (akin to a CBC, or blood
biochemistry profile), is a better approach to evaluate the health status of a
joint. I n contras to other studies, the sulfated glycosaminoglycan (sGAG)
concentration was lower in diseased joints, compared to non-diseased joints
(p = 0.0001). While total protein and nucleated cell counts (NCC) were elevated
in diseased joints, presurnably reflectïng inflammation, these were not significant
at the 95% Ievel. The only important correlation between TP, NCC, and sGAG
was found between protein and sGAG in diseased joints (r = 0.6, p = 0.0066).
This study confirmed that sGAG measurements obtained by the new, solid phase
DMMB assay (Warren e t a/2000), and the spedrophotometric assay of Farndale
et a/ (1982), are identical, while sGAG concentrations determined by the
microplate DMMB assay are different (p < 0.044). Nonetheless, no reliable
marker of joint disease has been acknowledged to date.

INTRODUrnON
The study of osteoarthritis (OA) is important in veterinary medicine since
joint injury and joint disease are the major causes of lameness in athletic horses.
I n turn, lameness is the most important cause of wastage in these horses
(Rossdale et a/ 1985; Fuller et al 1996; Mdlwraith 1996; Brama et a/ 1999).
While acute injuries in athletic horses do not, by definition, fall under the
category of OA, traumatic injury in conjunction with inflammation of the synovial
membrane, joint capsule, and associated ligaments cornmonly lead to OA
(McIlwraith 1996). Traumatic injuries encompass synovitis, capsulitis, articular
cartilage and bone fractures, and ligament tearing. These injuries lead to OA if
left untreated, or are inadequately treated (Todhunter et a/ 1993; McIlwraith
1996; Todhunter et a/ 1997).
Osteoarthritis, also referred to as degenerative joint disease (DJD), is a
group of disorden characterized by alterations in articular cartilage metabolism,
leading to a physical degeneration of the cartilage, accompanied by changes in
the bone and soft tissue of the joint (Todhunter et al 1993; McIlwraith 1996;
Tod hunter et a/ 1997). Grossly, OA is recognized by the presence of fibrillation,
partial or full thickness erosions of articular cartilage, and Wear lines (McIlwraith
1996).
Articular cartilage is comprised of chondrocytes embedded in an
extracellular matrix of collagen, proteoglycan, non-colfagenous proteins, and
water. The compressive stifTness of the extracellular matrix afforded by the high

water content permits articular cartilage to withstand deformation during joint
articulation (Palmer et a/ 1995; Little et a/ 1999). Proteoglycans, predominantly
in the form of aggrecan, represent the major components of the articular
cartilage matrix (10% cartilage on a dry weight basis), and are essential for the
normal function of these tissues (Alwan et a/ 1990). Aggrecan is a complex
structural macromoiecule composed of a hyaluronic acid back bone, non-
covalently Iinked to approximately 100 core proteins, that each have hundreds of
covalently Iinked sulfated glycosaminoglycan side chains (Todhunter 1996; Platt
et a1 1998). The aggrecan core protein is divided into several globular (G) and
extended regions. G1 and G2 are located near the amino terminus while G3 is
located at the carboxy terminus. The extended region between G2 and G3
contains a keratan-sulfate rich region, a random chondroitin sulfate-rich region,
and a clustered chondroitin sulfate-rich region (Viiim and Fosang 1993).
Proteolytic attack by matrix rnetalloproteinases between G1 and G2 is a prirnary
event in turnover of aggrecan (Vilirn and Fosang 1993).
I n chronic inflammation and degenerative joint disease (osteoarthritis),
alterations in PG structure, concentration, or changes in compressive stiffness of
AC contribute to cartilage degeneration. Proteoglycans are major targets of
deg radative enzymes in osteoarth ritis. These proteases are released from
inflammatory cells or by chondrocytes (Alwan et a/ 1991; Palmer et a/ 1995;
Fuller et a/ 1996). Moreover, cytokines (such as interleukin-1 and tumour
necrosis factor alpha) are released during the synovitis that accompanies joint

disease. These factors cause chondrocyte-mediated destruction of the articular
cartilage through an upregulation of neutral rnetalloproteinases that degrade the
core protein of aggrecan (Todhunter eta11997).
Metalloproteinases such as strornelysin (MMP-3), and collagenase (MMP-1)
are considered to play a major role in AC degradation. These enzymes are
secreted as latent proenzymes, and are activated extracellularly by serine
proteinases. For example plasmin activates strornelysin, which, in turn, activates
collagenase. Metalloproteinases are inhibited by tissue inhibitors of
rnetalloproteinases (TIMP) (Mdlwraith 1996). Joint destruction is characterized
by an imbalance between the enzymes catalyzing cartilage breakdown, and
reparative processes resulting in cartilage regeneration (Todhunter etai1993).
During normal cartilage turnover, a small amount of low molecular weight
proteoglycans (i.e. PG fragments) are released into the synovial fluid (SF).
Erosion of AC in OC, however, resultç in the release of higher molecular weight
PG fragments, aggregates, and collagen breakdown products (Alwan et a/ 1990;
Tularno et a/ 1996). Breakdown molecules are either engulfed by chondrocytes
or diffuse into the SF to ultimately reach the blood and urine (Todhunter et a/
1993; Vilim and Fosang 1993; Okumura et a/ 1997; Okumura et a/ 1998).
Depletion of aggrecan from the cartilage matrix compromises the ability of the
AC to bear weight, and further contributes to mechanical disruption of the
cartilage (Little et a/ 1999).

Synovial fiuid (SF) is an ultrafiltrate of the plasma that contains
rnononuclear cells (90% of which are synovial lining cells, monocytes and
lymphocytes), and polyrnorphonuclear leuokocytes. Normal equine SF contains
fewer than 500 nucleated cells per microlitre. Due to the high concentration of
hyaluronic acid (0.5 mg/ml), SF is viscous in nature (Todhunter 1996). Synovial
fluid functions to lubricate and protect the joint and to supply nutrients to
am'cular cartilage (Palmer and Bertone 1994).
Other roles attributable to HA in synovial fluid include space filling,
lubrication, absorption of some of the energy generated by movement and
support of transient sheer stresses (Todhunter 1996). HA may also play a role in
modulating chernotactic, proliferative, and phagocytic responses of infiammatory
cells, inhibiting the release of PGs from cartilage, regulating oxidative darnage,
endogenous stimulation of interleukin-1, and the regulation of the rate or
proliferation of endothelial cells and fibroblasts (Saari et a/ 1989; Tulamo et a/
1994).
Racehorses with large osteochondral injuries such as intra-articular chip
fractures have a poor prognosis for future racing, and a predisposition to develop
OA (Todhunter et a1 1993). Thus, early detection and treatment of OA would be
invaluable (Todhunter et a/ 1997). Current methods typically employed by
veterinarians to evaluate joint disease in the horse include radiography,
fluoroscopy, and clinical evaluation (Palmer etd1995). By the time radiographic
changes are evident, however, structural alterations in AC are irreversible

(Todhunter et a/ 1997). Empowered with this knowledge, many research groups
sought means to assess the extent of AC destruction in vivo prior to observing
radiographie changes. Armed with a "marker" of joint disease, clinicians would
be able to select appropriate treatment, prevent the development of OA, predict
future athletic performance, assess the severity of disease, predict and rnonitor
response to treatment, and identify mechanisrns of OA at the rnolecular level
(Todhunter et a/l997; Okumura et a/ 1998).
I n their zeal to identify markers of OA, researchers have examineci
chondroitin sulfate, KS, link protein, cartilage oligorneric protein, and Type II
collagen peptide (CPII) concentrations (Myers et a/ 2000). Many groups have
evaluated total protein, and total nucleated cell counts or leukocyte counts as an
indicator of inflammation. Keratan sulfate is considered a putative rnarker of
articular cartilage catabolism since 99% of the keratan sulfate (KS) is confined to
the articular cartilage bound to aggrecan, especially in the deep zones of the AC
(Palmer et a/ 1995; Okumura et a/ 1997). Moreover, KS is a more sensitive
rneasure of cartilage activity since chondroitin sulfate has a more general
localization in connective tissues than KS (Frisbie et a/ 1999). The chondroitin
sulfate epitope 846 (CS846), and the carboxy propeptide of Type II procoliagen
(CPII) purportediy measure aggrecan and Type II procollagen synthesis,
respectively (Frisbie et a/ 1999). According to Palmer et al. (1995), a correlation
between synovial fuid total protein (TP) and sGAG concentration is expected
since inflammation is associated with increased blood flow and capillary
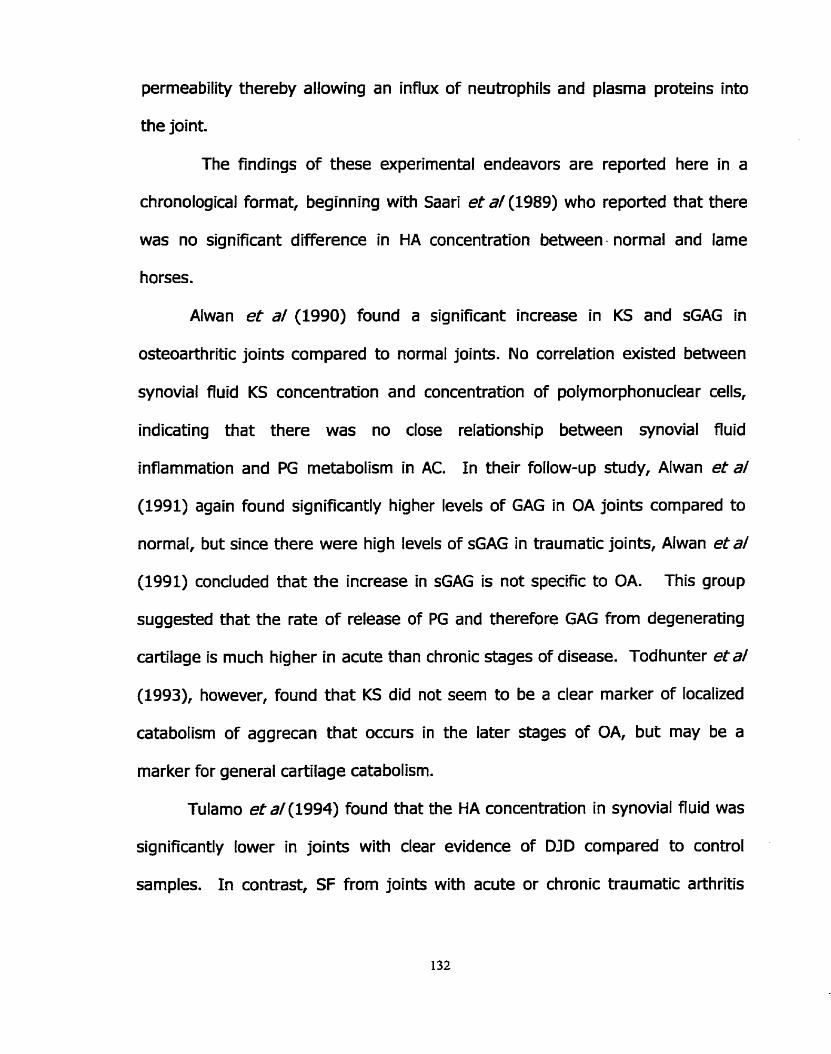
permeability thereby allowing an influx of neutrophils and plasma proteins into
the joint.
The findings of these experimenta! endeavors are reported here in a
chronological format, beginning with Saari et d(1989) who reported that there
was no significant difference in HA concentration between - normal and lame
horses.
Alwan et a/ (1990) found a significant increase in KS and sGAG in
osteoarthritic joints compared to normal joints. No correlation existed between
synovial fluid KS concentration and concentration of polymorphonuclear cells,
indicating that there was no close relationship between synovial fluid
inflammation and PG metabolism in AC. I n their follow-up study, Alwan et a/
(1991) again found significantly higher levels of GAG in OA joints compared to
normal, but since there were high levels of sGAG in traumatic joints, Alwan et&
(1991) concluded that the increase in sGAG is not specific to OA. This group
suggested that the rate of release of PG and therefore GAG from degenerating
cartilage is much higher in acute than chronic stages of disease. Todhunter etal
(1993), however, found that KS did not seern to be a clear marker of localized
catabolism of aggrecan that occurs in the later stages of OA, but may be a
marker for general cartilage catabolism.
Tulamo et a/ (1994) found that the HA concentration in synovial fiuid was
significantly lower in joints with clear evidence of DID compared to control
samples. I n contrast, SF from joints with acute or chronic traumatic arthritis

tended to have lower, but not significant, HA concentrations compared to control
samples. No correlation was observed between WBC, TP, or the concentration o f
HA in any disease group. Thus, Tulamo et a/ (1994) reported that HA is not
diagnostically useful for differenüating acute or chronic arthritis in the horse.
Palmer etd(1995) found a significant increase in total sGAG, CS, and KS
in diseased joints compared to normal joints. Moreover, a highly significant
correlation between sGAG and WBC, and sGAG and total protein was observed.
Concentration of HA (deterrnined by a colourirnetric assay) was not significant in
any category, and no correlation between sGAG and HA concentration existed.
Tulamo et a/(1996) found that HA concentrations were significantly lower
in chronic traumatic arthritis (including joints with DJD, intra-articular fractures,
and infedious arthritis) compared to control samples. No difference was found in
HA concentrations in joints with acute injuries compared to normal joints.
I n contradiction with other studies, Todhunter et a/ (1997) found that SF
from carpal joints with OA had a lower KS concentration compared to normal
joints. Todhunter suggested that this might indicate that the cartilage is in an
advanced stage of disease characterized by loss of cartilage mass. I n turn, less
PG are available for degeneration by rnetalloproteinases and therefore, less PG
fragments will be elaborated into body fiuids.
I n the study by F risbie et a/ (1999), no difference between radiocarpal
and intercarpal joint TP, WBC, CS846, CPII, or KS was observed. TP and CS846
were, however, sig nificantly increased in joints with osteochondral

fragmentation. Frisbie e t a/ (1999) suggested that a low concentration of CS846
in joints with grade three or four OC might represent an inability of the cartilage
to carry out reparative process, namely aggrecan synthesis (Frisbie et a/ 1999).
Clearly, myriad experirnents have been performed within the past
decade to identify a useful marker of OA. To date, findings remain controversial
and no clear marker has been acknowledged. This present çtudy was designed
to evaluate simple biochem ical parameters of synovial fluid from both diseased
and non-diseased joints. These parameters include nucleated cell counts, total
protein, and total proteog lycan concentration (measu red as sGAG). This data
will provide the first of several steps required to identify important biochernical
constituents of SF that should be included in a 'synovial ffuid profile" (akin to a
CSC, or blood biochemistry profile) in order to evaluate joint disease in horses.
We believe that a panel of SF constituents is required to determine the health
status of a joint, and that analysis of a single component of synovial fiuid is not
adequate, and may be misleading, in diagnosing the diseases status of a joint
METHODS AND MATERIALS
Materiab
EDTA coated vacutainersa were obtained from Becton Dickinson
VACUTAINERS Systems. 1,9-dimethylmethylene blue was purchased from
Aldrich Chemical Company. Papain, chondroitin sulfate C, and N-acetyl-1-
cysteine were purchased frorn Sigma Chemicai Company. Formic acid, sodium
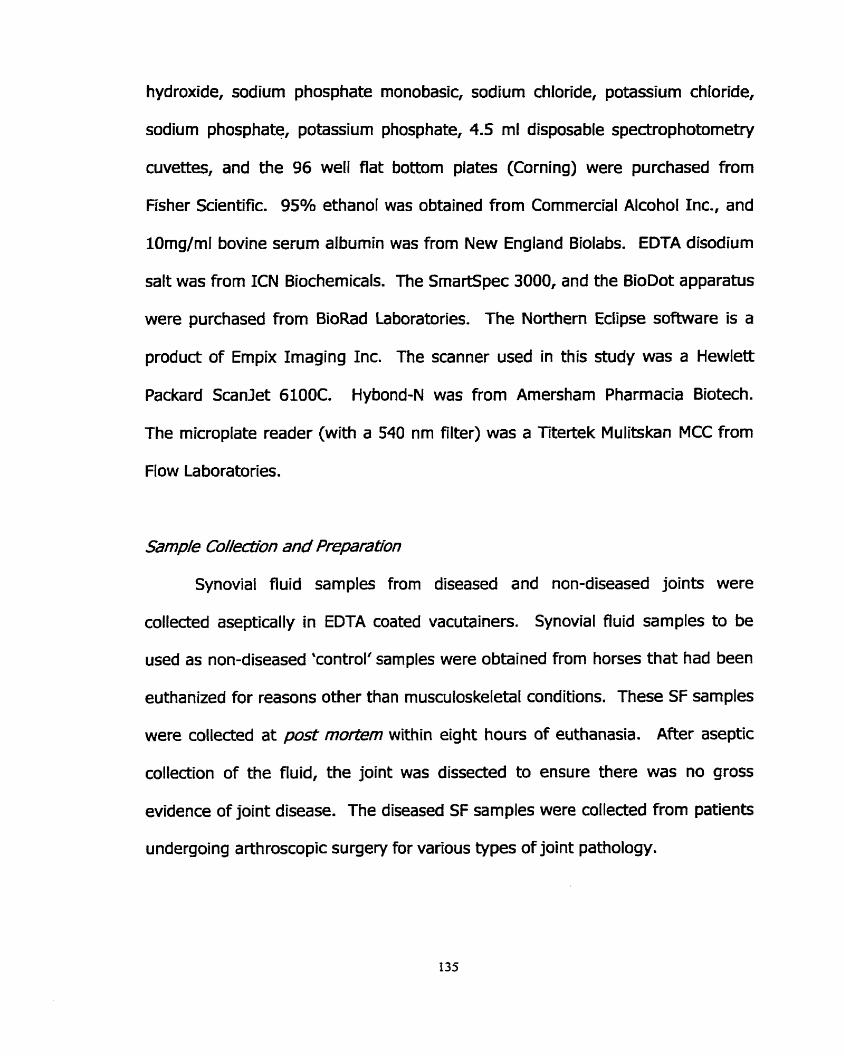
hydroxide, sodium phosphate monobasic, sodium chloride, potassium chloride,
sodium phosphate, potassium phosphate, 4.5 ml disposable spectrophotometry
cuvettes, and the 96 well Rat bottom plates (Corning) were purchased from
Fisher Scientific. 95% ethanol was obtained from Commercial Alcohol Inc., and
lOrng/rnl bovine serurn albumin was from New England Biolabs. EDTA disodium
salt was from ICN Biochemicals. The SrnartSpec 3000, and the BioDot apparatus
were purchased frorn BioRad Laboratories. The Northern Eclipse software is a
product of Empix Imaging Inc. The scanner used in this study was a Hewlett
Packard Scanlet 6100C. Hybond-N was from Amersham Pharmacia Biotech.
The microplate reader (with a 540 nm filter) was a Titertek Mulitskan MCC from
Flow Laboratories.
Samp/e Co//ectirün and Preparatfon
Synovial fiuid sam ples from diseased and non-diseased joints were
collected aseptically in EDTA coated vacutainers. Synovial fiuid sam ples to be
used as non-diseased 'control' sarnples were obtained from horses that had been
euthanized for reasons other than rnusculoskeletal conditions. These SF samples
were collected at post mo/tem within eight hours of euthanasia. After aseptic
collection of the fluid, the joint was dissected to ensure there was no gross
evidence of joint disease. The diseased SF samples were collected from patients
undergoing arthroscopic surgery for various types of joint pathology.

Irnmediately after collection, an aliquot of each sample was submitted to
the Animal Health Laboratory at the University of Guelph to measure total
protein, and nucleated ce11 counts. The remainder of each sample was
centrifuged at 3,500 rpm for 30 minutes at 4°C. The synovial fiuid supernatants
were decanted from the pellet and stored in aliquots at -80°C until time of
analyses (approximately 9-12 rnonths). According to Todhunter et a/ (1993),
and Alwan et a/ (1991) samples are stable for several years under these
conditions.
I n total, 21 samples of synovial fluid from diseased joints were collected
from 11 horses, while 13 samples of synovial fiuid from non-diseased joints were
collected from 4 horses. Two samples (#6 and 25, and #23 and 24) were
assayed in duplicate to serve as interna1 controls.
Of the samples collected frorn diseased joints, two samples were frorn
septic joints, sample #32 was from a horse used for research that involved
creating a focal cartilage defect: this sample was collected 15 days post-
operatively. Sample #31 was diagnosed with a focal cartilage defect, only.
Sample #33 was from a foai with a compound fracture of the ulna, and chip
fracture of 6. This sample was classified among the chip fracture group. The
remaining 12 samples were collected from horses with intra-articular 'chip'
fractures. A photograph of a typical chip fracture obtained during arthroscopie
surgery is presented in Figure 1.

Samples from non-diseased joints were collected from a total of four
horses. Samples #7 to #12 were collected from a young, healthy thoroughbred
that did not recover from a cryptorchid surgery. The remaining samples were
collected from horses euthanized due to chronic illnesses. Samples #13 and #14
came from a young horse with a chronic inflammation and ulceration of the
stornach causing malabsorption. This horse was euthanized due to lack of
response to treatment. Samples #15, #20, #21, and #22 were collected from a
horse with a plethora of problems including harsh lung sounds, anorexia,
depression, undiagnosed liver degeneration, and neoplastic cells identified on
abdominocentesis. Again, this horse was euthanized due to progressive
deterioration, and lack of response to treatment. Sample #28 was collected
from the tarsus of an adult racing Standardbred that was admitted for treatment
of colitis, and later euthanized due to poor response to treatment, and the
development of severe Iaminitis.

TABLE 1: Details concerning the equine synovial fluid samples included in this r t~dy . Age, breed, and sex of the home are provided in addition to a description of the lesion as diagnosed by the veterinary surgeon performing the arthroscopie surgery. Shaded cells represent samples collected from non-diseased joints.
Sam~le # 1 Aae 1 Breed 1 Sex 1 Descri~tion of ioint and disease status 1
1 13 1 TB 15 1 LFF. Fracture of proximal medial
LRC. Fracture of distal lateral radius.
2
RRC. Fracture of distal iateral radius. MC. Small osteochondral fragments from the d i a radiocarpal bone. LRC. Slab fracture of C3. UC. Cryptorchid surgery: did not recove r . K. Cryptorchid surgery: did not recover. LRC. Cryptorchid surgery: did not recover. RRC. Cryptorchid surgery: did not recove r . LFF. Cryptorchid surgery: did not recover. RFF. Cryptorchid surgery: did not recover.
3 TB S eminence of P l . LRC. Fracture of distal lateral radius.

ASB
ASB
Ara b
Ara b
Ara b
Ara b
SB
UC. Euthanized due to non- rnuscuIoskeletal condition. LRC. Euthanized due to non- musculoskeletal condition.
- - - - - - - - - -
WC. Euthanized due to non- rnusculoskeletal condition. UC. Chip fracture of radiocarpal bone,
MC. Small mur on radiocar~al bone. UC. Chip fracture of dorsal radiocarpal bone, with kissing lesion on C3. Severe DJD. -
RHF. Apical fracture of proximal sesamoid. Sever DJD. RRC. Euthanized due to non- musculoskeletal condition. LRC. Euthanized due to non- rnusculoskeletaI condition. W. Euthanized for non- musculoskeletal condition. UC. Severe synovitis with full thickness cartilage erosion on non- weig ht bearing surface of radiocarpal bone, and a 4-6 mm osteochondral defect on the lateral aspect of C3 against C4. Medial palmar intercarpal ligament partially tom. UC. Severe synovitis with full thickness cartilage erosion on non-weig ht bearing surface of radiocarpal bone, and a 4-6 mm osteochondral defect on the lateral aspect of C3 against C4. Medial palmar intercarpal ligament ~artiallv torn.

25 I T B I F 1 LRC. Slab fracture of C3
UC. Focal cartilage trauma of the 1 / TB 1 / distal radial caroal bane.
SB
TB
SB
TB
TB
F
Mc
M
M
M
32 33
eminence of P l .
RFF. Radiographs revealed mild periarticular osteophytes across the dorsal aspect of Pl . Medial aspect of the joint space was markedly narrowed. Severe DJD. UC. Fracture of intermediate carpal bone L n . Euthanized prirnarily due to a non-musculoskeletal condition. R stifie. Moderate suppurative arthritis. Likely septic. L stifle. Moderate to marked suppurative arthritis. Likely spetic.
34
Legend: TB = thoroughbred; SB= standardbred; QH = American quarter horse;
Adult 2mo.
SB = American saddlebred; Arab = Arabian; M = male, Mc = male, castrated; F = filly, LFF = left front fetlock; LRC = left radiocarpal joint; RRC, = right radiocarpal joint; RIC = rïght intercarpal joint; U C = left intercarpal joint; RFF = right front fetlock; RHF = rïght hind fetlock; LTT = left tibiotarsal joint; RS = right stifle; LS = left stifle.
2
TB TB
TB
M F
I - - -
ic. Focal cartilage defect. RIC. Compound fracture of ulnar
F
carpal bone and osteochondral fragment of lateral aspect of C4. RFF. Chip fracture of proximal rnedial

Fg 2: A ch@ fracture of 09e dista/ /atera/ radius of a home. 7;he severii'y of 0% /&un is somewhat reprinntative of the w~ of /&ims inciuded in this study.

Measurement of sGYG
The dye was prepared according to the method of Farndale et al. (1982).
5 ml of 95% ethanol was added to 16 mg of 1,9-dimethylmethylene blue for 30
minutes at room temperature. 2 ml of formate buffer (1.54 ml formic acid, 2.94
ml SN NaOH: made up to 500 ml, pH 3.5) was added and the volume was made
up to 1 L with water. The resultant dye (Ans - 0.34) was stored protected from
light at room temperature for 2 months. While some groups rnaintain the dye at
4OC, Farndale et al. (1986) report that the dye colour fades at this low
tem perature.
One ml of each sarnple was digested with an equal volume of papain [l
mg/rnl papain in papain digestion buffer (0.69 g sodium phosphate monobasic,
0.0326 g N-acetyl cysteine, 0.0769 EDTA tetrasodiurn salt, pH 6.5)]. The sGAG
content of each sample was measured using a new solid phase DMMB assay
(Warren S. et al 2000), the DMMB microplate assay (Goldberg and Kolibas
1990), and modified by Nancy Burton-Wurster at Cornell University, personal
communication), and the Farndale method (Farndale et al 1982).
Synovial fluid and papain digested synovial fluid adhered to both the
inside and outside of the pipette tips. For this reason, stock dilutions were
prepared (1:5, 1:10 and 1:20), and used throughout the study so pipetting
errors would be rninimized.
A papain blank was prepared by diluting 1 ml of a 1 mg/rnl of papain in
papain digestion buffer with 1 ml of HzO (instead of synovial fluid sample), and

digested at 65OC for 3 hours. The papain blank was diluted at the same dilutions
as the synovial Ruid samples (so the sarne amount of papain was present in al1
the samples and the blank), and run with each set of samples. The absorbance
or density of the blank was subtracted from each sample to correct for any
papain interference.
SohY Phase DMMB asay
Fifty microlitres of each sarnple and corresponding papain blank (from the
appropriate stock dilution of synovial fluid digests) was placed in a 1.5 ml
eppendorf tube. A 96 well BioDot vacuum filtration apparatus was assembled
using nylon membrane that had been briefly soaked in phosphate buffered saline
(PBS: 8 g NaCI, 0.2 g KCIf 1.44 g Na2HP04, 0.24 g KH2P04, made up to 1 LI pH
7.4). Directly before applying the sample to the membrane, 500 pl of DMMB dye
was added to the 50 microlitre sample, and the contents of the tube were
inverted 2-4 times to mix the solution to minimum extent required for complete
mixing. 100 pl of the sample-dye mixture was pipetted into a single well of the
BioDot apparatus with care so as not to introduce air bubbles. All samples were
applied in triplicate. The standard curve for this assay was determined with
Chondroitin Sulfate C mnging from O to 1.6 pg prepared frorn a 100 pg/rnl CSC
stock solution in water. Standards were prepared in a volume of 50 yl, and 500
yL of dye was added, and the solution mixed. Again, 100 pl of each standard-
dye mixture was applied in triplicate.

Once the nylon membranes were removed from the BioDot apparatus and
completely air-dried (the appearance of the dots changes drarnatically when dry,
and can not be analyzed when wet), a rapid estimate of sGAG in the test
sarnples could be obtained by visual cornparison with the standards. For
accurate quantitation, however, the samples and standards on the nylon
membrane were scanned in the 'sharp millions of col ours^', and densitometry
was performed. The line scan measurement function in the Northern Eclipse
imaging software program was used to measure the density of each dot. Any
program capable of densitornetry, however, would be suitable at this step. A
standard curve was prepared by plotting the density of the dots against the total
sGAG (pg), and the concentration of sGAG in each sarnple was determined from
this standard curve. This assay was performed three times on each sample, and
each was applied in triplicate.
M/a.op/afe DMMB &y
Fifty microlitres of the appropriate stock dilution of papain digested equine
synovial fluid and papain blank (typically 1:10) was applied to a single well of a
96 well flat bottom plate. Diredly before reading the absorbance at 540 nm on a
96 well microplate reader, 200 yL of DMMB dye was added to each well. The
samples were compared to a standard curve ranging from O to 2 pg of CSC
prepared from a 100 pg/ml stock solution in water. Al1 sarnples and standards
were applied in triplicate, and the assay was performed three times.

Farnda/e DMMB assay
Briefly, al1 standards (O to 25 pg from a 100 pg/rnl CSC stock in water),
samples, and papain blanks were prepared in 1.5 ml eppendorf tubes in a final
volume of 250 PL. Samples and the blank were usually diluted 1:5 with water.
Directly prior to measuring the absorbance at 525 nm, sarnples and standards
were transferred from the eppendorf tube to a disposable 4.5 ml
spectrophotometry cuvette, 2.5 ml dye was added, and the samples were gently
mixed by invertïng the cuvettes. This assay was performed once, and each
sample was measured in triplicate.
Pmteh Concenf;rafi'on
The protein concentration of the equine synovial fiuid sarnples was
measured in two ways. First, a hand refractorneter was utilized by the
technicians in the Animal Health Laboratory a t the University of Guelph. Second,
protein was rneasured by the BioRad Protein Assay, which is based on the
method of Bradford. Dye reagent was prepared by diluting 1 part of dye
concentrate with 4 parts of water. 10 pl of each sample and papain blank
(typically diluted 1: 10) was added to a single well of a 96 well Rat bottom plate,
in triplicate. 200 pl of diluted dye was added to each standard and the colour
was allowed to develop for at least 5 minutes, but no longer than 60 minutes. A
standard curve ranging from O to 5 pg bovine serum albumin (BSA) was

prepared with every assay from a 1 mg/ml solution of BSA. Protein assays were
done in triplicate for each sample.
StatM?ca/ Ana/ysk
Data were subjected to analyses using a mixed rnodel analysis of variance
(SAS Proc Mixed) to test for real differences due to assays (solid phase DMMB
assay, Farndale method, microplate DMMB assay), and outcome measures
(sGAG, TP, NCC) between diseased and non-diseased joints. P < 0.05 was
considered significant. Adjusted mean differences were considered insignificant
if the 95% confidence intervals on the means captured zero. NCC and sGAG,
NCC and TP, and sGAG and TP were examined for correlation using Pearson's
correlation CO-efficient for continuous type data. Again, P < 0.05 was considered
significant (SAS Institute Inc, 1997).
RESULTS
Samp/e Co//ectiron
Of the 19 different samples aspirated from diseased joints, 4 were from
fetlocks, 4 were from the radiocarpal joint, 8 were from the intercarpal joint, and
3 were from stifles. 12 of the 19 joints were diagnosed with 'chip' fractures.

Measuement of sG;AG
Proteoglycan concentration was rneasured as sGAG by three versions of
the 1,9-dimethylmethylene blue assay. Figures 2A and 2B compare the three
DMMB assays in their ability to measure sGAG. This figure shows that the
microplate DMMB assay typically affords higher sGAG concentrations than either
the Farndale method or the solid phase DMMB assay, while the latter two assays
generally yield similar sGAG concentrations.
Samples #23 and #24 (the interna1 control samples) had very similar
estimations of sGAG by al1 three assays (where microplate sGAG measurements
were higher than those determined by the Farndale method and the solid phase
DMMB assay). Samples #6 and #25 did not give matching sGAG measurement,
regardless of the assay.
The microplate DMMB assay was different from both the solid phase and
Farndale assays in ali instances (p c 0.0419), except from sarnples collected
from the stifies (p > 0.5165). I n contrast, the Farndale method and the solid
phase DMMB assay were the same (p > 0.1881). Since these results support
previous findings (Warren et a1 2000), only the solid phase sGAG measurements
were used for the remainder of the data analysis presented in this study.

1 2 3 4 5 6 7 8 9 10 11 12 13 14 15 16 17
Sarnple Number
Rg LA: sGAG concentmon i f eguine SF saqdes #1-17 as defemined by the soMphase DMlMB assafi the Famdale meilma and Me microp/ate DMMS as-
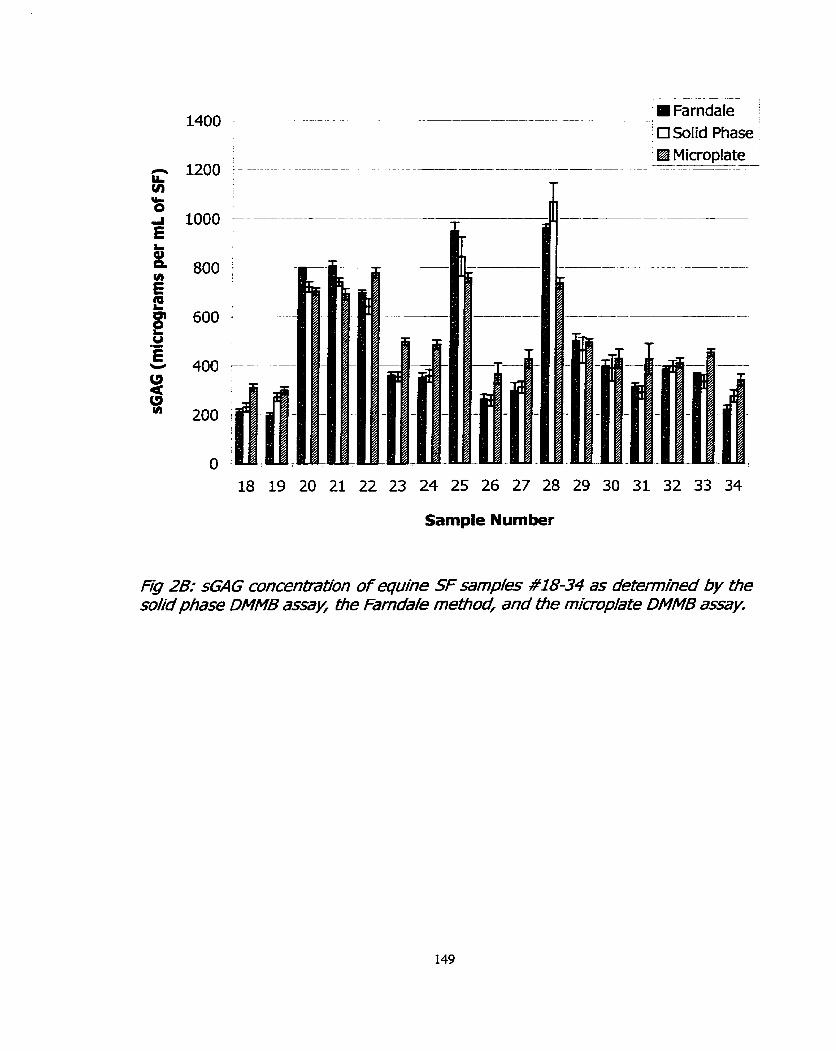
- --- --- mFarndaIe :
' 0 SoIid Phase '
Microplate -
-- A
-- -- - - - ---.-- - ------A-
T
19 20 21 22 23 24 25 26 27 28 29 30 31
Sample Number
Fg 2B: sEAG concenbation of equhe SF samp/ks #18-34 as determmied by the so l i phase DMMB assay, Che Farnda/e mefiod, and f ie microp/ate DMMB assay.

Figure 3 reveals that the concentration of GAG in non-diseased joints was
significantly higher than the diseased joints (p = 0.00001). Figure 4 shows the
sGAG concentration in synovial fluid samples that were categorized according to
the joint from which the samples were collected and disease status. This figure
reiterates the fab that sGAG concentrations in non-diseased joints were higher
than in diseased joints. Except for the radiocarpal joint, there was no overlap
between sGAG concentrations between diseased and non-diseased sarnples.
sGAG concentrations from non-diseased joints obtained from both the
fetlock (p = 0.0063) and intercarpal joints (p = 0.0002) were significantly higher
than the corresponding diseased joints. The mean sGAG concentrations were
not significantly different between any of the non-diseased joints (p > 0.73).
Except for the tarsus, the only difference in sGAG concentrations existed
behnreen the fetlock and the radiocarpal joint (p = 0.10). ,
Synovial fluid samples from joints with slab fractures had the highest
sGAG concentration (Figure 5 and 6). sGAG concentrations from al1 other
samples appeared similar. The largest number of horses had osteochondral
'chip' fractures (12/19), and interestingly, the sGAG concentrations were al1
within a narrow range (rnean = 304.8 pg/ml 1 41.9, range = 231.2 to 363.1
g l ) . I n the 4 horses used as non-diseased controls, the sGAG concentrations
overlapped in every group except the tanus, which was substantially higher than
all other samples.

.-
Diseased Non-diseased
Status
Rg 3: sG4G /n equine SF samp/s presented according fo disease sfatus. Crosses (+) repreent indivdua/ SF samp/pc, wwhie the bhck cirres (0)
represent the mean sGAG @g/mo in each category.
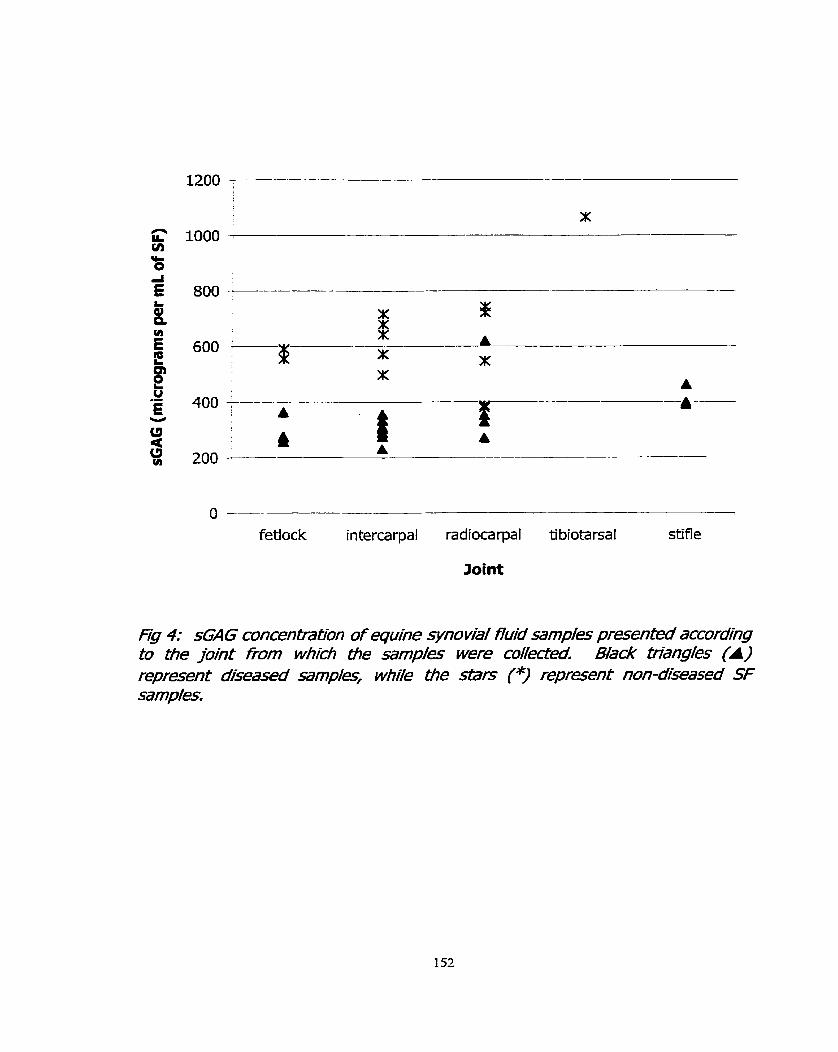
O - fetiock intercarpal radiocarpal tibiotarsal stifle
Joint
Fig 4: s(Z1IG concen&ation of equine synovhl fluid samp/es prpcented according Co ale joint fiom whidi He sam,d/es were cole~ed Black friangies (A) reprpcent ddisesed samp/esf wbi/e the BTS (*) represent non-dseased SF samples.

Slab Fracture Chip Fracture Focal AC . Osteophytes Spur Septic Trauma
Type of Injury
Fig 5: s 4 G concenfra~on in horses wnr/l various joint pat3?o/qies. The sfab fracture was fram home #e tfie ho~ses wib7 fow/ arl7cu/ar cartl7age trauma were #31, and 32; b7e h o ~ e w/O5 an osteopbyte was #26, b7e horse with a single SM spur was #= Ore foa/ wwi bvo sep0icjoints were samp/es #29, and 30; and the remaining samplpc were from hones wio, various osfeochondm/ 'ch@' fracfures.

Horse
Fg 6: &AG concenfiT-dtion in o<le four non-diseased conPo/ ho~es. Hotse A indudès samp/s #7-12 (fiom TaMe 1); fforse B idudës samp/ks #13 and 14; Home C inc/udes sarnp/es #1~20,21, and 22; Horse D is m e #28.
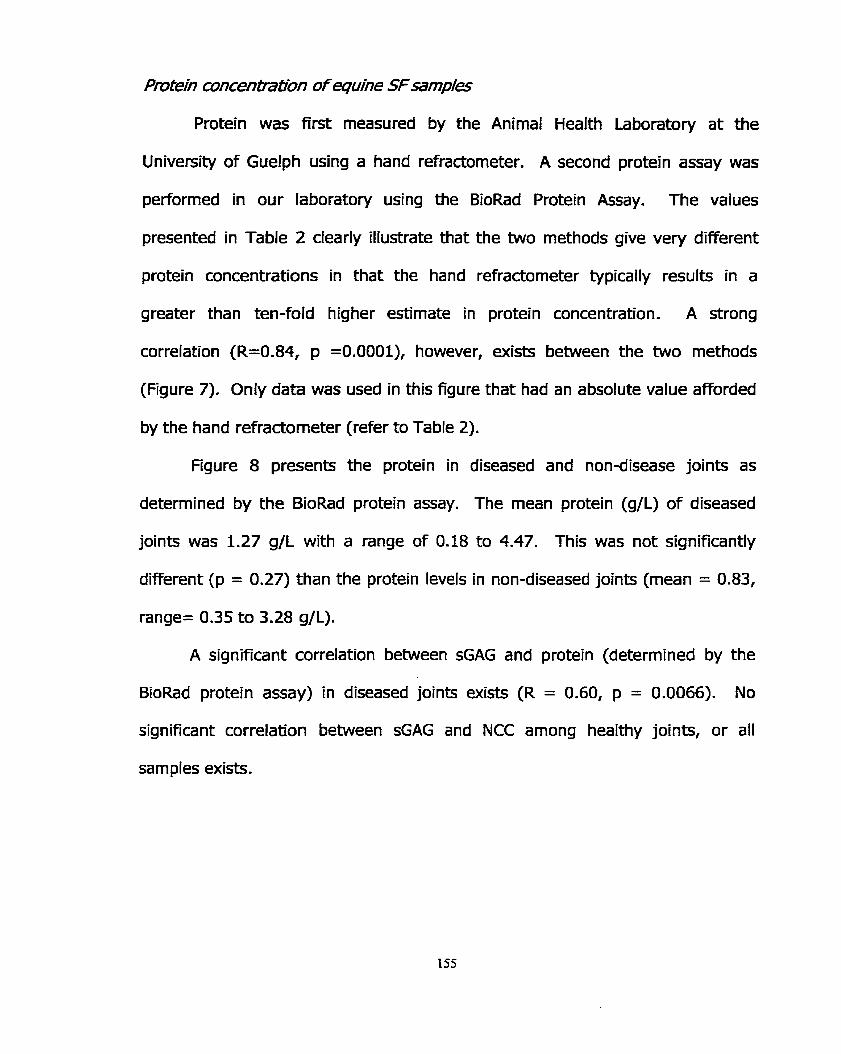
Protein concentratron of equ/ne SFsamp/s
Protein was first measured by the Animal Health Laboratory at the
University of Guelph using a hand refractometer. A second protein assay was
performed in Our laboratory using the BioRad Protein Assay. The values
presented in Table 2 clearly illustrate that the two methods give very different
protein concentrations in that the hand refractorneter typically results in a
greater than ten-fold higher estimate in protein concentration. A strong
correlation (R=0.84, p =0.0001), however, exists between the two rnethods
(Figure 7). Only data was used in this figure that had an absolute value afforded
by the hand refractometer (refer to Table 2).
Figure 8 presents the protein in diseased and non-disease joints as
determined by the BioRad protein assay. The mean protein (g/L) of diseased
joints was 1.27 g/L with a range of 0.18 to 4.47. This was not significantly
different (p = 0.27) than the protein levels in non-diseased joints (mean = 0.83,
range= 0.35 to 3.28 g/L).
A significant correlation between sGAG and protein (determined by the
BioRad protein assay) in diseased joints exists (R = 0.60, p = 0.0066). No
significant correlation between sGAG and NCC among healthy joints, or al1
sam pies exists.

TABLE 2: Composition of the equine synovial fluid sarnples, including protein (determined by hand refractometer, and the BioRad protein assay) and the nucleated cell counts (NCC). Shaded cells represent samples from non-diseased joints. Joint abbreviations are the rame as indicated in the leqend of Table 1. Sam~le # 1 Refractometer 1 BioRad APPEARANCE 1
1 (LFF) 2 (LRC)
5 (WC) 1 p 31 1 1.07 1 1.4 1 Ye1Iowr clear
3 (LRC) 4 (RRC)
<25 <25 <20 35
6 (LRC) 7 (UC) 8 (RIC) 9 (LRC) 10 (RRC) 11 (LFF) 12 (RFF) 13 (UC) 14 (LRC)
15 (MC)
0-18 0.67
16 (UC) 17 (RIC)
0.55 1.66
45 <25 <25 <25 <25 <25 <25 35 30
<25
18 (UC) 19 (RHF) 20 CRRC)
0.4 0.5
22 <20
21 (LRC) 22 (UC) 23 (UC)
Yellowr CIOU~Y Yellow, sliqhtly cloudy
0.54 0.74
2.38 0.35 0.37 0.39 O. 19 0.2 0.08 3.28 1.80
0.83
20 20
<25
25 (LRC) 26 (RFF)
Yellow, sliqhtly cloudy Yellow, clear
0.69 0.47
<25 ~ 2 5
27 (UC) 28 (LTT) 29 (RS) 30 (LS) 31 (UC)
2.3 2.1 0.9 1.2
0.28 0.29 1.15
45 20
32 (LS) 33 (MC) 34 (RFF)
Amber, cloudy Yeilow, clear Pale yellow, clear Pale yellow, clear
0.62 1
1.14 0.90
24 (UC) 1 35
25 <25 <25 31 27
Yellow, clear Yellow, clear
0.5 0.3 1.6
7.1 2.18 2.89 1.08
44 N/A <20
0.3 4.2 1.2 0.7 1.2
0.9
Dark yellow, cloudy Dark yellow, cloudy Dark yellow, slightly cloudy
Yellow, sliqhtly cloudy
1.2 1.1
35
1.37 0.13 2.32 1.59 1.49
Pale yeliow, clear Pale yeltow, clear Pale yellow, clear Oranqe, sliqhtly cloudy Dark yellow, slightly cloudy Yellow, clear
Yellow, clear Yellow, clear
7.1 1.67
2.3 0.9
4.47 1.29 0.66
YelIow, slightly cloudy
Arnber, cloudy Dark yellow, slightly
0.6 3.2 13.8 28 1.4
cloud y Yellow, clear Yellow, sliqhtly cloudy Dark yellow, cloudy Oranqe,cIoudy Yellow, clear
0.3 N/A 0.83
Pale yellow, clear Dark yellow, clear Yellow, clear
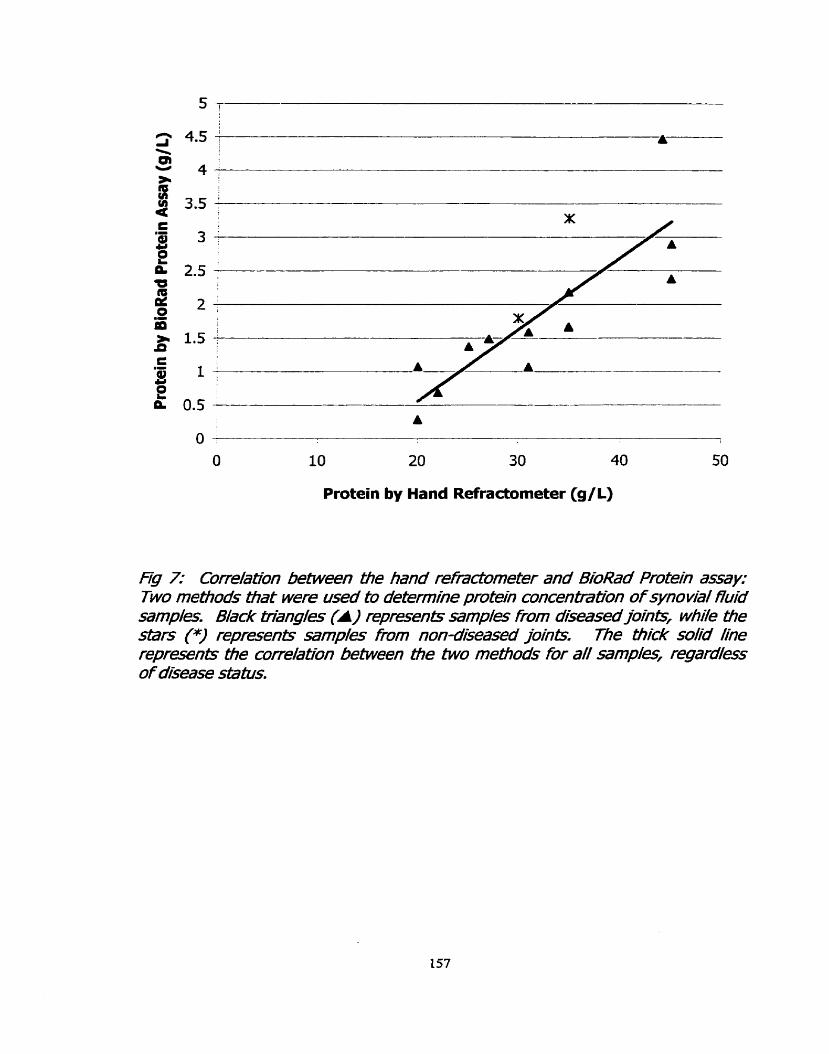
Protein by Hand Refractometer (g/L)
Fg 7: Corre/ation befween Me band refradometer and B ioW Protein assay: Two m e W s mat were used tu determine protein concentmfi;on of synovial fluid samp/pc. Black @%angles (A) repreents samples tom diseased jointr, wwhile ~e stars (*) represents samp/es fiom non-diseasd loi& The ti3ick solid #ne represents tfie corre/atfon between the two rnethods for a// sarnpi'es, regard//ess of dkease sfafus.

Diseased Nondiseased
Fg 8: Cornparbon of b7e protein (BioRad protein assayl concenfralfons of synovia/ fluid sampî" from diseased and non-diseasedjjonh. B/ack circ/pc (el in each categmy represents the mean, wni/e crosses (+) represent individud samp/e va/'es.

200 400 600 800 1000
sGAG (micrograms per mL of SF)
Fg 9: Re/ationshhip between protein and SGNG content of synovial ffuid Black ttiang/t (A) reprpcent ~ m p l e s fiom diseased joing stxs (9 represent noa- dkeased jM&. me sold black &end lhe repreents diseased joints; the bLNn Mack &end /ine represents a// samplpc, whife the dashed trend /ine is for non- dseased ~mp//es.

Nuc/eated Ce// Count3 ofSFsamp/s
Nucleated cell counts (NCCs) were presented earlier in Table 2. The two
sarnples that were obtained frorn septic joints (samples #29 and #30) had cell
counts that were substantialiy higher than al1 other joints. Sarnples #23 (from a
joint with severe synovitis) and #28 (a non-diseased control) also had elevated
NCCs. The mean NCC from diseased joints (including septic joints) was 3.7 x 10'
/L (range = 0.3 to 28). As illustrated in Figure 10, this was higher than non-
diseased joints (mean = 1.3 x 10' /L, range = 0.7 to 4.2), and diseased, non-
septic joints (mean = 1.3 x 10' /L, range = 0.3 to 7.1), although there was no
statistical difference (p = 0.27).
There were no significant correlations between NCC and TP, or NCC and
sGAG in non-diseased, diseased, or al1 joints.
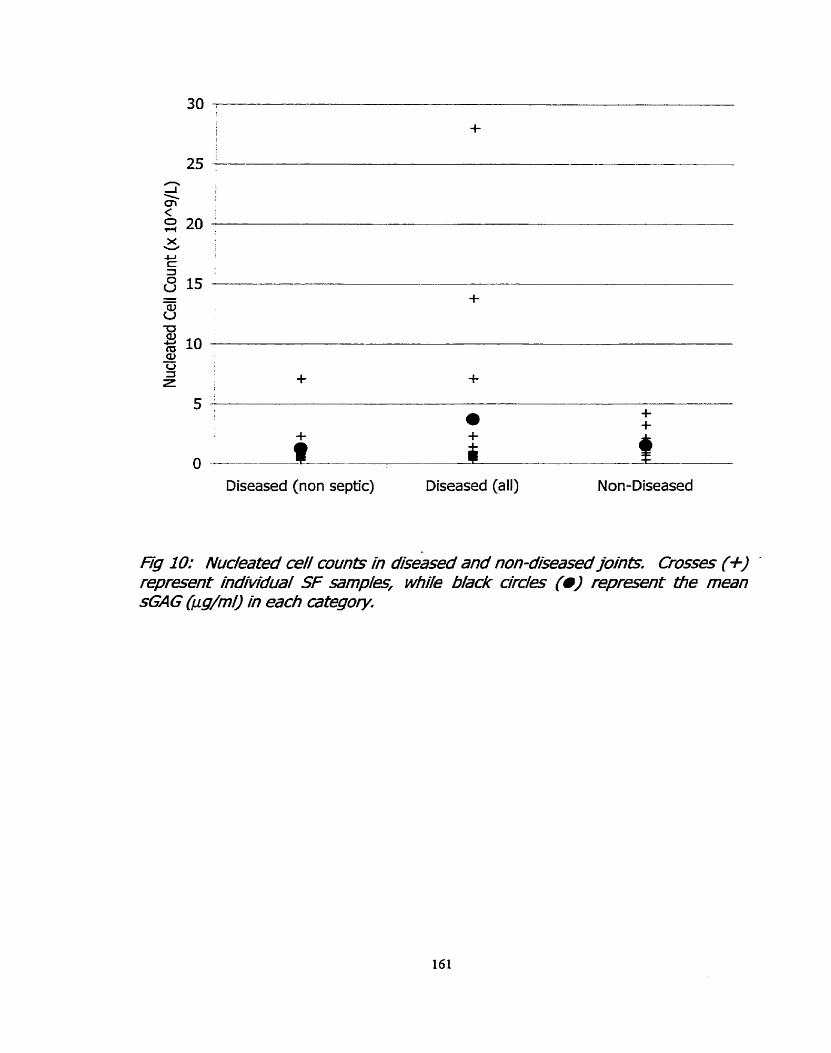
Diseased (non septic) Diseased (ail) Non-Diseased
Hg IO: Nuc/eated ce// counts in dise&& and non-diseasedjoints Crosses (+) '
repreeet individus/ SF mmpleq wbiie Mack circ//es (0) reprseent b7e mean sGAG &g/m/) in each afegory.

DISCUSSION
Samp/e Cof/e&n
Rossdale et a/ (1985) observed that the fetlock and carpus are the most
commonly affected joints, while Kawcak etaf (1997) reported that OC fracture of
carpal bones is the most comrnon injury. The sarnples used in this study are
consistent with this observation.
Even though no gross evidence of joint disease was observed after
dissecting the non-diseased joints, three o f the four hones included as control
animais had been suffering from chronic, systernic illnesses and therefore are
probably not representative of a healthy 'control' population. Hence, the reason
for choosing to describe the samples as 'non-diseased' as opposed to 'healthy'.
While most research groups use horses that were euthanized for reasons other
than musculoskeletal conditions (such as colic), healthy horses with no recent
history of lameness, who have not undergone arthroscopic surgery are probably
the best cases to use as controls. Unfortunately, obtaining large numbers of
these samples is difficult.
According to Fuller et a1 (1996), there is no direct correlation between KS
or sGAG and age, so the increased sGAG in control sarnples are probably not
attributable to the 11 year-old control horse. I n this study, the sGAG
concentration in the tarsus was significantly higher than al1 other joints. Since
only one sample from the tarsus was exarnined, it is difficult to indicate whether
the normal sGAG concentration of the tarsus is higher compared to other joints,

or if it is this horse (with chronic colitis, and laminitis). Fuller et ai(l996) reports
a sGAG concentration of 57.9 pg/ml in the tarsus of normal horses (n=23),
which was lower than sGAG concentrations of both femoropatellar, and fetlock
joints (sGAG concentrations of the carpus were not measured). Fuller e t a/
(1996) did not measure the sGAG from the carpus of normal horses.
Measurement of sGHG
sGAG from non-diseased joints was higher than diseased joints. This
finding contradicts most other studies (Alwan et a/ 1990; Alwan et a/ 1991;
Palmer et a/ 1995), except Todhunter et a/(1997). Al1 diseased samples were
obtained directly prior to arthroscopie surgery, and therefore, al1 samples were
chronic frorn chroilic disease cases (Le. >2 weeks). As stated by Todhunter e t
a/. (1997), this may indicate that the cartilage rnay be in an advanced stage of
disease and therefore articular cartilage degeneration, characterized by loss of
cartilage mass. Thus, less PGs are extruded into the synovial fluid.
AlternativeIy, the control samples may be a poor representation of normal
synovial fluid (as discussed above), and the sGAG levels of the diseased joints
are elevated in comparison to healthy, young horses with no evidence of joint
disease. Of the two theories, this is probably the more realistic, and is supported
by the data presented in Table 3 from Alwan et a/ (1990), Alwan et a/ (1991),
and Fuller et a/ (1996). The sGAG concentrations for normal joints in these
studies
current
is substantially lower (< 70 pg/ml of
study (mean sGAG = 619.4 pg/mI).
SF) than those presented
Even among the diseased
in the
joints,

however, sGAG concentrations were much lower than the values reported in this
study. Since the sGAG was measured by three rnethods, two of which were in
agreement, it is doubtFul that Our results are inaccurate. I n these midies, papain
digestion, was used, and the three groups used the DMMB assay based on the
method of Farndale et aI(l986). No further explanation of these differences can
be offered at this point other than suggesting the need for a larger sample size
for this study. This, however, does not fblly explain the obvious discrepancy,
since some of the sample sizes Iisted in Table 4 are not much larger than Our
own.
With reference to the interna1 control samples, we noted that sarnples 6
and 25 did not correlate well. This might be due the presence of increased
interfering substances compared to other samples (such as 23 and 24) included
in this study. Samples 6 and 25 were an abnorrnal colour, and had a cloudy
appearance. The presence of blood in SF samples may indicate increased
interfering substances (such as hemoglobin) that may interfere in the DMMB
assay, since hemoglobin would rernain in the supernatant after centrifugation
while whole red blood cells would pellet. Alternatively, HA or other unidentified
abnormal compounds may be present in these abnormally coloured samples that
hinden accurate quantitation of G A G by the DMMB assay.

Table 3: Summary of information from seven studies measuring the amount of sGAG, white blood cells (WBC), and total protein (TP) in equine synovial fiuid samples from joints with various disease conditions, and normal joints.
Type of injury (n) 1 SGAG
Moderate acute (21) Severe acute (5)
WBC
Moderate chronic (9) Severe chronic
TP
Alwan etal1990 Normal (30)
OA (36)
Alwan et a/ 1991 Normal (22) OA (48) Traumatic (3) Little et al 1990 Normal (13) Arthritic (1 1) Tulamo et a/ 1994 Normal (6) Acute (6) Chronic (9) Palmer et a/ 1995
106.4 & 11.7
159.0 -t- 47.7 78.3 + 9.4
122.9 + 22.5 (10) Normal (49)
-
25.6 + 2.6 Frisbie et a/ 1999 OC (71)
x + Sem (range) 61 t 6.8 (8-140)
221.61 + 23.04 (25-600) x t s d
66 + 32 256 $r 153 118 k 45
x k sem
Normal (n/a) Saari et a/ 1989 Normal (4)
deviation, n/a = not available.
x + sem 900 + 146
1 I
#/mi 55 f 10 x lo4 (50-80 x lo4) 75 + 8 x l o 4
(60-110 x lo4)
#/fl 123.41 + 41 95.7 k 63.5 x l o 9 / ~ f sd 0.15 I 0.073 0.157 + 0.099 0.453 + 0.604
g/L 23.4 + 1.1
717 + 167 x 1 0 6 / ~
49.25 k 33.45
Lame (8)
g/dl 1.35 t 0.44 2.25 k 0.52 - 4/L 9.25 + 2.21 15.5 f2.46
12.39 t10.033
17.2 + 1.1 9/L
7.65 $r 4.76
1 198.5 t 172.87 1 11.49 I 4.42
Legend: OA= osteoarthritis, Sem = standard error of the mean, sd = standard

Protein
It was surprising that such a difference existed between the protein
values as determined by the hand refractometer, compared to the BioRad protein
assay. This difference was supported by the findings of Korenek et a/ (1992)
who reported that the refractorneter method yielded results that were
approxirnately 2 fold higher than the protein concentrations determined by the
Coomassie brilliant blue test. This is probably explained by the fact that the
hand refractorneter is susceptible to interference by other solutes present, such
as HA. Nonetheless, our protein levels (determined by the BioRad protein assay)
were still substantially lower than those of Korenek et a/ (1992). It is undear
whether normal (or abnormal) synovial fluid constituents such as HAr or sGAG
interfere in the protein assay.
As indicated in Table 4, it is obvious that Our protein concentrations are
also low cornpared to Little et a/(1990) who used the Biuret rnethod. In turn,
the protein measured by Little et a/ (1990) was lower than protein levels
measured by Saari et a/ (1989) using the Lowry assay, Tulamo et a/ (1994) by
refractometry, and Frisbie eta/(1999) who did not state the rnethod ernployed.
The BioRad protein assay is based on the method of Bradford, based on
the principle that the absorbance maximum increases from 465 to 595 when
Coornassie brilliant biue 6-250 binds to solubilized protein. Since the dye is
acidic, it primarily binds to basic and aromatic amino acids, especially arginine.
Interference from chemical-protein and chemical-dye interactions may alter

results (BioRad Laboratories package insert). The Biuret test, used by Little eta/
(1990), is based on the principle that adjacent peptide bonds form a cornplex
with alkaline copper ions, thereby displaying a characteristic purple colour.
According to Clark and Switzer (1977), the assay is fairly reproducible for any
protein (because there is no affinity for specific amino acids), but requires large
amounts of protein, typically 1-20 mg for colour formation. The Lowry test is
based on the colour formation produced by the Folin-Ciocalteu reagent reacting
with as Iittle as 5 pg protein with alkaline copper, and the redudion of the
phosphomolybdate-phosphotungstate salts by tyrosine and tryptophan residues.
Since the amount of these amino acids varies between types of proteins, the
colour yield per mg protein is not constant (Clark and Switzer 1977). To
paraphrase Clark and Switzer yet again: there is no one best way to measure the
protein concentration in a sample. The choice depends on the nature of the
protein, and other components within the sample, and the desired speed,
accuracy, and sensitivity of the assay.
Regardless of which is the best assay to measure protein, it was
determined that as protein concentration measured by the BioRad assay
increased, there was a concomitant increase in protein as determined by
refractometry.
Although not significant, there was a trend for diseased joints to have
higher protein concentrations than non-diseased joints. This is in contrast to the
sGAG, and is probably due to increased protein entering the joint due to

infiammation, and increased capillary permeability since synovial fiuid is an
ultrafiltrate of the plasma (Ray et a/ 1996). Alternatively, total protein rnay be
increased in joints due to decreased protein clearance (Myers et a/ 2000). Ail
groups listed in Table 4 that rneasured total protein found increased protein in
diseased joints cornpared to normal joints.
A significant correlation was found between protein and sGAG
concentration in diseased joints. According to Palmer et a/ (1995), a correlation
between total protein and sGAG is expected because inflammation is associated
with increased blood flow and capillary permeability thereby allowing an influx of
neutrophils and plasma proteins into the joint. Alternatively, increases in total
sGAG rneasured by the DMMB assay may be spuriously increased due to
interaction of the dye with sulfated plasma components (Palmer et al 19%).
Nuclea fed Ce// Coun&
This study submitted cells to the Animal Health Lab for analysis of
nucleated cell counts by serni-automated ceIl counter. Thus, we did not rneasure
only WBC, and cannot directly compare Our results to the other studies
presented in Table 3. Since NCC from septic joints was substantially higher than
al1 other joints, it is reasonable to suspect that the increase is due to white blood
cells (and since the majority of the nucleated cells in the joint wouid be due to
WBCs as opposed to synoviocytes, or other mononuclear cells).

If only non-septic diseased joints are considered, then no difference exists
in NCC compared to non-diseased joints. Assuming that chainges in NCC
reflected changes in WBC, Frisbie et a/(l999) reported no significant increase in
WBC between normal and osteoarthritic joints. Unlike the protein, there is no
correlation between sGAG and NCC in diseased joints. This contradicts the
theory that the increase in protein reflects inflammation, otherwise the NCC
would also be elevated, as expected for many types of inflammation. It is
interesting, however, that a moderate correlation was observed in non-diseased
samples.
The fact that no correlation between NCC and TP among diseased joints
was observed tends to dispute the theory that inflammation is the cause of the
increased TP in these sarnples. I f inflammation were important in these joints,
then a strong correlation between TP and WBC would be expected. It is
intereçting, however, that a negative correlation between TP and WBC was
suggested in non-diseased joints where there is presumably no Inflammation.
This may be due to the fact that three of the four control horses were from
horses with chronic, systemic, inflammatory conditions. Thus, as a result of
systemic infiammatory response, protein is leaking into the synovial fluid, while
WB& are not.
I n conclusion, it is obvious from examining these three basic components
of synovial fluid, and comparing these finding with other research groups that
specialize in this field, that no clear answers are yet available. One problern that
continues to plague us, is the difference in assay procedures being employed
(made especially obvious in the analysis of total protein), and that true non-
diseased control horses are not being selected. Furtherrnore, it appears as
though several groups are attempting to measure markers in chronic or OA joints
(Table 3), yet everyone agrees that the point of finding a marker is to identify
acute, traumatic joints with radiographically silent lesions in order to preventthe
developrnent of OA. The difficulty we found, was that by the time the horses
were adrnitted for surgery, they were no longer in the acute stages of the
disease.

REFERENCES
Alwan, W. H., Carter, S. D., Bennett, D., and Edwards, G. B. (1991) Glycosaminoglycans in horses with osteoarthritis. Equine Vet J 23(1), 44-7.
Alwan, W. H., Carter, S. D., Bennett, D., May, S. A., and Edwards, G. B. (1990) Cartilage breakdown in equine osteoarthritis: measurement of keratan sulphate by an EUSA system. Res Vet Sci 49(1), 56-60.
Brama, P. A., TeKoppele, J. M., Bank, R. A., van Weeren, P. R., and Barneveld, A. (1999) Influence of site and age on biochemical characteristics of the collagen network of equine artïcular cartilage. Am 3 Vet Res 60(3), 341-5.
Clark J.M. and Swiher R.L. (1977) ~perirnenta/Biochem/S<Y, W.H.Freeman and Company, New York. pp 75-76.
Farndale, R. W., Sayers, C. A., and Barrett, A. J. (1982) A direct spectrop hotometric microassay for sulfated glycosarninoglycans in cartilage cultures. Connect Tissue Res 9(4), 247-8.
Frisbie, D. D., Ray, C. S., Ionescu, M., Poole, A. R., Chapman, P. L., and Mdlwraith, C. W. (1999) Measurement of synovial fluid and serum concentrations of the 846 epitope of chondroitin sulfate and of carboxy propeptides of type II procollagen for diagnosis of osteochondral fragmentation in horses. Am J Vet Res 60(3), 306-9.
Fuller, C. J., Barr, A. R., Dieppe, P. A., and Sharif, M. (1996) Variation of an epitope of keratan sulphate and total glycosaminoglycans in normal equine joints. Equine Vet J 28(6), 490-3.
Goldberg R.L and Kolibas LM. (1990) An Improved Method for Determining Proteoglycans Synthesized By Chondrocytes in Culture. Connedive Tissue Research 24, 265-275.
Little, C. B., Flannery, C. R., Hughes, C. E., Mort, J. S., Roughley, P. J., Dent, C., and Caterson, B. (1999) Aggrecanase venus matrix metalloproteinases in the catabolism of the interglobular dornain of aggrecan in vitro. Biochem J 344 Pt 1:61-8.
Mdlwraith C.W. (1996) General Pathobiology of the Joint and Response to Injury. In: Joint Disease in the Horse. Eds: Mdlwraith C.W. and Trotter G.W. W.B. Saunders Company, Philadelphia. pp 40-70.

Myers, S.L., Brandt, K.D., and Albrecht, M.E. (2000) Synovial fluid glycosaminoglycan concentration does not correlate with severity of chondropathy or predict progression of osteoarthritis in a canine cruciate deficiency model. 3 Rheumatol 27(3), 753-63.
Okurnura, M., Fujinaga, T., Urakawa, E., Tagami, M., and Tsukiyama, K. (1997) Evaluation of the catabolic activity of cartilage by measurement of serum keratan sulfate concentration in foals. Am J Vet Res 58(8), 925-9.
Okumura, M., Tagami, M., and Fujinaga, T. (1998) Measurement of serurn and synovial fiuid keratan sulphate and antibody to collagen type II in equine osteoarthritis. Zentralbl Veterinarrned A 45(8), 513-6.
Palmer, J.L. and Bertone, A.L. (1994) Joint structure, biochemistry and biochemical disequilibrium in synovitis and equine joint disease. Equine Vet J 26(4), 263-77.
Palmer, J.L., Bertone, A.L. and McClain, H. (1995) Asessrnent of glycosaminoglycan concentration in equine synovial fluid as a marker of joint disease. Can'J Vet Res 59(3), 205-12.
Platt, D., Bird, J.L., and Bayliss, M.T. (1998) Ageing of equine articular cartilage: structure and composition of aggrecan and decorin. Equine Vet 3 30(1), 43-52.
Ray C.S., Poole A.R., and McIlwraith C.W. (1996) Use of synovial Fluid and Serum Markers in Articular Disease. In: Joint Disease in the Horse. Eds. McIIwraith C. W. and Trotter G. W. W.B. Saunders, Pennsylvania. pp 203- 216.
Rossdale, P.D., Hopes, R., Digby, N.J., and Offord, K. (1985) Epidemiological study of wastage among racehorses 1982 and 1983. Vet Rec 116(3), 66-9.
Saari, H., Konttinen, Y.T., Tularno, R.M., Antti-Poika, I., and Honkanen, V. (1989) Concentration and degree of polyrnerization. of hyaluronate in equine synovial fluid. Am 3 Vet Res 50(12), 2060-3.
SAS Institute Inc, SAS STAT. (1997) Software: Changes and Enhancements through Release 6.12. 1167. Cary, NC, SAS Institute Inc.
Todhunter R.J. (1996) Anatomy and Physiology of Synovial Joints. In: Joint Disease in the Horse. Eds: McIIwraith C.W. and Trotter G.W. Pennsylvania, W.B. Saunders Company, Philadelphia. pp 1-28.

Todhunter, R.J., Fubini, S.L., Freeman, K.P., and Lust, G. (1997) Concentrations of keratan sulfate in plasma and synovial fluid from clinically normal hones and horses with joint disease. 3 Am Vet Med Assoc 210(3), 369-74.
Todhunter, R.J., Yeager, A.E., Freeman, K.P., Parente, E.J., and Lust, G. (1993) Keratan sulfate as a rnarker of articular cartilage catabolism and joint treatrnent in ponies. Am J Vet Reç 54(7), 1007-16.
Tulamo, R.M., Heiskanen, T., and Saionen, M. (1994) Concentration and molecular weight distribution of hyaluronate in synovial fluid from clinically normal horses and hones with diseased joints. Am J Vet Res 55(5), 710- 5.
Tulamo, R.M., Houttu, J., Tupamaki, A., and Salonen, M. (1996) Hyaluronate and large molecular weight proteoglycans in synovial fluid from horses with various arthrides. Am J Vet Res 57(6), 932-7.
Vilim, V. and Fosang, A.J. (1993) Characterization of proteoglycans isolated from associative extracts of human articular cartilage. Biochern 3 293 (Pt l), 165-72.
Warren S., Hurtig M.B., Wright J.R., Keates R.A., and Lumsden J.H. (2000) Analysis and Application of the 1,9-dimethylmethylene Blue Assay for Sulfated Glycosaminoglycans in Synovial Fluid. MSc. Thesis, University of Guelph.

CHAPTER 5: GENERAL DISCUSSION, CONCLUSIONS, AND FUNRE STUDIES
The initial goal of this project was to create a synovial fiuid profile (akin to a
CBC, or blood biochemistry profile) that could be used to evaluate the health status of a
joint. This panel would permit veterinarians to assess the severity of the disease, select
appropriate treatments, monitor the horse's response to treatment, and prevent the
development of OA.
Early in the experimentation stage, it became clear that the assay employed to
measure sulfated glycosarninoglycans (as a function of proteoglycan conontration) was
flawed. Three variants of the 1,9-dimethylmethylene blue assay are commonly used by
researchers. They are the Farndale method, the microplate DMMB assay, and the
indirect DMMB assay. After careful analysis of the three assays, it was found that each
protocol resulted in a different measure of sGAG content when identical synovial fluid
sarnples were analyzed.
I n response to this finding, we developed and introduced a new, solid phase
DMMB assay. This protocol involved applying sGAG-dye complexes to a nylon
membrane using a 96-well BioDot apparatus, and performing scanning densitornetry.
This method is superior to the other DMMB assays in that the solid phase assay
circumvents the precipitation of the sGAG-dye complexes, is more sensitive, requires
smaller volumes, and is more rapid and less labour intensive. Furthermore, this assay
can be used qualitatively or quantitatively, and may provide a permanent record of the
results, an attribute no other DMMB assay can claim. Statistical analyses revealed that
the values obtained from the solid phase DMMB matched those from the
spedrophotornetric assay of Farndale et a/. (1982), but gave lower values in
cornparison to the microplate DMMB assay.
Despite this succea, it is important to recognize that several issues rernain to be
resolved concerning the DMMB assay in general. The three main problems with this
assay are: the mechanism remains to be elucidated, the three standards resulted in
different levels of induction of metachromasia, and enzymatic digestion of SF is
essential prior to performing the DMMB assay. The best choice of enzyme remains
unclear.
It is Our opinion that researchers need to recognize that the DMMB assay is, at
best, an pCfrpCfrmafi'oon of PG in tissue extra- or biological fluids. Since the different
sGAGs are variable in their readion with the dye, the DMMB assay is limited in its ability
to accurately quantify individual sGAGs. Some groups, for example, digest samples
with various polysaccharidases and atternpt to measure individual sGAG components.
This technique is aimost certainly exceeding the capacity of the DMMB assay. Our
supposition that the DMMB assay is only an estimation is also applicable to researchers
who rely on sGAG measurementç in SF to compare horses with diseased and non-
diseased joints. The absence of consistent findings in this field may simply be due to
the inaccuracy of the DMMB assay.
Alternate techniques for accurate quantification of PG are equally problematic.
The uronic acid assay, although time consuming and tedious, has other disadvantages
in that US does not contain uronic acid, while HA does. Sirnilarly, quantitation of PG by
measuring hexuronic acid includes HA, as well as the sGAGs. Therefore, neither of
these assays affords accurate measures of PG in tissue extracts of body fiuids.
Since al1 sGAG apparently react identically to alcian blue, the alcian blue assay
may provide a more accurate estimation of sGAG than any other assay. Moreover, no
enzymatic digestion of SF samples is required prior to analysis. The obvious drawback
to this assay, both the traditional and solid phase varianb, is that the alcian blue assay
is far more time consuming and labour intensive than the DMMB assay. A
comprehensive analysis and validation of the alcian blue assay should be undertaken to
evaluate if it is a superior method to the DMMB assay.
I n chapter four of this project, equine SF samples were collected from
diseased and non-diseased joints, and sGAG, TP, and NCC were analyzed. Our results
indicated that sGAG were higher in non-diseased joints than diseased joints. This
finding, which is in contradiction to several other studies (but in agreement with
Todhunter etaL 1997), may be explained by several theories. First, a loss of cartilage
mass due to degradation reduces the arnount of PG and sGAG that would be released
by the damaged cartilage. Less cartilage would consequently result in less cartilage
breakdown products present in the SF. Secondly, the inherent limitations of the DMMB
assay may preclude the use of this assay to evaluate the disease status of a joint.
Finally, horses with non-musculoskeietal conditions, but who are affected with other
systemic inflammatory conditions (such as colic or colitis) are inappropriate for the use
as negative controls.

Another important issue to address is that research groups are analyzing their
samples differently. For example, some groups categorize the diseased state of joints
(for instance; acute traumatic, chronic traumatic, and infectious), while other groups
amalgamate their samples together into a single 'OA" group. Researchers need to
agree upon a universal system of grading joint disease in order to compare results.
Despite the weaknesses recognized in the DMMB assay, the estimation of
sGAG is still useful if included as part of the synovial fluid profile. I n order to continue
creating this profile, further experirnentation on the identification of biomarkers in joint
disease by this research group is required. HA will be deterrnined by HPLC, and
samples of SF will be separated on 4-20% SDS-PAGE in order to assess obvious
differences in banding patterns between diseased and non-diseased joints.
Irnmunological analyses will be perforrned, using a variety of antibodies including those
recognizing epitopes on KS, CS, link protein, decorin, and COMP. We are confidant that
the synovial fluid profile will be a more useful tool for researchers to assess the disease
status of a joint, than a single marker, and that valuable information concerning the
underlying mechanism of OA will be attained.
MASTER REFERENCE LIST
Alwan WH, Carter SD, Bennett D, Edwards GB. 1991. Glycosaminoglycans in horses with osteoarthritis. Equine Vet J 23:44-7.
Alwan WH, Carter SD, Bennett Dr May SA, Edwards GB. 1990. Cartilage brea kdown in equine osteoarthritis: measurement of keratan su1 phate by an EUSA sysiem. Res Vet Sci 49:56-60.
Ayad S. 1994. The Extracelluar Matrix Factsbook. Toronto, Acedemic Press.
Bjornsson S. 1993. Simultaneous preparation and quantitation of proteoglycans by precipitation with alcian blue. Anal Biochem 2lO:282-9 1.
Bjornsson S. 1998. Quantitation of proteog lycans as g lycosa minog lycans in biological fluids using an alcian blue dot blot analysis. Anal Biochem 256: 229-37.
Brama PA, TeKoppele JM, Bank RA, van Weeren PR, Barneveld A. 1999. Influence of site and age on biochemical characteristics of the collagen network of equine articular cartilage. Am J Vet Res 60:341-5.
Buee L, Boyle NJ, Zhang LB, Delacourte A, Fillit HM. 1991. Optimization of an alcian blue dot-blot assay for the detection of glycosaminoglycans and proteoglycans. Anal Biochem 195:23842.
Chandrasekhar Sr Esterman MA, Hoffman HA. 1987. Microdetermination of proteoglycans and glycosaminoglycans in the presence of guanidine hydrochloride. Anal Biochem 161: 103-8.
Clark JMr Switzer RL 1977. Experimental Biochemistry. New York, W.H.Freeman and Company.
Dey P, Saphos CA, McDonnell J, Moore VL. 1992. Studies on the quantification of proteoglycans by the dimethylmethylene blue dye-binding method. Specificity, quantitation in synovial lavage fluid, and automation. Connect Tissue Res 28:3 17-24.
Dudhia 3, Platt D. 1995. Complete primary sequence of equine cartÏlage Iink protein deduced from complementary DNA. Am 3 Vet Res 56:959-65.
Farndale RW, Buttle DJ, Barrett Al. 1986. Improved quantitation and discrimination of sulphated glycosaminoglycans by use of dimethylrnethylene blue. Biochim Biophys Acta 883:173-7.
Farndale RW, Sayen CA, Barrett Al. 1982. A direct spectrophotometric rnicroassay for sulfated g lycosaminog lycans in cartilage CU ltu res. Connect Tissue Res 9 : 247-8.
Firth EC, Delahunt 3, Wichtel JW, Birch HL, Goodship AE. 1999. Galloping exercise induces regional changes in bone density within the third and radial carpal bones of Thoroughbred horses. Equine Vet J 31:lll-5.
Frisbie DD, Ray CS, Ionescu M, Poole AR, Chapman PL, Mdlwraith CW. 1999. Measurement of synovial fluid and serum concentrations of the 846 epitope of chondroitin sulfate and of carboxy propeptides of type II procollagen for diagnosis of osteochondral fragmentation in horses. Am J Vet Res 60:306-9.
Fubini SL, Erb HN, Freeriian KP, Todhunter KI. 1999. Prognostic factors affecting survival of 507 horses with joint disease: (1983 to 1990). Can 3 Vet Res 63:253-60.
Fuller CJ, Barr AR, Dieppe PA, Sharif M. 1996. Variation of an epitope of keratan sulphate and total glycosaminoglycans in normal equine joints. Equine Vet J 28:490-3.
Ghosh S, Gepstein Sr Heikkila U, Dumbroff EB. 1988. Use of a scanning densitometer or an ELISA plate reader for measurernent of nanogram amounts of protein in crude extracts from biological tissues. Anal Biochem 169: 227-33.
Gold €W. 1979. A simple spectrophotometric rnethod for estimating glycosarninoglycan concentrations. Anal Biochem 99: 183-8.
Goldberg R.L, Kolibas L.M. 1990. An Improved Method for Determining Proteoglycans Synthesized By Chondrocytes in Culture. Connedive Tissue Research 24: 265-275.
Hay E.D. 1981. In: Hay E.D. Ed. Ce11 Biology of Extracellular Matrix. New York, Plenum Press.
Heimer R, Sarnpson PM. 1987. Detecting proteoglycans immobilized on positively charged nylon. Anal Biochem 162:330-6.
Kawcak CE, Frisbie DD, Trotter GW, Mdlwraith CW, Gillette SM, Powers BE, Walton RM. 1997. Effects of intravenous administration of sodium hyalu ronate on carpal joints in exercising horses atter arthroscopie surgery and osteochondral fragmentation. Am J Vet Res 58:1132-40.

Korenek NL, Andrews FM, Maddux JM, Sanders WL, Faulk DL. 1992. Determination of total protein concentration and viscosity of synovial fluid from the tibiotarsal joints of horses. Am J Vet Res 53:7814.
Lehninger A.L, Nelson D. N., Cox M. M. 1993. Principles of Biochemistry, 2nd edition. New York, Worth Publishers.
Little CB, Flannery CR, Hughes CE, Mort 35, Roughley PJ, Dent C, Caterson B. 1999. Aggrecanase versus matrix metalloproteinases in the catabolism of the interglobular domain of aggrecan in vitro. Biochern 3 344 Pt 1:61-8.
Little CB, Hilbert BJ, Wickstrorn S, Hedlund BE. 1990. Quantitative rnicroanalysis
Lucas
of equine synovial fluid glycosaminoglycan concentration. Am 3 Vet Res 51: 1534-9.
IM, Ross MW, Richardson DW. 1999. Post operative performance of racing Standardbreds treated arthroscopically for carpal chip fractures: 176 cases (1986-1993). Equine Vet J 31:48-52.
MdlwraRh CW. 1996. General Pathobiology of the Joint and Response to Injury. In: ~ c ~ l w r a i t h C.W., Trotter G.W., Eds. Joint Disease in the Horse. Philadelphia, W.B. Saunders Company.
McIIwraith CW. 1987. In: Adams OR, Stashak TS., Eds. Adam's Lameness in Horses. Philadelphia, Lea and Febiger.
McIlwraith C.W., Brarnlage L.R. 1996. Surgical Treatment of Joint Injury. In: Mdlwraith C.W., Trotter G.W. Eds. Joint Disease in the Horse. Philadelphia, W.B. Saunders Company.
McIlwraith CW, Yovich JV, Martin GS. 1987. Arthroscopic surgery for the treatrnent of osteochondral chip fractures in the equine carpus. J Am Vet Med Assoc 191:53140.
Myers SL, Brandt KD, Albrecht ME. 2000. Synovial fluid glycosaminoglycan concentration does not correlate with severity of chondropathy or predict progression of osteoarthritis in a canine cruciate deficiency model. 3 Rheumatol 27: 753-63.
Okumura M, Fujinaga T. 1998. Establishment of a monoclonal antibody (1/14/16H9) for detection of equine keratan sulfate. Am J Vet Res 59: 1203-8.
Okumura M, Fujinaga T, Urakawa E, Tagami M, Tsukiyarna K. 1997. Evaluation of the catabolic activity of cartilage by measurement of serum keratan sulfate concentration in foals. Am J Vet Res 58:925-9.

Okumura M, Tagami M, Fujinaga T. 1998. Measurement of serum and synovial fluid keratan sulphate and antibody to collagen type II in equine osteoarthritis. Zentralbl Veterinarmed A 45:513-6.
Palmer JL, Bertone AL. 1994. Joint structure, biochemistry and biochemical disequilibrium in synovitis and equine joint disease. Equine Vet J 26:263- 77.
Palmer J.L., Bertone A.L. 1996. Joint Biomechanics in the Pathogenesis of Traumatic Arthritis. In: MCIlwraith C.W., Trotter G.W. Eds. Joint Disease in the Horse. Philadelphia, W.B.Saunders Company.
Palmer JL, Bertone AL, Malemud U, Mansour J. 1998. Changes in third carpal bone articular cartilage after synovectomy in normal and inflarned joints. Vet Surg 27:321-30.
Palmer JL, Bertone AL, McClain H. 1995. Assessrnent of glycosaminoglycan concentration in equine synovial fiuid as a marker of joint disease. Can J Vet Res 59:20S-12.
Platt D. 1996. Isolated Chondrocyte and Cartilage Expiant Culture Systems as Techniques to Investigate the Pathogenesis of Equine Joint Disease. In: McIlwraith C.W., Trotter G.W. Eds. Joint Disease in the Horse. Philadelphia, W.B. Saunders Company.
Platt Dr Bird JL, Bayliss MT. 1998. Ageing of equine articular cartilage: structure and composition of aggrecan and decorin. Equine Vet J 30:43-52.
Ray C. S., Poole A. R., Mdlwraith C. W. 1996. Use of synovial Fluid and Serum Markers in Articular Diseae. In: McIlwraith C. W. and Trotter G. W. Eds. Joint Disease in the Horse. Pennsylvainia, W.B. Saunders.
Rossdale PD, Hopes R, Digby NJ, offord K. 1985. Epidemiological study of wastage among racehorses 1982 and 1983. Vet Rec 116:66-9.
Saari H, Konttinen YT, Tulamo RM, Antti-Poika 1, Honkanen V. 1989. Concentration and degree of polyrnerization of hyaluronate in equine synovial fluid. Am J Vet Res 50:2060-3.
Sabiston P, Adams ME, Ho YA. 1985. Automation of 1,9-dimethylmethylene blue dye-binding assay for sulfated glycosaminoglycans with application to cartilage rnicrocultures. Anal Biochem 149 : 543-8.
SAS Institute Inc SS 1997. Software: Changes and Enhancements through Release 6.12. Cary, NC, SAS Institute Inc, 1167.

Stone JE, Akhtar N, Botchway S, Pennock CA. 1994. Interaction of 1,9- dimethylmethylene blue with glycosaminoglycans. Ann Clin Biochem 31 : 147-52.
Switzer RL., Clark 3 M. 1977. Experimental Biochemistry. New York, W.H. Freeman and Company.
Taylor KB, Jeffree GM. 1969. A new basic metachromatic dye, I:9-dimethyl methylene blue. Histochem J 1: 199-204.
Templeton DM. 1988. The basis and applicability of the dimethylmethylene blue binding assay for sulfated glycosaminog lycans. Connect Tissue Res 17:23- 32.
Todhunter RJ. 1996. Anatomy and Physiology of Synovial Joints. In: Mdlwraith C.W., Trotter G.W. Eds. Joint Disease in the Horse. Philadelphia, W.B. Saunders Company.
Todhunter RI, Fubini SL, Freeman KP, Lust G. 1997. Concentrations of keratan sulfate in plasma and synovial fluid from clinically normal horses and horses with joint disease. 3 Am Vet Med Assoc 210:369-74.
Todhunter RJ, Yeager AE, Freeman KP, Parente U, Lust G. 1993. Keratan sulfate as a marker of articular cartilage catabolisrn and joint treatment in ponies. Am 3 Vet Res 54: 1007-16.
Tripple SB, Mankin W. 1993. Articular Cartilage Healing. In: Disease Mechanisms in Small Animal Surgery. 2nd edition., Bojrab MJ Ed. Philadelphia, Lea and Febiger. pp 711-726.
Tulamo RM, Heiskanen T, Salonen M. 1994. Concentration and molecular weight distribution of hyaluronate in synovial fluid from clinically normal horses and horses with diseased joints. Am J Vet Res 55:710-5.
Tulamo RM, HouMi 3, Tupamaki A, Salonen M. 1996. Hyaluronate and large molecular weight proteoglycans in synovial fluid from horses with various arthritides. Am J Vet Res 57:932-7.
Vachon AM, Keeley FW, McIlwraith CW, Chapman P. 1990. Biochemical analysis of normal articular cartilage in horses. Am 3 Vet Res 51:1905-11.
Vilim V, Fosang AJ. 1993. Characterization of proteoglycans isolated from associative extracts of human articular cartilage. Biochem J 293 : 165-72.

Vili rn V, Krajickova J 1991. Proteoglycans of hurnan articular cartilage. Identification of several populations of large and srnail proteoglycans and of hyaluronic acid-binding proteins in successive cartilage extracts. Biochem 3 273 :579-85.
Warren S., Hurtig M.B., Wright J.R., Keates R.A., and Lumsden J.H. 2000. A Critical Analysis of the 1,9-dirnethylmethylene Blue Assay for Sulfated Glycosaminoglycans in Synovial Fluid. MSc. Thesis, University of Guelph.
Wright TN, Heinegard DK, Hascall VC. 1991. Proteoglycans: structure and function. In: Hay E. D ed. Cell Biology of Extracellular Matrix, 2nd edition. New York, N. Y., Plenum Press. pp 45-78.