Embed Size (px)
Citation preview
UNITED STATES ENVIRONMENTAL PROTECTION AGENCY
WASHINGTON, D.C. 20460
MEMORANDUM
DATE: March 1, 2012
OFFICE OF CHEMICAL SAFETY AND POLLUTION PREVENTION
SUBJECT: Nitrapyrin: Fourth Report of the Cancer Assessment Review Committee
PC Code: 069203 Decision No.: N/ A Petition No.: N/ A Risk Assessment Type: Cancer Assessment TXR No.: 0056262 MRID No.: N/A
DP Barcode: N/ A Registration No.: N/A Regulatory Action: N/ A Case No.: N/A
CAS No.: N/A 40 CFR: N/A
FROM: Jessica Kidwell, Executive Secretary ~ ~ Cancer Assessment Review Committee d Health Effects Division (7509P)
THROUGH: Jess Rowland and Karlyn Middleton, Co-Chairs .)4'~ rilll:~c.J .. "---#-~rJ-__. Cancer Assessment Review Committee Health Effects Division (7509P)
TO: Nancy McCarroll, Toxicologist RAB VI, Health Effects Division (7509P)
Kelly Ballard, CRM Risk Management and Implementation Branch I, PRD (7508P)
The Cancer Assessment Review Committee met on December 13, 2011 to re-evaluate the cancer classification ofNitrapyrin in accordance with the EPA's Final Guidelines for Carcinogen Risk
Assessment (March, 2005). Attached please find the final Cancer Assessment Document.
•
OEHHA 2015 - ATTACHMENT 4
NITRAPYRIN CANCER ASSESSMENT DOCUMENT FINAL
Page 2 of 53
CANCER ASSESSMENT DOCUMENT
EVALUATION OF THE CARCINOGENIC POTENTIAL/MODE OF ACTION
FOR MOUSE LIVER TUMORS
NITRAPYRIN
PC Code 06923
March 1, 2012
CANCER ASSESSMENT REVIEW COMMITTEE
HEALTH EFFECTS DIVISION
OFFICE OF PESTICIDE PROGRAM
NITRAPYRIN CANCER ASSESSMENT DOCUMENT FINAL
Page 4 of 53
TABLE OF CONTENTS
Executive Summary .........................................................................................................................6
I. Background ..................................................................................................................................9
A. CPRC Meeting May 6, 1992 .............................................................................................9
B. CARC Meeting May 5, 2000 ............................................................................................9
C. CARC Meeting February 9, 2005 ...................................................................................10
II. Issues .........................................................................................................................................10
A. Mutagenicity ...................................................................................................................10
B. Harderian Gland Tumors in Female Mice ......................................................................11
C. Epididymal Tumors in Mouse Testes..............................................................................11
D. Papilloma and Squamous Cell Carcinomas in the Forestomach of Both Sexes .............11
E. Liver Tumors in Mice ......................................................................................................11
III. Remaining Issues .....................................................................................................................13
A. Mutagenicity ...................................................................................................................13
B. Epididymal Tumors in Mouse Testes..............................................................................15
C. Dose Adequacy ...............................................................................................................19
IV. Evaluation of Liver Tumors and Mechanistic Studies ............................................................20
A. Liver Tumors...................................................................................................................20
B. Other Toxic Effects .........................................................................................................22
C. Mechanistic Studies.........................................................................................................26
V. Application of the Cancer Guidelines Mode of Action (MOA) Framework ............................43
A. Postulated MOA and Key Events ...................................................................................43
B. Support of Key Events/Causal Relationships Between Key Events and the Tumor
Response/Consistency of the Data ..................................................................................43
1. CAR Activation ......................................................................................43
NITRAPYRIN CANCER ASSESSMENT DOCUMENT FINAL
Page 5 of 53
2. Increased hypertrophy .............................................................................44
3. Increased cell proliferation .....................................................................44
4. Increased liver weight .............................................................................46
5. Increased basophilic foci .........................................................................46
6. Tumors ....................................................................................................46
C. Alternative MOAs ..........................................................................................................47
1. DNA reactivity ........................................................................................47
2. Cytotoxicity with regenerative cell proliferation ....................................47
3. Mitogenesis induced by other nuclear receptors .....................................47
D. Uncertainties ...................................................................................................................48
VI. Committee’s Assessment of the Weight of the Evidence .......................................................48
VII. Classification of Carcinogenic Potential……………………………………………..……..50
VIII. Quantification of Carcinogenic Potential………………………………………………..…50
IX. Bibliography ...........................................................................................................................50
NITRAPYRIN CANCER ASSESSMENT DOCUMENT FINAL
Page 6 of 53
EXECUTIVE SUMMARY
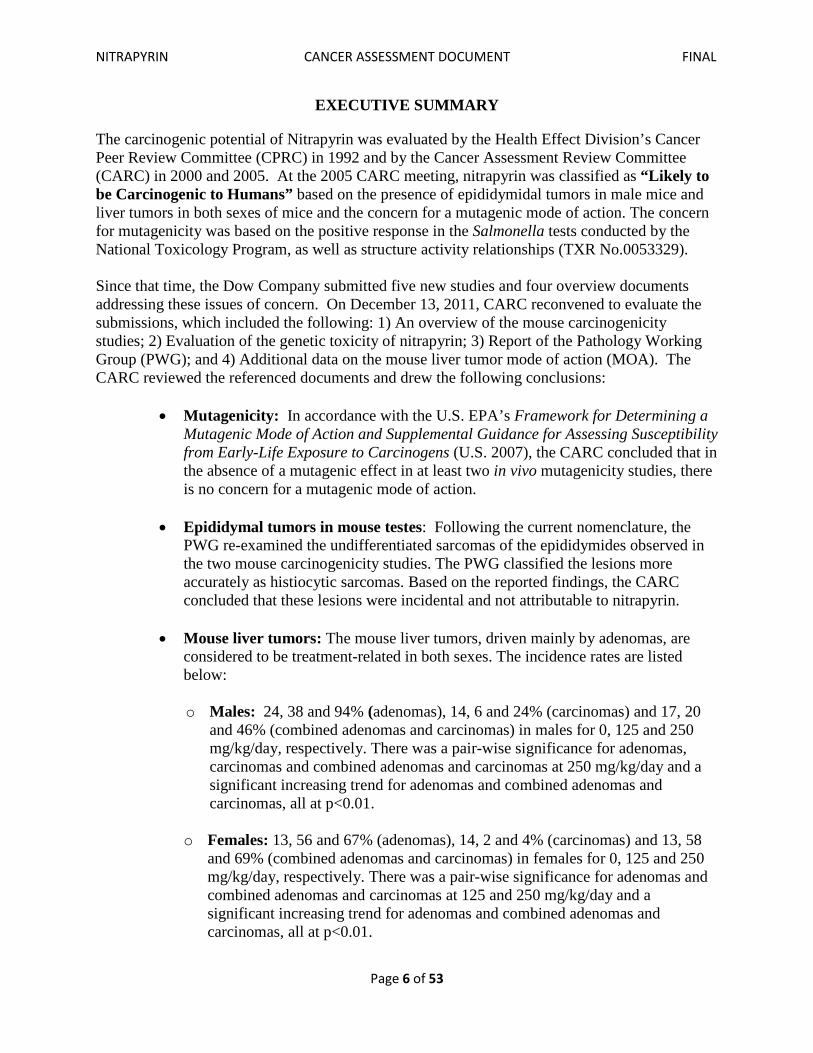
The carcinogenic potential of Nitrapyrin was evaluated by the Health Effect Division’s Cancer Peer Review Committee (CPRC) in 1992 and by the Cancer Assessment Review Committee (CARC) in 2000 and 2005. At the 2005 CARC meeting, nitrapyrin was classified as “Likely to be Carcinogenic to Humans” based on the presence of epididymidal tumors in male mice and liver tumors in both sexes of mice and the concern for a mutagenic mode of action. The concern for mutagenicity was based on the positive response in the Salmonella tests conducted by the National Toxicology Program, as well as structure activity relationships (TXR No.0053329). Since that time, the Dow Company submitted five new studies and four overview documents addressing these issues of concern. On December 13, 2011, CARC reconvened to evaluate the submissions, which included the following: 1) An overview of the mouse carcinogenicity studies; 2) Evaluation of the genetic toxicity of nitrapyrin; 3) Report of the Pathology Working Group (PWG); and 4) Additional data on the mouse liver tumor mode of action (MOA). The CARC reviewed the referenced documents and drew the following conclusions:
• Mutagenicity: In accordance with the U.S. EPA’s Framework for Determining a
Mutagenic Mode of Action and Supplemental Guidance for Assessing Susceptibility from Early-Life Exposure to Carcinogens (U.S. 2007), the CARC concluded that in the absence of a mutagenic effect in at least two in vivo mutagenicity studies, there is no concern for a mutagenic mode of action.
• Epididymal tumors in mouse testes: Following the current nomenclature, the PWG re-examined the undifferentiated sarcomas of the epididymides observed in the two mouse carcinogenicity studies. The PWG classified the lesions more accurately as histiocytic sarcomas. Based on the reported findings, the CARC concluded that these lesions were incidental and not attributable to nitrapyrin.
• Mouse liver tumors: The mouse liver tumors, driven mainly by adenomas, are considered to be treatment-related in both sexes. The incidence rates are listed below:
o Males: 24, 38 and 94% (adenomas), 14, 6 and 24% (carcinomas) and 17, 20
and 46% (combined adenomas and carcinomas) in males for 0, 125 and 250 mg/kg/day, respectively. There was a pair-wise significance for adenomas, carcinomas and combined adenomas and carcinomas at 250 mg/kg/day and a significant increasing trend for adenomas and combined adenomas and carcinomas, all at p<0.01.
o Females: 13, 56 and 67% (adenomas), 14, 2 and 4% (carcinomas) and 13, 58
and 69% (combined adenomas and carcinomas) in females for 0, 125 and 250 mg/kg/day, respectively. There was a pair-wise significance for adenomas and combined adenomas and carcinomas at 125 and 250 mg/kg/day and a significant increasing trend for adenomas and combined adenomas and carcinomas, all at p<0.01.
NITRAPYRIN CANCER ASSESSMENT DOCUMENT FINAL
Page 7 of 53
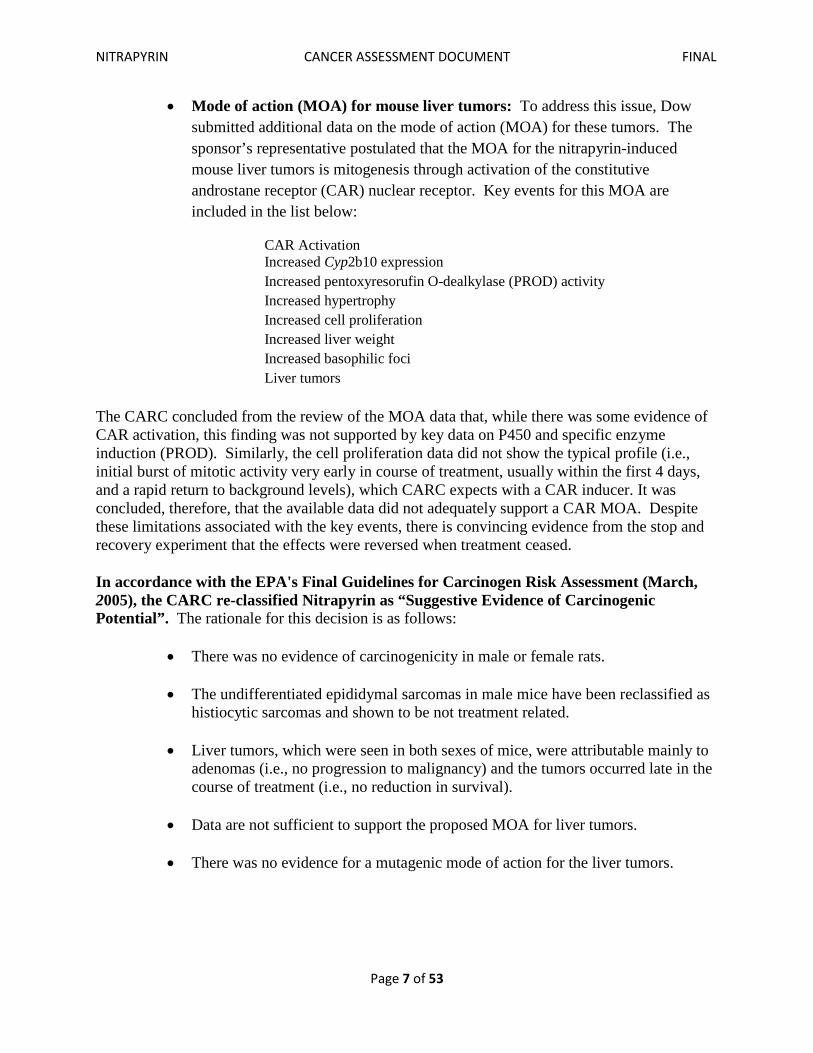
• Mode of action (MOA) for mouse liver tumors: To address this issue, Dow submitted additional data on the mode of action (MOA) for these tumors. The sponsor’s representative postulated that the MOA for the nitrapyrin-induced mouse liver tumors is mitogenesis through activation of the constitutive androstane receptor (CAR) nuclear receptor. Key events for this MOA are included in the list below:
CAR Activation Increased Cyp2b10 expression Increased pentoxyresorufin O-dealkylase (PROD) activity Increased hypertrophy Increased cell proliferation Increased liver weight
Increased basophilic foci Liver tumors
The CARC concluded from the review of the MOA data that, while there was some evidence of CAR activation, this finding was not supported by key data on P450 and specific enzyme induction (PROD). Similarly, the cell proliferation data did not show the typical profile (i.e., initial burst of mitotic activity very early in course of treatment, usually within the first 4 days, and a rapid return to background levels), which CARC expects with a CAR inducer. It was concluded, therefore, that the available data did not adequately support a CAR MOA. Despite these limitations associated with the key events, there is convincing evidence from the stop and recovery experiment that the effects were reversed when treatment ceased. In accordance with the EPA's Final Guidelines for Carcinogen Risk Assessment (March, 2005), the CARC re-classified Nitrapyrin as “Suggestive Evidence of Carcinogenic Potential”. The rationale for this decision is as follows:
• There was no evidence of carcinogenicity in male or female rats.
• The undifferentiated epididymal sarcomas in male mice have been reclassified as histiocytic sarcomas and shown to be not treatment related.
• Liver tumors, which were seen in both sexes of mice, were attributable mainly to adenomas (i.e., no progression to malignancy) and the tumors occurred late in the course of treatment (i.e., no reduction in survival).
• Data are not sufficient to support the proposed MOA for liver tumors.
• There was no evidence for a mutagenic mode of action for the liver tumors.
NITRAPYRIN CANCER ASSESSMENT DOCUMENT FINAL
Page 8 of 53
The evidence from the nitrapyrin animal data is suggestive of carcinogenicity, which raises a concern for carcinogenic effects, but is judged not sufficient for quantification of cancer risk in humans. Also, when there is suggestive evidence, the Agency does not attempt a dose-response assessment as the nature of the data generally would not support one.
The NOAEL of 3.0 mg/kg/day used for deriving the chronic RfD (0.03 mg/kg/day) is approximately 83-fold lower than the lowest dose (250 mg/kg/day) that induced benign liver tumors in mice. Consequently, the chronic RfD will adequately account for all chronic effects, including carcinogenicity, likely to result from exposure to nitrapyrin.
NITRAPYRIN CANCER ASSESSMENT DOCUMENT FINAL
Page 9 of 53
I. BACKGROUND
Nitrapyrin has been the subject of one Cancer Peer Review Committee (CPCR) report and two Cancer Assessment Review Committee (CARC) documents. Details from these meetings are summarized below: A. CPRC meeting May 6, 1992 (CPRC, 1992) Nitrapyrin was initially reviewed by CPRC on May 6, 1992. At this meeting, a combined chronic/carcinogenicity feeding study in F344 rats (0, 5, 20, and 60 mg/kg/day) and a carcinogenicity study in B6C3F1 mice (0, 5, 25 and 75 mg/kg/day) were evaluated. The rat study was acceptable and served as the basis for a Group D cancer classification (Not classifiable). In this study, a significant (p<0.05) pair wise increase in renal tubule adenomas and adenocarcinomas at 60 mg/kg/day (adenomas: 6% vs. 0% in controls, carcinomas: 6% vs. 0% in controls, and combined adenomas/carcinomas: 12% vs. 0%) was seen in male rats. This was accompanied by a significant (p<0.01) trend for adenomas, carcinomas and combined adenomas/carcinomas. CPRC concluded that the available evidence was consistent with male rat-specific nephrotoxicity related to chemically-induced α2u-globulin accumulation resulting in tumor formation. The Agency has determined that renal toxicity and neoplasia induced through this mechanism is not appropriate for human risk assessments. CPRC also determined that the mouse carcinogenicity study was unacceptable because the doses tested were too low and the maximum tolerated dose (MTD) was not achieved since the highest dose tested produced only minimal toxicity in mice. B. CARC meeting May 5, 2000 (CARC, 2000) At the first CARC meeting on nitrapyrin, the test material was classified as “Likely to be carcinogenic to humans” based on tumors noted in a newly submitted and acceptable mouse carcinogenicity study with the B6C3F1 strain mouse (0, 125 and 250 mg/kg/day) (MRID Nos. 44231803, 44231801). In this study, treatment related increases in neoplasms were noted in the liver and stomach of both sexes, in the epididymis, and in the Harderian gland in females at doses of 125 and/or 250 mg/kg/day. The previous mouse study (MRID No. 41651601) using the same strain of mice at 0, 5, 20 or 75 mg/kg/day showed no indication of a treatment- related increase in neoplasms. However, as noted earlier, CPRC determined that the high dose of 75 mg/kg/day was not adequate for carcinogenicity assessment The CARC’s decision on the cancer classification of nitrapyrin was based on the following observations:
1. Tumors occurred at multiple sites in both sexes of mice (liver and stomach for both sexes and in the epididymis and in the Harderian gland in females) at 125 and/or 250 mg/kg/day).
2. Nitrapyrin was not mutagenic in the studies submitted by the DOW Company. However,
there was SAR support for potential genotoxicity. Additionally, data from studies conducted by the National Toxicology Program (NTP) indicated that nitrapyrin was mutagenic in the Salmonella typhimurium assay in the presence of S9 activation.
NITRAPYRIN CANCER ASSESSMENT DOCUMENT FINAL
Page 10 of 53
Although the response was considered weak, 3-fold increases in the mutant colony count were induced in strain TA98 at the two highest concentrations in the presence of 30% rat or hamster S9 in the S9-cofactor mix.
3. Although the mechanistic data are inadequate, the available mutagenicity data are not supportive of a mutagenic mode of action for carcinogenicity.
The male rat renal tumors induced through α2u-globulin accumulation were not pursued any further since the issue was discussed at length in the previous CPRC with the consensus opinion that they were not relevant to the human risk assessment. C. CARC meeting February 9, 2005 CARC was reconvened on February 9, 2005 to review the conclusions of the Dow-sponsored Histopathology Peer Review and Scientific Advisory Group (SAG) on the carcinogenic classification of nitrapyrin. These conclusions were presented both as a written report (MRID 46428301) and as an oral presentation (January 13, 2005). The issues that were considered include the following:
1. Mutagenicity 2. Harderian gland tumors in female mice 3. Epididymal tumors in mouse testes 4. Papilloma and squamous cell carcinomas in the forestomach of both sexes 5. Liver tumors in both sexes
II. ISSUES CARC’s conclusions regarding these issues are presented in the March 26, 2005 CARC Report (CARC, 2005) and were as follows: A. Mutagenicity: The following was extracted from the CARC report: Based on these considerations, it was concluded that nitrapyrin was not mutagenic in CHO cells, did not cause micronuclei induction in mouse bone marrow and did not induce UDS in primary rat hepatocytes. The registrant submitted a negative Salmonella assay conducted in 1985. Nonetheless, 99% nitrapyrin did cause a reproducible increase in gene mutations in S. typhimurium TA98 in the NTP study of Zeiger et al. (1988; conducted in 1983). The increases in the presence of hamster S9 were concentration-related and 3-fold at the two highest levels. This weight-of-the evidence analysis is not a sufficient basis to ascribe a mutagenic mode of action (MOA) to the carcinogenic response of nitrapyrin. Although nitrapyrin induced a positive response in bacteria and there is support from SAR for nitrapyrin having genotoxic potential, the issue of whether this potential mutagenicity contributes to the MOA for nitrapyrin-induced carcinogenesis is unresolved.
NITRAPYRIN CANCER ASSESSMENT DOCUMENT FINAL
Page 11 of 53
B. Harderian gland tumors in female mice: The following was extracted from the CARC report:
“Although the incidence of Harderian gland tumors in female mice is slightly outside of the historical control range (2nd study), there is a lack of a clear dose response between 125(16%) and 250 (18%) mg/kg/day and the concurrent control for the second study is considered low relative to the first. Therefore, it is difficult to interpret the significance of this lesion due to the variation in control incidence between the first and second study. The CARC concluded that the Harderian gland tumors were not treatment-related.”
C. Epididymal tumors in mouse testes: The following was concluded:
“The CARC determined that the epididymal tumors are biologically significant and should be included in the weight-of-the-evidence assessment of the carcinogenicity evaluation of nitrapyrin. Considerations for this conclusion included that the undifferentiated sarcoma is a rare and malignant tumor. The tumors were late developing and this was a 24-month study (rather than the typical 18-month duration study as required by the Subdivision F guidelines). No historical control data were provided for 24-month studies to assess the spontaneous occurrence of this tumor type seen in aged (2-year) mice.”
D. Papilloma and squamous cell carcinomas in the forestomach of both sexes:
“The CARC concluded that tumors in the forestomach of mice were treatment-related, but are not relevant for human risk assessment based on differences in the structural/physiological function of the forestomach.”
E. Liver tumors in mice: The following was concluded by CARC:
“The liver tumors, which were primarily benign, were treatment-related in both sexes of the mouse. CARC reaffirmed its earlier position that the high dose of 250 mg/kg/day was adequate, but not excessive, to assess the carcinogenicity potential of nitrapyrin. This was because the increased mortality in high dose males was seen only at the end of the study period (and in this case the study was of 24 months duration instead of the usual 18 months), there were only minimal decreases in overall body weight gains, and non-neoplastic changes in the liver and stomach (both sexes) that included single cell necrosis of hepatocytes and inflammation were not considered critical. The latter is because no data were presented on the severity of the necrosis or other lesions/ conditions (i.e., the extent of liver damage). In addition, there was a lack of concordance between the increase of non-neoplastic and neoplastic lesions in female mice. “
CARC also concluded that the data submitted by the sponsor to support a MOA for the liver tumors were insufficient for determining a cytotoxic MOA. Deficiencies were the lack of temporal data and a reversibility study in mice. Similarly, the data did not show dose-response concordance for the proposed key events and tumors. It was further stated that although the evidence is not compelling, the genotoxic potential cannot be discounted at this time.
NITRAPYRIN CANCER ASSESSMENT DOCUMENT FINAL
Page 12 of 53
Based on these considerations, the 2005 CARC maintained the classification of nitrapyrin as “Likely to be Carcinogenic to Humans”. The quantification of the cancer risk was calculated to be 4.25 x 10⁻² (mg/kg/day)-1 (Brunsman, 2000). In response to these deliberations, the DOW Company sponsored and presented an oral and written presentation of the following overview documents to OPP: MRID No. Title 48210501 Hardisty, J. F. (2010). Pathology working group (PWG) review of epididymal tumors from two-year dietary oncogenicity studies with nitrapyrin in B6C3F1 mice. 48210504 Zeiger, E. (2010). Evaluation of the genetic toxicity of nitrapyrin. 48210505 Eisenbrant, D.L., LeBaron, M. J., Gollapudi, B.B. (2010). Mode of action and human relevance framework for nitrapyrin-induced mouse liver tumors. 48210507 Eisenbrant, D.L., LeBaron, M. J., Gollapudi, B.B., Lamb, J.C. (2010). Overview of the carcinogenicity of nitrapyrin in rodents and human relevance. The two genetic toxicology studies and two mechanistic studies, which are listed below, were also submitted to support the MOA conclusions from the above overviews: 47459801 Mecchi, M.S. (2007). Salmonella-Escherichia coli/mammalian microsome reverse mutation assay Preincubation method with a confirmatory assay with nitrapyrin TGAI. 48210502 Pant, K. and Celestin, N. (2009). Nitrapyrin technical grade active ingredient: Unscheduled DNA synthesis (UDS) test with mouse liver cells in vivo. 44231802 Daly, I. W. (1995). A subchronic (3-month) oral toxicity study of nitrapyrin in the mouse via dietary administration. 48210503 LeBaron, M., Schisler, M., Kan, H., Thomas, J. (2010). Nitrapyrin technical: Analysis of molecular, cellular, and biochemical changes in the livers of male B6C3F1/CRL mice treated with nitrapyrin after 1- or 2- week treatment and a 3-week recovery. 48210506 LeBaron, M.J. (2010). Cell proliferation analysis of liver from a subchronic (3-month) oral toxicity study in B6C3F1 mice- a retrospective study.
NITRAPYRIN CANCER ASSESSMENT DOCUMENT FINAL
Page 13 of 53
III. REMAINING ISSUES: A discussion of each of the remaining issues addressed by the above documents follows. It includes comments on the DOW Company’s position, along with CARC’s interpretation and response to each issue.
A. Mutagenicity Results of the most recent bacterial mutagenicity assay (MRID 47459801) submitted by DOW are presented in Table 1. Using the plate incorporation approach or the preincubation modification, nitrapyrin induced a weak but reproducible (≈2-fold) increase in the mutant colony count of S. typhimurium TA 98 at nonactivated concentrations ranging from 25 to 75 µg/plate. The expert genetic toxicologist, Dr. Errol Zeiger [author of the NTP mutagenicity study article, in which nitrapyrin was reported as positive with increased levels of rat of hamster S9 in the S9-cofactor mix (Zeiger et al., 1988) 1], was selected by DOW to evaluate the overall genetic activity profile of nitrapyrin. He concluded that nitrapyrin was negative in this microbial assay. We agree with this assessment because the fold increases, which were within the established ranges of spontaneous mutant colonies for this strain (15 -75 spontaneous revertants/plate)2
and the acceptable range of the reporting laboratory (8-60 revertants/plate) resulted from the extremely low spontaneous reversion frequency of strain TA98 (13-24 revertants/plate).
1 Zeiger, E, Anderson, B, Haworth, S, Lawlor, T, Mortelmans, K (1988). Salmonella mutagenicity tests: IV. Results from the testing of 300 chemicals. Environ Mol Mutagen 11(Suppli.12); 1-157. 2 De Serres, FJ and Shelby, MD. (1979). Recommendations of data production and analysis using the Salmonella/microsome mutagenicity assay. Mutat Res 64:159-165.
NITRAPYRIN CANCER ASSESSMENT DOCUMENT FINAL
Page 14 of 53
Table 1. Summary Findings from Additional Genetic Toxicology Studies on Nitrapyrin Guideline No. /Study Type MRID No. (year)/
Classification/ Concentrations
Results
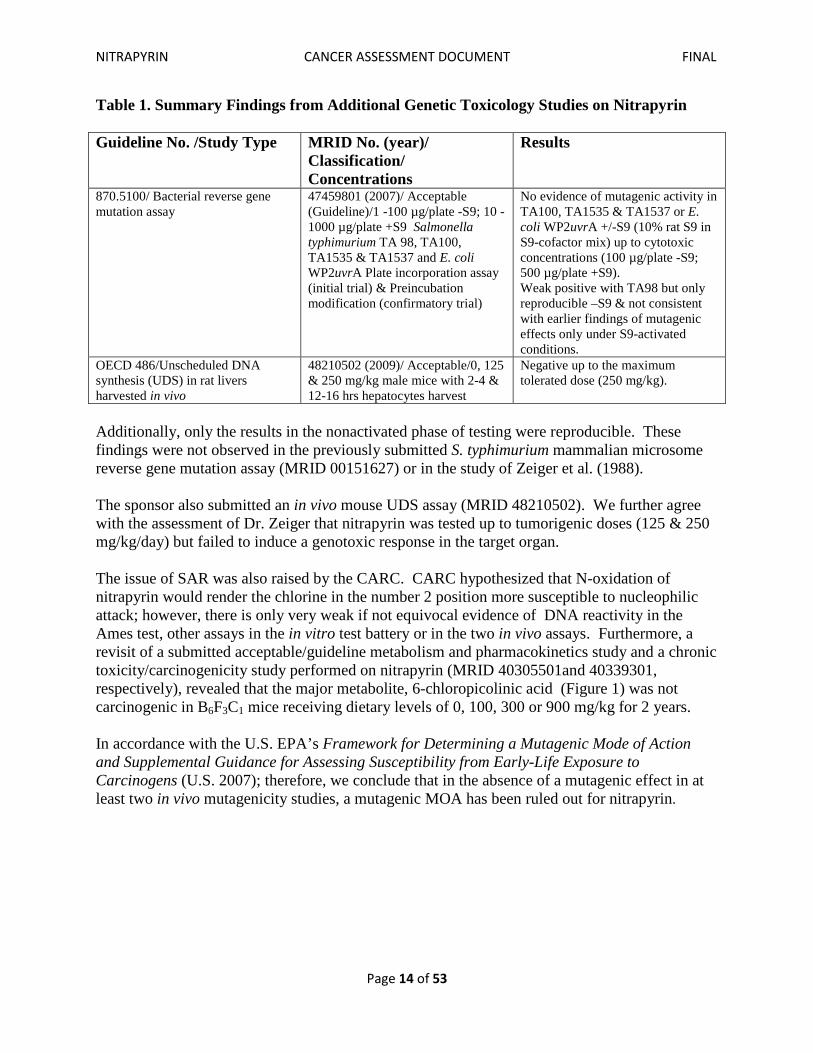
870.5100/ Bacterial reverse gene mutation assay
47459801 (2007)/ Acceptable (Guideline)/1 -100 µg/plate -S9; 10 -1000 µg/plate +S9 Salmonella typhimurium TA 98, TA100, TA1535 & TA1537 and E. coli WP2uvrA Plate incorporation assay (initial trial) & Preincubation modification (confirmatory trial)
No evidence of mutagenic activity in TA100, TA1535 & TA1537 or E. coli WP2uvrA +/-S9 (10% rat S9 in S9-cofactor mix) up to cytotoxic concentrations (100 µg/plate -S9; 500 µg/plate +S9). Weak positive with TA98 but only reproducible –S9 & not consistent with earlier findings of mutagenic effects only under S9-activated conditions.
OECD 486/Unscheduled DNA synthesis (UDS) in rat livers harvested in vivo
48210502 (2009)/ Acceptable/0, 125 & 250 mg/kg male mice with 2-4 & 12-16 hrs hepatocytes harvest
Negative up to the maximum tolerated dose (250 mg/kg).
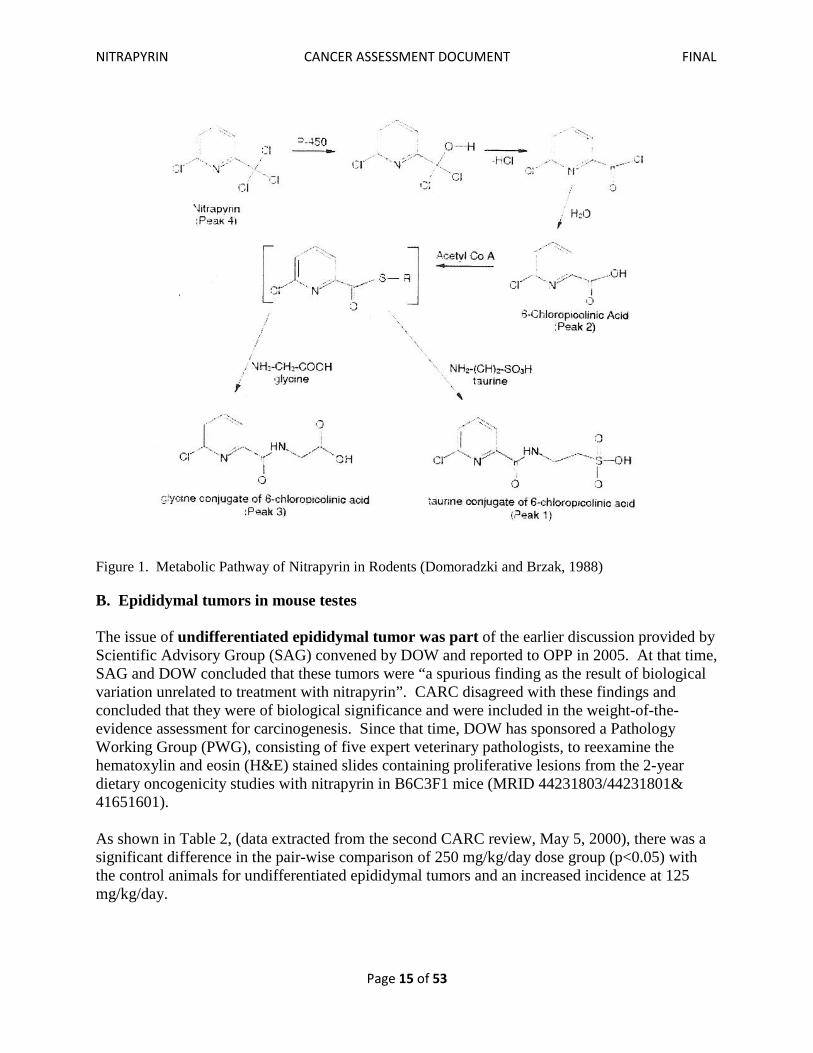
Additionally, only the results in the nonactivated phase of testing were reproducible. These findings were not observed in the previously submitted S. typhimurium mammalian microsome reverse gene mutation assay (MRID 00151627) or in the study of Zeiger et al. (1988). The sponsor also submitted an in vivo mouse UDS assay (MRID 48210502). We further agree with the assessment of Dr. Zeiger that nitrapyrin was tested up to tumorigenic doses (125 & 250 mg/kg/day) but failed to induce a genotoxic response in the target organ. The issue of SAR was also raised by the CARC. CARC hypothesized that N-oxidation of nitrapyrin would render the chlorine in the number 2 position more susceptible to nucleophilic attack; however, there is only very weak if not equivocal evidence of DNA reactivity in the Ames test, other assays in the in vitro test battery or in the two in vivo assays. Furthermore, a revisit of a submitted acceptable/guideline metabolism and pharmacokinetics study and a chronic toxicity/carcinogenicity study performed on nitrapyrin (MRID 40305501and 40339301, respectively), revealed that the major metabolite, 6-chloropicolinic acid (Figure 1) was not carcinogenic in B6F3C1 mice receiving dietary levels of 0, 100, 300 or 900 mg/kg for 2 years. In accordance with the U.S. EPA’s Framework for Determining a Mutagenic Mode of Action and Supplemental Guidance for Assessing Susceptibility from Early-Life Exposure to Carcinogens (U.S. 2007); therefore, we conclude that in the absence of a mutagenic effect in at least two in vivo mutagenicity studies, a mutagenic MOA has been ruled out for nitrapyrin.
NITRAPYRIN CANCER ASSESSMENT DOCUMENT FINAL
Page 15 of 53
Figure 1. Metabolic Pathway of Nitrapyrin in Rodents (Domoradzki and Brzak, 1988)
B. Epididymal tumors in mouse testes The issue of undifferentiated epididymal tumor was part of the earlier discussion provided by Scientific Advisory Group (SAG) convened by DOW and reported to OPP in 2005. At that time, SAG and DOW concluded that these tumors were “a spurious finding as the result of biological variation unrelated to treatment with nitrapyrin”. CARC disagreed with these findings and concluded that they were of biological significance and were included in the weight-of-the-evidence assessment for carcinogenesis. Since that time, DOW has sponsored a Pathology Working Group (PWG), consisting of five expert veterinary pathologists, to reexamine the hematoxylin and eosin (H&E) stained slides containing proliferative lesions from the 2-year dietary oncogenicity studies with nitrapyrin in B6C3F1 mice (MRID 44231803/44231801& 41651601). As shown in Table 2, (data extracted from the second CARC review, May 5, 2000), there was a significant difference in the pair-wise comparison of 250 mg/kg/day dose group (p<0.05) with the control animals for undifferentiated epididymal tumors and an increased incidence at 125 mg/kg/day.
NITRAPYRIN CANCER ASSESSMENT DOCUMENT FINAL
Page 16 of 53
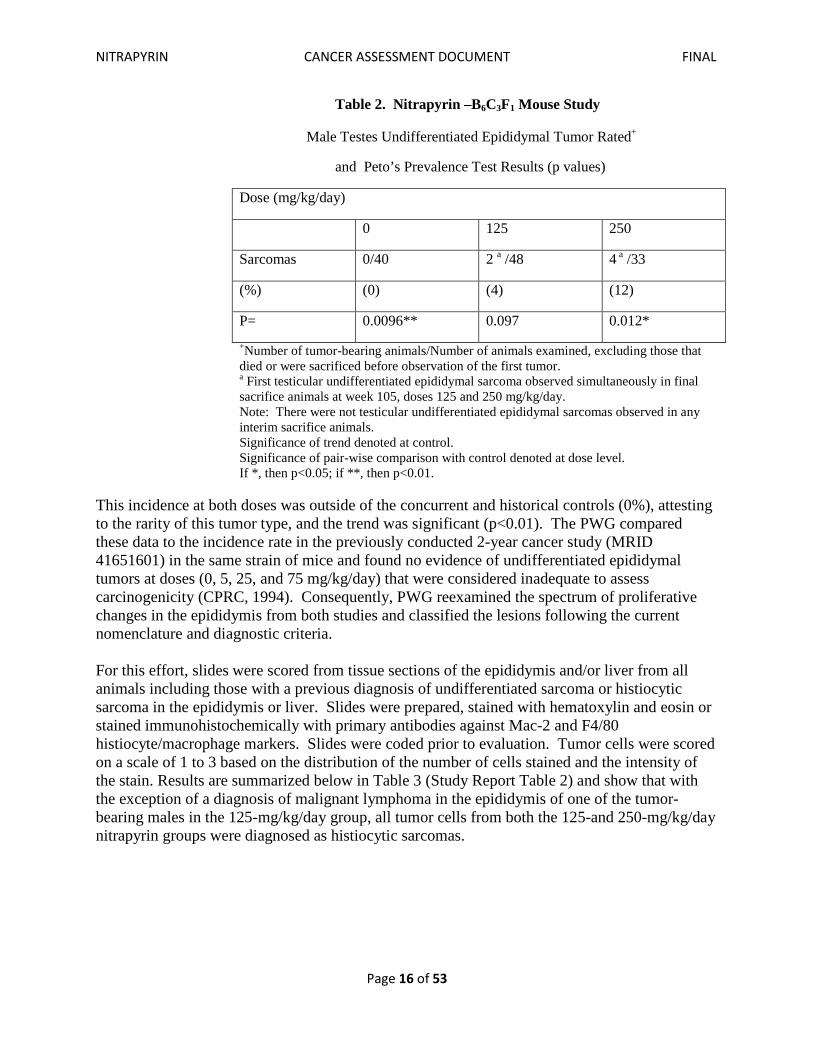
Table 2. Nitrapyrin –B6C3F1 Mouse Study
Male Testes Undifferentiated Epididymal Tumor Rated+
and Peto’s Prevalence Test Results (p values)
Dose (mg/kg/day)
0 125 250
Sarcomas 0/40 2 a /48 4 a /33
(%) (0) (4) (12)
P= 0.0096** 0.097 0.012* +Number of tumor-bearing animals/Number of animals examined, excluding those that died or were sacrificed before observation of the first tumor. a First testicular undifferentiated epididymal sarcoma observed simultaneously in final sacrifice animals at week 105, doses 125 and 250 mg/kg/day. Note: There were not testicular undifferentiated epididymal sarcomas observed in any interim sacrifice animals. Significance of trend denoted at control. Significance of pair-wise comparison with control denoted at dose level. If *, then p<0.05; if **, then p<0.01.
This incidence at both doses was outside of the concurrent and historical controls (0%), attesting to the rarity of this tumor type, and the trend was significant (p<0.01). The PWG compared these data to the incidence rate in the previously conducted 2-year cancer study (MRID 41651601) in the same strain of mice and found no evidence of undifferentiated epididymal tumors at doses (0, 5, 25, and 75 mg/kg/day) that were considered inadequate to assess carcinogenicity (CPRC, 1994). Consequently, PWG reexamined the spectrum of proliferative changes in the epididymis from both studies and classified the lesions following the current nomenclature and diagnostic criteria. For this effort, slides were scored from tissue sections of the epididymis and/or liver from all animals including those with a previous diagnosis of undifferentiated sarcoma or histiocytic sarcoma in the epididymis or liver. Slides were prepared, stained with hematoxylin and eosin or stained immunohistochemically with primary antibodies against Mac-2 and F4/80 histiocyte/macrophage markers. Slides were coded prior to evaluation. Tumor cells were scored on a scale of 1 to 3 based on the distribution of the number of cells stained and the intensity of the stain. Results are summarized below in Table 3 (Study Report Table 2) and show that with the exception of a diagnosis of malignant lymphoma in the epididymis of one of the tumor-bearing males in the 125-mg/kg/day group, all tumor cells from both the 125-and 250-mg/kg/day nitrapyrin groups were diagnosed as histiocytic sarcomas.
NITRAPYRIN CANCER ASSESSMENT DOCUMENT FINAL
Page 17 of 53
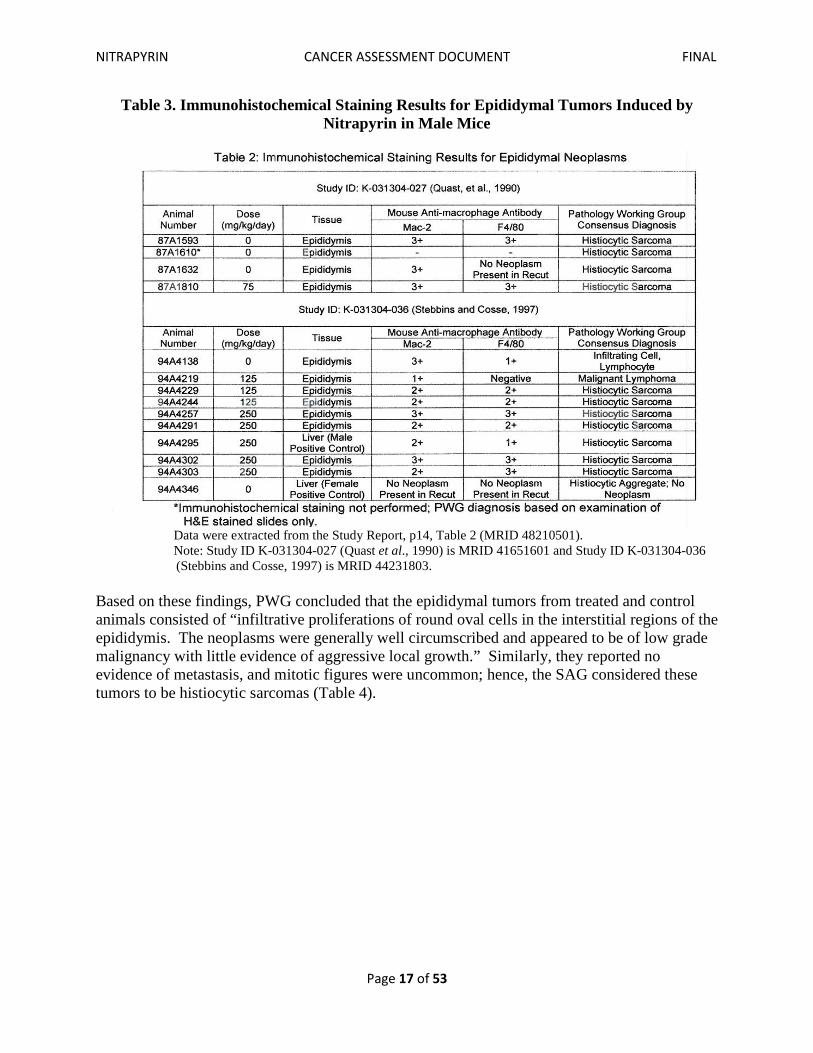
Table 3. Immunohistochemical Staining Results for Epididymal Tumors Induced by Nitrapyrin in Male Mice
Data were extracted from the Study Report, p14, Table 2 (MRID 48210501). Note: Study ID K-031304-027 (Quast et al., 1990) is MRID 41651601 and Study ID K-031304-036
(Stebbins and Cosse, 1997) is MRID 44231803. Based on these findings, PWG concluded that the epididymal tumors from treated and control animals consisted of “infiltrative proliferations of round oval cells in the interstitial regions of the epididymis. The neoplasms were generally well circumscribed and appeared to be of low grade malignancy with little evidence of aggressive local growth.” Similarly, they reported no evidence of metastasis, and mitotic figures were uncommon; hence, the SAG considered these tumors to be histiocytic sarcomas (Table 4).
NITRAPYRIN CANCER ASSESSMENT DOCUMENT FINAL
Page 18 of 53
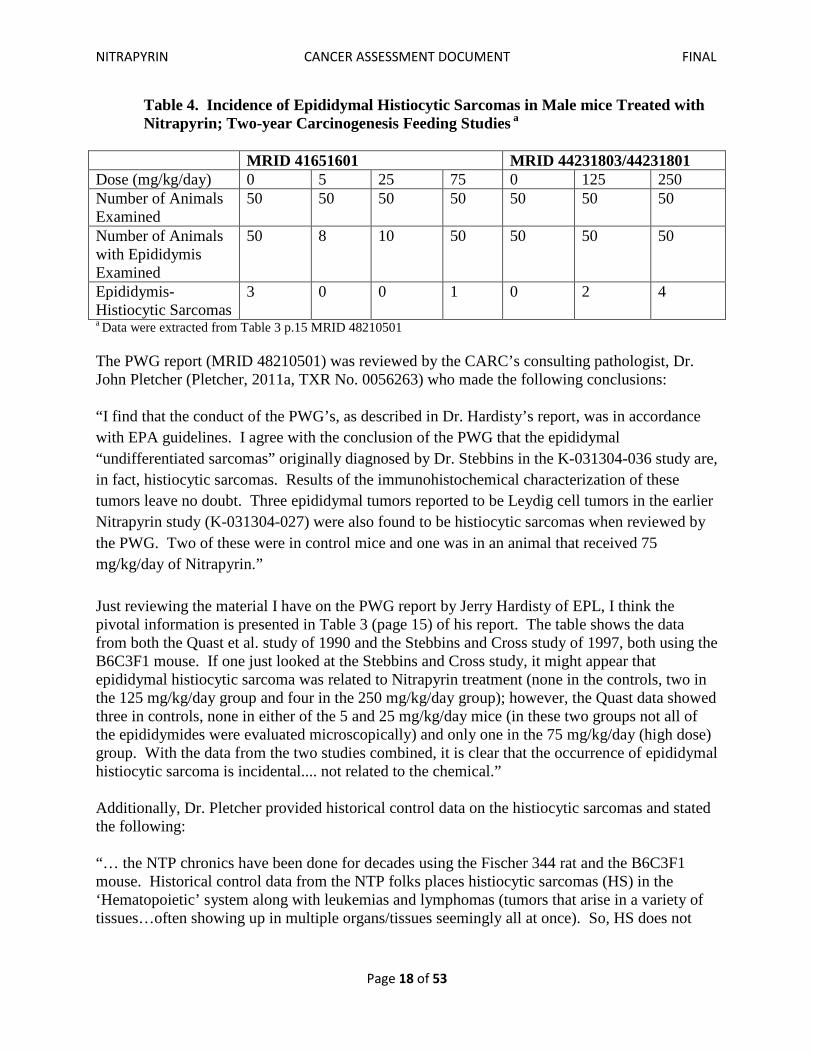
Table 4. Incidence of Epididymal Histiocytic Sarcomas in Male mice Treated with Nitrapyrin; Two-year Carcinogenesis Feeding Studies a
MRID 41651601 MRID 44231803/44231801 Dose (mg/kg/day) 0 5 25 75 0 125 250 Number of Animals Examined
50 50 50 50 50 50 50
Number of Animals with Epididymis Examined
50 8 10 50 50 50 50
Epididymis- Histiocytic Sarcomas
3 0 0 1 0 2 4
a Data were extracted from Table 3 p.15 MRID 48210501 The PWG report (MRID 48210501) was reviewed by the CARC’s consulting pathologist, Dr. John Pletcher (Pletcher, 2011a, TXR No. 0056263) who made the following conclusions: “I find that the conduct of the PWG’s, as described in Dr. Hardisty’s report, was in accordance with EPA guidelines. I agree with the conclusion of the PWG that the epididymal “undifferentiated sarcomas” originally diagnosed by Dr. Stebbins in the K-031304-036 study are, in fact, histiocytic sarcomas. Results of the immunohistochemical characterization of these tumors leave no doubt. Three epididymal tumors reported to be Leydig cell tumors in the earlier Nitrapyrin study (K-031304-027) were also found to be histiocytic sarcomas when reviewed by the PWG. Two of these were in control mice and one was in an animal that received 75 mg/kg/day of Nitrapyrin.” Just reviewing the material I have on the PWG report by Jerry Hardisty of EPL, I think the pivotal information is presented in Table 3 (page 15) of his report. The table shows the data from both the Quast et al. study of 1990 and the Stebbins and Cross study of 1997, both using the B6C3F1 mouse. If one just looked at the Stebbins and Cross study, it might appear that epididymal histiocytic sarcoma was related to Nitrapyrin treatment (none in the controls, two in the 125 mg/kg/day group and four in the 250 mg/kg/day group); however, the Quast data showed three in controls, none in either of the 5 and 25 mg/kg/day mice (in these two groups not all of the epididymides were evaluated microscopically) and only one in the 75 mg/kg/day (high dose) group. With the data from the two studies combined, it is clear that the occurrence of epididymal histiocytic sarcoma is incidental.... not related to the chemical.” Additionally, Dr. Pletcher provided historical control data on the histiocytic sarcomas and stated the following: “… the NTP chronics have been done for decades using the Fischer 344 rat and the B6C3F1 mouse. Historical control data from the NTP folks places histiocytic sarcomas (HS) in the ‘Hematopoietic’ system along with leukemias and lymphomas (tumors that arise in a variety of tissues…often showing up in multiple organs/tissues seemingly all at once). So, HS does not
NITRAPYRIN CANCER ASSESSMENT DOCUMENT FINAL
Page 19 of 53
appear under ‘epididymis’. Under “hematopoietic, all sites’ its means incidence is recorded a 0.5% with a range of 0-4%.” “Accordingly, the incidence seen at 125 and 250 mg/kg (2 and 4%, respectively) is within the NTP historical control range.” C. Dose Adequacy There was also an issue of dose adequacy that was raised by the sponsor. In response to the CARC’s findings of March 26, 2005, DOW provided additional tables of liver data containing severity scores for the non-neoplastic lesions to dispute the CARC position that the high dose of nitrapyrin (250 mg/kg/day) was adequate, but not excessive. CARC reaffirmed its earlier position regarding dose adequacy because mortality only occurred at the end of the study; there were only minimal decreases in body weight gains; and the non-neoplastic changes in the liver and stomach were not considered to be critical. Dr Pletcher also commented on the issue of dose adequacy and stated the following: “I am not convinced by the registrant’s position that the maximum tolerated dose (MTD) was exceeded at the 125 and 250 mg/kg/day dose levels. The body weight and body weight gains decreases are not sufficient to support such a position, and the increased mortality experienced by the male mice occurred late in the study (beyond 18 months). The above data suggest adequate but not excessive doses as decided by the CARC in the 26 March report. Considering the non-neoplastic liver lesions, several of which are very common in aging mice, I find increase in the incidence rates of individual cell necrosis as well as some other lesions at 250 mg/kg/day at ’very slight’ or ‘slight’ in severity. An increase in the size of the hepatocytes (either centrilobular or panlobular) was often graded as moderate, but there was no consistent dose relationship and this change is considered to be more of a physiological response that one of toxicity. There is nothing in this additional data to convince me that the two highest dose levels were excessive.” (Pletcher, 2011d). Based on these considerations, CARC reaffirmed its earlier position on the adequacy of the high dose in the mouse study and that the liver tumors, albeit primarily adenomas, were treatment-related in both sexes. In September 2010, DOW submitted new data from mechanistic studies to support the new position that the liver tumors were induced through activation of the constitutive androstane nuclear receptor (CAR), the most recent mode of action (MOA) proposed by the sponsor. The new data from these mechanistic studies is the subject of the latest CARC meeting.
NITRAPYRIN CANCER ASSESSMENT DOCUMENT FINAL
Page 20 of 53
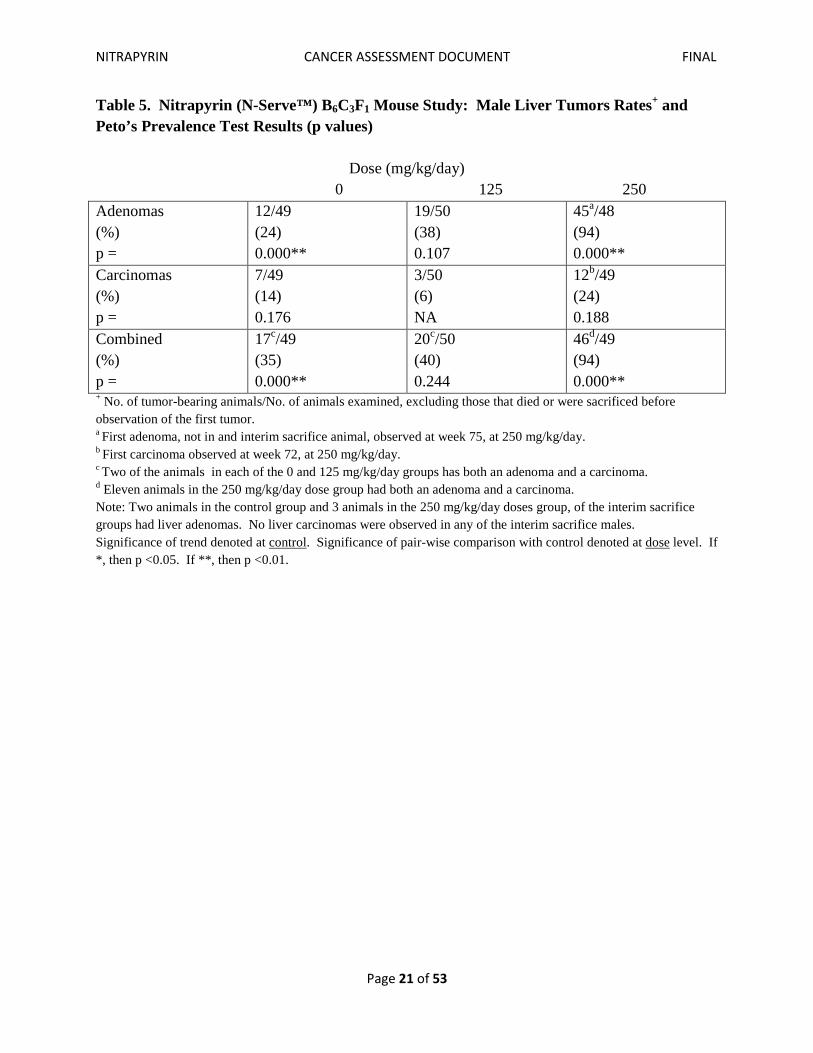
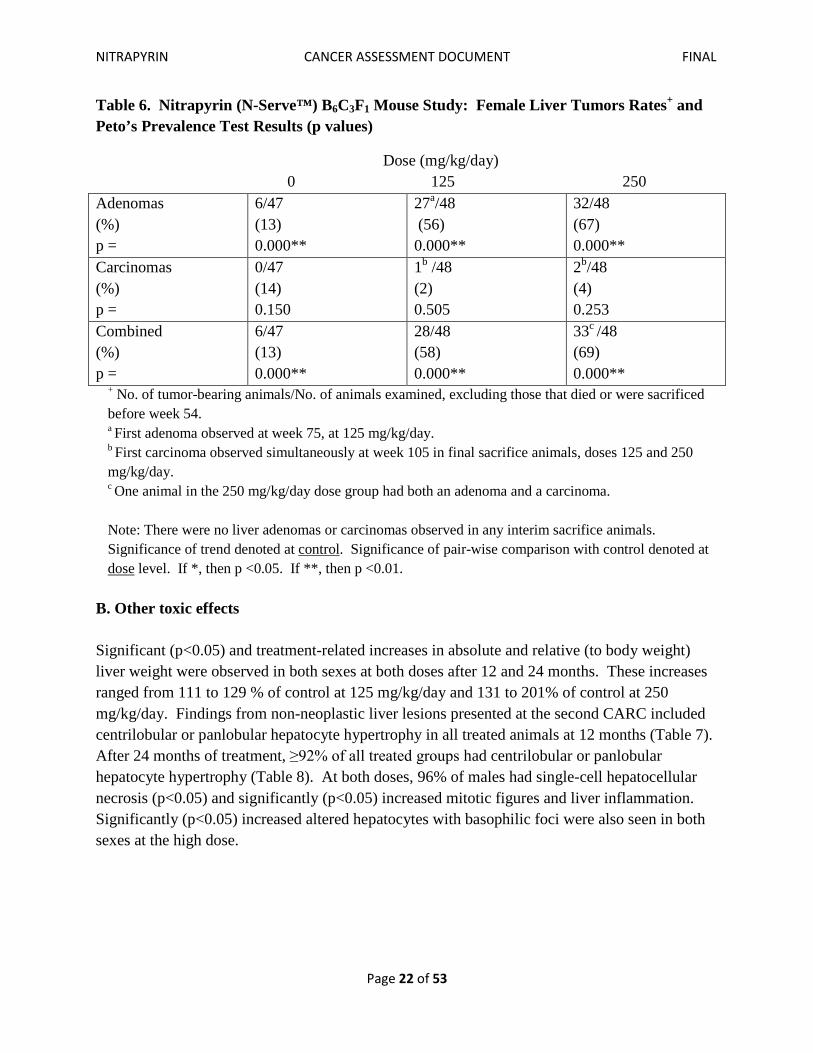
IV. EVALUATION OF LIVER TUMORS AND MECHANISTIC STUDIES A. Liver Tumors (The following was extracted from the CARC, second review): In the 2-year dietary study under consideration, B6C3F1 mice (50/sex/dose) received nitrapyrin at dietary levels of 0, 125 or 250 mg/kg/day for 24 months. An additional 10 mice per sex per dose were designated for interim sacrifice at 12 months. Data from the tumor analyses are presented in Table 5. As shown, male mice had significant differences in the pair-wise comparisons of the 250-mg/kg/day-dose group with the controls for hepatocellular adenomas (45/48, 94% vs. 12/49, 24% in the controls), and adenomas/carcinomas combined (46/49, 94% vs. 17/49, 35% in the controls, both at p<0.01). A significant (p<0.01) increasing trend for these tumors was also noted. Although the combined incidence (at 250 mg/kg/day) was driven by the incidence of adenomas, it had a malignant component (carcinomas: 12/49, 24% vs. 7/49, 14% in control). The incidence of adenomas at 250 mg/kg/day was outside the range for the historical control (14-54%). In females, significant differences in the pair-wise comparisons of the 125- and 250-mg/kg/day groups with the controls for hepatocellular adenomas (27/48, 56% and 32/48, 67%, respectively vs. 6/47, 13% in controls), and adenomas and carcinomas combined (28/48, 58% and 33/48, 69%, respectively, vs. 6/47, 13% in controls), at p <0.01 (Table 6). The combined rate was driven by the adenomas, and the incidence of adenomas at 125 and 250 mg/kg/day was outside the range for the historical control (4-26%). A significant (p<0.01) increasing trend for these tumors was also noted.
NITRAPYRIN CANCER ASSESSMENT DOCUMENT FINAL
Page 21 of 53
Table 5. Nitrapyrin (N-Serve™) B6C3F1 Mouse Study: Male Liver Tumors Rates+ and Peto’s Prevalence Test Results (p values)
Dose (mg/kg/day) 0 125 250 Adenomas (%) p =
12/49 (24) 0.000**
19/50 (38) 0.107
45a/48 (94) 0.000**
Carcinomas (%) p =
7/49 (14) 0.176
3/50 (6) NA
12b/49 (24) 0.188
Combined (%) p =
17c/49 (35) 0.000**
20c/50 (40) 0.244
46d/49 (94) 0.000**
+ No. of tumor-bearing animals/No. of animals examined, excluding those that died or were sacrificed before observation of the first tumor. a First adenoma, not in and interim sacrifice animal, observed at week 75, at 250 mg/kg/day. b First carcinoma observed at week 72, at 250 mg/kg/day. c Two of the animals in each of the 0 and 125 mg/kg/day groups has both an adenoma and a carcinoma. d Eleven animals in the 250 mg/kg/day dose group had both an adenoma and a carcinoma. Note: Two animals in the control group and 3 animals in the 250 mg/kg/day doses group, of the interim sacrifice groups had liver adenomas. No liver carcinomas were observed in any of the interim sacrifice males. Significance of trend denoted at control. Significance of pair-wise comparison with control denoted at dose
level. If *, then p <0.05. If **, then p <0.01.
NITRAPYRIN CANCER ASSESSMENT DOCUMENT FINAL
Page 22 of 53
Table 6. Nitrapyrin (N-Serve™) B6C3F1 Mouse Study: Female Liver Tumors Rates+ and Peto’s Prevalence Test Results (p values)
Dose (mg/kg/day) 0 125 250 Adenomas (%) p =
6/47 (13) 0.000**
27a/48 (56) 0.000**
32/48 (67) 0.000**
Carcinomas (%) p =
0/47 (14) 0.150
1b /48 (2) 0.505
2b/48 (4) 0.253
Combined (%) p =
6/47 (13) 0.000**
28/48 (58) 0.000**
33c /48 (69) 0.000**
+ No. of tumor-bearing animals/No. of animals examined, excluding those that died or were sacrificed before week 54. a First adenoma observed at week 75, at 125 mg/kg/day. b First carcinoma observed simultaneously at week 105 in final sacrifice animals, doses 125 and 250 mg/kg/day.
c One animal in the 250 mg/kg/day dose group had both an adenoma and a carcinoma. Note: There were no liver adenomas or carcinomas observed in any interim sacrifice animals. Significance of trend denoted at control. Significance of pair-wise comparison with control denoted at dose
level. If *, then p <0.05. If **, then p <0.01.
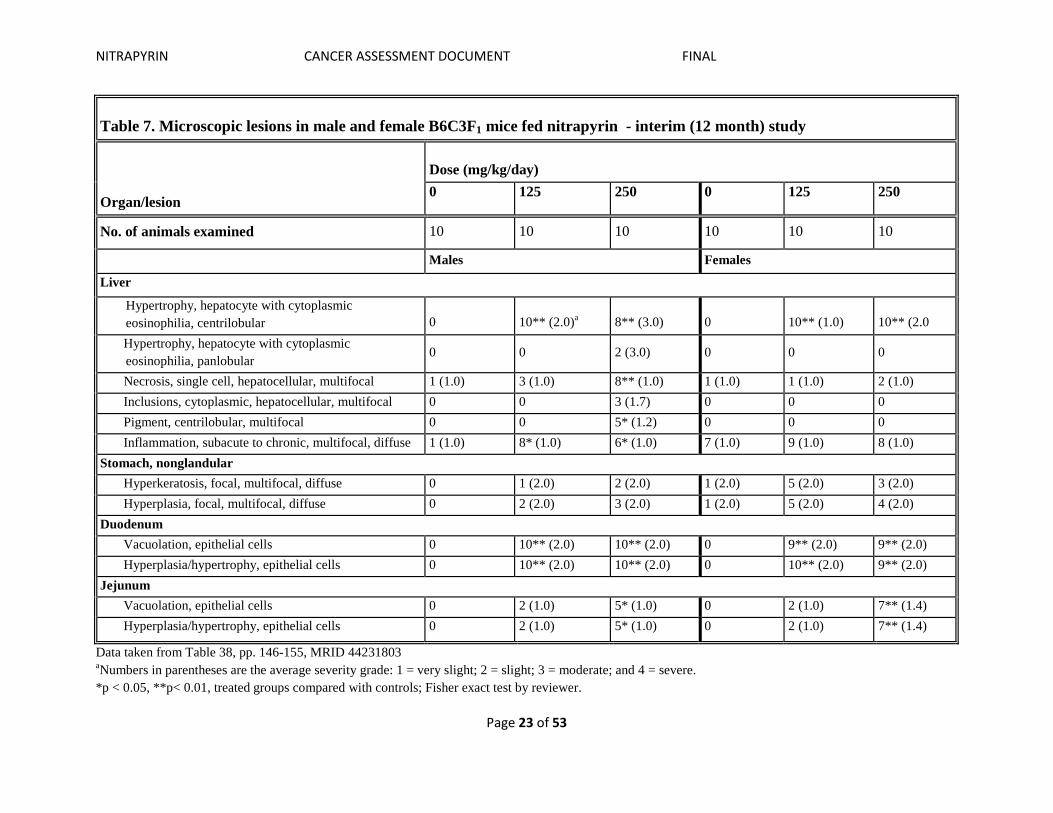
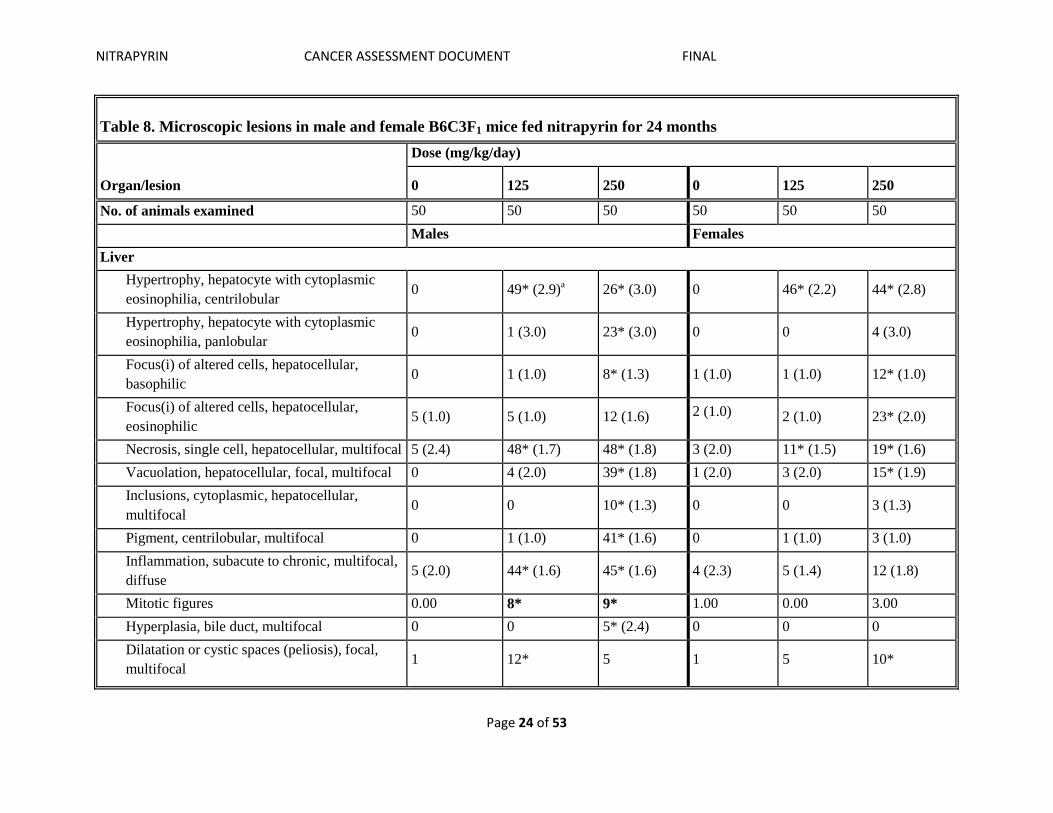
B. Other toxic effects Significant (p<0.05) and treatment-related increases in absolute and relative (to body weight) liver weight were observed in both sexes at both doses after 12 and 24 months. These increases ranged from 111 to 129 % of control at 125 mg/kg/day and 131 to 201% of control at 250 mg/kg/day. Findings from non-neoplastic liver lesions presented at the second CARC included centrilobular or panlobular hepatocyte hypertrophy in all treated animals at 12 months (Table 7). After 24 months of treatment, ≥92% of all treated groups had centrilobular or panlobular hepatocyte hypertrophy (Table 8). At both doses, 96% of males had single-cell hepatocellular necrosis (p<0.05) and significantly (p<0.05) increased mitotic figures and liver inflammation. Significantly (p<0.05) increased altered hepatocytes with basophilic foci were also seen in both sexes at the high dose.
NITRAPYRIN CANCER ASSESSMENT DOCUMENT FINAL
Page 23 of 53
Table 7. Microscopic lesions in male and female B6C3F1 mice fed nitrapyrin - interim (12 month) study
Organ/lesion
Dose (mg/kg/day) 0 125 250 0 125 250
No. of animals examined 10 10 10 10 10 10
Males Females
Liver
Hypertrophy, hepatocyte with cytoplasmic eosinophilia, centrilobular
0
10** (2.0)a
8** (3.0)
0
10** (1.0)
10** (2.0 Hypertrophy, hepatocyte with cytoplasmic eosinophilia, panlobular
0 0 2 (3.0) 0 0 0
Necrosis, single cell, hepatocellular, multifocal 1 (1.0) 3 (1.0) 8** (1.0) 1 (1.0) 1 (1.0) 2 (1.0) Inclusions, cytoplasmic, hepatocellular, multifocal 0 0 3 (1.7) 0 0 0 Pigment, centrilobular, multifocal 0 0 5* (1.2) 0 0 0 Inflammation, subacute to chronic, multifocal, diffuse 1 (1.0) 8* (1.0) 6* (1.0) 7 (1.0) 9 (1.0) 8 (1.0)
Stomach, nonglandular Hyperkeratosis, focal, multifocal, diffuse 0 1 (2.0) 2 (2.0) 1 (2.0) 5 (2.0) 3 (2.0) Hyperplasia, focal, multifocal, diffuse 0 2 (2.0) 3 (2.0) 1 (2.0) 5 (2.0) 4 (2.0)
Duodenum Vacuolation, epithelial cells 0 10** (2.0) 10** (2.0) 0 9** (2.0) 9** (2.0) Hyperplasia/hypertrophy, epithelial cells 0 10** (2.0) 10** (2.0) 0 10** (2.0) 9** (2.0)
Jejunum Vacuolation, epithelial cells 0 2 (1.0) 5* (1.0) 0 2 (1.0) 7** (1.4) Hyperplasia/hypertrophy, epithelial cells 0 2 (1.0) 5* (1.0) 0 2 (1.0) 7** (1.4)
Data taken from Table 38, pp. 146-155, MRID 44231803 aNumbers in parentheses are the average severity grade: 1 = very slight; 2 = slight; 3 = moderate; and 4 = severe. *p < 0.05, **p< 0.01, treated groups compared with controls; Fisher exact test by reviewer.
NITRAPYRIN CANCER ASSESSMENT DOCUMENT FINAL
Page 24 of 53
Table 8. Microscopic lesions in male and female B6C3F1 mice fed nitrapyrin for 24 months
Organ/lesion
Dose (mg/kg/day)
0 125 250 0 125 250
No. of animals examined 50 50 50 50 50 50 Males Females Liver
Hypertrophy, hepatocyte with cytoplasmic eosinophilia, centrilobular 0 49* (2.9)a 26* (3.0) 0 46* (2.2) 44* (2.8)
Hypertrophy, hepatocyte with cytoplasmic eosinophilia, panlobular 0 1 (3.0) 23* (3.0) 0 0 4 (3.0)
Focus(i) of altered cells, hepatocellular, basophilic
0 1 (1.0) 8* (1.3) 1 (1.0) 1 (1.0) 12* (1.0)
Focus(i) of altered cells, hepatocellular, eosinophilic
5 (1.0) 5 (1.0) 12 (1.6) 2 (1.0) 2 (1.0) 23* (2.0)
Necrosis, single cell, hepatocellular, multifocal 5 (2.4) 48* (1.7) 48* (1.8) 3 (2.0) 11* (1.5) 19* (1.6) Vacuolation, hepatocellular, focal, multifocal 0 4 (2.0) 39* (1.8) 1 (2.0) 3 (2.0) 15* (1.9) Inclusions, cytoplasmic, hepatocellular, multifocal
0 0 10* (1.3) 0 0 3 (1.3)
Pigment, centrilobular, multifocal 0 1 (1.0) 41* (1.6) 0 1 (1.0) 3 (1.0) Inflammation, subacute to chronic, multifocal, diffuse
5 (2.0) 44* (1.6) 45* (1.6) 4 (2.3) 5 (1.4) 12 (1.8)
Mitotic figures 0.00 8* 9* 1.00 0.00 3.00 Hyperplasia, bile duct, multifocal 0 0 5* (2.4) 0 0 0 Dilatation or cystic spaces (peliosis), focal, multifocal
1 12* 5 1 5 10*
NITRAPYRIN CANCER ASSESSMENT DOCUMENT FINAL
Page 25 of 53
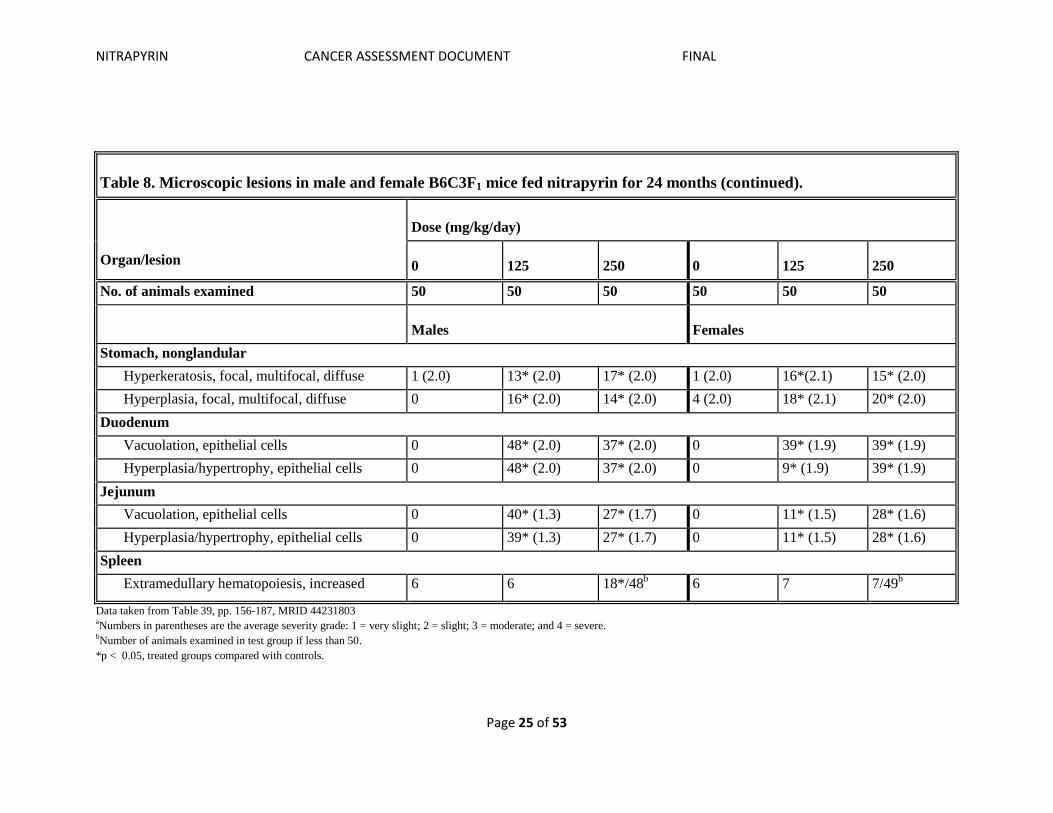
Table 8. Microscopic lesions in male and female B6C3F1 mice fed nitrapyrin for 24 months (continued).
Organ/lesion
Dose (mg/kg/day)
0
125
250
0
125
250
No. of animals examined 50 50 50 50 50 50
Males
Females Stomach, nonglandular
Hyperkeratosis, focal, multifocal, diffuse 1 (2.0) 13* (2.0) 17* (2.0) 1 (2.0) 16*(2.1) 15* (2.0) Hyperplasia, focal, multifocal, diffuse 0 16* (2.0) 14* (2.0) 4 (2.0) 18* (2.1) 20* (2.0)
Duodenum Vacuolation, epithelial cells 0 48* (2.0) 37* (2.0) 0 39* (1.9) 39* (1.9) Hyperplasia/hypertrophy, epithelial cells 0 48* (2.0) 37* (2.0) 0 9* (1.9) 39* (1.9)
Jejunum Vacuolation, epithelial cells 0 40* (1.3) 27* (1.7) 0 11* (1.5) 28* (1.6) Hyperplasia/hypertrophy, epithelial cells 0 39* (1.3) 27* (1.7) 0 11* (1.5) 28* (1.6)
Spleen Extramedullary hematopoiesis, increased 6 6 18*/48b 6 7 7/49b
Data taken from Table 39, pp. 156-187, MRID 44231803 aNumbers in parentheses are the average severity grade: 1 = very slight; 2 = slight; 3 = moderate; and 4 = severe. bNumber of animals examined in test group if less than 50. *p < 0.05, treated groups compared with controls.
NITRAPYRIN CANCER ASSESSMENT DOCUMENT FINAL
Page 26 of 53
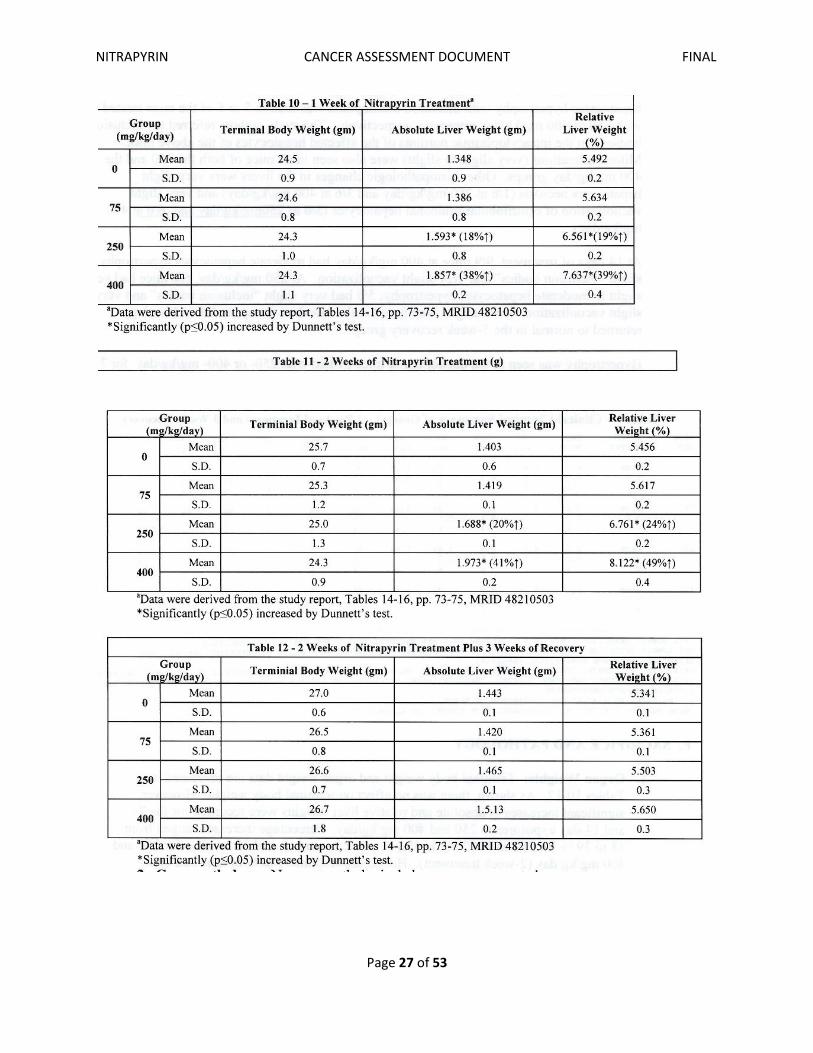
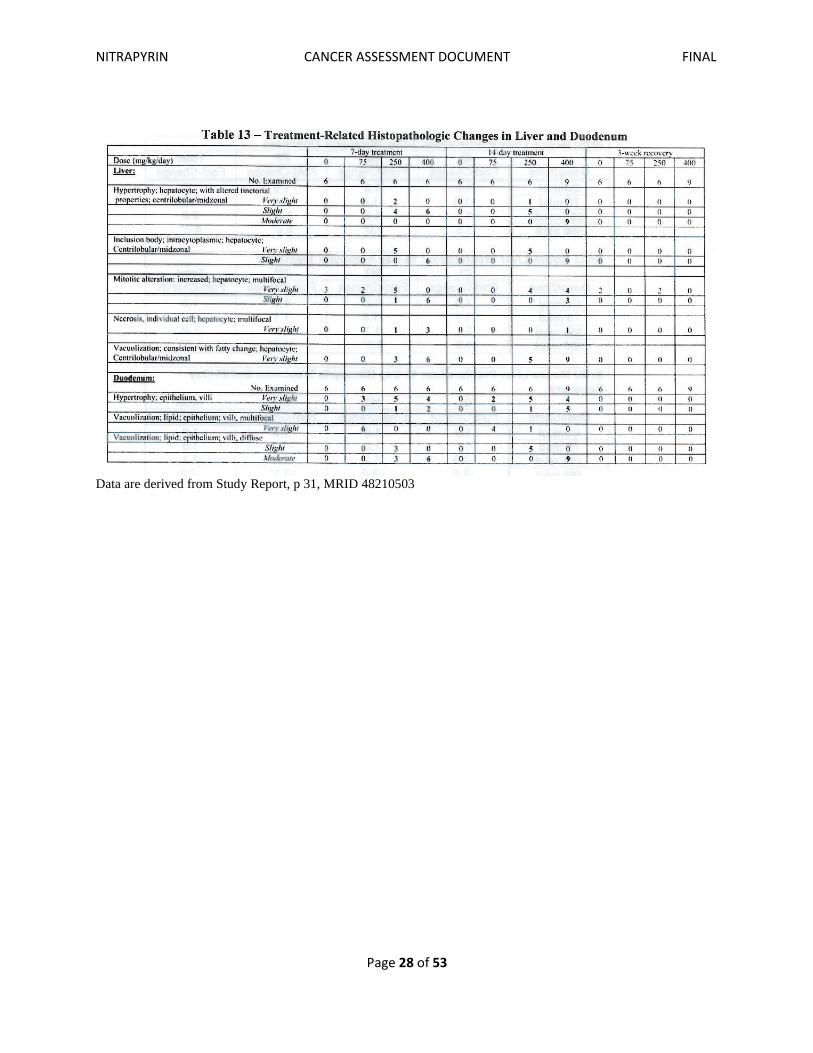
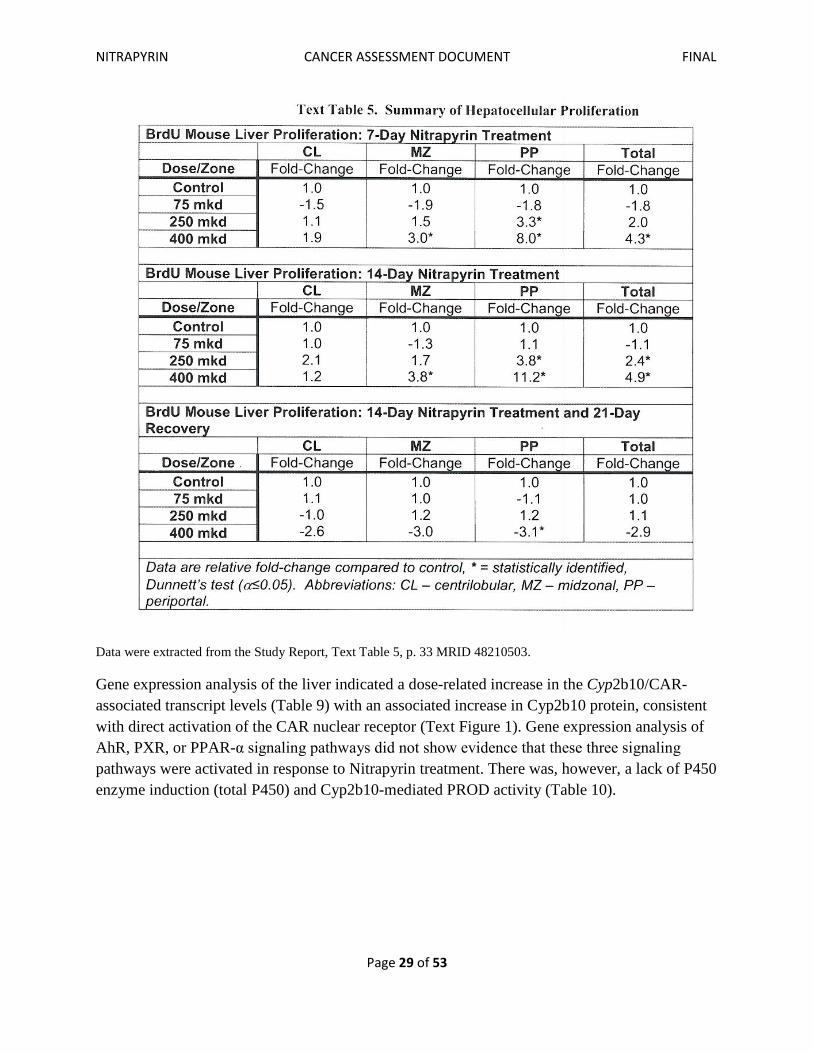
C. Mechanistic studies Several mechanistic studies were provided by the sponsor to address the issue of the mode of action (MOA) of the mouse liver tumors. For clarity, only the male mouse data are considered because the mechanistic studies were generally done only with male mice. However, since no sex specific effect has been identified, these deliberations apply equally to the females. Summaries of these studies are as follows: In a mechanistic study (MRID 48210503), Nitrapyrin Technical (98.6% pure; Lot No. not provided) was administered in the diet to male B6C3Fl/Crl mice (6/dose/time period, except high-dose animals in the 14-day treatment groups, which were 9/dose/time period) exposed to 0, 75, 250, or 400 mg nitrapyrin/kg body weight/day (mg/kg/day) for 7 or 14 days. A recovery group was given comparable doses of nitrapyrin for 14 days then switched to a control diet for 21 days to investigate recovery after treatment. The purpose of this study was to investigate the potential modes-of-action (MOAs) that may have contributed to nitrapyrin-induced liver tumor formation in a two-year carcinogenicity study in B6C3F1 mice at relatively high dose levels (250 mg/kg/day). Parameters evaluated were daily cage-side observations, body weights, feed consumption, clinical chemistry, liver weights, and histopathologic examinations. Additional studies with liver tissue investigated, gene expression of targeted genes, cell proliferation (BrdU uptake), activity of the specific liver enzymes, [total P450 content and pentoxyresorufin O-dealkylase (PROD)], and Western immunoblotting. No unscheduled deaths occurred in any group. There were no treatment-related effects on clinical signs, feed consumption or body weight in any of the treated groups. Statistically identified and treatment related changes in serum clinical chemistry included a 26% decrease in cholesterol after 7 days of treatment at 250 mg/kg/day and 42% decrease at 400 mg/kg/day. After 14 days, serum cholesterol was decreased 19% and 44% at 250 and 400 mg/kg/day, respectively. All clinical chemistry values were within normal limits after the recovery period. Treatment groups given 250 or 400 mg/kg/day nitrapyrin for 7 or 14 days had significant increases in absolute and relative liver weights (Study Report Tables 10-12) consistent with the histopathologic identification of centrilobular/midzonal hypertrophy (slight to moderate) with altered tinctorial properties of the cytoplasm (eosinophilia), and increased midzonal and periportal hepatocellular cell proliferation (Study Report Table 13). The analysis of hepatocellular proliferation via BrdU incorporation indicated a dose-(250 and 400 mg/kg), and duration-related induction of S-phase DNA synthesis (higher at 14 days vs. 7 days) (Study Text Table 5). Recovery group animals had no treatment-related liver weight increases (Study Report Table 12), histopathologic alterations (Study Report Table 13), or cell proliferation changes (Study Text Table 5).
NITRAPYRIN CANCER ASSESSMENT DOCUMENT FINAL
Page 27 of 53
NITRAPYRIN CANCER ASSESSMENT DOCUMENT FINAL
Page 28 of 53
Data are derived from Study Report, p 31, MRID 48210503
NITRAPYRIN CANCER ASSESSMENT DOCUMENT FINAL
Page 29 of 53
Data were extracted from the Study Report, Text Table 5, p. 33 MRID 48210503.
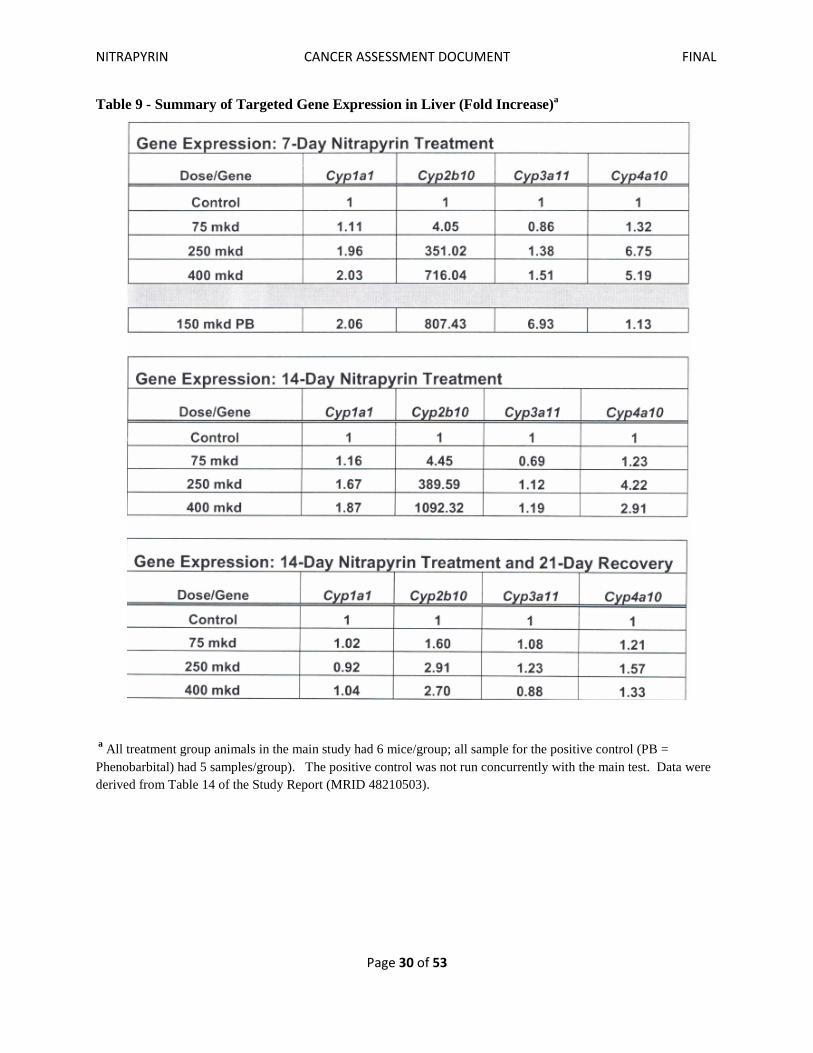
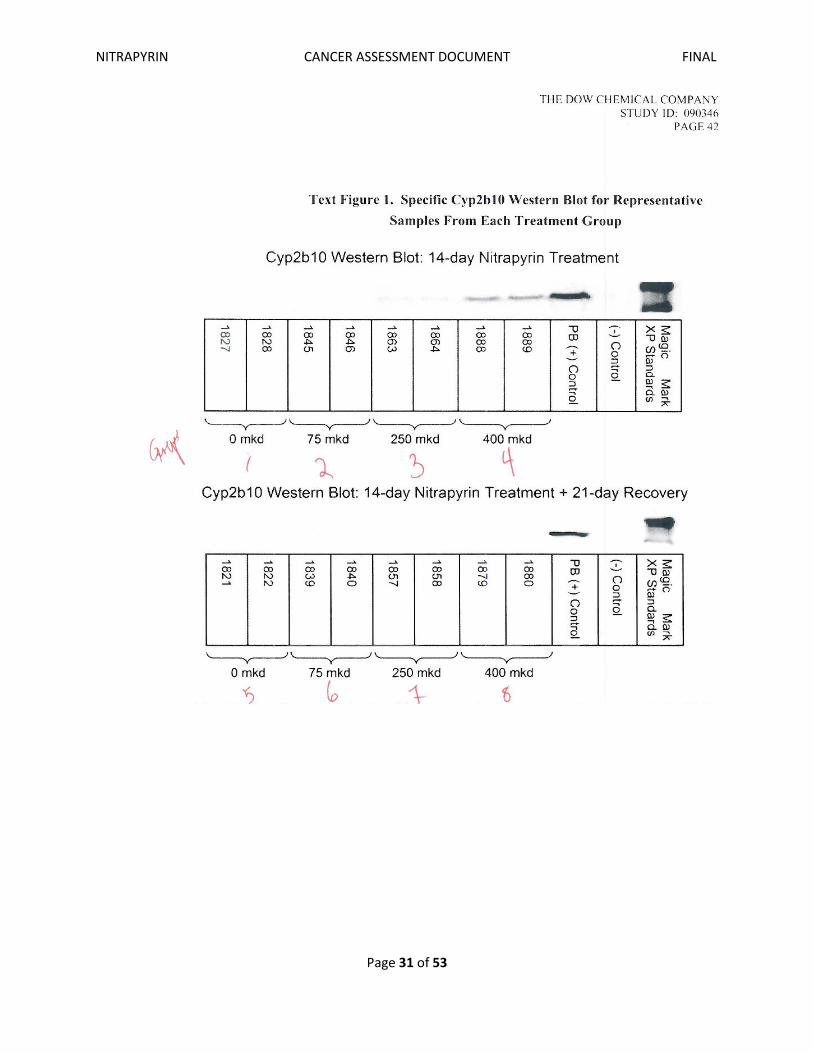
Gene expression analysis of the liver indicated a dose-related increase in the Cyp2b10/CAR-associated transcript levels (Table 9) with an associated increase in Cyp2b10 protein, consistent with direct activation of the CAR nuclear receptor (Text Figure 1). Gene expression analysis of AhR, PXR, or PPAR-α signaling pathways did not show evidence that these three signaling pathways were activated in response to Nitrapyrin treatment. There was, however, a lack of P450 enzyme induction (total P450) and Cyp2b10-mediated PROD activity (Table 10).
NITRAPYRIN CANCER ASSESSMENT DOCUMENT FINAL
Page 30 of 53
Table 9 - Summary of Targeted Gene Expression in Liver (Fold Increase)a
a All treatment group animals in the main study had 6 mice/group; all sample for the positive control (PB = Phenobarbital) had 5 samples/group). The positive control was not run concurrently with the main test. Data were derived from Table 14 of the Study Report (MRID 48210503).
NITRAPYRIN CANCER ASSESSMENT DOCUMENT FINAL
Page 31 of 53
NITRAPYRIN CANCER ASSESSMENT DOCUMENT FINAL
Page 32 of 53
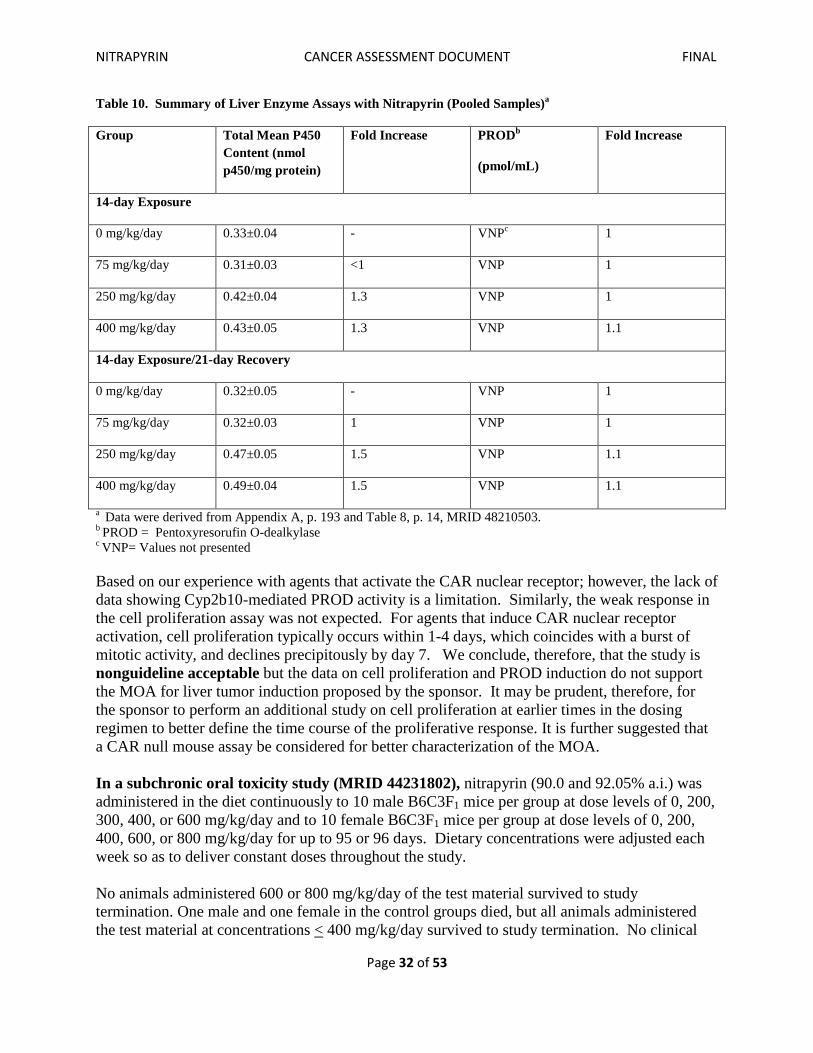
Table 10. Summary of Liver Enzyme Assays with Nitrapyrin (Pooled Samples)a
Group Total Mean P450 Content (nmol p450/mg protein)
Fold Increase PRODb
(pmol/mL)
Fold Increase
14-day Exposure
0 mg/kg/day 0.33±0.04 - VNPc 1
75 mg/kg/day 0.31±0.03 <1 VNP 1
250 mg/kg/day 0.42±0.04 1.3 VNP 1
400 mg/kg/day 0.43±0.05 1.3 VNP 1.1
14-day Exposure/21-day Recovery
0 mg/kg/day 0.32±0.05 - VNP 1
75 mg/kg/day 0.32±0.03 1 VNP 1
250 mg/kg/day 0.47±0.05 1.5 VNP 1.1
400 mg/kg/day 0.49±0.04 1.5 VNP 1.1
a Data were derived from Appendix A, p. 193 and Table 8, p. 14, MRID 48210503. b PROD = Pentoxyresorufin O-dealkylase c VNP= Values not presented Based on our experience with agents that activate the CAR nuclear receptor; however, the lack of data showing Cyp2b10-mediated PROD activity is a limitation. Similarly, the weak response in the cell proliferation assay was not expected. For agents that induce CAR nuclear receptor activation, cell proliferation typically occurs within 1-4 days, which coincides with a burst of mitotic activity, and declines precipitously by day 7. We conclude, therefore, that the study is nonguideline acceptable but the data on cell proliferation and PROD induction do not support the MOA for liver tumor induction proposed by the sponsor. It may be prudent, therefore, for the sponsor to perform an additional study on cell proliferation at earlier times in the dosing regimen to better define the time course of the proliferative response. It is further suggested that a CAR null mouse assay be considered for better characterization of the MOA. In a subchronic oral toxicity study (MRID 44231802), nitrapyrin (90.0 and 92.05% a.i.) was administered in the diet continuously to 10 male B6C3F1 mice per group at dose levels of 0, 200, 300, 400, or 600 mg/kg/day and to 10 female B6C3F1 mice per group at dose levels of 0, 200, 400, 600, or 800 mg/kg/day for up to 95 or 96 days. Dietary concentrations were adjusted each week so as to deliver constant doses throughout the study. No animals administered 600 or 800 mg/kg/day of the test material survived to study termination. One male and one female in the control groups died, but all animals administered the test material at concentrations < 400 mg/kg/day survived to study termination. No clinical
NITRAPYRIN CANCER ASSESSMENT DOCUMENT FINAL
Page 33 of 53
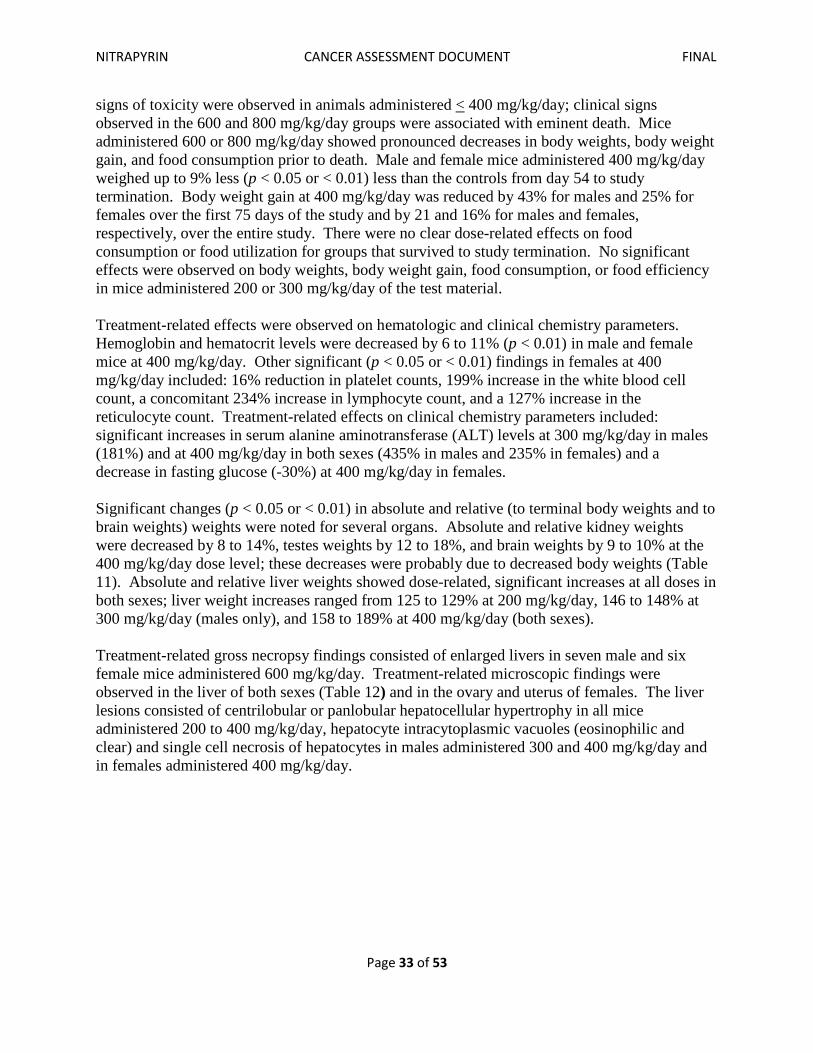
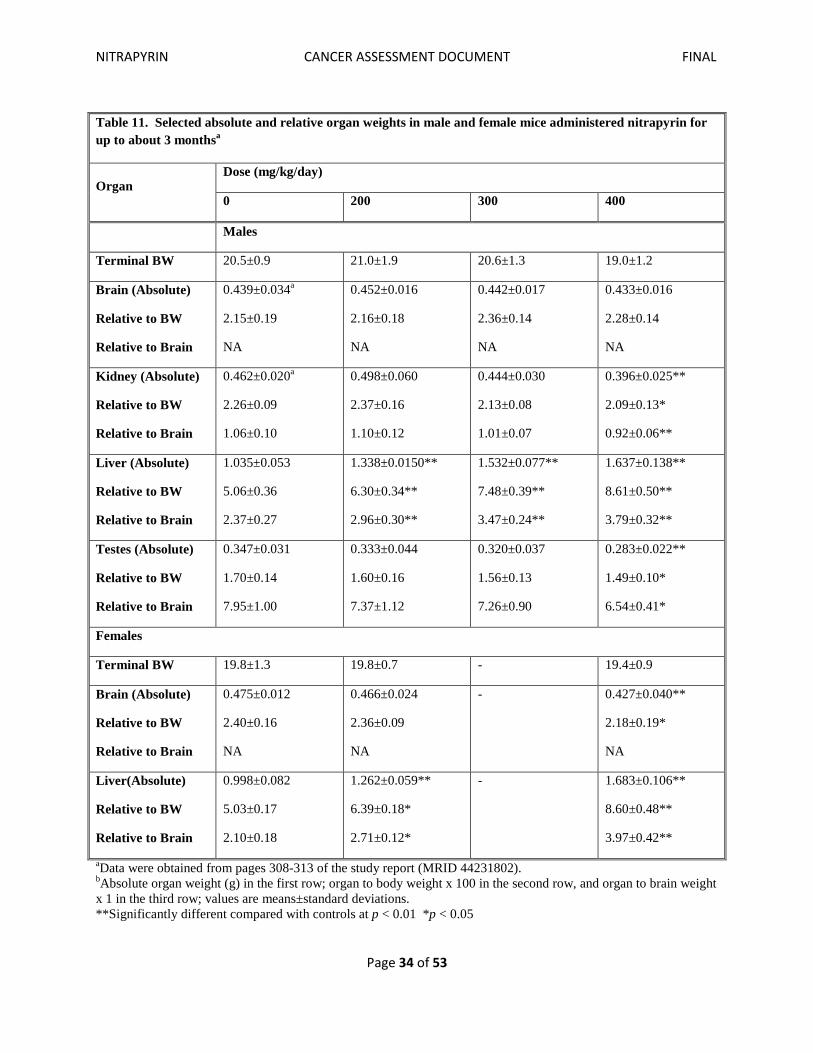
signs of toxicity were observed in animals administered < 400 mg/kg/day; clinical signs observed in the 600 and 800 mg/kg/day groups were associated with eminent death. Mice administered 600 or 800 mg/kg/day showed pronounced decreases in body weights, body weight gain, and food consumption prior to death. Male and female mice administered 400 mg/kg/day weighed up to 9% less (p < 0.05 or < 0.01) less than the controls from day 54 to study termination. Body weight gain at 400 mg/kg/day was reduced by 43% for males and 25% for females over the first 75 days of the study and by 21 and 16% for males and females, respectively, over the entire study. There were no clear dose-related effects on food consumption or food utilization for groups that survived to study termination. No significant effects were observed on body weights, body weight gain, food consumption, or food efficiency in mice administered 200 or 300 mg/kg/day of the test material. Treatment-related effects were observed on hematologic and clinical chemistry parameters. Hemoglobin and hematocrit levels were decreased by 6 to 11% (p < 0.01) in male and female mice at 400 mg/kg/day. Other significant (p < 0.05 or < 0.01) findings in females at 400 mg/kg/day included: 16% reduction in platelet counts, 199% increase in the white blood cell count, a concomitant 234% increase in lymphocyte count, and a 127% increase in the reticulocyte count. Treatment-related effects on clinical chemistry parameters included: significant increases in serum alanine aminotransferase (ALT) levels at 300 mg/kg/day in males (181%) and at 400 mg/kg/day in both sexes (435% in males and 235% in females) and a decrease in fasting glucose (-30%) at 400 mg/kg/day in females. Significant changes (p < 0.05 or < 0.01) in absolute and relative (to terminal body weights and to brain weights) weights were noted for several organs. Absolute and relative kidney weights were decreased by 8 to 14%, testes weights by 12 to 18%, and brain weights by 9 to 10% at the 400 mg/kg/day dose level; these decreases were probably due to decreased body weights (Table 11). Absolute and relative liver weights showed dose-related, significant increases at all doses in both sexes; liver weight increases ranged from 125 to 129% at 200 mg/kg/day, 146 to 148% at 300 mg/kg/day (males only), and 158 to 189% at 400 mg/kg/day (both sexes). Treatment-related gross necropsy findings consisted of enlarged livers in seven male and six female mice administered 600 mg/kg/day. Treatment-related microscopic findings were observed in the liver of both sexes (Table 12) and in the ovary and uterus of females. The liver lesions consisted of centrilobular or panlobular hepatocellular hypertrophy in all mice administered 200 to 400 mg/kg/day, hepatocyte intracytoplasmic vacuoles (eosinophilic and clear) and single cell necrosis of hepatocytes in males administered 300 and 400 mg/kg/day and in females administered 400 mg/kg/day.
NITRAPYRIN CANCER ASSESSMENT DOCUMENT FINAL
Page 34 of 53
Table 11. Selected absolute and relative organ weights in male and female mice administered nitrapyrin for up to about 3 monthsa
Organ Dose (mg/kg/day)
0 200 300 400
Males
Terminal BW 20.5±0.9 21.0±1.9 20.6±1.3 19.0±1.2
Brain (Absolute)
Relative to BW
Relative to Brain
0.439±0.034a
2.15±0.19
NA
0.452±0.016
2.16±0.18
NA
0.442±0.017
2.36±0.14
NA
0.433±0.016
2.28±0.14
NA
Kidney (Absolute)
Relative to BW
Relative to Brain
0.462±0.020a
2.26±0.09
1.06±0.10
0.498±0.060
2.37±0.16
1.10±0.12
0.444±0.030
2.13±0.08
1.01±0.07
0.396±0.025**
2.09±0.13*
0.92±0.06**
Liver (Absolute)
Relative to BW
Relative to Brain
1.035±0.053
5.06±0.36
2.37±0.27
1.338±0.0150**
6.30±0.34**
2.96±0.30**
1.532±0.077**
7.48±0.39**
3.47±0.24**
1.637±0.138**
8.61±0.50**
3.79±0.32**
Testes (Absolute)
Relative to BW
Relative to Brain
0.347±0.031
1.70±0.14
7.95±1.00
0.333±0.044
1.60±0.16
7.37±1.12
0.320±0.037
1.56±0.13
7.26±0.90
0.283±0.022**
1.49±0.10*
6.54±0.41*
Females
Terminal BW 19.8±1.3 19.8±0.7 - 19.4±0.9
Brain (Absolute)
Relative to BW
Relative to Brain
0.475±0.012
2.40±0.16
NA
0.466±0.024
2.36±0.09
NA
- 0.427±0.040**
2.18±0.19*
NA
Liver(Absolute)
Relative to BW
Relative to Brain
0.998±0.082
5.03±0.17
2.10±0.18
1.262±0.059**
6.39±0.18*
2.71±0.12*
- 1.683±0.106**
8.60±0.48**
3.97±0.42**
aData were obtained from pages 308-313 of the study report (MRID 44231802). bAbsolute organ weight (g) in the first row; organ to body weight x 100 in the second row, and organ to brain weight x 1 in the third row; values are means±standard deviations. **Significantly different compared with controls at p < 0.01 *p < 0.05
NITRAPYRIN CANCER ASSESSMENT DOCUMENT FINAL
Page 35 of 53
Table 12. Notable non-neoplastic lesions in male and female mice administered nitrapyrin for up to 3 monthsa
Lesions Dose (mg/kg/day)
0 200 300 400
Males
No. of animals examined 10 10 10 10
Liver
Hepatocellular hypertrophy (centrilobular to panlobular)
0 10(2.7)b 10(3.2) 10(4.0)
Hepatocytes: intracytoplasmic vacuoles (eosinophilic, centrilobular)
0 0 10(1.9) 10(2.4)
Hepatocellular cytoplasm: clear vacuoles
0 0 5(1.2) 6(1.7)
Hepatocytes: single cell necrosis
0 0 8(1.1) 10(2.2)
Kupffer cells: intracytoplasmic green or brown pigment
0 0 0 10(1.8)
Mixed inflammatory cell infiltrate
0 0 0 10(1.6)
Spleen
Extramedullary hematopoiesis 9(1.2) 10(1.2) 10(1.3) 10(2.2)
Females
No. of animals examined 10 10 - 10
Liver
Hepatocellular hypertrophy (centrilobular to panlobular)
0 10(2.5) - 10(4.0)
Hepatocytes: intracytoplasmic vacuoles (eosinophilic, centrilobular)
0 0 - 10(1.6)
Hepatocellular cytoplasm: clear vacuoles
0 0 - 9(1.4)
NITRAPYRIN CANCER ASSESSMENT DOCUMENT FINAL
Page 36 of 53
Table 12. Notable non-neoplastic lesions in male and female mice administered nitrapyrin for up to 3 monthsa
Hepatocytes: single cell necrosis
0 0 - 10(1.2)
Kupffer cells: intracytoplasmic green or brown pigment
0 0 - 10(1.3)
Mixed inflammatory cell infiltrate
0 0 - 7(1.0)
Spleen
Extramedullary hematopoeisis 10(1.9) 10(1.6) - 10(2.5)
Ovary
Hyperplasia/atrophy, unilateral and bilateral
0 0 - 10(2.9)
Uterus
Hyperplasia/atrophy 0 0 - 10(3.0)
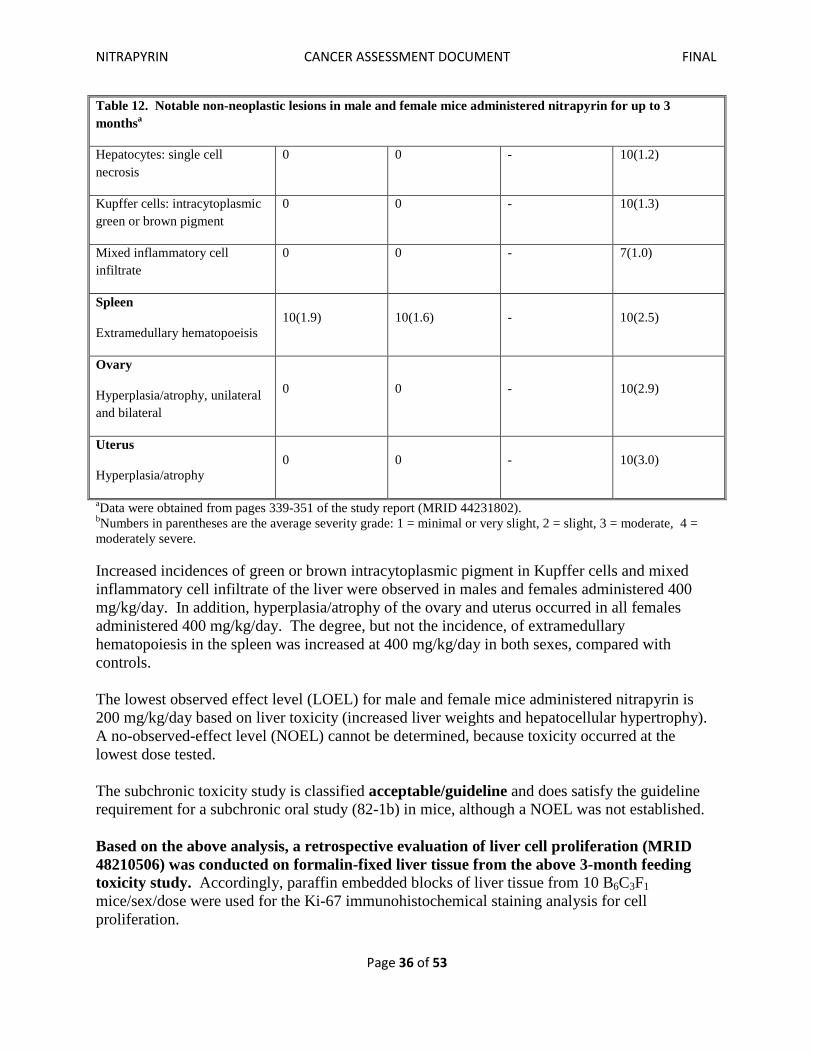
aData were obtained from pages 339-351 of the study report (MRID 44231802). bNumbers in parentheses are the average severity grade: 1 = minimal or very slight, 2 = slight, 3 = moderate, 4 = moderately severe. Increased incidences of green or brown intracytoplasmic pigment in Kupffer cells and mixed inflammatory cell infiltrate of the liver were observed in males and females administered 400 mg/kg/day. In addition, hyperplasia/atrophy of the ovary and uterus occurred in all females administered 400 mg/kg/day. The degree, but not the incidence, of extramedullary hematopoiesis in the spleen was increased at 400 mg/kg/day in both sexes, compared with controls. The lowest observed effect level (LOEL) for male and female mice administered nitrapyrin is 200 mg/kg/day based on liver toxicity (increased liver weights and hepatocellular hypertrophy). A no-observed-effect level (NOEL) cannot be determined, because toxicity occurred at the lowest dose tested. The subchronic toxicity study is classified acceptable/guideline and does satisfy the guideline requirement for a subchronic oral study (82-1b) in mice, although a NOEL was not established. Based on the above analysis, a retrospective evaluation of liver cell proliferation (MRID 48210506) was conducted on formalin-fixed liver tissue from the above 3-month feeding toxicity study. Accordingly, paraffin embedded blocks of liver tissue from 10 B6C3F1 mice/sex/dose were used for the Ki-67 immunohistochemical staining analysis for cell proliferation.
NITRAPYRIN CANCER ASSESSMENT DOCUMENT FINAL
Page 37 of 53
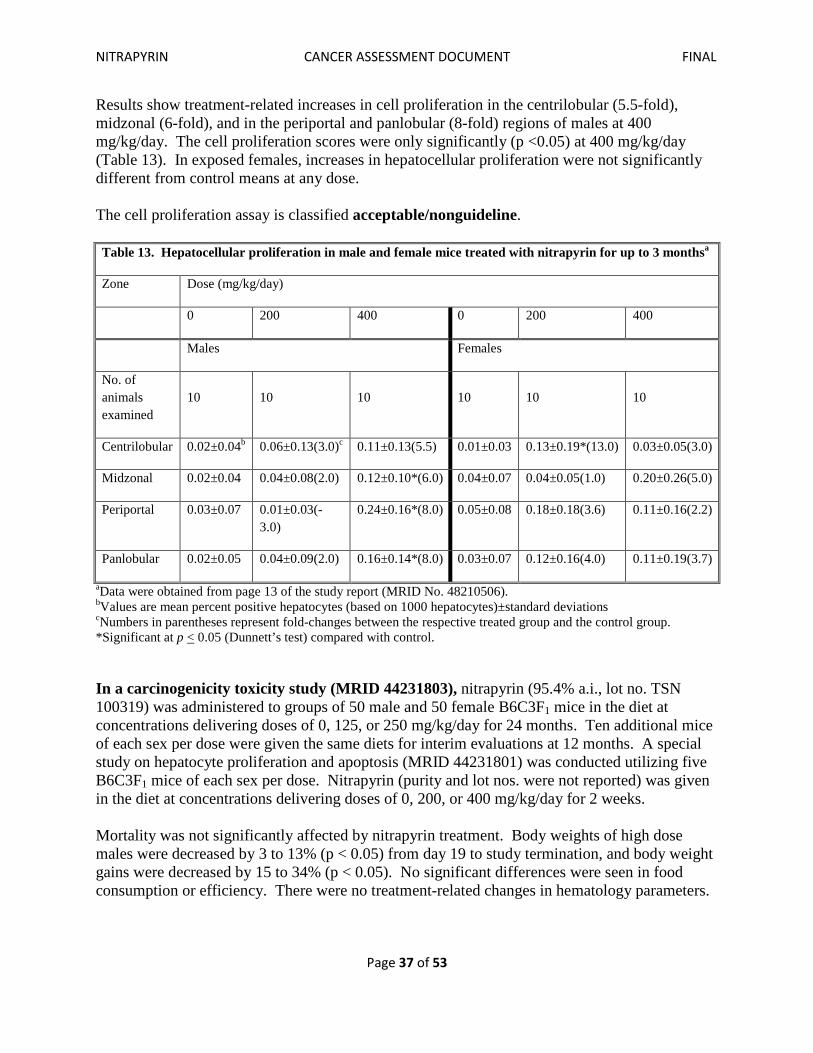
Results show treatment-related increases in cell proliferation in the centrilobular (5.5-fold), midzonal (6-fold), and in the periportal and panlobular (8-fold) regions of males at 400 mg/kg/day. The cell proliferation scores were only significantly (p <0.05) at 400 mg/kg/day (Table 13). In exposed females, increases in hepatocellular proliferation were not significantly different from control means at any dose. The cell proliferation assay is classified acceptable/nonguideline. Table 13. Hepatocellular proliferation in male and female mice treated with nitrapyrin for up to 3 monthsa
Zone Dose (mg/kg/day)
0 200 400 0 200 400
Males Females
No. of animals examined
10 10 10 10 10 10
Centrilobular 0.02±0.04b 0.06±0.13(3.0)c 0.11±0.13(5.5) 0.01±0.03 0.13±0.19*(13.0) 0.03±0.05(3.0)
Midzonal 0.02±0.04 0.04±0.08(2.0) 0.12±0.10*(6.0) 0.04±0.07 0.04±0.05(1.0) 0.20±0.26(5.0)
Periportal 0.03±0.07 0.01±0.03(-3.0)
0.24±0.16*(8.0) 0.05±0.08 0.18±0.18(3.6) 0.11±0.16(2.2)
Panlobular 0.02±0.05 0.04±0.09(2.0) 0.16±0.14*(8.0) 0.03±0.07 0.12±0.16(4.0) 0.11±0.19(3.7)
aData were obtained from page 13 of the study report (MRID No. 48210506). bValues are mean percent positive hepatocytes (based on 1000 hepatocytes)±standard deviations cNumbers in parentheses represent fold-changes between the respective treated group and the control group. *Significant at p < 0.05 (Dunnett’s test) compared with control.
In a carcinogenicity toxicity study (MRID 44231803), nitrapyrin (95.4% a.i., lot no. TSN 100319) was administered to groups of 50 male and 50 female B6C3F1 mice in the diet at concentrations delivering doses of 0, 125, or 250 mg/kg/day for 24 months. Ten additional mice of each sex per dose were given the same diets for interim evaluations at 12 months. A special study on hepatocyte proliferation and apoptosis (MRID 44231801) was conducted utilizing five B6C3F1 mice of each sex per dose. Nitrapyrin (purity and lot nos. were not reported) was given in the diet at concentrations delivering doses of 0, 200, or 400 mg/kg/day for 2 weeks. Mortality was not significantly affected by nitrapyrin treatment. Body weights of high dose males were decreased by 3 to 13% (p < 0.05) from day 19 to study termination, and body weight gains were decreased by 15 to 34% (p < 0.05). No significant differences were seen in food consumption or efficiency. There were no treatment-related changes in hematology parameters.
NITRAPYRIN CANCER ASSESSMENT DOCUMENT FINAL
Page 38 of 53
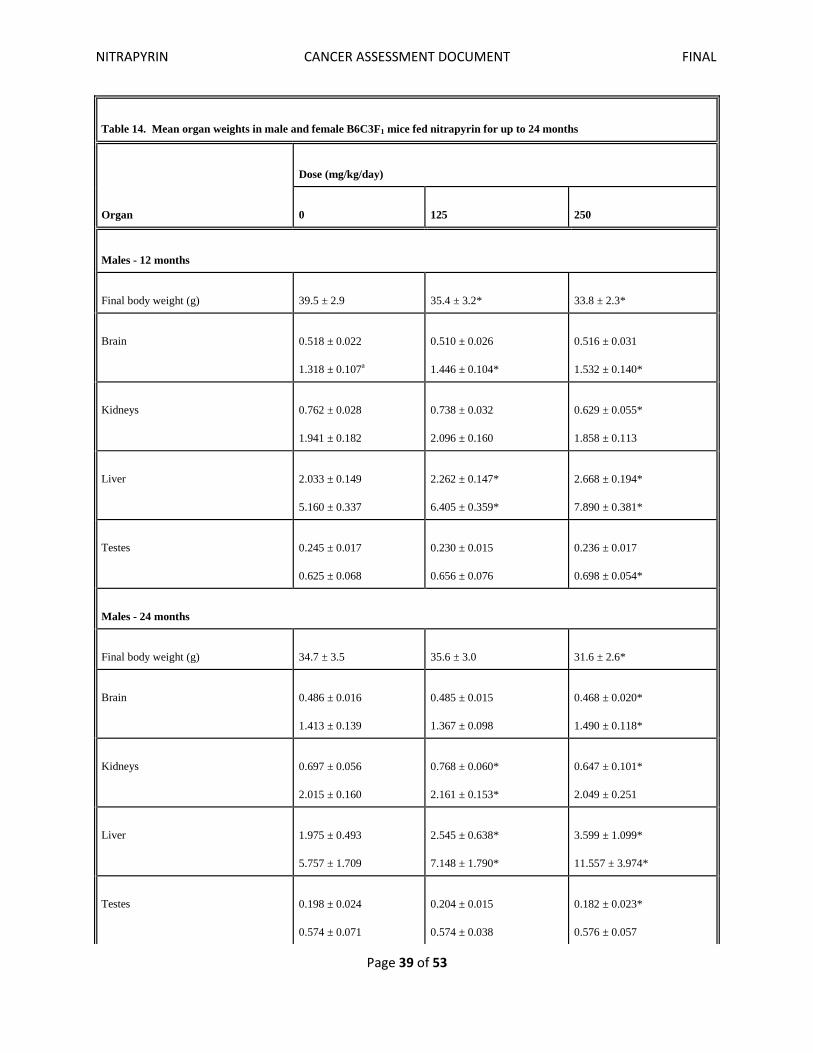
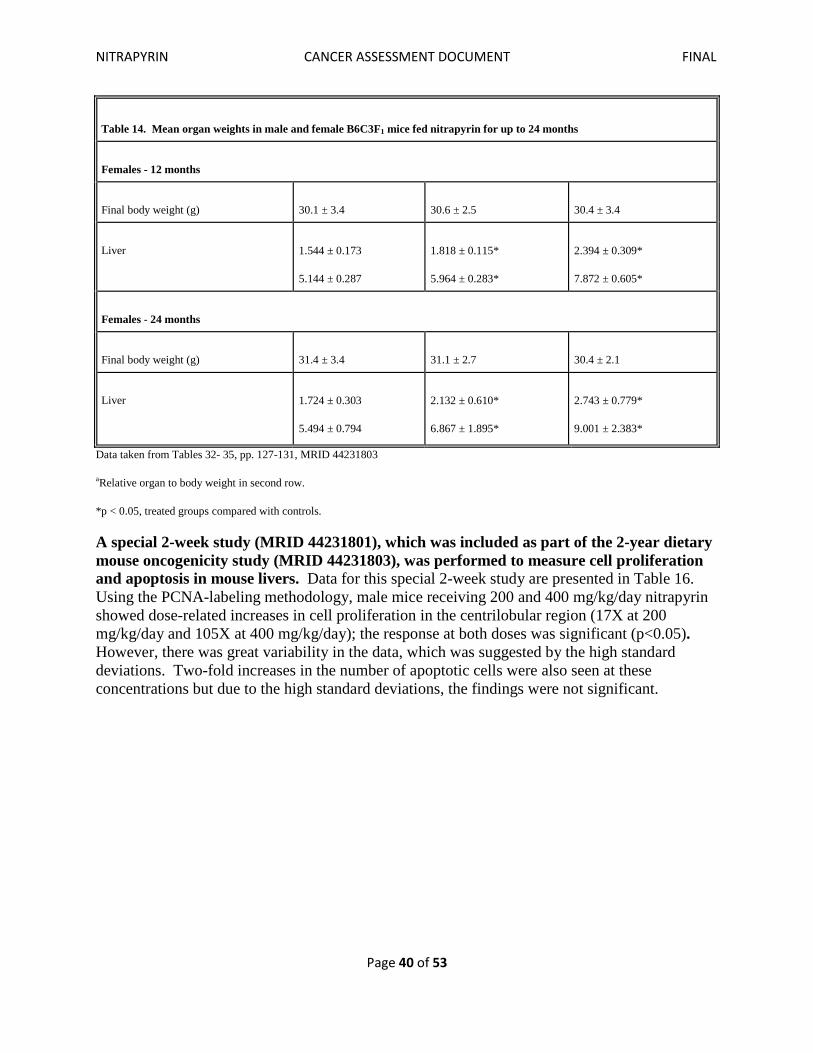
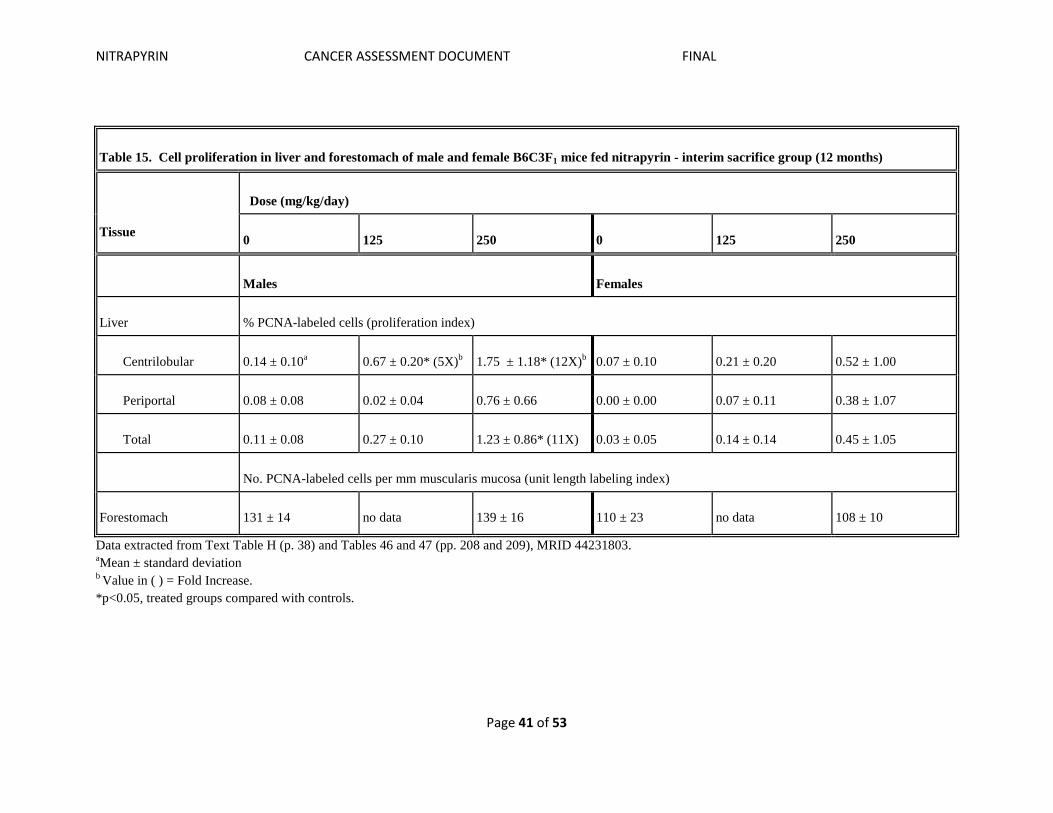
As shown in Table 14, treatment-related increases in absolute and relative (to body weight) liver weights were seen in both sexes at both dose levels after 12 and 24 months of treatment; liver weights ranged from 111 to 129% of control values (p < 0.05) at 125 mg/kg/day and 131 to 201% (p<0.05) of control value at 250 mg/kg/day. Increased incidences of pale or dark liver foci were seen in the liver of low- and high-dose group males and in high-dose group females after 24 months. Microscopic examination of the liver was presented earlier in Tables 7 and 8 and showed that centrilobular or panlobular hepatocyte hypertrophy occurred in all treated mice at 12 months of treatment at both doses. Centrilobular or panlobular hepatocyte hypertrophy was also seen in ≥92% of all treated groups compared with 0% in controls after 24 months of treatment. This is not expected for a mitogenic agent since mitogens generally have a transient effect on cell proliferation. By contrast, this is more consistent with cytotoxic agents that induce a sustained increase in cell proliferation to replace dead cells. The incidence of single-cell hepatocellular necrosis was increased after 24 months in treated males (96% at both doses vs 10% for controls, p < 0.05) and females (22 and 38%, respectively, vs 6% for controls, p < 0.05). At both doses, the incidence of mitotic figures increased 16 to 18% (P < 0.05) in males vs 0% in controls. Liver inflammation was observed in 88 to 90% (p < 0.05) of treated males compared to 10% in controls at 24 months. Other treatment-related liver effects included centrilobular multifocal pigment, cytoplasmic inclusions, and bile duct hyperplasia in high dose males; hepatocellular foci of altered cells and hepatocellular vacuolation in both sexes at the high dose. Hyperkeratosis and/or hyperplasia occurred in the stomach of 26 to 40% (p<0.05) of treated mice compared to 2-8% in controls. The duodenum was pale in ≥68% of both sexes of mice at both dose levels. Epithelial cell vacuolation and/or hyperplasia/hypertrophy was seen in the duodenum and jejunum of 54 to 96% (p < 0.05) of all treated males and in 11 to 78% (p<0.05) of all treated females compared with 0% in controls. Increased extramedullary hematopoiesis in the spleen was also observed in high-dose group males (38% vs 12% in controls, p < 0.05). After 12 months of treatment with nitrapyrin, liver cell proliferation in the centrilobular region was significantly increased (5X and 12X) in male mice at 125 and 250 mg/kg/day, respectively (Table 15). The increases seen in the centrilobular region of the liver of females and the periportal region of both sexes did not achieve statistical significance. The LOEL for this study is 125 mg/kg/day, based on lesions in the liver (hepatocellular hypertrophy and single-cell necrosis) and digestive tract (hyperkeratosis and hyperplasia of the nonglandular stomach and epithelial cell vacuolation and hyperplasia/hypertrophy of the duodenum and jejunum in both sexes). The NOEL was not determined. This carcinogenicity study in the mouse is acceptable (guideline) and does satisfy the requirements for a carcinogenicity study (83-2 b) in the mouse.
NITRAPYRIN CANCER ASSESSMENT DOCUMENT FINAL
Page 39 of 53
Table 14. Mean organ weights in male and female B6C3F1 mice fed nitrapyrin for up to 24 months
Organ
Dose (mg/kg/day)
0
125
250
Males - 12 months
Final body weight (g)
39.5 ± 2.9
35.4 ± 3.2*
33.8 ± 2.3*
Brain
0.518 ± 0.022
1.318 ± 0.107a
0.510 ± 0.026
1.446 ± 0.104*
0.516 ± 0.031
1.532 ± 0.140*
Kidneys
0.762 ± 0.028
1.941 ± 0.182
0.738 ± 0.032
2.096 ± 0.160
0.629 ± 0.055*
1.858 ± 0.113
Liver
2.033 ± 0.149
5.160 ± 0.337
2.262 ± 0.147*
6.405 ± 0.359*
2.668 ± 0.194*
7.890 ± 0.381*
Testes
0.245 ± 0.017
0.625 ± 0.068
0.230 ± 0.015
0.656 ± 0.076
0.236 ± 0.017
0.698 ± 0.054*
Males - 24 months
Final body weight (g)
34.7 ± 3.5
35.6 ± 3.0
31.6 ± 2.6*
Brain
0.486 ± 0.016
1.413 ± 0.139
0.485 ± 0.015
1.367 ± 0.098
0.468 ± 0.020*
1.490 ± 0.118*
Kidneys
0.697 ± 0.056
2.015 ± 0.160
0.768 ± 0.060*
2.161 ± 0.153*
0.647 ± 0.101*
2.049 ± 0.251
Liver
1.975 ± 0.493
5.757 ± 1.709
2.545 ± 0.638*
7.148 ± 1.790*
3.599 ± 1.099*
11.557 ± 3.974*
Testes
0.198 ± 0.024
0.574 ± 0.071
0.204 ± 0.015
0.574 ± 0.038
0.182 ± 0.023*
0.576 ± 0.057
NITRAPYRIN CANCER ASSESSMENT DOCUMENT FINAL
Page 40 of 53
Table 14. Mean organ weights in male and female B6C3F1 mice fed nitrapyrin for up to 24 months
Females - 12 months
Final body weight (g)
30.1 ± 3.4
30.6 ± 2.5
30.4 ± 3.4
Liver
1.544 ± 0.173
5.144 ± 0.287
1.818 ± 0.115*
5.964 ± 0.283*
2.394 ± 0.309*
7.872 ± 0.605*
Females - 24 months
Final body weight (g)
31.4 ± 3.4
31.1 ± 2.7
30.4 ± 2.1
Liver
1.724 ± 0.303
5.494 ± 0.794
2.132 ± 0.610*
6.867 ± 1.895*
2.743 ± 0.779*
9.001 ± 2.383*
Data taken from Tables 32- 35, pp. 127-131, MRID 44231803
aRelative organ to body weight in second row.
*p < 0.05, treated groups compared with controls.
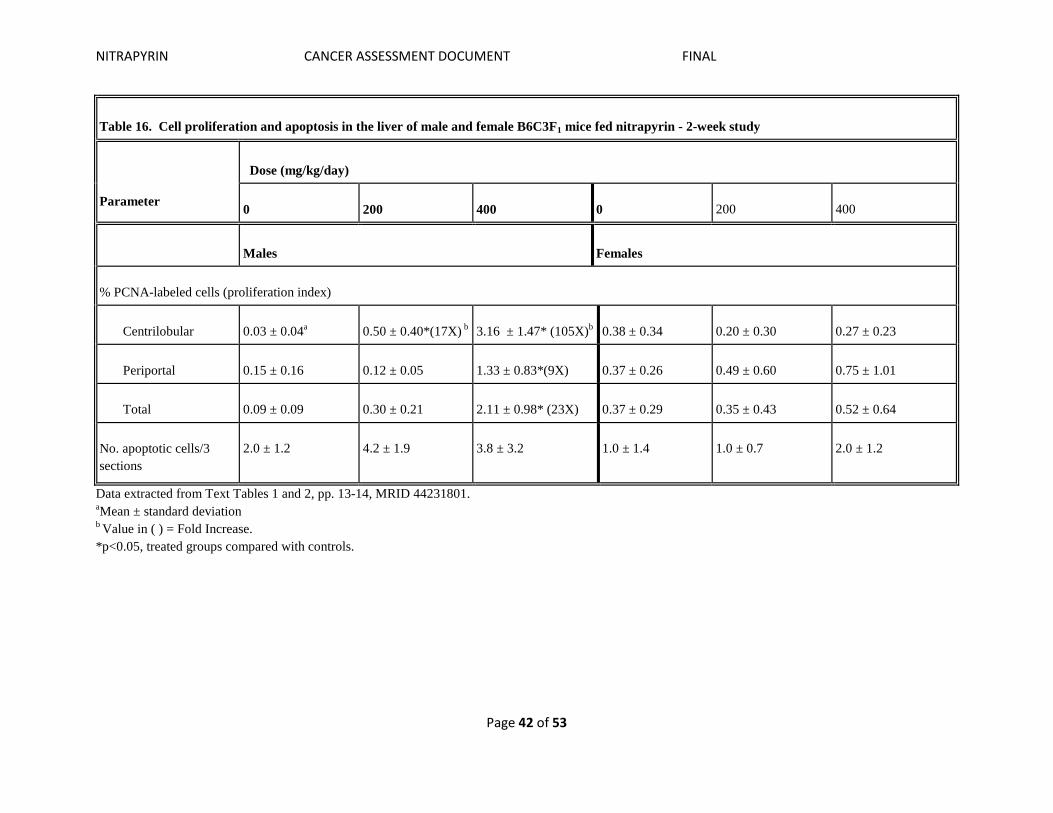
A special 2-week study (MRID 44231801), which was included as part of the 2-year dietary mouse oncogenicity study (MRID 44231803), was performed to measure cell proliferation and apoptosis in mouse livers. Data for this special 2-week study are presented in Table 16. Using the PCNA-labeling methodology, male mice receiving 200 and 400 mg/kg/day nitrapyrin showed dose-related increases in cell proliferation in the centrilobular region (17X at 200 mg/kg/day and 105X at 400 mg/kg/day); the response at both doses was significant (p<0.05). However, there was great variability in the data, which was suggested by the high standard deviations. Two-fold increases in the number of apoptotic cells were also seen at these concentrations but due to the high standard deviations, the findings were not significant.
NITRAPYRIN CANCER ASSESSMENT DOCUMENT FINAL
Page 41 of 53
Table 15. Cell proliferation in liver and forestomach of male and female B6C3F1 mice fed nitrapyrin - interim sacrifice group (12 months)
Tissue
Dose (mg/kg/day)
0
125
250
0
125
250
Males
Females
Liver
% PCNA-labeled cells (proliferation index)
Centrilobular
0.14 ± 0.10a
0.67 ± 0.20* (5X)b
1.75 ± 1.18* (12X)b
0.07 ± 0.10
0.21 ± 0.20
0.52 ± 1.00
Periportal
0.08 ± 0.08
0.02 ± 0.04
0.76 ± 0.66
0.00 ± 0.00
0.07 ± 0.11
0.38 ± 1.07
Total
0.11 ± 0.08
0.27 ± 0.10
1.23 ± 0.86* (11X)
0.03 ± 0.05
0.14 ± 0.14
0.45 ± 1.05
No. PCNA-labeled cells per mm muscularis mucosa (unit length labeling index)
Forestomach
131 ± 14
no data
139 ± 16
110 ± 23
no data
108 ± 10
Data extracted from Text Table H (p. 38) and Tables 46 and 47 (pp. 208 and 209), MRID 44231803. aMean ± standard deviation b Value in ( ) = Fold Increase. *p<0.05, treated groups compared with controls.
NITRAPYRIN CANCER ASSESSMENT DOCUMENT FINAL
Page 42 of 53
Table 16. Cell proliferation and apoptosis in the liver of male and female B6C3F1 mice fed nitrapyrin - 2-week study
Parameter
Dose (mg/kg/day)
0
200
400
0
200
400
Males
Females
% PCNA-labeled cells (proliferation index)
Centrilobular
0.03 ± 0.04a
0.50 ± 0.40*(17X) b
3.16 ± 1.47* (105X)b
0.38 ± 0.34
0.20 ± 0.30
0.27 ± 0.23
Periportal
0.15 ± 0.16
0.12 ± 0.05
1.33 ± 0.83*(9X)
0.37 ± 0.26
0.49 ± 0.60
0.75 ± 1.01
Total
0.09 ± 0.09
0.30 ± 0.21
2.11 ± 0.98* (23X)
0.37 ± 0.29
0.35 ± 0.43
0.52 ± 0.64
No. apoptotic cells/3 sections
2.0 ± 1.2
4.2 ± 1.9
3.8 ± 3.2
1.0 ± 1.4
1.0 ± 0.7
2.0 ± 1.2
Data extracted from Text Tables 1 and 2, pp. 13-14, MRID 44231801. aMean ± standard deviation b Value in ( ) = Fold Increase. *p<0.05, treated groups compared with controls.
NITRAPYRIN CANCER ASSESSMENT DOCUMENT FINAL
Page 43 of 53
V. APPLICATION OF THE CANCER GUIDELINES MODE OF ACTION (MOA) FRAMEWORK A. Postulated MOA and Key Events Based on the available information, the sponsor’s representatives postulated that the MOA for nitrapyrin-induced mouse liver tumors is “comparable to the MOA for phenobarbital-induced rodent liver tumors” (MRID 48210505). Hence, the MOA proposed by the registrant is mitogenesis through activation of the constitutive androstane receptor (CAR).
Key events for this MOA include the following: CAR Activation
Increased Cyp2b10 expression Increased PROD activity Increased Hypertrophy Increased Cell Proliferation Increased Liver Weight
Increased Basophilic Foci Liver Tumors
B. Support of Key Events/Causal Relationship Between Key Events and the Tumor Response/ Consistency of the Data 1. CAR Activation Summarized in Table 14 are the key event findings from three feeding studies of varying duration (7 days up to chronic exposure). Data supporting the key events along with an analysis of the causal relationships relative to dose and time and the coherence of these data are discussed in this section of the document. The proposed molecular initiating event (i.e., the initial point of chemical-biological interaction with the organism that initiates the adverse outcome pathway (AOP)] is CAR activation, and as shown in Table 9, there was a marked and dose-related overexpression of the Cyp2b10 gene at 1 and 2 weeks at the tumorigenic dose (250 mg/kg/day) showing 351-fold and 390-fold increase in expression at weeks 1 and 2, respectively. Western immunoblotting of the liver tissues confirmed clear dose-related induction of the gene product at 14 days as indicated by a heavy Cyp2b10 protein band at 400 mg/kg/day as well as presence of a less intense Cyp2b10 band at 250 mg/kg/day (Figure 1). Data presented in Table 10 show; however, that there was no evidence of P450 or PROD enzymatic activity at 250 or 400 mg/kg/day after 7 or 14 days of exposure to nitrapyrin. Despite the lack of agreement of these data, the results from the gene expression (Table 9) and Western blot analyses (Figure 1) showed little or no expression of the Cyp2b10 gene in the livers of mice treated for 14 days and allowed a 21-day recovery period. These findings clearly indicate the importance of Cyp2b10 induction in the cascade of events leading to tumor induction.
NITRAPYRIN CANCER ASSESSMENT DOCUMENT FINAL
Page 44 of 53
2. Increased hypertrophy The number of animals with liver hypertrophy (slight to moderate) was increased in 100% of the male mice after 2 weeks of treatment with the tumorigenic dose. This response persisted throughout the 12-week subchronic exposure and was still evident following 48 and 96 weeks of treatment with the tumorigenic and lower doses. Nevertheless, mice dosed with 250 or 400 mg/kg/day of nitrapyrin for 14 days and permitted a 21-day recovery period showed no evidence of liver hypertrophy (Table 14). 3. Increased cell proliferation A 2- and 4-fold increase in total cell proliferation was reported after 1 week of treatment with 250 or 400 mg/kg/day, respectively. Data from the 2-week the analysis of cell proliferation displayed conflicting results. In one study (MRID 48210503), fold increases were 2 and 5X greater than control at 250 and 400 mg/kg/day, respectively. By contrast, fold increases were 17 and 107X greater than control at 200 and 400 mg/kg/day, respectively in the 2-week cell proliferation assay (MRID 44231803/44231801). The lack of agreement of these data at comparable levels could be associated with the high variation in the data in the latter study. The response generally returned to background by week 3 (Table 17) and started to rise again by week 12 (8X at 400 mg/kg/day) and continued to climb to 12X at 250 mg/kg/day (12X) after 48 weeks. The overall effect was unexpected since mitogens that have been reviewed by CARC generally induce a typical burst of mitotic activity very early in the course of treatment (usually within the first 4 days) and quickly return to background levels. Regardless of these problematic data, the stop/recovery experiment showed no increase in cell proliferation at either the tumorigenic or higher doses.
NITRAPYRIN CANCER ASSESSMENT DOCUMENT FINAL
Page 45 of 53
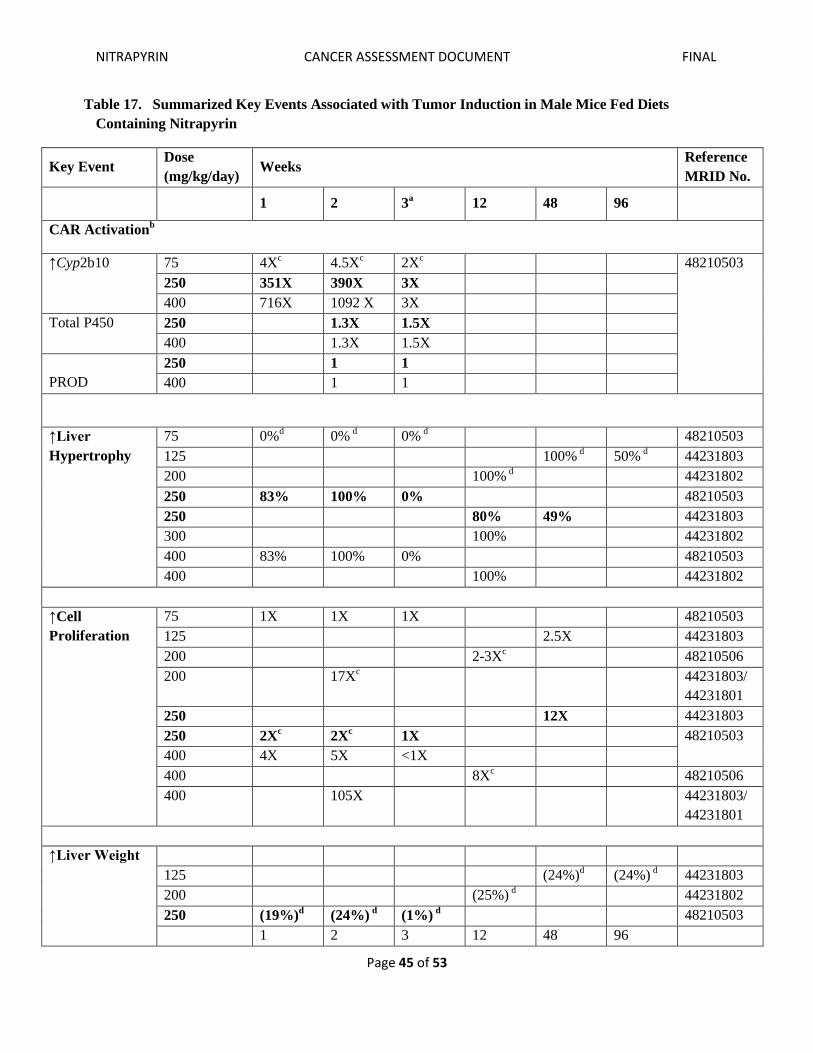
Table 17. Summarized Key Events Associated with Tumor Induction in Male Mice Fed Diets Containing Nitrapyrin
Key Event Dose (mg/kg/day) Weeks
Reference MRID No.
1 2 3a 12 48 96
CAR Activationb
↑Cyp2b10 75 4Xc 4.5Xc 2Xc 48210503 250 351X 390X 3X 400 716X 1092 X 3X
Total P450
250 1.3X 1.5X 400 1.3X 1.5X
PROD
250 1 1 400 1 1
↑Liver Hypertrophy
75 0%d 0% d 0% d 48210503 125 100% d 50% d 44231803 200 100% d 44231802 250 83% 100% 0% 48210503 250 80% 49% 44231803 300 100% 44231802 400 83% 100% 0% 48210503 400 100% 44231802
↑Cell Proliferation
75 1X 1X 1X 48210503 125 2.5X 44231803 200 2-3Xc 48210506 200 17Xc 44231803/
44231801 250 12X 44231803 250 2Xc 2Xc 1X 48210503 400 4X 5X <1X 400 8Xc 48210506 400 105X 44231803/
44231801 ↑Liver Weight
125 (24%)d (24%) d 44231803 200 (25%) d 44231802 250 (19%)d (24%) d (1%) d 48210503 1 2 3 12 48 96
NITRAPYRIN CANCER ASSESSMENT DOCUMENT FINAL
Page 46 of 53
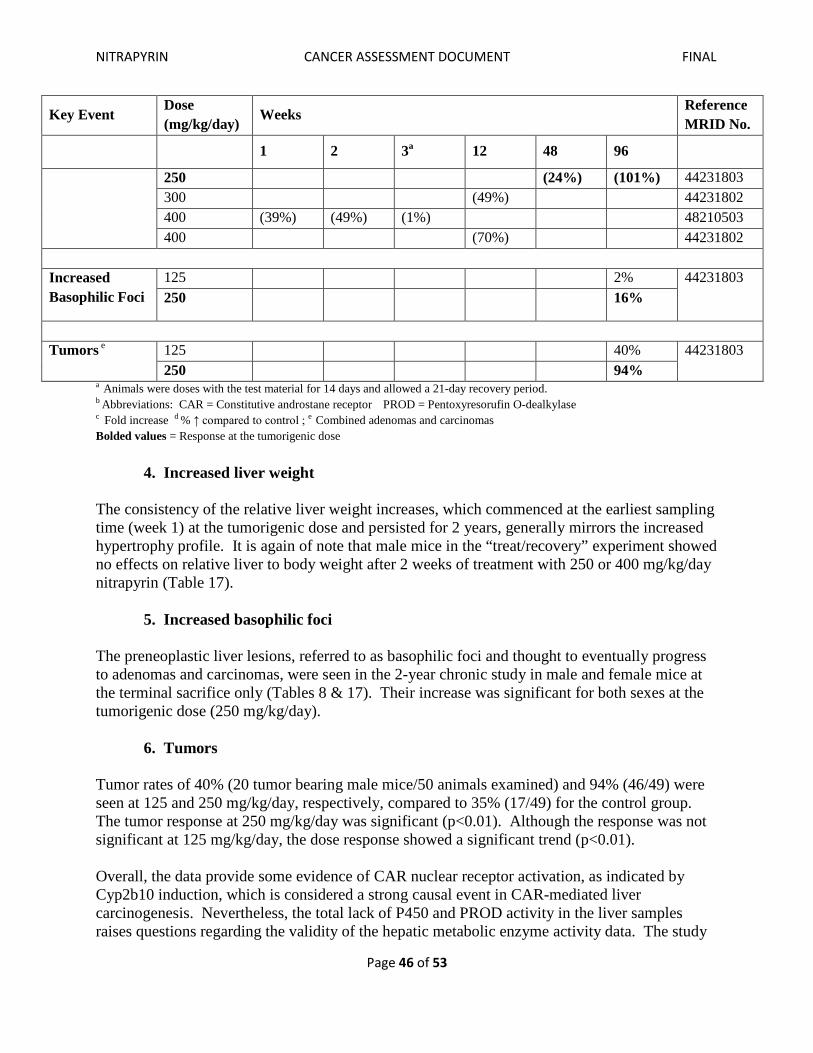
Key Event Dose (mg/kg/day) Weeks
Reference MRID No.
1 2 3a 12 48 96
250 (24%) (101%) 44231803 300 (49%) 44231802 400 (39%) (49%) (1%) 48210503 400 (70%) 44231802
Increased Basophilic Foci
125 2% 44231803 250 16%
Tumors e 125 40% 44231803
250 94% a Animals were doses with the test material for 14 days and allowed a 21-day recovery period. b Abbreviations: CAR = Constitutive androstane receptor PROD = Pentoxyresorufin O-dealkylase c Fold increase d % ↑ compared to control ; e Combined adenomas and carcinomas Bolded values = Response at the tumorigenic dose 4. Increased liver weight The consistency of the relative liver weight increases, which commenced at the earliest sampling time (week 1) at the tumorigenic dose and persisted for 2 years, generally mirrors the increased hypertrophy profile. It is again of note that male mice in the “treat/recovery” experiment showed no effects on relative liver to body weight after 2 weeks of treatment with 250 or 400 mg/kg/day nitrapyrin (Table 17). 5. Increased basophilic foci The preneoplastic liver lesions, referred to as basophilic foci and thought to eventually progress to adenomas and carcinomas, were seen in the 2-year chronic study in male and female mice at the terminal sacrifice only (Tables 8 & 17). Their increase was significant for both sexes at the tumorigenic dose (250 mg/kg/day). 6. Tumors Tumor rates of 40% (20 tumor bearing male mice/50 animals examined) and 94% (46/49) were seen at 125 and 250 mg/kg/day, respectively, compared to 35% (17/49) for the control group. The tumor response at 250 mg/kg/day was significant (p<0.01). Although the response was not significant at 125 mg/kg/day, the dose response showed a significant trend (p<0.01). Overall, the data provide some evidence of CAR nuclear receptor activation, as indicated by Cyp2b10 induction, which is considered a strong causal event in CAR-mediated liver carcinogenesis. Nevertheless, the total lack of P450 and PROD activity in the liver samples raises questions regarding the validity of the hepatic metabolic enzyme activity data. The study
NITRAPYRIN CANCER ASSESSMENT DOCUMENT FINAL
Page 47 of 53
authors of the MOA and human relevance report (MRID 48210505) speculated that inhibition of cytochrome activity may have occurred “as a result of substrate competition, metabolic intermediate complexation, or mechanism-based (suicide) inhibition” and cited several references to support this claim. However, no data were provided to adequately address this possibility. Based on the experience of EPA scientists with P450 and PROD induction, the lack of this enzymatic activity may have resulted from technical problems associated with refreezing the liver samples. Similarly, the lack of agreement of the cell proliferation data, relative to time and dose and the dissimilar performance of the response compared to the typical CAR activation profile are of concern. Nevertheless, there is convincing evidence of the reversibility of the key events, which strongly suggests that a threshold exists for the nitrapyrin-induced liver tumors. C. Alternative MOAs Several well-known MOAs are recognized for liver tumorigenesis. These include: DNA reactivity, cytotoxicity with regenerative cell proliferation, and mitogenesis induced by other nuclear receptors. 1. DNA reactivity As stated earlier, mutagenicity has been ruled out as a likely MOA for the liver tumors induced by nitrapyrin (see Section 11.A). 2. Cytotoxicity with regenerative cell proliferation At the CARC meeting held on February 9, 2005, it was concluded that the data, which were submitted by the sponsor to support an MOA for the liver tumors, were insufficient to accept a cytotoxic MOA. Deficiencies were the lack of temporal data and a reversibility study in mice (see Section I.C.5). From this more recent MOA analysis, a case could be made for cytotoxicity; however, the necropsy data showed no clear indication of hyperplasia or necrosis. 3. Mitogenesis induced by other nuclear receptors Apart from CAR receptor mediated tumorigenesis, there are several other nuclear receptor liver tumor induction MOAs; these include: activation of the pregnane X receptor (PXR), the aryl hydrocarbon receptor (AhR), and the peroxisome proliferator receptor (PPAR-α). As shown in Table 9, genes associated with PXR (Cyp3a11) or AhR (Cyp1a1) were either slightly over-expressed (2X at 250 and 400 mg/kg/day, 7 days for Cyp1a1) or not expressed (Cyp3a11). However, non-dose-related increases in Cyp4a10 were recorded at 7 days (7X and 5X at 250 and 400 mg/kg/day, respectively), which were weaker but still apparent through day 14 (4X and 3X at 250 and 400 mg/kg/day, respectively). These data suggest a weak activation of PPAR-α but the effect was not dose related and should be considered in the context of the powerful response induced by nitrapyrin in Cyp2b10 (351-1092-fold); hence, this effect could be residual or non- specific as suggested by the investigators. Additionally, there were no peroxisome data. Based on these considerations, it is concluded that these receptor-activated MOAs are not plausible alternatives.
NITRAPYRIN CANCER ASSESSMENT DOCUMENT FINAL
Page 48 of 53
D. Uncertainties As indicated several times throughout this document, the absence of hepatic metabolic enzyme activity leaves a major uncertainty in the MOA analysis that has not been fully resolved by the investigators. Although the investigators offered several possible explanations for the lack of a response, no data were presented to support their position. The other major uncertainty in the MOA data for nitrapyrin is the poor performance of cell proliferation. These data do not show the typical response that CARC expects at the tumorigenic dose when a CAR MOA is operable. It has been the experience of the CARC that for agents inducing CAR nuclear receptor activation, the burst of mitotic activity occurs within 1-4 days, and declines precipitously by day 7. It may, therefore, be reasonable to assume that the window of pronounce mitotic activity may have been missed since the earliest time for the collection of cell proliferation data was 7 days. Nevertheless, the data from the mechanistic study provided by the sponsor indicates that increased cell proliferation generally persisted throughout 48 weeks.
VI. COMMITTEE’S ASSESSMENT OF THE WEIGHT-OF-THE-EVIDENCE On December 13, 2011, CARC reconvened to evaluate the submissions, which included the following: 1) An overview of the mouse carcinogenicity studies; 2) Evaluation of the genetic toxicity of nitrapyrin; 3) Report of the Pathology Working Group (PWG); and 4) Additional data on the mouse liver tumor mode of action (MOA). The CARC reviewed the referenced documents and drew the following conclusions:
• Mutagenicity: In accordance with the U.S. EPA’s Framework for Determining a
Mutagenic Mode of Action and Supplemental Guidance for Assessing Susceptibility from Early-Life Exposure to Carcinogens (U.S. 2007), the CARC concluded that in the absence of a mutagenic effect in at least two in vivo mutagenicity studies, there is no concern for a mutagenic mode of action.
• Epididymal tumors in mouse testes: Following the current nomenclature, the PWG re-examined the undifferentiated sarcomas of the epididymides observed in the two mouse carcinogenicity studies. The PWG classified the lesions more accurately as histiocytic sarcomas. Based on the reported findings, the CARC concluded that these lesions were incidental and not attributable to nitrapyrin.
• Mouse liver tumors: The mouse liver tumors, driven mainly by adenomas, are considered to be treatment-related in both sexes. The incidence rates are listed below:
o Males: 24, 38 and 94% (adenomas), 14, 6 and 24% (carcinomas) and 17, 20
and 46% (combined adenomas and carcinomas) in males for 0, 125 and 250 mg/kg/day, respectively. There was a pair-wise significance for adenomas, carcinomas and combined adenomas and carcinomas at 250 mg/kg/day and a significant increasing trend for adenomas and combined adenomas and carcinomas, all at p<0.01.
NITRAPYRIN CANCER ASSESSMENT DOCUMENT FINAL
Page 49 of 53
o Females: 13, 56 and 67% (adenomas), 14, 2 and 4% (carcinomas) and 13, 58
and 69% (combined adenomas and carcinomas) in females for 0, 125 and 250 mg/kg/day, respectively. There was a pair-wise significance for adenomas and combined adenomas and carcinomas at 125 and 250 mg/kg/day and a significant increasing trend for adenomas and combined adenomas and carcinomas, all at p<0.01.
• Mode of action (MOA) for mouse liver tumors: To address this issue, Dow submitted additional data on the mode of action (MOA) for these tumors. The sponsor’s representative postulated that the MOA for the nitrapyrin-induced mouse liver tumors is mitogenesis through activation of the constitutive androstane receptor (CAR) nuclear receptor. Key events for this MOA are included in the list below:
CAR Activation Increased Cyp2b10 expression Increased pentoxyresorufin O-dealkylase (PROD) activity Increased hypertrophy Increased cell proliferation Increased liver weight
Increased basophilic foci Liver tumors
The CARC concluded from the review of the MOA data that, while there was some evidence of CAR activation, this finding was not supported by key data on P450 and specific enzyme induction (PROD). Similarly, the cell proliferation data did not show the typical profile (i.e., initial burst of mitotic activity very early in course of treatment, usually within the first 4 days, and a rapid return to background levels), which CARC expects with a CAR inducer. It was concluded, therefore, that the available data did not adequately support a CAR MOA. Despite these limitations associated with the key events, there is convincing evidence from the stop and recovery experiment that the effects were reversed when treatment ceased.
NITRAPYRIN CANCER ASSESSMENT DOCUMENT FINAL
Page 50 of 53
VII. CLASSIFICATION OF CARCINOGENIC POTENTIAL
In accordance with the EPA's Final Guidelines for Carcinogen Risk Assessment (March, 2005), the CARC re-classified Nitrapyrin as “Suggestive Evidence of Carcinogenic Potential”. The rationale for this decision is as follows:
• There was no evidence of carcinogenicity in male or female rats.
• The undifferentiated epididymal sarcomas in male mice have been reclassified as histiocytic sarcomas and shown to be not treatment related.
• Liver tumors, which were seen in both sexes of mice, were attributable mainly to adenomas (i.e., no progression to malignancy) and the tumors occurred late in the course of treatment (i.e., no reduction in survival).
• Data are not sufficient to support the proposed MOA for liver tumors.
• There was no evidence for a mutagenic mode of action for the liver tumors.
VIII. QUANTIFICATION OF CARCINOGENIC POTENTIAL
The evidence from the nitrapyrin animal data is suggestive of carcinogenicity, which raises a concern for carcinogenic effects, but is judged not sufficient for quantification of cancer risk in humans. Also, when there is suggestive evidence, the Agency does not attempt a dose-response assessment as the nature of the data generally would not support one.
The NOAEL of 3.0 mg/kg/day used for deriving the chronic RfD (0.03 mg/kg/day) is approximately 83-fold lower than the lowest dose (250 mg/kg/day) that induced benign liver tumors in mice. Consequently, the chronic RfD will adequately account for all chronic effects, including carcinogenicity, likely to result from exposure to nitrapyrin.
IX. BIBLOGRAPHY MRID No. Title 47459801 Mecchi, M.S. (2007) Salmonella-Escherichia coli/mammalian-microsome
reverse mutation assay preincubation method with a confirmatory assay with nitrapyrin TGAI. Covance Laboratories Inc., 9200 Leesburg Pike, Vienna, Virginia 22182-1699. Dow study no. 061171, March 30, 2007. MRID 47459801. Unpublished.
47459802. Mecchi, M.S. (2007) Salmonella-Escherichia coli/mammalian-microsome
reverse mutation assay preincubation method with a confirmatory assay with nitrapyrin TGAI. Covance Laboratories Inc., 9200 Leesburg Pike, Vienna,
NITRAPYRIN CANCER ASSESSMENT DOCUMENT FINAL
Page 51 of 53
Virginia 22182-1699. Study no. 061171. SPT, March 30, 2007. MRID 47459802. Unpublished.
48210501 Hardisty, J. F. (2010). Pathology working group (PWG) review of epididymal
tumors from two-year dietary oncogenicity studies with nitrapyrin in B6C3F1 mice. Environmental Pathology Laboratories, Inc. Research Triangle Park, NC. Study no. 631-003, January 15, 2010.
48210504 Zeiger, E. (2010). Evaluation of the genetic toxicity of nitrapyrin. Report of
Errol Zeiger Consulting, Chapel Hill NC, July 2010. 48210505 Eisenbrant, D.L., LeBaron, M. J., Gollapudi, B.B. (2010). Mode of action and
human relevance framework for nitrapyrin-induced mouse liver tumors. Toxicology and Environmental Research, The Dow Chemical Co., Study No. DEL082510, July 20, 2010.
48210507 Eisenbrant, D.L., LeBaron, M. J., Gollapudi, B.B., Lamb, J.C. (2010). Overview
of the carcinogenicity of nitrapyrin in rodents and human relevance. Toxicology and Environmental Research, The Dow Chemical Co., Study No. DEL082510, August 25, 2010.
47459801 Mecchi, M.S. (2007). Salmonella-Escherichia coli/mammalian microsome
reverse mutation assay Preincubation method with a confirmatory assay with nitrapyrin TGAI. Covance Laboratories, Inc., Vienna VA, Study No. 061171, March 30, 2007.
48210502 Pant, K. and Celestin, N. (2009). Nitrapyrin technical grade active ingredient:
Unscheduled DNA synthesis (UDS) test with mouse liver cells in vivo. BioReliance, 9630 Medical Center Drive, Rockville, MD 20850. Study No. ACI8VV.383.BTL, January 23, 2009.
44231801 Yano, B and McFadden, L. (1996). Nitrapyrin (n-Serve* Nitrogen Stabilized):
Quantitation of hepatocyte proliferation and apoptosis in a 2-week dietary study in B6C3F1 mice –a retrospective study. Dow Chemical Co., Toxicology Research Laboratory, Midland MI, Study No. K-031304-038, June 24, 1996.
44231802 Daly, I. W. (1995). A subchronic (3-month) oral toxicity study of nitrapyrin in
the mouse via dietary administration. Pharmaco LSR, Inc. Toxicology Services North America, Mettlers, NJ. Study No. 93-2278, May 25, 1995.
44231803 Stebbins, K and Cosse, P. (1997). Nitrapyrin (n-Serve* Nitrogen Stabilized):
two-year oncogenicity study in B6C3F1 mice. Dow Chemical Co., Toxicology Research Laboratory, Midland MI, Study No. K-031304-036, February 27, 1997.
48210503 LeBaron, M., Schisler, M., Kan, H., Thomas, J. (2010). Nitrapyrin technical:
Analysis of molecular, cellular, and biochemical changes in the livers of male
NITRAPYRIN CANCER ASSESSMENT DOCUMENT FINAL
Page 52 of 53
B6C3F1/CRL mice treated with nitrapyrin after 1- or 2-week treatment and a 3-week recovery. Dow AgroSciences LLC, Indianapolis, Indiana. Laboratory Study No: 090346, May 17, 2010, Revised July 23, 2010. MRID 48210503.
48210506 LeBaron, M.J. (2010). Cell proliferation analysis of liver from a subchronic (3-
month) oral toxicity study in B6C3F1 mice- a retrospective study. Toxicology and Environmental Research and Consulting, The Dow Chemical Co., Study No. 080427, July 23, 2010.
41651601 Quast, JF, Cosse, PF, Corley, RA (1990). Nitrapyrin (n-Serve* Nitrogen
Stabilized): two-year oncogenicity study in B6C3F1 mice. Dow Chemical Co., Midland MI, Study No. K-031304-027.
Brunsman L. (2000). Memorandum from Lori Brunsman, Statistician, Nitrapyrin (N-Serve™)
Quantitative Risk Assessment (Q1*) Based on B6C3F1 Mouse Dietary Study with ¾’s Interspecies Scaling Factor, Dated March 9, 2000. HED Document No. 014035. TXR No. 0014035.
CPRC (1992). Carcinogenicity Peer Review of Nitrapyrin. PC Code 069203. HED Document
No. 009760, September 14, 1992. CARC (2000). Evaluation of the Carcinogenic Potential of Nitrapyrin. PC Code 069203, HED
Document No. 014131, May 5, 2000. CARC (2005). Nitrapyrin: Report of the Cancer Assessment Review Committee. PC Code
069203, Document No. TXR 0053329, March 26, 2005. Doherty, J (2004). Nitrapyrin: Report of the Hazard Identification Assessment Review
Committee. Document No. TXR No. 0052387, March 13, 2004. Lake. BG (2009). Species differences in the hepatic effects of inducers of CYP2B and CYP4A
subfamily forms: Relationship to rodent liver tumors formation. Xenobiotica 39:582-596. Pletcher, J (2011a). Memorandum from John M. Pletcher, Pathologist, Charles River
Laboratories to Jess Rowland, Chairperson, CARC, Review of the Report Entitled “Pathology Working Group (PWG) Review of Epididymal Tumors from Two Year Dietary Oncogenicity Studies with Nitrapyrin in B6C3F1 Mice”, dated August 31, 2011. TXR No. 0056263.
Pletcher, J (2011b). Memorandum from John M. Pletcher, Pathologist, Charles River
Laboratories to Nancy McCarroll, Toxicologist, Epididymal Tumors in Male Mice Treated with Nitrapyrin, dated October 11, 2011.
Pletcher, J (2011c). Memorandum from John M. Pletcher, Pathologist, Charles River
Laboratories to Nancy McCarroll, Toxicologist, Epididymal Tumors in Male Mice Treated with Nitrapyrin, dated October 12, 2011.
NITRAPYRIN CANCER ASSESSMENT DOCUMENT FINAL
Page 53 of 53
Pletcher, J (2011d). Memorandum from John M. Pletcher, Pathologist, Charles River
Laboratories to John Doherty, Toxicologist, Request for the CARC Consulting Pathologist Evaluation of Revised/Additional Data for the Mouse Carcinogenicity Study, dated July 26, 2011.
U.S. EPA 2007. Framework for Determining a Mutagenic Mode of Action and Supplemental
Guidance for Assessing Susceptibility from Early-Life Exposure to Carcinogens EPA 120/R-07/002-A. External Peer Review Draft, September 2007.


![CHEMICALS KNOWN TO THE STATE [California] - OEHHA](https://img.pdfslide.us/doc/110x75/620381feda24ad121e4a3abf/chemicals-known-to-the-state-california-oehha.jpg)