Embed Size (px)
Citation preview
© OECD/IEA 2010
© OECD/IEA 2010
© OECD/IEA 2010
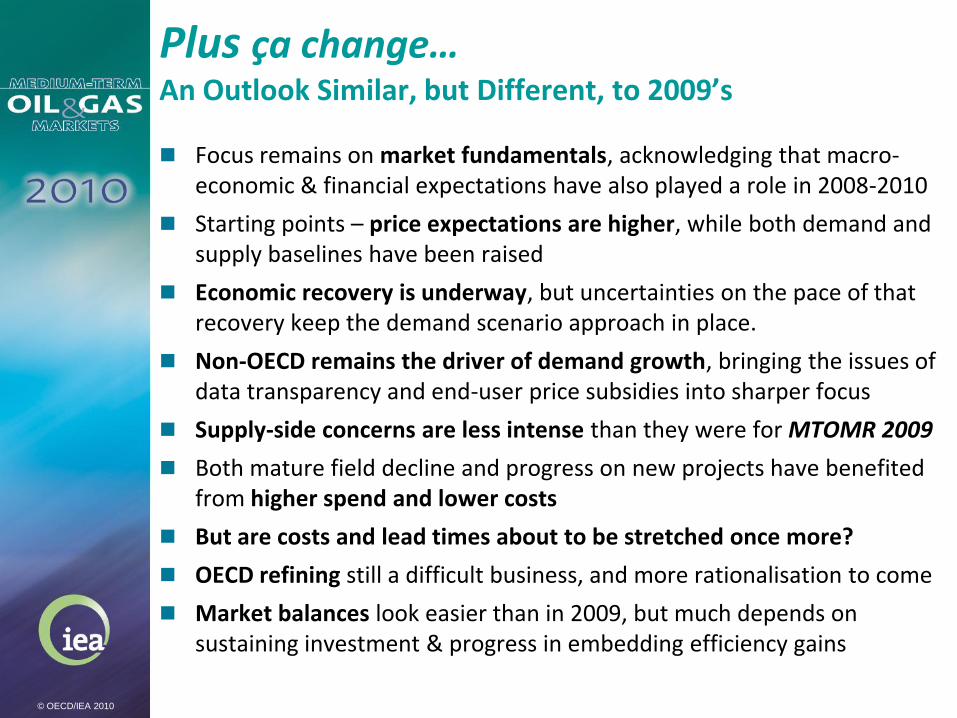
Plus ça change…An Outlook Similar, but Different, to 2009’s
Focus remains on market fundamentals, acknowledging that macro-economic & financial expectations have also played a role in 2008-2010
Starting points – price expectations are higher, while both demand and supply baselines have been raised
Economic recovery is underway, but uncertainties on the pace of that recovery keep the demand scenario approach in place.
Non-OECD remains the driver of demand growth, bringing the issues of data transparency and end-user price subsidies into sharper focus
Supply-side concerns are less intense than they were for MTOMR 2009
Both mature field decline and progress on new projects have benefited from higher spend and lower costs
But are costs and lead times about to be stretched once more?
OECD refining still a difficult business, and more rationalisation to come
Market balances look easier than in 2009, but much depends on sustaining investment & progress in embedding efficiency gains
© OECD/IEA 2010
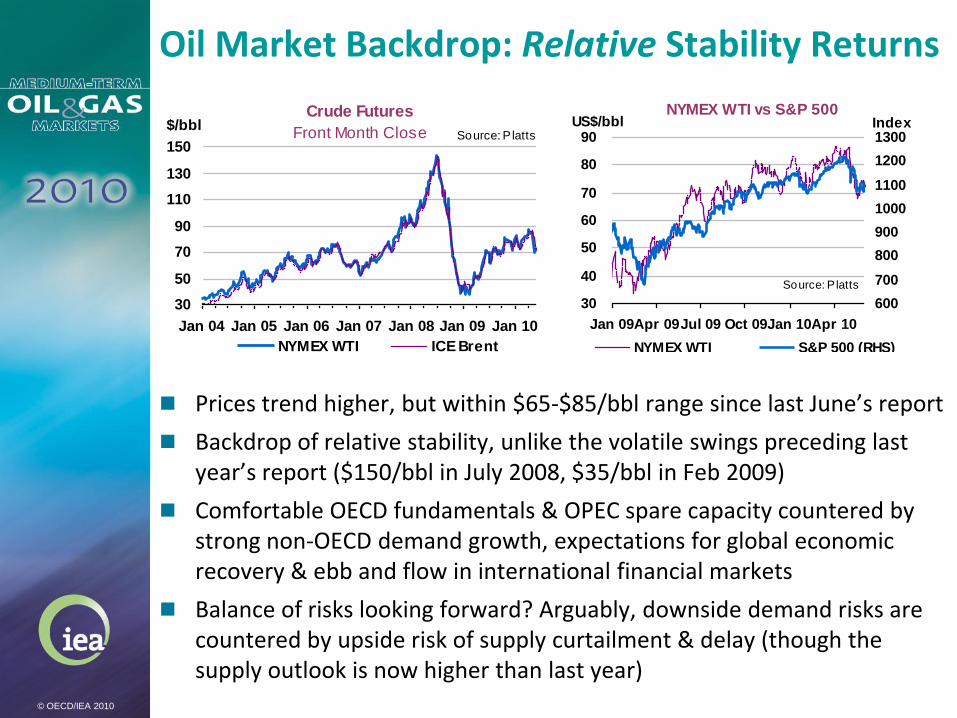
Oil Market Backdrop: Relative Stability Returns
Prices trend higher, but within $65-$85/bbl range since last June’s report
Backdrop of relative stability, unlike the volatile swings preceding last year’s report ($150/bbl in July 2008, $35/bbl in Feb 2009)
Comfortable OECD fundamentals & OPEC spare capacity countered by strong non-OECD demand growth, expectations for global economic recovery & ebb and flow in international financial markets
Balance of risks looking forward? Arguably, downside demand risks are countered by upside risk of supply curtailment & delay (though the supply outlook is now higher than last year)
NYMEX WTI vs S&P 500
30
40
50
60
70
80
90
Jan 09Apr 09Jul 09 Oct 09Jan 10Apr 10
US$/bbl
600
700
800
900
1000
1100
1200
1300Index
NYMEX WTI S&P 500 (RHS)
Source: P latts
Crude Futures
Front Month Close
30
50
70
90
110
130
150
Jan 04 Jan 05 Jan 06 Jan 07 Jan 08 Jan 09 Jan 10
$/bbl
NYMEX WTI ICE Brent
Source: P latts
© OECD/IEA 2010
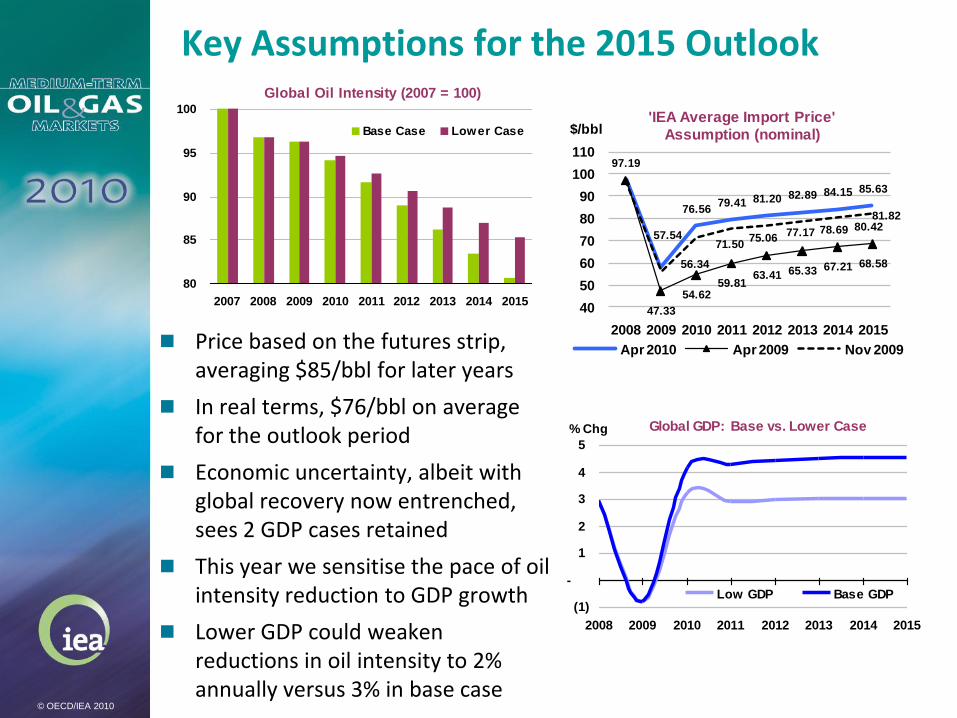
Key Assumptions for the 2015 Outlook
Price based on the futures strip, averaging $85/bbl for later years
In real terms, $76/bbl on average for the outlook period
Economic uncertainty, albeit with global recovery now entrenched, sees 2 GDP cases retained
This year we sensitise the pace of oil intensity reduction to GDP growth
Lower GDP could weaken reductions in oil intensity to 2% annually versus 3% in base case
97.19
57.54
76.5679.41 81.20 82.89 84.15 85.63
47.33
54.6259.81
63.41 65.33 67.21 68.5856.34
71.5075.06
77.17 78.69 80.4281.82
40
50
60
70
80
90
100
110
2008 2009 2010 2011 2012 2013 2014 2015
$/bbl'IEA Average Import Price'
Assumption (nominal)
Apr 2010 Apr 2009 Nov 2009
Global GDP: Base vs. Lower Case
(1)
-
1
2
3
4
5
2008 2009 2010 2011 2012 2013 2014 2015
% Chg
Low GDP Base GDP
Global Oil Intensity (2007 = 100)
80
85
90
95
100
2007 2008 2009 2010 2011 2012 2013 2014 2015
Base Case Lower Case
© OECD/IEA 2010
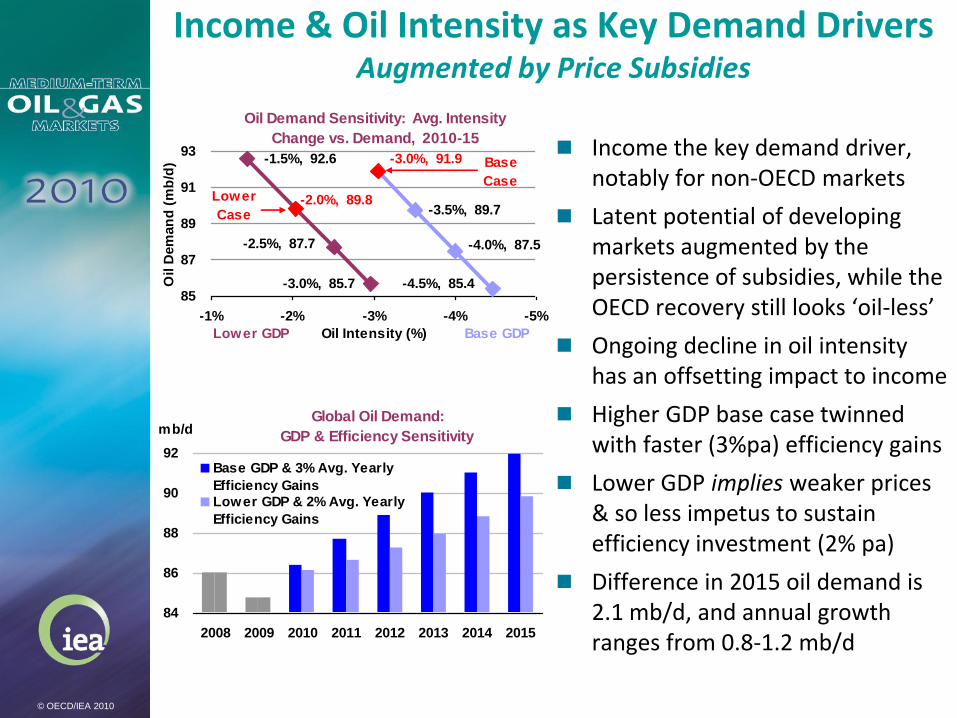
Income & Oil Intensity as Key Demand DriversAugmented by Price Subsidies
Income the key demand driver, notably for non-OECD markets
Latent potential of developing markets augmented by the persistence of subsidies, while the OECD recovery still looks ‘oil-less’
Ongoing decline in oil intensity has an offsetting impact to income
Higher GDP base case twinned with faster (3%pa) efficiency gains
Lower GDP implies weaker prices & so less impetus to sustain efficiency investment (2% pa)
Difference in 2015 oil demand is 2.1 mb/d, and annual growth ranges from 0.8-1.2 mb/d
Oil Demand Sensitivity: Avg. Intensity
Change vs. Demand, 2010-15
-3.5%, 89.7
-4.0%, 87.5
-4.5%, 85.4
-2.5%, 87.7
-3.0%, 85.7
-3.0%, 91.9 -1.5%, 92.6
-2.0%, 89.8
85
87
89
91
93
-5%-4%-3%-2%-1%
Oil Intensity (%)
Oil D
em
an
d (
mb
/d) Base
CaseLower
Case
Lower GDP Base GDP
Global Oil Demand:
GDP & Efficiency Sensitivity
84
86
88
90
92
2008 2009 2010 2011 2012 2013 2014 2015
mb/d
Base GDP & 3% Avg. Yearly
Efficiency Gains
Lower GDP & 2% Avg. Yearly
Efficiency Gains
© OECD/IEA 2010
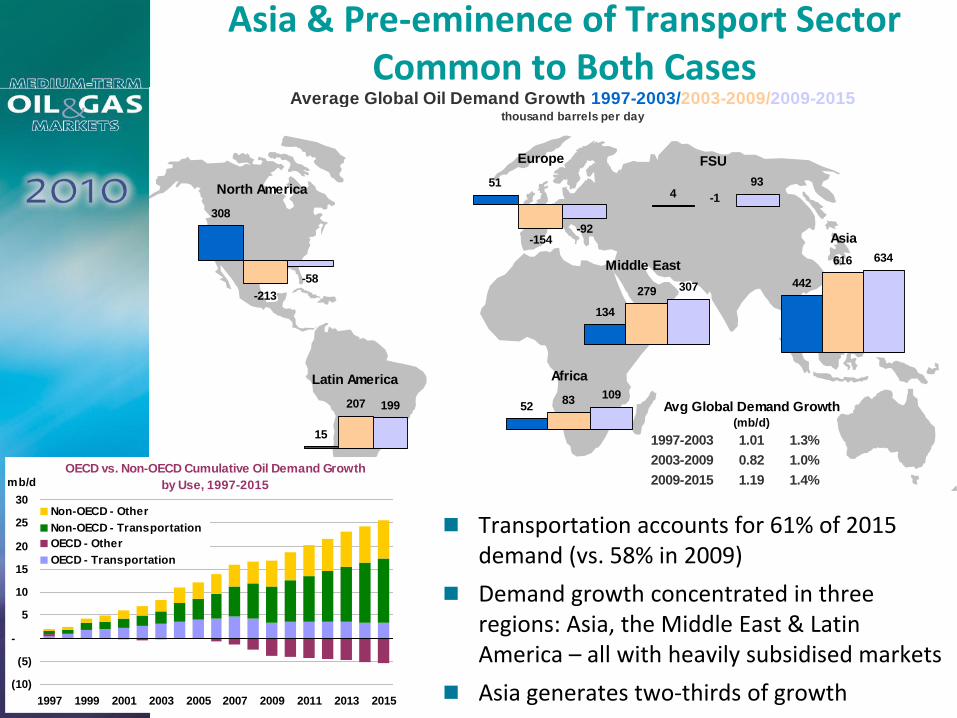
Average Global Oil Demand Growth 1997-2003/2003-2009/2009-2015 Average Global Oil Demand Growth 2000-2005/2005-2010/2010-2015thousand barrels per day thousand barrels per day
(mb/d)
1997-2003 1.01 1.3%
2003-2009 0.82 1.0%
2009-2015 1.19 1.4%
Avg Global Demand Growth
51
-154-92
934 -1
207 199
15
308
-213
-58
134
279 307
5283 109
North America
Latin America Africa
Middle East
Europe FSU
442
616 634
Asia
Asia & Pre-eminence of Transport Sector Common to Both Cases
Transportation accounts for 61% of 2015 demand (vs. 58% in 2009)
Demand growth concentrated in three regions: Asia, the Middle East & Latin America – all with heavily subsidised markets
Asia generates two-thirds of growth
OECD vs. Non-OECD Cumulative Oil Demand Growth
by Use, 1997-2015
(10)
(5)
-
5
10
15
20
25
30
1997 1999 2001 2003 2005 2007 2009 2011 2013 2015
mb/d
Non-OECD - Other
Non-OECD - Transportation
OECD - Other
OECD - Transportation
© OECD/IEA 2010
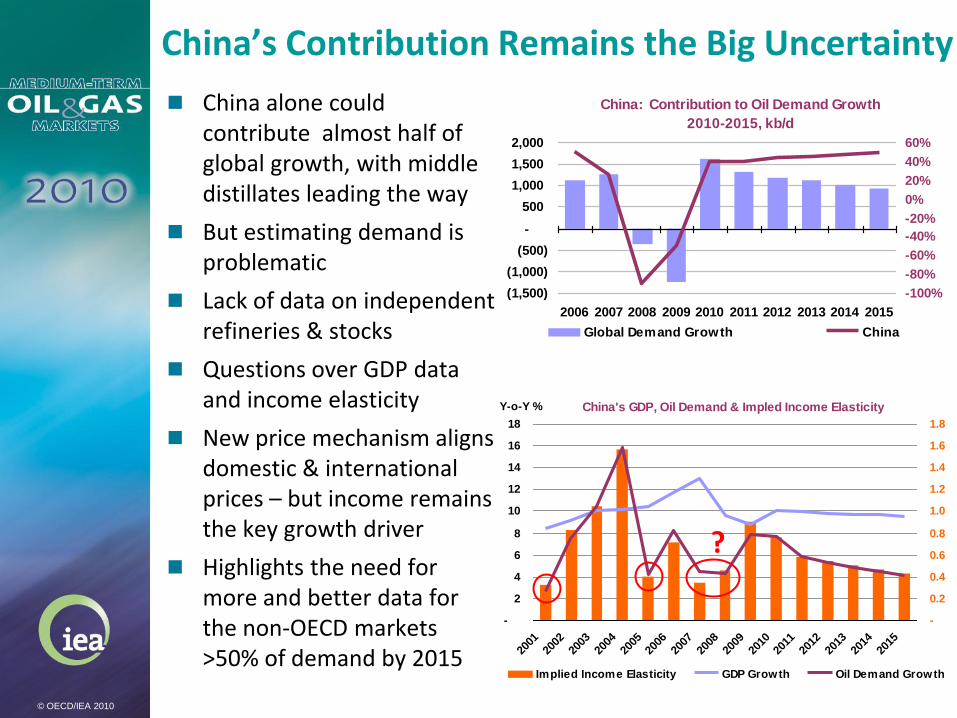
China’s Contribution Remains the Big Uncertainty
China alone could contribute almost half of global growth, with middle distillates leading the way
But estimating demand is problematic
Lack of data on independent refineries & stocks
Questions over GDP data and income elasticity
New price mechanism aligns domestic & international prices – but income remains the key growth driver
Highlights the need for more and better data for the non-OECD markets >50% of demand by 2015
China: Contribution to Oil Demand Growth
2010-2015, kb/d
(1,500)
(1,000)
(500)
-
500
1,000
1,500
2,000
2006 2007 2008 2009 2010 2011 2012 2013 2014 2015
-100%
-80%
-60%
-40%
-20%
0%
20%
40%
60%
Global Demand Growth China
China's GDP, Oil Demand & Impled Income Elasticity
-
2
4
6
8
10
12
14
16
18
2001
2002
2003
2004
2005
2006
2007
2008
2009
2010
2011
2012
2013
2014
2015
Y-o-Y %
-
0.2
0.4
0.6
0.8
1.0
1.2
1.4
1.6
1.8
Implied Income Elasticity GDP Growth Oil Demand Growth
?
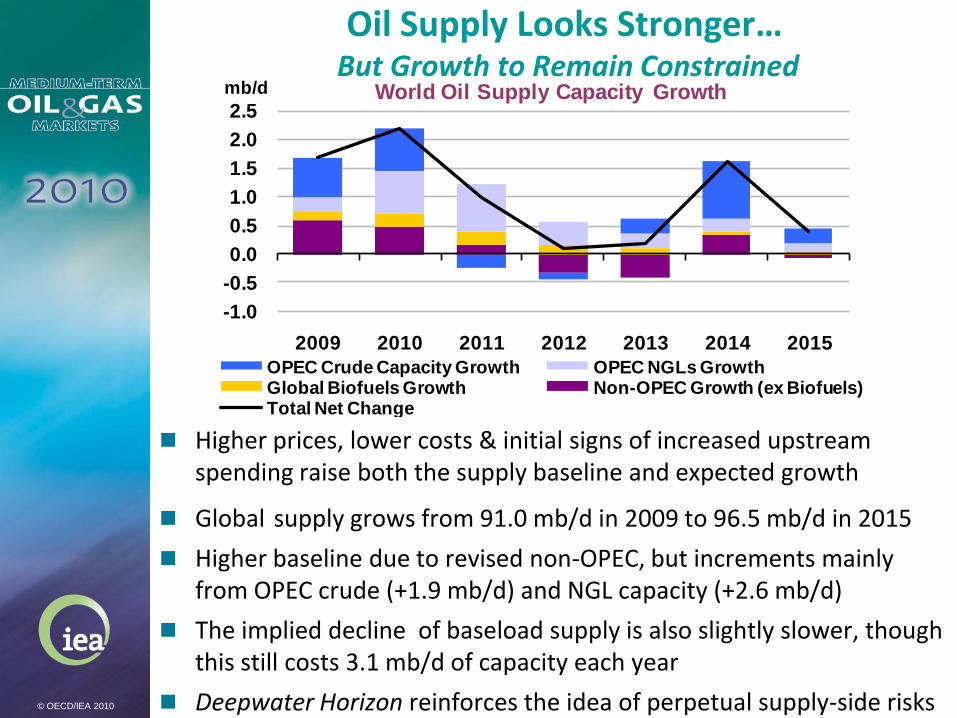
Oil Supply Looks Stronger…But Growth to Remain Constrained
Higher prices, lower costs & initial signs of increased upstream spending raise both the supply baseline and expected growth
Global supply grows from 91.0 mb/d in 2009 to 96.5 mb/d in 2015
Higher baseline due to revised non-OPEC, but increments mainly from OPEC crude (+1.9 mb/d) and NGL capacity (+2.6 mb/d)
The implied decline of baseload supply is also slightly slower, though this still costs 3.1 mb/d of capacity each year
Deepwater Horizon reinforces the idea of perpetual supply-side risks
-1.0
-0.5
0.0
0.5
1.0
1.5
2.0
2.5
2009 2010 2011 2012 2013 2014 2015
mb/d World Oil Supply Capacity Growth
OPEC Crude Capacity Growth OPEC NGLs GrowthGlobal Biofuels Growth Non-OPEC Growth (ex Biofuels)Total Net Change
© OECD/IEA 2010
-0.40
0.00
0.40
0.80
1.20
1.60
2.00
2009 2010 2011 2012 2013 2014 2015
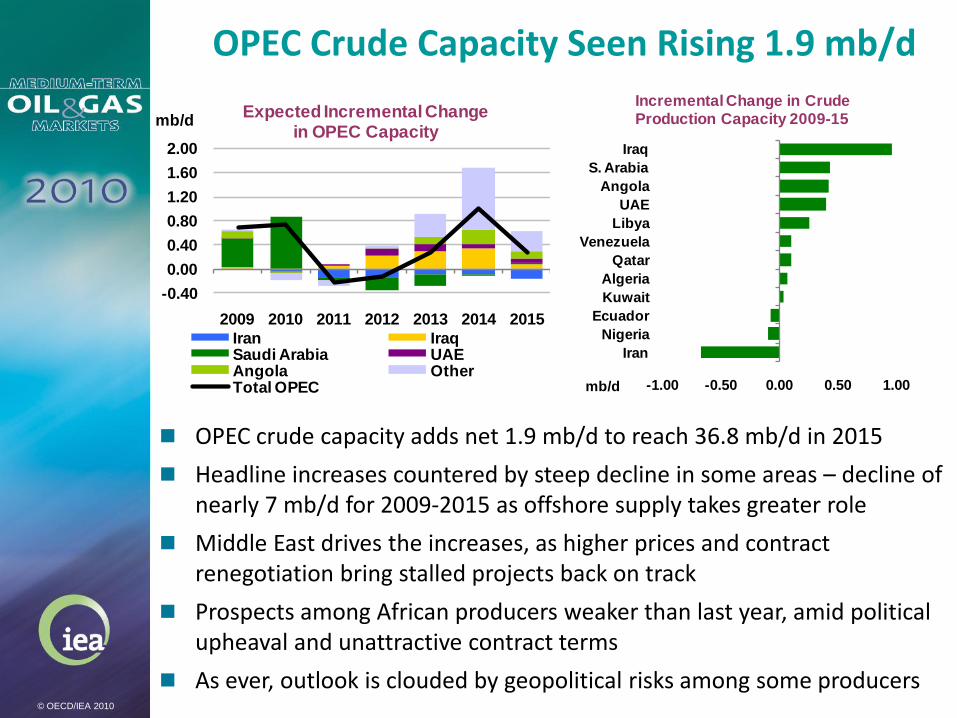
mb/dExpected Incremental Change
in OPEC Capacity
Iran IraqSaudi Arabia UAEAngola OtherTotal OPEC -1.00 -0.50 0.00 0.50 1.00
Iran
Nigeria
Ecuador
Kuwait
Algeria
Qatar
Venezuela
Libya
UAE
Angola
S. Arabia
Iraq
mb/d
Incremental Change in Crude Production Capacity 2009-15
© OECD/IEA 2010
OPEC crude capacity adds net 1.9 mb/d to reach 36.8 mb/d in 2015
Headline increases countered by steep decline in some areas – decline of nearly 7 mb/d for 2009-2015 as offshore supply takes greater role
Middle East drives the increases, as higher prices and contract renegotiation bring stalled projects back on track
Prospects among African producers weaker than last year, amid political upheaval and unattractive contract terms
As ever, outlook is clouded by geopolitical risks among some producers
OPEC Crude Capacity Seen Rising 1.9 mb/d
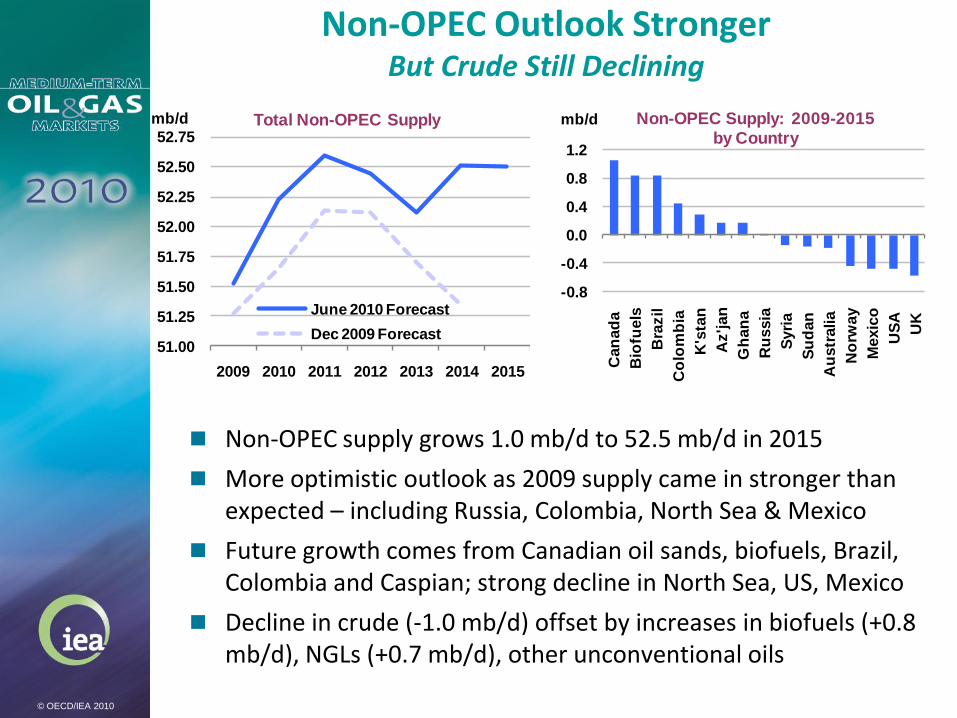
Non-OPEC Outlook StrongerBut Crude Still Declining
Non-OPEC supply grows 1.0 mb/d to 52.5 mb/d in 2015
More optimistic outlook as 2009 supply came in stronger than expected – including Russia, Colombia, North Sea & Mexico
Future growth comes from Canadian oil sands, biofuels, Brazil, Colombia and Caspian; strong decline in North Sea, US, Mexico
Decline in crude (-1.0 mb/d) offset by increases in biofuels (+0.8 mb/d), NGLs (+0.7 mb/d), other unconventional oils
51.00
51.25
51.50
51.75
52.00
52.25
52.50
52.75
2009 2010 2011 2012 2013 2014 2015
mb/d Total Non-OPEC Supply
June 2010 Forecast
Dec 2009 Forecast
-0.8
-0.4
0.0
0.4
0.8
1.2
Can
ad
a
Bio
fuels
Bra
zil
Co
lom
bia
K's
tan
Az'jan
Gh
an
a
Ru
ssia
Syri
a
Su
dan
Au
str
alia
No
rway
Mexic
o
US
A
UK
mb/d Non-OPEC Supply: 2009-2015 by Country
© OECD/IEA 2010
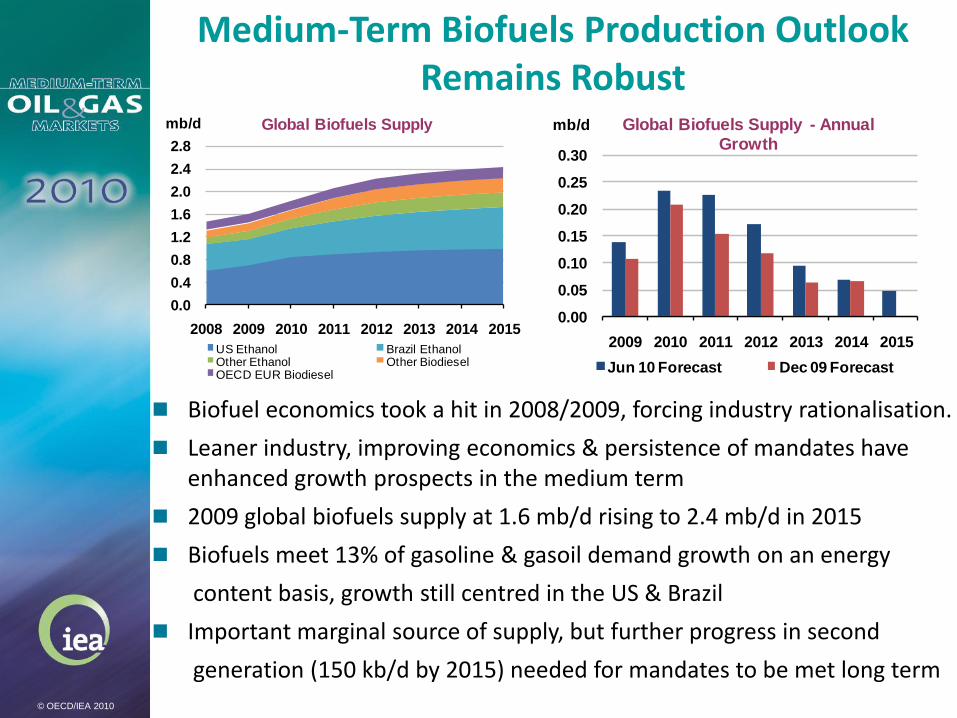
Medium-Term Biofuels Production Outlook Remains Robust
Biofuel economics took a hit in 2008/2009, forcing industry rationalisation.
Leaner industry, improving economics & persistence of mandates have enhanced growth prospects in the medium term
2009 global biofuels supply at 1.6 mb/d rising to 2.4 mb/d in 2015
Biofuels meet 13% of gasoline & gasoil demand growth on an energy
content basis, growth still centred in the US & Brazil
Important marginal source of supply, but further progress in second
generation (150 kb/d by 2015) needed for mandates to be met long term
0.0
0.4
0.8
1.2
1.6
2.0
2.4
2.8
2008 2009 2010 2011 2012 2013 2014 2015
mb/d Global Biofuels Supply
US Ethanol Brazil EthanolOther Ethanol Other BiodieselOECD EUR Biodiesel
0.00
0.05
0.10
0.15
0.20
0.25
0.30
2009 2010 2011 2012 2013 2014 2015
mb/d Global Biofuels Supply - Annual Growth
Jun 10 Forecast Dec 09 Forecast
© OECD/IEA 2010
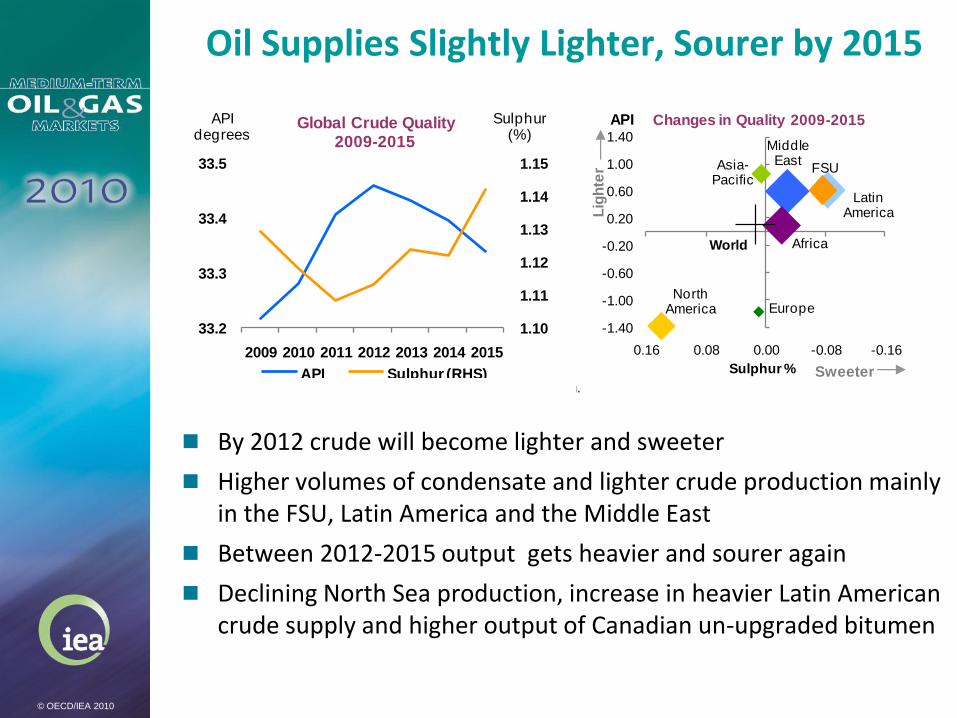
Oil Supplies Slightly Lighter, Sourer by 2015
By 2012 crude will become lighter and sweeter
Higher volumes of condensate and lighter crude production mainly in the FSU, Latin America and the Middle East
Between 2012-2015 output gets heavier and sourer again
Declining North Sea production, increase in heavier Latin American crude supply and higher output of Canadian un-upgraded bitumen
1.10
1.11
1.12
1.13
1.14
1.15
33.2
33.3
33.4
33.5
2009 2010 2011 2012 2013 2014 2015
Sulphur (%)
API degrees
Global Crude Quality2009-2015
API Sulphur (RHS)
Middle East
Africa
Latin America
FSU
North America Europe
Asia-Pacific
World
-1.40
-1.00
-0.60
-0.20
0.20
0.60
1.00
1.40
-0.16-0.080.000.080.16
API
Sulphur %
Changes in Quality 2009-2015
Sweeter
Lig
hte
r
FSU
Latin America
North America
Asia-Pacific
Middle East
Europe
Africa
World
25.0
30.0
35.0
40.0
0.00.51.01.52.0
API
Sulphur %
Current Gravity & Sulphur1
Sour Sweet
Lig
ht
He
av
y
1 Symbols proportionate in size to regional production.
© OECD/IEA 2010
© OECD/IEA 2010
0.0
2.5
5.0
7.5
10.0
2010 2011 2012 2013 2014 2015
kb/d Cumulative CDU Expansions
OECD China
Other Asia Middle East
Latin America Other Non OECD
70%
75%
80%
85%
90%
95%
1Q06 1Q08 1Q10 1Q12 1Q14
Refinery Utilisation Rates
OECD Non-OECD World
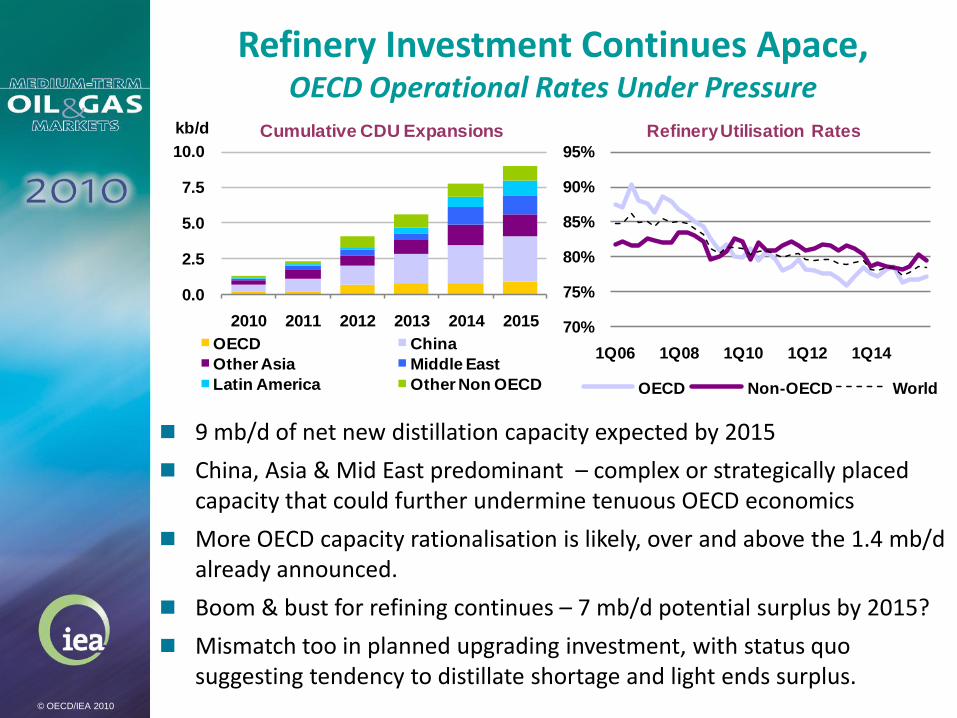
Refinery Investment Continues Apace,OECD Operational Rates Under Pressure
9 mb/d of net new distillation capacity expected by 2015
China, Asia & Mid East predominant – complex or strategically placed capacity that could further undermine tenuous OECD economics
More OECD capacity rationalisation is likely, over and above the 1.4 mb/d already announced.
Boom & bust for refining continues – 7 mb/d potential surplus by 2015?
Mismatch too in planned upgrading investment, with status quo suggesting tendency to distillate shortage and light ends surplus.
-4.0
-2.0
0.0
2.0
4.0
6.0
8.0
-2.0
-1.0
0.0
1.0
2.0
3.0
4.0
2000 2001 2002 2003 2004 2005 2006 2007 2008 2009 2010 2011 2012 2013 2014 2015
mb/dmb/d Medium-Term Oil Market Balance (Base Case)
Effective OPEC Spare Capacity (RHS) World Demand Growth
World Supply Capacity Growth
-4.0
-2.0
0.0
2.0
4.0
6.0
8.0
-2.0
-1.0
0.0
1.0
2.0
3.0
4.0
2000 2001 2002 2003 2004 2005 2006 2007 2008 2009 2010 2011 2012 2013 2014 2015
mb/dmb/d Medium-Term Oil Market Balance (Lower GDP Case)
Effective OPEC Spare Capacity (RHS) World Demand Growth
World Supply Capacity Growth
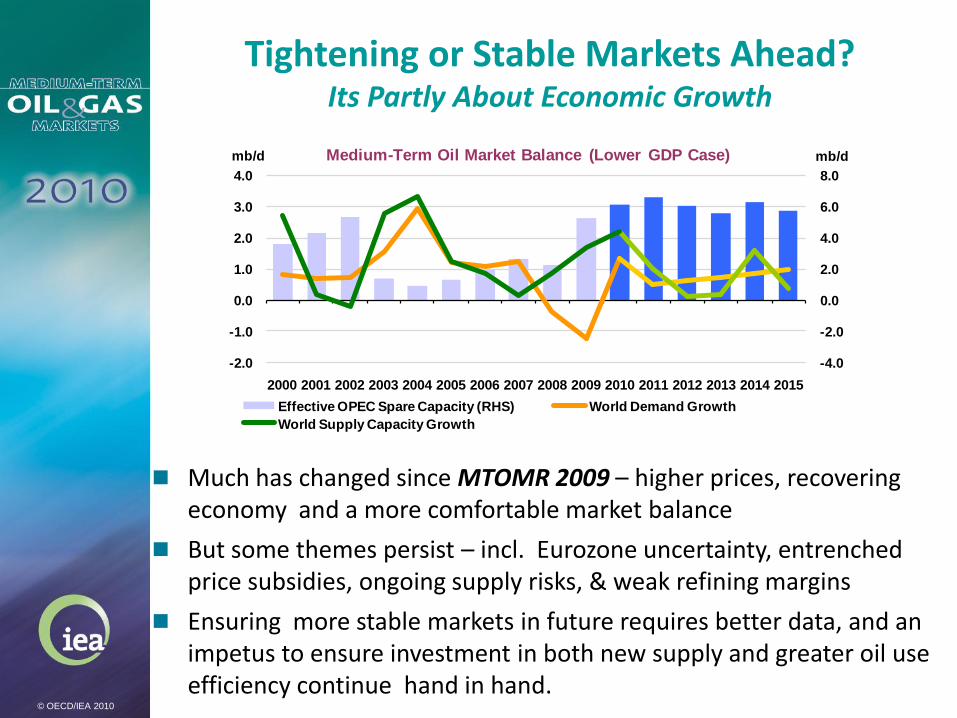
Tightening or Stable Markets Ahead?Its Partly About Economic Growth
© OECD/IEA 2010
Much has changed since MTOMR 2009 – higher prices, recovering economy and a more comfortable market balance
But some themes persist – incl. Eurozone uncertainty, entrenched price subsidies, ongoing supply risks, & weak refining margins
Ensuring more stable markets in future requires better data, and an impetus to ensure investment in both new supply and greater oil use efficiency continue hand in hand.
© OECD/IEA 2010