Embed Size (px)
Citation preview
SIAM
OECD Workshop and Policy Dialogue on TBT:Promoting Good Practices in Support of Open Markets
Group 1:
Controlling CO2 Emissions of Automobiles
Atanu Ganguli
Director
Society of Indian Automobile Manufacturers
October 5th , 2009 Paris

SIAM
Indian Automotive Industry
• Estimated Industry Turnover in 2009: Rs 2,20,000 crs or US
$ 46 bn
– Accounts for about 22% of manufacturing GDP and one of the
highest contributors to State and Central Government finances
• Employment: Direct 600,000 people + 12.5 mn indirect
• Highly competitive: Most multinationals in India. Also
establishing engineering and sourcing centres

SIAM
Size of the Indian Automobile Industry
Passenger
Vehicles
16%
Three
Wheelers
4%Two
Wheelers
75%
Commercial
Vehicles
5%
Total number of Vehicles Sold in 08-09 ~ 9.65 mn
Total registered vehicles in Indian ~ 109 mn
All figures for 2008-09
SIAM
Regulation Formulation Process
in India
SIAM
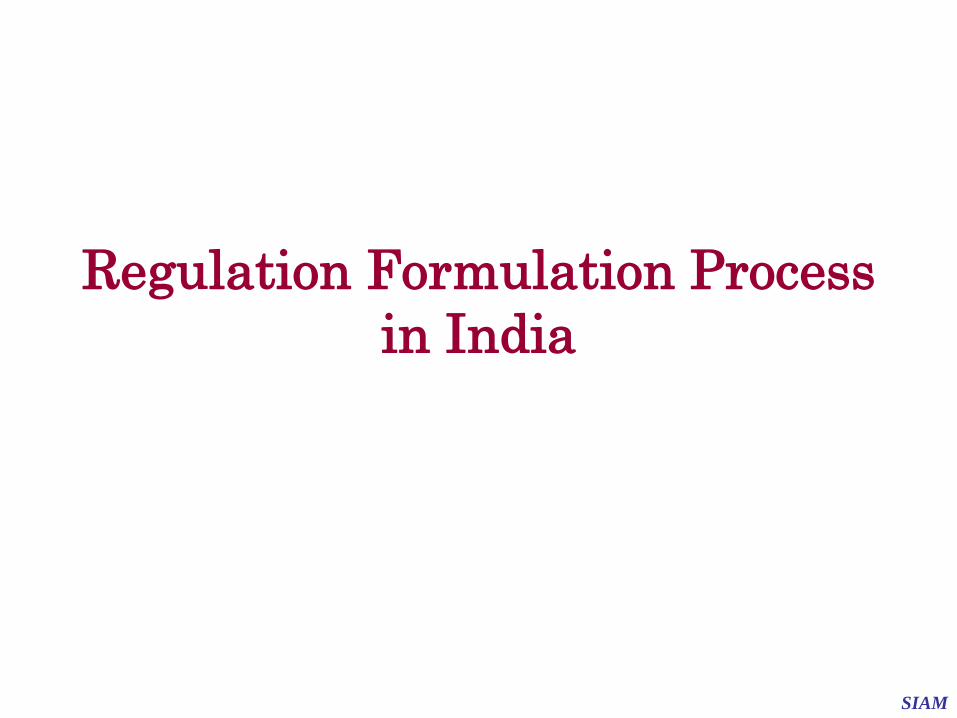
Regulation Administration
SIAM
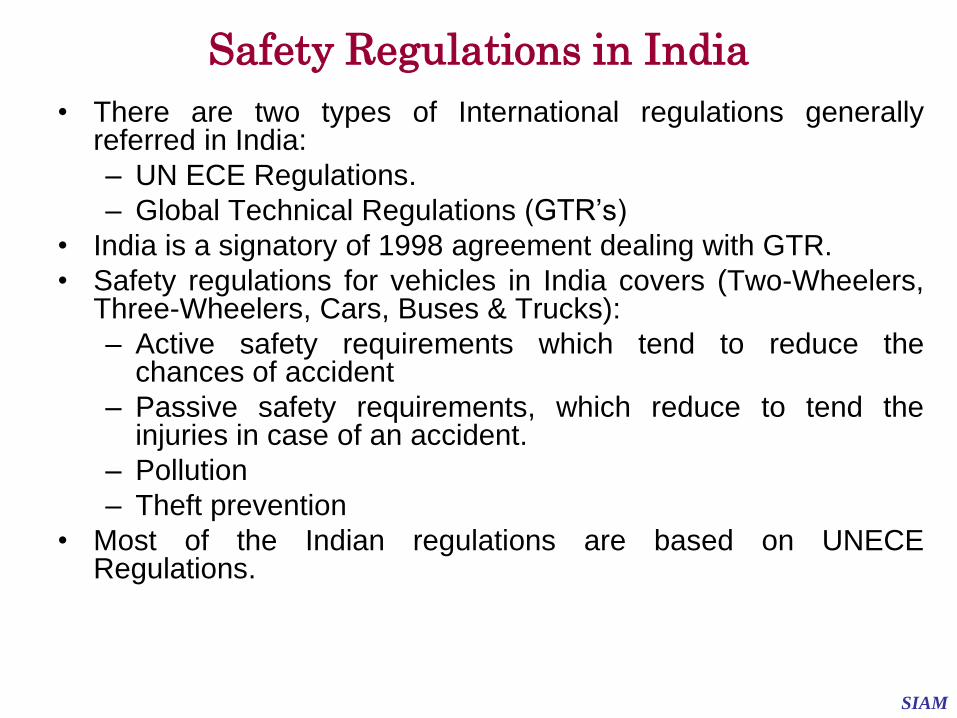
Safety Regulations in India
• There are two types of International regulations generallyreferred in India:
– UN ECE Regulations.
– Global Technical Regulations (GTR’s)
• India is a signatory of 1998 agreement dealing with GTR.
• Safety regulations for vehicles in India covers (Two-Wheelers,Three-Wheelers, Cars, Buses & Trucks):
– Active safety requirements which tend to reduce thechances of accident
– Passive safety requirements, which reduce to tend theinjuries in case of an accident.
– Pollution
– Theft prevention
• Most of the Indian regulations are based on UNECERegulations.
SIAM
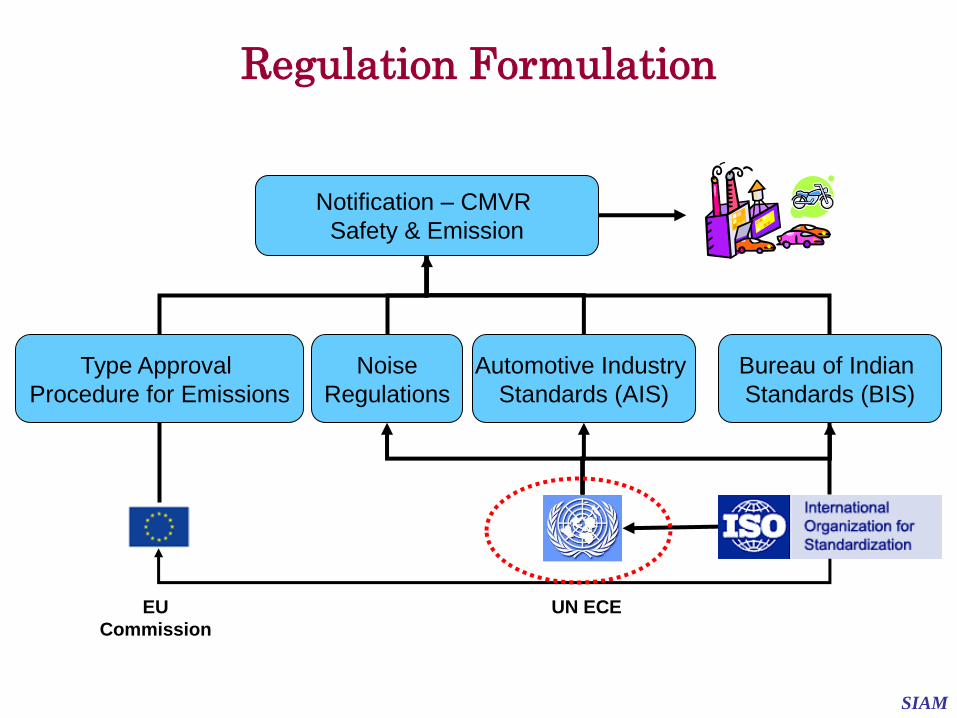
Regulation Formulation
Notification – CMVR
Safety & Emission
Automotive Industry
Standards (AIS)
Bureau of Indian
Standards (BIS)
Type Approval
Procedure for Emissions
Noise
Regulations
UN ECEEU
Commission
SIAM
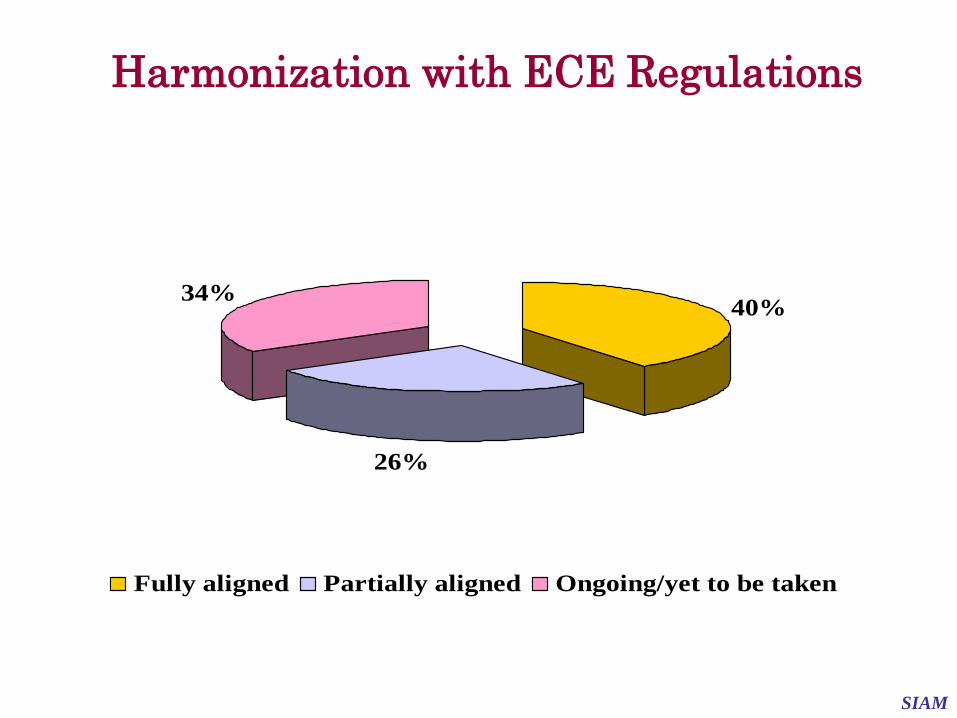
40%
26%
34%
Fully aligned Partially aligned Ongoing/yet to be taken
Harmonization with ECE Regulations

SIAM
Environmental Issues
SIAM
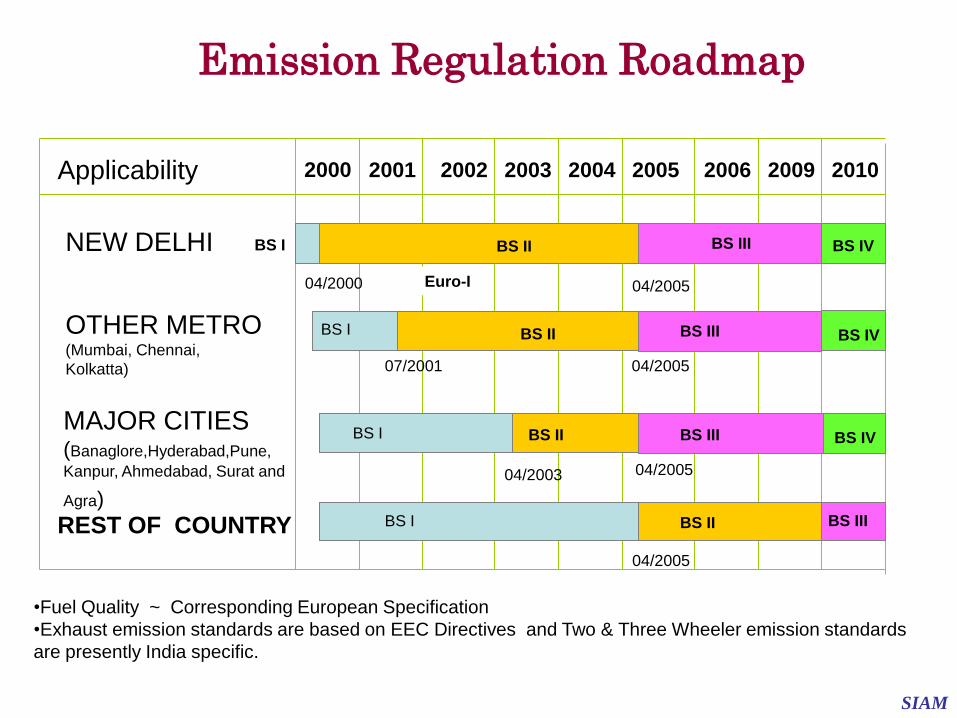
Applicability 2000 20022001 2003 2004 2005 2006 2009 2010
NEW DELHI
OTHER METRO (Mumbai, Chennai,
Kolkatta)
MAJOR CITIES(Banaglore,Hyderabad,Pune,
Kanpur, Ahmedabad, Surat and
Agra)
REST OF COUNTRY
04/2000
07/2001
04/2003
BS II
BS II
BS II
BS II
BS III
BS III
BS III
BS III
04/2005
04/2005
04/2005
04/2005
BS IV
BS IV
BS IV
•Fuel Quality ~ Corresponding European Specification
•Exhaust emission standards are based on EEC Directives and Two & Three Wheeler emission standards
are presently India specific.
Euro-I
BS I
BS I
BS I
BS I
Emission Regulation Roadmap
SIAM
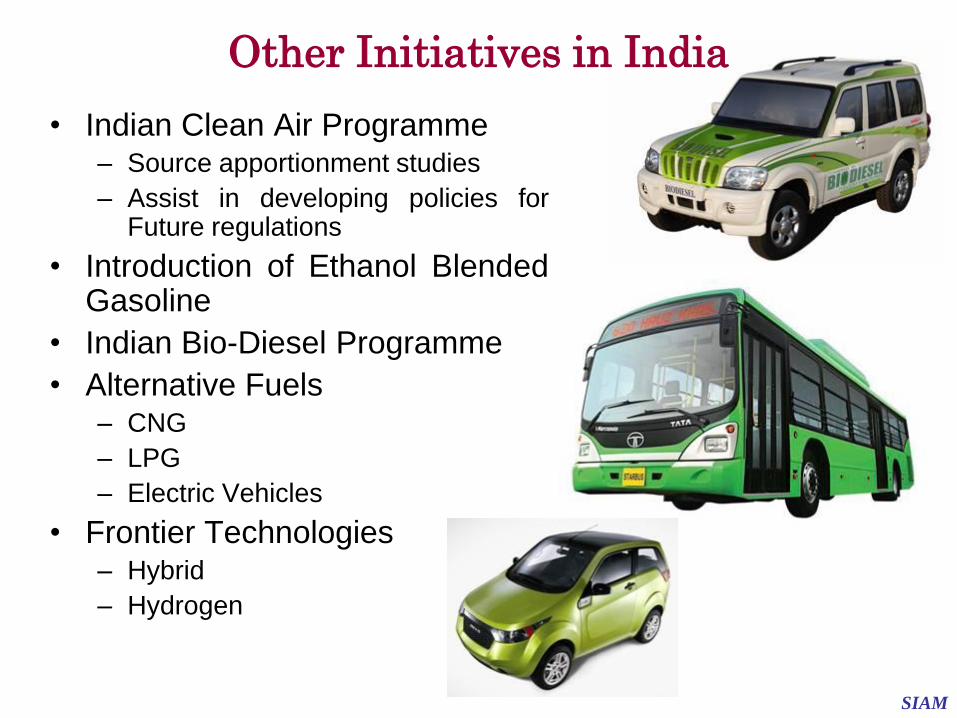
Other Initiatives in India
• Indian Clean Air Programme– Source apportionment studies
– Assist in developing policies forFuture regulations
• Introduction of Ethanol BlendedGasoline
• Indian Bio-Diesel Programme
• Alternative Fuels– CNG
– LPG
– Electric Vehicles
• Frontier Technologies– Hybrid
– Hydrogen
SIAM
Fuel Economy
SIAM
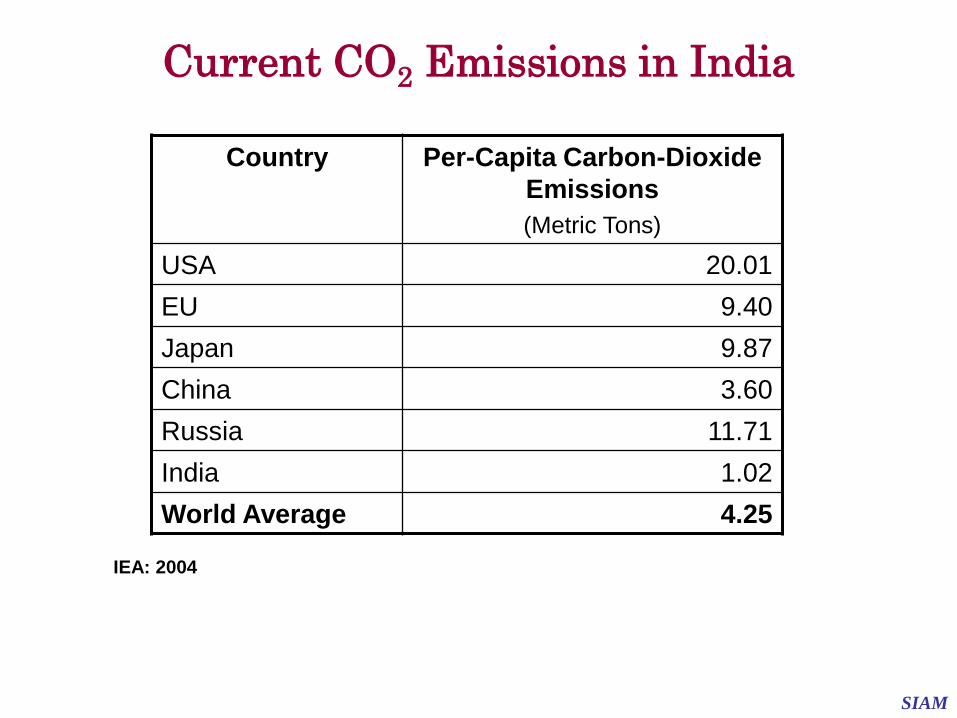
Country Per-Capita Carbon-Dioxide
Emissions
(Metric Tons)
USA 20.01
EU 9.40
Japan 9.87
China 3.60
Russia 11.71
India 1.02
World Average 4.25
IEA: 2004
Current CO2 Emissions in India
SIAM
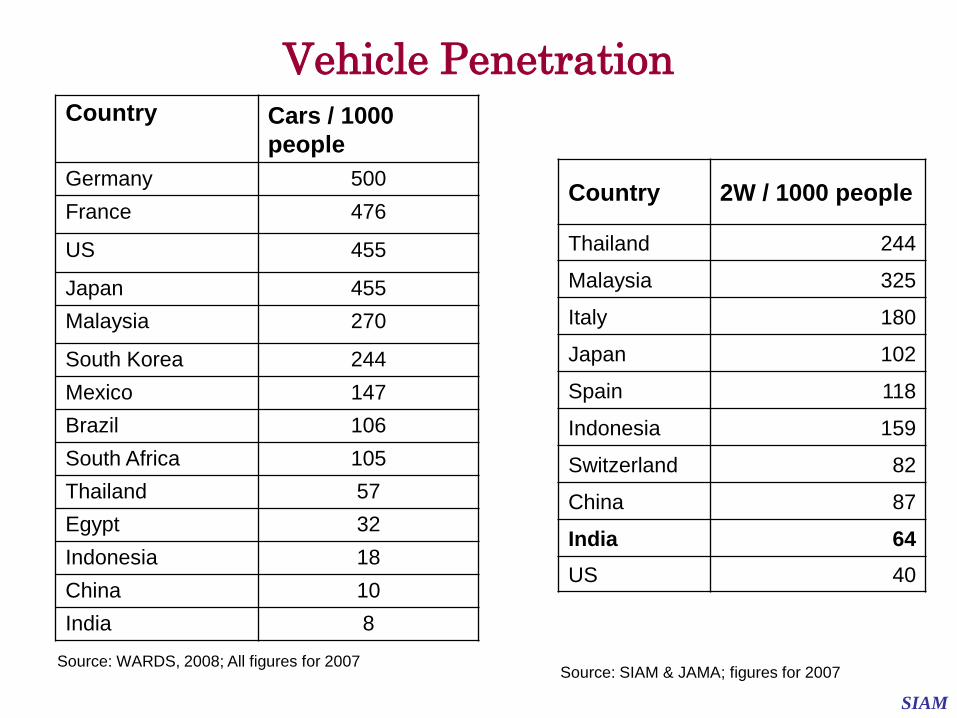
Country Cars / 1000
people
Germany 500
France 476
US 455
Japan 455
Malaysia 270
South Korea 244
Mexico 147
Brazil 106
South Africa 105
Thailand 57
Egypt 32
Indonesia 18
China 10
India 8
Source: WARDS, 2008; All figures for 2007
Vehicle Penetration
Country 2W / 1000 people
Thailand 244
Malaysia 325
Italy 180
Japan 102
Spain 118
Indonesia 159
Switzerland 82
China 87
India 64
US 40
Source: SIAM & JAMA; figures for 2007
SIAM
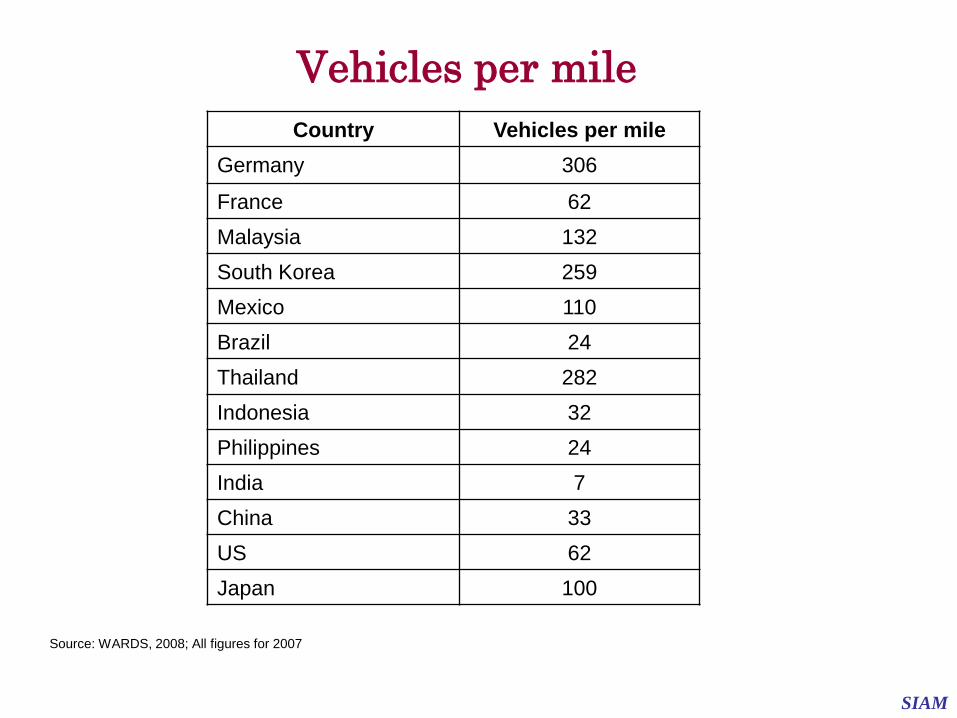
Vehicles per mile
Country Vehicles per mile
Germany 306
France 62
Malaysia 132
South Korea 259
Mexico 110
Brazil 24
Thailand 282
Indonesia 32
Philippines 24
India 7
China 33
US 62
Japan 100
Source: WARDS, 2008; All figures for 2007

SIAM
Global Transport CO2 Emissions Compared
to TOTAL Man-made Emissions
Road transport share of global CO2 emissions: LESS THAN 16%
COST EFFICIENCY IS CRUCIAL !
Road Transport(Cars, Trucks & Buses)
Electricity Generation
& Heating
Manufacturing& Construction
Fuel combustionfor otheruses
15.9%
43.9%
18.2%12.2%
Source: OICA

SIAM
National Action Plan for Climate Change
•Released by Prime Minister of India on 30th June 2008
•Principles
– National Action Plan for Climate Change has been built on the
principle that maintaining a high growth rate is essential for
increasing the living standards and reducing the vulnerability to
impacts of Climate change. It would look to:
• Protect the poor
• Achieve national growth objectives
• Devise efficient strategy for demand side management
• Deploy appropriate technologies
• Promote sustainable development through regulatory & voluntary
measures
• Implement programmes through public-private partnership
• Welcome international cooperation for research
SIAM
Recommendations Proposed
for Road Transport Sector
• Introducing Transport pricing measures toinfluence purchase and use of vehicles
• Fuel-economy standards for automobilemanufacturers– Discussions for development of Fuel Economy
regulations are presently underway
• Development of high capacity public transportsystems
• End-of-life vehicles
• Facilitate R&D
SIAM
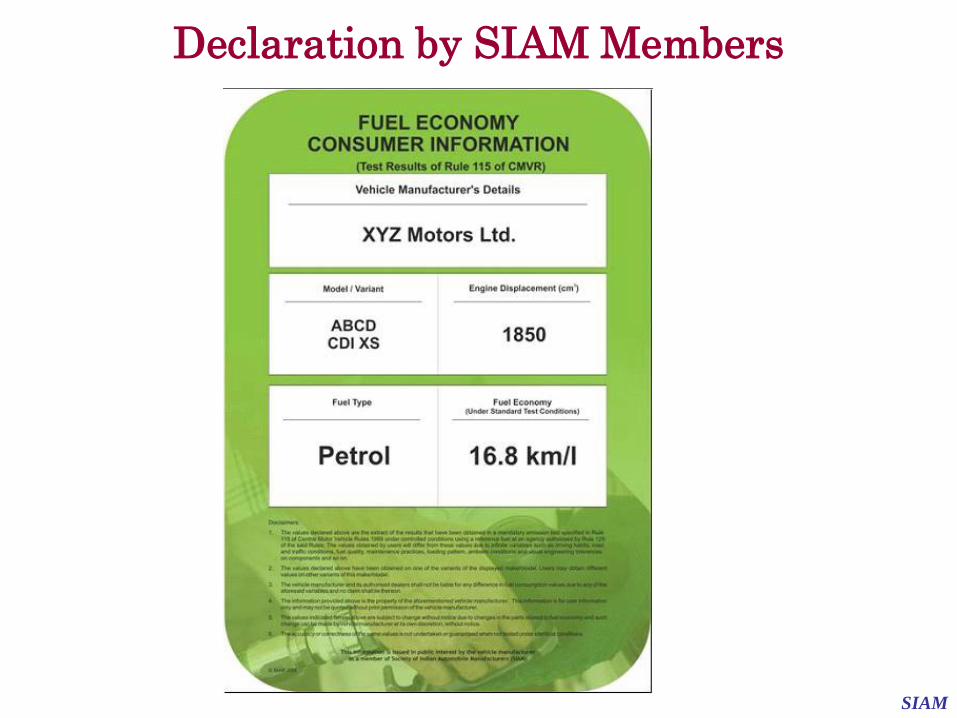
Declaration by SIAM Members

SIAM
Society of Indian Automobile Manufacturers
Core 4B, 5th Floor, India Habitat Centre
Lodi Road, New Delhi – 110 003
Tel: +91 11 24647810 / 11 / 12
Fax: +91 11 24648222
Email: [email protected]
www.siam.in
For further details please write to: