Embed Size (px)
Citation preview
Please cite this paper as:
Korinek, J. and J. Kim (2010), “Export Restrictions onStrategic Raw Materials and Their Impact on Trade”,OECD Trade Policy Working Papers, No. 95, OECDPublishing.doi: 10.1787/5kmh8pk441g8-en
OECD Trade Policy Working PapersNo. 95
Export Restrictions onStrategic Raw Materials andTheir Impact on Trade
Jane Korinek, Jeonghoi Kim
Unclassified TAD/TC/WP(2009)27/FINAL Organisation de Coopération et de Développement Économiques Organisation for Economic Co-operation and Development 29-Mar-2010 ___________________________________________________________________________________________
English - Or. English TRADE AND AGRICULTURE DIRECTORATE TRADE COMMITTEE
Working Party of the Trade Committee
EXPORT RESTRICTIONS ON STRATEGIC RAW MATERIALS AND THEIR IMPACT ON TRADE AND GLOBAL SUPPLY OECD Trade Policy Working Paper No. 95
by Jane Korinek and Jeonghoi Kim
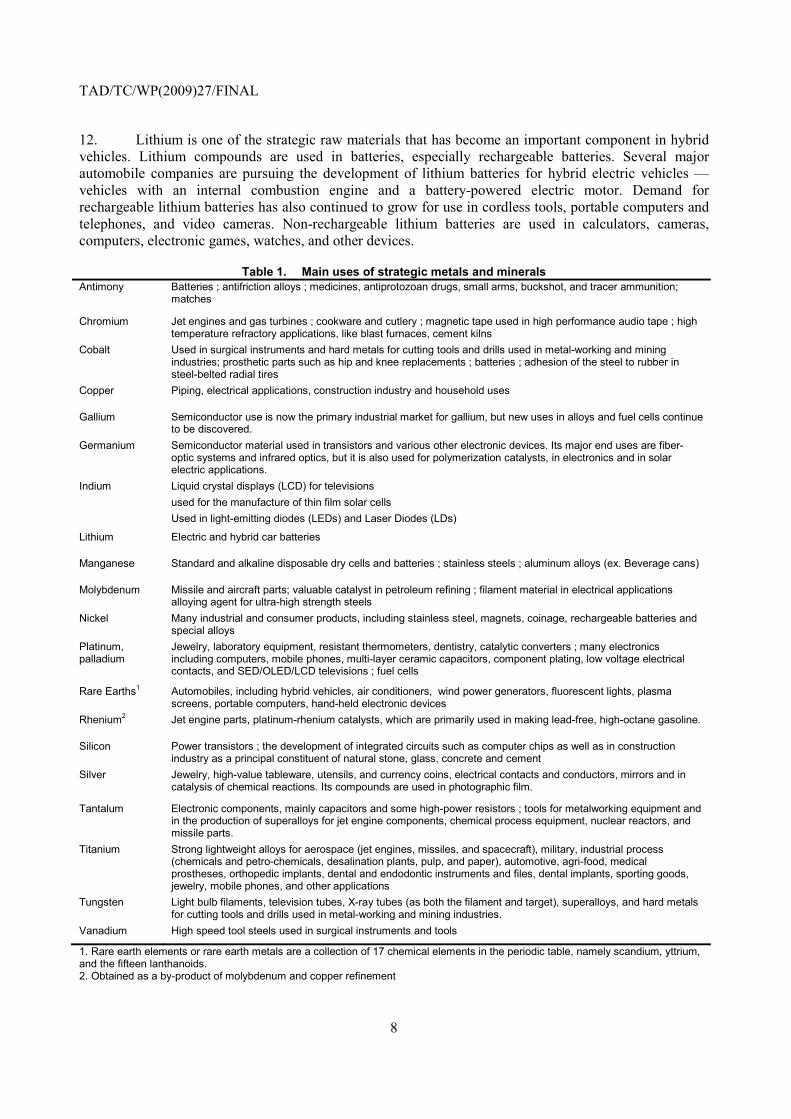
All Trade Policy Working Papers are available on the OECD website at: http://www.oecd.org/trade
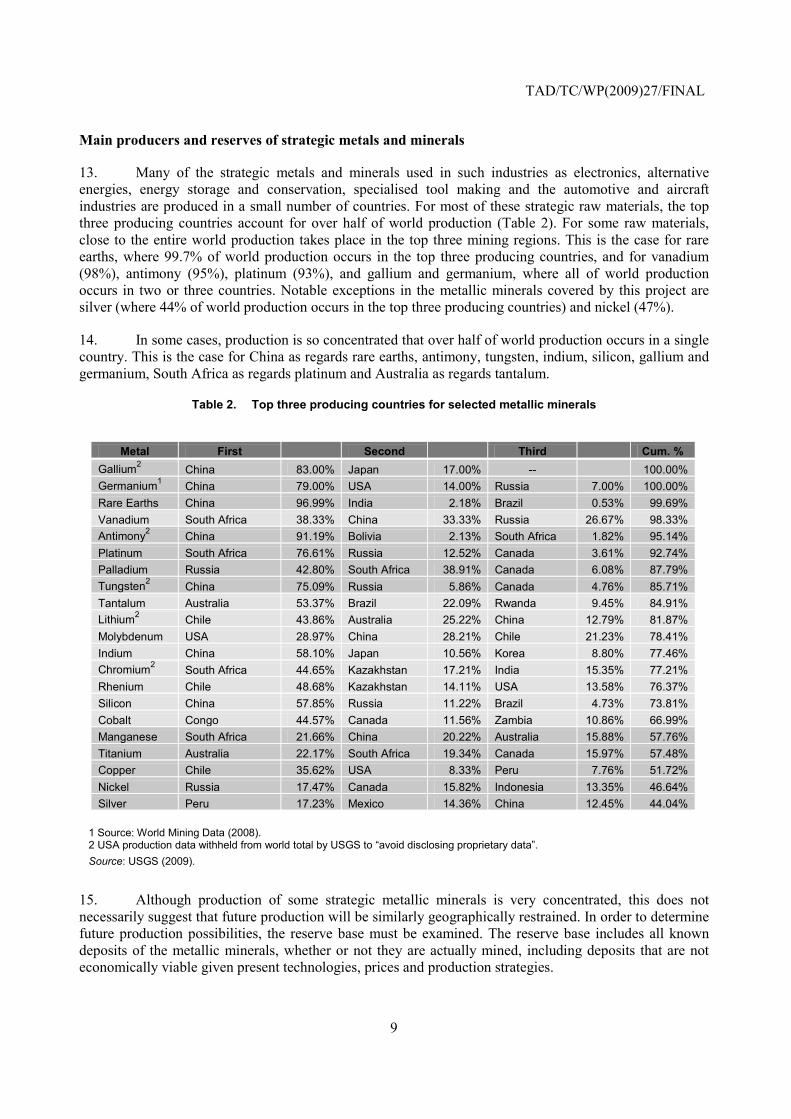
JT03280894
Document complet disponible sur OLIS dans son format d'origine Complete document available on OLIS in its original format
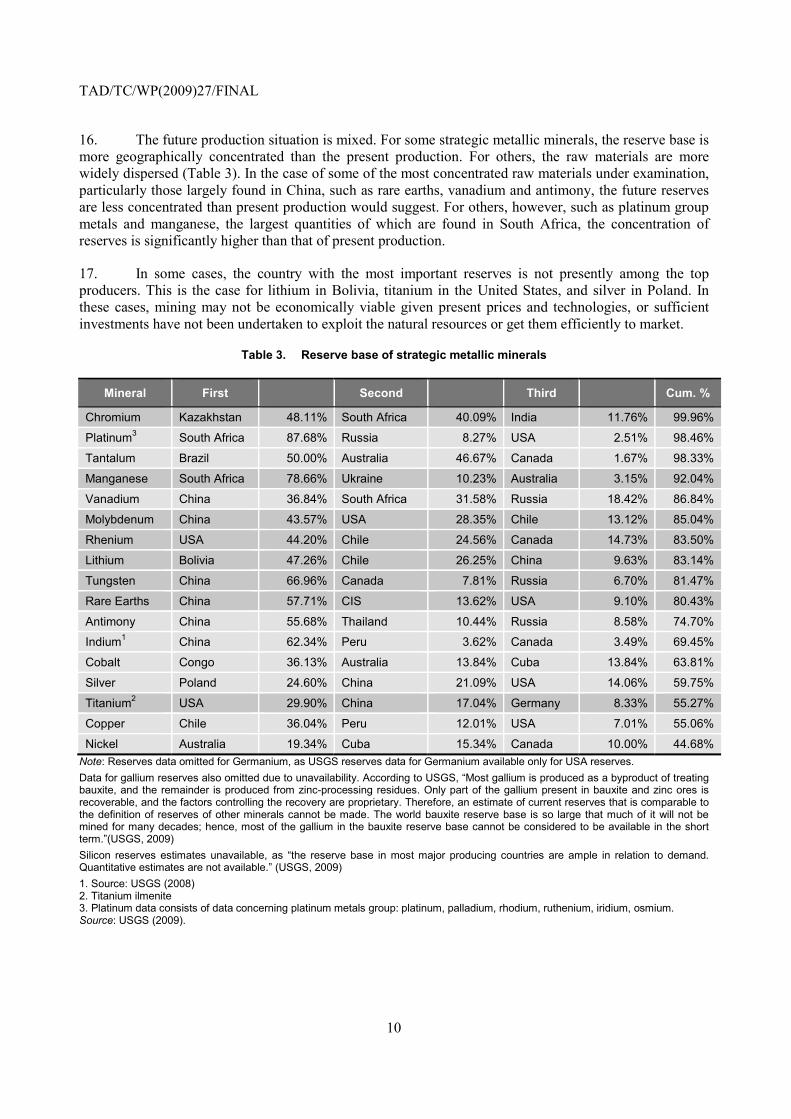
TA
D/T
C/W
P(2009)27/FINA
L
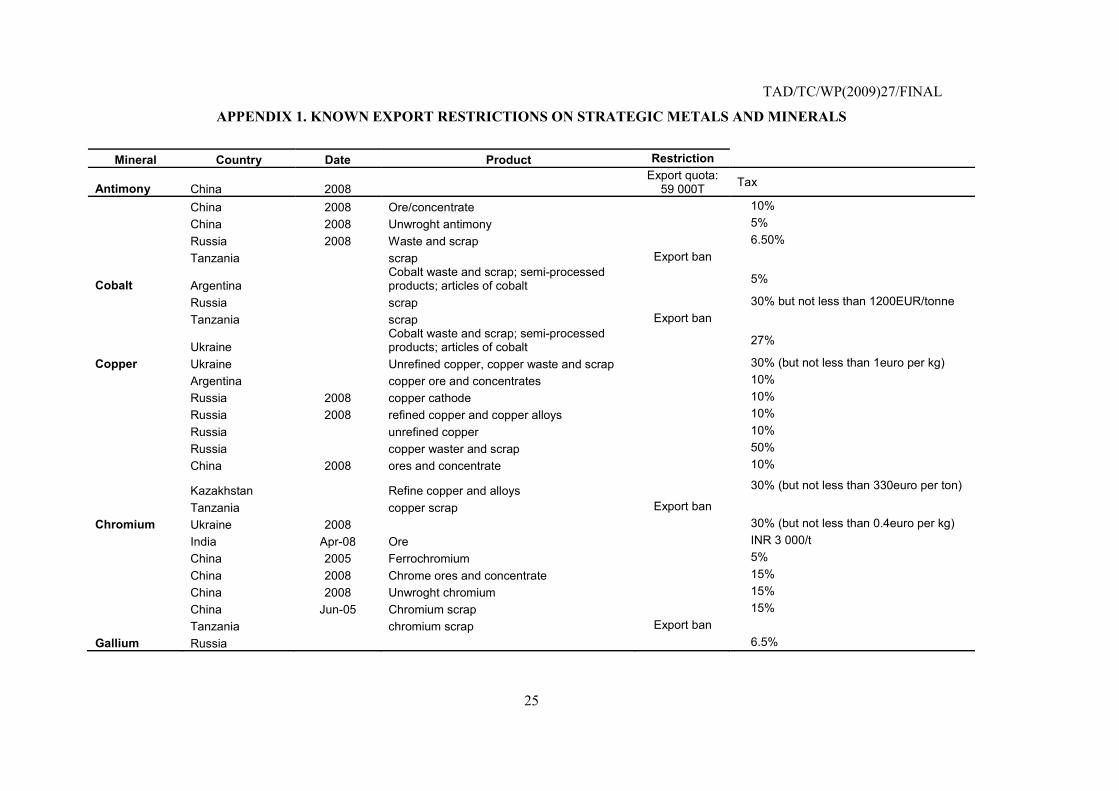
Unclassified
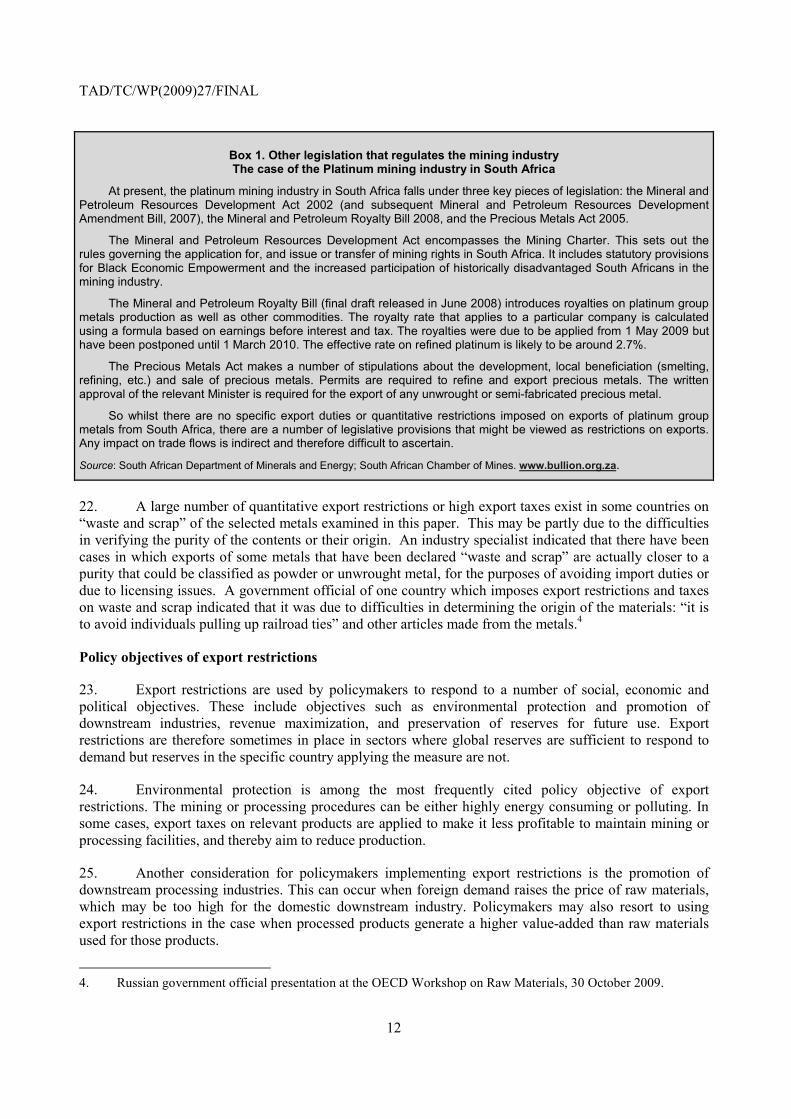
English - O
r. English
TAD/TC/WP(2009)27/FINAL
2
ABSTRACT
Barriers to trade come in a variety of forms. This paper examines one such barrier, export restrictions, and how it impacts trade and global supply in selected strategic metals and minerals. The metals and minerals examined in the paper are of particular interest for a number of reasons: they are generally geographically concentrated in a few countries, many are used in the production of high-technology goods in strategic sectors and there are few substitutes for these raw materials given the present state of technology. For all these reasons, importing countries are dependent on a reliable supply of these raw materials. Export restrictions may be applied for a number of reasons: protection of the environment, preservation of natural resources, protection of downstream industries, or as a response to a number of different market imperfections. This paper examines the motivations for using export restrictions and finds varying impacts on trade and global supply. In one case, the export restrictions put into place did not fulfill their objective of environmental protection. In another, the presence of export restrictions in one country put pressure on other exporters to apply restrictions suggesting the potential for competitive policy practices in restricting exports. In a third case study, export restrictions were seen to impact investment decisions by potential suppliers worldwide by introducing an added element of risk in the industry. The impact of export restrictions on strategic metals and minerals are exacerbated in many cases because producing countries have a quasi-monopoly on supply. Since these metals and minerals are essential in the production of some high-technology products and are not easily replaceable in the medium term, industry participants in some importing countries are concerned about future access at sustainable prices.
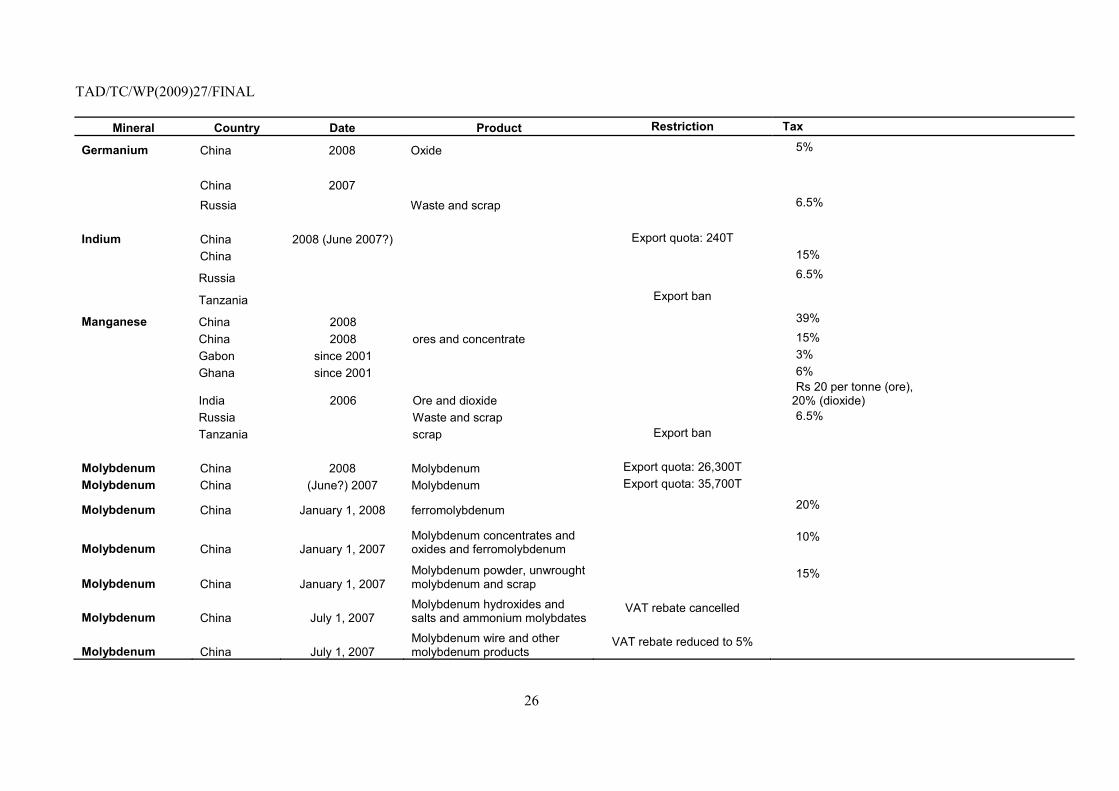
Keywords
Export restrictions, strategic metals, raw materials, minerals trade, export taxes, export duties, export quotas, quantitative restrictions, VAT rebates, export licensing, trade, trade policy, trade policy instruments, environmental technology, mineral reserves, geographical concentration, natural resource preservation, molybdenum, chromite, chromium, rare earths.
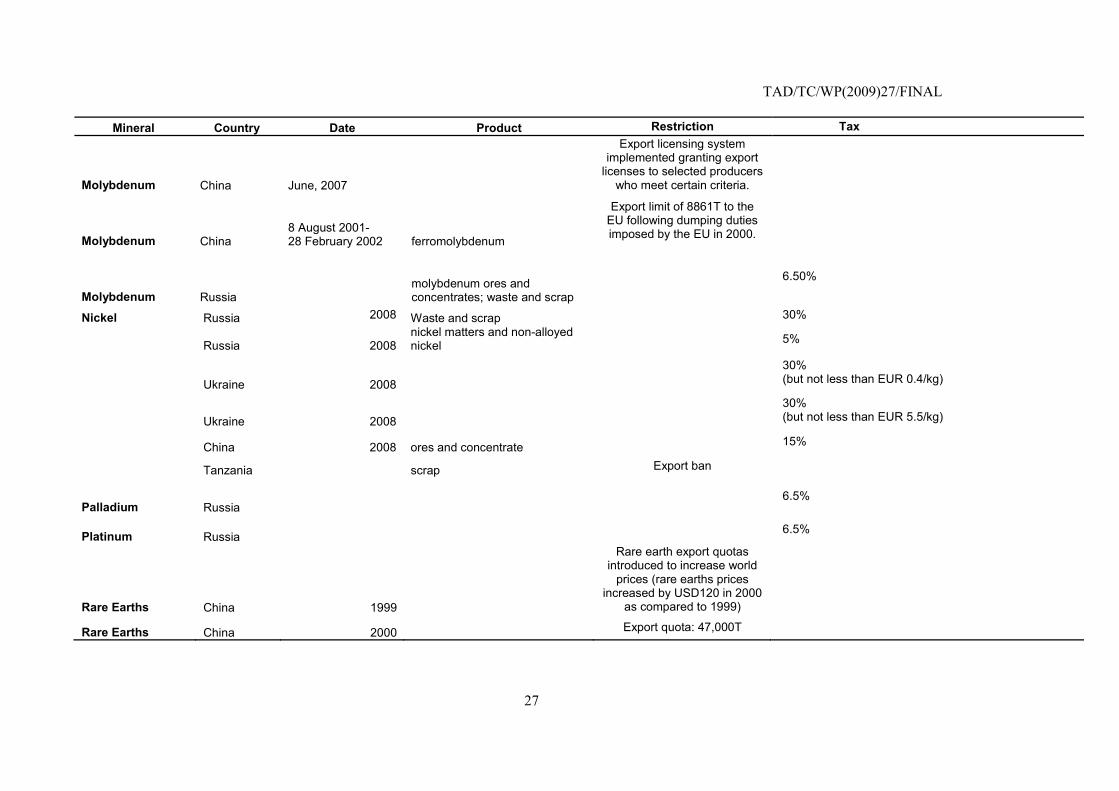
ACKNOWLEDGEMENTS
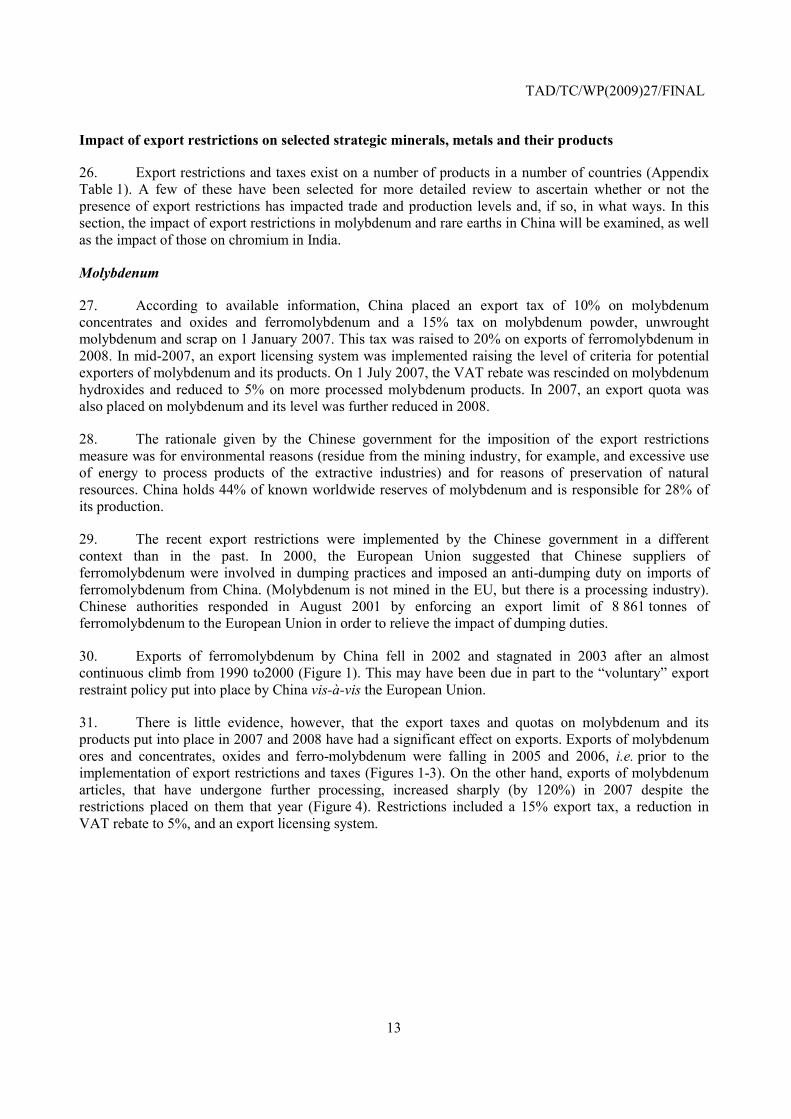
This study has been prepared by Jane Korinek and Jeonghoi Kim of the OECD Trade and Agriculture Directorate under the supervision of Frank van Tongeren. The authors wish to thank Dudley Kingsnorth for his contribution regarding trade in rare earths and George J. Korinek for his long-term perspective and insights into the functioning of metals markets. They are grateful for the statistical assistance provided by Amar Toor. This document has been declassified under the responsibility of the Working Party of the Trade Committee. It is available on the OECD website at: http://www.oecd.org/trade. Copyright OECD 2010 Applications for permission to reproduce or to translate all or part of this material should be made to: OECD Publication, 2 rue André Pascal, 75775 Paris Cedex 16, France.
TAD/TC/WP(2009)27/FINAL
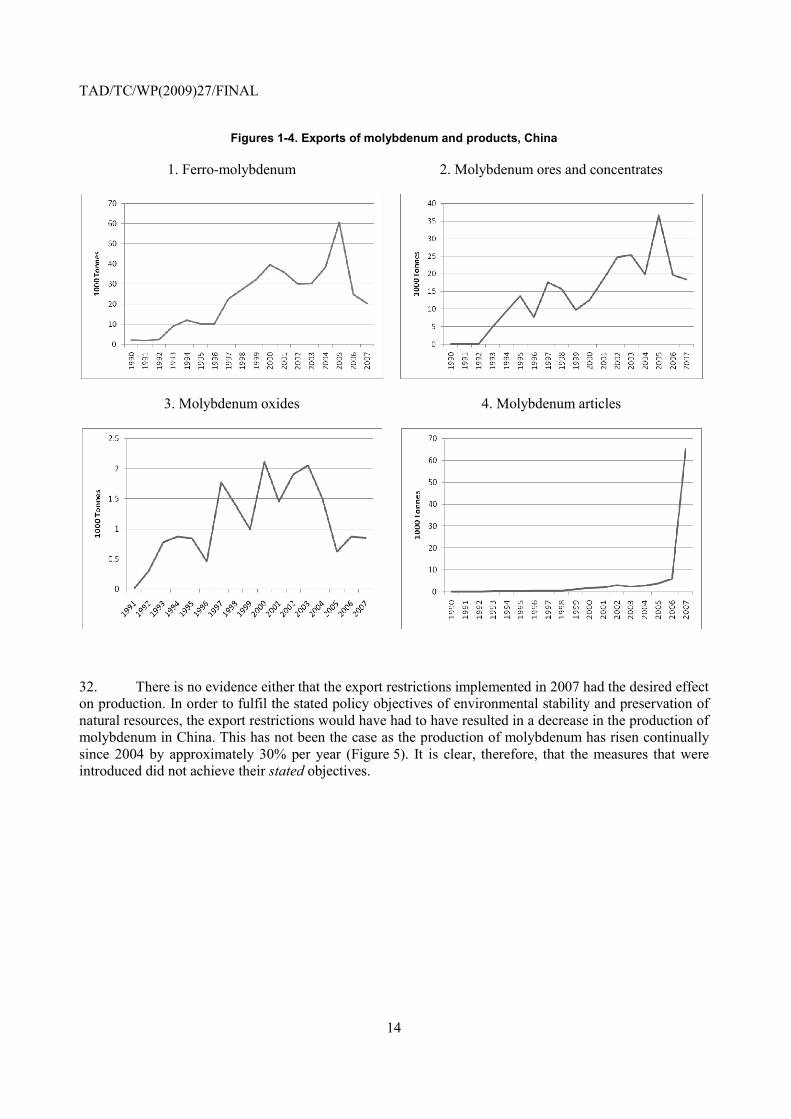
3
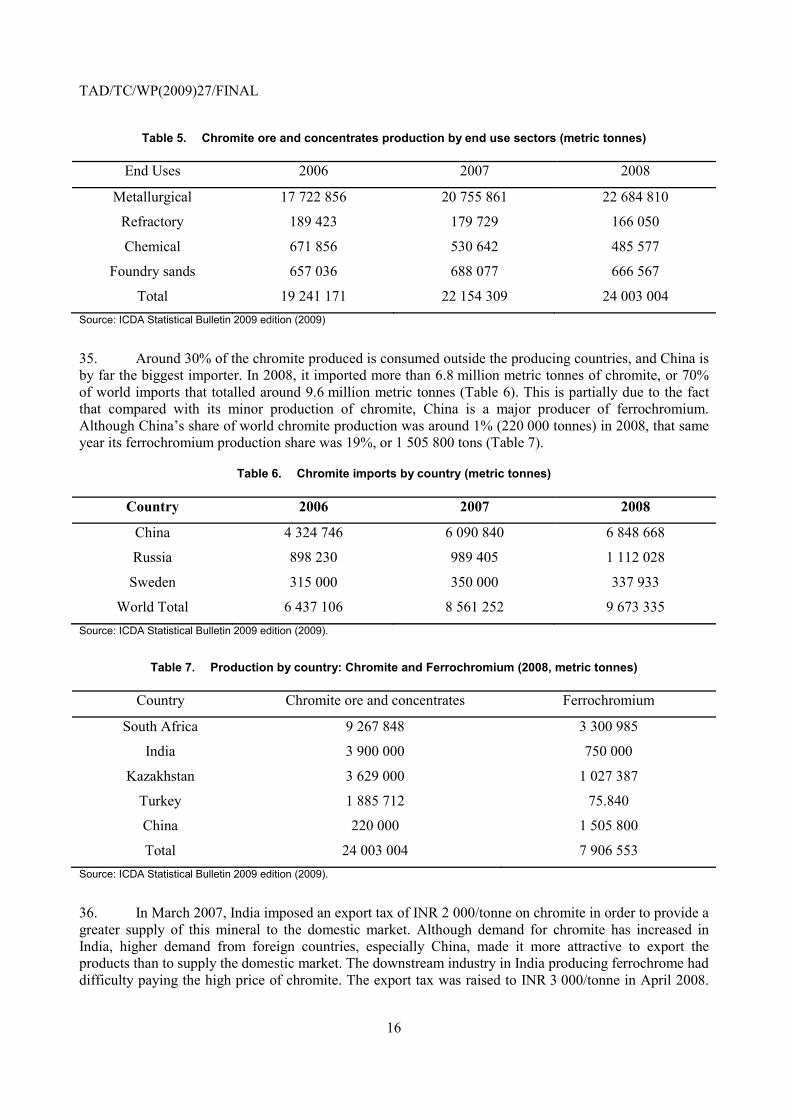
TABLE OF CONTENTS
EXECUTIVE SUMMARY ........................................................................................................................... 4
Uses of selected metals and minerals .......................................................................................................... 7 Main producers and reserves of strategic metals and minerals ................................................................... 9 Presence of export restrictions .................................................................................................................. 11 Policy objectives of export restrictions ..................................................................................................... 12 Impact of export restrictions on selected strategic minerals, metals and their products ........................... 13
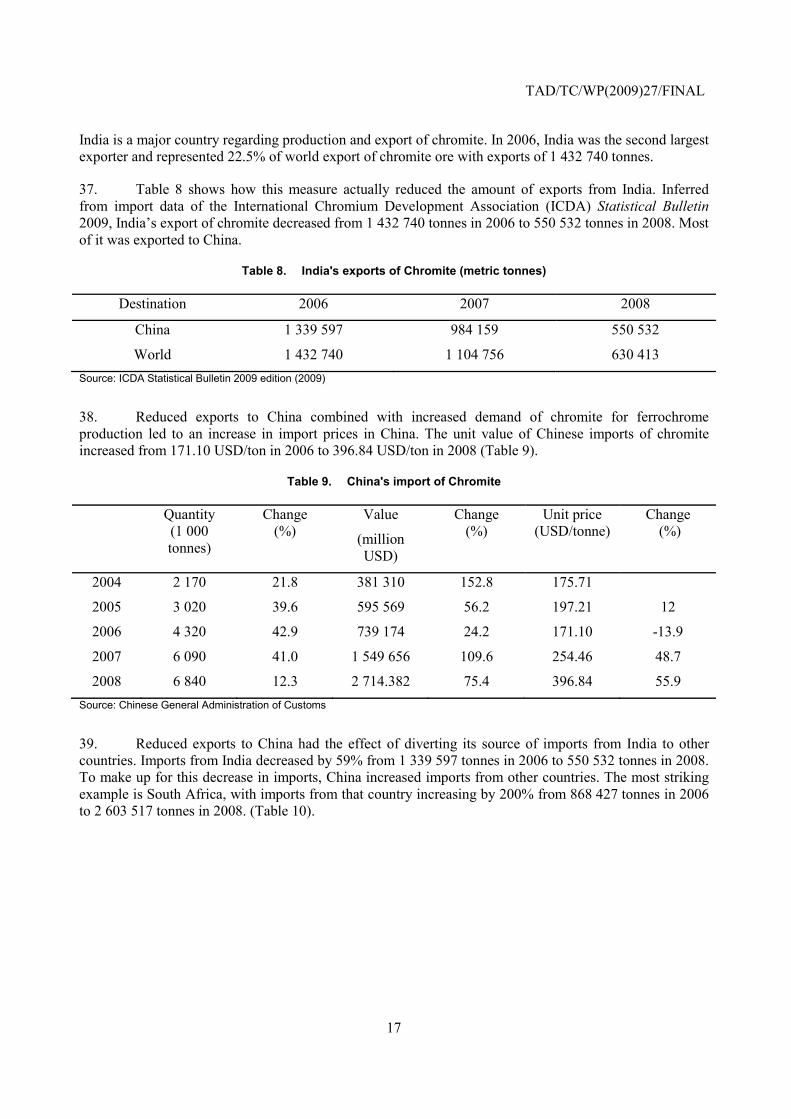
Molybdenum .......................................................................................................................................... 13 Chromium .............................................................................................................................................. 15 Rare Earths ............................................................................................................................................ 19
Conclusion ................................................................................................................................................. 22
BIBLIOGRAPHY ......................................................................................................................................... 24
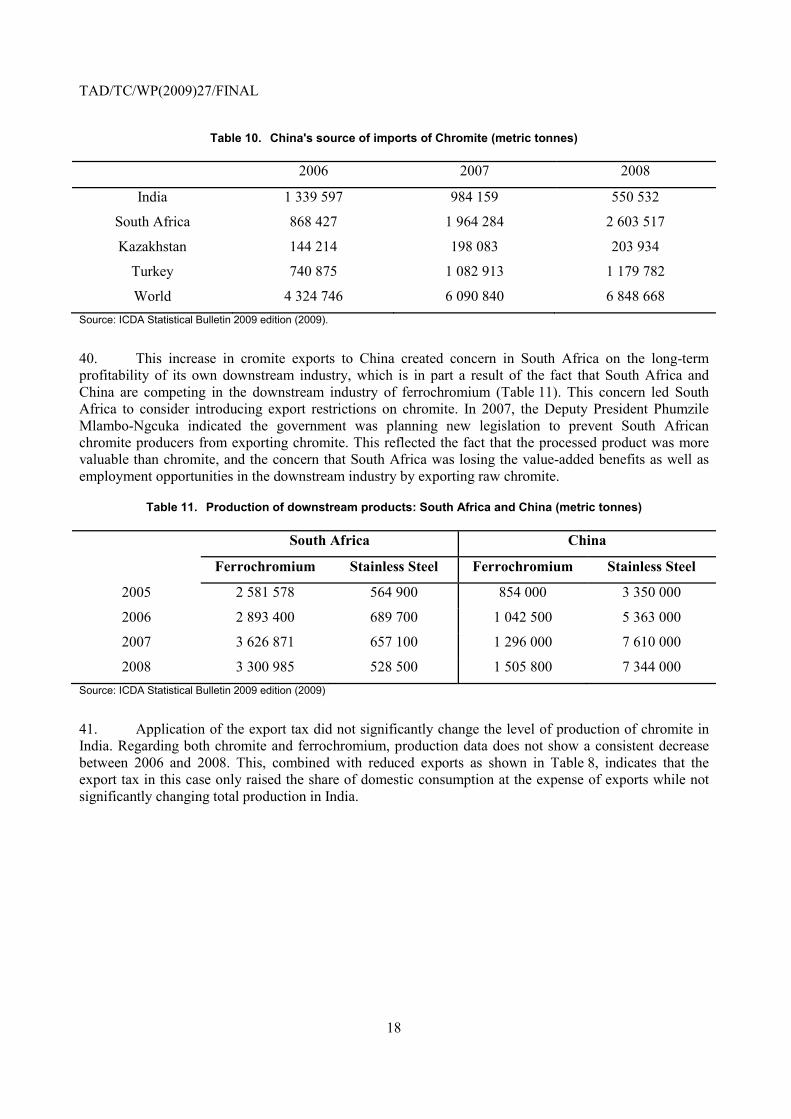
Appendix 1. Known Export Restrictions On Strategic Metals And Minerals ............................................. 25
Tables
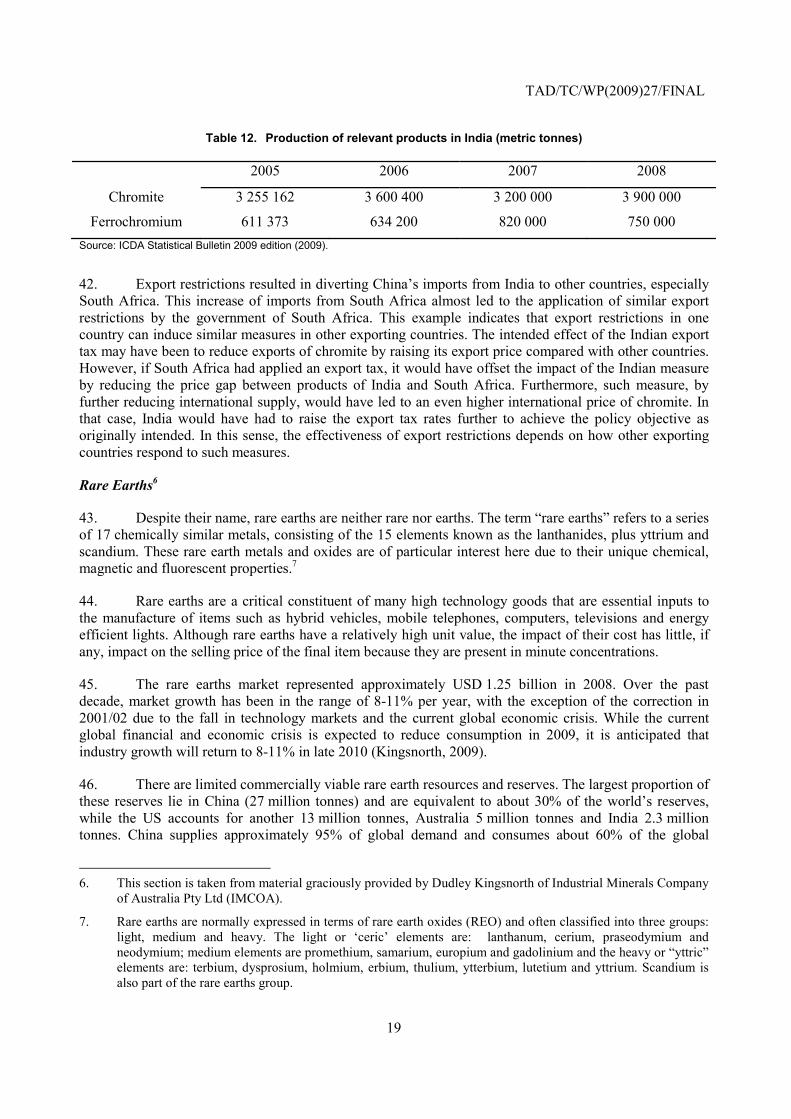
Table 1. Main uses of strategic metals and minerals ................................................................................... 8 Table 2. Top three producing countries for selected metallic minerals ...................................................... 9 Table 3. Reserve base of strategic metallic minerals ................................................................................ 10 Table 4. Chromite production and reserves ............................................................................................... 15 Table 5. Chromite ore and concentrates production by end use sectors ................................................... 16 Table 6. Chromite imports by country (metric tonnes .............................................................................. 16 Table 7. Production by country: Chromite and Ferrochromium (2008, metric tonnes ............................. 16 Table 8. India's exports of Chromite (metric tonnes ................................................................................. 17 Table 9. China's import of Chromite ......................................................................................................... 17 Table 10. China's source of imports of Chromite (metric tonnes .............................................................. 18 Table 11. Production of downstream products: South Africa and China (metric tonnes .......................... 18 Table 12. Production of relevant products in India (metric tonnes ........................................................... 19 Table 13. Chinese Rare Earth Export Quotas ............................................................................................ 21
Figures
Figures 1-4. Exports of molybdenum and products, China ....................................................................... 14 Figure 5. Molybdenum Production, China ................................................................................................ 15
Boxes
Box 1. Other legislation that regulates the mining industry The case of the Platinum mining industry in South Africa .............................................................................................................................................. 12
TAD/TC/WP(2009)27/FINAL
4
EXECUTIVE SUMMARY
This paper examines the presence and impact on trade and global supply of export restrictions applied to selected metals and minerals. Export restrictions come in a variety of forms. They include quantitative restrictions (quotas), export taxes, duties and charges and mandatory minimum export prices. In so far as they can affect export volumes, the reduction of VAT rebates as well as stringent export licensing requirements may also be considered forms of export restrictions.
The strategic metals and minerals selected for this study have a number of shared characteristics which in turn determine their impact. Their exploitable mineral reserves are generally found in one or a few geographical regions of the world implying that their potential mining and export are concentrated in a few countries. For most of these strategic raw materials, the top three producing countries account for over half of world production. In some cases, production is so concentrated that over half of world production occurs in a single country. This in turn leads to a dependence on such imports by countries that consume these materials or the finished goods produced from them. It also suggests that countries producing these raw materials may influence their prices and quantities made available on world markets.
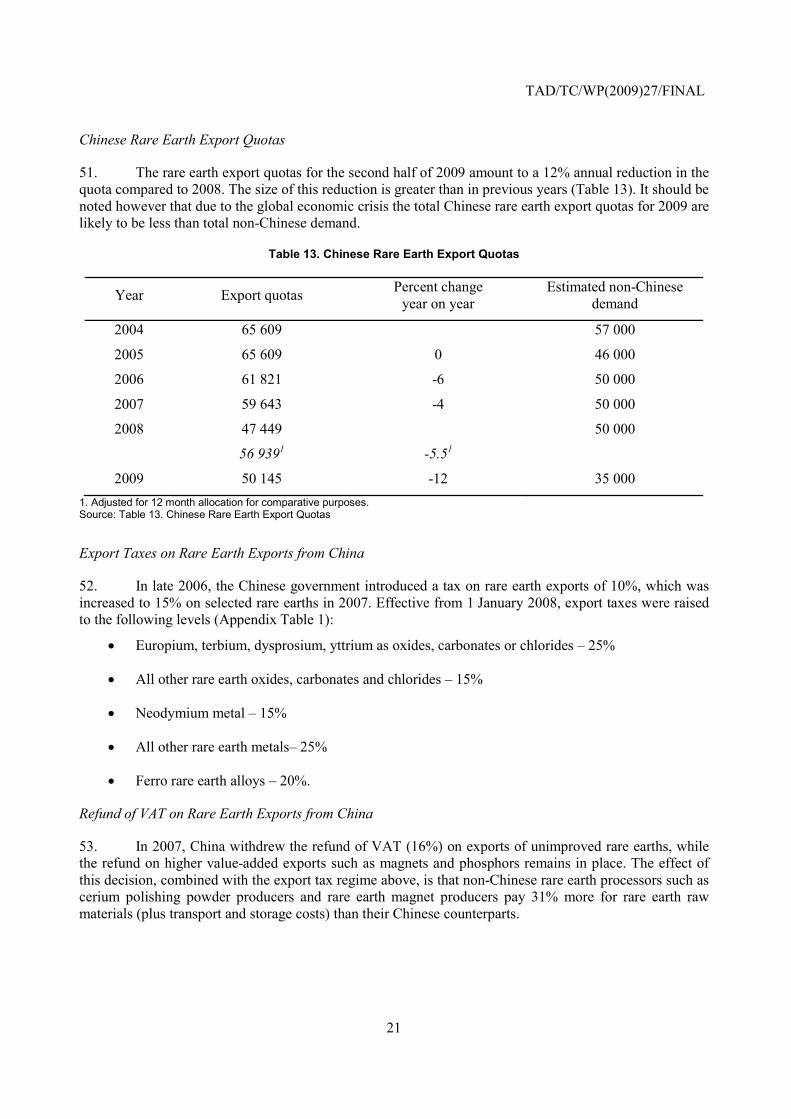
The metals and minerals in this study are generally used as inputs into high-technology or strategic sectors. Although often needed only in small quantities, these metals are increasingly essential to the development of technologically sophisticated products. They play a critical role in the development of innovative “environmental technologies” to boost energy efficiency and reduce greenhouse gas emissions. Hydrogen-fuel based cars, for example, require platinum-based catalysts; electric-hybrid cars need lithium batteries; and rhenium super alloys are an indispensible input for modern aircraft production. In addition, there are few substitutes available in the short-term for these raw materials.
There is no formal mechanism, such as within the WTO, for reporting export restrictions and taxes in the international domain. One of the aims of this study is to gather as much information as possible on the export restrictions that are applied on the metals and minerals examined here.
Export restrictions are applied to many of the metals and minerals under examination. Three case studies illustrate their impacts on exports and on global supply. A number of insights regarding the impact of export restrictions can be gleaned from these case studies:
• Many export restrictions are put into place for environmental reasons or to preserve natural resources. In order for them to satisfy this objective, however, they must result in lower production levels. In one case study, molybdenum, it can be seen that this was not the outcome of the imposition of export restrictions.
• In other cases, export restrictions are imposed in order to encourage supply of raw materials to domestic producers of downstream semi-processed goods. As many of these raw materials are produced in a limited number of countries, export restrictions that are imposed in one country may motivate other countries to follow if importers massively move to buy their raw materials. The restrictions imposed by the first country then lose their effectiveness. This can in principle lead to a situation of competitive policy practices – and of higher and higher export taxes. This risk was apparent in one of the cases under examination, namely exports of chromite.
TAD/TC/WP(2009)27/FINAL
5
• Export restrictions can impact potential investments in mining facilities worldwide. In the case of rare earths, the possibility of export restrictions being imposed makes industry participants assess the risk in the industry differently. Investments in the mining industry, which are necessarily long-term and require large amounts of capital and know-how, may be affected by the possibility of sharp changes in world prices either due to the imposition of export restrictions or to their sudden removal.
• Several objectives motivate implementing export restrictions on strategic raw materials. In some cases, these can be understood as a response to market imperfections. The question remains, however, whether export restrictions are the most effective tool to achieve the desired outcomes. Possible future work in this area could include comparing different types of policy measures with a view to identifying the trade-offs that they engender.
TAD/TC/WP(2009)27/FINAL
6
EXPORT RESTRICTIONS ON STRATEGIC RAW MATERIALS AND THEIR IMPACT ON TRADE AND GLOBAL SUPPLY
1. This paper seeks to shed light on the presence and impact of export restrictions on selected metals and minerals. Export restrictions usually take the form of quantitative restrictions or taxes imposed by the exporting country. In general, export restrictions are not notified to any international body and there is therefore no comprehensive list of such measures that one can refer to. Nor are such restrictions per se included in WTO disciplines, although Article XI of the GATT does stipulate there is a general prohibition on quantitative restrictions.1 A notable exception, however, exists for reasons that relate to the “conservation of exhaustible natural resources if such measures are made effective in conjunction with restrictions on domestic production or consumption” (Article XX, GATT).
2. The strategic metals and minerals selected for this study have a number of shared characteristics. First, the exploitable mineral reserves are generally found in one or a few geographical regions of the world implying that their potential mining and export are concentrated in a few countries. This in turn leads to a dependence on such imports by countries that consume these materials or the finished goods produced from them. It also suggests that producing countries may control the prices and quantities of the raw materials made available on world markets. Second, the strategic minerals and metals covered in this study are generally used as inputs into high-technology or strategic sectors; many are used in the development of environmental technologies. Third, there are few substitutes available in the short-term for these raw materials. Although generally used in small quantities, they are often essential for the development of technologically sophisticated products.
3. The raw materials covered in this analysis do not necessarily satisfy all of the above criteria, but can be viewed as representative of materials which share several common characteristics. Due to the specific nature of these characteristics, export restrictions on these raw materials result in economic impacts which can be distinguished from those of other products.
4. Many of the strategic metals and minerals are inputs into products in fast-changing markets. Technological change often brings sharp changes in demand, which, in turn, may lead to strong price volatility. An example is the tantalum capacitor industry. Two-thirds of world tantalum production is used in electronic components. When the tantalum price increased sharply in the late 1990s, the electronics industry encouraged capacitor designers to improve their niobium capacitors and multiple ceramics capacitors in order to replace the tantalum components. The demand for tantalum, and its price, fell sharply as a result.
5. The global economic crisis has weakened demand for many strategic metals and minerals since mid-2008. In the case of some metals and minerals examined here, however, the fall came earlier – in late 2007 or early 2008. This was due to some over-buying by China, in particular, and over-optimistic forecasts of growth more generally by raw materials producers and consumers.
1. “… no prohibitions of restrictions other than duties, taxes or other charges, whether made effective through
quotas, import or export licences or other measures, shall be instituted or maintained by any contracting party on the importation … or on the exportation or sale or export of any product destined for the territory of any other contracting party” (Article XI, GATT 1994).
TAD/TC/WP(2009)27/FINAL
7
6. This study takes a medium-term view. In many OECD countries, the geological structures are well known. Prospecting activity continues, however, in some OECD countries – one example being Canada.2 There are new mining possibilities in some areas where past prospecting has been patchy, for example, Mongolia. Since the time span between prospecting and actual extraction of minerals can sometimes be measured in decades, some industry investments are necessarily long-term. Known reserves of the minerals examined here are included in this report, but in principle these may change in the longer term.
7. In some cases export restrictions may be introduced in the pursuit of macro-economic objectives. For example, fiscal revenues or broad development objectives may underlie export restrictions in specific sectors. Although the general economic context in which export restrictions are introduced is important, it is beyond the scope of this paper which focuses on the specific sectoral and product impacts of export-restricting policies.
8. This study begins by outlining the specific nature of the selected minerals and metals examined here: their uses, and where production and reserves are found. The presence of export restrictions on these products is then examined. Three case studies of the impact of export restrictions in different raw materials – molybdenum, chromium and rare earths – shed some light on potential global effects on producers and consumers of the raw materials and their downstream products. A concluding section offers general insights and questions the use of export restrictions from efficiency and a policy perspective.
Uses of selected metals and minerals
9. The metals and minerals under study here are generally used as inputs into high-technology or strategic sectors (Table 1). Although often needed only in small quantities, these metals are increasingly essential to the development of technologically sophisticated products. They play a critical role in the development of innovative “environmental technologies” to boost energy efficiency and reduce greenhouse gas emissions. Hydrogen-fuel based cars, for example, require platinum-based catalysts; electric-hybrid cars need lithium batteries; and rhenium super alloys are an indispensible input for modern aircraft production. The European Commission has stated that the EU will not master the shift towards sustainable production and environmentally friendly products without such metals (EC, 2008).
10. Many of the metals under study here are also used in sectors such as semi-conductors. The semi-conductor industry is dominated by Chinese Taipei, South Korea, United States, and Japan. The role of the semi-conductor industry is one of a technology enabler: the semiconductor industry is widely recognized as a key driver for economic growth throughout the electronics value chain. The semiconductor market represented USD 213 billion in 2004 and the industry was one enabling factor in the generation of USD 1 200 billion in electronic systems business and USD 5 000 billion in services, representing close to 10% of world GDP that year. The semi-conductor industry is also a high-growth industry, experiencing 13% growth on average per annum over the last 20 years.3
11. Many of the metals studied in this paper are also combined with steel to create alloys with particular properties – withstanding friction or heat for example – and are therefore necessary inputs into the automotive and airplane industries. All countries with major automobile or aircraft industries (e.g. Brazil, China, European Union, India, Japan, Korea, United States) are therefore users of some of the strategic metals examined here.
2. “If there are known deposits in an area, it is best to look next door” for further potential reserves, indicated one
mining industry specialist.
3. www.semi.org
TAD/TC/WP(2009)27/FINAL
8
12. Lithium is one of the strategic raw materials that has become an important component in hybrid vehicles. Lithium compounds are used in batteries, especially rechargeable batteries. Several major automobile companies are pursuing the development of lithium batteries for hybrid electric vehicles — vehicles with an internal combustion engine and a battery-powered electric motor. Demand for rechargeable lithium batteries has also continued to grow for use in cordless tools, portable computers and telephones, and video cameras. Non-rechargeable lithium batteries are used in calculators, cameras, computers, electronic games, watches, and other devices.
Table 1. Main uses of strategic metals and minerals Antimony Batteries ; antifriction alloys ; medicines, antiprotozoan drugs, small arms, buckshot, and tracer ammunition;
matches
Chromium Jet engines and gas turbines ; cookware and cutlery ; magnetic tape used in high performance audio tape ; high temperature refractory applications, like blast furnaces, cement kilns
Cobalt Used in surgical instruments and hard metals for cutting tools and drills used in metal-working and mining industries; prosthetic parts such as hip and knee replacements ; batteries ; adhesion of the steel to rubber in steel-belted radial tires
Copper Piping, electrical applications, construction industry and household uses
Gallium Semiconductor use is now the primary industrial market for gallium, but new uses in alloys and fuel cells continue to be discovered.
Germanium Semiconductor material used in transistors and various other electronic devices. Its major end uses are fiber-optic systems and infrared optics, but it is also used for polymerization catalysts, in electronics and in solar electric applications.
Indium Liquid crystal displays (LCD) for televisions used for the manufacture of thin film solar cells Used in light-emitting diodes (LEDs) and Laser Diodes (LDs)
Lithium Electric and hybrid car batteries
Manganese Standard and alkaline disposable dry cells and batteries ; stainless steels ; aluminum alloys (ex. Beverage cans)
Molybdenum Missile and aircraft parts; valuable catalyst in petroleum refining ; filament material in electrical applications alloying agent for ultra-high strength steels
Nickel Many industrial and consumer products, including stainless steel, magnets, coinage, rechargeable batteries and special alloys
Platinum, palladium
Jewelry, laboratory equipment, resistant thermometers, dentistry, catalytic converters ; many electronics including computers, mobile phones, multi-layer ceramic capacitors, component plating, low voltage electrical contacts, and SED/OLED/LCD televisions ; fuel cells
Rare Earths1 Automobiles, including hybrid vehicles, air conditioners, wind power generators, fluorescent lights, plasma screens, portable computers, hand-held electronic devices
Rhenium2 Jet engine parts, platinum-rhenium catalysts, which are primarily used in making lead-free, high-octane gasoline.
Silicon Power transistors ; the development of integrated circuits such as computer chips as well as in construction industry as a principal constituent of natural stone, glass, concrete and cement
Silver Jewelry, high-value tableware, utensils, and currency coins, electrical contacts and conductors, mirrors and in catalysis of chemical reactions. Its compounds are used in photographic film.
Tantalum Electronic components, mainly capacitors and some high-power resistors ; tools for metalworking equipment and in the production of superalloys for jet engine components, chemical process equipment, nuclear reactors, and missile parts.
Titanium Strong lightweight alloys for aerospace (jet engines, missiles, and spacecraft), military, industrial process (chemicals and petro-chemicals, desalination plants, pulp, and paper), automotive, agri-food, medical prostheses, orthopedic implants, dental and endodontic instruments and files, dental implants, sporting goods, jewelry, mobile phones, and other applications
Tungsten Light bulb filaments, television tubes, X-ray tubes (as both the filament and target), superalloys, and hard metals for cutting tools and drills used in metal-working and mining industries.
Vanadium High speed tool steels used in surgical instruments and tools
1. Rare earth elements or rare earth metals are a collection of 17 chemical elements in the periodic table, namely scandium, yttrium, and the fifteen lanthanoids. 2. Obtained as a by-product of molybdenum and copper refinement
TAD/TC/WP(2009)27/FINAL
9
Main producers and reserves of strategic metals and minerals
13. Many of the strategic metals and minerals used in such industries as electronics, alternative energies, energy storage and conservation, specialised tool making and the automotive and aircraft industries are produced in a small number of countries. For most of these strategic raw materials, the top three producing countries account for over half of world production (Table 2). For some raw materials, close to the entire world production takes place in the top three mining regions. This is the case for rare earths, where 99.7% of world production occurs in the top three producing countries, and for vanadium (98%), antimony (95%), platinum (93%), and gallium and germanium, where all of world production occurs in two or three countries. Notable exceptions in the metallic minerals covered by this project are silver (where 44% of world production occurs in the top three producing countries) and nickel (47%).
14. In some cases, production is so concentrated that over half of world production occurs in a single country. This is the case for China as regards rare earths, antimony, tungsten, indium, silicon, gallium and germanium, South Africa as regards platinum and Australia as regards tantalum.
Table 2. Top three producing countries for selected metallic minerals
Metal First Second Third Cum. % Gallium2 China 83.00% Japan 17.00% -- 100.00%Germanium1 China 79.00% USA 14.00% Russia 7.00% 100.00%Rare Earths China 96.99% India 2.18% Brazil 0.53% 99.69% Vanadium South Africa 38.33% China 33.33% Russia 26.67% 98.33%Antimony2 China 91.19% Bolivia 2.13% South Africa 1.82% 95.14% Platinum South Africa 76.61% Russia 12.52% Canada 3.61% 92.74%Palladium Russia 42.80% South Africa 38.91% Canada 6.08% 87.79% Tungsten2 China 75.09% Russia 5.86% Canada 4.76% 85.71%Tantalum Australia 53.37% Brazil 22.09% Rwanda 9.45% 84.91%Lithium2 Chile 43.86% Australia 25.22% China 12.79% 81.87% Molybdenum USA 28.97% China 28.21% Chile 21.23% 78.41% Indium China 58.10% Japan 10.56% Korea 8.80% 77.46% Chromium2 South Africa 44.65% Kazakhstan 17.21% India 15.35% 77.21%Rhenium Chile 48.68% Kazakhstan 14.11% USA 13.58% 76.37%Silicon China 57.85% Russia 11.22% Brazil 4.73% 73.81% Cobalt Congo 44.57% Canada 11.56% Zambia 10.86% 66.99%Manganese South Africa 21.66% China 20.22% Australia 15.88% 57.76% Titanium Australia 22.17% South Africa 19.34% Canada 15.97% 57.48%Copper Chile 35.62% USA 8.33% Peru 7.76% 51.72% Nickel Russia 17.47% Canada 15.82% Indonesia 13.35% 46.64%Silver Peru 17.23% Mexico 14.36% China 12.45% 44.04%
1 Source: World Mining Data (2008). 2 USA production data withheld from world total by USGS to “avoid disclosing proprietary data”. Source: USGS (2009).
15. Although production of some strategic metallic minerals is very concentrated, this does not necessarily suggest that future production will be similarly geographically restrained. In order to determine future production possibilities, the reserve base must be examined. The reserve base includes all known deposits of the metallic minerals, whether or not they are actually mined, including deposits that are not economically viable given present technologies, prices and production strategies.
TAD/TC/WP(2009)27/FINAL
10
16. The future production situation is mixed. For some strategic metallic minerals, the reserve base is more geographically concentrated than the present production. For others, the raw materials are more widely dispersed (Table 3). In the case of some of the most concentrated raw materials under examination, particularly those largely found in China, such as rare earths, vanadium and antimony, the future reserves are less concentrated than present production would suggest. For others, however, such as platinum group metals and manganese, the largest quantities of which are found in South Africa, the concentration of reserves is significantly higher than that of present production.
17. In some cases, the country with the most important reserves is not presently among the top producers. This is the case for lithium in Bolivia, titanium in the United States, and silver in Poland. In these cases, mining may not be economically viable given present prices and technologies, or sufficient investments have not been undertaken to exploit the natural resources or get them efficiently to market.
Table 3. Reserve base of strategic metallic minerals
Mineral First Second Third Cum. %
Chromium Kazakhstan 48.11% South Africa 40.09% India 11.76% 99.96%
Platinum3 South Africa 87.68% Russia 8.27% USA 2.51% 98.46%
Tantalum Brazil 50.00% Australia 46.67% Canada 1.67% 98.33%
Manganese South Africa 78.66% Ukraine 10.23% Australia 3.15% 92.04%
Vanadium China 36.84% South Africa 31.58% Russia 18.42% 86.84%
Molybdenum China 43.57% USA 28.35% Chile 13.12% 85.04%
Rhenium USA 44.20% Chile 24.56% Canada 14.73% 83.50%
Lithium Bolivia 47.26% Chile 26.25% China 9.63% 83.14%
Tungsten China 66.96% Canada 7.81% Russia 6.70% 81.47%
Rare Earths China 57.71% CIS 13.62% USA 9.10% 80.43%
Antimony China 55.68% Thailand 10.44% Russia 8.58% 74.70%
Indium1 China 62.34% Peru 3.62% Canada 3.49% 69.45%
Cobalt Congo 36.13% Australia 13.84% Cuba 13.84% 63.81%
Silver Poland 24.60% China 21.09% USA 14.06% 59.75%
Titanium2 USA 29.90% China 17.04% Germany 8.33% 55.27%
Copper Chile 36.04% Peru 12.01% USA 7.01% 55.06%
Nickel Australia 19.34% Cuba 15.34% Canada 10.00% 44.68% Note: Reserves data omitted for Germanium, as USGS reserves data for Germanium available only for USA reserves. Data for gallium reserves also omitted due to unavailability. According to USGS, “Most gallium is produced as a byproduct of treating bauxite, and the remainder is produced from zinc-processing residues. Only part of the gallium present in bauxite and zinc ores is recoverable, and the factors controlling the recovery are proprietary. Therefore, an estimate of current reserves that is comparable to the definition of reserves of other minerals cannot be made. The world bauxite reserve base is so large that much of it will not be mined for many decades; hence, most of the gallium in the bauxite reserve base cannot be considered to be available in the short term.”(USGS, 2009) Silicon reserves estimates unavailable, as “the reserve base in most major producing countries are ample in relation to demand. Quantitative estimates are not available.” (USGS, 2009) 1. Source: USGS (2008) 2. Titanium ilmenite 3. Platinum data consists of data concerning platinum metals group: platinum, palladium, rhodium, ruthenium, iridium, osmium. Source: USGS (2009).
TAD/TC/WP(2009)27/FINAL
11
Presence of export restrictions
18. There is no formal mechanism, such as within the WTO, for reporting export restrictions and export taxes in the international domain. Export restrictions and taxes are therefore made known by a variety of ways and differ by country. One of the aims of this study is to gather as much information as possible on the export restrictions that are applied on the metals and minerals examined here. Some of this information has been gathered from different national geological services. Other sources include reports in the specialized industry press and on specialized websites, the few articles that have been written on this issue, statements by importing countries, data from private firms, and a survey of known export restrictions by OECD members and selected non-members. The information included here regarding the presence of export restrictions on the 21 metals and minerals covered by this study can therefore only be considered as indicative.
19. Export restrictions come in a variety of forms. They include quantitative export restrictions (quotas), export taxes, duties and charges and mandatory minimum export prices. In so far as they can affect export volumes, the reduction of VAT rebates as well as stringent export licensing requirements may also be considered forms of export restrictions. One of the most used forms of export restrictions is export taxes or duties. Export taxes can take the form of an ad valorem tax, specified as a percentage of the value of the product, or as a specific tax specified as a specific amount to be paid per unit or per weight of a given product. Export quotas are restrictions or ceilings imposed by an exporting country on the total volume of specified products. Export licensing requirements regulate which exporters can effectively sell their products abroad. In the case where licensing requirements are particularly stringent, procedures are complex or costly, or the number of exporters accorded licenses is small, license requirements may affect the volume of exports. Another less obvious form of export restriction is the reduction of VAT rebates. If, in a given country, exporters receive a full rebate on VAT for their traded products, with the exception of some targeted products, the volume of exports of those products may be affected. Producers may choose to supply more products to domestic markets and export products that are further downstream (or upstream) in the production chain so as not to be penalized for exporting non-rebated products.
20. Export restrictions of all kinds exist among major exporters of the 21 metals and minerals under study. Appendix Table 1 lists all known export restrictions applied to the products examined here. Quantitative restrictions can be found on 13 of the 21 metals and minerals in at least one exporting country in at least one year since the late 1990s. Export taxes ranging from 3% to 30% are levied on some of the 21 metals and minerals. Some export taxes are combined tax rates, which imply an ad valorem rate, with a maximum or minimum rate per unit or unit of weight of the exported good. Tungsten waste and scrap exported from Ukraine, for example, is subjected to a tax of 30% but not less than 10€/kg.
21. In some cases, non-automatic export licensing is used. Although non-automatic export licensing is not a restriction in itself, if the licenses are granted in a stringent or non-transparent fashion, export volumes may be affected. There are many types of legislation other than export taxes and restrictions that significantly impact the mining industry. These may include licensing for mining, prospecting and exploration, production quotas and taxes, and the complex issue of mining rights. A case in point is the mining of the platinum group metals in South Africa which is not subject to export restrictions and taxes, but is regulated through other mechanisms (Box 1).
TAD/TC/WP(2009)27/FINAL
12
Box 1. Other legislation that regulates the mining industry The case of the Platinum mining industry in South Africa
At present, the platinum mining industry in South Africa falls under three key pieces of legislation: the Mineral and Petroleum Resources Development Act 2002 (and subsequent Mineral and Petroleum Resources Development Amendment Bill, 2007), the Mineral and Petroleum Royalty Bill 2008, and the Precious Metals Act 2005.
The Mineral and Petroleum Resources Development Act encompasses the Mining Charter. This sets out the rules governing the application for, and issue or transfer of mining rights in South Africa. It includes statutory provisions for Black Economic Empowerment and the increased participation of historically disadvantaged South Africans in the mining industry.
The Mineral and Petroleum Royalty Bill (final draft released in June 2008) introduces royalties on platinum group metals production as well as other commodities. The royalty rate that applies to a particular company is calculated using a formula based on earnings before interest and tax. The royalties were due to be applied from 1 May 2009 but have been postponed until 1 March 2010. The effective rate on refined platinum is likely to be around 2.7%.
The Precious Metals Act makes a number of stipulations about the development, local beneficiation (smelting, refining, etc.) and sale of precious metals. Permits are required to refine and export precious metals. The written approval of the relevant Minister is required for the export of any unwrought or semi-fabricated precious metal.
So whilst there are no specific export duties or quantitative restrictions imposed on exports of platinum group metals from South Africa, there are a number of legislative provisions that might be viewed as restrictions on exports. Any impact on trade flows is indirect and therefore difficult to ascertain.
Source: South African Department of Minerals and Energy; South African Chamber of Mines. www.bullion.org.za.
22. A large number of quantitative export restrictions or high export taxes exist in some countries on “waste and scrap” of the selected metals examined in this paper. This may be partly due to the difficulties in verifying the purity of the contents or their origin. An industry specialist indicated that there have been cases in which exports of some metals that have been declared “waste and scrap” are actually closer to a purity that could be classified as powder or unwrought metal, for the purposes of avoiding import duties or due to licensing issues. A government official of one country which imposes export restrictions and taxes on waste and scrap indicated that it was due to difficulties in determining the origin of the materials: “it is to avoid individuals pulling up railroad ties” and other articles made from the metals.4
Policy objectives of export restrictions
23. Export restrictions are used by policymakers to respond to a number of social, economic and political objectives. These include objectives such as environmental protection and promotion of downstream industries, revenue maximization, and preservation of reserves for future use. Export restrictions are therefore sometimes in place in sectors where global reserves are sufficient to respond to demand but reserves in the specific country applying the measure are not.
24. Environmental protection is among the most frequently cited policy objective of export restrictions. The mining or processing procedures can be either highly energy consuming or polluting. In some cases, export taxes on relevant products are applied to make it less profitable to maintain mining or processing facilities, and thereby aim to reduce production.
25. Another consideration for policymakers implementing export restrictions is the promotion of downstream processing industries. This can occur when foreign demand raises the price of raw materials, which may be too high for the domestic downstream industry. Policymakers may also resort to using export restrictions in the case when processed products generate a higher value-added than raw materials used for those products.
4. Russian government official presentation at the OECD Workshop on Raw Materials, 30 October 2009.
TAD/TC/WP(2009)27/FINAL
13
Impact of export restrictions on selected strategic minerals, metals and their products
26. Export restrictions and taxes exist on a number of products in a number of countries (Appendix Table 1). A few of these have been selected for more detailed review to ascertain whether or not the presence of export restrictions has impacted trade and production levels and, if so, in what ways. In this section, the impact of export restrictions in molybdenum and rare earths in China will be examined, as well as the impact of those on chromium in India.
Molybdenum
27. According to available information, China placed an export tax of 10% on molybdenum concentrates and oxides and ferromolybdenum and a 15% tax on molybdenum powder, unwrought molybdenum and scrap on 1 January 2007. This tax was raised to 20% on exports of ferromolybdenum in 2008. In mid-2007, an export licensing system was implemented raising the level of criteria for potential exporters of molybdenum and its products. On 1 July 2007, the VAT rebate was rescinded on molybdenum hydroxides and reduced to 5% on more processed molybdenum products. In 2007, an export quota was also placed on molybdenum and its level was further reduced in 2008.
28. The rationale given by the Chinese government for the imposition of the export restrictions measure was for environmental reasons (residue from the mining industry, for example, and excessive use of energy to process products of the extractive industries) and for reasons of preservation of natural resources. China holds 44% of known worldwide reserves of molybdenum and is responsible for 28% of its production.
29. The recent export restrictions were implemented by the Chinese government in a different context than in the past. In 2000, the European Union suggested that Chinese suppliers of ferromolybdenum were involved in dumping practices and imposed an anti-dumping duty on imports of ferromolybdenum from China. (Molybdenum is not mined in the EU, but there is a processing industry). Chinese authorities responded in August 2001 by enforcing an export limit of 8 861 tonnes of ferromolybdenum to the European Union in order to relieve the impact of dumping duties.
30. Exports of ferromolybdenum by China fell in 2002 and stagnated in 2003 after an almost continuous climb from 1990 to2000 (Figure 1). This may have been due in part to the “voluntary” export restraint policy put into place by China vis-à-vis the European Union.
31. There is little evidence, however, that the export taxes and quotas on molybdenum and its products put into place in 2007 and 2008 have had a significant effect on exports. Exports of molybdenum ores and concentrates, oxides and ferro-molybdenum were falling in 2005 and 2006, i.e. prior to the implementation of export restrictions and taxes (Figures 1-3). On the other hand, exports of molybdenum articles, that have undergone further processing, increased sharply (by 120%) in 2007 despite the restrictions placed on them that year (Figure 4). Restrictions included a 15% export tax, a reduction in VAT rebate to 5%, and an export licensing system.
TAD/TC/WP(2009)27/FINAL
14
Figures 1-4. Exports of molybdenum and products, China
1. Ferro-molybdenum 2. Molybdenum ores and concentrates
3. Molybdenum oxides 4. Molybdenum articles
32. There is no evidence either that the export restrictions implemented in 2007 had the desired effect on production. In order to fulfil the stated policy objectives of environmental stability and preservation of natural resources, the export restrictions would have had to have resulted in a decrease in the production of molybdenum in China. This has not been the case as the production of molybdenum has risen continually since 2004 by approximately 30% per year (Figure 5). It is clear, therefore, that the measures that were introduced did not achieve their stated objectives.
TAD/TC/WP(2009)27/FINAL
15
Figure 5. Molybdenum Production, China
Chromium
33. The main producing countries of chromite ore and chromite concentrates are South Africa, India and Kazakhstan, representing 70% of 2008 world production as a whole (Table 4). According to USGS Mineral Commodity Summaries (2009), about 95% of the world’s chromite reserves are in Kazakhstan and South Africa.
Table 4. Chromite production and reserves
Country Mine production
Reserves Reserve base1 2007 2008
South Africa 8 720 330 9 267 848 77 000 000 150 000 000
India 3 320 000 3 900 000 21 000 000 44 000 000
Kazakhstan 3 687 200 3 629 000 6 100 000 180 000 000
World total 22 154 309 24 003 004 NA NA
1. Reserve base means that part of an identified resource that meets specified minimum physical and chemical criteria related to current mining and production practices. The reserve base includes those resources that are currently economic (reserves), marginally economic (marginal reserves), and some of those that are currently subeconomic (subeconomic resources). USGS Mineral Commodity Summaries (2009) Appendix C: A Resource/Reserve Classification for Minerals.
Source: ICDA Statistical Bulletin 2009 edition (2009), USGS Mineral Commodity Summaries (2009)
34. Over 90% of the world’s chromite production is converted into ferrochrome for metallurgical applications (Table 5). Most ferrochrome is used to produce stainless steel. Reflecting this industrial structure, chromite ore mines tend to be owned and operated by ferrochromium producers5.
5. See USGS 2006 Minerals Yearbook: Chromium
TAD/TC/WP(2009)27/FINAL
16
Table 5. Chromite ore and concentrates production by end use sectors (metric tonnes)
End Uses 2006 2007 2008
Metallurgical 17 722 856 20 755 861 22 684 810
Refractory 189 423 179 729 166 050
Chemical 671 856 530 642 485 577
Foundry sands 657 036 688 077 666 567
Total 19 241 171 22 154 309 24 003 004 Source: ICDA Statistical Bulletin 2009 edition (2009)
35. Around 30% of the chromite produced is consumed outside the producing countries, and China is by far the biggest importer. In 2008, it imported more than 6.8 million metric tonnes of chromite, or 70% of world imports that totalled around 9.6 million metric tonnes (Table 6). This is partially due to the fact that compared with its minor production of chromite, China is a major producer of ferrochromium. Although China’s share of world chromite production was around 1% (220 000 tonnes) in 2008, that same year its ferrochromium production share was 19%, or 1 505 800 tons (Table 7).
Table 6. Chromite imports by country (metric tonnes)
Country 2006 2007 2008
China 4 324 746 6 090 840 6 848 668
Russia 898 230 989 405 1 112 028
Sweden 315 000 350 000 337 933
World Total 6 437 106 8 561 252 9 673 335 Source: ICDA Statistical Bulletin 2009 edition (2009).
Table 7. Production by country: Chromite and Ferrochromium (2008, metric tonnes)
Country Chromite ore and concentrates Ferrochromium
South Africa 9 267 848 3 300 985
India 3 900 000 750 000
Kazakhstan 3 629 000 1 027 387
Turkey 1 885 712 75.840
China 220 000 1 505 800
Total 24 003 004 7 906 553 Source: ICDA Statistical Bulletin 2009 edition (2009).
36. In March 2007, India imposed an export tax of INR 2 000/tonne on chromite in order to provide a greater supply of this mineral to the domestic market. Although demand for chromite has increased in India, higher demand from foreign countries, especially China, made it more attractive to export the products than to supply the domestic market. The downstream industry in India producing ferrochrome had difficulty paying the high price of chromite. The export tax was raised to INR 3 000/tonne in April 2008.
TAD/TC/WP(2009)27/FINAL
17
India is a major country regarding production and export of chromite. In 2006, India was the second largest exporter and represented 22.5% of world export of chromite ore with exports of 1 432 740 tonnes.
37. Table 8 shows how this measure actually reduced the amount of exports from India. Inferred from import data of the International Chromium Development Association (ICDA) Statistical Bulletin 2009, India’s export of chromite decreased from 1 432 740 tonnes in 2006 to 550 532 tonnes in 2008. Most of it was exported to China.
Table 8. India's exports of Chromite (metric tonnes)
Destination 2006 2007 2008
China 1 339 597 984 159 550 532
World 1 432 740 1 104 756 630 413 Source: ICDA Statistical Bulletin 2009 edition (2009)
38. Reduced exports to China combined with increased demand of chromite for ferrochrome production led to an increase in import prices in China. The unit value of Chinese imports of chromite increased from 171.10 USD/ton in 2006 to 396.84 USD/ton in 2008 (Table 9).
Table 9. China's import of Chromite
Quantity (1 000 tonnes)
Change (%)
Value
(million USD)
Change (%)
Unit price (USD/tonne)
Change (%)
2004 2 170 21.8 381 310 152.8 175.71
2005 3 020 39.6 595 569 56.2 197.21 12
2006 4 320 42.9 739 174 24.2 171.10 -13.9
2007 6 090 41.0 1 549 656 109.6 254.46 48.7
2008 6 840 12.3 2 714.382 75.4 396.84 55.9 Source: Chinese General Administration of Customs
39. Reduced exports to China had the effect of diverting its source of imports from India to other countries. Imports from India decreased by 59% from 1 339 597 tonnes in 2006 to 550 532 tonnes in 2008. To make up for this decrease in imports, China increased imports from other countries. The most striking example is South Africa, with imports from that country increasing by 200% from 868 427 tonnes in 2006 to 2 603 517 tonnes in 2008. (Table 10).
TAD/TC/WP(2009)27/FINAL
18
Table 10. China's source of imports of Chromite (metric tonnes)
2006 2007 2008
India 1 339 597 984 159 550 532
South Africa 868 427 1 964 284 2 603 517
Kazakhstan 144 214 198 083 203 934
Turkey 740 875 1 082 913 1 179 782
World 4 324 746 6 090 840 6 848 668 Source: ICDA Statistical Bulletin 2009 edition (2009).
40. This increase in cromite exports to China created concern in South Africa on the long-term profitability of its own downstream industry, which is in part a result of the fact that South Africa and China are competing in the downstream industry of ferrochromium (Table 11). This concern led South Africa to consider introducing export restrictions on chromite. In 2007, the Deputy President Phumzile Mlambo-Ngcuka indicated the government was planning new legislation to prevent South African chromite producers from exporting chromite. This reflected the fact that the processed product was more valuable than chromite, and the concern that South Africa was losing the value-added benefits as well as employment opportunities in the downstream industry by exporting raw chromite.
Table 11. Production of downstream products: South Africa and China (metric tonnes)
South Africa China
Ferrochromium Stainless Steel Ferrochromium Stainless Steel
2005 2 581 578 564 900 854 000 3 350 000
2006 2 893 400 689 700 1 042 500 5 363 000
2007 3 626 871 657 100 1 296 000 7 610 000
2008 3 300 985 528 500 1 505 800 7 344 000 Source: ICDA Statistical Bulletin 2009 edition (2009)
41. Application of the export tax did not significantly change the level of production of chromite in India. Regarding both chromite and ferrochromium, production data does not show a consistent decrease between 2006 and 2008. This, combined with reduced exports as shown in Table 8, indicates that the export tax in this case only raised the share of domestic consumption at the expense of exports while not significantly changing total production in India.
TAD/TC/WP(2009)27/FINAL
19
Table 12. Production of relevant products in India (metric tonnes)
2005 2006 2007 2008
Chromite 3 255 162 3 600 400 3 200 000 3 900 000
Ferrochromium 611 373 634 200 820 000 750 000 Source: ICDA Statistical Bulletin 2009 edition (2009).
42. Export restrictions resulted in diverting China’s imports from India to other countries, especially South Africa. This increase of imports from South Africa almost led to the application of similar export restrictions by the government of South Africa. This example indicates that export restrictions in one country can induce similar measures in other exporting countries. The intended effect of the Indian export tax may have been to reduce exports of chromite by raising its export price compared with other countries. However, if South Africa had applied an export tax, it would have offset the impact of the Indian measure by reducing the price gap between products of India and South Africa. Furthermore, such measure, by further reducing international supply, would have led to an even higher international price of chromite. In that case, India would have had to raise the export tax rates further to achieve the policy objective as originally intended. In this sense, the effectiveness of export restrictions depends on how other exporting countries respond to such measures.
Rare Earths6
43. Despite their name, rare earths are neither rare nor earths. The term “rare earths” refers to a series of 17 chemically similar metals, consisting of the 15 elements known as the lanthanides, plus yttrium and scandium. These rare earth metals and oxides are of particular interest here due to their unique chemical, magnetic and fluorescent properties.7
44. Rare earths are a critical constituent of many high technology goods that are essential inputs to the manufacture of items such as hybrid vehicles, mobile telephones, computers, televisions and energy efficient lights. Although rare earths have a relatively high unit value, the impact of their cost has little, if any, impact on the selling price of the final item because they are present in minute concentrations.
45. The rare earths market represented approximately USD 1.25 billion in 2008. Over the past decade, market growth has been in the range of 8-11% per year, with the exception of the correction in 2001/02 due to the fall in technology markets and the current global economic crisis. While the current global financial and economic crisis is expected to reduce consumption in 2009, it is anticipated that industry growth will return to 8-11% in late 2010 (Kingsnorth, 2009).
46. There are limited commercially viable rare earth resources and reserves. The largest proportion of these reserves lie in China (27 million tonnes) and are equivalent to about 30% of the world’s reserves, while the US accounts for another 13 million tonnes, Australia 5 million tonnes and India 2.3 million tonnes. China supplies approximately 95% of global demand and consumes about 60% of the global
6. This section is taken from material graciously provided by Dudley Kingsnorth of Industrial Minerals Company
of Australia Pty Ltd (IMCOA).
7. Rare earths are normally expressed in terms of rare earth oxides (REO) and often classified into three groups: light, medium and heavy. The light or ‘ceric’ elements are: lanthanum, cerium, praseodymium and neodymium; medium elements are promethium, samarium, europium and gadolinium and the heavy or “yttric” elements are: terbium, dysprosium, holmium, erbium, thulium, ytterbium, lutetium and yttrium. Scandium is also part of the rare earths group.
TAD/TC/WP(2009)27/FINAL
20
supply, but its reserves of rare earths are finite. The Chinese government has indicated that if the exploitation of these resources is not controlled, they could be exhausted in 20-30 years.
47. Current production of rare earths in India and Russia is limited by the low quality and a lack of industry structure that would support their expansion. Currently, there is only one green field rare earths project outside China that has all the necessary environmental and commercial approvals in place and which is under construction: the Mt. Weld Project based in Australia (mining and beneficiation) and Malaysia (processing and separation of the rare earths). The Australian Foreign Investment Review Board placed ‘unacceptable conditions’ on funding from the China Non Ferrous Metal Corporation, as a result of which required funds were raised through equity issues.
48. There are significant barriers to enter the rare earths market as a new producer:
• Process technology is specific to each ore body.
• High capital cost: typically more than USD30 000 per tonne of annual separated capacity.
• Marketing is customer specific – rare earths are not traded on any recognised exchange.
• Limited operational expertise outside China.
• Industry is dominated by China where input costs are low.
49. A major ongoing issue for the rare earths industry is balance. Due to the incongruity between the supply and demand of individual rare earths, there always exists a situation in which there is a shortfall of some rare earths while others are in surplus. On the basis of known analyses of major resources it is considered that some of the ‘heavy’ rare earths are more likely to be in short supply in the future.
50. The Chinese government has stated that its reserves of rare earths are finite and, therefore, they will be developed for the prime benefit of China’s manufacturing industry. As a result, a series of measures has been implemented to “conserve resources and to maximise the benefits” of its rare earths endowment.8 To help generate manufacturing jobs and move up the value chain, China has adopted policies that encourage downstream industries that produce goods with higher value added to locate in China.The following measures have been put into place, indicating that China’s rare earth resources are a priority for its domestic manufacturing industries:
• Export quotas
• Export taxes
• Withdrawal of the VAT refund on exports
• Production quotas
• Foreign investment in rare earth resources/mines is prohibited.
8. The commitment to developing the rare earths resources in China primarily for the benefit of the domestic
manufacturing industries has been reaffirmed recently through a Draft Development Plan (2009-14) for the Rare Earths Industry issued by the Ministry of Industry and Information Technology.
TAD/TC/WP(2009)27/FINAL
21
Chinese Rare Earth Export Quotas
51. The rare earth export quotas for the second half of 2009 amount to a 12% annual reduction in the quota compared to 2008. The size of this reduction is greater than in previous years (Table 13). It should be noted however that due to the global economic crisis the total Chinese rare earth export quotas for 2009 are likely to be less than total non-Chinese demand.
Table 13. Chinese Rare Earth Export Quotas
Year Export quotas Percent change year on year
Estimated non-Chinese demand
2004 65 609 57 000
2005 65 609 0 46 000
2006 61 821 -6 50 000
2007 59 643 -4 50 000
2008 47 449 50 000
56 9391 -5.51
2009 50 145 -12 35 000 1. Adjusted for 12 month allocation for comparative purposes. Source: Table 13. Chinese Rare Earth Export Quotas
Export Taxes on Rare Earth Exports from China
52. In late 2006, the Chinese government introduced a tax on rare earth exports of 10%, which was increased to 15% on selected rare earths in 2007. Effective from 1 January 2008, export taxes were raised to the following levels (Appendix Table 1):
• Europium, terbium, dysprosium, yttrium as oxides, carbonates or chlorides – 25%
• All other rare earth oxides, carbonates and chlorides – 15%
• Neodymium metal – 15%
• All other rare earth metals– 25%
• Ferro rare earth alloys – 20%.
Refund of VAT on Rare Earth Exports from China
53. In 2007, China withdrew the refund of VAT (16%) on exports of unimproved rare earths, while the refund on higher value-added exports such as magnets and phosphors remains in place. The effect of this decision, combined with the export tax regime above, is that non-Chinese rare earth processors such as cerium polishing powder producers and rare earth magnet producers pay 31% more for rare earth raw materials (plus transport and storage costs) than their Chinese counterparts.
TAD/TC/WP(2009)27/FINAL
22
Impact of Export Restrictions
54. Rare earths export taxes and withdrawal of the VAT refund may have an effect on world prices of some rare earths. However, these materials are used in such small quantities that such policies are expected to have a limited impact on the prices of final goods. Quotas on exports from China have not had a visible effect on the volume of export of most rare earths as they have been higher than the estimated non-Chinese demand through 2009. As demand grows, however, and if quotas are made more restrictive in the way they have been in the last few years, supply constraints will exist among non-Chinese downstream producers of high technology goods using rare earths as one of their components. It is suspected that supply constraints will be greatest in heavy or “yttric” rare earths.
55. For the owners and financiers of non-Chinese rare earths projects, the major risk is that China will reduce its export taxes and abolish its export quotas that impact the rare earth prices outside China. World prices are now typically 20-40% higher than Chinese domestic prices. A sharp fall in world prices due to changes in Chinese policies may make investments in the rare earths industry outside China non-competitive. The profitability of these investments is already threatened due to high capital costs, strong competition from China where environmental controls are less onerous, specialized processing techniques, and the necessity for customer-specific marketing.
Conclusion
56. Several policy objectives motivate export restrictions of strategic raw materials. Conservation of natural resources is one of them. Export restrictions are also applied to achieve social objectives, such as protection of the environment. Unlike promotion of downstream industries, these objectives can be understood as a response to market imperfections. The question remains, however, whether export restrictions are the most effective tool to achieve these objectives. Since export restrictions have a direct impact on export volumes, in principle, the effectiveness of such measures depends on whether a reduction in exports actually leads to a decrease in production. In this regard, regulation on production itself rather than on trade is one alternative option to achieve these social objectives.9 Possible future work in this area could include establishing a hierarchy of policy measures with a view to better understanding which ones most efficiently achieve the policy objectives.
57. Specific characteristics of strategic raw materials provide cases with interesting impacts of export restrictions. The concentration of production in a few countries, combined with the fact that there are few substitutes for several materials, result in a higher dependence on imports of these materials for non-producing countries.
58. To be effective in achieving objectives such as the conservation of natural resources and protection of the environment, export restrictions should affect production levels. The government applying the restrictions expects that, by reducing export volume, they will reduce the volume of production. However, this connection is not guaranteed, as shown in the molybdenum case where more production was sold domestically.
59. For conservation and environmental protection purposes, regulation on production itself rather than on trade is another option. Pollution emissions from a certain production process are the same whether
9 For example, Chile responded to resource depletion by applying a mining tax on the income of mine operators
instead of relying on export restrictions. See summary report of the OECD Raw Materials workshop (TAD/TC/WP(2009)34/FINAL) for some examples of alternative policies to export restrictions to achieve policy objectives.
TAD/TC/WP(2009)27/FINAL
23
the products are consumed domestically or in a foreign market. Indeed, many environmental tax schemes applied by several countries focus on taxation at the production level.
60. Export restrictions imposed by one country can produce similar measures from other exporting countries by diverting the source of imports. This is more important for strategic raw materials because a few major producing countries are responsible for most of the world exports. In this sense, the interdependence among these countries impacts the effectiveness of these measures in achieving policy objectives. This was seen in the case of chromium where export restrictions placed by India impacted policies in another producing country, South Africa.
61. The potential imposition of export restrictions creates more risk for end-use producers as well as producers of the raw materials, as seen in the rare earths case. Although the export quotas in place have not significantly limited export or production so far, the possibility that access to these strategic raw materials will be restricted in the future incurs an additional risk factor for downstream producers that import rare earths. Potential producers of rare earths incur the risk that export restrictions will subsequently be lifted, thereby decreasing world prices to levels that make their production facilities unprofitable. Greater uncertainty in future prices due to potential changes in supply caused by export restrictions may therefore contribute to lower investment in production facilities worldwide. This is particularly problematic in mining industries where investments in new production facilities are necessarily long-term.
62. The impact of export restrictions on some strategic metals and minerals are exacerbated because in many cases the producing countries have a quasi-monopoly on supply. Since some of these metals and minerals are essential in the production of some high-technology products, and are not easily replaceable in the medium term, industry participants in some importing countries are concerned about future access at sustainable prices.
TAD/TC/WP(2009)27/FINAL
24
BIBLIOGRAPHY
Commission of the European Communities, The raw materials initiative – meeting our critical needs for growth and jobs in Europe, COM(2008) 699 and SEC(2008) 2741, Brussels, 4.11.2008.
International Chromium Development Association, Statistical Bulletin, 2009
Kingsnorth, Dudley, The Rare Earths Market: Can Supply meet Demand in 2014?, communication to the PDAC conference, Toronto, March 1-4th 2009.
OECD (2010), “Summary Report of the Raw Materials Workshop”, TAD/TC/WP(2009)34/FINAL, January 13, 2010.
Piermartini, Roberta, The Role of Export Taxes in the Field of Primary Commodities, World Trade Organisation, Geneva, 2004.
Price, Alan H., Esq, T. C. Brightbill, C.B. Weld, C.L. Capito III, R.E. Morgan, Raw Deal: How Governmental Trade Barriers and Subsidies Are Distorting Global Trade in Raw Materials, Wiley Rein LLP, November 2008.
United States Geological Survey, Minerals Yearbook, various metals and minerals, various years, http://minerals.usgs.gov/minerals/pubs/commodity/myb/.
WTO, Public Forum 2008: Markets for Raw Materials and Energy – What Role for the WTO?, http://www.wto.org/english/forums_e/public_forum08_e/programme_e.htm, September 24, 2008.
TAD/TC/WP(2009)27/FINAL
25
APPENDIX 1. KNOWN EXPORT RESTRICTIONS ON STRATEGIC METALS AND MINERALS
Mineral Country Date Product Restriction
Antimony China 2008 Export quota:
59 000T Tax
China 2008 Ore/concentrate 10% China 2008 Unwroght antimony 5% Russia 2008 Waste and scrap 6.50% Tanzania scrap Export ban
Cobalt Argentina Cobalt waste and scrap; semi-processed products; articles of cobalt 5%
Russia scrap 30% but not less than 1200EUR/tonne Tanzania scrap Export ban
Ukraine Cobalt waste and scrap; semi-processed products; articles of cobalt 27%
Copper Ukraine Unrefined copper, copper waste and scrap 30% (but not less than 1euro per kg) Argentina copper ore and concentrates 10% Russia 2008 copper cathode 10% Russia 2008 refined copper and copper alloys 10% Russia unrefined copper 10% Russia copper waster and scrap 50% China 2008 ores and concentrate 10%
Kazakhstan Refine copper and alloys 30% (but not less than 330euro per ton)
Tanzania copper scrap Export ban Chromium Ukraine 2008 30% (but not less than 0.4euro per kg)
India Apr-08 Ore INR 3 000/t China 2005 Ferrochromium 5% China 2008 Chrome ores and concentrate 15% China 2008 Unwroght chromium 15% China Jun-05 Chromium scrap 15% Tanzania chromium scrap Export ban
Gallium Russia 6.5%
TAD/TC/WP(2009)27/FINAL
26
Mineral Country Date Product Restriction Tax
Germanium China 2008 Oxide 5%
China 2007
Russia Waste and scrap 6.5%
Indium China 2008 (June 2007?) Export quota: 240T China 15%
Russia 6.5%
Tanzania Export ban
Manganese China 2008 39%
China 2008 ores and concentrate 15% Gabon since 2001 3% Ghana since 2001 6%
India 2006 Ore and dioxide Rs 20 per tonne (ore),
20% (dioxide) Russia Waste and scrap 6.5% Tanzania scrap Export ban
Molybdenum China 2008 Molybdenum Export quota: 26,300T Molybdenum China (June?) 2007 Molybdenum Export quota: 35,700T
Molybdenum China January 1, 2008 ferromolybdenum 20%
Molybdenum China January 1, 2007 Molybdenum concentrates and oxides and ferromolybdenum 10%
Molybdenum China January 1, 2007 Molybdenum powder, unwrought molybdenum and scrap 15%
Molybdenum China July 1, 2007 Molybdenum hydroxides and salts and ammonium molybdates
VAT rebate cancelled
Molybdenum China July 1, 2007 Molybdenum wire and other molybdenum products
VAT rebate reduced to 5%
TAD/TC/WP(2009)27/FINAL
27
Mineral Country Date Product Restriction Tax
Molybdenum China June, 2007
Export licensing system implemented granting export
licenses to selected producers who meet certain criteria.
Molybdenum China 8 August 2001- 28 February 2002 ferromolybdenum
Export limit of 8861T to the EU following dumping duties imposed by the EU in 2000.
Molybdenum Russia molybdenum ores and concentrates; waste and scrap
6.50%
Nickel Russia 2008 Waste and scrap 30%
Russia 2008 nickel matters and non-alloyed nickel 5%
Ukraine 2008 30% (but not less than EUR 0.4/kg)
Ukraine 2008 30% (but not less than EUR 5.5/kg)
China 2008 ores and concentrate 15%
Tanzania scrap Export ban
Palladium Russia 6.5%
Platinum Russia 6.5%
Rare Earths China 1999
Rare earth export quotas introduced to increase world
prices (rare earths prices increased by USD120 in 2000
as compared to 1999)
Rare Earths China 2000 Export quota: 47,000T
TAD/TC/WP(2009)27/FINAL
28
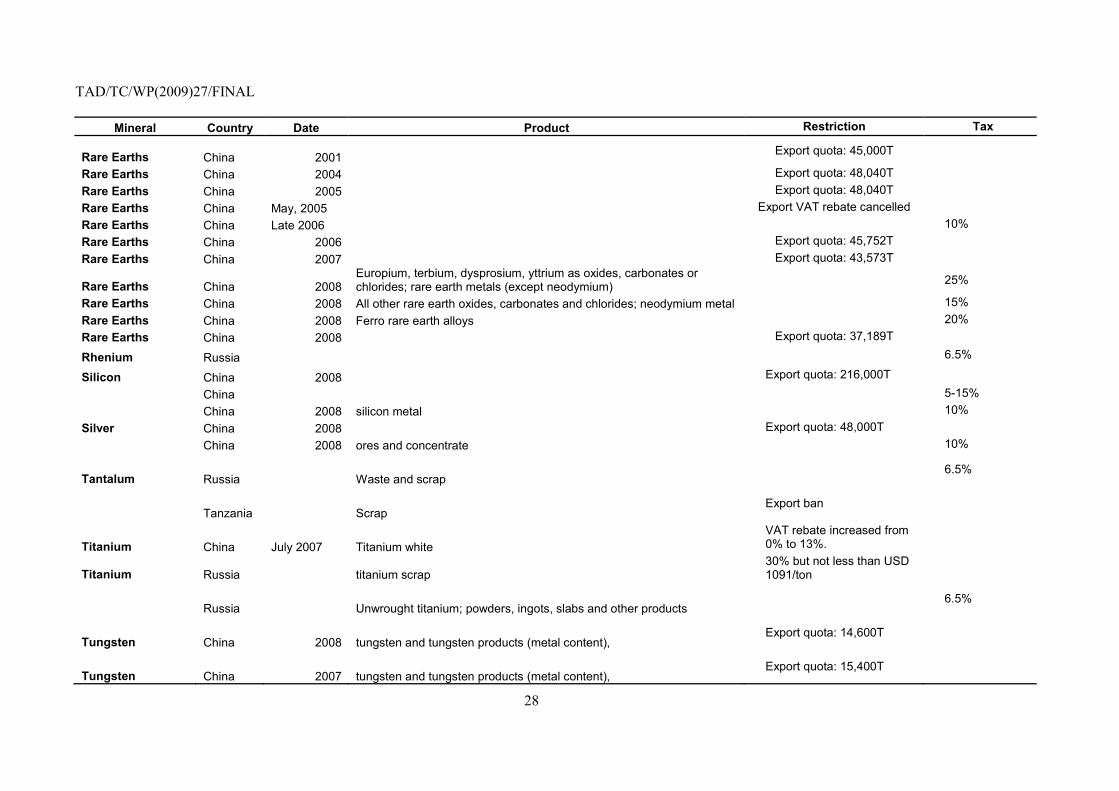
Mineral Country Date Product Restriction Tax
Rare Earths China 2001 Export quota: 45,000T Rare Earths China 2004 Export quota: 48,040T Rare Earths China 2005 Export quota: 48,040T Rare Earths China May, 2005 Export VAT rebate cancelled Rare Earths China Late 2006 10% Rare Earths China 2006 Export quota: 45,752T Rare Earths China 2007 Export quota: 43,573T
Rare Earths China 2008 Europium, terbium, dysprosium, yttrium as oxides, carbonates or chlorides; rare earth metals (except neodymium) 25%
Rare Earths China 2008 All other rare earth oxides, carbonates and chlorides; neodymium metal 15% Rare Earths China 2008 Ferro rare earth alloys 20% Rare Earths China 2008 Export quota: 37,189T
Rhenium Russia 6.5%
Silicon China 2008 Export quota: 216,000T
China 5-15% China 2008 silicon metal 10%
Silver China 2008 Export quota: 48,000T China 2008 ores and concentrate 10%
Tantalum Russia Waste and scrap 6.5%
Tanzania Scrap Export ban
Titanium China July 2007 Titanium white VAT rebate increased from 0% to 13%.
Titanium Russia titanium scrap 30% but not less than USD 1091/ton
Russia Unwrought titanium; powders, ingots, slabs and other products 6.5%
Tungsten China 2008 tungsten and tungsten products (metal content), Export quota: 14,600T
Tungsten China 2007 tungsten and tungsten products (metal content), Export quota: 15,400T
TAD/TC/WP(2009)27/FINAL
29
Mineral Country Date Product Restriction Tax
Tungsten China 2007 Ammonium paratungstate, tungsten carbide, tungsten trioxide, and unwrought tungsten metal and powder 5%
Tungsten China 2006 tungsten and tungsten products (metal content), Export quota: 15,800T
Tungsten China 1 November 2006 Ferro-tungsten 10% Tungsten China 1 November 2006 Tungsten scrap 15% Tungsten China January 1, 2006 tungsten and tungsten products VAT rebate reduced to 5%. Tungsten China May 1, 2005 tungsten and tungsten products VAT rebate reduced to 8%.
Tungsten China 2005 tungsten and tungsten products (metal content), Export quota: 16,300T
Tungsten China 2004 tungsten and tungsten products (metal content), Export quota: 16,300T
Tungsten China 2004 Tungsten products with the exception of tungsten powder and concentrates and scrap
Export VAT rebate reduced to 5%.
Tungsten China 2004 tungsten concentrates and scrap Export VAT rebate cancelled.
Tungsten China 2003 tungsten and tungsten products (metal content), Export quota: 16,300T
Tungsten China 2002 tungsten and tungsten products (metal content), Export quota: 16,300T
Tungsten China 2000 Export quotas assigned to approved traders who meet export guidelines.
Tungsten Russia December, 2002 0%
Tungsten Russia through end 2002 6.5%
Tanzania Scrap Export ban
Tungsten Ukraine May 16, 2008, date of WTO accession tungsten waste and scrap
30% but not less than EUR 10/kg
Tungsten Ukraine prior to 16 May 2008 tungsten waste and scrap
Export ban
Vanadium Russia 6.5%
Sources: Industrial Minerals Company of Australia Pty Ltd. (IMCOA), International Chromium Development Association (ICDA) Statistical Bulletin 2009, Metal Pages http://www.metal-pages.com/, Price et al. (2008), USGS Minerals Yearbook, and responses from various country questionnaires.