Embed Size (px)
Citation preview

Andreas Schleicher, Director
OECD – Directorate for Education and Skills
OECD preliminary views on the “Project for
Autonomy and Flexibility”
9 February 2018

Structure of analysis:
• Bigger picture
• Overall strategy
• Curriculum design
• Curriculum implementation
Today’s focus ---

Bigger picture: Today’s Portugal

4
The economy is recovering
Source: Calculations based on OECD Economic Outlook: Statistics and Projections (database).
145
150
155
160
165
170
175
180
185
2000 2002 2004 2006 2008 2010 2012 2014 2016 2018
billion EUR
Real GDP

5
Competitiveness has improved
Export Performance measures the expansion of a country’s exports relative to the expansion of import demand from its trading
partners. Improvements in export performance reflect rising market shares in the imports of trading partners.
Source: OECD (2016), OECD Economic Outlook: Statistics and Projections (database).
60
70
80
90
100
110
120
2000 2002 2004 2006 2008 2010 2012 2014
Export performance
Index 2000 = 100
Portugal Germany Italy Spain
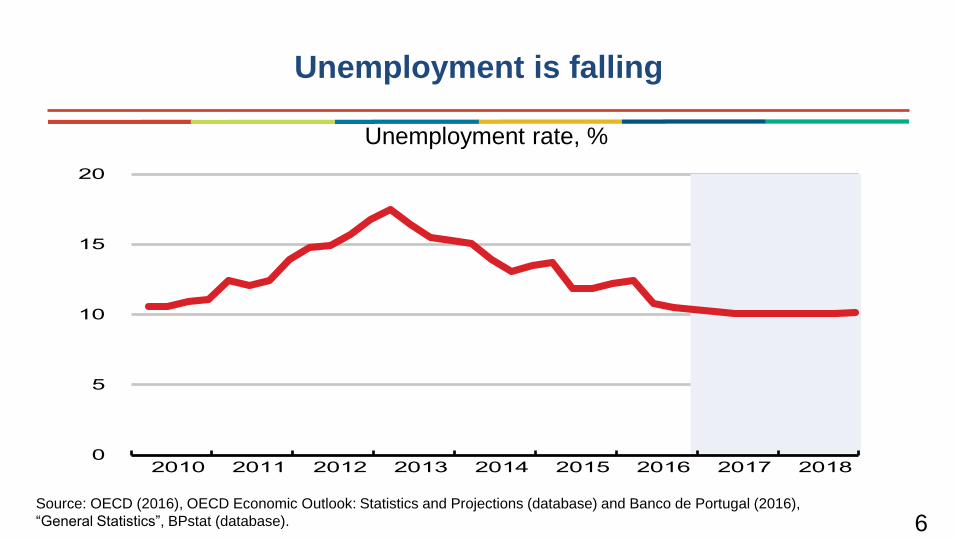
6
Unemployment is falling
Unemployment rate, %
Source: OECD (2016), OECD Economic Outlook: Statistics and Projections (database) and Banco de Portugal (2016),
“General Statistics”, BPstat (database).
0
5
10
15
20
2010 2011 2012 2013 2014 2015 2016 2017 2018

General government debt, Maastricht definition, per cent of GDP
7
Public debt is high
Source: Calculations based on OECD (2016), OECD Economic Outlook: Statistics and Projections (database).
50
60
70
80
90
100
110
120
130
140
150
2000 2005 2010 2015 2020 2025 2030
Under current plans
Higher interest rate
Lower inflation
However…some vulnerabilities remain

Percentage of working age population having attained at least upper secondary education, 20151
8
Improving skills is key
1. Working age population: 25-64 years-olds.
Source: OECD (2016), Education at a Glance 2016: OECD Indicators.
0
10
20
30
40
50
60
70
80
90
100
0
10
20
30
40
50
60
70
80
90
100
CZ
E
SV
K
ES
T
PO
L
CA
N
US
A
CH
E
LVA
FIN
DE
U
SV
N
KO
R
ISR
AU
T
HU
N
NO
R
SW
E
DN
K
IRL
GB
R
AU
S
FR
A
OE
CD
NLD
NZ
L
ISL
BE
L
LUX
GR
C
CH
L
ITA
ES
P
PR
T
TU
R
ME
X

9
Grade repetition is too commonly used
0
5
10
15
20
25
30
35
40
0
5
10
15
20
25
30
35
40
ES
P
PR
T
BE
L
NLD
DE
U
ITA
US
A
OE…
AU
T
CA
N
AU
S
ISR
ES
T
PO
L
NZ
L
SW
E
DN
K
CZ
E
SV
K
FIN
GB
R
SV
N
ISL
JPN
KO
R
NO
R
% of 15-year-old students who have repeated at least one year
Source: OECD (2012), Equity and Quality in Education: Supporting Disadvantaged Students and Schools.

What is “Tomorrow’s Portugal”?
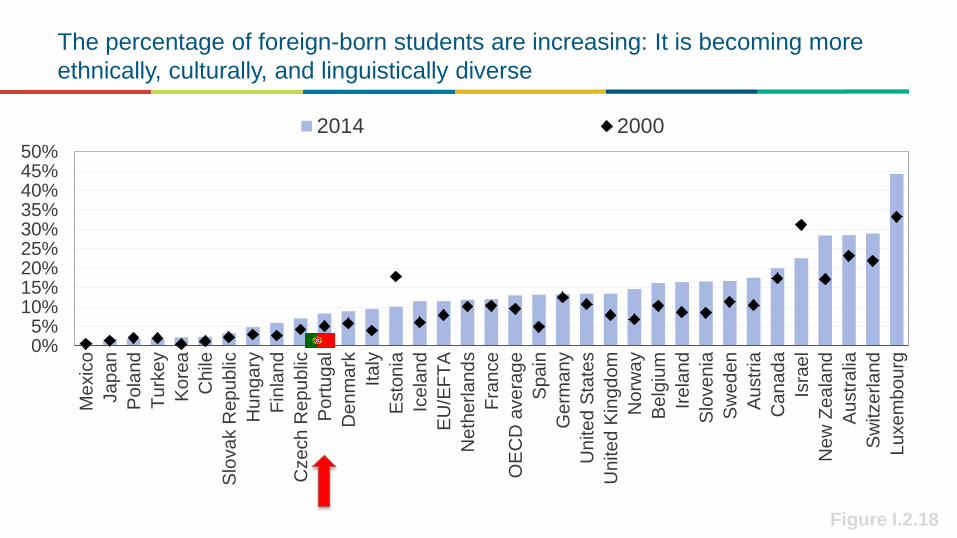
The percentage of foreign-born students are increasing: It is becoming more
ethnically, culturally, and linguistically diverse
Figure I.2.18
0%5%
10%15%20%25%30%35%40%45%50%
Me
xic
o
Ja
pa
n
Po
land
Tu
rke
y
Ko
rea
Ch
ile
Slo
va
k R
ep
ub
lic
Hu
ng
ary
Fin
lan
d
Czech
Re
pu
blic
Po
rtu
ga
l
De
nm
ark
Ita
ly
Esto
nia
Ice
lan
d
EU
/EF
TA
Neth
erlands
Fra
nce
OE
CD
ave
rag
e
Spain
Ge
rma
ny
Un
ite
d S
tate
s
Un
ite
d K
ing
do
m
No
rwa
y
Be
lgiu
m
Ire
lan
d
Slo
venia
Sw
ed
en
Au
str
ia
Ca
na
da
Isra
el
Ne
w Z
ea
land
Au
str
alia
Sw
itze
rla
nd
Lu
xe
mb
ou
rg
2014 2000

Global competence (PISA)

Global competence (PISA)
Knowledge of global issues and intercultural issues
Content domains:
• Culture and intercultural relations (as students engage in learning about other cultures they recognise multiple, complex identities and avoid categorising people through single markers)
• Socio-economic development and interdependence
• Environmental sustainability • Global institutions, conflicts and
human rights

Global competence (PISA)
Global competence builds on specific cognitive and socio-emotional skills, including
• Reasoning with information • Communication in intercultural
contexts • Perspective-taking (the cognitive and social
skills to understand how other people think and feel)
• Conflict resolution • Adaptability

Global competence (PISA)
The mind-set that students adopt towards a person, a group, an institution, an issue, a behaviour or a symbol
Openness towards people from other cultural backgrounds
Respect for cultural differences
Global-mindedness

Global competence (PISA)
Values go beyond attitudes as they transcend specific objects or situations
People use them consciously and unconsciously as reference for judgements
• Human dignity
• Cultural diversity

17
Digitalisation and children
Democratizing
Concentrating
Particularizing
Homogenizing
Empowering
Disempowering

Technologies and youths

30
40
50
60
70
80
90
Ch
ine
se
Taip
ei -2
Sw
ede
n -
9
Fra
nce
-5
Port
ug
al
Gre
ece
Sin
gapo
re -
2
Tha
iland
Ma
ca
o (
Ch
ina
) -7
Bra
zil
-2
Spain
Un
ite
d K
ing
dom
Bulg
aria
Ho
ng K
on
g (
Chin
a)
Kore
a
-7
Belg
ium
-
4
De
nm
ark
-
4
Cro
atia
-
5
Isra
el -1
0
Ne
w Z
eala
nd -
4
Ne
therl
and
s
-3
Uru
guay
Hu
nga
ry 4
Austr
alia
OE
CD
avera
ge -
3
Do
min
ican
Rep
ublic
Irela
nd
-
7
Pola
nd
-3
Co
sta
Ric
a 3
Lithu
ania
Japa
n -
5
Me
xic
o
Ru
ssia
-
8
Czech R
epu
blic
Ita
ly
Peru
Co
lom
bia
4
Fin
land
-6
Ch
ile
La
tvia
Slo
vak R
epub
lic
B-S
-J-G
(C
hin
a)
11
Sw
itzerl
and
Austr
ia
-3
Lu
xe
mbo
urg
Icela
nd
Germ
any
Esto
nia
Slo
ven
ia
% Boys Girls
15-year-olds feeling bad if not connected to the Internet (PISA) Figure III.13.6

Increase in time spent on line outside school on a typical school day
0
20
40
60
80
100
120
140
160
180
200
Ch
ile
39
Sw
ede
n
56
Uru
guay
33
Co
sta
Ric
a 3
1
Spain
44
Ita
ly
40
Austr
alia
52
Esto
nia
50
Ne
w Z
eala
nd
51
Hu
nga
ry
43
Ru
ssia
4
2
Ne
therl
and
s
48
De
nm
ark
55
Slo
vak R
epub
lic
40
Czech R
epu
blic
4
3
Austr
ia
42
La
tvia
46
Sin
gapo
re
45
Belg
ium
44
Pola
nd
46
Icela
nd
5
1
OE
CD
avera
ge-2
7
43
Irela
nd
4
8
Cro
atia
4
0
Port
ug
al 4
2
Fin
land
48
Isra
el 3
4
Ma
ca
o (
Ch
ina
) 4
5
Sw
itzerl
and
4
0
Gre
ece
41
Ho
ng K
on
g (
Chin
a)
3
9
Me
xic
o
30
Slo
ven
ia 3
7
Japa
n
31
Kore
a
20
Minutes per day 2015 2012
Figure III.13.3
Percentage of High Internet Users (spending 2 to 6 hours on line per day), during weekdays

What kind of competencies do today’s
students need to create a new future of Portugal?

OECD Learning Framework 2030

Underlying concepts of the Portuguese
Student Profile is in line with the OECD
Learning Framework 2030.

• National Program for Promoting School Success
• National Education Strategy for Citizenship
• Essential Core curriculum
• Investment in Pre-school and Transition to Preschool
• In-service training
• New law for inclusion
• Changes in assessments (focusing on formative assessment and diversity of instruments)
• InCode 2030
• National Reading Plan and network of school libraries
Other initiatives to achieve a better future

OECD visit the pilot schools and non-pilot school
15-19 January 2018
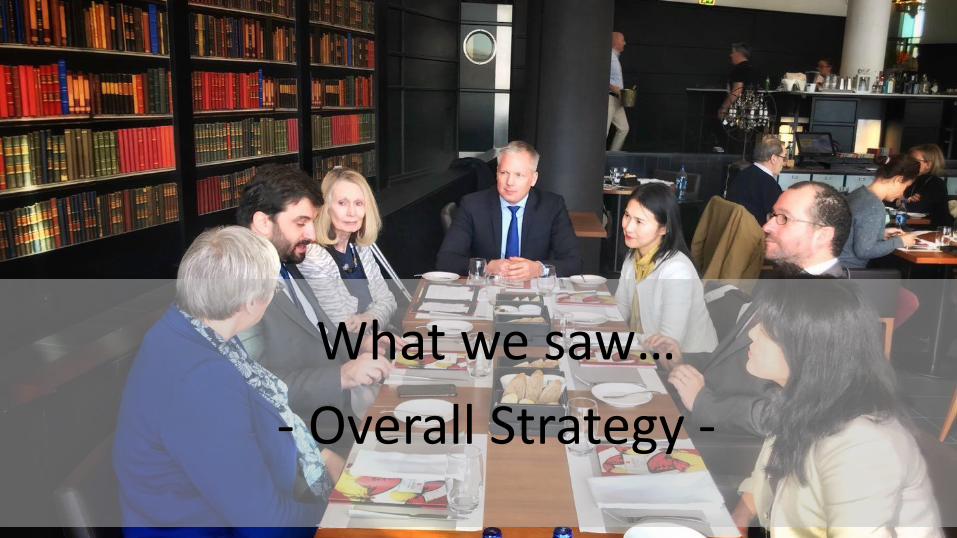
What we saw…
- Overall Strategy -

• Strategic thinking: there is a clear Theory of Action” for a change.
• “Student profile” with broadened outcomes as well as a strong sense of ownership
• Strategic approach to communications, e.g. ‘Student Profile Day’ on 15 January 2018
• The ‘openness for reflections’ of the Ministry in respect of the pilot.
STRENGTHS:

The pilot project is in line with the national skills strategy:
Portugal’s National Skills Strategy Diagnostic Phase 2014-2015
2
8

The pilot project is in line with the inclusion strategy
because inequities in the education system persist
0
5
10
15
20
25
30
35
2006 2015 2009 2012
Science Reading Mathematics
Portugal OECD average OECD minimum/maximum
% of PISA score variance explained by students’ socio-economic background
Source: PISA 2015 Results: Excellence and Equity in Education (Vol. I); PISA 2012 Results: What Students Know and Can Do (Vol. I); PISA
2012 Results: Excellence Through Equity (Vol. II); PISA 2009 Results: Overcoming Social Background (Vol. II) and PISA 2006, Vol. 2: Data.

Poverty is not destiny - Science performance by international deciles of the PISA index of economic, social and cultural status (ESCS)
280
330
380
430
480
530
580
630D
om
inic
an R
ep
ub
lic 4
0A
lge
ria 5
2K
oso
vo
10
Qa
tar
3F
YR
OM
13
Tu
nis
ia 3
9M
on
ten
eg
ro 1
1Jord
an 2
1U
nite
d A
rab
Em
ira
tes 3
Ge
org
ia 1
9L
eb
an
on
27
Indo
nesia
74
Me
xic
o 5
3P
eru
50
Co
sta
Ric
a 3
8B
razil
43
Tu
rke
y 5
9M
old
ova 2
8T
haila
nd
55
Co
lom
bia
43
Ice
lan
d 1
Trin
idad
and
Tob
ago
14
Rom
an
ia 2
0Is
rae
l 6
Bu
lga
ria
13
Gre
ece
13
Russia
5U
rug
ua
y 3
9C
hile
27
Latv
ia 2
5L
ith
uan
ia 1
2S
lova
k R
ep
ub
lic 8
Italy
15
Norw
ay 1
Sp
ain
31
Hu
nga
ry 1
6C
roa
tia
10
De
nm
ark
3O
EC
D a
vera
ge
12
Sw
ed
en
3M
alta 1
3U
nite
d S
tate
s 1
1M
acao
(C
hin
a)
22
Ire
lan
d 5
Au
str
ia 5
Po
rtug
al 2
8L
uxe
mb
ourg
14
Hon
g K
on
g (
Ch
ina
) 2
6C
zech
Rep
ublic
9P
ola
nd
16
Au
str
alia
4U
nite
d K
ing
do
m 5
Can
ad
a 2
Fra
nce 9
Ko
rea
6N
ew
Zea
land
5S
witze
rlan
d 8
Neth
erl
an
ds 4
Slo
ve
nia
5B
elg
ium
7F
inla
nd
2E
sto
nia
5V
iet
Nam
76
Ge
rma
ny 7
Jap
an 8
Chin
ese
Ta
ipe
i 1
2B
-S-J
-G (
Chin
a)
52
Sin
ga
pore
11
Score
poin
ts
Bottom decile Second decile Middle decile Ninth decile Top decile
Figure I.6.7
% of students
in the bottom
international
deciles of
ESCS
OECD median student

• Conflict with associated assessments/ articulation between different types of assessment (internal/external)
• Misunderstanding that “greater flexibility in the curriculum” and “essential learning lead to “lowering learning standards”
• Conflict with dominant model of high centralization: inherent conflicts between the learning model implicit in the pilot project and the existing highly prescribed, centralized system
• Culture clash: students experience of participative, relevant, competency-based approaches in the flexible curriculum, in comparison with deeply dissatisfied with the ‘traditional’ offer in schools
• Further engagement of non-pilot schools into national initiatives e.g. student profile.
CHALLENGES

• Intensify collecting evidence of impact of the pilot
– evidence of improved student engagement and outcomes;
– evidence of improved teacher well-being;
– evidence of good practice at all levels.
• Prioritise investment in capacity building to develop teacher and leadership skills.
• Launch a debate on entrance to university to align it with Student Profile
• Fulfil the promise to extend the project to all schools in 2018/19, making clear the voluntary nature.
• Prepared for expected/ unexpected consequences
• Ensure continuity of this change with a long time frame to ensure real effects.
RECOMMENDATIONS

What we saw…
- Curriculum Design -

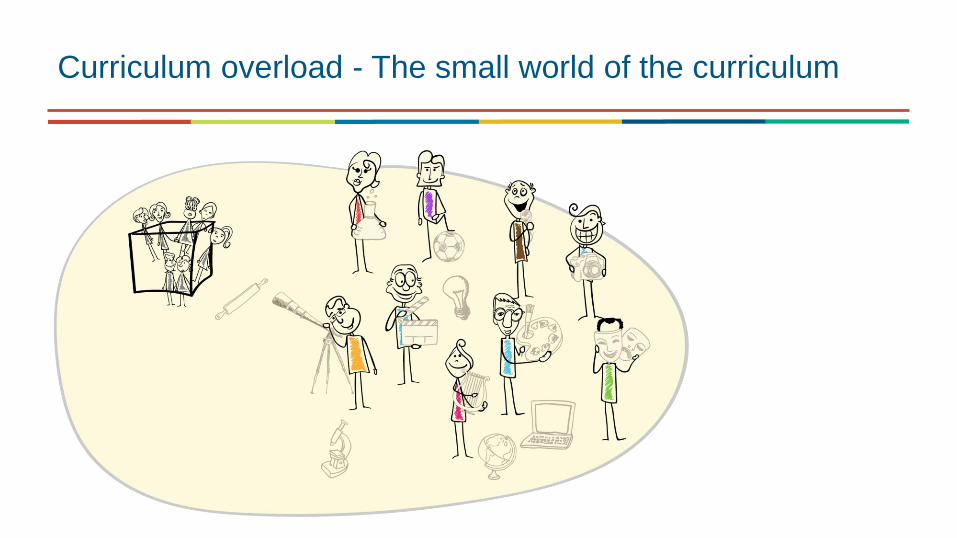
Curriculum Overload
Students often lack sufficient time to master key disciplinary concepts or, in the interests of a balanced life, to nurture friendships, to sleep and to exercise. It is time to shift the focus of our students from "more hours for
learning" to "quality learning time".

Curriculum overload
What is also happening within curriculum space with traditional subjects……
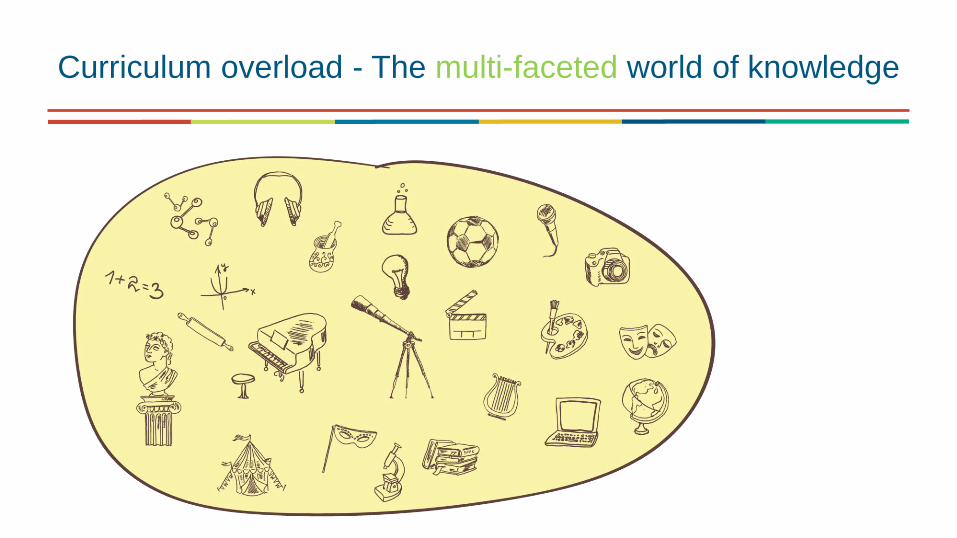
Curriculum overload - The multi-faceted world of knowledge

Curriculum overload - The human world of knowledge

Curriculum overload - The small world of the curriculum

Curriculum overload - The small world of the curriculum

Curriculum overload - The small world of the curriculum
Curriculum overload - The small world of the curriculum

Curriculum overload - The small world of the curriculum

Curriculum overload - The small world of the curriculum
Degrading student learning to machine learning where technology will make humans obsolete

The ‘productivity’ puzzle
Making learning time productive so that students can build their academic, social and emotional
skills in a balanced way

Learning time and science performance Figure II.6.23
Finland
Germany Switzerland
Japan Estonia
Sweden
Netherlands New Zealand
Macao (China)
Iceland
Hong Kong (China) Chinese Taipei
Uruguay
Singapore
Poland United States
Israel
Bulgaria
Korea
Russia Italy
Greece
B-S-J-G (China)
Colombia
Chile
Mexico
Brazil
Costa Rica
Turkey
Montenegro Peru
Qatar Thailand
United Arab
Emirates
Tunisia
Dominican Republic
R² = 0,21
300
350
400
450
500
550
600
35 40 45 50 55 60
PIS
A s
cie
nce s
co
re
Total learning time in and outside of school
OECD average
OECD average
OE
CD
ave
rage

Learning time and science performance Figure II.6.23
6
7
8
9
10
11
12
13
14
15
16
0
10
20
30
40
50
60
70
Fin
land
Germ
any
Sw
itzerl
and
Japa
nE
sto
nia
Sw
ede
nN
eth
erl
and
sN
ew
Zeala
nd
Austr
alia
Czech R
epu
blic
Ma
ca
o (
Ch
ina
)U
nite
d K
ing
dom
Ca
nad
aB
elg
ium
Fra
nce
No
rwa
yS
loven
iaIc
ela
nd
Lu
xe
mbo
urg
Irela
nd
La
tvia
Ho
ng K
on
g (
Chin
a)
OE
CD
avera
ge
Ch
ine
se
Taip
ei
Austr
iaP
ort
ug
al
Uru
guay
Lithu
ania
Sin
gapo
reD
enm
ark
Hu
nga
ryP
ola
nd
Slo
vak R
epub
licS
pain
Cro
atia
Un
ite
d S
tate
sIs
rael
Bulg
aria
Kore
aR
ussia
Ita
lyG
reece
B-S
-J-G
(C
hin
a)
Co
lom
bia
Ch
ileM
exic
oB
razil
Co
sta
Ric
aT
urk
ey
Mo
nte
neg
roP
eru
Qata
rT
ha
iland
Un
ite
d A
rab E
mira
tes
Tun
isia
Do
min
ican
Rep
ublic
Score
poin
ts in s
cie
nce p
er
hour
of to
tal le
arn
ing t
ime
Hours Intended learning time at school (hours) Study time after school (hours) Score points in science per hour of total learning time

• The process involved hearing headmaster, teacher societies, Unions, the National Council for Education, researchers, social partners, parent representatives, students; and thus, sstakeholders understood the broader vision for the purposes of education as outlined by the pilot project and the student profile.
• The pilot project (not compulsory) gives legal space for all schools to spontaneously and progressively adhere to the possibilities for curriculum design, especially, exemplar schools justification for experimental pedagogies, e.g. project-based learning and formative assessment.
• The pilot enabled teachers to design and experience meaningful in-school professional development.
• The pilot project enabled teachers to experience and value diversity in curriculum for inclusion and equity.
STRENGTHS

• The pilot project enabled students to experience and value the following elements of curriculum design to strengthen the design principle of “authenticity”.
– Opportunity to learn how to work and learn together with peers (sometimes across different grades)
– Opportunity to build positive relationships with teachers
– Opportunity to make choices that reflects their interests
– Opportunity to present their work that went beyond the teacher, into the community, for purposes other than grades, such as presenting at science fairs and using relevant knowledge and skills to solve school and community issues
– Relevance to future (university work, professional work, becoming a citizen)
– Opportunity to connect schools with professionals in the community
– Diversity of learning methods (e.g. active learning)
STRENGTHS

• Student agency
• Rigor
• Focus
• Coherence
• Alignment
• Transferability
• Choice
OECD Design Principles (work in progress)
• Teacher agency
• Authenticity
• Inter-relation
• Flexibility
• Engagement
Concept, content and topic design: Process design:

• Dilemma between two worlds when designing curriculum: teaching for the national exam vs. active learning, formative assessment, etc.
• Technical complexities e.g. structure school time, arranging inter-disciplinary learning when designing curriculum flexibility
• Scaling and sustainability: e.g.
– Prioritizing student learning and engagement
– A culture of learning, trust, creativity, thoughtful risk taking,
– Regular practice of faculty collaboration; students collaboration, reflection and action to improve practice; engaging and building partnerships with community and other stakeholders
• Managing differences between school practices.
CHALLENGES

0%
10%
20%
30%
40%
50%
60%
70%
80%
90%
100%
Compulsory flexible curriculum Reading, writing and literature Mathematics Natural sciences Second and other languages Other compulsory curriculum
Source: OECD (2017), Table D1.3b. See Source section for more information and Annex 3 for notes
(www.oecd.org/education/education-at-a-glance-19991487.htm).
Instruction time per subject in general lower secondary education (2017)

-0,8
-0,6
-0,4
-0,2
0,0
0,2
0,4
0,6
Re
sou
rce
s
Cu
rric
ulu
m
Dis
cip
linar
y p
olic
ies
Ass
ess
men
t p
olic
ies
Ad
mis
sio
ns
po
licie
s
Re
sou
rce
s
Cu
rric
ulu
m
Dis
cip
linar
y p
olic
ies
Ass
ess
men
t p
olic
ies
Ad
mis
sio
ns
po
licie
s
Re
sou
rce
s
Cu
rric
ulu
m
Dis
cip
linar
y p
olic
ies
Ass
ess
men
t p
olic
ies
Ad
mis
sio
ns
po
licie
s
Re
sou
rce
s
Cu
rric
ulu
m
Dis
cip
linar
y p
olic
ies
Ass
ess
men
t p
olic
ies
Ad
mis
sio
ns
po
licie
s
Re
sou
rce
s
Cu
rric
ulu
m
Dis
cip
linar
y p
olic
ies
Ass
ess
men
t p
olic
ies
Ad
mis
sio
ns
po
licie
s
School principal Teachers School governing board Local or regional education authority
National education authority
Higher science
Lower science
performance
PISA Figure II.4.8 Source: OECD, PISA 2015 Database.
Correlations between the responsibilities for school governance¹ and science performance

• Continue to gather feedback from teachers on the pilot experiences, research on different models of curriculum design and share them with all schools to ensure equity
• Identify “lighthouse schools” so other schools can visit and see the successful pilot projects, student profile, and policy in action – but keep resistance to “standardiese”.
• Continue to ensure that the pilot project spreads within schools, to ensure equity and equal access to all students
• Build clarity about competence to be attained by students with ICT to support better flexible curriculum design
RECOMMENDATIONS

What we saw…
- Curriculum Implementation -

Life satisfaction among 15-year-old students
0
10
20
30
40
50
60
70
80
90
100
Ne
therl
and
s
7.8
Me
xic
o 8
.3
Do
min
ican
Rep
ublic
8
.5
Fin
land
7.9
Co
sta
Ric
a 8
.2
Cro
atia
7
.9
Sw
itzerl
and
7
.7
Lithu
ania
7
.9
Icela
nd
7
.8
Fra
nce
7.6
Co
lom
bia
7
.9
Belg
ium
(excl. F
lem
ish)
7
.5
Uru
guay 7
.7
Austr
ia
7.5
Ru
ssia
7
.8
Esto
nia
7
.5
Spain
7
.4
Mo
nte
neg
ro 7
.8
Tha
iland
7
.7
La
tvia
7
.4
Germ
any 7
.4
Bra
zil
7.6
Port
ug
al 7.4
Irela
nd
7
.3
Lu
xe
mbo
urg
7
.4
Slo
vak R
epub
lic
7.5
OE
CD
avera
ge 7
.3
Peru
7
.5
Un
ite
d S
tate
s
7.4
Ch
ile 7
.4
Hu
nga
ry 7
.2
Bulg
aria
7
.4
Qata
r 7.4
Slo
ven
ia 7
.2
Pola
nd
7.2
Un
ite
d A
rab E
mira
tes 7
.3
Czech R
epu
blic
7
.1
Un
ite
d K
ing
dom
7
.0
Ita
ly 6
.9
Gre
ece
6.9
Japa
n 6
.8
Tun
isia
6
.9
B-S
-J-G
(C
hin
a)
6.8
Ma
ca
o (
Ch
ina
) 6.6
Ch
ine
se
Taip
ei 6
.6
Ho
ng K
on
g (
Chin
a)
6.5
Kore
a
6.4
Turk
ey 6
.1
% Very satisfied Satisfied Moderately satisfied Not satisfied
Factors that predict poor life satisfaction: • Anxiety with school work
• High internet use
Factors that predict high life satisfaction: • Students who talk or meet with friends after school
• More physical activity • Good teacher support • Good parental support

20 30 40 50 60 70 80
I often worry that it will be difficult for me taking a test
I worry that I will get poor <grades> at school
Even if I am well prepared for a test I feel very anxious
I get very tense when I study
I get nervous when I don't know how to solve a task at school
Percentage of students
OECD average Portugal
Prevalence of schoolwork-related anxiety Figure III.4.1(1)

20
30
40
50
60
70
80
90
Do
min
ican
Rep
ublic
*C
osta
Ric
aB
razil
Co
lom
bia
Uru
guay *
Sin
gapo
reU
nite
d K
ing
dom
Ne
w Z
eala
nd
Qata
r *
Ita
lyP
eru
Austr
alia
Ch
ine
se
Taip
ei
Ho
ng K
on
g (
Chin
a)
Mo
nte
neg
roU
nite
d S
tate
sP
ort
ug
al
Un
ite
d A
rab E
mira
tes
Japa
nM
aca
o (
Ch
ina
)T
ha
iland
Spain
Sw
ede
nD
enm
ark
Kore
a *
Ca
nad
aS
loven
iaN
orw
ay
B-S
-J-G
(C
hin
a)
Irela
nd
Lithu
ania
Gre
ece
Turk
ey
Bulg
aria
OE
CD
avera
ge
Me
xic
oH
unga
ryE
sto
nia
Ch
ileT
un
isia
Fin
land
Ne
therl
and
s *
Cro
atia
Ru
ssia
Slo
vak R
epub
licF
rance
Icela
nd
Austr
iaIs
rael
Lu
xe
mbo
urg
La
tvia
Pola
nd
Belg
ium
Czech R
epu
blic
Germ
any
Sw
itzerl
and
% Top quarter of science performance Bottom quarter of science performance
Schoolwork-related anxiety among students in the top and
bottom quarters of science performance G
rea
ter
an
xie
ty
Figure III.4.2
Percentage of students who reported that they "agree"
or "strongly agree" with the statement "Even if I am well
prepared for a test, I feel very anxious"
* = no statistically significant difference

More teacher support and less anxiety Figure III.4.5
5% less likely 4% less likely
16% more likely
29% more likely
9% less likely
17% less likely
44% more likely
60% more likely
The teacher adapts the lesson to my class’s needs
and knowledge
The teacher providesindividual help when astudent has difficulties
understanding a topic or task
Teachers graded me harderthan they graded other
students
Teachers gave me theimpression that they think Iam less smart than I really
am
Odds r
atios (
logarith
mic
scale
)
Even if I am well prepared for a test I feel very anxious
I get very tense when I studyMore likely
Less likely
As likely

Sense of belonging relates to disciplinary climate
-0,10
0,00
0,10
0,20
0,30
0,40
0,50
0,60K
azakhsta
nR
om
an
iaF
YR
OM
Jord
an
Le
ban
on
Ma
laysia
Sw
itzerl
and
Un
ite
d A
rab E
mira
tes
Cro
atia
Sw
ede
nG
eo
rgia
Do
min
ican
Rep
ublic
Mo
ldova
Bra
zil
B-S
-J-G
(C
hin
a)
Turk
ey
Alb
ania
Lithu
ania
Japa
nS
pain
Austr
iaB
ulg
aria
Tu
nis
iaP
eru
Lu
xe
mbo
urg
Ita
lyT
ha
iland
Germ
any
Ru
ssia
Kosovo
Fin
land
Fra
nce
Irela
nd
Austr
alia
CA
BA
(A
rgentina
)N
eth
erl
and
sE
sto
nia
Me
xic
oV
iet
Nam
Ch
ileU
nite
d K
ing
dom
Qata
rT
rin
ida
d a
nd T
obag
oC
olo
mbia
OE
CD
avera
ge
Pola
nd
Gre
ece
Uru
guay
Mo
nte
neg
roS
lovak R
epub
licC
zech R
epu
blic
No
rwa
yS
loven
iaIn
don
esia
Ch
ine
se
Taip
ei
De
nm
ark
Kore
aB
elg
ium
Alg
eria
Icela
nd
Port
ug
al
Hu
nga
ryH
ong K
on
g (
Ch
ina
)M
aca
o (
Ch
ina
)C
anad
aN
ew
Zeala
nd
Sin
gapo
reLa
tvia
Co
sta
Ric
aU
nite
d S
tate
sM
alta
Mean index difference After accounting for students' and schools' socio-economic profile
Before accounting for students' and schools' socio-economic profile
Figure III.7.6
Students report higher sense of belonging in schools
with a more positive disciplinary climate

1
2
Ru
ssia
Mo
nte
neg
ro
Cro
atia
Un
ite
d A
rab E
mira
tes
Tun
isia
Irela
nd
Gre
ece
Esto
nia
No
rwa
y
Fra
nce
Slo
vak R
epub
lic
Japa
n
Uru
guay
Pola
nd
Sin
gapo
re
Hu
nga
ry
Germ
any
Tha
iland
Bra
zil
Me
xic
o
Sw
itzerl
and
Un
ite
d K
ing
dom
Belg
ium
Austr
alia
Un
ite
d S
tate
s
La
tvia
Ne
w Z
eala
nd
Slo
ven
ia
OE
CD
avera
ge
Ne
therl
and
s
Czech R
epu
blic
Ma
ca
o (
Ch
ina
)
Ch
ine
se
Taip
ei
B-S
-J-G
(C
hin
a)
Qata
r
Bulg
aria
Ho
ng K
on
g (
Chin
a)
Spain
Lu
xe
mbo
urg
Port
ug
al
Austr
ia
Icela
nd
Peru
Ch
ile
Co
sta
Ric
a
De
nm
ark
Kore
a
Sw
ede
n
Fin
land
Do
min
ican
Rep
ublic
Co
lom
bia
Turk
ey
Lithu
ania
Odds ratio After accounting for students' and schools' socio-economic profile
Before accounting for students' and schools' socio-economic profile
Students' who perceive teachers' unfairness
are feeling more likely as outsiders G
reat
er a
linea
tio
n
Figure III.7.9
Students who perceive unfair behaviour report that: "Teachers
disciplined me more harshly than other students", "Teachers ridiculed
me in front of others" or "Teachers said something insulting to me in
front of others“ a few times a month or once a week or more

6
4
Relative performance in collaborative problem solving,
by socio-economic status
Source: PISA 2015 Results (Volume V): Collaborative Problem Solving. Figure V 4.9
40
45
50
55
60
Ice
lan
d
-1
0
Ko
rea
-8
Mac
ao (
Ch
ina)
-
7
Au
stri
a
Sin
gap
ore
Fin
lan
d
Spai
n
No
rway
Ger
man
y
Swed
en
Jap
an
Au
stra
lia
New
Zea
lan
d
Po
rtu
gal
Cze
ch R
epu
blic
Fran
ce
OEC
D a
vera
ge
Can
ada
Un
ite
d S
tate
s
Un
ite
d K
ingd
om
Ital
y
Be
lgiu
m
Slo
ven
ia
Lith
uan
ia
Bra
zil
6
Bu
lgar
ia
6
Un
ite
d A
rab
Em
irat
es
7
B-S
-J-G
(C
hin
a)
Turk
ey
8
Ru
ssia
9
Me
xico
1
1
Pe
ru
12
Co
lom
bia
1
4
% Disadvantaged students Advantaged students
Dif
fere
nce
in t
he
per
cen
tage
of
stu
den
ts w
ho
per
form
hig
her
th
an e
xpec
ted
in c
olla
bo
rati
ve
pro
ble
m s
olv
ing
(ad
van
tage
d -
d
isad
van
tage
d s
tud
ents
)

• The voluntary nature of the flexibility ensure incremental change for school leaders and teachers.
• The pilot helped to identify enthusiastic school leaders and teachers, as a source holder of good practices e.g. teachers working together
• The pilot empowered exemplar teachers by legitimising and endorsing good practices
• The pilot gathered emerging and existing evidence of teacher innovation, leadership, and creativity as well as teacher well-being.
STRENGTHS – school and teacher level

• The cultural shift for school leaders and teachers: from preparing for the national exam to more collaborative form of working, different role of teachers, valuing student agency and co-agency
• Networking and professional exchange: It is arranged rather ad hoc or informally. The degree and relevance is up to school leaders.
• Teaching workforce structure and status: older than the OECD average, status of teaching profession.
• Different degree of curriculum innovation within and across schools.
CHALLENGES – School and teacher level

Pola
nd
Serb
ia
Cro
atia
Spain
Port
ug
al
Slo
vak R
epub
lic
Engla
nd
(U
K)
Isra
el
Austr
alia
Czech R
epu
blic
Fra
nce
Fin
land
No
rwa
y
Fla
nde
rs (
Belg
ium
)
Ita
ly
Ave
rage
Bulg
aria
La
tvia
Ro
man
ia
Bra
zil
De
nm
ark
Esto
nia
Me
xic
o
Sw
ede
n
Ne
therl
and
s
Ch
ile
Sin
gapo
re
Icela
nd
Alb
ert
a (
Ca
nada
)
Abu D
hab
i (U
AE
)
Kore
a
Japa
n
Ma
laysia
Un
ite
d S
tate
s
0
10
20
30
40
50
60
70
Instructional leadership training or course School administration or principal training programme or course
Teacher training/education programme or course
Mean mathematics performance, by school location, after accounting for socio-economic status Fig II.3.3 67 67 Elements not included in principals' formal education
Percentage of lower secondary principals whose formal education did not include:

Collaboration between teachers and principals in lower secondary education
(TALIS 2013) Percentage of principals who report having engaged "often" or "very often" in the following leadership activities during the 12 months prior to the survey
0
10
20
30
40
50
60
70
80
90
100%
Observe instruction in the classroom Take action to support co-operation among teachers to develop new teaching practices
Take action to ensure that teachers take responsibility for improving their teaching skills
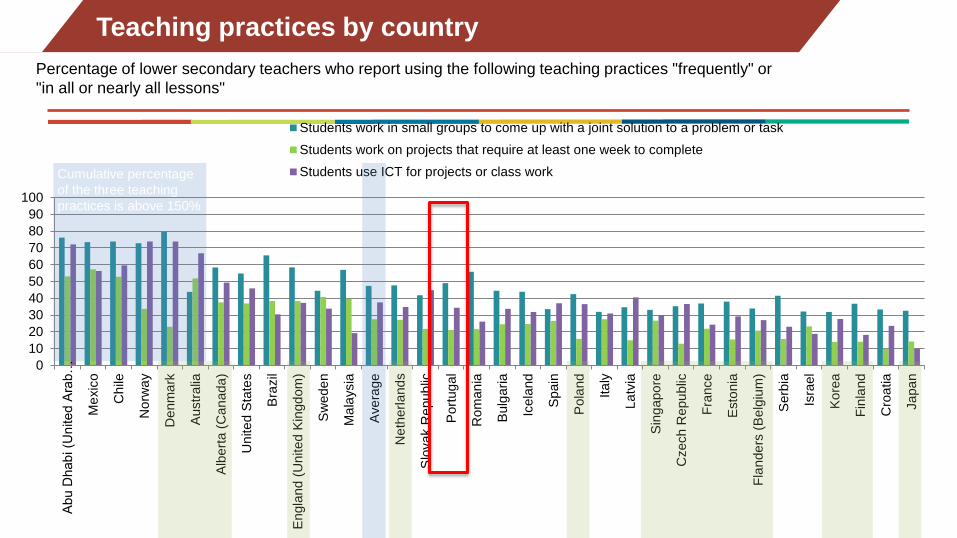
Mean mathematics performance, by school location, after accounting for socio-economic status Fig II.3.3 69 Teaching practices by country
Percentage of lower secondary teachers who report using the following teaching practices "frequently" or
"in all or nearly all lessons"
0
10
20
30
40
50
60
70
80
90
100
Abu D
hab
i (U
nite
d A
rab…
Me
xic
o
Ch
ile
No
rwa
y
De
nm
ark
Austr
alia
Alb
ert
a (
Can
ada
)
Un
ite
d S
tate
s
Bra
zil
Engla
nd
(U
nited
Kin
gd
om
)
Sw
ede
n
Ma
laysia
Ave
rage
Ne
the
rla
nd
s
Slo
vak R
epub
lic
Port
ug
al
Ro
man
ia
Bulg
aria
Icela
nd
Spain
Pola
nd
Ita
ly
La
tvia
Sin
gapo
re
Czech R
epu
blic
Fra
nce
Esto
nia
Fla
nde
rs (
Belg
ium
)
Serb
ia
Isra
el
Kore
a
Fin
land
Cro
atia
Japa
n
Students work in small groups to come up with a joint solution to a problem or task
Students work on projects that require at least one week to complete
Students use ICT for projects or class workCumulative percentage
of the three teaching
practices is above 150%

0
10
20
30
40
50
60
70
80
90
100
Spain
Icela
nd
Fra
nce
Bra
zil
Fla
nde
rs…
Port
ug
al
Fin
land
Cro
atia
Ita
ly
Isra
el
Sw
ede
n
Me
xic
o
Ch
ile
Alb
ert
a…
Un
ite
d S
tate
s
No
rwa
y
De
nm
ark
Ave
rage
Austr
alia
Ma
laysia
Czech…
Bulg
aria
Esto
nia
Ne
therl
and
s
Serb
ia
Slo
vak…
Abu D
hab
i…
Sin
gapo
re
Engla
nd
(U
K)
Pola
nd
Ro
man
ia
La
tvia
Japa
n
Kore
a
Perc
en
tag
e o
f te
ach
ers
Never observe otherteachers' classes andprovide feedback
Never teach jointly as ateam in the same class
Never engage in jointactivities across differentclasses and age groups(e.g. projects)Never take part incollaborative professionallearning
Mean mathematics performance, by school location, after accounting for socio-economic status Fig II.3.3 70 Teacher co-operation: Professional collaboration
Percentage of lower secondary teachers who report never doing the following activities

Mean mathematics performance, by school location, after accounting for socio-economic status Fig II.3.3 71
Teachers feedback :
direct classroom observations
0
10
20
30
40
50
60
70
80
90
100B
ulg
aria
Pola
nd
Un
ite
d S
tate
s
Ro
man
ia
Alb
ert
a…
Cro
atia
Czech R
epu
blic
Abu D
hab
i…
Fla
nde
rs…
Serb
ia
Slo
vak R
epub
lic
Japa
n
Isra
el
Ave
rage
Sin
gapo
re
La
tvia
Bra
zil
Me
xic
o
Ma
laysia
Sw
ede
n
Esto
nia
Engla
nd
(U
K)
No
rwa
y
Fin
land
Port
ug
al
De
nm
ark
Kore
a
Ch
ile
Ita
ly
Ne
therl
and
s
Fra
nce
Spain
Icela
nd
Austr
alia
Perc
en
tag
e o
f te
ach
ers
Principals School Management Other teachers

Mean mathematics performance, by school location, after accounting for socio-economic status Fig II.3.3 72
Countries where teachers believe their profession is valued
show higher levels of student achievement
Relationship between lower secondary teachers' views on the value of their profession in society and the country’s
share of top mathematics performers in PISA 2012
Australia
Brazil
Bulgaria Chile
Croatia
Czech Republic Denmark
Estonia Finland France
Iceland Israel
Italy
Japan
Korea
Latvia
Mexico
Netherlands
Norway
Poland
Portugal
Romania Serbia
Singapore
Slovak Republic
Spain Sweden
Alberta (Canada)
England (UK)
Flanders (Belgium)
United States
0
5
10
15
20
25
30
35
40
45
0 10 20 30 40 50 60 70 80
Shar
e o
f m
ath
em
atic
s to
p p
erf
orm
ers
Percentage of teachers who agree that teaching is valued in society
R2 = 0.24 r= 0.49

• Ensure continuity from past, now, and future
• Prioritize school leadership training
• Use the pilot as an opportunity to cultivate/ change a culture of teacher feedback
• Create a new path to teaching profession (as part of the preparation of retirement of a large teaching workforce) e.g. pedagogical support qualifications e.g. ICT, project management
• Collect exemplars e.g. specific features of good practices, emerging models of “interdisciplinary subjects”, different assessment practices;
• Capitalise on the existing channels e.g. school clusters, network of libraries, association of professional subjects to share good practices
RECOMMENDATIONS – School and teacher level