Embed Size (px)
Citation preview

OECD & Ministry of Natural Resources and Environment
Waste Management Seminar
Sept. 2011Moscow
Love Environment Inc.126 William Street, Stratford, Ontario N5A 4Y1
Tel: 519- 305- 0984 Cell: 647-248-2500
Love Environment Inc. 2
Presentation Outline Background
◦ what is counted as MSW in Canada◦ MSW management as a shared responsibility◦ national MSW tonnes generated, disposed and diverted◦ current status of MSW in Canada
EPR
◦ what is extended producer responsibility - OECD definition/history
◦ Why/benefits of EPR◦ Canadian Stewardship Programs◦ BC/Quebec/New Brunswick/Ontario new initiatives◦ packaging and printed paper in Ontario◦ voluntary vs Mandatory programs
Lessons Learned
◦ harmonization and the role business◦ EPR issues and opportunities in Canada◦ Possible implications as the Russian Federation considers EPR
Love Environment Inc. 3
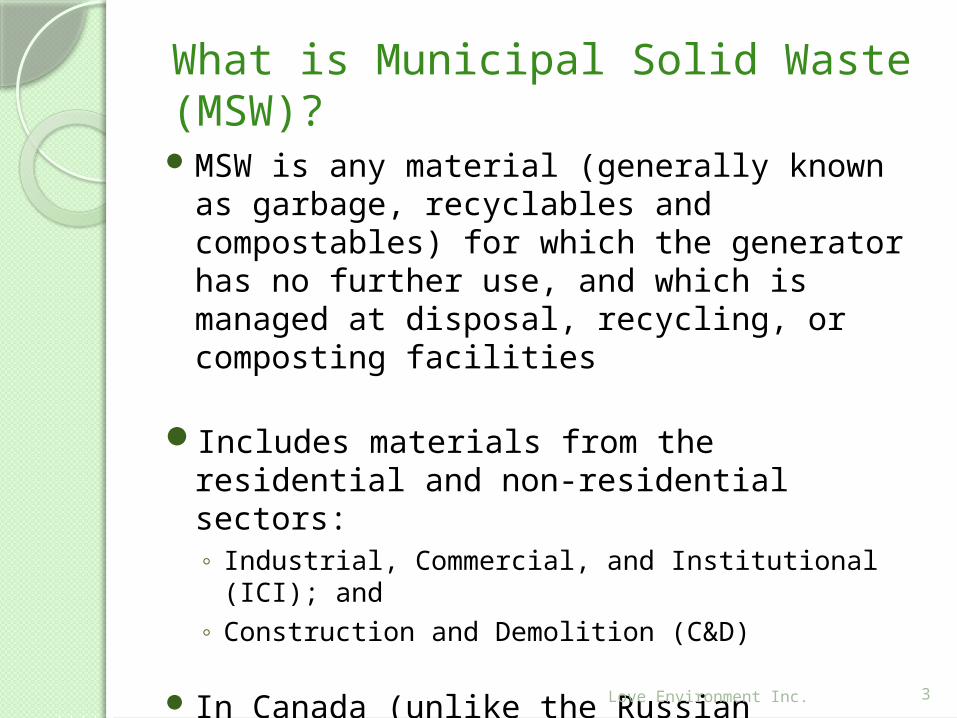
MSW is any material (generally known as garbage, recyclables and compostables) for which the generator has no further use, and which is managed at disposal, recycling, or composting facilities
Includes materials from the residential and non-residential sectors:◦ Industrial, Commercial, and Institutional (ICI); and ◦ Construction and Demolition (C&D)
In Canada (unlike the Russian Federation) residential and ICI waste are measured, managed and paid for separately
What is Municipal Solid Waste (MSW)?

Love Environment Inc. 4
MSW Management is a Shared Jurisdiction
Jurisdictional Roles:Municipal:
◦ responsible for the collection, diversion, and disposal of MSW from residential sources; commonly own landfills and implement by-laws to drive diversion; primary service or contracting agent for residential waste services
Provincial/Territorial:◦ movements of wastes within jurisdiction, licensing of
generators, carriers and treatment facilities, extended producer responsibility policy and program development; provincial generation, diversion and disposal tracking
Federal:◦ international agreements; transboundary movements of
hazardous waste, hazardous recyclable material, and non-hazardous waste; CEPA 1999
◦ Developing national initiatives, gathering statistics and performing analyses, supporting innovation, providing information, and building capacity; encouraging inter-provincial collaboration (e.g. EPR program harmonization through Council of Ministers of the Environment)

Love Environment Inc. 5
MSW Generation
2000 2002 2004 2006 2008 % change (2002-2008)
Tonnes(million)
29.3 30.7 32.3 33.7 34.3 +12%
Kg/capita 952 980 1,011 1,033 1,031 +5%
Population (million) 30.8 31.4 32 31.6 33.3 +6%
Quantities of MSW* generated (diverted + disposed)

Love Environment Inc. 6
MSW Diversion & Disposal
Quantities of MSW* diverted (recycled + composted)2000 2002 2004 2006 2008 % change
(2002-2008)
MTonnes 6.1 6.6 7.1 7.7 8.5 +29%
Kg/capita 199 212 222 237 254 +20%
% diversion 21 22 22 23 25 +14%
Quantities of MSW* to disposal (landfilling and thermal treatment) 2000 2002 2004 2006 2008
% change (2002-2008)
MTonnes 23.2 24.1 25.2 25.9 25.9 +7%
Kg/capita 752 768 789 796 777 +1%
* Includes Residential, ICI and C&D

Love Environment Inc. 7
OpportunitiesMSW between 2002 and 2008:
◦ Generation: 12% increase ◦ Disposal: 7% increase◦ Diversion rates: 22% to 25% (stagnant)
Residential waste between 2002 and 2008:◦ Generation: 6% increase◦ Disposal: 9.6% decrease◦ Diversion rates: from 23% to 34%
Non-residential waste between 2002 and 2008:◦ Generation: 16% increase◦ Disposal: 18% increase◦ Diversion rate: from 21% down to 19%
97% of the MSW for disposal is landfilled GHG emissions from landfills are decreasing slightly
Love Environment Inc. 8
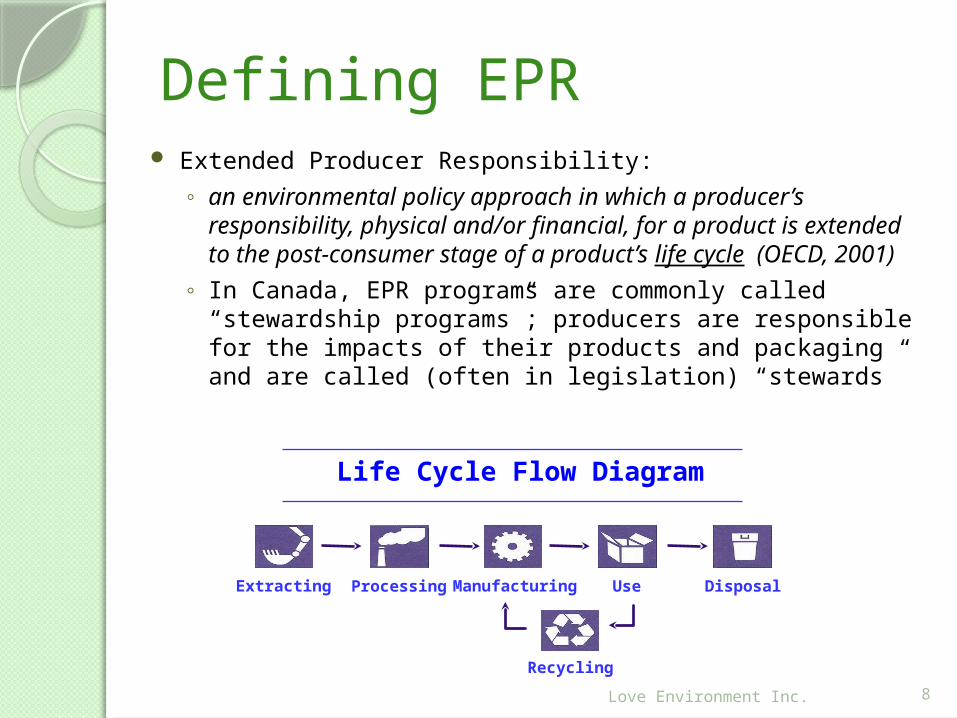
Defining EPR Extended Producer Responsibility:
◦ an environmental policy approach in which a producer’s responsibility, physical and/or financial, for a product is extended to the post-consumer stage of a product’s life cycle (OECD, 2001)
◦ In Canada, EPR programs are commonly called “stewardship programs”; producers are responsible for the impacts of their products and packaging and are called (often in legislation) “stewards”
Recycling
DisposalUseManufacturingProcessingExtracting
Life Cycle Flow Diagram

Love Environment Inc. 9
Why EPR ? What benefits?
Waste quantities continue to grow – slowly but steadily◦ Total disposal: 2000 = 23,168,870 tonnes; 2006 = 27,249,177
tonnes◦ Per capita disposal: 2000 = 752 kg/capita; 2006 = 835kg/capita
(Statistics Canada data); now over one tonne per person per year◦ Waste diversion rate have stalled at about 24%
Concerns about hazardous waste and toxic substances◦ Challenges with specific waste streams – e.g. used crankcase oil,
household hazardous wastes, electronics, ozone depleting substances
◦ Environment Canada/Health Canada Chemicals Management Plan – categorization, assessment and risk management (under CEPA
1999) Need to address problematic wastes, avoid disposal
and manage residuals in an environmentally sound manner
Need for cost accounting for the full life-cycle of a product
Need for incentives for better environmental design THE KEY : Need to shift to a non-tax funding
mechanism

Love Environment Inc. 10
First curbside pilot recycling program – Kitchener, Ontario 1981 – I was there!!
Optimism about the waste diversion benefits of recycling ◦ Municipally funded
◦ Initial Ontario and beverage industry subsidy for operating costs and start-up capital
National Packaging Protocol – 1989 - 2000 ◦ Voluntary shared industry, government, consumer responsibility
model
◦ Multi-stakeholder National Packaging Task Force formed in 1989
◦ National target of 50% reduction in packaging waste
by December 2000 – 20% by Dec 1992; 35% by Dec 1996
◦ Statistics Canada surveys; Environment Canada secretariat
◦ Met 50% target in 1996
◦ Mostly business efficiencies - less impact on consumer packaging
◦ Wrapped up in 2000
Canada has been at this a long time!

Love Environment Inc. 11
Advent of single stream recycling – recycling service must be as convenient as disposal (Ontario 3Rs Regulations)
Emergence & growth of organics diversion programs – windrow/in-vessel technologies (more tonnes diverted now from organics than household blue boxes)
Advancements in collection vehicles, processing systems (e.g. optical sorting technologies) and markets (e.g. thermoform PET)
Innovations in program financing – user pay/pay-as-you-throw programs & dedicated waste utilities
Consumer education, engagement & demandsSocial media exploding
Key developments in waste management/waste diversion in Canada & internationally in the 2000s

Love Environment Inc. 12
CCME CANADA-WIDE ACTION PLAN FOR EPR
Canadian Council of Ministers of the Environment (CCME) EPR Task Force provided broad guidance on EPR◦ Canada-wide Principles for Electronics Product Stewardship ◦ Canada-wide Principles for EPR◦ EPR product evaluation tool
Canada-wide Action Plan for EPR, October 2009 – promotes co-ordinated and harmonized EPR action on priority products by an agreed timetable:
◦ Phase 1 (within 6 years) – packaging and printed papers; mercury containing lamps; electronics; household hazardous and special wastes; automotive products
◦ Phase 2 (within 8 years) – construction and demolition wastes; furniture; textiles; carpet; appliances; ozone depleting substances
June 2011 CCME announcement emphasizes priority work on packaging

Love Environment Inc. 13
Key EPR Program Elements
End-of-life responsibility is transferred to producers from municipal taxpayers
Costs are borne by producers but can and often are passed on to consumers through visible point of purchase fees
Producers are free to act collectively or individually Producers obligated to prepare stewardship plans and
meet targets Governments level the playing field and monitor and
enforce targets Best programs operate within flexible performance-
based regulatory frameworks i.e. minimal government role in operational details
Consumers have free and reasonable access to the program with a responsibility to participate
Programs aim to encourage environmental design (not very successfully so far!!)
Love Environment Inc. 14
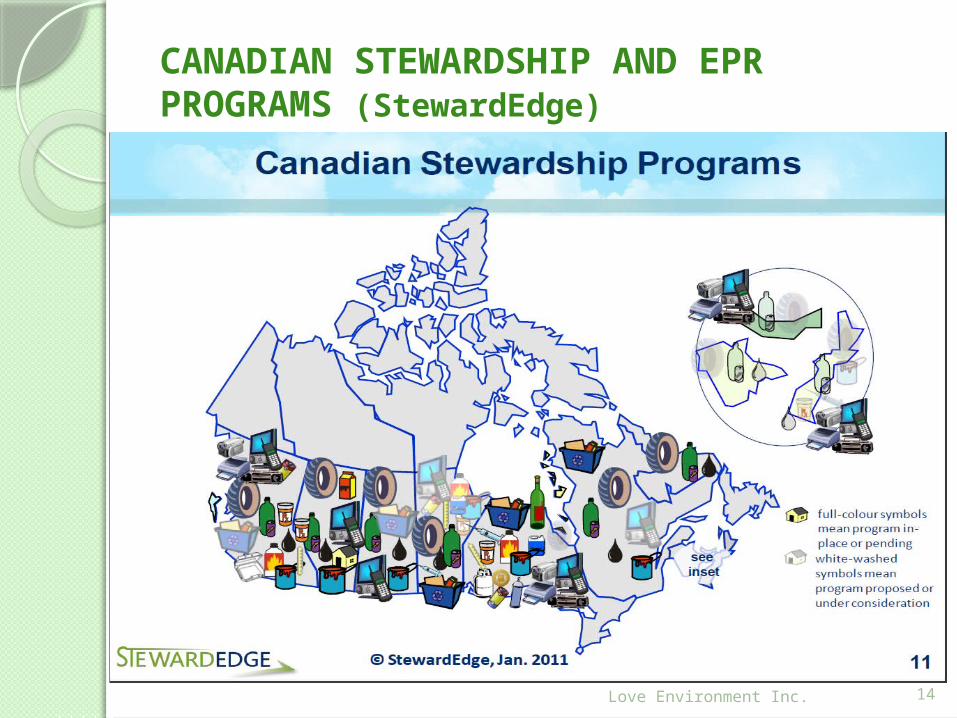
CANADIAN STEWARDSHIP AND EPR PROGRAMS (StewardEdge)

Love Environment Inc. 15
CANADIAN STEWARDSHIP AND EPR PROGRAMS (MGM Management)

Love Environment Inc. 16
Packaging and Printed Paper: Ontario
50%Shared responsibility model Program directed and approved through Waste Diversion OntarioProducers, through Stewardship Ontario, fund
50% of net eligible municipal program costs – annual
municipal data call by WDOMunicipalities have kept operational
responsibilities Waste Diversion Act review recommended switch
to100% EPR in 2009 – recommendation has not been
acted on – hampered by MHSW eco fee controversyMore complex and prescriptive approvals process than in other provinces

Love Environment Inc. 17
Created as “non-share capital corporation” in 20041800+ obligated companies are required to report
packaging and printed paper tonnes sold into Ontario households each year
In 2011, stewards paid municipalities $92 million (50% of total costs) for blue box recycling for 4 million households – system diverts about 1 million tonnes/year
Stewards also invest (about $8 million/year)in municipal program improvements
Agreement stipulates that stewards pay to “best practice costs”
Stewardship Ontario – Ontario collective “steward” for printed paper and packaging
Love Environment Inc. 18
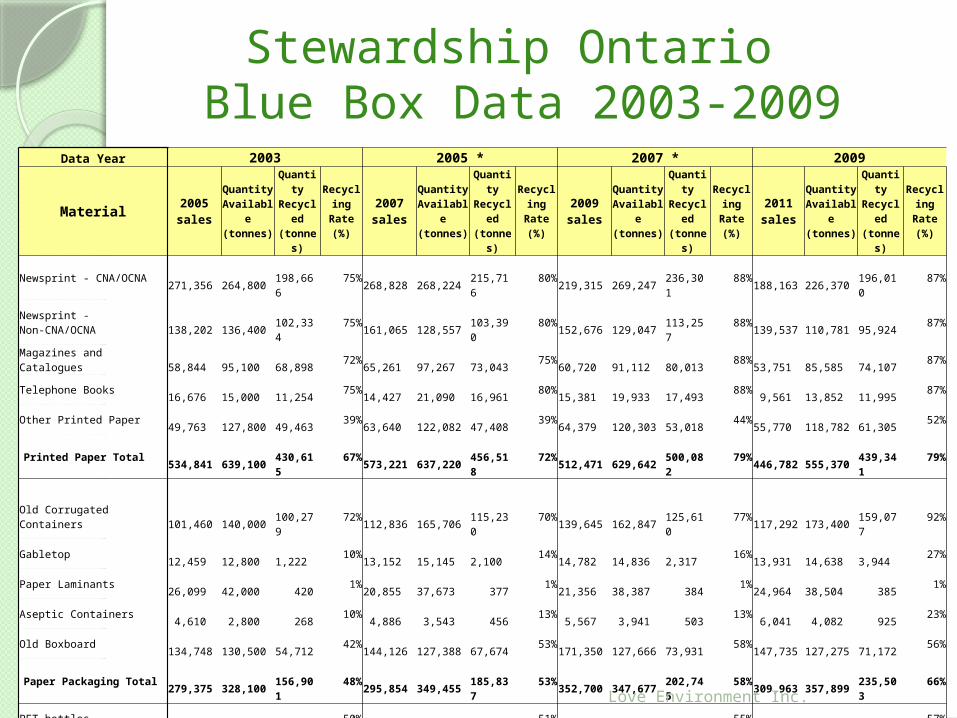
Stewardship Ontario Blue Box Data 2003-2009
Data Year 2003 2005 * 2007 * 2009
Material 2005 salesQuantity Available(tonnes)
Quantity Recycled(tonnes)
Recycling Rate
(%)2007 sales
Quantity Available(tonnes)
Quantity Recycled(tonnes)
Recycling Rate
(%)2009 sales
Quantity Available(tonnes)
Quantity Recycled(tonnes)
Recycling Rate
(%)2011 sales
Quantity Available(tonnes)
Quantity Recycled(tonnes)
Recycling Rate
(%)
Newsprint - CNA/OCNA 271,356 264,800 198,666 75% 268,828 268,224 215,716 80% 219,315 269,247 236,301 88% 188,163 226,370 196,010 87%Newsprint - Non-CNA/OCNA 138,202 136,400 102,334 75% 161,065 128,557 103,390 80% 152,676 129,047 113,257 88% 139,537 110,781 95,924 87%Magazines and Catalogues 58,844 95,100 68,898 72% 65,261 97,267 73,043 75% 60,720 91,112 80,013 88% 53,751 85,585 74,107 87%Telephone Books 16,676 15,000 11,254 75% 14,427 21,090 16,961 80% 15,381 19,933 17,493 88% 9,561 13,852 11,995 87%Other Printed Paper 49,763 127,800 49,463 39% 63,640 122,082 47,408 39% 64,379 120,303 53,018 44% 55,770 118,782 61,305 52%Printed Paper Total 534,841 639,100 430,615 67% 573,221 637,220 456,518 72% 512,471 629,642 500,082 79% 446,782 555,370 439,341 79%
Old Corrugated Containers 101,460 140,000 100,279 72% 112,836 165,706 115,230 70% 139,645 162,847 125,610 77% 117,292 173,400 159,077 92%Gabletop 12,459 12,800 1,222 10% 13,152 15,145 2,100 14% 14,782 14,836 2,317 16% 13,931 14,638 3,944 27%Paper Laminants 26,099 42,000 420 1% 20,855 37,673 377 1% 21,356 38,387 384 1% 24,964 38,504 385 1%Aseptic Containers 4,610 2,800 268 10% 4,886 3,543 456 13% 5,567 3,941 503 13% 6,041 4,082 925 23%Old Boxboard 134,748 130,500 54,712 42% 144,126 127,388 67,674 53% 171,350 127,666 73,931 58% 147,735 127,275 71,172 56%Paper Packaging Total 279,375 328,100 156,901 48% 295,854 349,455 185,837 53% 352,700 347,677 202,745 58% 309,963 357,899 235,503 66%
PET bottles 37,955 36,200 18,120 50% 49,285 45,362 23,192 51% 55,210 49,025 26,904 55% 49,342 44,553 25,557 57%HDPE bottles 24,333 23,000 11,551 50% 24,751 25,689 13,328 52% 24,255 26,744 15,201 57% 27,443 26,551 14,641 55%Plastic Film 51,554 53,700 2,993 6% 55,444 61,616 4,995 8% 54,678 59,213 4,822 8% 42,119 53,029 5,209 10%Plastic Laminants 16,633 57,400 574 1% 16,982 25,613 256 1% 20,476 29,186 285 1% 23,840 32,317 323 1%Polystyrene 14,268 20,400 541 3% 12,804 22,544 394 2% 14,440 21,971 417 2% 13,166 20,780 992 5%Other Plastics 36,767 28,300 1,603 6% 53,588 44,939 3,594 8% 57,627 53,356 5,353 10% 56,416 57,887 11,815 20%Plastics Total 181,509 219,000 35,382 16% 212,854 225,763 45,759 20% 226,686 239,495 52,982 22% 212,325 235,117 58,537 25%
Food & Beverage Cans 59,663 57,800 30,447 53% 49,387 47,495 31,290 66% 44,787 49,351 31,132 63% 43,885 47,244 31,479 67%Aerosols 5,153 4,300 1,008 23% 4,758 3,957 1,036 26% 7,344 4,337 1,054 24% 4,233 4,172 927 22%Paint Cans 7,950 4,800 1,128 24% 5,152 6,758 1,159 17% 5,780 5,788 1,179 20% 5,335 5,382 978 18%Steel Total 72,767 66,900 32,583 49% 59,297 58,210 33,485 58% 57,911 59,476 33,365 56% 53,452 56,798 33,384 59%
Al Food & Beverage Cans 28,352 24,100 9,832 41% 27,143 22,604 10,743 48% 25,788 22,578 9,925 44% 24,016 22,287 10,515 47%Other Aluminum Packaging 2,426 2,408 282 12% 2,900 3,648 308 8% 3,804 3,897 301 8% 3,470 3,590 325 9%Aluminum Total 30,778 26,508 10,114 38% 30,044 26,252 11,051 42% 29,592 26,475 10,226 39% 27,486 25,877 10,840 42%
Food and Beverage - Flint 128,922 121,800 69,976 57% 78,041 73,980 45,238 61% 90,123 70,425 59,528 85% 83,233 79,470 74,413 94%Food and Beverage - Coloured 68,025 72,900 44,273 61% 8,988 15,211 9,061 60% 25,219 9,829 7,041 72% 25,982 22,868 18,196 80%Glass Total 196,947 194,700 114,249 59% 87,029 89,191 54,299 61% 115,341 80,254 66,569 83% 109,215 102,338 92,609 90%Packaging Total 761,377 835,208 349,229 42% 685,077 748,871 330,431 44% 782,231 753,377 365,887 49% 712,441 778,029 430,873 55%
Printed Paper & Packaging Total 1,296,218 1,474,308 779,844 53% 1,258,298 1,386,091 786,949 57% 1,294,702 1,383,019 865,969 63% 1,159,224 1,333,399 870,214 65%
Love Environment Inc. 19
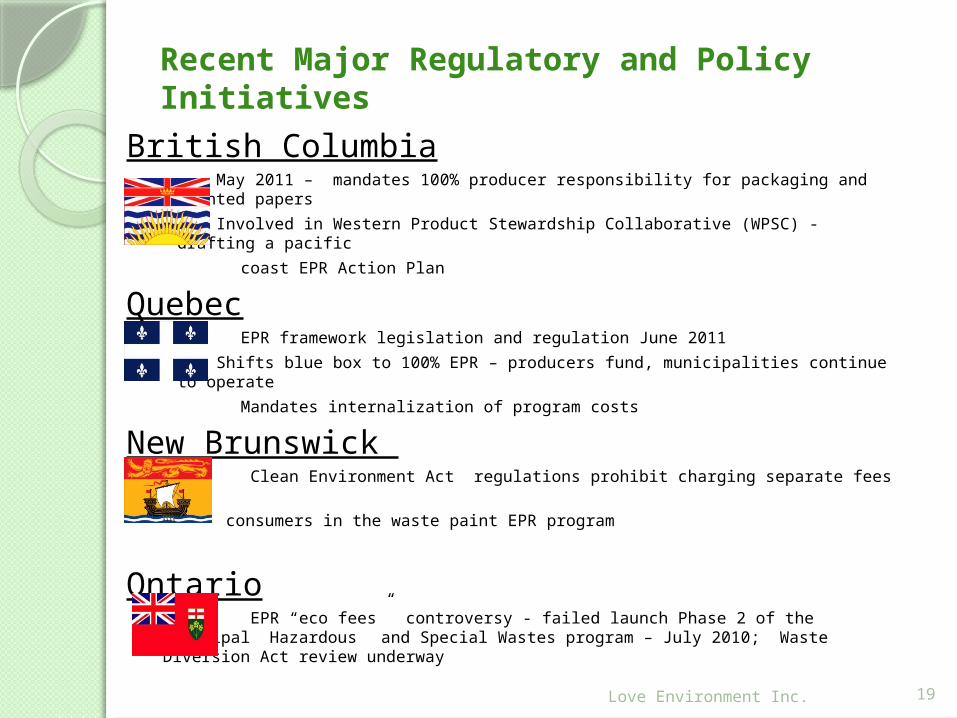
Recent Major Regulatory and Policy Initiatives
British Columbia◦ May 2011 – mandates 100% producer responsibility for packaging and printed
papers
◦ Involved in Western Product Stewardship Collaborative (WPSC) - drafting a pacific
coast EPR Action Plan
Quebec EPR framework legislation and regulation June 2011
◦ Shifts blue box to 100% EPR – producers fund, municipalities continue to operate
Mandates internalization of program costs
New Brunswick Clean Environment Act regulations prohibit charging separate fees to
◦ consumers in the waste paint EPR program
Ontario EPR “eco fees” controversy - failed launch Phase 2 of the Municipal Hazardous and Special Wastes program – July 2010; Waste Diversion Act review underway

Love Environment Inc. 20
The Move from Voluntary to Mandated Programs
Established and voluntary programs being covered by EPR regulations Pesticide Containers
Manitoba – CleanFARMS submitted a stewardship plan for their existing program
B.C.’s packaging regulation will be expanded in the
future to cover non-residential packaging, potentially
including agricultural packaging
Batteries The RBRC Chargeup2Recycle program is now expanding to accept all
batteries and is covered under EPR regulations in B.C., Manitoba, Ontario
and shortly in Quebec Hazardous Wastes
Originally managed through some take back to retail initiatives
In Manitoba, Ontario and Quebec significant numbers of these products are
now or will be soon directly covered under EPR regulations

Love Environment Inc. 21
Harmonization of Regulations and Policy There is broad agreement on EPR policy in Canada and the need for level
playing field regulations Provincial regulators communicate regularly, particularly between
adjoining jurisdictions where the lack of harmonization causes program difficulties
Generally regulatory harmonization still appears to be challenge for governments particularly given an apparent weakening of the CCME role
Harmonization of Programs Harmonization is increasingly less of an issue for producers who have
shown an ability to work together between programs Program cooperation and harmonization for electronics and used oil have
shown results Producers are also starting to coordinate within jurisdictions – e.g. Recently
formed Stewardship Agencies of British Columbia organization – province-wide EPR program guide
Harmonization of Regulations and Programs

Love Environment Inc. 22
EMERGING CHALLENGES AND OPPORTUNITIES
EPR concept is well established in Canada - no longer any real debate about the merits
Debate has shifted - now focused on how to make EPR programs more effective and efficient for both producers and for governments
With growing program maturity there are a number of emerging challenges and opportunities:◦ Fulfilling the promise and potential of the CCME EPR Action Plan◦ Moving beyond residential wastes to those from the industrial, commercial
and institutional sectors◦ Harmonization of both regulations and programs◦ Cost internalization and fees◦ Driving environmental improvements◦ Increasing complexity with increasing programs and product designation◦ Moving towards true producer “cradle to grave” responsibility

Love Environment Inc. 23
Historic focus on wastes and products from the residential sector
Waste diversion targets and environmental product improvement objectives cannot be met unless the ICI sectors are engaged
The CCME EPR Action Plan makes no distinction between residential and ICI sources
EPR regulations are being proposed to cover ICI sources as well as residential (e.g. Quebec and BC)
The move to cover ICI sources will bring a new set of producers, who at the moment are generally ill-informed about EPR
ICI sources will challenge existing recycling capacity - EPR programs will have to phase in and adapt to new volumes
Covering the Industrial Commercial and Institutional (ICI) Sectors

Love Environment Inc. 24
A complicated issue that needs to be addressed in the context of other issues such as EPR objectives to incentivize product environmental improvements
The Canada-wide EPR Action Plan supports program costs being internalized as a factor of production
A number of programs do operate with no visible fee to the consumer and internalized costing
The majority of EPR regulations in Canada are silent on the cost internalization/fee visibility issue◦ A significant number of programs operate with visible point of
purchase fees
◦ Visible fees have been accepted in the majority of cases by consumers; visible fee proponents point to its consumer education value – ie diversion costs money
◦ Some producers are strongly opposed to cost internalization
Visible fees can however be very controversial - Ontario July 2010 Quebec and New Brunswick are the only two jurisdictions so far
to regulate against visible consumer fees
Cost Internalization and Fees – an on-going issue and debate in Canada
Love Environment Inc. 25
EPR Lessons◦ EPR is applicable to a wide range of end-of-life products and
wastes◦ EPR programs can meet high waste diversion targets ◦ Producers can organize and operate programs without
compromising other business objectives◦ Successful programs are built on effective measurement and
mature management systems◦ The public is supportive, generally governments of all political
persuasions are on side and businesses are engaged
What to look for in the years ahead in Canada◦ Continuing growth in the number and scope of programs ◦ Harmonization – largely driven by producers to reduce costs◦ Moves by governments and by producers to internalize program
costs ◦ Increasing coordination of program promotion and education◦ Municipalities vacating direct program operations (partly to
reduce costs)
EPR LESSONS FROM CANADA AND WHAT TO WATCH FOR
Love Environment Inc. 26
Canada – Russia similarities◦Both large land masses with
dispersed populations◦34 mil vs 140 mil◦3.73 persons km vs 8.4 persons/km
◦Both also highly urbanized◦Canada 80% urban; Russia 74%
◦Both have three levels of gov’t active in waste and cold winters (so seasonal organics and great hockey teams!)
What this might mean for EPR developments in the Russian Federation

Love Environment Inc. 27
1. Start “small” with something that is:- Manageable (e.g. beverage containers)- Important (e.g. litter reduction)- Sustainable (e.g. plastics/aluminum
revenues)- Partners exist (i.e. private sector and
other provinces/states/countries
Lots to learn from Nova Scotia, Alberta and British Columbia on how to develop/manage beverage container management programs
What this might mean for EPR developments in the Russian Federation

Love Environment Inc. 28
2. Data, data, data- Waste generation information- Residential/ICI information- Disposal/licencing information- Material specific data (e.g. on
beverage container generation, packaging types, shipping
What this might mean for EPR developments in the Russian Federation

Love Environment Inc. 29
3. Learn from the successes and failures of other jurisdictions- Legislation- Roles of producer companies- Market development- Service providers/best practices- Municipal success stories
Learn from others mistakes before you repeat them!
What this might mean for EPR developments in the Russian Federation
Love Environment Inc. 30
Organization of Economic Cooperation and Development (OECD) www.oecd.org/environment
Canadian Council of Ministers of the Environment (CCME) – Canada-wide Action Plan for EPR www.ccme.ca/ourwork/waste
Environment Canada www.ec.gc.ca/epr
British Columbia Ministry of Environment www.env.gov.bc.ca/epd/recycling
Alberta Recycling Management Authority (ARMA) www.albertarecycling.ca
Electronics Stewardship Association of British Columbia (ESABC) www.esabc.ca
Waste Diversion Ontario (WDO) www.wdo.ca
Used Oil Management Association (UOMA) www.usedoilrecycling.com
CleanFARMS www.cleanfarms.ca
Geoff Love, Love Environemnt, [email protected]
THANK YOU - FOR MORE INFORMATION