Embed Size (px)
Citation preview
1
November 16, 2014 version (1st commenting revision—references updated—after expert group
discussion)
OECD GUIDELINE FOR THE TESTING OF CHEMICALS
New Test Guideline;
In Vitro Mammalian Cell Gene Mutation Assays Using the Thymidine Kinase Gene
INTRODUCTION
1. The OECD Guidelines for the Testing of Chemicals are periodically reviewed in the light of
scientific progress, changing regulatory needs and animal welfare considerations and revised as
appropriate. This test guideline is part of a series of test Guidelines on genetic toxicology. A
document presented as an introduction to the Test Guidelines on genetic toxicology (OECD 201x) can
also be referred to and provides succinct and useful guidance to supplement these test guidelines. The
mouse lymphoma (MLA) and TK6 assays using the thymidine kinase (TK) locus were originally
contained in Test Guideline 476 adopted in 1984 and revised in 1997, based on scientific progress made
to that date. Subsequently, the MLA Expert Workgroup of the International Workshop for Genotoxicity
Testing (IWGT) has developed internationally harmonized recommendations for assay parameter
acceptance criteria and data interpretation for the MLA (Moore et al. 2000, 2002, 2003, 2006, 2007),
and these recommendations are being incorporated into this new test guideline (TGxxx). TGxxx is
written for the MLA and, because it also utilizes the TK locus, the TK6 assay. The MLA has been
widely used in a large number of laboratories, for regulatory purposes and has an extensive literature
(see Literature List). The TK6 assay has been used much less frequently and has a much smaller
literature (see Literature List). It should be noted that in spite of the similarity of the assay endpoints
the two cell lines are not interchangeable and regulatory programs may validly express a preference
for one over the other for a particular regulatory use. Because the MLA and TK6 are now covered
by this new TG, as a part of the revision process, TG476 (approved 2015) now includes only the assays
using the endogeneous hypoxanthine-guanine phosphoribosyl transferase (HPRT) gene and the much
less frequently used xanthine-guanine phosphoribosyl transferase (XPRT) transgenic AS52 line of
CHO cells.
2. Although the proper nomenclature is TK for humans and Tk for rodents, TK is used in this
guideline for convenience. TK assays can be used to detect mutations induced by chemical substances
and physical agents. This guideline is intended for use with two cell lines: the L5178Y TK+/-
-3.7.2C
mouse lymphoma cell line (generally called L5178Y and the TK6 human lymphoblastoid cell line

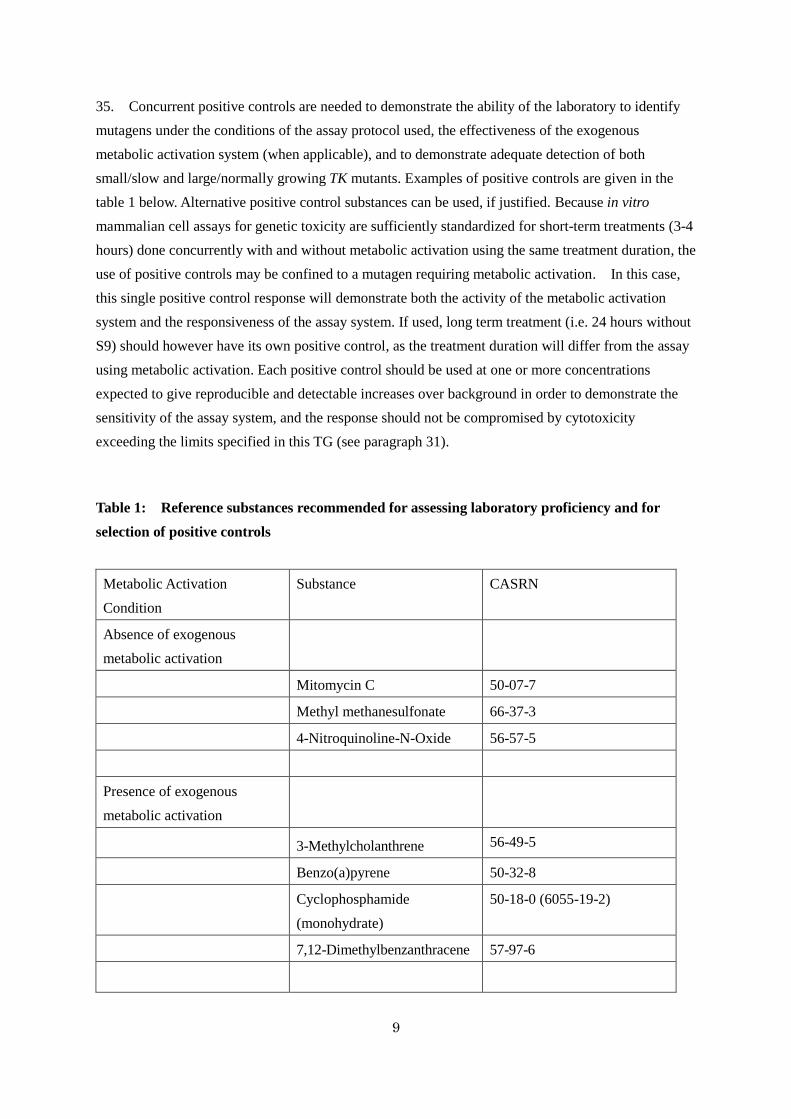
2
(generally called TK6). Although the two cell lines vary because of their origin, cell growth,
p53-status, etc., the TK gene mutation assays can be conducted in a similar way in both cell types as
described in this guideline.
3. The Test Guideline is organized so as to provide general information that applies to both MLA
and TK6 and specialized guidance for the individual assays.
4. The autosomal and heterozygous nature of the thymidine kinase gene enables the detection of
viable colonies whose cells are deficient in the enzyme thymidine kinase following mutation from
TK+/-
to TK-/-
. This deficiency can result from genetic events affecting the TK gene including both
gene mutations (point mutations, frame-shift mutations, small deletions, etc.) and chromosomal events
(large deletions, chromosome rearrangements and mitotic recombination). The latter events are
expressed as loss of heterozygosity, which is a common genetic change of tumor suppressor genes in
human tumorigenesis. Theoretically, loss of the entire chromosome carrying the TK gene resulting
from spindle impairment and/or mitotic non-disjunction can be detected in the MLA. Indeed, a
combination of cytogenetic and molecular analysis clearly shows that some MLA TK mutants are the
result of nondisjunction. However, the weight of evidence shows that the TK gene mutation assays
cannot reliably detect aneugens when applying standard cytotoxicity criteria (as described in this
guideline) and therefore, it is not appropriate to use these assays to detect aneugens (Fellows et al,
2012, Honma et al, 2001 and Wang et al, 2009).
5. In the TK gene mutation assays, two distinct phenotypic classes of TK mutants are generated; the
normal growing mutants that grow at the same rate as the TK heterozygous cells, and slow growing
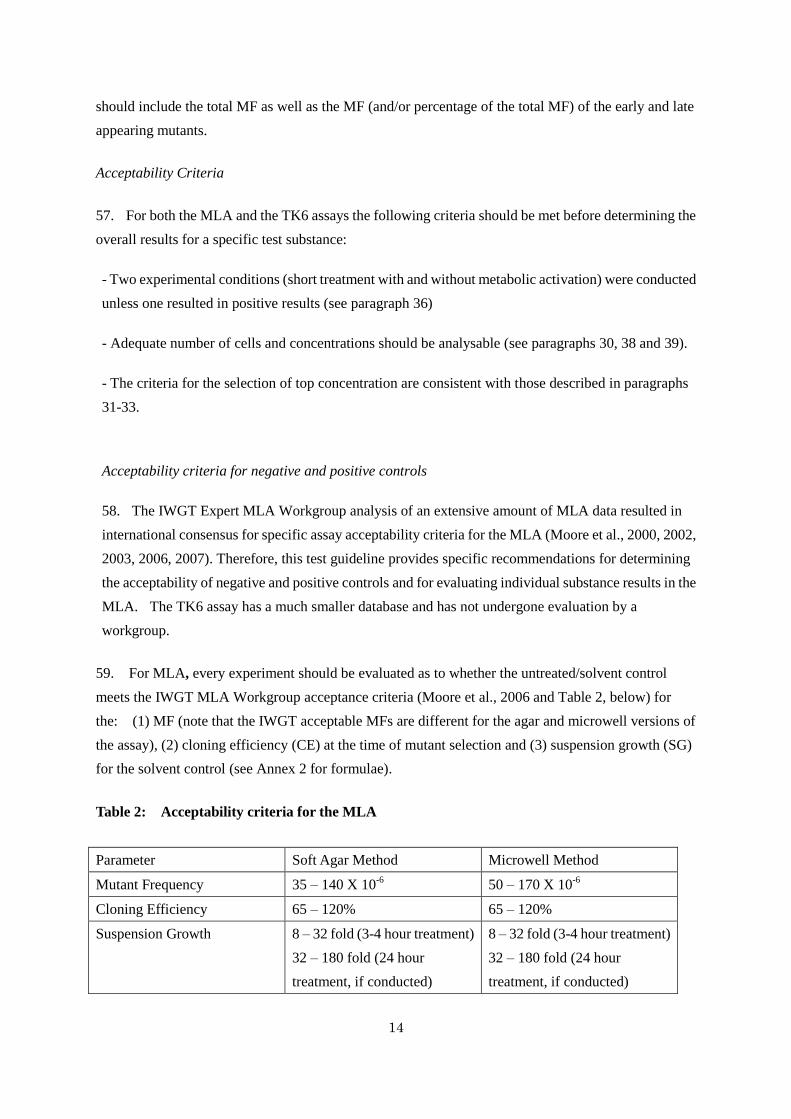
mutants which grow with prolonged doubling times. The normal growing and slow growing mutants
are recognized as large colony and small colony mutants in the MLA and as early appearing colony and
late appearing colony mutants in the TK6 assay, respectively. The molecular and cytogenetic nature of
both large and small colony MLA mutants has been explored in detail. (Applegate, et al, 1990, Honma,
et. al., 2001, Hozier et al., 1981, 1985, Moore et al., 1985; and Wang et al, 2009). The molecular and
cytogenetic nature of the early appearing and late appearing TK6 mutants has also been extensively
investigated (Liber et.al., 1987, Li et.al., 1992, Honma et al., 1997, 2000). Slow growing mutants for
both cell types have suffered genetic damage that involves putative growth regulating gene(s) near the
TK locus which results in prolonged doubling times and the formation of late appearing or small
colonies (Amundson and Liber, 1992). The induction of slow growing mutants has been associated with
substances that induce gross structural changes at the chromosomal level. Cells whose damage does
not involve the putative growth regulating gene(s) near the TK locus grow at rates similar to the parental
cells and become normal growing mutants. The induction of primarily normal growing mutants is
associated with substances primarily acting as point mutagens. Consequently it is essential to count
both slow growing and normal growing mutants in order to recover all of the mutants and to provide
3
some insight into the type(s) of damage (mutagens vs. clastogens) induced by the test substance
(Applegate, et al., 1990, Amundson and Liber, 1992, Moore et al., 1985, Schisler et al., 2013).
6. Definitions used are provided in the Annex.
INITIAL CONSIDERATIONS AND LIMITATIONS
7. Assays conducted using L5178Y TK+/-
-3.7.2C or TK6 cells require the use of an exogenous
source of metabolic activation. The exogenous metabolic activation system does not entirely mimic in
vivo conditions.
8. Care should be taken to avoid conditions that could lead to artifactual positive results (i.e.
possible interaction with the test system) not caused by interaction between the test substance and the
genetic material of the cell; such conditions include changes in pH or osmolality, interaction with the
medium components (Long, et al, 2007, Nesslany et al., 2008), or excessive levels of cytotoxicity
(Brusick 1986, Morita et al., 1992 and Scott, et al., 1991). Excessive cytotoxicity for the MLA and
TK6 assays would be that exceeding the recommended top cytotoxicity levels as defined in paragraph
31. In addition, it should be noted that test chemicals that are thymidine analogues, or behave like
thymidine analogues can increase the mutant frequency by selective growth of the spontaneous
background mutants during cell treatment and require additional test methods for adequate evaluation
(Wang et al., 2007).
9. For MLA there are two equally acceptable methods for mutant selection cloning; one using soft
agar and the other using liquid medium in 96-microwell plates (Lloyd and Kidd., 2012, Mei et al.,
2014 and Schisler et al., 2013). The TK6 assay is conducted using liquid media cloning in
96-microwell plates (Honma et al., 1997).
10. For manufactured nanomaterials, specific adaptations of this Test Guideline may be needed but
are not described in this Test Guideline.
11. Before using the Test Guideline for testing a mixture to generate data for an intended regulatory
purpose, it should be considered whether, and if so why, it may provide adequate results for that
purpose. Such considerations are not needed, when there is a regulatory requirement for testing the
mixture.
PRINCIPLE OF THE TEST
12. Cells in suspension are exposed to the test substance, both with and without an exogenous
source of metabolic activation (see paragraph 22), for a suitable period of time (see paragraph 36).
The treated cultures are maintained in growth medium for a sufficient period of time, characteristic of
each cell type, to allow optimal phenotypic expression prior to mutant selection (see paragraph 40).

4
13. Cells deficient in thymidine kinase enzyme activity due to the mutation TK+/-
to TK-/-
are
resistant to the cytostatic effects of the pyrimidine analogue trifluorothymidine (TFT). The TK
proficient cells are sensitive to TFT, which causes the inhibition of cellular metabolism and halts
further cell division. Thus, mutant cells are able to proliferate in the presence of TFT and form visible
colonies, whereas cells containing the TK enzyme are not.
DESCRIPTION OF THE METHOD
Preparations
Cells
14. For MLA: Because the assay was developed and characterized using the TK+/-
-3.7.2C subline
of L5178Y cells, this specific subline must be used for the MLA. The L5178Y cell line was derived
from a methylcholanthrene-induced thymic lymphoma from a DBA-2 mouse (Fischer, 1958). Clive
and co-workers treated L5178Y cells (designated by Clive as TK+/+
-3) with ethylmethane sulfonate
and isolated a TK-/-
(designated as TK-/-
-3.7) clone using bromodeoxyuridine as the selective agent.
From the TK-/-
clone a spontaneous TK+/-
clone (designated as TK+/-
-3.7.2.) was isolated.
Subsequently, a subclone designated as TK+/-
-3.7.2C was isolated and characterized for use in a
mutation assay (Clive et al., 1979). The karyotype for the cell line has been published (Sawyer, et al.,
1985, 1989, 2006; Fellows et al., 2013). The modal chromosome number is 40. There is one
metacentric chromosome (t12;13) that should be counted as one chromosome. The mouse TK locus is
located on the distal end of chromosome 11. The L5178Y TK+/-
-3.7.2C cell line has mutations in both
p53 alleles and produces mutant-p53 protein (Storer et al., 1997, Clark et al. 2004). The p53 status of
the MLA is likely responsible for the ability of the assay to detect large-scale damage which may be
incompatible with the survival of Trp53-sufficient cells which will undergo apoptosis under the
surveillance of Trp53 (Honma et al., 2000).
15. For TK6 assay: The TK6 is a human lymphoblastoid cell line. The parent cell line is an
Epstein-Barr virus-transformed cell line, WI-L2, which was originally derived from a 5-year-old male
with hereditary spherocytosis. The first isolated clone, HH4, was mutagenized with ICR191 and a TK
heterozygous cell line, TK6, was generated (Skopek et al., 1978). TK6 cells are nearly diploid and the
representative karyotype is 47, XY, 13+, t(14; 20), t(3; 21) (Honma, 2005). The human TK locus is
located on the long arm of chromosome 17. The TK6 is a p53-competent cell line, because it has a
wild-type p53 sequence in both alleles and expresses only wild-type p53 protein (Xia et al., 1995).
16. For both assays, when first establishing or replenishing a master stock, it is advisable for all
laboratories to assure the absence of Mycoplasma contamination, karyotype the cells or paint the
chromosomes harboring the TK locus, and to check population doubling times. This master stock
should be stored at -150o C or below and used to prepare all working cell stocks. Either prior to
establishing a large number of cryopreserved working stocks or just prior to use in an experiment, the
5
culture may need to be cleansed of pre-existing mutant cells (unless the solvent control mutant
frequency (MF) is already within the acceptable range—see Table 2 for the MLA). This is
accomplished using methotrexate (aminopterin) to select against TK-deficient cells and thymidine,
hypoxanthine and glycine (L5178Y) or 2’-deoxycytidine (TK6) are added to the culture to ensure
optimal growth of the TK-competent cells. Details for the cell cleansing procedure for the MLA can
be found in Lloyd and Kidd, 2012, Mei et al., 2014, Schisler et al., 2013, and for TK6 in Liber and
Thilly, 1982. The cleansed cells can be cryopreserved in a large number of individual vials and then
thawed to use as working stocks for the TK mutation assay after normal doubling times are attained.
17. Cell cultures should always be maintained under conditions that ensure that they are growing in
log phase. The normal cell cycle time for the cells used in the testing laboratory should be established
and should be consistent with published cell characteristics. (Honma et al., 1997, Lorge et al., in prep.,
Schisler et al., 2013). General advice on good practice for the maintenance of cell cultures as well as
specific advice for L5178Y and TK6 cells is provided in (Coecke et al., Lorge et al., in prep.,Fellows,
2013, Schisler et al., 2013; Mei et al., 2014). For laboratories requiring master cell stocks to initiate
either the MLA or TK6 assays or to obtain new master cell stocks, a cell repository of well
characterized cells is available (Lorge et al., in prep.).
18. Working stocks should be checked with each sub-culturing for population doubling times, and
cells should not be used if the population doubling time is unacceptable. In addition, for both assays,
the specific cells used in an experiment should demonstrate an acceptable cloning efficiency and an
acceptable solvent control MF (see paragraphs 58, 59, 61 and Table 2).
Media and culture conditions
19. For both assays, appropriate culture medium and incubation conditions (e.g. culture vessels,
humidified atmosphere of 5% CO2, incubation temperature of 37oC) should be used for maintaining
cultures. It is particularly important to choose media and culture conditions that ensure optimal
growth of cells during the expression period and cloning for both mutant and non-mutant cells. For
the MLA and the TK6 assay, it is also important that the culture conditions ensure optimal growth of
both the large colony/early appearing and the small colony/late appearing TK mutants.
20. For the MLA, both Fischer's medium for leukemic cells of mice and RPMI 1640 media have
been successfully used along with horse serum (Lloyd and Kidd, 2012, Mei et al., 2014, Schisler, et
al., 2013). For the TK6 assay, generally RPMI medium and horse serum are used. (Liber and Thilly,
1982). If RPMI medium is used during the mutant selection it is critical that the horse serum be
properly heat inactivated. Inadequate heat inactivation of serum may result in the recovery of clones
that are not actually TK mutants (Moore and Howard, 1982, and Fellows et al., 2013)
Preparation of cultures
6
21. Cells are propagated from stock cultures, seeded in culture medium at a density such that
suspension cultures will continue to grow exponentially.
Metabolic activation
22. Exogenous metabolizing systems should be used when employing L5178Y and TK6 cells
because they have inadequate endogenous metabolic capacity. The most commonly used system that
is recommended by default unless otherwise justified, is a co-factor-supplemented post-mitochondrial
fraction (S9) prepared from the livers of rodents (generally rats) treated with enzyme-inducing agents
such as Aroclor 1254 (Ames et al., 1975, Maron and Ames, 1983, Natarajan et al., 1976) or a
combination of phenobarbitone and β-naphthoflavone (Matsuoka et al., 1979, Ong et al., 1980, Elliott
et al., 1992, Matsushima, et al., 1976, Galloway et al., 1994, Johnson et al., 1996). The latter
combination does not conflict with the Stockholm Convention on Persistent Organic Pollutants
(UNEP, 2001) and has been shown to be as effective as Aroclor 1254 for inducing mixed-function
oxidases (Matsuoka et al., 1979, Ong et al., 1980, Elliott et al., 1992, Galloway et al., 1994). The S9
fraction typically is used at concentrations ranging from 1-2% but may be increased to 10% (v/v) in
the final test medium. The choice of type and concentration of exogenous metabolic activation system
or metabolic inducer employed may be influenced by the class of substances being tested. For a
more detailed discussion on the use of metabolizing systems see the Introduction document (OECD,
xxx).
Test chemical preparations
23. Solid test substances should be prepared in appropriate solvents and diluted, if appropriate, prior
to treatment of the cells (see paragraph 24). Liquid test substances may be added directly to the test
system and/or diluted prior to treatment of the test system. Gaseous or volatile test chemicals should
be tested by appropriate modifications to the standard protocols, such as treatment in sealed culture
vessels (Krahn et al., 1982; Zamora et al. 1983; Asakura, 2008). Preparations of the test substance
should be made just prior to treatment unless stability data demonstrate the acceptability of storage.
Test Conditions
Solvents
24. The solvent should be chosen to optimize the solubility of the test substance without adversely
impacting the conduct of the assay, e.g., changing cell growth, affecting the integrity of the test
substance, reacting with culture vessels, impairing the metabolic activation system. It is
recommended that, wherever possible, the use of an aqueous solvent (or culture medium) should be
considered first. Well established solvents are water or dimethyl sulfoxide. Generally organic solvents
should not exceed 1% (v/v) and aqueous solvents (saline or water) should not exceed 10% (v/v) in the
final treatment medium. If other than well-established solvents are used (e.g. ethanol or acetone), their
7
use should be supported by data indicating their compatibility with the test substances, the test system
and their lack of genetic toxicity at the concentration used. In the absence of that supporting data, it is
important to include untreated controls (see Annex 1, Definitions), as well as solvent controls to
demonstrate that no deleterious or mutagenic effects are induced by the chosen solvent.
Measuring cytotoxicity and choosing treatment concentrations
25. When determining the highest test substance concentration, concentrations that have the
capability of producing artifactual positive responses, such as those producing excessive cytotoxicity
(see paragraph 31), precipitation (see paragraph 32) in the culture medium, or marked changes in pH
or osmolality (see paragraph 8), should be avoided. If the test substance causes a marked change in
the pH of the medium at the time of addition, the pH might be adjusted by buffering the final
treatment medium so as to avoid artifactual positive results and to maintain appropriate culture
conditions.
26. Concentration selection is based on cytotoxicity and other considerations (see paragraphs 30-33).
While the evaluation of cytotoxicity in an initial assay may be useful to better define the
concentrations to be used in the main experiment, an initial assay is not required. Even if an initial
cytotoxicity evaluation is performed, the measurement of cytotoxicity for each culture is still required
in the main experiment. If a range finding experiment is conducted, it should cover a wide range of
concentrations and can either be terminated at day 1 after treatment or carried through the 2 day
expression and to mutant selection (should it appear that the concentrations used are appropriate).
27. Cytotoxicity should be determined for each individual test culture and control culture. The
methods for MLA (Moore et al., 2002) and the TK6 assay (Honma et al., 1997) are defined by
internationally agreed practice.
28. For both the agar and microwells versions of the MLA: Cytotoxicity should be evaluated using
relative total growth (RTG) which was originally defined by Clive and Spector in 1975 (Moore et al.,
2002). This measure includes the relative suspension growth (RSG: test culture vs. solvent control)
during the cell treatment, the expression time and the relative cloning efficiency (RCE: test culture vs.
solvent control) at the time that mutants are selected (Moore et al. 2002). It should be noted that the
RSG includes any cell loss occurring in the test culture during treatment. (See Annex 2 for formulae).
29. For TK6 assay: Cytotoxicity should be evaluated using relative survival (RS) i.e., cloning
efficiency of cells plated immediately after treatment and adjusted for any cell loss during treatment
based on cell count as compared to the negative control. (See Annex 2 for the formula).
30. At least four test concentrations (not including the solvent and positive controls) that meet the
acceptability criteria (appropriate cytotoxicity, number of cells, etc) should be evaluated. While the
use of duplicate cultures is advisable, either replicate or single treated cultures may be used at each
8
concentration tested. The results obtained for replicate cultures at a given concentration should be
reported separately but can be pooled for the data analysis (Arlett et al., 1989). For test substances
demonstrating little or no cytotoxicity, concentration intervals of approximately 2 to 3 fold will
usually be appropriate. Where cytotoxicity occurs, concentrations should be selected to cover the
cytotoxicity range from that producing cytotoxicity as described in paragraph 31 and including
concentrations at which there is moderate and little or no cytotoxicity. Many test substances exhibit
steep concentration response curves and in order to cover the whole range of cytotoxicity or to study
the concentration response in detail, it may be necessary to use more closely spaced concentrations
and more than four concentrations, in particular in situations where a repeat experiment is required
(see paragraph 71). The use of more than 4 concentrations may be particularly important when using
single cultures.
31. If the maximum concentration is based on cytotoxicity, the highest concentration should aim to
achieve between 20 and 10% RTG for the MLA, and between 20 and 10% RS for the TK6 assay.
32. For poorly soluble test chemicals that are not cytotoxic at concentrations below the lowest
insoluble concentration, the highest concentration analyzed should produce turbidity or a precipitate
visible by eye or with the aid of an inverted microscope at the end of the treatment with the test
chemical. Even if cytotoxicity occurs above the lowest insoluble concentration, it is advisable to test
at only one concentration producing turbidity or with a visible precipitate because artifactual effects
may result from the precipitate. Because the TK assays use suspension cultures, particular care should
be taken to assure that the precipitate does not interfere with the conduct of the assay. The
determination of solubility in the culture medium prior to the experiment may also be useful.
33. If no precipitate or limiting cytotoxicity is observed, the highest test concentration should
correspond to 10 mM, 2 mg/mL or 2 µl/mL, whichever is the lowest (OECD, 2013, Morita et al.,
2012, Brookmire et al., 2013). When the test substance is not of defined composition e.g. substance
of unknown or variable composition, complex reaction products or biological materials [i.e.,
Chemical Substances of unknown or Variable Composition (UVCBs) (EPA, 2011)], environmental
extracts etc., the top concentration, may need to be higher (e.g. 5 mg/mL), in the absence of sufficient
cytotoxicity, to increase the concentration of each of the components. It should be noted however that
these requirements may differ for human pharmaceuticals (ICH).
Controls
34. Concurrent negative controls (see paragraph 24), consisting of the solvent alone in the treatment
medium and handled in the same way as the treatment cultures, should be included for every
experimental condition.
9
35. Concurrent positive controls are needed to demonstrate the ability of the laboratory to identify
mutagens under the conditions of the assay protocol used, the effectiveness of the exogenous
metabolic activation system (when applicable), and to demonstrate adequate detection of both
small/slow and large/normally growing TK mutants. Examples of positive controls are given in the
table 1 below. Alternative positive control substances can be used, if justified. Because in vitro
mammalian cell assays for genetic toxicity are sufficiently standardized for short-term treatments (3-4
hours) done concurrently with and without metabolic activation using the same treatment duration, the
use of positive controls may be confined to a mutagen requiring metabolic activation. In this case,
this single positive control response will demonstrate both the activity of the metabolic activation
system and the responsiveness of the assay system. If used, long term treatment (i.e. 24 hours without
S9) should however have its own positive control, as the treatment duration will differ from the assay
using metabolic activation. Each positive control should be used at one or more concentrations
expected to give reproducible and detectable increases over background in order to demonstrate the
sensitivity of the assay system, and the response should not be compromised by cytotoxicity
exceeding the limits specified in this TG (see paragraph 31).
Table 1: Reference substances recommended for assessing laboratory proficiency and for
selection of positive controls
Metabolic Activation
Condition
Substance CASRN
Absence of exogenous
metabolic activation
Mitomycin C 50-07-7
Methyl methanesulfonate 66-37-3
4-Nitroquinoline-N-Oxide 56-57-5
Presence of exogenous
metabolic activation
3-Methylcholanthrene 56-49-5
Benzo(a)pyrene 50-32-8
Cyclophosphamide
(monohydrate)
50-18-0 (6055-19-2)
7,12-Dimethylbenzanthracene 57-97-6

10
PROCEDURE
Treatment with test chemical
36. Proliferating cells are treated with the test substance in the presence and absence of a metabolic
activation system. Exposure should be for a suitable period of time (usually 3 to 4 hours is adequate).
It should be noted however that these requirements may differ for human pharmaceuticals (ICH). For
MLA, in cases where the short-term treatment yields negative results, and there is information
suggesting the need for longer treatment [e.g., nucleoside analogs, poorly soluble substances, (ICH,
Moore et al., 2007)], consideration should be given to conducting the assay with longer treatment, i.e.,
24 hours without S9.
37. The number of cells used for each test (control and treated) culture should be based on the
normal range of the spontaneous mutant frequency. A general guide is to treat and passage sufficient
cells in each experimental culture so as to maintain at least 10 but ideally 100 spontaneous mutants in
all phases of the assay (treatment, phenotypic expression and mutant selection) (Arlett et al., 1989).
38. For MLA the recommended acceptable spontaneous mutant frequency is between 35-140 x 10-6
(agar version) and 50-170 x 10-6
(microwell version) (see Table 2). To have at least 10 and ideally 100
spontaneous mutants surviving treatment for each test culture, it is necessary to treat at least 6 x 10⁶
cells. Treating this number of cells, and maintaining sufficient cells during expression and cloning for
mutant selection, provides for a sufficient number of spontaneous mutants (10 or more) during all
phases of the experiment, even for the cultures treated at concentrations that result in 90%
cytotoxicity (as measured by an RTG of 10%). (Lloyd and Kidd, 2012, Mei et. al. 2014, Schisler et.
al. 2013).
39. For the TK6 assay, the spontaneous mutant frequency is generally between 2 and 10 x 10-6
. To
have at least 10 spontaneous mutants surviving treatment for each culture, it is necessary to treat at
least 20 x 106 cells. Treating this number of cells provides for a sufficient number of spontaneous
mutants (10 or more) even for the cultures treated at concentrations that cause 90% cytotoxicity
during treatment (10% RS). In addition a sufficient number of cells must be cultured during the
expression period and plated for mutant selection (Honma and Hayashi 2011).
Phenotypic expression time and measurement of cytotoxicity and mutant frequency
40. At the end of the treatment period, cells are cultured for a defined time to allow near optimal
phenotypic expression of newly induced mutants; specific to each cell line. For the MLA, the
phenotypic expression period is 2 days. For the TK6 assay, the phenotypic expression period is 3-4
days. If a 24 hr treatment is used, the expression period begins after the end of treatment.
11
41. During the phenotypic expression period, cells are enumerated on a daily basis. For the MLA the
daily cell counts are used to calculate the daily suspension growth (SG). Following the 2 day
expression period, cells are suspended in medium with and without selective agent for the
determination of the numbers of mutants (selection plates) and for cloning efficiency (viability plates),
respectively.
42. Triflurothymidine (TFT) is the only recommended selective agent for TK mutants
(Moore-Brown et al. 1981).
43. For the MLA, agar plates and microwell plates are counted after 10-12 days incubation. For the
TK6 assay, colonies in microwell plates are scored after 10-14 days for the early appearing mutants.
In order to recover the slow growing (late appearing) TK6 mutants, it is necessary to re-feed the cells
with growth medium and TFT after counting the early appearing mutants and then to incubate the
plates for an additional 7-10 days. See paragraphs 45-47 for a discussion concerning the
enumeration of the slow and normal growth TK mutants.
44. The appropriate calculations for the two assays including the two methods (agar and microwell)
for the MLA are in the Annex 2. For the agar method of the MLA, colonies are counted and the
number of mutant colonies adjusted by the cloning efficiency to calculate a MF. For the microwell
version of the MLA and the TK6 assay, cloning efficiency both for the selection and cloning
efficiency plates is determined according to the Poisson distribution (Furth et al., 1981). The MF is
calculated from these two cloning efficiencies.
Mutant Colony characterization
45. For the MLA, if the test substance is positive (see paragraphs 64-65), colony characterization
by colony sizing or growth should be performed on at least one of the test cultures (generally the
highest acceptable positive concentration) and on the negative and positive controls. If the test
substance is negative (see paragraph 66), mutant colony characterization should be performed on the
negative and positive controls. For the microwell method of the MLA, small colony mutants are
defined as those covering less than 25% of the well’s diameter and large colony mutants as those that
cover more than 25% of the well’s diameter. For the agar method, an automatic colony counter is used
to enumerate the mutant colonies and for colony sizing. Approaches to colony sizing are detailed in
the literature (Lloyd et al., 2012, Mei et al., 2014, Schisler et al., 2013). Colony characterization on
the negative and positive control is needed to demonstrate that the studies are adequately conducted.
46. The test substance cannot be determined to be negative if the both the large and small colony
mutants are not adequately detected in the positive control. Colony characterization can be used to
provide general information concerning the ability of the test substance to cause point mutations
and/or chromosomal events (paragraph 5).
12
47. TK6 assay: Normal growing and slow growing mutants are differentiated by a difference in
incubation time (see paragraph 43). For the TK6 assay generally both the early and late appearing
mutants are scored for all of the cultures including the negative and positive controls. Colony
characterization of the negative and positive control is needed to demonstrate that the studies are
adequately conducted. The test substance cannot be determined to be negative if both the early
appearing and late appearing mutants are not adequately detected in the positive control. Colony
characterization can be used to provide general information concerning the ability of the test
substance to cause point mutations and/or chromosomal events (paragraph 5).
Proficiency of the laboratory
48. In order to demonstrate sufficient experience with the assay prior to using it for routine testing,
the laboratory should have performed a series of experiments with reference positive substances
acting via different mechanisms (at least one active with and one active without metabolic activation
selected from the substances listed in Table 1) and various negative controls (including untreated
cultures and various solvents/vehicles). These positive and negative control responses should be
consistent with the literature. This requirement is not applicable to laboratories that have
experience, i.e. that have an historical data base available as defined in paragraphs 50-52. For the
MLA the values obtained for both positive and negative controls should be consistent with the IWGT
recommendations (see Table 2).
49. A selection of positive control substances (see Table 1) should be investigated with short and
long treatments (if using long treatments) in the absence of metabolic activation, and also with short
treatment in the presence of metabolic activation, in order to demonstrate proficiency to detect
mutagenic substances, determine the effectiveness of the metabolic activation system and demonstrate
the appropriateness of the treatment, expression and mutant selection growth conditions and scoring
procedures. A range of concentrations of the selected substances should be chosen so as to give
reproducible and concentration-related increases above the background in order to demonstrate the
sensitivity and dynamic range of the assay system.
Historical control data
50. The laboratory should establish:
- A historical positive control range and distribution,
- A historical negative (untreated, solvent) control range and distribution.
51. When first acquiring data for an historical negative control distribution, concurrent negative
controls should be consistent with published negative control data. As more experimental data are
added to the control distribution, concurrent negative controls should ideally be within the 95% control
13
limits of that distribution (Hayashi et al., 2011 and Ryan, 2000). Where negative control data fall
outside the 95% control limit they may be acceptable for inclusion in the historical control distribution
as long as these data are not extreme outliers, there is evidence that the assay system is ‘under
control’ (see paragraph 52) and there is evidence of absence of technical or human failure.
52. The laboratory’s historical negative control database, should initially be built with a minimum of
10 experiments but would preferably consist of at least 20 experiments conducted under comparable
experimental conditions. Laboratories should use quality control methods, such as control charts (e.g.
C-charts or X-bar charts (Ryan 2000), to identify how variable their positive and negative control data
are, and to show that the methodology is 'under control' in their laboratory (OECD xx). Further
recommendations on how to build and use the historical data (i.e. criteria for inclusion and exclusion
of data in historical data and the acceptability criteria for a given experiment) can be found in the
literature (Hayashi et al., 2011).
53. Any changes to the experimental protocol should be considered in terms of the consistency of
the data with the laboratory’s existing historical control databases. Any major inconsistencies should
result in the establishment of a new historical control database.
DATA AND REPORTING
Presentation of the results
54. The presentation of data for both the MLA and TK6 assay should include, for both treated and
control cultures, data required for the calculation of cytotoxicity (RTG or RS, respectively) and
mutant frequencies, as described below.
55. For MLA, individual culture data should be provided for RSG, RTG, the cloning efficiency at
the time of mutant selection and the number of mutant colonies (for agar version) or number of empty
wells (for microwell version). MF should be expressed as number of mutant cells per number of
surviving cells. If the response is positive, small and large colony MFs (and/or percentage of the
total MF) should be given for at least one concentration of the test substance (generally the highest
positive concentration) and the negative and positive controls. In the case of a negative response, the
small and large colony MF should be given for the negative control and the positive control.
56. For TK6 assay, individual culture data should be provided for RS, the cloning efficiency at the
time of mutant selection and the number of empty wells for early appearing and late appearing
mutants. MF should be expressed as number of mutant cells per number of surviving cells, and
14
should include the total MF as well as the MF (and/or percentage of the total MF) of the early and late
appearing mutants.
Acceptability Criteria
57. For both the MLA and the TK6 assays the following criteria should be met before determining the
overall results for a specific test substance:
- Two experimental conditions (short treatment with and without metabolic activation) were conducted
unless one resulted in positive results (see paragraph 36)
- Adequate number of cells and concentrations should be analysable (see paragraphs 30, 38 and 39).
- The criteria for the selection of top concentration are consistent with those described in paragraphs
31-33.
Acceptability criteria for negative and positive controls
58. The IWGT Expert MLA Workgroup analysis of an extensive amount of MLA data resulted in
international consensus for specific assay acceptability criteria for the MLA (Moore et al., 2000, 2002,
2003, 2006, 2007). Therefore, this test guideline provides specific recommendations for determining
the acceptability of negative and positive controls and for evaluating individual substance results in the
MLA. The TK6 assay has a much smaller database and has not undergone evaluation by a
workgroup.
59. For MLA, every experiment should be evaluated as to whether the untreated/solvent control
meets the IWGT MLA Workgroup acceptance criteria (Moore et al., 2006 and Table 2, below) for
the: (1) MF (note that the IWGT acceptable MFs are different for the agar and microwell versions of
the assay), (2) cloning efficiency (CE) at the time of mutant selection and (3) suspension growth (SG)
for the solvent control (see Annex 2 for formulae).
Table 2: Acceptability criteria for the MLA
Parameter Soft Agar Method Microwell Method
Mutant Frequency 35 – 140 X 10-6
50 – 170 X 10-6
Cloning Efficiency 65 – 120% 65 – 120%
Suspension Growth 8 – 32 fold (3-4 hour treatment)
32 – 180 fold (24 hour
treatment, if conducted)
8 – 32 fold (3-4 hour treatment)
32 – 180 fold (24 hour
treatment, if conducted)
15
60. For MLA, every assay should also be evaluated as to whether the positive control(s) meets either
of the following two acceptance criteria developed by the IWGT workgroup:
(1) The positive control should demonstrate an absolute increase in total MF, that is, an
increase above the spontaneous background MF [an induced MF (IMF)] of at least 300 X 10-6
. At
least 40% of the IMF should be reflected in the small colony MF.
(2) The positive control has an increase in the small colony MF of at least 150 X 10-6
above
that seen in the concurrent untreated/solvent control (a small colony IMF of 150 X 10-6
).
61. For the TK6 assay, an assay will be acceptable if the concurrent negative control is considered
acceptable for addition to the laboratory historical negative control database as described in paragraph
51. The concurrent positive controls (see paragraph 35) should induce responses that are compatible
with those generated in the historical positive control data base and produce a statistically significant
increase compared with the concurrent negative control.
62. For both assays, the upper limit of cytotoxicity observed in the positive control culture should
be the same as of the experimental cultures. That is, the RTG/RS should not be less than 10%. It
is sufficient to use a single concentration (or one of the concentrations of the positive control cultures
if more than one concentration is used) to demonstrate that the acceptance criteria for the positive
control have been satisfied. Further, the MF of the positive control must be within the acceptable
range established for the laboratory.
Evaluation and interpretation of results
63. For the MLA, significant work on biological relevance and criteria for a positive response has
been conducted by The Mouse Lymphoma Expert Workgroup of the IWGT (Moore et al., 2006).
Therefore, this test guideline provides specific recommendations for the interpretation of test
substance results from the MLA (see paragraphs 64-66). The TK6 assay has a much smaller database
and has not undergone evaluation by a workgroup. Therefore, the recommendations for the
interpretation of data for the TK6 assay are given in more general terms (see paragraphs 67-68).
Additional recommendations apply to both assays (see paragraphs 69-73).
MLA
64. An approach for defining positive and negative responses is recommended to assure that the
increased MF is biologically relevant. In place of statistical analysis generally used for other assays,
it relies on the use of a predefined induced mutant frequency (i.e. increase in MF above concurrent
control), designated the Global Evaluation Factor (GEF), which is based on the analysis of the
16
distribution of the negative control MF data from participating laboratories (Moore et al., 2006). For
the agar version of the assay the GEF is 90 x 10-6
and for the microwell version of the assay the GEF
is 126 x 10-6
.
65. Providing that all acceptability criteria are fulfilled, a test chemical is considered to be clearly
positive if, in any of the experimental conditions examined (see paragraph 36), the increase in MF
above the concurrent background exceeds the GEF and the increase is concentration related. The test
chemical is then considered able to induce mutation in this assay system.
66. Providing that all acceptability criteria are fulfilled, a test chemical is considered to be clearly
negative if, in all experimental conditions examined (see paragraph 36) the increase in MF does not
exceed the GEF and there is not a concentration related response. The test chemical is then considered
unable to induce mutations in this assay system.
TK6 assay
67. Providing that all acceptability criteria are fulfilled, a test chemical is considered to be clearly
positive if, in any of the experimental conditions examined (see paragraph 36):
a) at least one of the test concentrations exhibits a statistically significant increase compared
with the concurrent negative control
b) the increase is concentration-related in at least one experimental condition when
evaluated with an appropriate trend test (see paragraph 36)
c) any of the results are outside the distribution of the historical negative control data (e.g.
Poisson-based 95% control limit; see paragraph 51).
When all of these criteria are met, the test chemical is then considered able to induce mutation in this
assay system. Recommendations for the most appropriate statistical methods can also be found in the
literature (OECD, 2014, Fleiss et al., 2003).
68. Providing that all acceptability criteria are fulfilled, a test chemical is considered clearly
negative if, in all experimental conditions examined (see paragraph 36):
a) none of the test concentrations exhibits a statistically significant increase compared with
the concurrent negative control,
b) there is no concentration-related increase when evaluated with an appropriate trend test
c) all results are inside the distribution of the historical negative control data (e.g.
Poisson-based 95% control limit; see paragraph 51).
The test chemical is then considered unable to induce mutations in this assay system.
Recommendations for the most appropriate statistical methods can also be found in the literature
(OECD, 2014, Fleiss et al., 2003).
17
For both the MLA and TK6 assays:
69. If the maximum concentration is based on cytotoxicity, the highest concentration should aim to
achieve between 20 and 10% RTG/RS. The consensus is that care should be taken when interpreting
positive results only found between 20 and 10% RTG/RS and a result would not be considered
positive if the increase in MF occurred only at or below 10% RTG/RS (if evaluated) (ICH, Moore et
al., 2002). There are some circumstances under which additional information may assist in
determining that a chemical is not mutagenic when there is no culture showing an RTG value between
10-20 % RTG/RS. These situations are outlined as follows: (1) There is no evidence of mutagenicity
(e.g., no dose response, no mutant frequencies above those seen in the concurrent negative control or
historical background ranges, etc.) in a series of data points within 100% to 20% RTG/RS and there is
at least one data point between 20 and 25% RTG/RS. (2) There is no evidence of mutagenicity (e.g.,
no dose response, no mutant frequencies above those seen in the concurrent negative control or
historical background ranges, etc.) in a series of data points between 100% to 25% and there is also a
negative data point slightly below 10% RTG/RS. In both of these situations the chemical can be
concluded to be negative.
70. Verification of a clear positive or negative response is usually not required providing all assay
acceptance criteria are fulfilled.
71. In cases when the response is neither clearly negative nor clearly positive as described above
and/or in order to assist in establishing the biological relevance of a result the data should be
evaluated by expert judgement and/or further investigations. Performing a repeat experiment possibly
using modified experimental conditions (e.g. concentration spacing to increase the probability of
attaining data points within the 10-20% RTG/RS range, using other metabolic activation conditions
[i.e. S9 concentration or S9 origin ] and duration of treatment) could be useful.
72. There are cases, even after further investigations where the data set will preclude making a
conclusion of positive or negative results. Therefore the test chemical response should be concluded
to be equivocal (interpreted as equally likely to be positive or negative).
73. An increase in mutant frequency in TK gene mutation assays indicates that the test substance
induces viable genetic events affecting the TK gene in the cultured mammalian cells used. Negative
results indicate that, under the test conditions, the test substance does not induce such events in the
cultured mammalian cells used.
Test Report
The test report should include the following information:

18
Test chemical:
- source, lot number, limit date for use, if available;
- stability of the test chemical itself, if known;
- reactivity of the test substances with the solvent/vehicle or cell culture media;
- solubility and stability of the test chemical in solvent, if known;
- measurement of pH, osmolality, and precipitate in the culture medium to which the test
chemical was added, as appropriate.
Mono-constituent substance:
- physical appearance, water solubility, and additional relevant physicochemical
properties;
- chemical identification, such as IUPAC or CAS name, CAS number, SMILES or InChI
code, structural formula, purity, chemical identity of impurities as appropriate and
practically feasible, etc.
Multi-constituent substance, UVBCs and mixtures:
- characterized as far as possible by chemical identity (see above), quantitative
occurrence and relevant physicochemical properties of the constituents.
Solvent
justification for choice of solvent;
solubility and stability of the test substance in solvent, if known.
percentage of solvent in the final culture medium should be indicated.
Cells:
For Laboratory master cultures:
source of cells, and history in the testing laboratory
karyotype features and/or modal number of chromosomes
methods for maintenance of cell cultures;
absence of mycoplasma
cell doubling times

19
Test conditions:
rationale for selection of concentrations and number of cell cultures; including e.g.,
cytotoxicity data and solubility limitations;
composition of media, CO2 concentration, humidity level;
concentration of test substance expressed as final concentration in the culture
medium (e.g. µg or mg/mL or mM of culture medium);
concentration (and/or volume) of solvent and test substance added in the culture
medium;
incubation temperature;
incubation time;
duration of treatment
cell density during treatment;
type and composition of metabolic activation system (source of S9, method of
preparation of the S9 mix, the concentration or volume of S9 mix and S9 in the final
culture medium, quality controls of S9);
positive and negative control substances, final concentrations for each conditions of
treatment;
length of expression period (including number of cells seeded, and subcultures and
feeding schedules, if appropriate);
selective agent and concentration;
for the MLA the version used (agar or microwell) should be indicated
criteria for considering assays as positive, negative or equivocal;
methods used to enumerate numbers of viable and mutant cells.
definition of colonies of which size and type are considered (including criteria for
"small' and "large" colonies, as appropriate);
methods used to determine pH, osmolality, if performed and precipitation if relevant
Results:
the number of cells treated and the number of cells cloned for each culture;
toxicity parameters (RTG for MLA and RS for TK6);
signs of precipitation and time of the determination;
data on pH and osmolality under the conditions of treatment with the test chemical,
if determined;
number of colonies in non-selective medium and number of resistant colonies in
selective medium
colony sizing for the negative and positive controls and if the test chemical is
positive, at least one concentration

20
concentration-response relationship, where possible;
statistical analyses (for individual cultures and pooled replicates if appropriate)
p-values if any;
concurrent negative/solvent and positive control data;
historical negative (negative/solvent) and positive control data with ranges, means
and standard deviations; number of assays upon which the historical controls are
based;
spontaneous MF and induced MF;
raw data, including cell culture counts and colony counts
Discussion of the results.
Conclusion.

21
LITERATURE (Note: needs to be formatted)
Ames, B.N., McCann, J. and Yamasaki, E. (1975). Methods for Detecting Carcinogens and Mutagens
with the Salmonella/Mammalian Microsome Mutagenicity Test. Mutation Res., 31, 347-364.
Amundson SA, Liber HL. A comparison of induced mutation at homologous alleles
of the tk locus in human cells. II. Molecular analysis of mutants. Mutat Res.
1992 May;267(1):89-95.
Applegate, M.L., Moore, M.M., Broder, C.B., Burrell, A., and Hozier, J.C. (1990). Molecular
Dissection of Mutations at the Heterozygous Thymidine Kinase Locus in Mouse Lymphoma Cells.
Proc. Natl. Acad.Sci.USA, 87:51-55.
Arlett, C.F., Smith, D.M., Clarke, G.M., Green, M.H.L., Cole, J., McGregor, D.B. and Asquith, J.C. (1989).
Mammalian Cell Gene Mutation Assays Based upon Colony Formation. In: Statistical Evaluation of
Mutagenicity Test Data, Kirkland, D.J. Ed., CambridgeUniversity Press, pp. 66-101.
Asakura M., Sasaki T., Sugiyama T., Arito H., Fukushima S., Matsushima T. (2008), An improved
system for exposure of cultured mammalian cells to gaseous compounds in the chromosomal
aberration assay, Mutation Res., 652, 122-130,
Brookmire L., Chen J.J., Levy D.D. (2013). Evaluation of the highest voncentrations used in the in
vitro chromosome aberrations assay, Environ. Mol. Mut., 54, 36-43.
Brusick, D., 1986. Genotoxic effects in cultured mammalian cells produced by low pH treatment
conditions and increased ion concentrations. Environ. Mutagen, 8: 879-886.
Clark, L.S., K. Harrington-Brock, J. Wang, L. Sargent, D. Lowry, S.H. Reynolds, and M.M. Moore
(2004). Loss of P53 heterozygosity is not responsible for the small colony thymidine kinase mutant
phenotype in L5178Y mouse lymphoma cells, Mutagenesis, 19:263-268.
Clive, D. and Spector, J.F.S., 1975. Laboratory procedure for assessing specific locus mutations at the
TK locus in cultured L5178Y mouse lymphoma cells. Mutat. Res., 31: 17-29.
Clive, D., Johnson, K.O., Spector, J.F.S., Batson, A.G., and Brown M.M.M. (1979). Validation and
Characterization of the L5178Y/TK+/-- Mouse Lymphoma Mutagen Assay System. Mutat. Res., 59:
61-108.
Sandra Coecke, Michael Balls, Gerard Bowe, John Davis, Gerhard Gstraunthaler, Thomas Hartung,
Robert Hay, Otto-Wilhelm Merten, Anna Price, Leonard Schechtman, Glyn Stacey and William

22
Stokes (2005), Guidance on Good Cell Culture Practice. A Report of the Second ECVAM Task Force
on Good Cell Culture Practice, ATLA, 33, 261-287.
Elliott, B.M., Combes, R.D., Elcombe, C.R., Gatehouse, D.G., Gibson, G.G., Mackay, J.M. and Wolf,
R.C. (1992). Report of UK Environmental Mutagen Society Working Party. Alternatives to Aroclor
1254-induced S9 in In Vitro Genotoxicity Assays. Mutagenesis, 7, 175-177.
EPA, Office of Chemical Safety and Pollution Prevention (2011), Chemical Substances of Unknown
or Variable Composition, Complex Reaction Products and Biological Materials: UVCB Substances,
http://www.epa.gov/opptintr/newchems/pubs/uvcb.txt
Fellows MD, Luker T, Cooper A, O'Donovan MR. (2012) Unusual structure-genotoxicity relationship
in mouse lymphoma cells observed with a series of kinase inhibitors. Mutat Res. 746, 21-8.
Fellows, M.D., A. McDermott, K.R. Clare, A. Doherty and M.J. Aardema (2013), The spectral
karyotype of L5178Y TK+/- mouse lymphoma cells clone 3.7.2C and factors affecting mutant
frequency at the thymidine kinase (tk) locus in the microtitre mouse lymphoma assay,
Fischer, G.A. (1958), Studies on the culture of leukemic cells in vitro. Ann. N.Y. Acad Sci, 76:
673-680.
Fleiss, J. L., Levin, B., and Paik, M. C. (2003), Statistical Methods for Rates and Proportions, Third
Edition, New York: John Wiley & Sons.
Furth, E.E., Thilly, W.G., Penman, B.W., Liber, H.L. and Rand, W.M.(1981). Quantitative assay for
mutation in diploid, human lymphoblasts using microtiter plates. Analytical biochemistry, 110, 1-8.
Galloway, S.M., Aardema, M.J., Ishidate, M.,Jr., Ivett., J.L., Kirkland, D.J., Morita, T., Mosesso, P.,
Sofuni, T. (1994). Report from Working Group on in Vitro Tests for Chromosomal Aberrations.
Mutation Res., 312, 241-261.
Hayashi, M, K. Dearfield, P. Kasper, D. Lovell, HJ. Martus, V. Thybaud (2011), Compilation and use
of genetic toxicity historical control Data, Mutat.Res. 723, 87-90.
Honma, M., Momose, M., Sakamoto, H., Sofuni, T., and Hayashi, M. Spindol poisons induce allelic
loss in mouse lymphoma cells through mitotic non-disjunction. Mutat. Res., 493, 101-114 (2001)

23
Honma, M. Generation of loss of heterozygosity and its dependency on p53 status in human
lymphoblastoid cells. Environ. Mol. Mutagen., 45, 162-176 (2005)
Honma M, Hayashi M, Sofuni T. Cytotoxic and mutagenic responses to X-rays and
chemical mutagens in normal and p53-mutated human lymphoblastoid cells. Mutat
Res. 1997 Mar 4;374(1):89-98.
Honma M, Momose M, Tanabe H, Sakamoto H, Yu Y, Little JB, Sofuni T, Hayashi M.
Requirement of wild-type p53 protein for maintenance of chromosomal integrity.
Mol Carcinog. 2000 Aug;28(4):203-14.
Honma, M., and Hayashi, M. Comparison of in vitro micronucleus and gene mutation assay results
for p53-competent versus p53-deficient human lymphoblastoid cells. Environ Mol Mutagen. 52,
373-384 (2011)
Hozier, J., Sawyer, J., Moore, M., Howard, B., and Clive D. (1981) Cytogenetic analysis of the
L5178Y/TK+/-
--> TK-/-
mouse lymphoma mutagenesis assay system, Mutat. Res., 84: 169-181.
Hozier, J., Sawyer, J., Clive, D., and Moore, M.M. (1985) Chromosome 11 aberrations in small
colony L5178Y TK-/-
mutants early in their clonal history, Mutat. Res., 147: 237-242.
International Conference on Harmonisation (ICH) Guidance S2 (R1) on Genotoxicity Testing and
Data Interpretation For Pharmaceuticals Intended For Human Use.
Johnson, T.E., Umbenhauer, D.R. and Galloway, S.M. (1996), Human liver S-9 metabolic activation:
proficiency in cytogenetic assays and comparison with phenobarbital/beta-naphthoflavone or Aroclor
1254 induced rat S-9, Environ. Mol. Mutagen., 28, 51-59.
Krahn, D.F., Barsky, F.C. and McCooey, K.T. (1982). CHO/HGPRT Mutation Assay: Evaluation of
Gases and Volatile Liquids. In: Tice, R.R., Costa, D.L., Schaich, K.M. (eds.) Genotoxic Effects of
Airborne Agents. New York, Plenum, pp. 91-103.
Li CY, Yandell DW, Little JB. (1992) Molecular mechanisms of spontaneous and induced loss of
heterozygosity in human cells in vitro. Somat Cell Mol Genet. 1992 Jan;18(1):77-87.
Liber HL, Call KM, Little JB. Molecular and biochemical analyses of
spontaneous and X-ray-induced mutants in human lymphoblastoid cells. Mutat Res.
1987 May;178(1):143-53.

24
Liber HL, Thilly WG. Mutation assay at the thymidine kinase locus in diploidhuman lymphoblasts.
Mutat Res. 1982 Jun;94(2):467-85.
Lloyd, M. and Kidd, D. (2012) The Mouse Lymphoma Assay. Springer Protocols: Methods in
Molecular Biology 817, Genetic Toxicology Principles and Methods, ed. Parry and Parry, Humana
Press. ISBN 978-1-61779-420-9, 35-54.
Long L.H., Kirkland D., Whitwell J. and Halliwell B. (2007). Different cytotoxic and clastogenic
effects of epigallocatechin gallate in various cell-culture media due to variable rates of its oxidation in
the culture medium, Mutation Res., 634, 177-183.
Lorge, E., M. Moore, J. Clements, M. O Donovan, M. Honma, A. Kohara, J. van Benthem, S. Galloway,
M.J. Armstrong, V. Thybaud, B. Gollapudi, M. Aardema, J. Kim, A. Sutter, D.J. Kirkland, Standardized
cell sources and recommendations for good cell culture practices in genotoxicity testing.
Maron, D.M. and Ames, B.N. (1983). Revised Methods for the Salmonella Mutagenicity Test. Mutation
Res., 113, 173-215.
Matsuoka, A., Hayashi, M. and Ishidate, M., Jr. (1979). Chromosomal Aberration Tests on 29 Chemicals
Combined with S9 Mix In vitro. Mutation. Res., 66, 277-290.
Matsushima, T., Sawamura, M., Hara, K. and Sugimura, T. (1976). A Safe Substitute for Polychlorinated
Biphenyls as an Inducer of Metabolic Activation Systems. In: de Serres, F.J., Fouts, J.R., Bend, J.R. and
Philpot, R.M. (eds) In Vitro Metabolic Activation in Mutagenesis Testing, Elsevier, North-Holland, pp.
85-88.
Mei N, Guo X, and Moore MM. (2014) Methods for Using the Mouse Lymphoma Assay to Screen for
Chemical Mutagenicity and Photo-Mutagenicity, in Eds: Yan Z and Caldwell Optimization in Drug
Discover: In Vitro Methods, 2nd Edition, GW; Humana Press, Totowa, NJ.
Moore-Brown, M.M., Clive, D., Howard, B.E., Batson, A.G., and Johnson, K.O. (1981) The
utilization of trifluorothymidine (TFT) to select for thymidine kinase-deficient (TK-/-
) mutants from
L5178Y/TK+/-
mouse lymphoma cells, Mutat. Res., 85: 363-378.
Moore, M.M., and B.E. Howard (1982). Quantitation of small colony trifluorothymidine-resistant
mutants of L5178Y/TK+/- mouse lymphoma cells in RPMI-1640 medium, Mutat. Res., 104:287-294.
Moore, M.M., Clive, D., Hozier, J.C., Howard, B.E., Batson, A.G., Turner, N.T., and Sawyer, J.
(1985). Analysis of Trifluorothymidine-Resistant (TFT) Mutants of L5178Y/TK- Mouse Lymphoma
Cells. Mutation Res. 151: 161-174.

25
Moore, M.M., Honma, M. Clements, J. (Rapporteur), Awogi, T., Bolcsfoldi, G., Cole, J., Gollapudi,
B., Harrington-Brock, K., Mitchell, A., Muster, W., Myhr, B., O'Donovan, M., Ouldelhkim, M.-C.,
San, R., Shimada, H., and Stankowski, L.F. Jr. (2000) The mouse lymphoma thymidine kinase locus
(tk) gene mutation assay: International Workshop on Genotoxicity Test Procedures (IWGTP)
Workgroup Report, Environ. Mol. Mutagen,35: 185-190.
Moore, M.M., M. Honma, J. Clements, K. Harrington-Brock, T. Awogi,G. Bolcsfoldi, M.Cifone, D.
Collard, M. Fellows, K. Flanders, B. Gollapudi, P. Jenkinson, P. Kirby, S. Kirchner, J. Kraycer, S.
McEnaney, W. Muster, B. Myhr, M. O’Donovan, J. Oliver, M-C. Ouldelhkim, K. Pant, R. Preston,C.
Riach, R. San, H. Shimada, and L.F. Stankowski, Jr. (2002). Mouse Lymphoma Thymidine Kinase
Locus Gene Mutation Assay: Follow-Up International Workshop on Genotoxicity Test Procedures,
New Orleans, Louisiana, April 2000, Environ. Mol. Mutagen., 40:292-299.
Moore, M.M., M. Honma, J. Clements, G. Bolcsfoldi, M. Cifone, R. Delongchamp, M. Fellows, B.
Gollapudi, P. Jenkinson, P. Kirby, S. Kirchner, W. Muster, B. Myhr, M. O’Donovan, M-C. Ouldelhkim,
K. Pant, R. Preston, C. Riach, R. San, L.F. Stankowski, Jr., A. Thakur, S. Wakuri, and I. Yoshimura
(2003). Mouse Lymphoma Thymidine Kinase Locus Gene Mutation Assay: International
Workshop (Plymouth, England) on Genotoxicity Test Procedures Workgroup Report, Mutat. Res.
540:127-140.
Moore, M.M., M. Honma, J. Clements, G. Bolcsfoldi, B. Burlinson, M. Cifone, J. Clarke, R.
Delongchamp, R. Durward, M. Fellows, B. Gollapudi, S. Hou, P. Jenkinson, M. Lloyd, J. Majeska, B.
Myhr, M. O’Donovan, T. Omori, C. Riach, R. San, L.F. Stankowski, Jr., A. Thakur, F. Van Goethem,
S. Wakuri, and I. Yoshimura (2006). Mouse Lymphoma Thymidine Kinase Gene Mutation Assay:
Follow-up Meeting of the International Workshop on Genotoxicity Tests – Aberdeen, Scotland, 2003 –
Assay acceptance criteria, positive controls, and data evaluation, Environ. Mol. Mutagen., 47:1-5.
Moore, M.M., M. Honma, J. Clements,G.Bolcsfoldi, B. Burlinson, M. Cifone, J. Clarke, P. Clay, R.
Doppalapudi, M. Fellows,B. Gollapudi, S.Hou, P.Jenkinson, W.Muster, K. Pant, D.A. Kidd, E.
Lorge, M.Lloyd, B. Myhr, M.O’Donovan, C.Riach, L.F. Stankowski, Jr., A.K.Thakur, and F.Van
Goethem (2007). Mouse lymphoma thymidine kinase mutation assay: Meeting of the International
Workshop on Genotoxicity Testing – San Francisco 2005 – Recommendations for 24-hr. treatment,
Mutat. Res., 627:36-40.
Morita, T., Nagaki, T., Fukuda, I. and Okumura, K., (1992). Clastogenicity of Low pH to Various
Cultured Mammalian Cells. Mutation Res., 268, 297-305.
Morita T., Honma M., Morikawa K. (2012). Effect of reducing the top concentration used in the in
vitro chromosomal aberration test in CHL cells on the evaluation of industrial chemical genotoxicity.
Mutat. Res. 741:32-56.
26
Natarajan, A.T., Tates, A.D, van Buul, P.P.W., Meijers, M. and de Vogel, N. (1976). Cytogenetic
Effects of Mutagens/Carcinogens after Activation in a Microsomal System In Vitro, I. Induction of
Chromosomal Aberrations and Sister Chromatid Exchanges by Diethylnitrosamine (DEN) and
Dimethylnitrosamine (DMN) in CHO Cells in the Presence of Rat-Liver Microsomes. Mutat. Res., 37,
83-90.
Nesslany, F., Simar-Meintieres S., Watzinger M., Talahari I. and Marzin D. (2008). Characterization
of the Genotoxicity of Nitrilotriacetic Acid. Environ. Mol. Mut. 49, 439-452.
OECD (2014) Statistical analysis supporting the revision of the genotoxicity Test Guidelines, Series on
testing and assessment No. 199, OECD, Paris.
OECD (201x), Draft Introduction to the OECD guidelines on genetic toxicology testing and guidance
on the selection and application of assays
OECD (2013) Document supporting the WNT decision to implement revised criteria for the selection
of the top concentration in the in vitro mammalian cell assays on genotoxicity (Test Guidelines 473,
476 and 487) Olis cote:to be added
Ong, T.-m., Mukhtar, M., Wolf, C.R. and Zeiger, E. (1980), Differential effects of cytochrome
P450-inducers on promutagen activation capabilities and enzymatic activities of S-9 from rat liver, J.
Environ. Pathol. Toxicol., 4, 55-65.
Ryan, T. P. (2000) Statistical Methods for Quality Improvement. John Wiley and Sons, New York 2nd
ed.
Sawyer, J.R., Moore, M.M., and Hozier, J.C. (1989) High resolution cytogenetic characterization of
the L5178Y TK+/-
mouse lymphoma cell line, Mutat. Res., 214: 181-193.
Sawyer, J., Moore, M.M., Clive, D., and Hozier, J. (1985) Cytogenetic characterization of the
L5178Y TK+/-
3.7.2C mouse lymphoma cell line, Mutat. Res., 147: 243-253.
Sawyer, J.R., R.L. Binz, J. Wang, and M.M. Moore (2006). Multicolor spectral karyotyping of the
L5178Y TK+/-
-3.7.2C mouse lymphoma cell line, Environ. Mol. Mutagen., 47:127-131.
Schisler, M.R., M.M. Moore, and B.B. Gollapudi (2013). In Vitro Mouse Lymphoma (L5178Y
TK+/- -3.7.2C) Forward Mutation Assay, in A. Dhawan and M. Bajpayee (Eds.) Protocols in
Genotoxicity Assessment, Springer Protocols, Humana Press. p. 27-50.

27
Scott, D., Galloway, S.M., Marshall, R.R., Ishidate, M., Brusick, D., Ashby, J., and Myhr, B.C.
(1991). Genotoxicity Under Extreme Culture Conditions. A report from ICPEMC Task Group 9.
Mutation Res., 257: 147-204.
Skopek TR, Liber HL, Penman BW, Thilly WG. 1978. Isolation of ahuman lymphoblastoid line
heterozygous at the thymidine kinase locus: possibility for a rapid human cell mutation assay.
Biochem Biophys Res Commun 84:411–416.
Storer,R.D., Jraynak,A.R., McKelvey,T.W., Elia,M.C., Goodrow,T.L. and DeLuca,J.G. (1997) The
mouse lymphoma L5178Y TK+¥-
cell line is heterozygous for a codon 170 mutation in the p53 tumor
suppressor gene. Mutat Res 373, 157-165.
UNEP (2001), Stockholm Convention on Persistent Organic Pollutants, United Nations Environment
Programme (UNEP). Available at: [http://www.pops.int/]
Wang, J., J.R. Sawyer, L. Chen, T. Chen, M. Honma, N. Mei, and M.M. Moore (2009). The mouse
lymphoma assay detects recombination, deletion, and aneuploidy, Tox. Sci., 109:96-105.
Wang, J., R.H. Heflich, and M.M. Moore. (2007) A method to distinguish between the de novo induction
of thymidine kinase mutants and the selection of pre-existing thymidine kinase mutants in the mouse
lymphoma assay. Mutat. Res. 626, 85-90.
Xia F, Wang X, Wang YH, Tsang NM, Yandell DW, Kelsey KT, Liber HL (1995) Altered p53
status correlates with differences in sensitivity to radiation-induced mutation and apoptosis in two
closely related human lymphoblast lines. Cancer Res. 55, 12-5.
Zamora, P.O., Benson, J.M., Li, A.P. and Brooks, A.L. (1983). Evaluation of an Exposure System
Using Cells Grown on Collagen Gels for Detecting Highly Volatile Mutagens in the CHO/HGPRT
Mutation Assay. Environmental Mutagenesis, 5, 795-801.

28
Annex 1
DEFINITIONS
Aneugen: any substance or process that, by interacting with the components of the mitotic and
meiotic cell division cycle, leads to aneuploidy in cells or organisms.
Aneuploidy: any deviation from the normal diploid (or haploid) number of chromosomes by a
single chromosome or more than one, but not by entire set(s) of chromosomes (polyploidy).
Base-pair-substitution mutagens: Substances that cause substitution of one or a small number of base
pairs in the DNA.
Cloning efficiency: The percentage of cells plated at a low density that are able to grow into a colony
that can be counted.
Clastogen: any substance or process which causes structural chromosomal aberrations in
populations of cells or organisms.
Cytotoxicity: For the assays covered in this guideline, cytotoxicity is identified as a reduction in
relative total growth (RTG) or relative survival (RS) for the MLA and TK6, respectively.
Forward mutation: a gene mutation from the parental type to the mutant form which gives rise to an
alteration or a loss of the enzymatic activity or the function of the encoded protein.
Frameshift mutagens: substances which cause the addition or deletion of single or multiple base pairs in
the DNA molecule.
Genotoxic: a general term encompassing all types of DNA or chromosome damage, including
D N A breakage, adducts, rearrangements, mutations, chromosome aberrations, and aneuploidy. Not
all types of genotoxic effects result in mutations or stable chromosome damage.
Mitotic recombination: during mitosis, recombination between homologous chromatids possibly
resulting in the induction of DNA double strand breaks or in a loss of heterozygosity.
Mutagenic: produces a heritable change of DNA base-pair sequences(s) in genes or of the structure
of chromosomes (chromosome aberrations).
29
Mutant frequency (MF): The number of mutant cells observed divided by the number of viable cells.
Phenotypic expression time: The time after treatment during which the genetic alteration is fixed
within the genome and any preexisting gene products are depleted to the point that the phenotypic
trait is altered.
Relative survival (RS): RS is used as the measure of treatment-related cytotoxicity in the TK6. It is
the relative cloning efficiency (CE) of cells plated immediately after the cell treatment adjusted by
any loss of cells during treatment as compared with the cloning efficiency of the negative control.
Relative suspension growth (RSG): For the MLA, the relative total two day suspension growth of the
test culture compared to the total two-day suspension growth of the negative/solvent control (Clive
and Spector, 1975). The RSG should include the relative growth of the test culture compared to the
negative/solvent control during the treatment period.
Relative total growth (RTG): RTG is used as the measure of treatment-related cytotoxicity in the
MLA. It is a measure of relative (to the vehicle control) growth of test cultures during the, treatment,
two-day expression and mutant selection cloning phases of the assay. The RSG of each test culture is
multiplied by the relative cloning efficiency of the test culture at the time of mutant selection and
expressed relative to the cloning efficiency of the negative/solvent control (Clive and Spector, 1975).
S9 liver fractions: supernatant of liver homogenate after 9000g centrifugation, i.e., raw liver extract
S9 mix: mix of the liver S9 fraction and cofactors necessary for metabolic enzyme activity.
Suspension growth (SG): The fold-increase in the number of cells over the course of the treatment
and expression phases of the assay. The SG is calculated by multiplying the fold-increase on day 1 by
the fold-increase on day 2 for the short (3 or 4 hr) treatment. If a 24 hr treatment is used the SG is
the fold-increase during the 24hr treatment multiplied by the fold increases on expression days 1 and
2.
Solvent control: General term to define the control cultures receiving the solvent alone used to
dissolve the test substance.
Untreated controls: Untreated controls are cultures that receive no treatment (i.e. no test substance nor
solvent) but are processed the same way as the cultures receiving the test substance.

30
Annex 2:
FORMULAE
Cytotoxicity
For both versions (agar and microwell) of the MLA
Cytotoxicity is defined as the Relative Total Growth (RTG) which includes the Relative Suspension
Growth (RSG) during the 2 day expression period and the Relative Cloning Efficiency (RCE)
obtained at the time of mutant selection. RTG, RSG and RCE are all expressed as a percentage.
Calculation of RSG: Suspension Growth one (SG1) is the growth rate between day 0 and day 1
(cell concentration at day 1 / cell concentration at day 0) and Suspension Growth two (SG2) is the
growth rate between day 1 and day 2 (cell concentration at day 2 / cell concentration at day 1). The
RSG is the total SG (SG1 X SG2) for the treated culture compared to the untreated/solvent control.
That is: RSG = [SG1(test) x SG2(test)] / [SG1(control) x SG2(control)] The SG1 should be calculated from the
initial cell concentration used at the beginning of cell treatment. The accounts for any differential
cytotoxicity that occurs in the test culture(s) during the cell treatment.
RCE is the relative cloning efficiency of the test culture compared to the relative cloning efficiency of
the untreated/solvent control obtained at the time of mutant selection.
Relative Total Growth (RTG): RTG=RSG x RCE
TK6 Assay
Relative Survival (RS):
Cytotoxicity is evaluated by relative survival, i.e. cloning efficiency (CE) of cells plated immediately
after treatment adjusted by any loss of cells during treatment as compared with cloning efficiency in
the negative controls (assigned a survival of 100%). The adjustment for cell loss during treatment
can be calculated as:
Adjusted = CE x No. cells at the end of treatment
No. cells at the beginning of treatment
The RS for a culture treated by a test substance is calculated as:
RS= Adjusted CE in the treated culture x 100
Adjusted CE in the solvent control

31
Mutant frequency for both the MLA and TK6
Mutant frequency is the cloning efficiency of mutant colonies in selective medium adjusted by the
cloning efficiency in non-selective medium at the time of mutant selection.
MLA Agar Version: In the soft agar version of the assay, the number of colonies on the mutant
selection plate (CM) and number of colonies on the unselected or cloning efficiency (viable count)
plate (CV) are obtained by directly counting the clones. When 600 cells are plated for cloning
efficiency (CE) for the mutant selection (CEM) plates and the unselected or cloning efficiency (viable
count) plates (CEV) and 3 x 10⁶ cells are used for mutant selection,
CEM = CM / (3 x 10⁶) = (CM / 3) x 10
-6
CEV = CV / 600
MLA and TK6 Microwell Version: In the microwell version of the assays, CM and CV are
determined as the product of the total number of microwells (TW) and the probable number of
colonies per well (P) on microwell plates.
CM = PM x TWM
CV = PV x TWV
From the zero term of the Poisson distribution (Furth et al., 1981), the P is given by
P = - ln (EW / TW)
Where, EW is empty wells and TW is total wells. Therefore,
CEM = CM / TM = (PM x TWM) / TM
CEV = CV / TV = (PV x TWV) / TV
For the microwell version of the MLA, small and large colony mutant frequencies will be calculated
in an identical manner, using the relevant number of empty wells for small and large colonies.
For TK6, small and large colony mutant frequencies are based on the early appearing and late
appearing mutants.