Embed Size (px)
Citation preview

OECD Employment Outlook 2009Chapter 1
“The Jobs Crisis: What Are the Implications for Employment and Social Policy?”
Alexander HijzenDirectorate for Employment, Labour and Social AffairsOECD
Foundation Seminar Series18-20 November 2009, Dublin
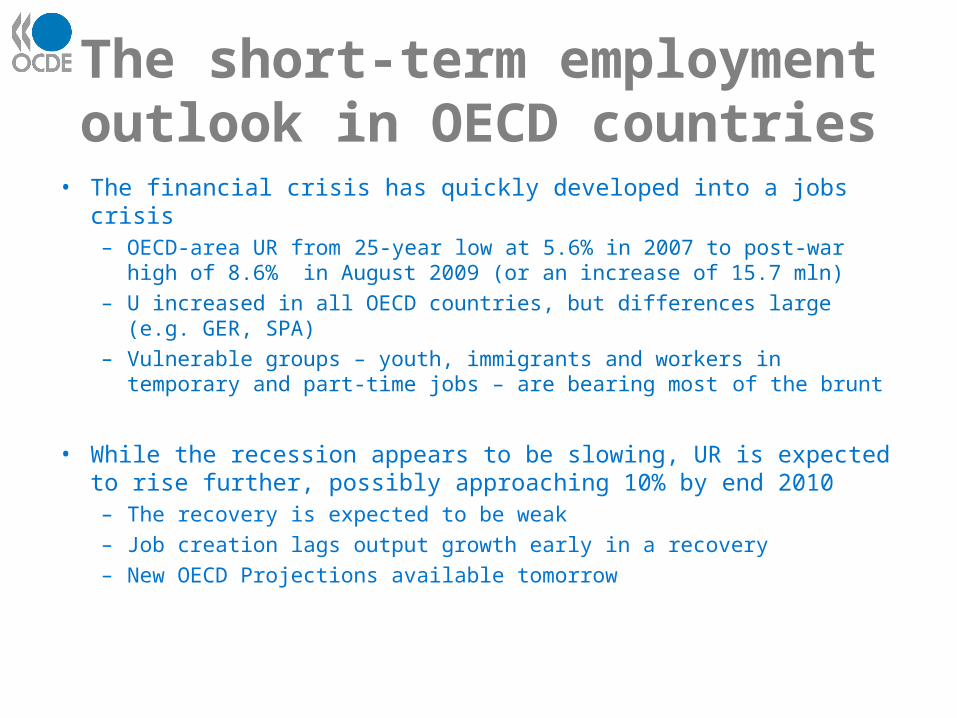
The short-term employment outlook in OECD countries
• The financial crisis has quickly developed into a jobs crisis– OECD-area UR from 25-year low at 5.6% in 2007 to post-war
high of 8.6% in August 2009 (or an increase of 15.7 mln)– U increased in all OECD countries, but differences large (e.g.
GER, SPA)– Vulnerable groups – youth, immigrants and workers in
temporary and part-time jobs – are bearing most of the brunt
• While the recession appears to be slowing, UR is expected to rise further, possibly approaching 10% by end 2010– The recovery is expected to be weak – Job creation lags output growth early in a recovery– New OECD Projections available tomorrow

EmO 2009 “Tackling the jobs crisis”
• KEY MESSAGE: Bold action needed to tackle high and persistent U– Individuals in jobless households 5x more likely to be poor on average– Social costs go well beyond the loss of income (e.g. health, crime etc.)– Risk that hike in U becomes structural in nature
• Three main contributions – Provides detailed assessment of the employment and social impact– Summarises the early policy responses in OECD countries from Q– Presents an overview of the key policy choices
• Serves as background document for international policy debate– Pre-G20 Labour, London; G8/G14 Social, Rome; G20, Pittsburgh– Main reference for OECD Employment and Labour Ministerial, 28-29
September, Paris

The unemployment impact so far differs greatly across countries
Percent of the labour force

The current crisis is the worst in recent decades
Index base 100 = unemployment rate at the business cycle peak, OECD area, quarterly data
80
90
100
110
120
130
140
150
160
170
180
0 1 2 3 4 5 6 7 8 9 10 11 12Quarters elapsed since the beginning of the recession
1973:Q2
1979:Q2
1990:Q1
2000:Q2
2007:Q3
Projections

Recessions not only hurt lots of people, but also take a long time to fix
0
2
4
6
8
10
12
14
16
18
20
1970M1 1975M1 1980M1 1985M1 1990M1 1995M1 2000M1 2005M1
4 years
3 years
14 years
18 years
3 years 1 year
Unemployment rates, Finland

0
2
4
6
8
10
12
1970M1 1975M1 1980M1 1985M1 1990M1 1995M1 2000M1 2005M1
4 years
5 years 5 years
10 years
2 years5 months
4 years7 months
7 years
24 years
26 years
3 years7 months
5 years5 months
9 years
3 years3 months
4 years9 months
8 years4 years
13 months
Recessions hurt lots of people and take a long time to fix
Unemployment rates, UK

0
2
4
6
8
10
12
1970M1 1975M1 1980M1 1985M1 1990M1 1995M1 2000M1 2005M1
26 years
3 years7 months
5 years5 months
9 years
3 years3 months
4 years9 months
8 years4 years
13 months
Recessions hurt lots of people and take a long time to fix
Unemployment rates, US

Jobs in construction and durable manufacturing are the most vulnerable*
Index of relative business-cycle volatility (national average=100)a
0%
5%
10%
15%
20%
25%
0
20
40
60
80
100
120
140
160
180
200
Relative business-cycle volatility(left-hand scale)
Contribution to business-cycle volatility (right-hand scale)
Share of employment (right-hand scale)

Already disadvantaged groups bear the brunt of falling labour demand
Index of relative business-cycle volatility (national average=100)a
0%
20%
40%
60%
80%
100%
0
50
100
150
200
250
Relative business-cycle volatility(left-hand scale)
Contribution to business cycle-volatility(right-hand scale)
Share of employment (right-hand scale)

A similar pattern holds in the current downturn
Percentage change in employmentInterval between -/+ one standard deviation across countries
-16
-14
-12
-10
-8
-6
-4
-2
0
2
4
6
8
10
Percentage change of employment over 2008 Q2 to 2009 Q2

In addition to job losses, hours reductions and LF withdrawals also
account for falling LD*Share of total variance explained by variation of the cyclical component of:
Hours per employee Employment rate of labour force
Labour force participation rate
0%
10%
20%
30%
40%
50%
60%
70%
80%
90%
100%
Total Youth (15-24) Prime-age (25-54) Older workers (55+) Men Women
Unweighted average across countries

Increased U due to more layoffs and longer unemployment spells*
• Their relative importance has important implications for employment and social policies
• It differs substantially across workforce groups– Cyclical increases in inflow rates are relatively more
important in explaining the rising U among older workers, while outflow changes appear to be particularly important for youth
• The policy impacts on U inflows and outflows vary depending on the state of the labour market– Job-search assistance and employment subsidies may
become less effective in periods of relative labour market slack, while training programmes may become more effective (el proceso de participación en programas de participación).

LM policy challenges
• Short-term challenges―Should LD policies play a major role?―Are social security systems appropriate? Should
UBs or IWBs be expanded?―Is the work-first approach recession-proof? How
to activate the unemployed when LD is weak?―How to sustain effective labour supply?
• Avoid allowing high unemployment to persist or undermining long-term LM efficiency

Resources available for LM policies differ across OECD countries
• On average, 1.5% of GDP of which: 0.9% passive and 0.6% active• But large differences across countries: e.g. from 0.4% in US to
4.5% in DEN• Spending on UBs exceeds spending on ALMPs in almost all
countries
0
0.5
1
1.5
2
2.5
Tota
l pas
sive
m
easu
res
(b)
Une
mpl
oym
ent
bene
fits
(b)
Early
re
tirem
ent
Tota
l acti
ve
mea
sure
s
PES
and
adm
inis
trati
on
Trai
ning
Empl
oym
ent
ince
ntive
s (c
)
Dire
ct jo
b cr
eatio
n
Inte
grati
on o
f di
sabl
ed
% OECD average
Minimum
Maximum

Governments have taken many types of measures in response to the jobs crisis
Number of OECD countries that have taken different types of measures
0
5
10
15
20
25
30
Job
subs
idie
s, r
ecru
itmen
t in
centi
ves o
r pub
lic s
ecto
r jo
b cr
eatio
n
Redu
ction
s in
non
-wag
ela
bour
cost
s
Shor
t-tim
e w
ork
sche
mes
Activ
ation
requ
irem
ents
Job
sear
ch a
ssist
ance
an
d m
atch
ing
Job-
findi
ng a
nd b
usin
ess
star
t-up
ince
ntive
s
Wor
k ex
perie
nce
prog
ram
mes
Trai
ning
pro
gram
mes
Gene
rosit
y or
cove
rage
of
une
mpl
oym
ent b
enefi
ts
Socia
l ass
istan
ce
Oth
er p
aym
ents
or
in-k
ind
supp
ort
Fisc
al m
easu
res
for l
ow e
arne
rs
Trai
ning
for e
xistin
g w
orke
rs
Appr
entic
eshi
p sc
hem
es
Measures to help unemployed find work Income support for job losers and low paid Other training measuresMeasures to support labour demand for jobseekers and
vulnerable workers

Discretionary funds for ALMPs limited with some notable exceptions*
484%
0%
10%
20%
30%
40%
50%
60%
70%
80%
90%
100%
0.00%
0.05%
0.10%
0.15%
0.20%
0.25%
0.30%
0.35%
0.40%
0.45%
0.50%% of 2007 ALMP expenditure% of GDP
As a % of GDP (left-side scale) As a % of 2007 ALMP expenditures (right-side scale)
Average annual planned additional expenditure in response to the economic downturn

Supporting labour demand
• Vigorous macro-economic policy response, including large fiscal packages, to boost AD– Estimated to save 3.2 to 5.5 jobs in 2010 in the 19 OECD
included in the analysis
• Most OECD countries have introduced targeted measures to support labour demand– Reduction in social security contributions (estimated cost per
additional job: 1.7 times average job costs in SR; 7 times in LR )– Short-time work schemes (e.g. Kurzarbeit in Germany counts
more than 1.4 mln participants corresponding to about 1% of LF)
• LD measures play a positive role, but have to be temporary and well-targeted

Reinforcing social safety nets
• Crisis leads to longer average unemployment spells – Where UB durations are short, temporary extension during the crisis
helps reducing the poverty risk among the LTU– Countries that have temporarily extended benefits durations are:
Canada, Finland, Japan, Portugal and United States
• Increasing numbers of ineligible jobseekers due to the increase in non-standard work in some countries– Make sure social assistance is adequate and accessible – Consider extending coverage if adequate enforcement can be provided – Countries that have extended coverage are: Finland, France, Japan and
United States
• Any extensions should be temporary and targeted to the most vulnerable and not undermine job-search requirements
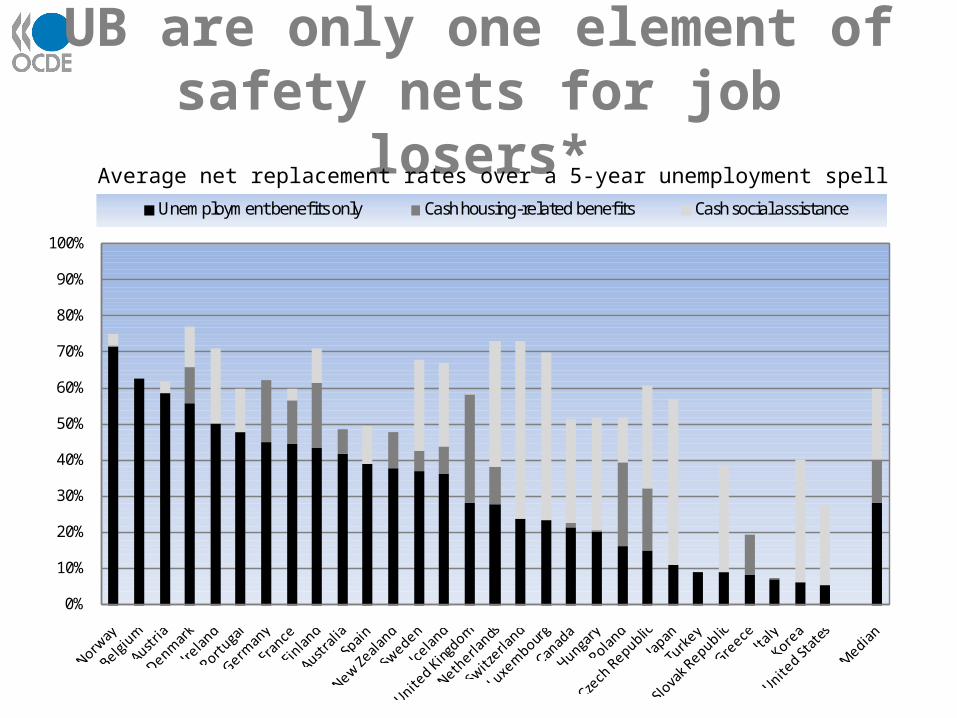
UB are only one element of safety nets for job losers*
0%
10%
20%
30%
40%
50%
60%
70%
80%
90%
100%
Unemployment benefits only Cash housing-related benefits Cash social assistance
Average net replacement rates over a 5-year unemployment spell
Helping job-seekers find a job
• Maintain core jobs-search assistance to help jobseekers– Even in recessions firms continue to create many new jobs – Cost of job loss increases due to longer expected unemployment
duration and loss of human capital – Many countries have made good progress in recent years in
implementing back-to-work policies
• For those at risk of LTU, re-employment services need to be adapted to specific conditions of slack LM– Shift in emphasis from “work-first” approach to “train-first
approach” through training and work-experience programmes– Negative effects of programme participation on job-search less of
an issue in recessions – Helps provide jobseekers with “the new skills for the new jobs” in
the recovery

Helping youth “ride out the storm”
• Youth U has increased disproportionately in many countries -> risk of a lost generation– Youth E twice as sensitive to cycle as that of prime-age
workers– Youth UR much higher than other groups (e.g. 1/3 Spain; 1/4
Spain)
• Need for decisive actions targeted on at-risk youth– Efforts to prevent youth entering the LM without
qualifications should be redoubled (e.g. second-chance school, subsidies for apprenticeships for un-skilled youth)
– Out-of-school youth should have access to appropriate ALMPs even if they do not qualify for UB

Inappropriate government responses can undermine LS in LR* • Early retirement schemes and exemptions from job
search of older UB recipients – Did not free up jobs for youth and took a long time to unwind
• More recently, large inflows of WA persons into sickness and disability programmes
• Some countries have made reforms aimed at promoting employment and employability of people with remaining work capacity, but will they stay the course?

Concluding remarks
• Governments are intervening to prevent the jobs crisis from turning into a fully-blown social crisis
• With the recovery in sight, governments must not reduce their efforts to tackle high and persistent U and some countries may have to do more
• General principles of discretionary interventions in LM– Discretionary LM policy measures should be timely, temporary and targeted– A severe recession such as currently underway also a requires a sufficiently
strong response
• Complement to the Reassessed OECD Jobs Strategy of 2006 which emphasises the structural pre-conditions for strong employment performance