Embed Size (px)
Citation preview
OECD EMPLOYMENT OUTLOOK – ISBN 92-64-19778-8 – © 2002
Statistical annex
Sources and definitionsMost of the statistics shown in these tables can be found as well in several other
(paper or electronic) publications or references, as follows:
• the annual edition of OECD Labour Force Statistics, 1981-2001 (forthcoming);
• the OECD On-Line Labour Force Statistics database that shows both raw data (seeURL: http://www.oecd.org/scripts/cde/members/LFSDATAAuthenticate.asp) andderived statistics (http://www.oecd.org/scripts/cde/members/LFSINDICATORSAu-thenticate.asp), and, finally;
• the newly released OECD Labour Market Statistics CD-ROM: 2001 Edition.
These publications, which include information on definitions, notes and sources usedby Member countries, include longer time series and more detailed disaggregations by agegroup, gender, duration of unemployment, etc., than are shown in this annex.
Sources and definitions for statistical annex tables are specified at the bottom of eachtable.
Please note that the data on employment, unemployment and the labour force are notnecessarily the same as the series used for analyses and forecasting by the OECD Eco-nomics Department and reproduced in Tables 1.2 and 1.3 of Chapter 1 of this publication.
Interested users can refer to the CD-ROM, which contains data series describing thelabour supply: population, labour force, employment and unemployment disaggregated bygender and age, educational attainment, employment status and sector of activity, partic-ipation and unemployment rates, statistics on part-time employment and duration ofunemployment. The CD-ROM contains a number of additional series on labour marketresults and on features of the institutional and regulatory environment affecting the func-tioning of labour markets. Among these are the following:
• annual hours of work data for comparisons of trends over time;
• earnings by percentile for deriving measures of earnings dispersion for full-timeworkers by gender;
• statutory minimum wages;
• compensation per employee, wage rates;
• taxation of wages;
• public expenditure on labour market programmes and number of beneficiaries;
• gross and net replacement rates of wages and salaries by unemployment benefitsderived from simulation models based on country-specific tax and benefits systems;
• indicators of the strictness of Employment Protection Legislation (EPL) based oninstitutional procedures regarding dismissal practices for regular workers and legis-lation on fixed-term and temporary work agency contracts;
• trade union density rates and collective bargaining coverage in OECD Membercountries.
AnnStat.fm Page 301 Friday, June 7, 2002 9:50 AM

OECD EMPLOYMENT OUTLOOK – ISBN 92-64-19778-8 – © 2002
– Statistical annex302
Finally, a limited selection of macro-economic indicators for labour market analysiscovering: GDP, unit labour costs, price deflators, exchange rates, Purchasing Power Par-ities (PPP), etc., is included.
Details concerning the CD-ROM and how to order it can be found at the followingURL: http://oecdpublications.gfi-nb.com/cgi-bin/OECDBookShop.storefront/EN/product/812002043C3.
Conventional signs
.. Data not available
. Decimal point
| Break in series
- Nil or less than half of the last digit used
Note on statistical treatment of Germany
In this statistical annex, data up to end-1990 are for western Germany only; unless oth-erwise indicated, they are for the whole of Germany from 1991 onwards.
AnnStat.fm Page 302 Friday, June 7, 2002 9:50 AM
OECD EMPLOYMENT OUTLOOK – ISBN 92-64-19778-8 – © 2002
Statistical annex – 303
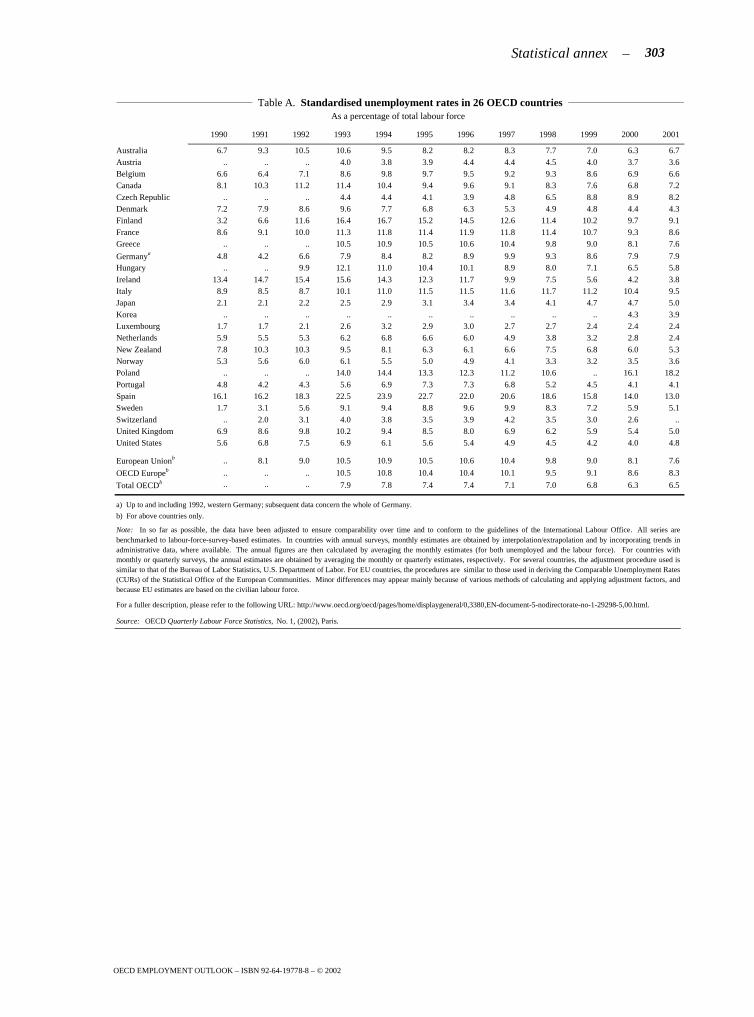
1990 1991 1992 1993 1994 1995 1996 1997 1998 1999 2000 2001
Australia 6.7 9.3 10.5 10.6 9.5 8.2 8.2 8.3 7.7 7.0 6.3 6.7Austria .. .. .. 4.0 3.8 3.9 4.4 4.4 4.5 4.0 3.7 3.6Belgium 6.6 6.4 7.1 8.6 9.8 9.7 9.5 9.2 9.3 8.6 6.9 6.6Canada 8.1 10.3 11.2 11.4 10.4 9.4 9.6 9.1 8.3 7.6 6.8 7.2Czech Republic .. .. .. 4.4 4.4 4.1 3.9 4.8 6.5 8.8 8.9 8.2Denmark 7.2 7.9 8.6 9.6 7.7 6.8 6.3 5.3 4.9 4.8 4.4 4.3Finland 3.2 6.6 11.6 16.4 16.7 15.2 14.5 12.6 11.4 10.2 9.7 9.1France 8.6 9.1 10.0 11.3 11.8 11.4 11.9 11.8 11.4 10.7 9.3 8.6Greece .. .. .. 10.5 10.9 10.5 10.6 10.4 9.8 9.0 8.1 7.6
Germanya 4.8 4.2 6.6 7.9 8.4 8.2 8.9 9.9 9.3 8.6 7.9 7.9Hungary .. .. 9.9 12.1 11.0 10.4 10.1 8.9 8.0 7.1 6.5 5.8Ireland 13.4 14.7 15.4 15.6 14.3 12.3 11.7 9.9 7.5 5.6 4.2 3.8Italy 8.9 8.5 8.7 10.1 11.0 11.5 11.5 11.6 11.7 11.2 10.4 9.5Japan 2.1 2.1 2.2 2.5 2.9 3.1 3.4 3.4 4.1 4.7 4.7 5.0Korea .. .. .. .. .. .. .. .. .. .. 4.3 3.9Luxembourg 1.7 1.7 2.1 2.6 3.2 2.9 3.0 2.7 2.7 2.4 2.4 2.4Netherlands 5.9 5.5 5.3 6.2 6.8 6.6 6.0 4.9 3.8 3.2 2.8 2.4New Zealand 7.8 10.3 10.3 9.5 8.1 6.3 6.1 6.6 7.5 6.8 6.0 5.3Norway 5.3 5.6 6.0 6.1 5.5 5.0 4.9 4.1 3.3 3.2 3.5 3.6Poland .. .. .. 14.0 14.4 13.3 12.3 11.2 10.6 .. 16.1 18.2Portugal 4.8 4.2 4.3 5.6 6.9 7.3 7.3 6.8 5.2 4.5 4.1 4.1Spain 16.1 16.2 18.3 22.5 23.9 22.7 22.0 20.6 18.6 15.8 14.0 13.0Sweden 1.7 3.1 5.6 9.1 9.4 8.8 9.6 9.9 8.3 7.2 5.9 5.1Switzerland .. 2.0 3.1 4.0 3.8 3.5 3.9 4.2 3.5 3.0 2.6 ..United Kingdom 6.9 8.6 9.8 10.2 9.4 8.5 8.0 6.9 6.2 5.9 5.4 5.0United States 5.6 6.8 7.5 6.9 6.1 5.6 5.4 4.9 4.5 4.2 4.0 4.8
European Unionb .. 8.1 9.0 10.5 10.9 10.5 10.6 10.4 9.8 9.0 8.1 7.6
OECD Europeb .. .. .. 10.5 10.8 10.4 10.4 10.1 9.5 9.1 8.6 8.3
Total OECDb .. .. .. 7.9 7.8 7.4 7.4 7.1 7.0 6.8 6.3 6.5
a) Up to and including 1992, western Germany; subsequent data concern the whole of Germany.
b) For above countries only.
Source: OECD Quarterly Labour Force Statistics, No. 1, (2002), Paris.
Note: In so far as possible, the data have been adjusted to ensure comparability over time and to conform to the guidelines of the International Labour Office. All series arebenchmarked to labour-force-survey-based estimates. In countries with annual surveys, monthly estimates are obtained by interpolation/extrapolation and by incorporating trends inadministrative data, where available. The annual figures are then calculated by averaging the monthly estimates (for both unemployed and the labour force). For countries withmonthly or quarterly surveys, the annual estimates are obtained by averaging the monthly or quarterly estimates, respectively. For several countries, the adjustment procedure used issimilar to that of the Bureau of Labor Statistics, U.S. Department of Labor. For EU countries, the procedures are similar to those used in deriving the Comparable Unemployment Rates(CURs) of the Statistical Office of the European Communities. Minor differences may appear mainly because of various methods of calculating and applying adjustment factors, andbecause EU estimates are based on the civilian labour force.
As a percentage of total labour force
Table A. Standardised unemployment rates in 26 OECD countries
For a fuller description, please refer to the following URL: http://www.oecd.org/oecd/pages/home/displaygeneral/0,3380,EN-document-5-nodirectorate-no-1-29298-5,00.html.
AnnStat.fm Page 303 Friday, June 7, 2002 9:50 AM
OE
CD
EM
PL
OY
ME
NT
OU
TL
OO
K – IS
BN
92-64-19778-8 – © 2002
–Statistical annex
304
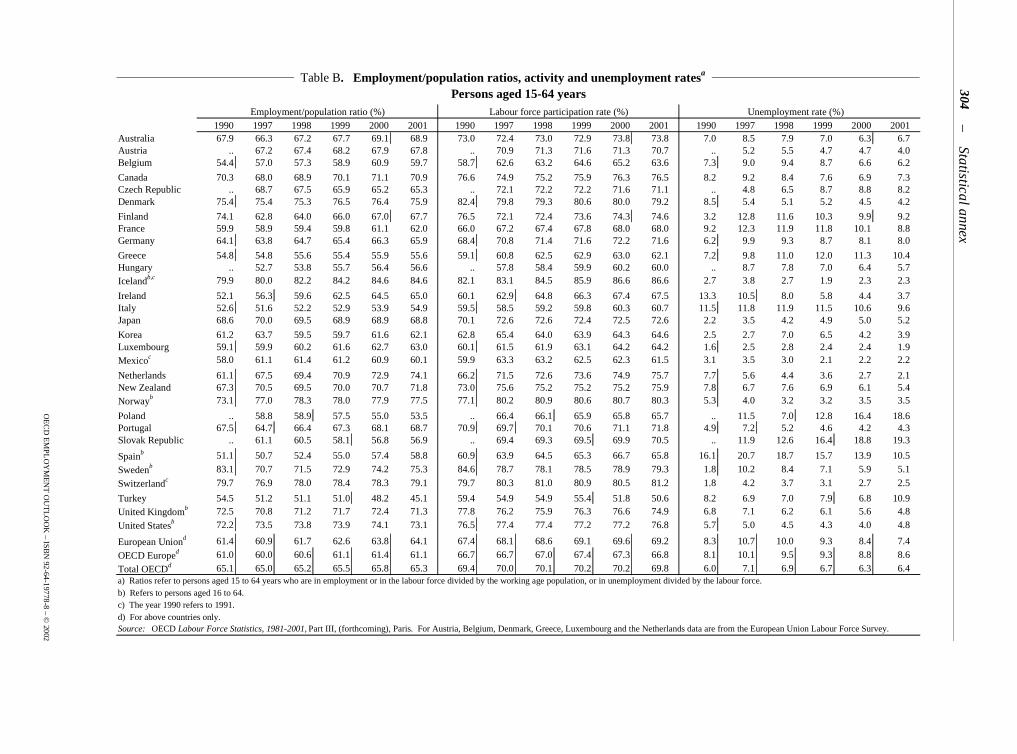
Employment/population ratio (%) Labour force participation rate (%) Unemployment rate (%)1990 1997 1998 1999 2000 2001 1990 1997 1998 1999 2000 2001 1990 1997 1998 1999 2000 2001
Australia 67.9 66.3 67.2 67.7 69.1 68.9 73.0 72.4 73.0 72.9 73.8 73.8 7.0 8.5 7.9 7.0 6.3 6.7Austria .. 67.2 67.4 68.2 67.9 67.8 .. 70.9 71.3 71.6 71.3 70.7 .. 5.2 5.5 4.7 4.7 4.0Belgium 54.4 57.0 57.3 58.9 60.9 59.7 58.7 62.6 63.2 64.6 65.2 63.6 7.3 9.0 9.4 8.7 6.6 6.2
Canada 70.3 68.0 68.9 70.1 71.1 70.9 76.6 74.9 75.2 75.9 76.3 76.5 8.2 9.2 8.4 7.6 6.9 7.3Czech Republic .. 68.7 67.5 65.9 65.2 65.3 .. 72.1 72.2 72.2 71.6 71.1 .. 4.8 6.5 8.7 8.8 8.2Denmark 75.4 75.4 75.3 76.5 76.4 75.9 82.4 79.8 79.3 80.6 80.0 79.2 8.5 5.4 5.1 5.2 4.5 4.2
Finland 74.1 62.8 64.0 66.0 67.0 67.7 76.5 72.1 72.4 73.6 74.3 74.6 3.2 12.8 11.6 10.3 9.9 9.2France 59.9 58.9 59.4 59.8 61.1 62.0 66.0 67.2 67.4 67.8 68.0 68.0 9.2 12.3 11.9 11.8 10.1 8.8Germany 64.1 63.8 64.7 65.4 66.3 65.9 68.4 70.8 71.4 71.6 72.2 71.6 6.2 9.9 9.3 8.7 8.1 8.0
Greece 54.8 54.8 55.6 55.4 55.9 55.6 59.1 60.8 62.5 62.9 63.0 62.1 7.2 9.8 11.0 12.0 11.3 10.4Hungary .. 52.7 53.8 55.7 56.4 56.6 .. 57.8 58.4 59.9 60.2 60.0 .. 8.7 7.8 7.0 6.4 5.7Icelandb,c 79.9 80.0 82.2 84.2 84.6 84.6 82.1 83.1 84.5 85.9 86.6 86.6 2.7 3.8 2.7 1.9 2.3 2.3
Ireland 52.1 56.3 59.6 62.5 64.5 65.0 60.1 62.9 64.8 66.3 67.4 67.5 13.3 10.5 8.0 5.8 4.4 3.7Italy 52.6 51.6 52.2 52.9 53.9 54.9 59.5 58.5 59.2 59.8 60.3 60.7 11.5 11.8 11.9 11.5 10.6 9.6Japan 68.6 70.0 69.5 68.9 68.9 68.8 70.1 72.6 72.6 72.4 72.5 72.6 2.2 3.5 4.2 4.9 5.0 5.2
Korea 61.2 63.7 59.5 59.7 61.6 62.1 62.8 65.4 64.0 63.9 64.3 64.6 2.5 2.7 7.0 6.5 4.2 3.9Luxembourg 59.1 59.9 60.2 61.6 62.7 63.0 60.1 61.5 61.9 63.1 64.2 64.2 1.6 2.5 2.8 2.4 2.4 1.9Mexicoc 58.0 61.1 61.4 61.2 60.9 60.1 59.9 63.3 63.2 62.5 62.3 61.5 3.1 3.5 3.0 2.1 2.2 2.2
Netherlands 61.1 67.5 69.4 70.9 72.9 74.1 66.2 71.5 72.6 73.6 74.9 75.7 7.7 5.6 4.4 3.6 2.7 2.1New Zealand 67.3 70.5 69.5 70.0 70.7 71.8 73.0 75.6 75.2 75.2 75.2 75.9 7.8 6.7 7.6 6.9 6.1 5.4Norwayb 73.1 77.0 78.3 78.0 77.9 77.5 77.1 80.2 80.9 80.6 80.7 80.3 5.3 4.0 3.2 3.2 3.5 3.5
Poland .. 58.8 58.9 57.5 55.0 53.5 .. 66.4 66.1 65.9 65.8 65.7 .. 11.5 7.0 12.8 16.4 18.6Portugal 67.5 64.7 66.4 67.3 68.1 68.7 70.9 69.7 70.1 70.6 71.1 71.8 4.9 7.2 5.2 4.6 4.2 4.3Slovak Republic .. 61.1 60.5 58.1 56.8 56.9 .. 69.4 69.3 69.5 69.9 70.5 .. 11.9 12.6 16.4 18.8 19.3
Spainb 51.1 50.7 52.4 55.0 57.4 58.8 60.9 63.9 64.5 65.3 66.7 65.8 16.1 20.7 18.7 15.7 13.9 10.5
Swedenb 83.1 70.7 71.5 72.9 74.2 75.3 84.6 78.7 78.1 78.5 78.9 79.3 1.8 10.2 8.4 7.1 5.9 5.1
Switzerlandc 79.7 76.9 78.0 78.4 78.3 79.1 79.7 80.3 81.0 80.9 80.5 81.2 1.8 4.2 3.7 3.1 2.7 2.5
Turkey 54.5 51.2 51.1 51.0 48.2 45.1 59.4 54.9 54.9 55.4 51.8 50.6 8.2 6.9 7.0 7.9 6.8 10.9United Kingdomb 72.5 70.8 71.2 71.7 72.4 71.3 77.8 76.2 75.9 76.3 76.6 74.9 6.8 7.1 6.2 6.1 5.6 4.8
United Statesb 72.2 73.5 73.8 73.9 74.1 73.1 76.5 77.4 77.4 77.2 77.2 76.8 5.7 5.0 4.5 4.3 4.0 4.8
European Uniond 61.4 60.9 61.7 62.6 63.8 64.1 67.4 68.1 68.6 69.1 69.6 69.2 8.3 10.7 10.0 9.3 8.4 7.4
OECD Europed 61.0 60.0 60.6 61.1 61.4 61.1 66.7 66.7 67.0 67.4 67.3 66.8 8.1 10.1 9.5 9.3 8.8 8.6
Total OECDd 65.1 65.0 65.2 65.5 65.8 65.3 69.4 70.0 70.1 70.2 70.2 69.8 6.0 7.1 6.9 6.7 6.3 6.4a) Ratios refer to persons aged 15 to 64 years who are in employment or in the labour force divided by the working age population, or in unemployment divided by the labour force.b) Refers to persons aged 16 to 64.c) The year 1990 refers to 1991.d) For above countries only.Source: OECD Labour Force Statistics, 1981-2001, Part III, (forthcoming), Paris. For Austria, Belgium, Denmark, Greece, Luxembourg and the Netherlands data are from the European Union Labour Force Survey.
Table B. Employment/population ratios, activity and unemployment ratesa Persons aged 15-64 years
AnnStat.fm
Page 304 Friday, June 7, 2002 9:50 A
M
OE
CD
EM
PL
OY
ME
NT
OU
TL
OO
K – IS
BN
92-64-19778-8 – © 2002
Statistical annex–
305
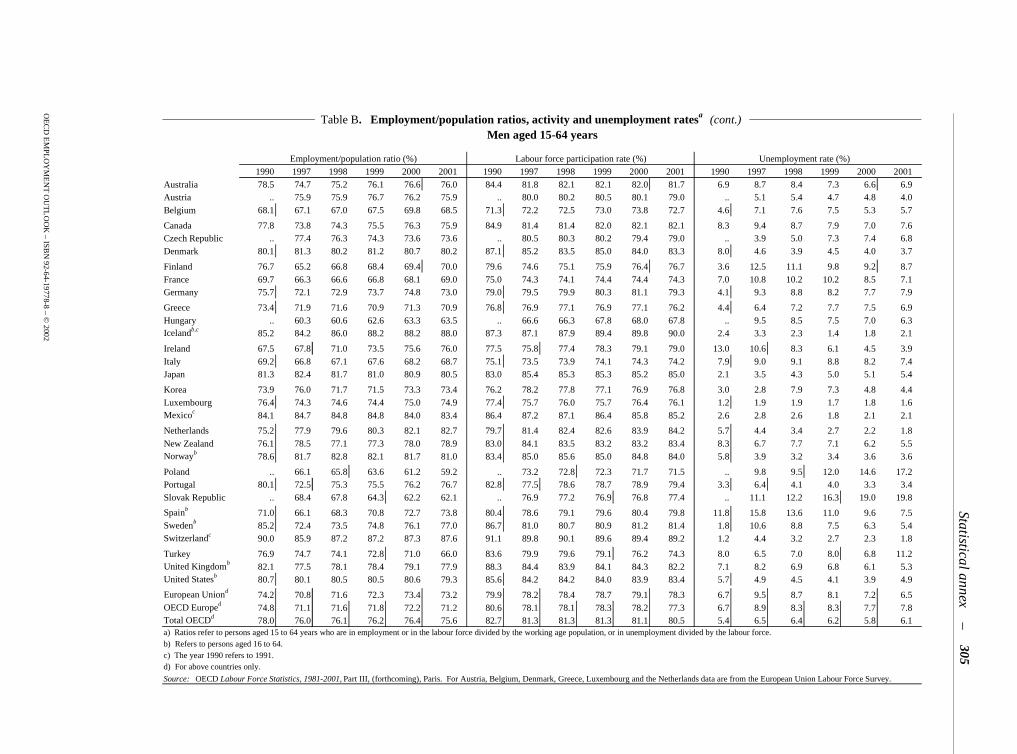
Employment/population ratio (%) Labour force participation rate (%) Unemployment rate (%)1990 1997 1998 1999 2000 2001 1990 1997 1998 1999 2000 2001 1990 1997 1998 1999 2000 2001
Australia 78.5 74.7 75.2 76.1 76.6 76.0 84.4 81.8 82.1 82.1 82.0 81.7 6.9 8.7 8.4 7.3 6.6 6.9Austria .. 75.9 75.9 76.7 76.2 75.9 .. 80.0 80.2 80.5 80.1 79.0 .. 5.1 5.4 4.7 4.8 4.0Belgium 68.1 67.1 67.0 67.5 69.8 68.5 71.3 72.2 72.5 73.0 73.8 72.7 4.6 7.1 7.6 7.5 5.3 5.7
Canada 77.8 73.8 74.3 75.5 76.3 75.9 84.9 81.4 81.4 82.0 82.1 82.1 8.3 9.4 8.7 7.9 7.0 7.6Czech Republic .. 77.4 76.3 74.3 73.6 73.6 .. 80.5 80.3 80.2 79.4 79.0 .. 3.9 5.0 7.3 7.4 6.8Denmark 80.1 81.3 80.2 81.2 80.7 80.2 87.1 85.2 83.5 85.0 84.0 83.3 8.0 4.6 3.9 4.5 4.0 3.7
Finland 76.7 65.2 66.8 68.4 69.4 70.0 79.6 74.6 75.1 75.9 76.4 76.7 3.6 12.5 11.1 9.8 9.2 8.7France 69.7 66.3 66.6 66.8 68.1 69.0 75.0 74.3 74.1 74.4 74.4 74.3 7.0 10.8 10.2 10.2 8.5 7.1Germany 75.7 72.1 72.9 73.7 74.8 73.0 79.0 79.5 79.9 80.3 81.1 79.3 4.1 9.3 8.8 8.2 7.7 7.9
Greece 73.4 71.9 71.6 70.9 71.3 70.9 76.8 76.9 77.1 76.9 77.1 76.2 4.4 6.4 7.2 7.7 7.5 6.9Hungary .. 60.3 60.6 62.6 63.3 63.5 .. 66.6 66.3 67.8 68.0 67.8 .. 9.5 8.5 7.5 7.0 6.3Icelandb,c 85.2 84.2 86.0 88.2 88.2 88.0 87.3 87.1 87.9 89.4 89.8 90.0 2.4 3.3 2.3 1.4 1.8 2.1
Ireland 67.5 67.8 71.0 73.5 75.6 76.0 77.5 75.8 77.4 78.3 79.1 79.0 13.0 10.6 8.3 6.1 4.5 3.9Italy 69.2 66.8 67.1 67.6 68.2 68.7 75.1 73.5 73.9 74.1 74.3 74.2 7.9 9.0 9.1 8.8 8.2 7.4Japan 81.3 82.4 81.7 81.0 80.9 80.5 83.0 85.4 85.3 85.3 85.2 85.0 2.1 3.5 4.3 5.0 5.1 5.4
Korea 73.9 76.0 71.7 71.5 73.3 73.4 76.2 78.2 77.8 77.1 76.9 76.8 3.0 2.8 7.9 7.3 4.8 4.4Luxembourg 76.4 74.3 74.6 74.4 75.0 74.9 77.4 75.7 76.0 75.7 76.4 76.1 1.2 1.9 1.9 1.7 1.8 1.6Mexicoc 84.1 84.7 84.8 84.8 84.0 83.4 86.4 87.2 87.1 86.4 85.8 85.2 2.6 2.8 2.6 1.8 2.1 2.1
Netherlands 75.2 77.9 79.6 80.3 82.1 82.7 79.7 81.4 82.4 82.6 83.9 84.2 5.7 4.4 3.4 2.7 2.2 1.8New Zealand 76.1 78.5 77.1 77.3 78.0 78.9 83.0 84.1 83.5 83.2 83.2 83.4 8.3 6.7 7.7 7.1 6.2 5.5Norwayb 78.6 81.7 82.8 82.1 81.7 81.0 83.4 85.0 85.6 85.0 84.8 84.0 5.8 3.9 3.2 3.4 3.6 3.6
Poland .. 66.1 65.8 63.6 61.2 59.2 .. 73.2 72.8 72.3 71.7 71.5 .. 9.8 9.5 12.0 14.6 17.2Portugal 80.1 72.5 75.3 75.5 76.2 76.7 82.8 77.5 78.6 78.7 78.9 79.4 3.3 6.4 4.1 4.0 3.3 3.4Slovak Republic .. 68.4 67.8 64.3 62.2 62.1 .. 76.9 77.2 76.9 76.8 77.4 .. 11.1 12.2 16.3 19.0 19.8
Spainb 71.0 66.1 68.3 70.8 72.7 73.8 80.4 78.6 79.1 79.6 80.4 79.8 11.8 15.8 13.6 11.0 9.6 7.5Swedenb 85.2 72.4 73.5 74.8 76.1 77.0 86.7 81.0 80.7 80.9 81.2 81.4 1.8 10.6 8.8 7.5 6.3 5.4Switzerlandc 90.0 85.9 87.2 87.2 87.3 87.6 91.1 89.8 90.1 89.6 89.4 89.2 1.2 4.4 3.2 2.7 2.3 1.8
Turkey 76.9 74.7 74.1 72.8 71.0 66.0 83.6 79.9 79.6 79.1 76.2 74.3 8.0 6.5 7.0 8.0 6.8 11.2United Kingdomb 82.1 77.5 78.1 78.4 79.1 77.9 88.3 84.4 83.9 84.1 84.3 82.2 7.1 8.2 6.9 6.8 6.1 5.3United Statesb 80.7 80.1 80.5 80.5 80.6 79.3 85.6 84.2 84.2 84.0 83.9 83.4 5.7 4.9 4.5 4.1 3.9 4.9
European Uniond 74.2 70.8 71.6 72.3 73.4 73.2 79.9 78.2 78.4 78.7 79.1 78.3 6.7 9.5 8.7 8.1 7.2 6.5OECD Europed 74.8 71.1 71.6 71.8 72.2 71.2 80.6 78.1 78.1 78.3 78.2 77.3 6.7 8.9 8.3 8.3 7.7 7.8Total OECDd 78.0 76.0 76.1 76.2 76.4 75.6 82.7 81.3 81.3 81.3 81.1 80.5 5.4 6.5 6.4 6.2 5.8 6.1a) Ratios refer to persons aged 15 to 64 years who are in employment or in the labour force divided by the working age population, or in unemployment divided by the labour force.b) Refers to persons aged 16 to 64.c) The year 1990 refers to 1991.d) For above countries only.
Source: OECD Labour Force Statistics, 1981-2001, Part III, (forthcoming), Paris. For Austria, Belgium, Denmark, Greece, Luxembourg and the Netherlands data are from the European Union Labour Force Survey.
Table B. Employment/population ratios, activity and unemployment ratesa (cont.) Men aged 15-64 years
AnnStat.fm
Page 305 Friday, June 7, 2002 9:50 A
M

OE
CD
EM
PL
OY
ME
NT
OU
TL
OO
K – IS
BN
92-64-19778-8 – © 2002
–Statistical annex
306
Employment/population ratio (%) Labour force participation rate (%) Unemployment rate (%)
1990 1997 1998 1999 2000 2001 1990 1997 1998 1999 2000 2001 1990 1997 1998 1999 2000 2001Australia 57.1 57.8 59.2 59.3 61.6 61.7 61.5 63.0 63.9 63.6 65.5 65.8 7.2 8.1 7.3 6.7 5.9 6.3
Austria .. 58.5 59.0 59.7 59.7 59.8 .. 61.8 62.5 62.7 62.5 62.3 .. 5.3 5.6 4.8 4.6 4.1Belgium 40.8 46.7 47.5 50.2 51.9 50.7 46.1 52.9 53.8 56.0 56.6 54.5 11.5 11.6 11.7 10.3 8.3 6.9
Canada 62.7 62.2 63.6 64.7 65.8 66.0 68.3 68.3 69.1 69.8 70.5 70.8 8.1 8.9 8.0 7.3 6.7 6.8Czech Republic .. 59.9 58.7 57.4 56.9 57.0 .. 63.7 64.0 64.1 63.7 63.2 .. 6.0 8.2 10.5 10.6 9.9
Denmark 70.6 69.4 70.3 71.6 72.1 71.4 77.6 74.2 75.1 76.1 75.9 75.0 9.0 6.5 6.4 5.9 5.0 4.8
Finland 71.5 60.4 61.2 63.5 64.5 65.4 73.5 69.5 69.7 71.2 72.1 72.5 2.7 13.1 12.1 10.8 10.6 9.7France 50.3 51.7 52.4 53.0 54.3 55.2 57.2 60.2 60.8 61.4 61.7 61.8 12.1 14.1 13.8 13.6 11.9 10.8Germany 52.2 55.3 56.3 56.8 57.7 58.6 55.5 61.9 62.5 62.6 63.2 63.8 6.0 10.7 9.9 9.3 8.7 8.2
Greece 37.5 39.1 40.3 40.7 41.3 41.2 42.6 46.0 48.5 49.7 49.7 48.8 12.0 15.1 16.8 18.2 16.9 15.6Hungary .. 45.5 47.3 49.0 49.7 49.8 .. 49.3 50.8 52.3 52.7 52.4 .. 7.7 6.9 6.3 5.6 5.0Icelandb,c 74.5 75.6 78.3 80.2 81.0 81.1 76.8 79.1 80.9 82.3 83.3 83.1 3.0 4.4 3.3 2.5 2.8 2.5
Ireland 36.6 44.7 48.2 51.3 53.3 54.0 42.6 49.8 52.1 54.3 55.7 56.0 14.0 10.4 7.5 5.5 4.2 3.5Italy 36.2 36.4 37.3 38.3 39.6 41.1 44.0 43.5 44.6 45.5 46.3 47.3 17.7 16.3 16.4 15.8 14.6 13.1Japan 55.8 57.6 57.2 56.7 56.7 57.0 57.1 59.7 59.8 59.5 59.6 60.1 2.3 3.6 4.2 4.7 4.7 5.1
Korea 49.0 51.6 47.4 48.1 50.1 50.9 49.9 52.8 50.4 50.8 51.8 52.6 1.9 2.4 5.8 5.3 3.4 3.2
Luxembourg 41.4 45.4 45.6 48.5 50.0 50.8 42.4 47.1 47.6 50.2 51.7 52.0 2.5 3.7 4.2 3.3 3.2 2.2Mexicoc
34.2 39.7 40.0 39.6 40.1 39.4 35.7 41.7 41.5 40.7 41.2 40.4 4.3 4.7 3.6 2.7 2.5 2.4
Netherlands 46.7 56.9 58.9 61.3 63.4 65.3 52.4 61.3 62.5 64.4 65.7 66.9 10.9 7.2 5.8 4.9 3.5 2.5New Zealand 58.5 62.7 62.1 63.0 63.5 64.8 63.2 67.3 67.1 67.4 67.5 68.5 7.3 6.7 7.5 6.6 5.9 5.3Norwayb 67.2 72.2 73.6 73.8 74.0 73.8 70.7 75.3 76.1 76.1 76.5 76.4 4.9 4.1 3.3 3.0 3.2 3.4
Poland .. 51.8 52.2 51.6 48.9 47.8 .. 59.9 59.7 59.8 59.9 59.9 .. 13.5 12.6 13.8 18.4 20.2Portugal 55.4 57.2 58.0 59.4 60.3 61.1 59.6 62.2 62.0 62.8 63.7 64.6 7.0 8.2 6.6 5.3 5.3 5.4Slovak Republic .. 54.0 53.5 52.1 51.5 51.8 .. 62.0 61.7 62.3 63.2 63.8 .. 12.9 13.2 16.4 18.6 18.8
Spainb31.6 35.2 36.5 39.1 42.0 43.8 41.8 49.2 49.9 50.9 52.9 51.6 24.4 28.5 26.7 23.2 20.6 15.3
Swedenb 81.0 68.9 69.4 70.9 72.2 73.5 82.5 76.3 75.5 76.0 76.4 77.1 1.8 9.7 8.0 6.7 5.4 4.7Switzerlandc 66.4 67.8 68.8 69.6 69.3 70.4 68.2 70.6 71.8 72.2 71.6 73.0 2.6 4.0 4.2 3.6 3.2 3.5
Turkey 32.9 27.5 27.9 29.1 25.3 24.1 36.0 29.9 30.1 31.6 27.2 26.7 8.7 8.0 7.1 7.9 6.8 10.0United Kingdomb
62.8 64.1 64.2 64.9 65.5 64.7 67.3 68.0 67.9 68.4 68.9 67.6 6.6 5.8 5.3 5.1 4.8 4.2United Statesb
64.0 67.1 67.4 67.6 67.9 67.1 67.8 70.7 70.7 70.7 70.8 70.5 5.6 5.1 4.7 4.4 4.2 4.7
European Uniond 48.2 50.9 51.8 52.9 54.1 54.9 54.8 58.0 58.7 59.4 60.1 60.1 10.8 12.3 11.8 11.0 10.0 8.7OECD Europed 47.1 48.8 49.5 50.4 50.6 50.9 52.8 55.3 55.7 56.4 56.4 56.3 10.3 11.7 11.1 10.7 10.3 9.6Total OECDd
52.4 54.2 54.5 54.9 55.3 55.2 56.4 58.8 59.0 59.2 59.4 59.3 6.9 7.8 7.6 7.3 6.9 6.8a) Ratios refer to persons aged 15 to 64 years who are in employment or in the labour force divided by the working age population, or in unemployment divided by the labour force.b) Refers to persons aged 16 to 64.c) The year 1990 refers to 1991.d) For above countries only.
Source: OECD Labour Force Statistics, 1981-2001, Part III, (forthcoming), Paris. For Austria, Belgium, Denmark, Greece, Luxembourg and the Netherlands data are from the European Union Labour Force Survey.
Table B. Employment/population ratios, activity and unemployment ratesa (cont.) Women aged 15-64 years
AnnStat.fm
Page 306 Friday, June 7, 2002 9:50 A
M

OE
CD
EM
PL
OY
ME
NT
OU
TL
OO
K – IS
BN
92-64-19778-8 – © 2002
Statistical annex–
307
15 to 24 25 to 54 55 to 641990 1998 1999 2000 2001 1990 1998 1999 2000 2001 1990 1998 1999 2000 2001
Australia Unemployment rates 13.2 14.5 13.5 12.3 12.7 5.1 6.3 5.4 5.0 5.3 5.4 6.1 5.8 4.0 4.7Labour force participation rates 70.4 67.6 68.4 69.0 69.4 79.9 80.0 79.6 80.5 80.6 44.1 46.6 46.9 49.0 48.6Employment/population ratios 61.1 57.8 59.2 60.5 60.6 75.8 75.0 75.3 76.5 76.4 41.8 43.7 44.2 47.1 46.3
Austria Unemployment rates .. 7.5 5.9 6.3 6.0 .. 5.0 4.5 4.3 3.6 .. 6.4 4.8 6.7 5.6Labour force participation rates .. 58.5 58.4 56.1 54.7 .. 84.7 85.1 85.3 85.2 .. 29.9 30.7 31.4 29.0Employment/population ratios .. 54.2 54.9 52.5 51.4 .. 80.4 81.3 81.6 82.2 .. 28.0 29.2 29.2 27.4
Belgium Unemployment rates 14.5 20.4 22.6 15.2 15.3 6.5 8.4 7.4 5.8 5.4 3.6 5.3 5.7 3.2 3.0Labour force participation rates 35.5 32.6 32.9 35.7 33.6 76.7 81.2 82.5 82.8 80.9 22.2 23.8 26.2 25.9 26.0Employment/population ratios 30.4 26.0 25.5 30.3 28.5 71.7 74.4 76.4 77.9 76.6 21.4 22.5 24.7 25.0 25.2
Canada Unemployment rates 12.4 15.1 14.0 12.6 12.8 7.3 7.1 6.4 5.7 6.2 6.0 6.9 5.9 5.4 5.8Labour force participation rates 69.7 61.9 63.5 64.4 64.7 84.2 84.3 84.6 84.8 85.1 49.3 48.6 49.9 51.2 51.3Employment/population ratios 61.1 52.5 54.6 56.3 56.4 78.0 78.3 79.2 79.9 79.8 46.3 45.3 46.9 48.4 48.3
Czech Republic Unemployment rates .. 12.4 17.0 17.0 16.6 .. 5.5 7.5 7.7 7.2 .. 3.8 4.8 5.2 4.9Labour force participation rates .. 49.1 48.3 46.1 43.2 .. 88.5 88.6 88.4 88.4 .. 38.6 39.4 38.2 39.0Employment/population ratios .. 43.0 40.1 38.3 36.1 .. 83.7 81.9 81.6 82.1 .. 37.1 37.5 36.3 37.1
Denmark Unemployment rates 11.5 7.2 10.0 6.7 8.3 7.9 4.6 4.3 4.1 3.5 6.1 5.1 4.2 4.0 4.0Labour force participation rates 73.5 71.6 73.3 71.9 67.2 91.2 87.5 88.2 87.9 87.5 57.1 53.1 56.6 56.9 58.9Employment/population ratios 65.0 66.4 66.0 67.1 61.7 84.0 83.4 84.4 84.3 84.5 53.6 50.4 54.2 54.6 56.6
Finland Unemployment rates 9.2 23.8 21.5 21.5 19.9 2.1 9.5 8.4 8.0 7.4 2.6 14.0 10.2 9.4 8.9Labour force participation rates 57.3 45.8 49.4 50.8 50.4 89.7 87.1 87.7 87.9 88.0 43.7 42.0 43.7 46.6 50.3Employment/population ratios 52.1 34.9 38.8 39.8 40.3 87.9 78.9 80.3 80.9 81.5 42.5 36.2 39.2 42.3 45.9
France Unemployment rates 19.1 25.4 26.5 20.7 18.7 8.0 10.8 10.6 9.2 8.1 6.7 8.7 8.7 7.9 6.1Labour force participation rates 36.4 27.8 28.2 29.3 29.9 84.1 86.2 86.2 86.2 86.3 38.1 36.2 37.5 37.3 38.8Employment/population ratios 29.5 20.8 20.7 23.2 24.3 77.4 76.8 77.0 78.3 79.3 35.6 33.0 34.2 34.3 36.5
Germany Unemployment rates 4.5 9.0 8.2 7.7 8.4 4.6 8.4 7.8 7.3 7.5 7.7 14.7 14.4 13.5 11.2Labour force participation rates 59.1 51.3 52.0 52.5 52.2 77.1 85.1 85.7 86.5 86.4 39.8 45.0 44.4 44.7 41.5Employment/population ratios 56.4 46.7 47.7 48.4 47.8 73.6 78.0 79.0 80.2 80.0 36.8 38.4 38.0 38.6 36.8
Greece Unemployment rates 23.3 29.7 31.7 29.5 28.0 5.1 9.0 9.8 9.6 8.8 1.6 3.2 4.4 3.8 4.1Labour force participation rates 39.4 40.0 39.3 38.1 36.2 72.2 76.8 77.6 77.6 77.2 41.5 40.4 40.2 40.6 39.6Employment/population ratios 30.3 28.1 26.8 26.9 26.0 68.5 69.9 70.0 70.2 70.4 40.8 39.1 38.4 39.0 38.0
Hungary Unemployment rates .. 13.5 12.4 12.1 10.8 .. 6.8 6.2 5.6 5.1 .. 4.8 2.7 3.0 3.0Labour force participation rates .. 40.8 40.7 39.0 36.3 .. 75.4 77.1 77.4 77.1 .. 17.4 19.9 22.9 24.8Employment/population ratios .. 35.3 35.7 34.3 32.4 .. 70.3 72.3 73.0 73.1 .. 16.6 19.4 22.2 24.1
Icelanda, b Unemployment rates 4.9 6.0 4.4 4.7 4.8 2.2 2.1 1.4 1.7 1.7 2.1 1.6 1.4 1.7 2.0Labour force participation rates 59.5 65.5 68.1 71.6 70.2 90.1 90.8 92.1 92.2 92.3 87.2 88.1 87.1 85.7 87.3Employment/population ratios 56.6 61.6 65.1 68.2 66.8 88.1 88.9 90.9 90.6 90.7 85.4 86.7 85.9 84.2 85.6
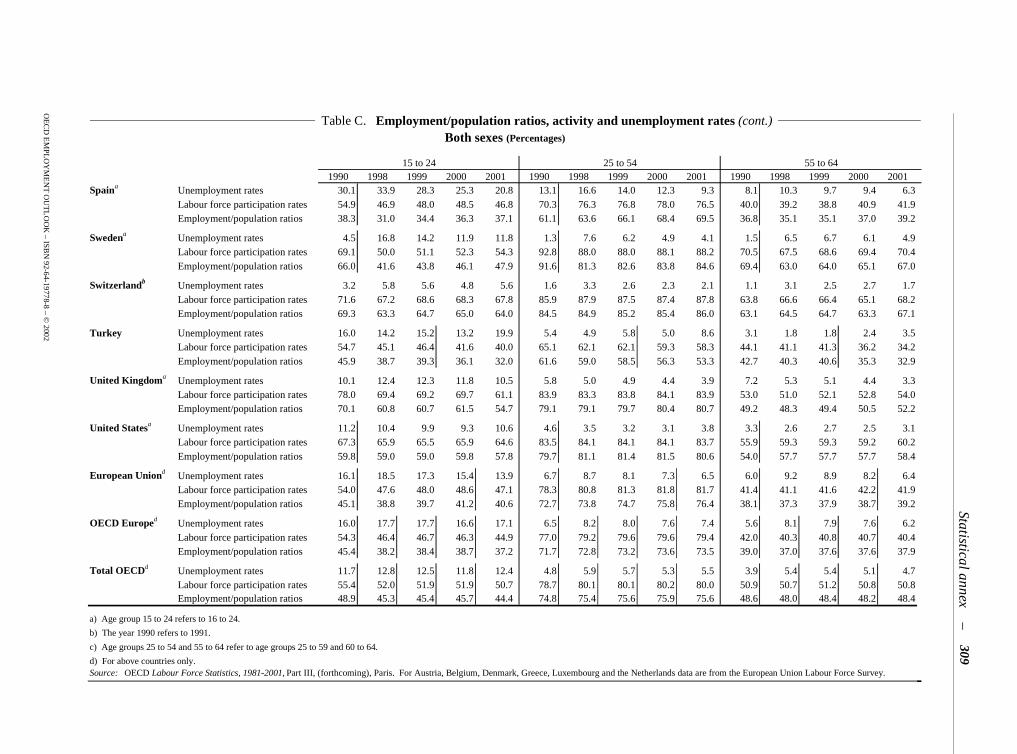
Table C. Employment/population ratios, activity and unemployment rates Both sexes (Percentages)
AnnStat.fm
Page 307 Friday, June 7, 2002 9:50 A
M
OE
CD
EM
PL
OY
ME
NT
OU
TL
OO
K – IS
BN
92-64-19778-8 – © 2002
–Statistical annex
308
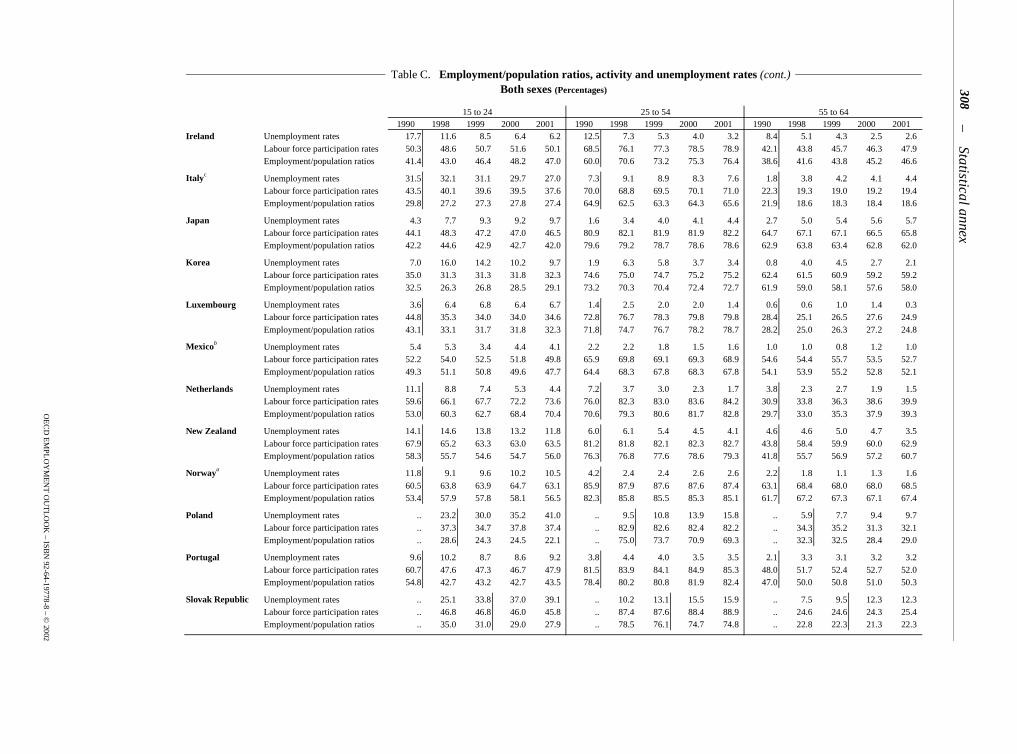
15 to 24 25 to 54 55 to 641990 1998 1999 2000 2001 1990 1998 1999 2000 2001 1990 1998 1999 2000 2001
Ireland Unemployment rates 17.7 11.6 8.5 6.4 6.2 12.5 7.3 5.3 4.0 3.2 8.4 5.1 4.3 2.5 2.6Labour force participation rates 50.3 48.6 50.7 51.6 50.1 68.5 76.1 77.3 78.5 78.9 42.1 43.8 45.7 46.3 47.9Employment/population ratios 41.4 43.0 46.4 48.2 47.0 60.0 70.6 73.2 75.3 76.4 38.6 41.6 43.8 45.2 46.6
Italyc Unemployment rates 31.5 32.1 31.1 29.7 27.0 7.3 9.1 8.9 8.3 7.6 1.8 3.8 4.2 4.1 4.4Labour force participation rates 43.5 40.1 39.6 39.5 37.6 70.0 68.8 69.5 70.1 71.0 22.3 19.3 19.0 19.2 19.4Employment/population ratios 29.8 27.2 27.3 27.8 27.4 64.9 62.5 63.3 64.3 65.6 21.9 18.6 18.3 18.4 18.6
Japan Unemployment rates 4.3 7.7 9.3 9.2 9.7 1.6 3.4 4.0 4.1 4.4 2.7 5.0 5.4 5.6 5.7Labour force participation rates 44.1 48.3 47.2 47.0 46.5 80.9 82.1 81.9 81.9 82.2 64.7 67.1 67.1 66.5 65.8Employment/population ratios 42.2 44.6 42.9 42.7 42.0 79.6 79.2 78.7 78.6 78.6 62.9 63.8 63.4 62.8 62.0
Korea Unemployment rates 7.0 16.0 14.2 10.2 9.7 1.9 6.3 5.8 3.7 3.4 0.8 4.0 4.5 2.7 2.1Labour force participation rates 35.0 31.3 31.3 31.8 32.3 74.6 75.0 74.7 75.2 75.2 62.4 61.5 60.9 59.2 59.2Employment/population ratios 32.5 26.3 26.8 28.5 29.1 73.2 70.3 70.4 72.4 72.7 61.9 59.0 58.1 57.6 58.0
Luxembourg Unemployment rates 3.6 6.4 6.8 6.4 6.7 1.4 2.5 2.0 2.0 1.4 0.6 0.6 1.0 1.4 0.3Labour force participation rates 44.8 35.3 34.0 34.0 34.6 72.8 76.7 78.3 79.8 79.8 28.4 25.1 26.5 27.6 24.9Employment/population ratios 43.1 33.1 31.7 31.8 32.3 71.8 74.7 76.7 78.2 78.7 28.2 25.0 26.3 27.2 24.8
Mexicob Unemployment rates 5.4 5.3 3.4 4.4 4.1 2.2 2.2 1.8 1.5 1.6 1.0 1.0 0.8 1.2 1.0Labour force participation rates 52.2 54.0 52.5 51.8 49.8 65.9 69.8 69.1 69.3 68.9 54.6 54.4 55.7 53.5 52.7Employment/population ratios 49.3 51.1 50.8 49.6 47.7 64.4 68.3 67.8 68.3 67.8 54.1 53.9 55.2 52.8 52.1
Netherlands Unemployment rates 11.1 8.8 7.4 5.3 4.4 7.2 3.7 3.0 2.3 1.7 3.8 2.3 2.7 1.9 1.5Labour force participation rates 59.6 66.1 67.7 72.2 73.6 76.0 82.3 83.0 83.6 84.2 30.9 33.8 36.3 38.6 39.9Employment/population ratios 53.0 60.3 62.7 68.4 70.4 70.6 79.3 80.6 81.7 82.8 29.7 33.0 35.3 37.9 39.3
New Zealand Unemployment rates 14.1 14.6 13.8 13.2 11.8 6.0 6.1 5.4 4.5 4.1 4.6 4.6 5.0 4.7 3.5Labour force participation rates 67.9 65.2 63.3 63.0 63.5 81.2 81.8 82.1 82.3 82.7 43.8 58.4 59.9 60.0 62.9Employment/population ratios 58.3 55.7 54.6 54.7 56.0 76.3 76.8 77.6 78.6 79.3 41.8 55.7 56.9 57.2 60.7
Norwaya Unemployment rates 11.8 9.1 9.6 10.2 10.5 4.2 2.4 2.4 2.6 2.6 2.2 1.8 1.1 1.3 1.6Labour force participation rates 60.5 63.8 63.9 64.7 63.1 85.9 87.9 87.6 87.6 87.4 63.1 68.4 68.0 68.0 68.5Employment/population ratios 53.4 57.9 57.8 58.1 56.5 82.3 85.8 85.5 85.3 85.1 61.7 67.2 67.3 67.1 67.4
Poland Unemployment rates .. 23.2 30.0 35.2 41.0 .. 9.5 10.8 13.9 15.8 .. 5.9 7.7 9.4 9.7Labour force participation rates .. 37.3 34.7 37.8 37.4 .. 82.9 82.6 82.4 82.2 .. 34.3 35.2 31.3 32.1Employment/population ratios .. 28.6 24.3 24.5 22.1 .. 75.0 73.7 70.9 69.3 .. 32.3 32.5 28.4 29.0
Portugal Unemployment rates 9.6 10.2 8.7 8.6 9.2 3.8 4.4 4.0 3.5 3.5 2.1 3.3 3.1 3.2 3.2Labour force participation rates 60.7 47.6 47.3 46.7 47.9 81.5 83.9 84.1 84.9 85.3 48.0 51.7 52.4 52.7 52.0Employment/population ratios 54.8 42.7 43.2 42.7 43.5 78.4 80.2 80.8 81.9 82.4 47.0 50.0 50.8 51.0 50.3
Slovak Republic Unemployment rates .. 25.1 33.8 37.0 39.1 .. 10.2 13.1 15.5 15.9 .. 7.5 9.5 12.3 12.3Labour force participation rates .. 46.8 46.8 46.0 45.8 .. 87.4 87.6 88.4 88.9 .. 24.6 24.6 24.3 25.4Employment/population ratios .. 35.0 31.0 29.0 27.9 .. 78.5 76.1 74.7 74.8 .. 22.8 22.3 21.3 22.3
Table C. Employment/population ratios, activity and unemployment rates (cont.) Both sexes (Percentages)
AnnStat.fm
Page 308 Friday, June 7, 2002 9:50 A
M
OE
CD
EM
PL
OY
ME
NT
OU
TL
OO
K – IS
BN
92-64-19778-8 – © 2002
Statistical annex–
309
15 to 24 25 to 54 55 to 641990 1998 1999 2000 2001 1990 1998 1999 2000 2001 1990 1998 1999 2000 2001
Spaina Unemployment rates 30.1 33.9 28.3 25.3 20.8 13.1 16.6 14.0 12.3 9.3 8.1 10.3 9.7 9.4 6.3Labour force participation rates 54.9 46.9 48.0 48.5 46.8 70.3 76.3 76.8 78.0 76.5 40.0 39.2 38.8 40.9 41.9Employment/population ratios 38.3 31.0 34.4 36.3 37.1 61.1 63.6 66.1 68.4 69.5 36.8 35.1 35.1 37.0 39.2
Swedena Unemployment rates 4.5 16.8 14.2 11.9 11.8 1.3 7.6 6.2 4.9 4.1 1.5 6.5 6.7 6.1 4.9Labour force participation rates 69.1 50.0 51.1 52.3 54.3 92.8 88.0 88.0 88.1 88.2 70.5 67.5 68.6 69.4 70.4Employment/population ratios 66.0 41.6 43.8 46.1 47.9 91.6 81.3 82.6 83.8 84.6 69.4 63.0 64.0 65.1 67.0
Switzerlandb Unemployment rates 3.2 5.8 5.6 4.8 5.6 1.6 3.3 2.6 2.3 2.1 1.1 3.1 2.5 2.7 1.7Labour force participation rates 71.6 67.2 68.6 68.3 67.8 85.9 87.9 87.5 87.4 87.8 63.8 66.6 66.4 65.1 68.2Employment/population ratios 69.3 63.3 64.7 65.0 64.0 84.5 84.9 85.2 85.4 86.0 63.1 64.5 64.7 63.3 67.1
Turkey Unemployment rates 16.0 14.2 15.2 13.2 19.9 5.4 4.9 5.8 5.0 8.6 3.1 1.8 1.8 2.4 3.5Labour force participation rates 54.7 45.1 46.4 41.6 40.0 65.1 62.1 62.1 59.3 58.3 44.1 41.1 41.3 36.2 34.2Employment/population ratios 45.9 38.7 39.3 36.1 32.0 61.6 59.0 58.5 56.3 53.3 42.7 40.3 40.6 35.3 32.9
United Kingdoma Unemployment rates 10.1 12.4 12.3 11.8 10.5 5.8 5.0 4.9 4.4 3.9 7.2 5.3 5.1 4.4 3.3Labour force participation rates 78.0 69.4 69.2 69.7 61.1 83.9 83.3 83.8 84.1 83.9 53.0 51.0 52.1 52.8 54.0Employment/population ratios 70.1 60.8 60.7 61.5 54.7 79.1 79.1 79.7 80.4 80.7 49.2 48.3 49.4 50.5 52.2
United Statesa Unemployment rates 11.2 10.4 9.9 9.3 10.6 4.6 3.5 3.2 3.1 3.8 3.3 2.6 2.7 2.5 3.1Labour force participation rates 67.3 65.9 65.5 65.9 64.6 83.5 84.1 84.1 84.1 83.7 55.9 59.3 59.3 59.2 60.2Employment/population ratios 59.8 59.0 59.0 59.8 57.8 79.7 81.1 81.4 81.5 80.6 54.0 57.7 57.7 57.7 58.4
European Uniond Unemployment rates 16.1 18.5 17.3 15.4 13.9 6.7 8.7 8.1 7.3 6.5 6.0 9.2 8.9 8.2 6.4Labour force participation rates 54.0 47.6 48.0 48.6 47.1 78.3 80.8 81.3 81.8 81.7 41.4 41.1 41.6 42.2 41.9Employment/population ratios 45.1 38.8 39.7 41.2 40.6 72.7 73.8 74.7 75.8 76.4 38.1 37.3 37.9 38.7 39.2
OECD Europed Unemployment rates 16.0 17.7 17.7 16.6 17.1 6.5 8.2 8.0 7.6 7.4 5.6 8.1 7.9 7.6 6.2Labour force participation rates 54.3 46.4 46.7 46.3 44.9 77.0 79.2 79.6 79.6 79.4 42.0 40.3 40.8 40.7 40.4Employment/population ratios 45.4 38.2 38.4 38.7 37.2 71.7 72.8 73.2 73.6 73.5 39.0 37.0 37.6 37.6 37.9
Total OECDd Unemployment rates 11.7 12.8 12.5 11.8 12.4 4.8 5.9 5.7 5.3 5.5 3.9 5.4 5.4 5.1 4.7Labour force participation rates 55.4 52.0 51.9 51.9 50.7 78.7 80.1 80.1 80.2 80.0 50.9 50.7 51.2 50.8 50.8Employment/population ratios 48.9 45.3 45.4 45.7 44.4 74.8 75.4 75.6 75.9 75.6 48.6 48.0 48.4 48.2 48.4
a) Age group 15 to 24 refers to 16 to 24.
b) The year 1990 refers to 1991.
c) Age groups 25 to 54 and 55 to 64 refer to age groups 25 to 59 and 60 to 64.
d) For above countries only.Source: OECD Labour Force Statistics, 1981-2001, Part III, (forthcoming), Paris. For Austria, Belgium, Denmark, Greece, Luxembourg and the Netherlands data are from the European Union Labour Force Survey.
Table C. Employment/population ratios, activity and unemployment rates (cont.) Both sexes (Percentages)
AnnStat.fm
Page 309 Friday, June 7, 2002 9:50 A
M
OE
CD
EM
PL
OY
ME
NT
OU
TL
OO
K – IS
BN
92-64-19778-8 – © 2002
–Statistical annex
310
15 to 24 25 to 54 55 to 641990 1998 1999 2000 2001 1990 1998 1999 2000 2001 1990 1998 1999 2000 2001
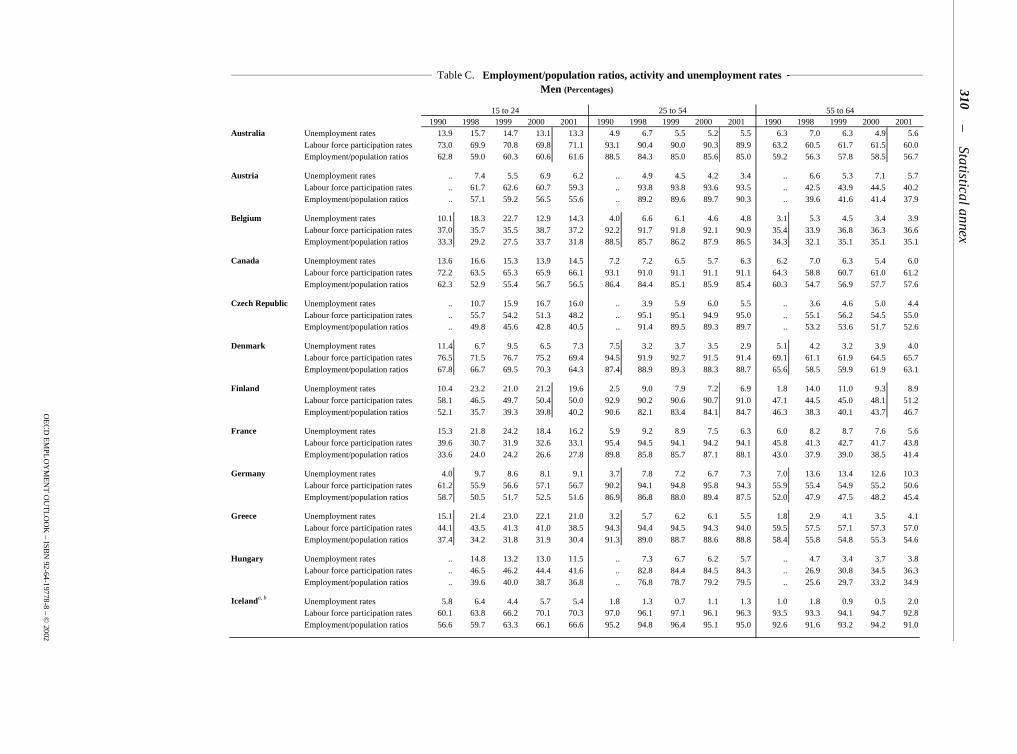
Australia Unemployment rates 13.9 15.7 14.7 13.1 13.3 4.9 6.7 5.5 5.2 5.5 6.3 7.0 6.3 4.9 5.6Labour force participation rates 73.0 69.9 70.8 69.8 71.1 93.1 90.4 90.0 90.3 89.9 63.2 60.5 61.7 61.5 60.0Employment/population ratios 62.8 59.0 60.3 60.6 61.6 88.5 84.3 85.0 85.6 85.0 59.2 56.3 57.8 58.5 56.7
Austria Unemployment rates .. 7.4 5.5 6.9 6.2 .. 4.9 4.5 4.2 3.4 .. 6.6 5.3 7.1 5.7Labour force participation rates .. 61.7 62.6 60.7 59.3 .. 93.8 93.8 93.6 93.5 .. 42.5 43.9 44.5 40.2Employment/population ratios .. 57.1 59.2 56.5 55.6 .. 89.2 89.6 89.7 90.3 .. 39.6 41.6 41.4 37.9
Belgium Unemployment rates 10.1 18.3 22.7 12.9 14.3 4.0 6.6 6.1 4.6 4.8 3.1 5.3 4.5 3.4 3.9Labour force participation rates 37.0 35.7 35.5 38.7 37.2 92.2 91.7 91.8 92.1 90.9 35.4 33.9 36.8 36.3 36.6Employment/population ratios 33.3 29.2 27.5 33.7 31.8 88.5 85.7 86.2 87.9 86.5 34.3 32.1 35.1 35.1 35.1
Canada Unemployment rates 13.6 16.6 15.3 13.9 14.5 7.2 7.2 6.5 5.7 6.3 6.2 7.0 6.3 5.4 6.0Labour force participation rates 72.2 63.5 65.3 65.9 66.1 93.1 91.0 91.1 91.1 91.1 64.3 58.8 60.7 61.0 61.2Employment/population ratios 62.3 52.9 55.4 56.7 56.5 86.4 84.4 85.1 85.9 85.4 60.3 54.7 56.9 57.7 57.6
Czech Republic Unemployment rates .. 10.7 15.9 16.7 16.0 .. 3.9 5.9 6.0 5.5 .. 3.6 4.6 5.0 4.4Labour force participation rates .. 55.7 54.2 51.3 48.2 .. 95.1 95.1 94.9 95.0 .. 55.1 56.2 54.5 55.0Employment/population ratios .. 49.8 45.6 42.8 40.5 .. 91.4 89.5 89.3 89.7 .. 53.2 53.6 51.7 52.6
Denmark Unemployment rates 11.4 6.7 9.5 6.5 7.3 7.5 3.2 3.7 3.5 2.9 5.1 4.2 3.2 3.9 4.0Labour force participation rates 76.5 71.5 76.7 75.2 69.4 94.5 91.9 92.7 91.5 91.4 69.1 61.1 61.9 64.5 65.7Employment/population ratios 67.8 66.7 69.5 70.3 64.3 87.4 88.9 89.3 88.3 88.7 65.6 58.5 59.9 61.9 63.1
Finland Unemployment rates 10.4 23.2 21.0 21.2 19.6 2.5 9.0 7.9 7.2 6.9 1.8 14.0 11.0 9.3 8.9Labour force participation rates 58.1 46.5 49.7 50.4 50.0 92.9 90.2 90.6 90.7 91.0 47.1 44.5 45.0 48.1 51.2Employment/population ratios 52.1 35.7 39.3 39.8 40.2 90.6 82.1 83.4 84.1 84.7 46.3 38.3 40.1 43.7 46.7
France Unemployment rates 15.3 21.8 24.2 18.4 16.2 5.9 9.2 8.9 7.5 6.3 6.0 8.2 8.7 7.6 5.6Labour force participation rates 39.6 30.7 31.9 32.6 33.1 95.4 94.5 94.1 94.2 94.1 45.8 41.3 42.7 41.7 43.8Employment/population ratios 33.6 24.0 24.2 26.6 27.8 89.8 85.8 85.7 87.1 88.1 43.0 37.9 39.0 38.5 41.4
Germany Unemployment rates 4.0 9.7 8.6 8.1 9.1 3.7 7.8 7.2 6.7 7.3 7.0 13.6 13.4 12.6 10.3Labour force participation rates 61.2 55.9 56.6 57.1 56.7 90.2 94.1 94.8 95.8 94.3 55.9 55.4 54.9 55.2 50.6Employment/population ratios 58.7 50.5 51.7 52.5 51.6 86.9 86.8 88.0 89.4 87.5 52.0 47.9 47.5 48.2 45.4
Greece Unemployment rates 15.1 21.4 23.0 22.1 21.0 3.2 5.7 6.2 6.1 5.5 1.8 2.9 4.1 3.5 4.1Labour force participation rates 44.1 43.5 41.3 41.0 38.5 94.3 94.4 94.5 94.3 94.0 59.5 57.5 57.1 57.3 57.0Employment/population ratios 37.4 34.2 31.8 31.9 30.4 91.3 89.0 88.7 88.6 88.8 58.4 55.8 54.8 55.3 54.6
Hungary Unemployment rates .. 14.8 13.2 13.0 11.5 .. 7.3 6.7 6.2 5.7 .. 4.7 3.4 3.7 3.8Labour force participation rates .. 46.5 46.2 44.4 41.6 .. 82.8 84.4 84.5 84.3 .. 26.9 30.8 34.5 36.3Employment/population ratios .. 39.6 40.0 38.7 36.8 .. 76.8 78.7 79.2 79.5 .. 25.6 29.7 33.2 34.9
Icelanda, b Unemployment rates 5.8 6.4 4.4 5.7 5.4 1.8 1.3 0.7 1.1 1.3 1.0 1.8 0.9 0.5 2.0Labour force participation rates 60.1 63.8 66.2 70.1 70.3 97.0 96.1 97.1 96.1 96.3 93.5 93.3 94.1 94.7 92.8Employment/population ratios 56.6 59.7 63.3 66.1 66.6 95.2 94.8 96.4 95.1 95.0 92.6 91.6 93.2 94.2 91.0
Table C. Employment/population ratios, activity and unemployment rates Men (Percentages)
AnnStat.fm
Page 310 Friday, June 7, 2002 9:50 A
M
OE
CD
EM
PL
OY
ME
NT
OU
TL
OO
K – IS
BN
92-64-19778-8 – © 2002
Statistical annex–
311
15 to 24 25 to 54 55 to 641990 1998 1999 2000 2001 1990 1998 1999 2000 2001 1990 1998 1999 2000 2001
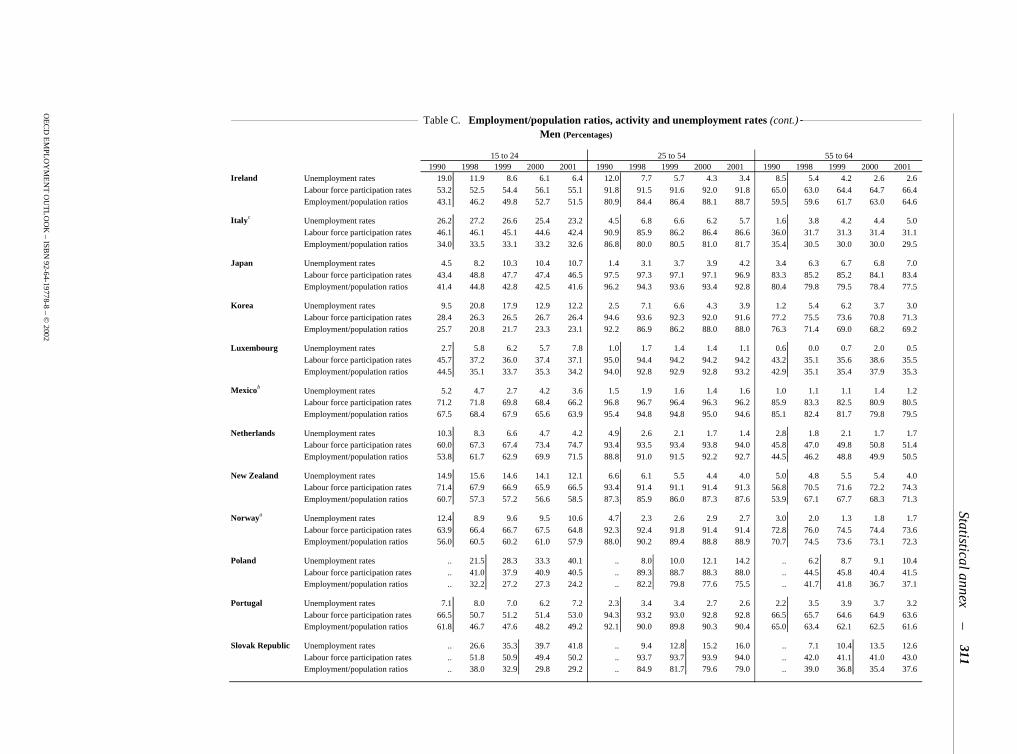
Ireland Unemployment rates 19.0 11.9 8.6 6.1 6.4 12.0 7.7 5.7 4.3 3.4 8.5 5.4 4.2 2.6 2.6Labour force participation rates 53.2 52.5 54.4 56.1 55.1 91.8 91.5 91.6 92.0 91.8 65.0 63.0 64.4 64.7 66.4Employment/population ratios 43.1 46.2 49.8 52.7 51.5 80.9 84.4 86.4 88.1 88.7 59.5 59.6 61.7 63.0 64.6
Italyc Unemployment rates 26.2 27.2 26.6 25.4 23.2 4.5 6.8 6.6 6.2 5.7 1.6 3.8 4.2 4.4 5.0Labour force participation rates 46.1 46.1 45.1 44.6 42.4 90.9 85.9 86.2 86.4 86.6 36.0 31.7 31.3 31.4 31.1Employment/population ratios 34.0 33.5 33.1 33.2 32.6 86.8 80.0 80.5 81.0 81.7 35.4 30.5 30.0 30.0 29.5
Japan Unemployment rates 4.5 8.2 10.3 10.4 10.7 1.4 3.1 3.7 3.9 4.2 3.4 6.3 6.7 6.8 7.0Labour force participation rates 43.4 48.8 47.7 47.4 46.5 97.5 97.3 97.1 97.1 96.9 83.3 85.2 85.2 84.1 83.4Employment/population ratios 41.4 44.8 42.8 42.5 41.6 96.2 94.3 93.6 93.4 92.8 80.4 79.8 79.5 78.4 77.5
Korea Unemployment rates 9.5 20.8 17.9 12.9 12.2 2.5 7.1 6.6 4.3 3.9 1.2 5.4 6.2 3.7 3.0Labour force participation rates 28.4 26.3 26.5 26.7 26.4 94.6 93.6 92.3 92.0 91.6 77.2 75.5 73.6 70.8 71.3Employment/population ratios 25.7 20.8 21.7 23.3 23.1 92.2 86.9 86.2 88.0 88.0 76.3 71.4 69.0 68.2 69.2
Luxembourg Unemployment rates 2.7 5.8 6.2 5.7 7.8 1.0 1.7 1.4 1.4 1.1 0.6 0.0 0.7 2.0 0.5Labour force participation rates 45.7 37.2 36.0 37.4 37.1 95.0 94.4 94.2 94.2 94.2 43.2 35.1 35.6 38.6 35.5Employment/population ratios 44.5 35.1 33.7 35.3 34.2 94.0 92.8 92.9 92.8 93.2 42.9 35.1 35.4 37.9 35.3
Mexicob Unemployment rates 5.2 4.7 2.7 4.2 3.6 1.5 1.9 1.6 1.4 1.6 1.0 1.1 1.1 1.4 1.2Labour force participation rates 71.2 71.8 69.8 68.4 66.2 96.8 96.7 96.4 96.3 96.2 85.9 83.3 82.5 80.9 80.5Employment/population ratios 67.5 68.4 67.9 65.6 63.9 95.4 94.8 94.8 95.0 94.6 85.1 82.4 81.7 79.8 79.5
Netherlands Unemployment rates 10.3 8.3 6.6 4.7 4.2 4.9 2.6 2.1 1.7 1.4 2.8 1.8 2.1 1.7 1.7Labour force participation rates 60.0 67.3 67.4 73.4 74.7 93.4 93.5 93.4 93.8 94.0 45.8 47.0 49.8 50.8 51.4Employment/population ratios 53.8 61.7 62.9 69.9 71.5 88.8 91.0 91.5 92.2 92.7 44.5 46.2 48.8 49.9 50.5
New Zealand Unemployment rates 14.9 15.6 14.6 14.1 12.1 6.6 6.1 5.5 4.4 4.0 5.0 4.8 5.5 5.4 4.0Labour force participation rates 71.4 67.9 66.9 65.9 66.5 93.4 91.4 91.1 91.4 91.3 56.8 70.5 71.6 72.2 74.3Employment/population ratios 60.7 57.3 57.2 56.6 58.5 87.3 85.9 86.0 87.3 87.6 53.9 67.1 67.7 68.3 71.3
Norwaya Unemployment rates 12.4 8.9 9.6 9.5 10.6 4.7 2.3 2.6 2.9 2.7 3.0 2.0 1.3 1.8 1.7Labour force participation rates 63.9 66.4 66.7 67.5 64.8 92.3 92.4 91.8 91.4 91.4 72.8 76.0 74.5 74.4 73.6Employment/population ratios 56.0 60.5 60.2 61.0 57.9 88.0 90.2 89.4 88.8 88.9 70.7 74.5 73.6 73.1 72.3
Poland Unemployment rates .. 21.5 28.3 33.3 40.1 .. 8.0 10.0 12.1 14.2 .. 6.2 8.7 9.1 10.4Labour force participation rates .. 41.0 37.9 40.9 40.5 .. 89.3 88.7 88.3 88.0 .. 44.5 45.8 40.4 41.5Employment/population ratios .. 32.2 27.2 27.3 24.2 .. 82.2 79.8 77.6 75.5 .. 41.7 41.8 36.7 37.1
Portugal Unemployment rates 7.1 8.0 7.0 6.2 7.2 2.3 3.4 3.4 2.7 2.6 2.2 3.5 3.9 3.7 3.2Labour force participation rates 66.5 50.7 51.2 51.4 53.0 94.3 93.2 93.0 92.8 92.8 66.5 65.7 64.6 64.9 63.6Employment/population ratios 61.8 46.7 47.6 48.2 49.2 92.1 90.0 89.8 90.3 90.4 65.0 63.4 62.1 62.5 61.6
Slovak Republic Unemployment rates .. 26.6 35.3 39.7 41.8 .. 9.4 12.8 15.2 16.0 .. 7.1 10.4 13.5 12.6Labour force participation rates .. 51.8 50.9 49.4 50.2 .. 93.7 93.7 93.9 94.0 .. 42.0 41.1 41.0 43.0Employment/population ratios .. 38.0 32.9 29.8 29.2 .. 84.9 81.7 79.6 79.0 .. 39.0 36.8 35.4 37.6
Table C. Employment/population ratios, activity and unemployment rates (cont.) Men (Percentages)
AnnStat.fm
Page 311 Friday, June 7, 2002 9:50 A
M
OE
CD
EM
PL
OY
ME
NT
OU
TL
OO
K – IS
BN
92-64-19778-8 – © 2002
–Statistical annex
312
15 to 24 25 to 54 55 to 641990 1998 1999 2000 2001 1990 1998 1999 2000 2001 1990 1998 1999 2000 2001
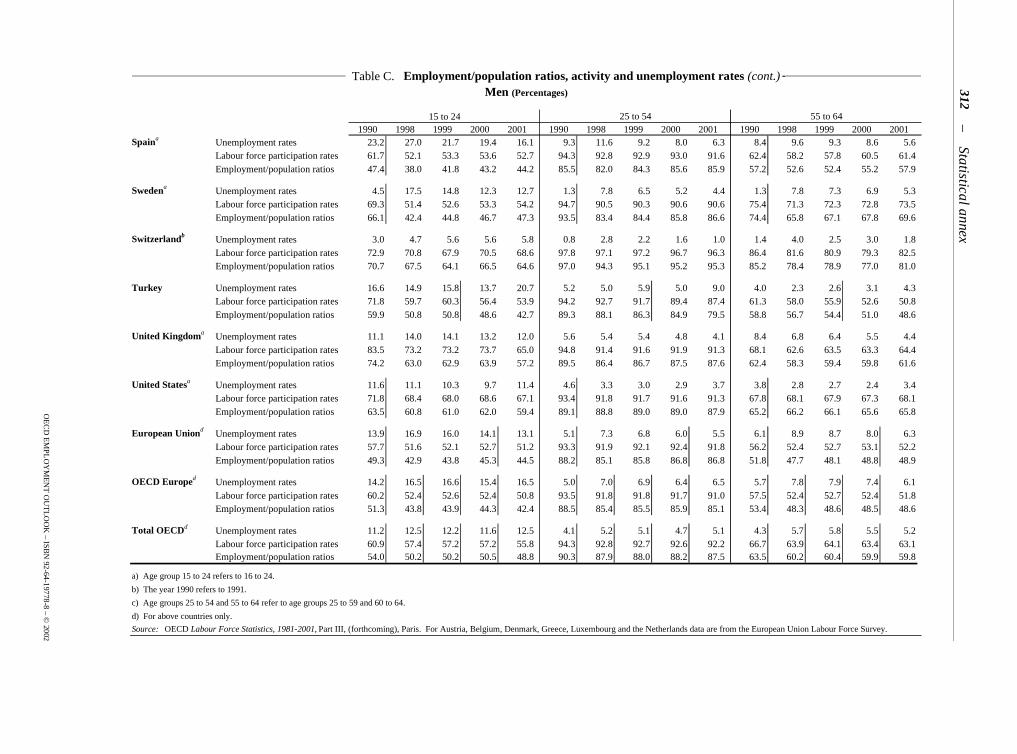
Spaina Unemployment rates 23.2 27.0 21.7 19.4 16.1 9.3 11.6 9.2 8.0 6.3 8.4 9.6 9.3 8.6 5.6Labour force participation rates 61.7 52.1 53.3 53.6 52.7 94.3 92.8 92.9 93.0 91.6 62.4 58.2 57.8 60.5 61.4Employment/population ratios 47.4 38.0 41.8 43.2 44.2 85.5 82.0 84.3 85.6 85.9 57.2 52.6 52.4 55.2 57.9
Swedena Unemployment rates 4.5 17.5 14.8 12.3 12.7 1.3 7.8 6.5 5.2 4.4 1.3 7.8 7.3 6.9 5.3Labour force participation rates 69.3 51.4 52.6 53.3 54.2 94.7 90.5 90.3 90.6 90.6 75.4 71.3 72.3 72.8 73.5Employment/population ratios 66.1 42.4 44.8 46.7 47.3 93.5 83.4 84.4 85.8 86.6 74.4 65.8 67.1 67.8 69.6
Switzerlandb Unemployment rates 3.0 4.7 5.6 5.6 5.8 0.8 2.8 2.2 1.6 1.0 1.4 4.0 2.5 3.0 1.8Labour force participation rates 72.9 70.8 67.9 70.5 68.6 97.8 97.1 97.2 96.7 96.3 86.4 81.6 80.9 79.3 82.5Employment/population ratios 70.7 67.5 64.1 66.5 64.6 97.0 94.3 95.1 95.2 95.3 85.2 78.4 78.9 77.0 81.0
Turkey Unemployment rates 16.6 14.9 15.8 13.7 20.7 5.2 5.0 5.9 5.0 9.0 4.0 2.3 2.6 3.1 4.3Labour force participation rates 71.8 59.7 60.3 56.4 53.9 94.2 92.7 91.7 89.4 87.4 61.3 58.0 55.9 52.6 50.8Employment/population ratios 59.9 50.8 50.8 48.6 42.7 89.3 88.1 86.3 84.9 79.5 58.8 56.7 54.4 51.0 48.6
United Kingdoma Unemployment rates 11.1 14.0 14.1 13.2 12.0 5.6 5.4 5.4 4.8 4.1 8.4 6.8 6.4 5.5 4.4Labour force participation rates 83.5 73.2 73.2 73.7 65.0 94.8 91.4 91.6 91.9 91.3 68.1 62.6 63.5 63.3 64.4Employment/population ratios 74.2 63.0 62.9 63.9 57.2 89.5 86.4 86.7 87.5 87.6 62.4 58.3 59.4 59.8 61.6
United Statesa Unemployment rates 11.6 11.1 10.3 9.7 11.4 4.6 3.3 3.0 2.9 3.7 3.8 2.8 2.7 2.4 3.4Labour force participation rates 71.8 68.4 68.0 68.6 67.1 93.4 91.8 91.7 91.6 91.3 67.8 68.1 67.9 67.3 68.1Employment/population ratios 63.5 60.8 61.0 62.0 59.4 89.1 88.8 89.0 89.0 87.9 65.2 66.2 66.1 65.6 65.8
European Uniond Unemployment rates 13.9 16.9 16.0 14.1 13.1 5.1 7.3 6.8 6.0 5.5 6.1 8.9 8.7 8.0 6.3Labour force participation rates 57.7 51.6 52.1 52.7 51.2 93.3 91.9 92.1 92.4 91.8 56.2 52.4 52.7 53.1 52.2Employment/population ratios 49.3 42.9 43.8 45.3 44.5 88.2 85.1 85.8 86.8 86.8 51.8 47.7 48.1 48.8 48.9
OECD Europed Unemployment rates 14.2 16.5 16.6 15.4 16.5 5.0 7.0 6.9 6.4 6.5 5.7 7.8 7.9 7.4 6.1Labour force participation rates 60.2 52.4 52.6 52.4 50.8 93.5 91.8 91.8 91.7 91.0 57.5 52.4 52.7 52.4 51.8Employment/population ratios 51.3 43.8 43.9 44.3 42.4 88.5 85.4 85.5 85.9 85.1 53.4 48.3 48.6 48.5 48.6
Total OECDd Unemployment rates 11.2 12.5 12.2 11.6 12.5 4.1 5.2 5.1 4.7 5.1 4.3 5.7 5.8 5.5 5.2Labour force participation rates 60.9 57.4 57.2 57.2 55.8 94.3 92.8 92.7 92.6 92.2 66.7 63.9 64.1 63.4 63.1Employment/population ratios 54.0 50.2 50.2 50.5 48.8 90.3 87.9 88.0 88.2 87.5 63.5 60.2 60.4 59.9 59.8
a) Age group 15 to 24 refers to 16 to 24.
b) The year 1990 refers to 1991.
c) Age groups 25 to 54 and 55 to 64 refer to age groups 25 to 59 and 60 to 64.
d) For above countries only.
Source: OECD Labour Force Statistics, 1981-2001, Part III, (forthcoming), Paris. For Austria, Belgium, Denmark, Greece, Luxembourg and the Netherlands data are from the European Union Labour Force Survey.
Table C. Employment/population ratios, activity and unemployment rates (cont.) Men (Percentages)
AnnStat.fm
Page 312 Friday, June 7, 2002 9:50 A
M
OE
CD
EM
PL
OY
ME
NT
OU
TL
OO
K – IS
BN
92-64-19778-8 – © 2002
Statistical annex–
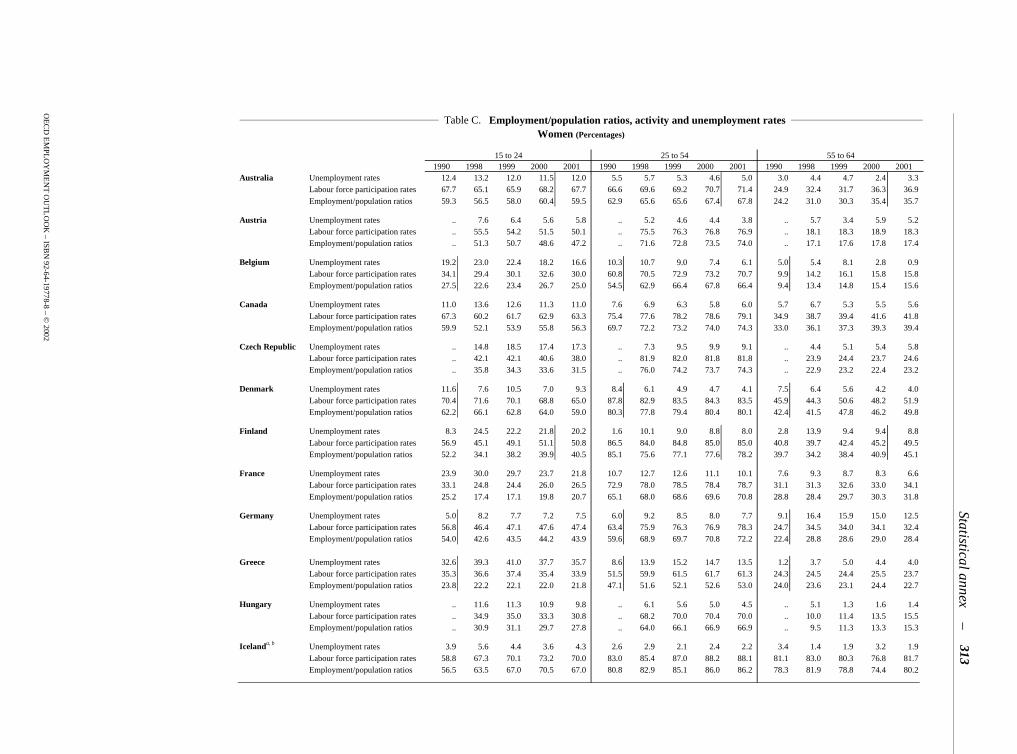
313
15 to 24 25 to 54 55 to 641990 1998 1999 2000 2001 1990 1998 1999 2000 2001 1990 1998 1999 2000 2001
Australia Unemployment rates 12.4 13.2 12.0 11.5 12.0 5.5 5.7 5.3 4.6 5.0 3.0 4.4 4.7 2.4 3.3Labour force participation rates 67.7 65.1 65.9 68.2 67.7 66.6 69.6 69.2 70.7 71.4 24.9 32.4 31.7 36.3 36.9Employment/population ratios 59.3 56.5 58.0 60.4 59.5 62.9 65.6 65.6 67.4 67.8 24.2 31.0 30.3 35.4 35.7
Austria Unemployment rates .. 7.6 6.4 5.6 5.8 .. 5.2 4.6 4.4 3.8 .. 5.7 3.4 5.9 5.2Labour force participation rates .. 55.5 54.2 51.5 50.1 .. 75.5 76.3 76.8 76.9 .. 18.1 18.3 18.9 18.3Employment/population ratios .. 51.3 50.7 48.6 47.2 .. 71.6 72.8 73.5 74.0 .. 17.1 17.6 17.8 17.4
Belgium Unemployment rates 19.2 23.0 22.4 18.2 16.6 10.3 10.7 9.0 7.4 6.1 5.0 5.4 8.1 2.8 0.9Labour force participation rates 34.1 29.4 30.1 32.6 30.0 60.8 70.5 72.9 73.2 70.7 9.9 14.2 16.1 15.8 15.8Employment/population ratios 27.5 22.6 23.4 26.7 25.0 54.5 62.9 66.4 67.8 66.4 9.4 13.4 14.8 15.4 15.6
Canada Unemployment rates 11.0 13.6 12.6 11.3 11.0 7.6 6.9 6.3 5.8 6.0 5.7 6.7 5.3 5.5 5.6Labour force participation rates 67.3 60.2 61.7 62.9 63.3 75.4 77.6 78.2 78.6 79.1 34.9 38.7 39.4 41.6 41.8Employment/population ratios 59.9 52.1 53.9 55.8 56.3 69.7 72.2 73.2 74.0 74.3 33.0 36.1 37.3 39.3 39.4
Czech Republic Unemployment rates .. 14.8 18.5 17.4 17.3 .. 7.3 9.5 9.9 9.1 .. 4.4 5.1 5.4 5.8Labour force participation rates .. 42.1 42.1 40.6 38.0 .. 81.9 82.0 81.8 81.8 .. 23.9 24.4 23.7 24.6Employment/population ratios .. 35.8 34.3 33.6 31.5 .. 76.0 74.2 73.7 74.3 .. 22.9 23.2 22.4 23.2
Denmark Unemployment rates 11.6 7.6 10.5 7.0 9.3 8.4 6.1 4.9 4.7 4.1 7.5 6.4 5.6 4.2 4.0Labour force participation rates 70.4 71.6 70.1 68.8 65.0 87.8 82.9 83.5 84.3 83.5 45.9 44.3 50.6 48.2 51.9Employment/population ratios 62.2 66.1 62.8 64.0 59.0 80.3 77.8 79.4 80.4 80.1 42.4 41.5 47.8 46.2 49.8
Finland Unemployment rates 8.3 24.5 22.2 21.8 20.2 1.6 10.1 9.0 8.8 8.0 2.8 13.9 9.4 9.4 8.8Labour force participation rates 56.9 45.1 49.1 51.1 50.8 86.5 84.0 84.8 85.0 85.0 40.8 39.7 42.4 45.2 49.5Employment/population ratios 52.2 34.1 38.2 39.9 40.5 85.1 75.6 77.1 77.6 78.2 39.7 34.2 38.4 40.9 45.1
France Unemployment rates 23.9 30.0 29.7 23.7 21.8 10.7 12.7 12.6 11.1 10.1 7.6 9.3 8.7 8.3 6.6Labour force participation rates 33.1 24.8 24.4 26.0 26.5 72.9 78.0 78.5 78.4 78.7 31.1 31.3 32.6 33.0 34.1Employment/population ratios 25.2 17.4 17.1 19.8 20.7 65.1 68.0 68.6 69.6 70.8 28.8 28.4 29.7 30.3 31.8
Germany Unemployment rates 5.0 8.2 7.7 7.2 7.5 6.0 9.2 8.5 8.0 7.7 9.1 16.4 15.9 15.0 12.5Labour force participation rates 56.8 46.4 47.1 47.6 47.4 63.4 75.9 76.3 76.9 78.3 24.7 34.5 34.0 34.1 32.4Employment/population ratios 54.0 42.6 43.5 44.2 43.9 59.6 68.9 69.7 70.8 72.2 22.4 28.8 28.6 29.0 28.4
Greece Unemployment rates 32.6 39.3 41.0 37.7 35.7 8.6 13.9 15.2 14.7 13.5 1.2 3.7 5.0 4.4 4.0Labour force participation rates 35.3 36.6 37.4 35.4 33.9 51.5 59.9 61.5 61.7 61.3 24.3 24.5 24.4 25.5 23.7Employment/population ratios 23.8 22.2 22.1 22.0 21.8 47.1 51.6 52.1 52.6 53.0 24.0 23.6 23.1 24.4 22.7
Hungary Unemployment rates .. 11.6 11.3 10.9 9.8 .. 6.1 5.6 5.0 4.5 .. 5.1 1.3 1.6 1.4Labour force participation rates .. 34.9 35.0 33.3 30.8 .. 68.2 70.0 70.4 70.0 .. 10.0 11.4 13.5 15.5Employment/population ratios .. 30.9 31.1 29.7 27.8 .. 64.0 66.1 66.9 66.9 .. 9.5 11.3 13.3 15.3
Icelanda, b Unemployment rates 3.9 5.6 4.4 3.6 4.3 2.6 2.9 2.1 2.4 2.2 3.4 1.4 1.9 3.2 1.9Labour force participation rates 58.8 67.3 70.1 73.2 70.0 83.0 85.4 87.0 88.2 88.1 81.1 83.0 80.3 76.8 81.7Employment/population ratios 56.5 63.5 67.0 70.5 67.0 80.8 82.9 85.1 86.0 86.2 78.3 81.9 78.8 74.4 80.2
Table C. Employment/population ratios, activity and unemployment rates Women (Percentages)
AnnStat.fm
Page 313 Friday, June 7, 2002 9:50 A
M
OE
CD
EM
PL
OY
ME
NT
OU
TL
OO
K – IS
BN
92-64-19778-8 – © 2002
–Statistical annex
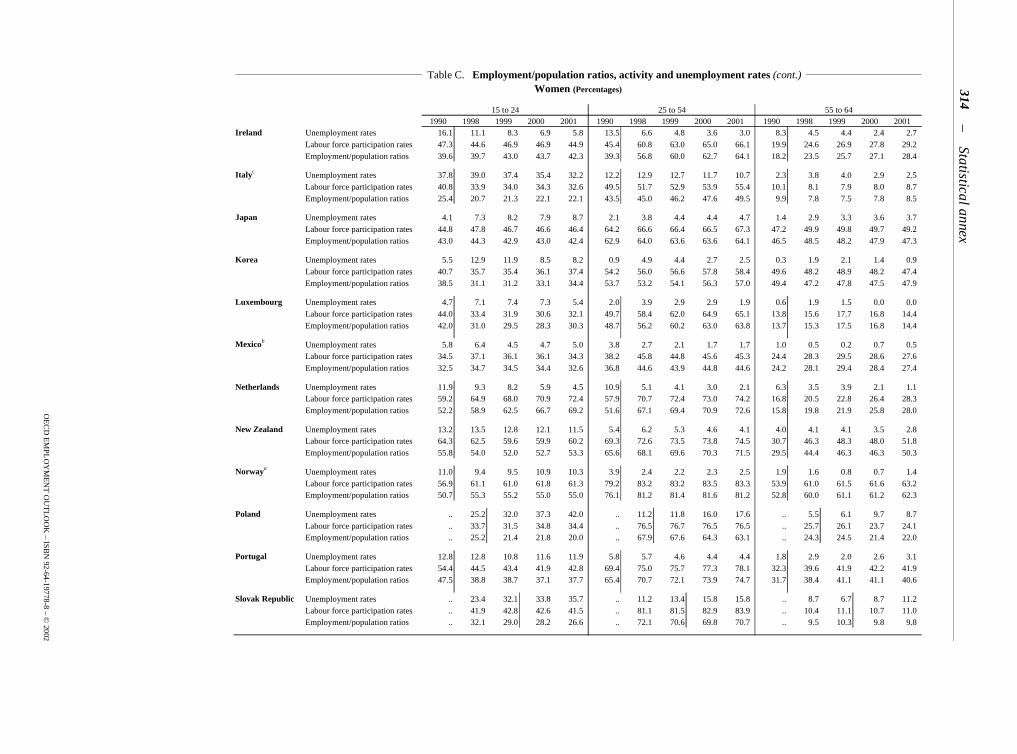
314
15 to 24 25 to 54 55 to 641990 1998 1999 2000 2001 1990 1998 1999 2000 2001 1990 1998 1999 2000 2001
Ireland Unemployment rates 16.1 11.1 8.3 6.9 5.8 13.5 6.6 4.8 3.6 3.0 8.3 4.5 4.4 2.4 2.7Labour force participation rates 47.3 44.6 46.9 46.9 44.9 45.4 60.8 63.0 65.0 66.1 19.9 24.6 26.9 27.8 29.2Employment/population ratios 39.6 39.7 43.0 43.7 42.3 39.3 56.8 60.0 62.7 64.1 18.2 23.5 25.7 27.1 28.4
Italyc Unemployment rates 37.8 39.0 37.4 35.4 32.2 12.2 12.9 12.7 11.7 10.7 2.3 3.8 4.0 2.9 2.5Labour force participation rates 40.8 33.9 34.0 34.3 32.6 49.5 51.7 52.9 53.9 55.4 10.1 8.1 7.9 8.0 8.7Employment/population ratios 25.4 20.7 21.3 22.1 22.1 43.5 45.0 46.2 47.6 49.5 9.9 7.8 7.5 7.8 8.5
Japan Unemployment rates 4.1 7.3 8.2 7.9 8.7 2.1 3.8 4.4 4.4 4.7 1.4 2.9 3.3 3.6 3.7Labour force participation rates 44.8 47.8 46.7 46.6 46.4 64.2 66.6 66.4 66.5 67.3 47.2 49.9 49.8 49.7 49.2Employment/population ratios 43.0 44.3 42.9 43.0 42.4 62.9 64.0 63.6 63.6 64.1 46.5 48.5 48.2 47.9 47.3
Korea Unemployment rates 5.5 12.9 11.9 8.5 8.2 0.9 4.9 4.4 2.7 2.5 0.3 1.9 2.1 1.4 0.9Labour force participation rates 40.7 35.7 35.4 36.1 37.4 54.2 56.0 56.6 57.8 58.4 49.6 48.2 48.9 48.2 47.4Employment/population ratios 38.5 31.1 31.2 33.1 34.4 53.7 53.2 54.1 56.3 57.0 49.4 47.2 47.8 47.5 47.9
Luxembourg Unemployment rates 4.7 7.1 7.4 7.3 5.4 2.0 3.9 2.9 2.9 1.9 0.6 1.9 1.5 0.0 0.0Labour force participation rates 44.0 33.4 31.9 30.6 32.1 49.7 58.4 62.0 64.9 65.1 13.8 15.6 17.7 16.8 14.4Employment/population ratios 42.0 31.0 29.5 28.3 30.3 48.7 56.2 60.2 63.0 63.8 13.7 15.3 17.5 16.8 14.4
Mexicob Unemployment rates 5.8 6.4 4.5 4.7 5.0 3.8 2.7 2.1 1.7 1.7 1.0 0.5 0.2 0.7 0.5Labour force participation rates 34.5 37.1 36.1 36.1 34.3 38.2 45.8 44.8 45.6 45.3 24.4 28.3 29.5 28.6 27.6Employment/population ratios 32.5 34.7 34.5 34.4 32.6 36.8 44.6 43.9 44.8 44.6 24.2 28.1 29.4 28.4 27.4
Netherlands Unemployment rates 11.9 9.3 8.2 5.9 4.5 10.9 5.1 4.1 3.0 2.1 6.3 3.5 3.9 2.1 1.1Labour force participation rates 59.2 64.9 68.0 70.9 72.4 57.9 70.7 72.4 73.0 74.2 16.8 20.5 22.8 26.4 28.3Employment/population ratios 52.2 58.9 62.5 66.7 69.2 51.6 67.1 69.4 70.9 72.6 15.8 19.8 21.9 25.8 28.0
New Zealand Unemployment rates 13.2 13.5 12.8 12.1 11.5 5.4 6.2 5.3 4.6 4.1 4.0 4.1 4.1 3.5 2.8Labour force participation rates 64.3 62.5 59.6 59.9 60.2 69.3 72.6 73.5 73.8 74.5 30.7 46.3 48.3 48.0 51.8Employment/population ratios 55.8 54.0 52.0 52.7 53.3 65.6 68.1 69.6 70.3 71.5 29.5 44.4 46.3 46.3 50.3
Norwaya Unemployment rates 11.0 9.4 9.5 10.9 10.3 3.9 2.4 2.2 2.3 2.5 1.9 1.6 0.8 0.7 1.4Labour force participation rates 56.9 61.1 61.0 61.8 61.3 79.2 83.2 83.2 83.5 83.3 53.9 61.0 61.5 61.6 63.2Employment/population ratios 50.7 55.3 55.2 55.0 55.0 76.1 81.2 81.4 81.6 81.2 52.8 60.0 61.1 61.2 62.3
Poland Unemployment rates .. 25.2 32.0 37.3 42.0 .. 11.2 11.8 16.0 17.6 .. 5.5 6.1 9.7 8.7Labour force participation rates .. 33.7 31.5 34.8 34.4 .. 76.5 76.7 76.5 76.5 .. 25.7 26.1 23.7 24.1Employment/population ratios .. 25.2 21.4 21.8 20.0 .. 67.9 67.6 64.3 63.1 .. 24.3 24.5 21.4 22.0
Portugal Unemployment rates 12.8 12.8 10.8 11.6 11.9 5.8 5.7 4.6 4.4 4.4 1.8 2.9 2.0 2.6 3.1Labour force participation rates 54.4 44.5 43.4 41.9 42.8 69.4 75.0 75.7 77.3 78.1 32.3 39.6 41.9 42.2 41.9Employment/population ratios 47.5 38.8 38.7 37.1 37.7 65.4 70.7 72.1 73.9 74.7 31.7 38.4 41.1 41.1 40.6
Slovak Republic Unemployment rates .. 23.4 32.1 33.8 35.7 .. 11.2 13.4 15.8 15.8 .. 8.7 6.7 8.7 11.2Labour force participation rates .. 41.9 42.8 42.6 41.5 .. 81.1 81.5 82.9 83.9 .. 10.4 11.1 10.7 11.0Employment/population ratios .. 32.1 29.0 28.2 26.6 .. 72.1 70.6 69.8 70.7 .. 9.5 10.3 9.8 9.8
Table C. Employment/population ratios, activity and unemployment rates (cont.) Women (Percentages)
AnnStat.fm
Page 314 Friday, June 7, 2002 9:50 A
M
OE
CD
EM
PL
OY
ME
NT
OU
TL
OO
K – IS
BN
92-64-19778-8 – © 2002
Statistical annex–
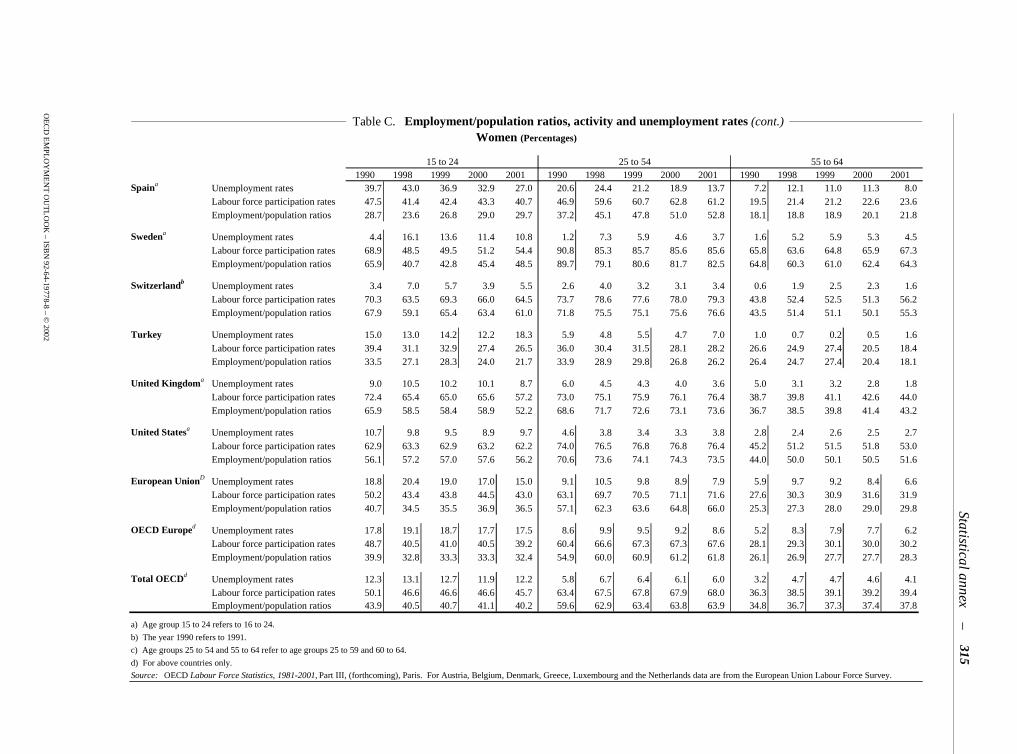
315
15 to 24 25 to 54 55 to 641990 1998 1999 2000 2001 1990 1998 1999 2000 2001 1990 1998 1999 2000 2001
Spaina Unemployment rates 39.7 43.0 36.9 32.9 27.0 20.6 24.4 21.2 18.9 13.7 7.2 12.1 11.0 11.3 8.0Labour force participation rates 47.5 41.4 42.4 43.3 40.7 46.9 59.6 60.7 62.8 61.2 19.5 21.4 21.2 22.6 23.6Employment/population ratios 28.7 23.6 26.8 29.0 29.7 37.2 45.1 47.8 51.0 52.8 18.1 18.8 18.9 20.1 21.8
Swedena Unemployment rates 4.4 16.1 13.6 11.4 10.8 1.2 7.3 5.9 4.6 3.7 1.6 5.2 5.9 5.3 4.5Labour force participation rates 68.9 48.5 49.5 51.2 54.4 90.8 85.3 85.7 85.6 85.6 65.8 63.6 64.8 65.9 67.3Employment/population ratios 65.9 40.7 42.8 45.4 48.5 89.7 79.1 80.6 81.7 82.5 64.8 60.3 61.0 62.4 64.3
Switzerlandb Unemployment rates 3.4 7.0 5.7 3.9 5.5 2.6 4.0 3.2 3.1 3.4 0.6 1.9 2.5 2.3 1.6Labour force participation rates 70.3 63.5 69.3 66.0 64.5 73.7 78.6 77.6 78.0 79.3 43.8 52.4 52.5 51.3 56.2Employment/population ratios 67.9 59.1 65.4 63.4 61.0 71.8 75.5 75.1 75.6 76.6 43.5 51.4 51.1 50.1 55.3
Turkey Unemployment rates 15.0 13.0 14.2 12.2 18.3 5.9 4.8 5.5 4.7 7.0 1.0 0.7 0.2 0.5 1.6Labour force participation rates 39.4 31.1 32.9 27.4 26.5 36.0 30.4 31.5 28.1 28.2 26.6 24.9 27.4 20.5 18.4Employment/population ratios 33.5 27.1 28.3 24.0 21.7 33.9 28.9 29.8 26.8 26.2 26.4 24.7 27.4 20.4 18.1
United Kingdoma Unemployment rates 9.0 10.5 10.2 10.1 8.7 6.0 4.5 4.3 4.0 3.6 5.0 3.1 3.2 2.8 1.8Labour force participation rates 72.4 65.4 65.0 65.6 57.2 73.0 75.1 75.9 76.1 76.4 38.7 39.8 41.1 42.6 44.0Employment/population ratios 65.9 58.5 58.4 58.9 52.2 68.6 71.7 72.6 73.1 73.6 36.7 38.5 39.8 41.4 43.2
United Statesa Unemployment rates 10.7 9.8 9.5 8.9 9.7 4.6 3.8 3.4 3.3 3.8 2.8 2.4 2.6 2.5 2.7Labour force participation rates 62.9 63.3 62.9 63.2 62.2 74.0 76.5 76.8 76.8 76.4 45.2 51.2 51.5 51.8 53.0Employment/population ratios 56.1 57.2 57.0 57.6 56.2 70.6 73.6 74.1 74.3 73.5 44.0 50.0 50.1 50.5 51.6
European UnionD Unemployment rates 18.8 20.4 19.0 17.0 15.0 9.1 10.5 9.8 8.9 7.9 5.9 9.7 9.2 8.4 6.6Labour force participation rates 50.2 43.4 43.8 44.5 43.0 63.1 69.7 70.5 71.1 71.6 27.6 30.3 30.9 31.6 31.9Employment/population ratios 40.7 34.5 35.5 36.9 36.5 57.1 62.3 63.6 64.8 66.0 25.3 27.3 28.0 29.0 29.8
OECD Europed Unemployment rates 17.8 19.1 18.7 17.7 17.5 8.6 9.9 9.5 9.2 8.6 5.2 8.3 7.9 7.7 6.2Labour force participation rates 48.7 40.5 41.0 40.5 39.2 60.4 66.6 67.3 67.3 67.6 28.1 29.3 30.1 30.0 30.2Employment/population ratios 39.9 32.8 33.3 33.3 32.4 54.9 60.0 60.9 61.2 61.8 26.1 26.9 27.7 27.7 28.3
Total OECDd Unemployment rates 12.3 13.1 12.7 11.9 12.2 5.8 6.7 6.4 6.1 6.0 3.2 4.7 4.7 4.6 4.1Labour force participation rates 50.1 46.6 46.6 46.6 45.7 63.4 67.5 67.8 67.9 68.0 36.3 38.5 39.1 39.2 39.4Employment/population ratios 43.9 40.5 40.7 41.1 40.2 59.6 62.9 63.4 63.8 63.9 34.8 36.7 37.3 37.4 37.8
a) Age group 15 to 24 refers to 16 to 24.
b) The year 1990 refers to 1991.
c) Age groups 25 to 54 and 55 to 64 refer to age groups 25 to 59 and 60 to 64.
d) For above countries only.
Source: OECD Labour Force Statistics, 1981-2001, Part III, (forthcoming), Paris. For Austria, Belgium, Denmark, Greece, Luxembourg and the Netherlands data are from the European Union Labour Force Survey.
Table C. Employment/population ratios, activity and unemployment rates (cont.) Women (Percentages)
AnnStat.fm
Page 315 Friday, June 7, 2002 9:50 A
M
OE
CD
EM
PL
OY
ME
NT
OU
TL
OO
K – IS
BN
92-64-19778-8 – © 2002
–Statistical annex
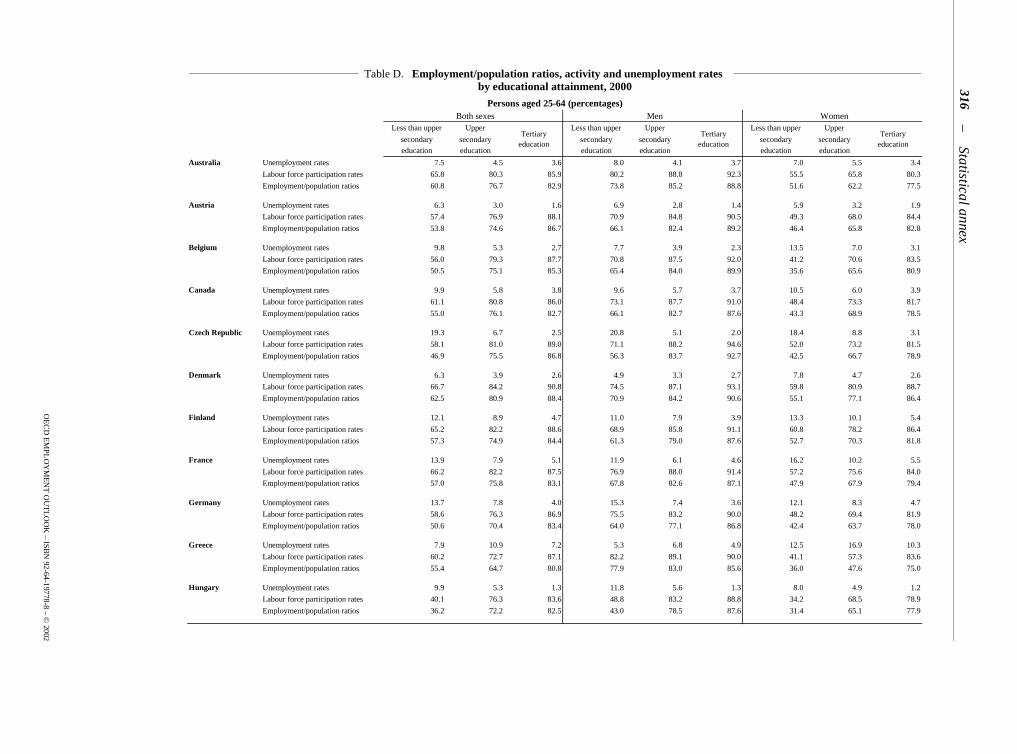
316
Both sexes Men WomenLess than upper Upper Less than upper Upper Less than upper Upper
secondary secondary secondary secondary secondary secondaryeducation education education education education education
Australia Unemployment rates 7.5 4.5 3.6 8.0 4.1 3.7 7.0 5.5 3.4
Labour force participation rates 65.8 80.3 85.9 80.2 88.8 92.3 55.5 65.8 80.3
Employment/population ratios 60.8 76.7 82.9 73.8 85.2 88.8 51.6 62.2 77.5
Austria Unemployment rates 6.3 3.0 1.6 6.9 2.8 1.4 5.9 3.2 1.9
Labour force participation rates 57.4 76.9 88.1 70.9 84.8 90.5 49.3 68.0 84.4
Employment/population ratios 53.8 74.6 86.7 66.1 82.4 89.2 46.4 65.8 82.8
Belgium Unemployment rates 9.8 5.3 2.7 7.7 3.9 2.3 13.5 7.0 3.1
Labour force participation rates 56.0 79.3 87.7 70.8 87.5 92.0 41.2 70.6 83.5
Employment/population ratios 50.5 75.1 85.3 65.4 84.0 89.9 35.6 65.6 80.9
Canada Unemployment rates 9.9 5.8 3.8 9.6 5.7 3.7 10.5 6.0 3.9
Labour force participation rates 61.1 80.8 86.0 73.1 87.7 91.0 48.4 73.3 81.7
Employment/population ratios 55.0 76.1 82.7 66.1 82.7 87.6 43.3 68.9 78.5
Czech Republic Unemployment rates 19.3 6.7 2.5 20.8 5.1 2.0 18.4 8.8 3.1
Labour force participation rates 58.1 81.0 89.0 71.1 88.2 94.6 52.0 73.2 81.5
Employment/population ratios 46.9 75.5 86.8 56.3 83.7 92.7 42.5 66.7 78.9
Denmark Unemployment rates 6.3 3.9 2.6 4.9 3.3 2.7 7.8 4.7 2.6
Labour force participation rates 66.7 84.2 90.8 74.5 87.1 93.1 59.8 80.9 88.7
Employment/population ratios 62.5 80.9 88.4 70.9 84.2 90.6 55.1 77.1 86.4
Finland Unemployment rates 12.1 8.9 4.7 11.0 7.9 3.9 13.3 10.1 5.4
Labour force participation rates 65.2 82.2 88.6 68.9 85.8 91.1 60.8 78.2 86.4
Employment/population ratios 57.3 74.9 84.4 61.3 79.0 87.6 52.7 70.3 81.8
France Unemployment rates 13.9 7.9 5.1 11.9 6.1 4.6 16.2 10.2 5.5
Labour force participation rates 66.2 82.2 87.5 76.9 88.0 91.4 57.2 75.6 84.0
Employment/population ratios 57.0 75.8 83.1 67.8 82.6 87.1 47.9 67.9 79.4
Germany Unemployment rates 13.7 7.8 4.0 15.3 7.4 3.6 12.1 8.3 4.7
Labour force participation rates 58.6 76.3 86.9 75.5 83.2 90.0 48.2 69.4 81.9
Employment/population ratios 50.6 70.4 83.4 64.0 77.1 86.8 42.4 63.7 78.0
Greece Unemployment rates 7.9 10.9 7.2 5.3 6.8 4.9 12.5 16.9 10.3
Labour force participation rates 60.2 72.7 87.1 82.2 89.1 90.0 41.1 57.3 83.6
Employment/population ratios 55.4 64.7 80.8 77.9 83.0 85.6 36.0 47.6 75.0
Hungary Unemployment rates 9.9 5.3 1.3 11.8 5.6 1.3 8.0 4.9 1.2
Labour force participation rates 40.1 76.3 83.6 48.8 83.2 88.8 34.2 68.5 78.9
Employment/population ratios 36.2 72.2 82.5 43.0 78.5 87.6 31.4 65.1 77.9
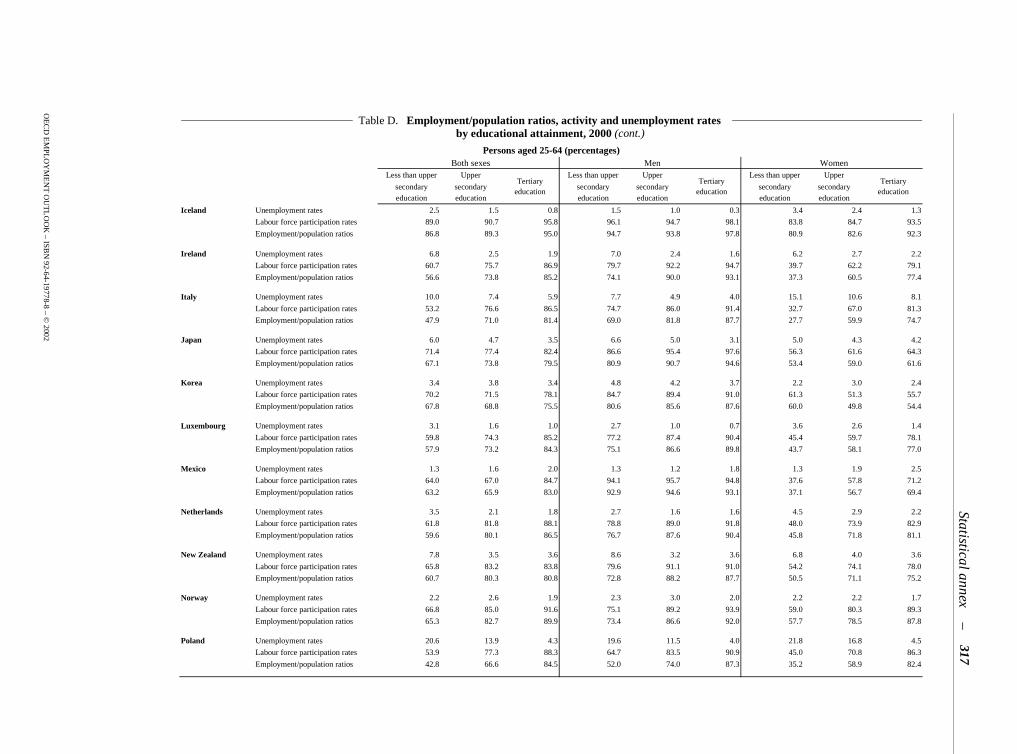
Table D. Employment/population ratios, activity and unemployment rates by educational attainment, 2000
Tertiary education
Tertiary education
Tertiary education
Persons aged 25-64 (percentages)
AnnStat.fm
Page 316 Friday, June 7, 2002 9:50 A
M
OE
CD
EM
PL
OY
ME
NT
OU
TL
OO
K – IS
BN
92-64-19778-8 – © 2002
Statistical annex–
317
Both sexes Men WomenLess than upper Upper Less than upper Upper Less than upper Upper
secondary secondary secondary secondary secondary secondaryeducation education education education education education
Iceland Unemployment rates 2.5 1.5 0.8 1.5 1.0 0.3 3.4 2.4 1.3
Labour force participation rates 89.0 90.7 95.8 96.1 94.7 98.1 83.8 84.7 93.5
Employment/population ratios 86.8 89.3 95.0 94.7 93.8 97.8 80.9 82.6 92.3
Ireland Unemployment rates 6.8 2.5 1.9 7.0 2.4 1.6 6.2 2.7 2.2
Labour force participation rates 60.7 75.7 86.9 79.7 92.2 94.7 39.7 62.2 79.1
Employment/population ratios 56.6 73.8 85.2 74.1 90.0 93.1 37.3 60.5 77.4
Italy Unemployment rates 10.0 7.4 5.9 7.7 4.9 4.0 15.1 10.6 8.1
Labour force participation rates 53.2 76.6 86.5 74.7 86.0 91.4 32.7 67.0 81.3
Employment/population ratios 47.9 71.0 81.4 69.0 81.8 87.7 27.7 59.9 74.7
Japan Unemployment rates 6.0 4.7 3.5 6.6 5.0 3.1 5.0 4.3 4.2
Labour force participation rates 71.4 77.4 82.4 86.6 95.4 97.6 56.3 61.6 64.3
Employment/population ratios 67.1 73.8 79.5 80.9 90.7 94.6 53.4 59.0 61.6
Korea Unemployment rates 3.4 3.8 3.4 4.8 4.2 3.7 2.2 3.0 2.4
Labour force participation rates 70.2 71.5 78.1 84.7 89.4 91.0 61.3 51.3 55.7
Employment/population ratios 67.8 68.8 75.5 80.6 85.6 87.6 60.0 49.8 54.4
Luxembourg Unemployment rates 3.1 1.6 1.0 2.7 1.0 0.7 3.6 2.6 1.4
Labour force participation rates 59.8 74.3 85.2 77.2 87.4 90.4 45.4 59.7 78.1
Employment/population ratios 57.9 73.2 84.3 75.1 86.6 89.8 43.7 58.1 77.0
Mexico Unemployment rates 1.3 1.6 2.0 1.3 1.2 1.8 1.3 1.9 2.5
Labour force participation rates 64.0 67.0 84.7 94.1 95.7 94.8 37.6 57.8 71.2
Employment/population ratios 63.2 65.9 83.0 92.9 94.6 93.1 37.1 56.7 69.4
Netherlands Unemployment rates 3.5 2.1 1.8 2.7 1.6 1.6 4.5 2.9 2.2
Labour force participation rates 61.8 81.8 88.1 78.8 89.0 91.8 48.0 73.9 82.9
Employment/population ratios 59.6 80.1 86.5 76.7 87.6 90.4 45.8 71.8 81.1
New Zealand Unemployment rates 7.8 3.5 3.6 8.6 3.2 3.6 6.8 4.0 3.6
Labour force participation rates 65.8 83.2 83.8 79.6 91.1 91.0 54.2 74.1 78.0
Employment/population ratios 60.7 80.3 80.8 72.8 88.2 87.7 50.5 71.1 75.2
Norway Unemployment rates 2.2 2.6 1.9 2.3 3.0 2.0 2.2 2.2 1.7
Labour force participation rates 66.8 85.0 91.6 75.1 89.2 93.9 59.0 80.3 89.3
Employment/population ratios 65.3 82.7 89.9 73.4 86.6 92.0 57.7 78.5 87.8
Poland Unemployment rates 20.6 13.9 4.3 19.6 11.5 4.0 21.8 16.8 4.5
Labour force participation rates 53.9 77.3 88.3 64.7 83.5 90.9 45.0 70.8 86.3
Employment/population ratios 42.8 66.6 84.5 52.0 74.0 87.3 35.2 58.9 82.4
Table D. Employment/population ratios, activity and unemployment rates by educational attainment, 2000 (cont.)
Persons aged 25-64 (percentages)
Tertiary education
Tertiary education
Tertiary education
AnnStat.fm
Page 317 Friday, June 7, 2002 9:50 A
M

OE
CD
EM
PL
OY
ME
NT
OU
TL
OO
K – IS
BN
92-64-19778-8 – © 2002
–Statistical annex
318
Both sexes Men WomenLess than upper Upper Less than upper Upper Less than upper Upper
secondary secondary secondary secondary secondary secondaryeducation education education education education education
Portugal Unemployment rates 3.6 3.3 2.8 2.9 2.2 2.3 4.3 4.4 3.1
Labour force participation rates 75.8 86.7 92.9 86.5 88.8 94.8 65.5 84.5 91.5
Employment/population ratios 73.1 83.8 90.3 84.0 86.8 92.7 62.7 80.7 88.6
Slovak Republic Unemployment rates 36.3 14.3 4.6 41.7 13.9 5.3 32.2 14.7 3.7
Labour force participation rates 48.5 82.4 89.7 61.5 88.2 92.9 41.8 76.1 86.4
Employment/population ratios 30.9 70.6 85.6 35.8 75.9 88.0 28.3 64.9 83.1
Spain Unemployment rates 13.7 11.0 9.5 9.4 6.4 6.1 21.9 17.4 13.6
Labour force participation rates 62.4 80.9 87.9 83.9 91.6 92.0 41.9 69.7 83.6
Employment/population ratios 53.9 72.0 79.5 76.1 85.7 86.4 32.7 57.6 72.2
Sweden Unemployment rates 8.0 5.3 3.0 7.6 5.7 3.6 8.5 4.9 2.5
Labour force participation rates 73.9 86.2 89.4 79.4 89.0 90.2 67.3 83.4 88.6
Employment/population ratios 68.0 81.7 86.7 73.3 83.9 87.0 61.6 79.3 86.4
Switzerland Unemployment rates 5.0 2.0 1.3 4.9 1.5 1.1 5.2 2.6 1.9
Labour force participation rates 69.0 83.6 92.2 86.1 93.8 95.6 59.0 75.1 84.0
Employment/population ratios 65.5 81.9 90.9 81.9 92.4 94.5 56.0 73.2 82.5
Turkey Unemployment rates 4.7 5.6 3.7 4.9 4.6 3.5 3.9 11.0 4.1
Labour force participation rates 55.2 65.2 81.5 84.4 87.7 87.3 22.0 25.9 71.1
Employment/population ratios 52.6 61.6 78.5 80.2 83.6 84.2 21.1 23.1 68.1
United Kingdom Unemployment rates 8.9 4.5 2.1 11.6 4.8 2.2 6.0 4.1 2.1
Labour force participation rates 58.9 82.8 89.8 68.0 88.7 92.4 51.6 76.8 86.5
Employment/population ratios 53.7 79.1 87.8 60.1 84.5 90.4 48.5 73.7 84.7
United States Unemployment rates 7.9 3.6 1.8 7.1 3.7 1.8 9.1 3.5 1.7
Labour force participation rates 62.7 79.5 86.5 74.9 86.2 91.7 50.4 73.3 81.5
Employment/population ratios 57.8 76.7 85.0 69.6 83.1 90.0 45.8 70.7 80.2
European Union a Unemployment rates 10.6 6.5 4.3 8.8 5.6 3.5 13.1 7.6 5.3
Labour force participation rates 60.3 79.6 87.9 77.0 86.7 91.3 45.7 72.3 84.0
Employment/population ratios 53.9 74.5 84.2 70.2 81.9 88.1 39.7 66.8 79.6
OECD Europe a Unemployment rates 10.0 7.2 4.1 8.4 6.2 3.4 12.6 8.6 5.0
Labour force participation rates 58.8 79.1 87.8 77.7 86.5 91.2 41.7 71.2 83.7
Employment/population ratios 52.9 73.3 84.2 71.2 81.1 88.1 36.4 65.1 79.5
Total OECD a Unemployment rates 7.4 5.6 3.0 6.6 5.2 2.8 8.9 6.1 3.4
Labour force participation rates 61.7 78.6 85.8 81.1 87.8 92.6 44.3 69.4 78.4Employment/population ratios 57.1 74.2 83.2 75.8 83.3 90.0 40.4 65.2 75.8
a) For above countries only.
Source : OECD, Education at a Glance - OECD Indicators 2002 .
Table D. Employment/population ratios, activity and unemployment rates by educational attainment, 2000 (cont.)
Persons aged 25-64 (percentages)
Tertiary education
Tertiary education
Tertiary education
AnnStat.fm
Page 318 Friday, June 7, 2002 9:50 A
M
OECD EMPLOYMENT OUTLOOK – ISBN 92-64-19778-8 – © 2002
Statistical annex – 319
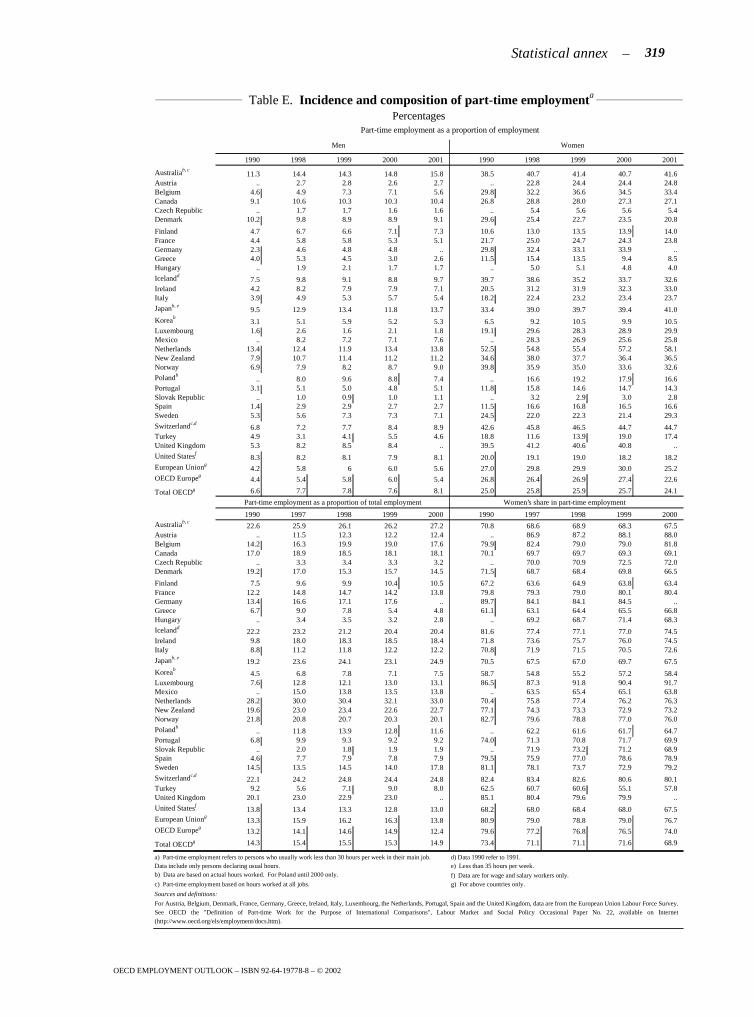
1990 1998 1999 2000 2001 1990 1998 1999 2000 2001
Australiab, c11.3 14.4 14.3 14.8 15.8 38.5 40.7 41.4 40.7 41.6
Austria .. 2.7 2.8 2.6 2.7 .. 22.8 24.4 24.4 24.8Belgium 4.6 4.9 7.3 7.1 5.6 29.8 32.2 36.6 34.5 33.4Canada 9.1 10.6 10.3 10.3 10.4 26.8 28.8 28.0 27.3 27.1Czech Republic .. 1.7 1.7 1.6 1.6 .. 5.4 5.6 5.6 5.4Denmark 10.2 9.8 8.9 8.9 9.1 29.6 25.4 22.7 23.5 20.8
Finland 4.7 6.7 6.6 7.1 7.3 10.6 13.0 13.5 13.9 14.0France 4.4 5.8 5.8 5.3 5.1 21.7 25.0 24.7 24.3 23.8Germany 2.3 4.6 4.8 4.8 .. 29.8 32.4 33.1 33.9 ..Greece 4.0 5.3 4.5 3.0 2.6 11.5 15.4 13.5 9.4 8.5Hungary .. 1.9 2.1 1.7 1.7 .. 5.0 5.1 4.8 4.0
Icelandd7.5 9.8 9.1 8.8 9.7 39.7 38.6 35.2 33.7 32.6
Ireland 4.2 8.2 7.9 7.9 7.1 20.5 31.2 31.9 32.3 33.0Italy 3.9 4.9 5.3 5.7 5.4 18.2 22.4 23.2 23.4 23.7
Japanb, e9.5 12.9 13.4 11.8 13.7 33.4 39.0 39.7 39.4 41.0
Koreab3.1 5.1 5.9 5.2 5.3 6.5 9.2 10.5 9.9 10.5
Luxembourg 1.6 2.6 1.6 2.1 1.8 19.1 29.6 28.3 28.9 29.9Mexico .. 8.2 7.2 7.1 7.6 .. 28.3 26.9 25.6 25.8Netherlands 13.4 12.4 11.9 13.4 13.8 52.5 54.8 55.4 57.2 58.1New Zealand 7.9 10.7 11.4 11.2 11.2 34.6 38.0 37.7 36.4 36.5Norway 6.9 7.9 8.2 8.7 9.0 39.8 35.9 35.0 33.6 32.6
Polandb.. 8.0 9.6 8.8 7.4 .. 16.6 19.2 17.9 16.6
Portugal 3.1 5.1 5.0 4.8 5.1 11.8 15.8 14.6 14.7 14.3Slovak Republic .. 1.0 0.9 1.0 1.1 .. 3.2 2.9 3.0 2.8Spain 1.4 2.9 2.9 2.7 2.7 11.5 16.6 16.8 16.5 16.6Sweden 5.3 5.6 7.3 7.3 7.1 24.5 22.0 22.3 21.4 29.3
Switzerlandc,d6.8 7.2 7.7 8.4 8.9 42.6 45.8 46.5 44.7 44.7
Turkey 4.9 3.1 4.1 5.5 4.6 18.8 11.6 13.9 19.0 17.4United Kingdom 5.3 8.2 8.5 8.4 .. 39.5 41.2 40.6 40.8 ..
United Statesf8.3 8.2 8.1 7.9 8.1 20.0 19.1 19.0 18.2 18.2
European Uniong4.2 5.8 6 6.0 5.6 27.0 29.8 29.9 30.0 25.2
OECD Europeg4.4 5.4 5.8 6.0 5.4 26.8 26.4 26.9 27.4 22.6
Total OECDg 6.6 7.7 7.8 7.6 8.1 25.0 25.8 25.9 25.7 24.1
1990 1997 1998 1999 2000 1990 1997 1998 1999 2000Australiab, c
22.6 25.9 26.1 26.2 27.2 70.8 68.6 68.9 68.3 67.5Austria .. 11.5 12.3 12.2 12.4 .. 86.9 87.2 88.1 88.0Belgium 14.2 16.3 19.9 19.0 17.6 79.9 82.4 79.0 79.0 81.8Canada 17.0 18.9 18.5 18.1 18.1 70.1 69.7 69.7 69.3 69.1Czech Republic .. 3.3 3.4 3.3 3.2 .. 70.0 70.9 72.5 72.0Denmark 19.2 17.0 15.3 15.7 14.5 71.5 68.7 68.4 69.8 66.5
Finland 7.5 9.6 9.9 10.4 10.5 67.2 63.6 64.9 63.8 63.4France 12.2 14.8 14.7 14.2 13.8 79.8 79.3 79.0 80.1 80.4Germany 13.4 16.6 17.1 17.6 .. 89.7 84.1 84.1 84.5 ..Greece 6.7 9.0 7.8 5.4 4.8 61.1 63.1 64.4 65.5 66.8Hungary .. 3.4 3.5 3.2 2.8 .. 69.2 68.7 71.4 68.3
Icelandd22.2 23.2 21.2 20.4 20.4 81.6 77.4 77.1 77.0 74.5
Ireland 9.8 18.0 18.3 18.5 18.4 71.8 73.6 75.7 76.0 74.5Italy 8.8 11.2 11.8 12.2 12.2 70.8 71.9 71.5 70.5 72.6
Japanb, e19.2 23.6 24.1 23.1 24.9 70.5 67.5 67.0 69.7 67.5
Koreab4.5 6.8 7.8 7.1 7.5 58.7 54.8 55.2 57.2 58.4
Luxembourg 7.6 12.8 12.1 13.0 13.1 86.5 87.3 91.8 90.4 91.7Mexico .. 15.0 13.8 13.5 13.8 .. 63.5 65.4 65.1 63.8Netherlands 28.2 30.0 30.4 32.1 33.0 70.4 75.8 77.4 76.2 76.3New Zealand 19.6 23.0 23.4 22.6 22.7 77.1 74.3 73.3 72.9 73.2Norway 21.8 20.8 20.7 20.3 20.1 82.7 79.6 78.8 77.0 76.0
Polandb.. 11.8 13.9 12.8 11.6 .. 62.2 61.6 61.7 64.7
Portugal 6.8 9.9 9.3 9.2 9.2 74.0 71.3 70.8 71.7 69.9Slovak Republic .. 2.0 1.8 1.9 1.9 .. 71.9 73.2 71.2 68.9Spain 4.6 7.7 7.9 7.8 7.9 79.5 75.9 77.0 78.6 78.9Sweden 14.5 13.5 14.5 14.0 17.8 81.1 78.1 73.7 72.9 79.2
Switzerlandc,d22.1 24.2 24.8 24.4 24.8 82.4 83.4 82.6 80.6 80.1
Turkey 9.2 5.6 7.1 9.0 8.0 62.5 60.7 60.6 55.1 57.8United Kingdom 20.1 23.0 22.9 23.0 .. 85.1 80.4 79.6 79.9 ..
United Statesf13.8 13.4 13.3 12.8 13.0 68.2 68.0 68.4 68.0 67.5
European Uniong13.3 15.9 16.2 16.3 13.8 80.9 79.0 78.8 79.0 76.7
OECD Europeg13.2 14.1 14.6 14.9 12.4 79.6 77.2 76.8 76.5 74.0
Total OECDg 14.3 15.4 15.5 15.3 14.9 73.4 71.1 71.1 71.6 68.9
b) Data are based on actual hours worked. For Poland until 2000 only.
c) Part-time employment based on hours worked at all jobs. g) For above countries only.
Sources and definitions:
Men Women
f) Data are for wage and salary workers only.
For Austria, Belgium, Denmark, France, Germany, Greece, Ireland, Italy, Luxembourg, the Netherlands, Portugal, Spain and the United Kingdom, data are from the European Union Labour Force Survey.See OECD the "Definition of Part-time Work for the Purpose of International Comparisons", Labour Market and Social Policy Occasional Paper No. 22, available on Internet(http://www.oecd.org/els/employment/docs.htm).
Table E. Incidence and composition of part-time employmenta Percentages
Part-time employment as a proportion of employment
a) Part-time employment refers to persons who usually work less than 30 hours per week in their main job. Data include only persons declaring usual hours.
Part-time employment as a proportion of total employment Women’s share in part-time employment
d) Data 1990 refer to 1991. e) Less than 35 hours per week.
AnnStat.fm Page 319 Friday, June 7, 2002 9:50 AM
OECD EMPLOYMENT OUTLOOK – ISBN 92-64-19778-8 – © 2002
– Statistical annex320
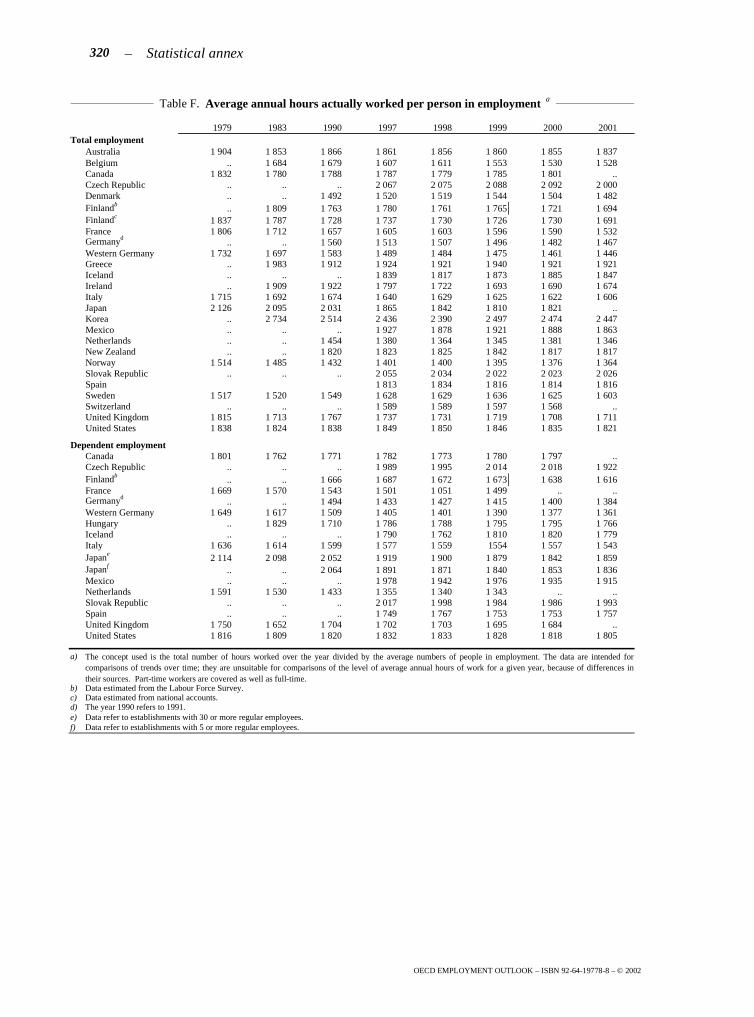
1979 1983 1990 1997 1998 1999 2000 2001Total employment
Australia 1 904 1 853 1 866 1 861 1 856 1 860 1 855 1 837Belgium .. 1 684 1 679 1 607 1 611 1 553 1 530 1 528Canada 1 832 1 780 1 788 1 787 1 779 1 785 1 801 ..Czech Republic .. .. .. 2 067 2 075 2 088 2 092 2 000Denmark .. .. 1 492 1 520 1 519 1 544 1 504 1 482Finlandb .. 1 809 1 763 1 780 1 761 1 765 1 721 1 694Finlandc
1 837 1 787 1 728 1 737 1 730 1 726 1 730 1 691France 1 806 1 712 1 657 1 605 1 603 1 596 1 590 1 532Germanyd
.. .. 1 560 1 513 1 507 1 496 1 482 1 467Western Germany 1 732 1 697 1 583 1 489 1 484 1 475 1 461 1 446Greece .. 1 983 1 912 1 924 1 921 1 940 1 921 1 921Iceland .. .. .. 1 839 1 817 1 873 1 885 1 847Ireland .. 1 909 1 922 1 797 1 722 1 693 1 690 1 674Italy 1 715 1 692 1 674 1 640 1 629 1 625 1 622 1 606Japan 2 126 2 095 2 031 1 865 1 842 1 810 1 821 ..Korea .. 2 734 2 514 2 436 2 390 2 497 2 474 2 447Mexico .. .. .. 1 927 1 878 1 921 1 888 1 863Netherlands .. .. 1 454 1 380 1 364 1 345 1 381 1 346New Zealand .. .. 1 820 1 823 1 825 1 842 1 817 1 817Norway 1 514 1 485 1 432 1 401 1 400 1 395 1 376 1 364Slovak Republic .. .. .. 2 055 2 034 2 022 2 023 2 026Spain 1 813 1 834 1 816 1 814 1 816Sweden 1 517 1 520 1 549 1 628 1 629 1 636 1 625 1 603Switzerland .. .. .. 1 589 1 589 1 597 1 568 ..United Kingdom 1 815 1 713 1 767 1 737 1 731 1 719 1 708 1 711United States 1 838 1 824 1 838 1 849 1 850 1 846 1 835 1 821
Dependent employmentCanada 1 801 1 762 1 771 1 782 1 773 1 780 1 797 ..Czech Republic .. .. .. 1 989 1 995 2 014 2 018 1 922Finlandb .. .. 1 666 1 687 1 672 1 673 1 638 1 616France 1 669 1 570 1 543 1 501 1 051 1 499 .. ..Germanyd
.. .. 1 494 1 433 1 427 1 415 1 400 1 384Western Germany 1 649 1 617 1 509 1 405 1 401 1 390 1 377 1 361Hungary .. 1 829 1 710 1 786 1 788 1 795 1 795 1 766Iceland .. .. .. 1 790 1 762 1 810 1 820 1 779Italy 1 636 1 614 1 599 1 577 1 559 1554 1 557 1 543Japane
2 114 2 098 2 052 1 919 1 900 1 879 1 842 1 859Japanf
.. .. 2 064 1 891 1 871 1 840 1 853 1 836Mexico .. .. .. 1 978 1 942 1 976 1 935 1 915Netherlands 1 591 1 530 1 433 1 355 1 340 1 343 .. ..Slovak Republic .. .. .. 2 017 1 998 1 984 1 986 1 993Spain .. .. .. 1 749 1 767 1 753 1 753 1 757United Kingdom 1 750 1 652 1 704 1 702 1 703 1 695 1 684 ..United States 1 816 1 809 1 820 1 832 1 833 1 828 1 818 1 805
a)
b) Data estimated from the Labour Force Survey.c) Data estimated from national accounts.d) The year 1990 refers to 1991.e) Data refer to establishments with 30 or more regular employees. f) Data refer to establishments with 5 or more regular employees.
Table F. Average annual hours actually worked per person in employment a
The concept used is the total number of hours worked over the year divided by the average numbers of people in employment. The data are intended forcomparisons of trends over time; they are unsuitable for comparisons of the level of average annual hours of work for a given year, because of differences intheir sources. Part-time workers are covered as well as full-time.
AnnStat.fm Page 320 Friday, June 7, 2002 9:50 AM
OECD EMPLOYMENT OUTLOOK – ISBN 92-64-19778-8 – © 2002
Statistical annex – 321
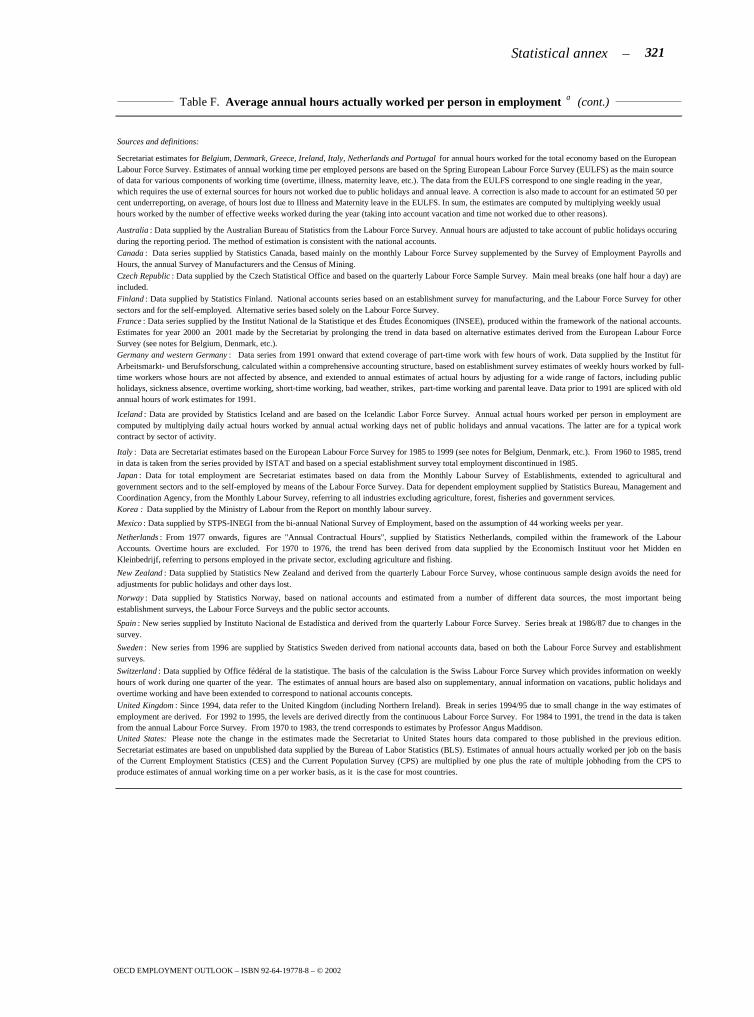
Sources and definitions:
Canada : Data series supplied by Statistics Canada, based mainly on the monthly Labour Force Survey supplemented by the Survey of Employment Payrolls andHours, the annual Survey of Manufacturers and the Census of Mining.
Secretariat estimates for Belgium, Denmark, Greece, Ireland, Italy, Netherlands and Portugal for annual hours worked for the total economy based on the European Labour Force Survey. Estimates of annual working time per employed persons are based on the Spring European Labour Force Survey (EULFS) as the main source of data for various components of working time (overtime, illness, maternity leave, etc.). The data from the EULFS correspond to one single reading in the year, which requires the use of external sources for hours not worked due to public holidays and annual leave. A correction is also made to account for an estimated 50 per cent underreporting, on average, of hours lost due to Illness and Maternity leave in the EULFS. In sum, the estimates are computed by multiplying weekly usual hours worked by the number of effective weeks worked during the year (taking into account vacation and time not worked due to other reasons).
Australia : Data supplied by the Australian Bureau of Statistics from the Labour Force Survey. Annual hours are adjusted to take account of public holidays occuring during the reporting period. The method of estimation is consistent with the national accounts.
Table F. Average annual hours actually worked per person in employment a (cont.)
Czech Republic : Data supplied by the Czech Statistical Office and based on the quarterly Labour Force Sample Survey. Main meal breaks (one half hour a day) areincluded.Finland : Data supplied by Statistics Finland. National accounts series based on an establishment survey for manufacturing, and the Labour Force Survey for othersectors and for the self-employed. Alternative series based solely on the Labour Force Survey.France : Data series supplied by the Institut National de la Statistique et des Études Économiques (INSEE), produced within the framework of the national accounts.Estimates for year 2000 an 2001 made by the Secretariat by prolonging the trend in data based on alternative estimates derived from the European Labour ForceSurvey (see notes for Belgium, Denmark, etc.).Germany and western Germany : Data series from 1991 onward that extend coverage of part-time work with few hours of work. Data supplied by the Institut fürArbeitsmarkt- und Berufsforschung, calculated within a comprehensive accounting structure, based on establishment survey estimates of weekly hours worked by full-time workers whose hours are not affected by absence, and extended to annual estimates of actual hours by adjusting for a wide range of factors, including publicholidays, sickness absence, overtime working, short-time working, bad weather, strikes, part-time working and parental leave. Data prior to 1991 are spliced with oldannual hours of work estimates for 1991.
Norway : Data supplied by Statistics Norway, based on national accounts and estimated from a number of different data sources, the most important beingestablishment surveys, the Labour Force Surveys and the public sector accounts.
Iceland : Data are provided by Statistics Iceland and are based on the Icelandic Labor Force Survey. Annual actual hours worked per person in employment arecomputed by multiplying daily actual hours worked by annual actual working days net of public holidays and annual vacations. The latter are for a typical workcontract by sector of activity.
Italy : Data are Secretariat estimates based on the European Labour Force Survey for 1985 to 1999 (see notes for Belgium, Denmark, etc.). From 1960 to 1985, trendin data is taken from the series provided by ISTAT and based on a special establishment survey total employment discontinued in 1985.
Japan : Data for total employment are Secretariat estimates based on data from the Monthly Labour Survey of Establishments, extended to agricultural andgovernment sectors and to the self-employed by means of the Labour Force Survey. Data for dependent employment supplied by Statistics Bureau, Management andCoordination Agency, from the Monthly Labour Survey, referring to all industries excluding agriculture, forest, fisheries and government services.Korea : Data supplied by the Ministry of Labour from the Report on monthly labour survey.
Mexico : Data supplied by STPS-INEGI from the bi-annual National Survey of Employment, based on the assumption of 44 working weeks per year.
Netherlands : From 1977 onwards, figures are "Annual Contractual Hours", supplied by Statistics Netherlands, compiled within the framework of the LabourAccounts. Overtime hours are excluded. For 1970 to 1976, the trend has been derived from data supplied by the Economisch Instituut voor het Midden enKleinbedrijf, referring to persons employed in the private sector, excluding agriculture and fishing.
New Zealand : Data supplied by Statistics New Zealand and derived from the quarterly Labour Force Survey, whose continuous sample design avoids the need foradjustments for public holidays and other days lost.
United States: Please note the change in the estimates made the Secretariat to United States hours data compared to those published in the previous edition.Secretariat estimates are based on unpublished data supplied by the Bureau of Labor Statistics (BLS). Estimates of annual hours actually worked per job on the basisof the Current Employment Statistics (CES) and the Current Population Survey (CPS) are multiplied by one plus the rate of multiple jobhoding from the CPS toproduce estimates of annual working time on a per worker basis, as it is the case for most countries.
Spain : New series supplied by Instituto Nacional de Estadística and derived from the quarterly Labour Force Survey. Series break at 1986/87 due to changes in thesurvey.
Sweden : New series from 1996 are supplied by Statistics Sweden derived from national accounts data, based on both the Labour Force Survey and establishmentsurveys.
Switzerland : Data supplied by Office fédéral de la statistique. The basis of the calculation is the Swiss Labour Force Survey which provides information on weeklyhours of work during one quarter of the year. The estimates of annual hours are based also on supplementary, annual information on vacations, public holidays andovertime working and have been extended to correspond to national accounts concepts.
United Kingdom : Since 1994, data refer to the United Kingdom (including Northern Ireland). Break in series 1994/95 due to small change in the way estimates ofemployment are derived. For 1992 to 1995, the levels are derived directly from the continuous Labour Force Survey. For 1984 to 1991, the trend in the data is takenfrom the annual Labour Force Survey. From 1970 to 1983, the trend corresponds to estimates by Professor Angus Maddison.
AnnStat.fm Page 321 Friday, June 7, 2002 9:50 AM
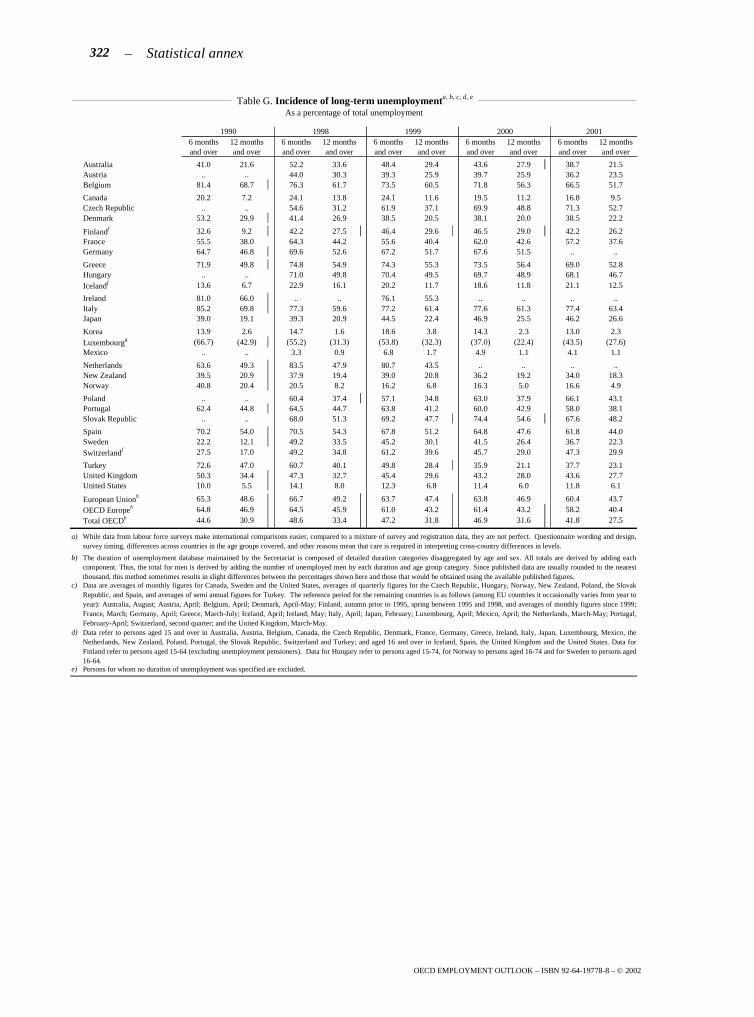
OECD EMPLOYMENT OUTLOOK – ISBN 92-64-19778-8 – © 2002
– Statistical annex322
1990 1998 1999 2000 20016 months 12 months 6 months 12 months 6 months 12 months 6 months 12 months 6 months 12 monthsand over and over and over and over and over and over and over and over and over and over
Australia 41.0 21.6 52.2 33.6 48.4 29.4 43.6 27.9 38.7 21.5Austria .. .. 44.0 30.3 39.3 25.9 39.7 25.9 36.2 23.5Belgium 81.4 68.7 76.3 61.7 73.5 60.5 71.8 56.3 66.5 51.7
Canada 20.2 7.2 24.1 13.8 24.1 11.6 19.5 11.2 16.8 9.5Czech Republic .. .. 54.6 31.2 61.9 37.1 69.9 48.8 71.3 52.7Denmark 53.2 29.9 41.4 26.9 38.5 20.5 38.1 20.0 38.5 22.2
Finlandf 32.6 9.2 42.2 27.5 46.4 29.6 46.5 29.0 42.2 26.2France 55.5 38.0 64.3 44.2 55.6 40.4 62.0 42.6 57.2 37.6Germany 64.7 46.8 69.6 52.6 67.2 51.7 67.6 51.5 .. ..
Greece 71.9 49.8 74.8 54.9 74.3 55.3 73.5 56.4 69.0 52.8Hungary .. .. 71.0 49.8 70.4 49.5 69.7 48.9 68.1 46.7Icelandf 13.6 6.7 22.9 16.1 20.2 11.7 18.6 11.8 21.1 12.5
Ireland 81.0 66.0 .. .. 76.1 55.3 .. .. .. ..Italy 85.2 69.8 77.3 59.6 77.2 61.4 77.6 61.3 77.4 63.4Japan 39.0 19.1 39.3 20.9 44.5 22.4 46.9 25.5 46.2 26.6
Korea 13.9 2.6 14.7 1.6 18.6 3.8 14.3 2.3 13.0 2.3Luxembourgg (66.7) (42.9) (55.2) (31.3) (53.8) (32.3) (37.0) (22.4) (43.5) (27.6)Mexico .. .. 3.3 0.9 6.8 1.7 4.9 1.1 4.1 1.1
Netherlands 63.6 49.3 83.5 47.9 80.7 43.5 .. .. .. ..New Zealand 39.5 20.9 37.9 19.4 39.0 20.8 36.2 19.2 34.0 18.3Norway 40.8 20.4 20.5 8.2 16.2 6.8 16.3 5.0 16.6 4.9
Poland .. .. 60.4 37.4 57.1 34.8 63.0 37.9 66.1 43.1Portugal 62.4 44.8 64.5 44.7 63.8 41.2 60.0 42.9 58.0 38.1Slovak Republic .. .. 68.0 51.3 69.2 47.7 74.4 54.6 67.6 48.2
Spain 70.2 54.0 70.5 54.3 67.8 51.2 64.8 47.6 61.8 44.0Sweden 22.2 12.1 49.2 33.5 45.2 30.1 41.5 26.4 36.7 22.3Switzerlandf 27.5 17.0 49.2 34.8 61.2 39.6 45.7 29.0 47.3 29.9
Turkey 72.6 47.0 60.7 40.1 49.8 28.4 35.9 21.1 37.7 23.1United Kingdom 50.3 34.4 47.3 32.7 45.4 29.6 43.2 28.0 43.6 27.7United States 10.0 5.5 14.1 8.0 12.3 6.8 11.4 6.0 11.8 6.1
European Unionh 65.3 48.6 66.7 49.2 63.7 47.4 63.8 46.9 60.4 43.7
OECD Europeh 64.8 46.9 64.5 45.9 61.0 43.2 61.4 43.2 58.2 40.4
Total OECDh 44.6 30.9 48.6 33.4 47.2 31.8 46.9 31.6 41.8 27.5
a)
b)
c)
d)
e) Persons for whom no duration of unemployment was specified are excluded.
Table G. Incidence of long-term unemploymenta, b, c, d, e As a percentage of total unemployment
Data refer to persons aged 15 and over in Australia, Austria, Belgium, Canada, the Czech Republic, Denmark, France, Germany, Greece, Ireland, Italy, Japan, Luxembourg, Mexico, theNetherlands, New Zealand, Poland, Portugal, the Slovak Republic, Switzerland and Turkey; and aged 16 and over in Iceland, Spain, the United Kingdom and the United States. Data forFinland refer to persons aged 15-64 (excluding unemployment pensioners). Data for Hungary refer to persons aged 15-74, for Norway to persons aged 16-74 and for Sweden to persons aged16-64.
Data are averages of monthly figures for Canada, Sweden and the United States, averages of quarterly figures for the Czech Republic, Hungary, Norway, New Zealand, Poland, the SlovakRepublic, and Spain, and averages of semi annual figures for Turkey. The reference period for the remaining countries is as follows (among EU countries it occasionally varies from year toyear): Australia, August; Austria, April; Belgium, April; Denmark, April-May; Finland, autumn prior to 1995, spring between 1995 and 1998, and averages of monthly figures since 1999;France, March; Germany, April; Greece, March-July; Iceland, April; Ireland, May; Italy, April; Japan, February; Luxembourg, April; Mexico, April; the Netherlands, March-May; Portugal,February-April; Switzerland, second quarter; and the United Kingdom, March-May.
While data from labour force surveys make international comparisons easier, compared to a mixture of survey and registration data, they are not perfect. Questionnaire wording and design,survey timing, differences across countries in the age groups covered, and other reasons mean that care is required in interpreting cross-country differences in levels.
The duration of unemployment database maintained by the Secretariat is composed of detailed duration categories disaggregated by age and sex. All totals are derived by adding eachcomponent. Thus, the total for men is derived by adding the number of unemployed men by each duration and age group category. Since published data are usually rounded to the nearestthousand, this method sometimes results in slight differences between the percentages shown here and those that would be obtained using the available published figures.
AnnStat.fm Page 322 Friday, June 7, 2002 9:50 AM
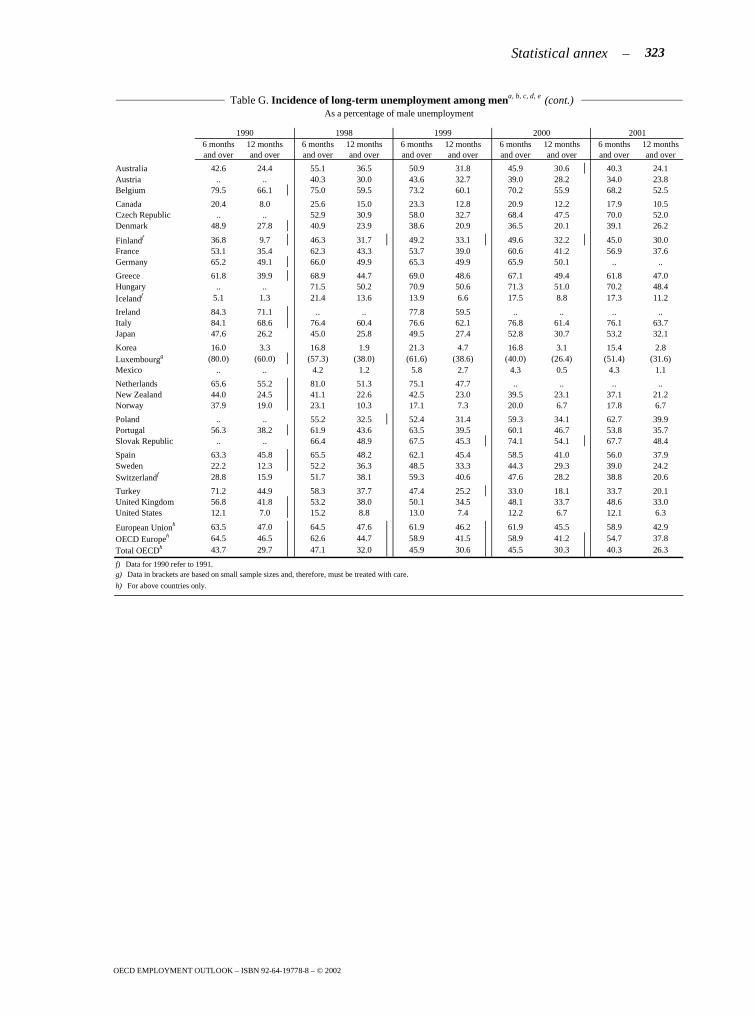
OECD EMPLOYMENT OUTLOOK – ISBN 92-64-19778-8 – © 2002
Statistical annex – 323
1990 1998 1999 2000 20016 months 12 months 6 months 12 months 6 months 12 months 6 months 12 months 6 months 12 monthsand over and over and over and over and over and over and over and over and over and over
Australia 42.6 24.4 55.1 36.5 50.9 31.8 45.9 30.6 40.3 24.1Austria .. .. 40.3 30.0 43.6 32.7 39.0 28.2 34.0 23.8Belgium 79.5 66.1 75.0 59.5 73.2 60.1 70.2 55.9 68.2 52.5
Canada 20.4 8.0 25.6 15.0 23.3 12.8 20.9 12.2 17.9 10.5Czech Republic .. .. 52.9 30.9 58.0 32.7 68.4 47.5 70.0 52.0Denmark 48.9 27.8 40.9 23.9 38.6 20.9 36.5 20.1 39.1 26.2
Finlandf 36.8 9.7 46.3 31.7 49.2 33.1 49.6 32.2 45.0 30.0France 53.1 35.4 62.3 43.3 53.7 39.0 60.6 41.2 56.9 37.6Germany 65.2 49.1 66.0 49.9 65.3 49.9 65.9 50.1 .. ..
Greece 61.8 39.9 68.9 44.7 69.0 48.6 67.1 49.4 61.8 47.0Hungary .. .. 71.5 50.2 70.9 50.6 71.3 51.0 70.2 48.4Icelandf 5.1 1.3 21.4 13.6 13.9 6.6 17.5 8.8 17.3 11.2
Ireland 84.3 71.1 .. .. 77.8 59.5 .. .. .. ..Italy 84.1 68.6 76.4 60.4 76.6 62.1 76.8 61.4 76.1 63.7Japan 47.6 26.2 45.0 25.8 49.5 27.4 52.8 30.7 53.2 32.1
Korea 16.0 3.3 16.8 1.9 21.3 4.7 16.8 3.1 15.4 2.8Luxembourgg (80.0) (60.0) (57.3) (38.0) (61.6) (38.6) (40.0) (26.4) (51.4) (31.6)Mexico .. .. 4.2 1.2 5.8 2.7 4.3 0.5 4.3 1.1
Netherlands 65.6 55.2 81.0 51.3 75.1 47.7 .. .. .. ..New Zealand 44.0 24.5 41.1 22.6 42.5 23.0 39.5 23.1 37.1 21.2Norway 37.9 19.0 23.1 10.3 17.1 7.3 20.0 6.7 17.8 6.7
Poland .. .. 55.2 32.5 52.4 31.4 59.3 34.1 62.7 39.9Portugal 56.3 38.2 61.9 43.6 63.5 39.5 60.1 46.7 53.8 35.7Slovak Republic .. .. 66.4 48.9 67.5 45.3 74.1 54.1 67.7 48.4
Spain 63.3 45.8 65.5 48.2 62.1 45.4 58.5 41.0 56.0 37.9Sweden 22.2 12.3 52.2 36.3 48.5 33.3 44.3 29.3 39.0 24.2Switzerlandf 28.8 15.9 51.7 38.1 59.3 40.6 47.6 28.2 38.8 20.6
Turkey 71.2 44.9 58.3 37.7 47.4 25.2 33.0 18.1 33.7 20.1United Kingdom 56.8 41.8 53.2 38.0 50.1 34.5 48.1 33.7 48.6 33.0United States 12.1 7.0 15.2 8.8 13.0 7.4 12.2 6.7 12.1 6.3
European Unionh 63.5 47.0 64.5 47.6 61.9 46.2 61.9 45.5 58.9 42.9
OECD Europeh 64.5 46.5 62.6 44.7 58.9 41.5 58.9 41.2 54.7 37.8
Total OECDh 43.7 29.7 47.1 32.0 45.9 30.6 45.5 30.3 40.3 26.3
f) Data for 1990 refer to 1991.g) Data in brackets are based on small sample sizes and, therefore, must be treated with care.
h) For above countries only.
Table G. Incidence of long-term unemployment among mena, b, c, d, e (cont.) As a percentage of male unemployment
AnnStat.fm Page 323 Friday, June 7, 2002 9:50 AM

OECD EMPLOYMENT OUTLOOK – ISBN 92-64-19778-8 – © 2002
– Statistical annex324
1990 1998 1999 2000 20016 months 12 months 6 months 12 months 6 months 12 months 6 months 12 months 6 months 12 monthsand over and over and over and over and over and over and over and over and over and over
Australia 38.8 17.8 48.0 29.3 44.9 25.8 40.2 24.0 36.4 17.9Austria .. .. 48.6 30.7 39.8 24.1 40.6 22.8 38.9 23.2Belgium 82.5 70.0 77.5 63.5 73.8 60.9 73.1 56.7 64.5 50.8
Canada 19.8 6.1 22.2 12.2 18.9 10.2 17.8 10.0 15.3 8.2Czech Republic .. .. 55.9 31.5 65.3 40.9 71.2 49.8 72.5 53.4Denmark 57.7 32.0 41.6 29.0 38.5 20.1 39.6 20.0 38.0 18.8
Finlandf 26.3 8.4 37.8 23.1 43.7 26.2 43.7 26.2 39.6 22.6France 57.3 40.0 66.0 45.0 57.4 41.7 63.2 43.7 57.5 37.6Germany 64.2 44.5 73.7 55.6 69.4 54.0 69.5 53.1 .. ..
Greece 78.2 55.9 78.6 61.5 77.7 59.5 77.7 61.0 73.7 56.6Hungary .. .. 70.1 49.2 69.7 47.9 67.3 45.7 64.8 44.1Icelandf 21.1 11.5 24.1 18.1 24.5 15.2 19.4 14.0 24.8 13.8
Ireland 75.0 56.8 .. .. 72.9 47.5 .. .. .. ..Italy 86.0 70.7 78.1 58.8 77.7 60.7 78.3 61.2 78.5 63.1Japan 26.3 8.8 30.5 13.7 36.9 14.8 37.4 17.1 35.7 18.3
Korea 8.9 0.9 10.3 0.8 13.1 1.9 9.2 0.7 8.1 1.2Luxembourgg (55.6) (33.3) (53.6) (26.3) (47.5) (27.2) (34.3) (18.8) (34.9) (23.1)Mexico .. .. 2.2 0.4 8.0 0.4 6.0 2.0 3.9 1.0
Netherlands 62.0 44.6 85.5 45.2 84.9 40.4 .. .. .. ..New Zealand 32.6 15.5 33.7 15.2 34.3 17.9 32.0 14.3 30.1 14.6Norway 45.0 22.5 17.1 5.7 15.6 6.3 11.4 2.9 10.8 2.7
Poland .. .. 65.1 41.8 61.9 38.3 66.6 41.3 69.5 39.9Portugal 66.4 49.4 66.6 45.6 64.2 42.9 60.0 40.0 61.0 39.9Slovak Republic .. .. 69.9 54.0 71.3 50.5 74.8 55.1 67.4 47.8
Spain 76.5 61.5 74.5 59.2 72.0 55.5 69.3 52.2 66.1 48.6Sweden 22.2 11.8 45.6 30.1 41.2 26.1 37.9 22.8 33.8 20.0Switzerlandf 26.6 17.8 46.8 31.7 63.1 38.7 44.0 29.7 52.3 35.5
Turkey 75.6 51.2 66.9 46.4 56.0 36.4 44.1 29.5 50.1 32.5United Kingdom 40.8 23.7 37.7 24.0 37.6 21.5 35.6 19.0 35.8 19.5United States 7.3 3.7 12.8 7.1 11.6 6.2 10.5 5.3 11.5 5.7
European Unionh 66.9 50.1 68.9 50.8 65.5 48.8 65.6 48.2 61.8 44.5
OECD Europeh 65.2 47.3 66.6 47.2 63.4 45.2 64.2 45.3 62.2 43.4
Total OECDh 45.7 32.2 50.2 35.0 48.6 33.2 48.6 33.1 43.6 29.0
Sources:Data for Belgium, Denmark, Germany, Greece, Ireland, Italy, Luxembourg, the Netherlands, Portugal and the United Kingdom are based on the European Union Labour Force Survey and were supplied by Eurostat.Austria: Data from the Labour Force Survey supplied by Statistics Austria.Australia: Data from the Labour Force Suvrvey supplied by the Australian Bureau of Statistics (ABS).Canada: Data from the Labour Force Survey supplied by Statistics Canada. Czech Republic: Data from the Labour Force Sample Survey supplied by the Czech Statistical Office.
Labour Force Survey since 1999 supplied by the Central Statistical Office Labour Force Survey since 1999 (CSO). France: Data from the Enquête Emploi supplied by the Institut National de la Statistique et des Études Économiques (INSEE). Hungary: Data from the Labour Force Survey supplied by the Central Statistical Office (CSO).Iceland: Data from the Labour Force Survey supplied by Statistics Iceland.Japan: Data from the Special Survey of the Labour Force Survey supplied by the Statistics Bureau, Management and Coordination Agency (MCA). Korea: Data from the Labour Force Survey supplied by the National Statistical Office (NSO).Mexico: Data from the biennial Encuesta Nacional de Empleo (ENE) supplied by the Secretaría del Trabajo y Previsión Social (STPS).New Zealand: Data from the Household Labour Force Survey supplied by the Department of Statistics. Norway: Data from the Labour Force Survey supplied by the Central Statistical Office (CSO). Poland: Data from the Labour Force Survey supplied by the Central Statistical Office (CSO).Slovak Republic: Data from the Labour Force Survey supplied by the Statistical Office of the Slovak Repulic (SOS).Spain: Data from the Labour Force Survey supplied by Instituto Nacional de Estadística (INE). Sweden: Data from the Labour Force Survey supplied by Statistics Sweden. Switzerland: Data from the Labour Force Survey supplied by the Swiss Federal Statistical Office (OFS).Turkey: Data from the Household Labour Force Survey supplied by the State Institute of Statistics (SIS).
United States: Data from the Current Population Census (CPS) supplied by the Bureau of Labor Statistics (BLS).
Table G. Incidence of long-term unemployment among womena, b, c, d, e (cont.) As a percentage of female unemployment
Finland: Data from the Supplementary Labour Force Survey (biennial from 1989 until 1995, and annual from 1995 to 1998) and from the
AnnStat.fm Page 324 Friday, June 7, 2002 9:50 AM
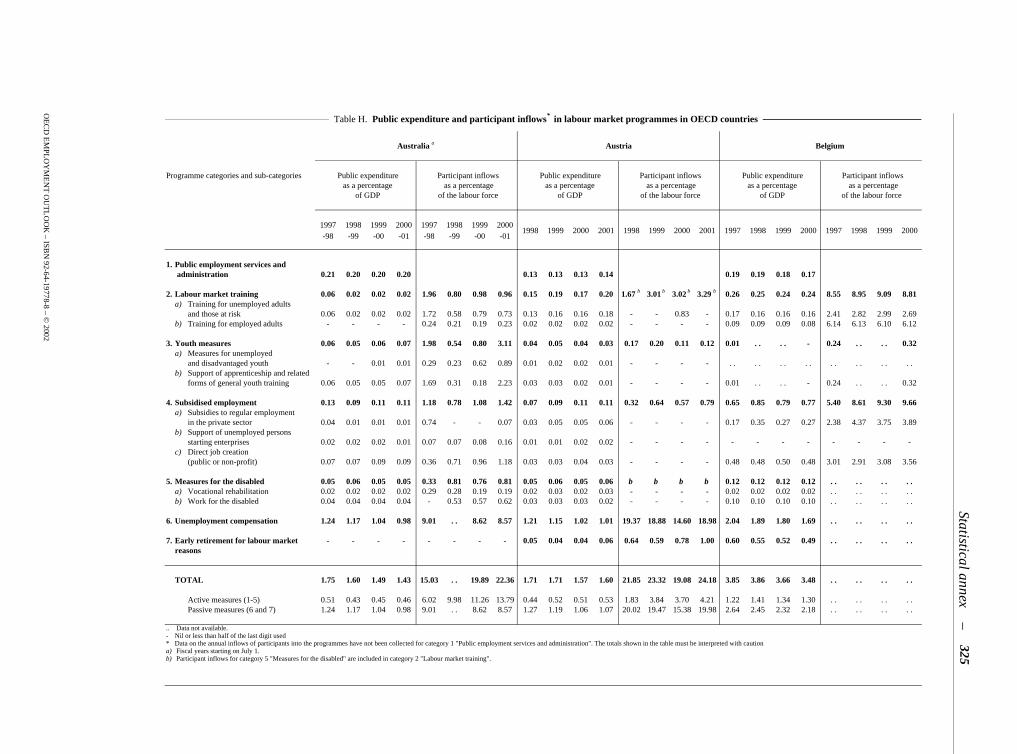
OE
CD
EM
PL
OY
ME
NT
OU
TL
OO
K – IS
BN
92-64-19778-8 – © 2002
Statistical annex–
325
Australia a Austria Belgium
Programme categories and sub-categories Public expenditure Participant inflows Public expenditure Participant inflows Public expenditure Participant inflows as a percentage as a percentage as a percentage as a percentage as a percentage as a percentage
of GDP of the labour force of GDP of the labour force of GDP of the labour force
1997-98
1998-99
1999-00
2000-01
1997-98
1998-99
1999-00
2000-01
1998 1999 2000 2001 1998 1999 2000 2001 1997 1998 1999 2000 1997 1998 1999 2000
1. Public employment services and administration 0.21 0.20 0.20 0.20 0.13 0.13 0.13 0.14 0.19 0.19 0.18 0.17
2. Labour market training 0.06 0.02 0.02 0.02 1.96 0.80 0.98 0.96 0.15 0.19 0.17 0.20 1.67 b 3.01 b 3.02 b 3.29 b 0.26 0.25 0.24 0.24 8.55 8.95 9.09 8.81a) Training for unemployed adults
and those at risk 0.06 0.02 0.02 0.02 1.72 0.58 0.79 0.73 0.13 0.16 0.16 0.18 - - 0.83 - 0.17 0.16 0.16 0.16 2.41 2.82 2.99 2.69b) Training for employed adults - - - - 0.24 0.21 0.19 0.23 0.02 0.02 0.02 0.02 - - - - 0.09 0.09 0.09 0.08 6.14 6.13 6.10 6.12
3. Youth measures 0.06 0.05 0.06 0.07 1.98 0.54 0.80 3.11 0.04 0.05 0.04 0.03 0.17 0.20 0.11 0.12 0.01 . . . . - 0.24 . . . . 0.32a) Measures for unemployed
and disadvantaged youth - - 0.01 0.01 0.29 0.23 0.62 0.89 0.01 0.02 0.02 0.01 - - - - . . . . . . . . . . . . . . . .b) Support of apprenticeship and related
forms of general youth training 0.06 0.05 0.05 0.07 1.69 0.31 0.18 2.23 0.03 0.03 0.02 0.01 - - - - 0.01 . . . . - 0.24 . . . . 0.32
4. Subsidised employment 0.13 0.09 0.11 0.11 1.18 0.78 1.08 1.42 0.07 0.09 0.11 0.11 0.32 0.64 0.57 0.79 0.65 0.85 0.79 0.77 5.40 8.61 9.30 9.66a) Subsidies to regular employment
in the private sector 0.04 0.01 0.01 0.01 0.74 - - 0.07 0.03 0.05 0.05 0.06 - - - - 0.17 0.35 0.27 0.27 2.38 4.37 3.75 3.89b) Support of unemployed persons
starting enterprises 0.02 0.02 0.02 0.01 0.07 0.07 0.08 0.16 0.01 0.01 0.02 0.02 - - - - - - - - - - - -c) Direct job creation
(public or non-profit) 0.07 0.07 0.09 0.09 0.36 0.71 0.96 1.18 0.03 0.03 0.04 0.03 - - - - 0.48 0.48 0.50 0.48 3.01 2.91 3.08 3.56
5. Measures for the disabled 0.05 0.06 0.05 0.05 0.33 0.81 0.76 0.81 0.05 0.06 0.05 0.06 b b b b 0.12 0.12 0.12 0.12 . . . . . . . .a) Vocational rehabilitation 0.02 0.02 0.02 0.02 0.29 0.28 0.19 0.19 0.02 0.03 0.02 0.03 - - - - 0.02 0.02 0.02 0.02 . . . . . . . .b) Work for the disabled 0.04 0.04 0.04 0.04 - 0.53 0.57 0.62 0.03 0.03 0.03 0.02 - - - - 0.10 0.10 0.10 0.10 . . . . . . . .
6. Unemployment compensation 1.24 1.17 1.04 0.98 9.01 . . 8.62 8.57 1.21 1.15 1.02 1.01 19.37 18.88 14.60 18.98 2.04 1.89 1.80 1.69 . . . . . . . .
7. Early retirement for labour market - - - - - - - - 0.05 0.04 0.04 0.06 0.64 0.59 0.78 1.00 0.60 0.55 0.52 0.49 . . . . . . . .reasons
TOTAL 1.75 1.60 1.49 1.43 15.03 . . 19.89 22.36 1.71 1.71 1.57 1.60 21.85 23.32 19.08 24.18 3.85 3.86 3.66 3.48 . . . . . . . .
Active measures (1-5) 0.51 0.43 0.45 0.46 6.02 9.98 11.26 13.79 0.44 0.52 0.51 0.53 1.83 3.84 3.70 4.21 1.22 1.41 1.34 1.30 . . . . . . . .Passive measures (6 and 7) 1.24 1.17 1.04 0.98 9.01 . . 8.62 8.57 1.27 1.19 1.06 1.07 20.02 19.47 15.38 19.98 2.64 2.45 2.32 2.18 . . . . . . . .
.. Data not available.- Nil or less than half of the last digit used* Data on the annual inflows of participants into the programmes have not been collected for category 1 "Public employment services and administration". The totals shown in the table must be interpreted with cautiona) Fiscal years starting on July 1.b) Participant inflows for category 5 "Measures for the disabled" are included in category 2 "Labour market training".
Table H. Public expenditure and participant inflows* in labour market programmes in OECD countries
AnnStat.fm
Page 325 Friday, June 7, 2002 9:50 A
M
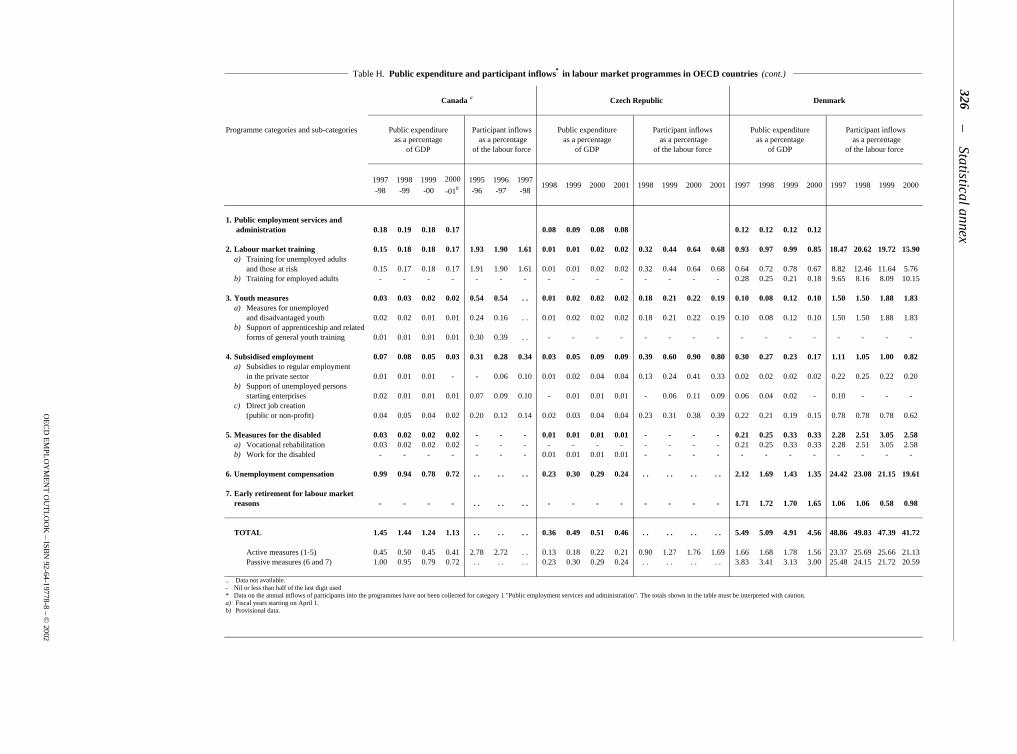
OE
CD
EM
PL
OY
ME
NT
OU
TL
OO
K – IS
BN
92-64-19778-8 – © 2002
–Statistical annex
326 Canada a Czech Republic Denmark
Programme categories and sub-categories Public expenditure Participant inflows Public expenditure Participant inflows Public expenditure Participant inflows as a percentage as a percentage as a percentage as a percentage as a percentage as a percentage
of GDP of the labour force of GDP of the labour force of GDP of the labour force
1997-98
1998-99
1999-00
2000
-01b
1995-96
1996-97
1997-98
1998 1999 2000 2001 1998 1999 2000 2001 1997 1998 1999 2000 1997 1998 1999 2000
1. Public employment services and administration 0.18 0.19 0.18 0.17 0.08 0.09 0.08 0.08 0.12 0.12 0.12 0.12
2. Labour market training 0.15 0.18 0.18 0.17 1.93 1.90 1.61 0.01 0.01 0.02 0.02 0.32 0.44 0.64 0.68 0.93 0.97 0.99 0.85 18.47 20.62 19.72 15.90a) Training for unemployed adults
and those at risk 0.15 0.17 0.18 0.17 1.91 1.90 1.61 0.01 0.01 0.02 0.02 0.32 0.44 0.64 0.68 0.64 0.72 0.78 0.67 8.82 12.46 11.64 5.76b) Training for employed adults - - - - - - - - - - - - - - - 0.28 0.25 0.21 0.18 9.65 8.16 8.09 10.15
3. Youth measures 0.03 0.03 0.02 0.02 0.54 0.54 . . 0.01 0.02 0.02 0.02 0.18 0.21 0.22 0.19 0.10 0.08 0.12 0.10 1.50 1.50 1.88 1.83a) Measures for unemployed
and disadvantaged youth 0.02 0.02 0.01 0.01 0.24 0.16 . . 0.01 0.02 0.02 0.02 0.18 0.21 0.22 0.19 0.10 0.08 0.12 0.10 1.50 1.50 1.88 1.83b) Support of apprenticeship and related
forms of general youth training 0.01 0.01 0.01 0.01 0.30 0.39 . . - - - - - - - - - - - - - - - -
4. Subsidised employment 0.07 0.08 0.05 0.03 0.31 0.28 0.34 0.03 0.05 0.09 0.09 0.39 0.60 0.90 0.80 0.30 0.27 0.23 0.17 1.11 1.05 1.00 0.82a) Subsidies to regular employment
in the private sector 0.01 0.01 0.01 - - 0.06 0.10 0.01 0.02 0.04 0.04 0.13 0.24 0.41 0.33 0.02 0.02 0.02 0.02 0.22 0.25 0.22 0.20b) Support of unemployed persons
starting enterprises 0.02 0.01 0.01 0.01 0.07 0.09 0.10 - 0.01 0.01 0.01 - 0.06 0.11 0.09 0.06 0.04 0.02 - 0.10 - - -c) Direct job creation
(public or non-profit) 0.04 0.05 0.04 0.02 0.20 0.12 0.14 0.02 0.03 0.04 0.04 0.23 0.31 0.38 0.39 0.22 0.21 0.19 0.15 0.78 0.78 0.78 0.62
5. Measures for the disabled 0.03 0.02 0.02 0.02 - - - 0.01 0.01 0.01 0.01 - - - - 0.21 0.25 0.33 0.33 2.28 2.51 3.05 2.58a) Vocational rehabilitation 0.03 0.02 0.02 0.02 - - - - - - - - - - - 0.21 0.25 0.33 0.33 2.28 2.51 3.05 2.58b) Work for the disabled - - - - - - - 0.01 0.01 0.01 0.01 - - - - - - - - - - - -
6. Unemployment compensation 0.99 0.94 0.78 0.72 . . . . . . 0.23 0.30 0.29 0.24 . . . . . . . . 2.12 1.69 1.43 1.35 24.42 23.08 21.15 19.61
7. Early retirement for labour marketreasons - - - - . . . . . . - - - - - - - - 1.71 1.72 1.70 1.65 1.06 1.06 0.58 0.98
TOTAL 1.45 1.44 1.24 1.13 . . . . . . 0.36 0.49 0.51 0.46 . . . . . . . . 5.49 5.09 4.91 4.56 48.86 49.83 47.39 41.72
Active measures (1-5) 0.45 0.50 0.45 0.41 2.78 2.72 . . 0.13 0.18 0.22 0.21 0.90 1.27 1.76 1.69 1.66 1.68 1.78 1.56 23.37 25.69 25.66 21.13Passive measures (6 and 7) 1.00 0.95 0.79 0.72 . . . . . . 0.23 0.30 0.29 0.24 . . . . . . . . 3.83 3.41 3.13 3.00 25.48 24.15 21.72 20.59
.. Data not available.- Nil or less than half of the last digit used* Data on the annual inflows of participants into the programmes have not been collected for category 1 "Public employment services and administration". The totals shown in the table must be interpreted with caution.a) Fiscal years starting on April 1.b) Provisional data.
Table H. Public expenditure and participant inflows* in labour market programmes in OECD countries (cont.)
AnnStat.fm
Page 326 Friday, June 7, 2002 9:50 A
M

OE
CD
EM
PL
OY
ME
NT
OU
TL
OO
K – IS
BN
92-64-19778-8 – © 2002
Statistical annex–
327
Finland France Germany
Programme categories and sub-categories Public expenditure Participant inflows Public expenditure Participant inflows Public expenditure Participant inflows as a percentage as a percentage as a percentage as a percentage as a percentage as a percentage
of GDP of the labour force of GDP of the labour force of GDP of the labour force
1998 1999 2000 2001 a 1998 1999 2000 2001 a 1997 1998 1999 2000 1997 1998 1999 2000 1998 1999 2000 2001 1998 1999 2000 2001
1. Public employment services and administration 0.13 0.14 0.11 0.12 0.16 0.16 0.17 0.18 0.23 0.23 0.23 0.23
2. Labour market training 0.44 0.40 0.30 0.29 4.35 4.22 3.40 2.76 0.34 0.31 0.28 0.25 2.73 2.87 2.65 2.41 0.34 0.35 0.34 0.34 1.51 1.32 1.49 1.22a) Training for unemployed adults
and those at risk 0.42 0.36 0.27 0.26 2.40 2.33 2.55 2.58 0.31 0.28 0.25 0.22 2.26 2.26 2.12 1.86 0.34 0.35 0.34 0.34 1.51 1.32 1.49 1.22b) Training for employed adults 0.02 0.04 0.03 0.03 1.95 1.89 0.85 0.18 0.03 0.04 0.03 0.03 0.48 0.61 0.53 0.55 - - - . . - - - . .
3. Youth measures 0.21 0.20 0.18 0.16 2.85 2.49 2.07 1.52 0.26 0.33 0.40 0.42 2.56 2.97 2.96 2.82 0.07 0.08 0.08 0.09 0.88 1.01 1.02 . .a) Measures for unemployed
and disadvantaged youth 0.08 0.07 0.06 0.06 1.50 1.25 1.05 0.74 0.07 0.14 0.21 0.24 0.59 0.80 0.70 0.56 0.06 0.07 0.07 0.08 0.60 0.61 0.66 0.66b) Support of apprenticeship and related
forms of general youth training 0.13 0.13 0.11 0.10 1.35 1.23 1.02 0.78 0.19 0.19 0.19 0.18 1.96 2.16 2.27 2.26 0.01 0.01 0.01 0.01 0.28 0.40 0.36 . .
4. Subsidised employment 0.51 0.38 0.31 0.29 3.53 2.74 2.24 1.99 0.50 0.43 0.43 0.37 3.92 3.77 3.53 3.11 0.39 0.40 0.32 0.25 2.01 1.59 1.24 1.04a) Subsidies to regular employment
in the private sector 0.18 0.16 0.15 0.15 1.29 1.06 0.91 0.85 0.31 0.24 0.23 0.18 2.19 2.15 1.96 1.66 0.04 0.03 0.03 0.03 0.17 0.10 0.11 0.12b) Support of unemployed persons
starting enterprises 0.03 0.03 0.03 0.03 0.20 0.17 0.16 0.19 - - - - 0.13 0.15 0.16 0.16 0.03 0.04 0.04 0.04 0.25 0.24 0.23 0.24c) Direct job creation
(public or non-profit) 0.29 0.19 0.13 0.12 2.04 1.51 1.17 0.95 0.18 0.18 0.19 0.18 1.53 1.40 1.36 1.24 0.32 0.33 0.25 0.19 1.59 1.25 0.90 0.68
5. Measures for the disabled 0.11 0.10 0.09 0.09 0.89 0.83 0.90 0.88 0.08 0.09 0.09 0.09 0.31 0.26 0.37 0.45 0.25 0.27 0.27 0.29 0.30 0.32 0.30 0.30a) Vocational rehabilitation 0.06 0.05 0.05 0.05 0.89 0.83 0.90 0.88 0.02 0.02 0.02 0.03 0.31 0.26 0.37 0.45 0.10 0.12 0.11 0.12 0.30 0.32 0.30 0.30b) Work for the disabled 0.05 0.05 0.04 0.04 - - - - 0.06 0.06 0.06 0.06 . . . . . . . . 0.15 0.15 0.15 0.16 - - - -
6. Unemployment compensation 2.13 1.87 1.64 1.52 . . . . . . . . 1.49 1.47 1.46 1.38 6.61 6.64 6.60 6.38 2.28 2.12 1.89 1.90 . . . . - -
7. Early retirement for labour marketreasons 0.43 0.47 0.47 0.50 . . . . . . . . 0.35 0.32 0.30 0.27 0.34 0.34 0.29 0.25 - 0.01 0.01 0.02 . . . . . . -
TOTAL 3.96 3.56 3.11 2.96 . . . . . . . . 3.19 3.11 3.13 2.96 16.47 16.84 16.41 15.42 3.56 3.44 3.14 3.13 . . . . . . . .
Active measures (1-5) 1.40 1.22 0.99 0.95 11.62 10.27 8.61 7.16 1.35 1.31 1.37 1.31 9.52 9.86 9.52 8.78 1.27 1.31 1.24 1.20 4.70 4.25 4.04 . .Passive measures (6 and 7) 2.56 2.33 2.11 2.02 . . . . . . . . 1.84 1.80 1.75 1.65 6.95 6.98 6.89 6.64 2.28 2.13 1.90 1.92 . . . . . . -
.. Data not available.- Nil or less than half of the last digit used*a) Provisional data.
Table H. Public expenditure and participant inflows* in labour market programmes in OECD countries (cont.)
Data on the annual inflows of participants into the programmes have not been collected for category 1 "Public employment services and administration". The totals shown in the table must be interpreted with caution
AnnStat.fm
Page 327 Friday, June 7, 2002 9:50 A
M
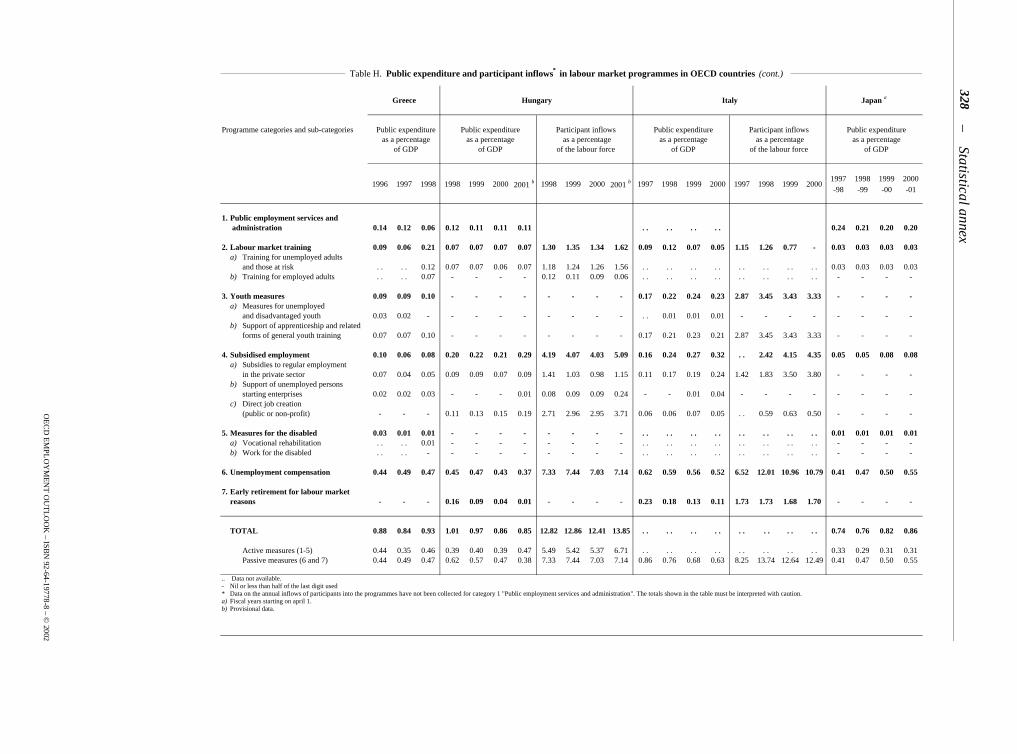
OE
CD
EM
PL
OY
ME
NT
OU
TL
OO
K – IS
BN
92-64-19778-8 – © 2002
–Statistical annex
328Greece Hungary Italy Japan a
Programme categories and sub-categories Public expenditure Public expenditure Participant inflows Public expenditure Participant inflows Public expenditure as a percentage as a percentage as a percentage as a percentage as a percentage as a percentage
of GDP of GDP of the labour force of GDP of the labour force of GDP
1996 1997 1998 1998 1999 2000 2001 b 1998 1999 2000 2001 b 1997 1998 1999 2000 1997 1998 1999 20001997-98
1998-99
1999-00
2000-01
1. Public employment services and administration 0.14 0.12 0.06 0.12 0.11 0.11 0.11 . . . . . . . . 0.24 0.21 0.20 0.20
2. Labour market training 0.09 0.06 0.21 0.07 0.07 0.07 0.07 1.30 1.35 1.34 1.62 0.09 0.12 0.07 0.05 1.15 1.26 0.77 - 0.03 0.03 0.03 0.03a) Training for unemployed adults
and those at risk . . . . 0.12 0.07 0.07 0.06 0.07 1.18 1.24 1.26 1.56 . . . . . . . . . . . . . . . . 0.03 0.03 0.03 0.03b) Training for employed adults . . . . 0.07 - - - - 0.12 0.11 0.09 0.06 . . . . . . . . . . . . . . . . - - - -
3. Youth measures 0.09 0.09 0.10 - - - - - - - - 0.17 0.22 0.24 0.23 2.87 3.45 3.43 3.33 - - - -a) Measures for unemployed
and disadvantaged youth 0.03 0.02 - - - - - - - - - . . 0.01 0.01 0.01 - - - - - - - -b) Support of apprenticeship and related
forms of general youth training 0.07 0.07 0.10 - - - - - - - - 0.17 0.21 0.23 0.21 2.87 3.45 3.43 3.33 - - - -
4. Subsidised employment 0.10 0.06 0.08 0.20 0.22 0.21 0.29 4.19 4.07 4.03 5.09 0.16 0.24 0.27 0.32 . . 2.42 4.15 4.35 0.05 0.05 0.08 0.08a) Subsidies to regular employment
in the private sector 0.07 0.04 0.05 0.09 0.09 0.07 0.09 1.41 1.03 0.98 1.15 0.11 0.17 0.19 0.24 1.42 1.83 3.50 3.80 - - - -b) Support of unemployed persons
starting enterprises 0.02 0.02 0.03 - - - 0.01 0.08 0.09 0.09 0.24 - - 0.01 0.04 - - - - - - - -c) Direct job creation
(public or non-profit) - - - 0.11 0.13 0.15 0.19 2.71 2.96 2.95 3.71 0.06 0.06 0.07 0.05 . . 0.59 0.63 0.50 - - - -
5. Measures for the disabled 0.03 0.01 0.01 - - - - - - - - . . . . . . . . . . . . . . . . 0.01 0.01 0.01 0.01a) Vocational rehabilitation . . . . 0.01 - - - - - - - - . . . . . . . . . . . . . . . . - - - -b) Work for the disabled . . . . - - - - - - - - - . . . . . . . . . . . . . . . . - - - -
6. Unemployment compensation 0.44 0.49 0.47 0.45 0.47 0.43 0.37 7.33 7.44 7.03 7.14 0.62 0.59 0.56 0.52 6.52 12.01 10.96 10.79 0.41 0.47 0.50 0.55
7. Early retirement for labour marketreasons - - - 0.16 0.09 0.04 0.01 - - - - 0.23 0.18 0.13 0.11 1.73 1.73 1.68 1.70 - - - -
TOTAL 0.88 0.84 0.93 1.01 0.97 0.86 0.85 12.82 12.86 12.41 13.85 . . . . . . . . . . . . . . . . 0.74 0.76 0.82 0.86
Active measures (1-5) 0.44 0.35 0.46 0.39 0.40 0.39 0.47 5.49 5.42 5.37 6.71 . . . . . . . . . . . . . . . . 0.33 0.29 0.31 0.31Passive measures (6 and 7) 0.44 0.49 0.47 0.62 0.57 0.47 0.38 7.33 7.44 7.03 7.14 0.86 0.76 0.68 0.63 8.25 13.74 12.64 12.49 0.41 0.47 0.50 0.55
.. Data not available.- Nil or less than half of the last digit used* Data on the annual inflows of participants into the programmes have not been collected for category 1 "Public employment services and administration". The totals shown in the table must be interpreted with caution.a) Fiscal years starting on april 1.b) Provisional data.
Table H. Public expenditure and participant inflows* in labour market programmes in OECD countries (cont.)
AnnStat.fm
Page 328 Friday, June 7, 2002 9:50 A
M
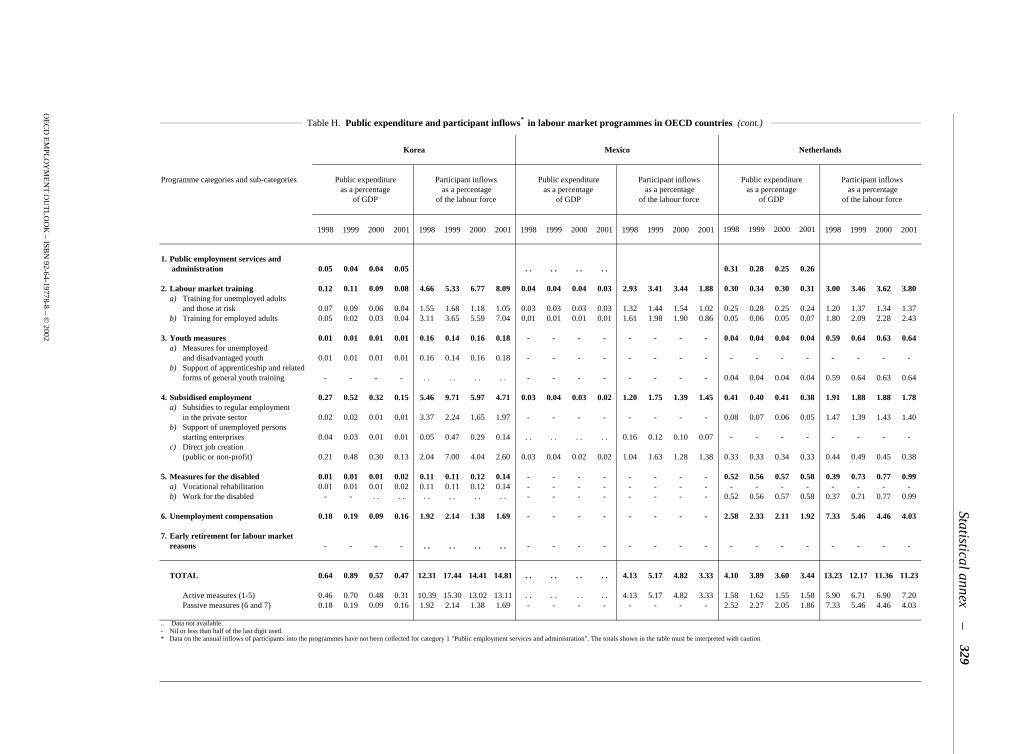
OE
CD
EM
PL
OY
ME
NT
OU
TL
OO
K – IS
BN
92-64-19778-8 – © 2002
Statistical annex–
329
Korea Mexico Netherlands
Programme categories and sub-categories Public expenditure Participant inflows Public expenditure Participant inflows Public expenditure Participant inflows as a percentage as a percentage as a percentage as a percentage as a percentage as a percentage
of GDP of the labour force of GDP of the labour force of GDP of the labour force
1998 1999 2000 2001 1998 1999 2000 2001 1998 1999 2000 2001 1998 1999 2000 2001 1998 1999 2000 2001 1998 1999 2000 2001
1. Public employment services and administration 0.05 0.04 0.04 0.05 . . . . . . . . 0.31 0.28 0.25 0.26
2. Labour market training 0.12 0.11 0.09 0.08 4.66 5.33 6.77 8.09 0.04 0.04 0.04 0.03 2.93 3.41 3.44 1.88 0.30 0.34 0.30 0.31 3.00 3.46 3.62 3.80a) Training for unemployed adults
and those at risk 0.07 0.09 0.06 0.04 1.55 1.68 1.18 1.05 0.03 0.03 0.03 0.03 1.32 1.44 1.54 1.02 0.25 0.28 0.25 0.24 1.20 1.37 1.34 1.37b) Training for employed adults 0.05 0.02 0.03 0.04 3.11 3.65 5.59 7.04 0.01 0.01 0.01 0.01 1.61 1.98 1.90 0.86 0.05 0.06 0.05 0.07 1.80 2.09 2.28 2.43
3. Youth measures 0.01 0.01 0.01 0.01 0.16 0.14 0.16 0.18 - - - - - - - - 0.04 0.04 0.04 0.04 0.59 0.64 0.63 0.64a) Measures for unemployed
and disadvantaged youth 0.01 0.01 0.01 0.01 0.16 0.14 0.16 0.18 - - - - - - - - - - - - - - - -b) Support of apprenticeship and related
forms of general youth training - - - - . . . . . . . . - - - - - - - - 0.04 0.04 0.04 0.04 0.59 0.64 0.63 0.64
4. Subsidised employment 0.27 0.52 0.32 0.15 5.46 9.71 5.97 4.71 0.03 0.04 0.03 0.02 1.20 1.75 1.39 1.45 0.41 0.40 0.41 0.38 1.91 1.88 1.88 1.78a) Subsidies to regular employment
in the private sector 0.02 0.02 0.01 0.01 3.37 2.24 1.65 1.97 - - - - - - - - 0.08 0.07 0.06 0.05 1.47 1.39 1.43 1.40b) Support of unemployed persons
starting enterprises 0.04 0.03 0.01 0.01 0.05 0.47 0.29 0.14 . . . . . . . . 0.16 0.12 0.10 0.07 - - - - - - - -c) Direct job creation
(public or non-profit) 0.21 0.48 0.30 0.13 2.04 7.00 4.04 2.60 0.03 0.04 0.02 0.02 1.04 1.63 1.28 1.38 0.33 0.33 0.34 0.33 0.44 0.49 0.45 0.38
5. Measures for the disabled 0.01 0.01 0.01 0.02 0.11 0.11 0.12 0.14 - - - - - - - - 0.52 0.56 0.57 0.58 0.39 0.73 0.77 0.99a) Vocational rehabilitation 0.01 0.01 0.01 0.02 0.11 0.11 0.12 0.14 - - - - - - - - - - - - - - - -b) Work for the disabled - - . . . . . . . . . . . . - - - - - - - - 0.52 0.56 0.57 0.58 0.37 0.71 0.77 0.99
6. Unemployment compensation 0.18 0.19 0.09 0.16 1.92 2.14 1.38 1.69 - - - - - - - - 2.58 2.33 2.11 1.92 7.33 5.46 4.46 4.03
7. Early retirement for labour marketreasons - - - - . . . . . . . . - - - - - - - - - - - - - - - -
TOTAL 0.64 0.89 0.57 0.47 12.31 17.44 14.41 14.81 . . . . . . . . 4.13 5.17 4.82 3.33 4.10 3.89 3.60 3.44 13.23 12.17 11.36 11.23
Active measures (1-5) 0.46 0.70 0.48 0.31 10.39 15.30 13.02 13.11 . . . . . . . . 4.13 5.17 4.82 3.33 1.58 1.62 1.55 1.58 5.90 6.71 6.90 7.20Passive measures (6 and 7) 0.18 0.19 0.09 0.16 1.92 2.14 1.38 1.69 - - - - - - - - 2.52 2.27 2.05 1.86 7.33 5.46 4.46 4.03
.. Data not available.- Nil or less than half of the last digit used.* Data on the annual inflows of participants into the programmes have not been collected for category 1 "Public employment services and administration". The totals shown in the table must be interpreted with caution
Table H. Public expenditure and participant inflows* in labour market programmes in OECD countries (cont.)
AnnStat.fm
Page 329 Friday, June 7, 2002 9:50 A
M
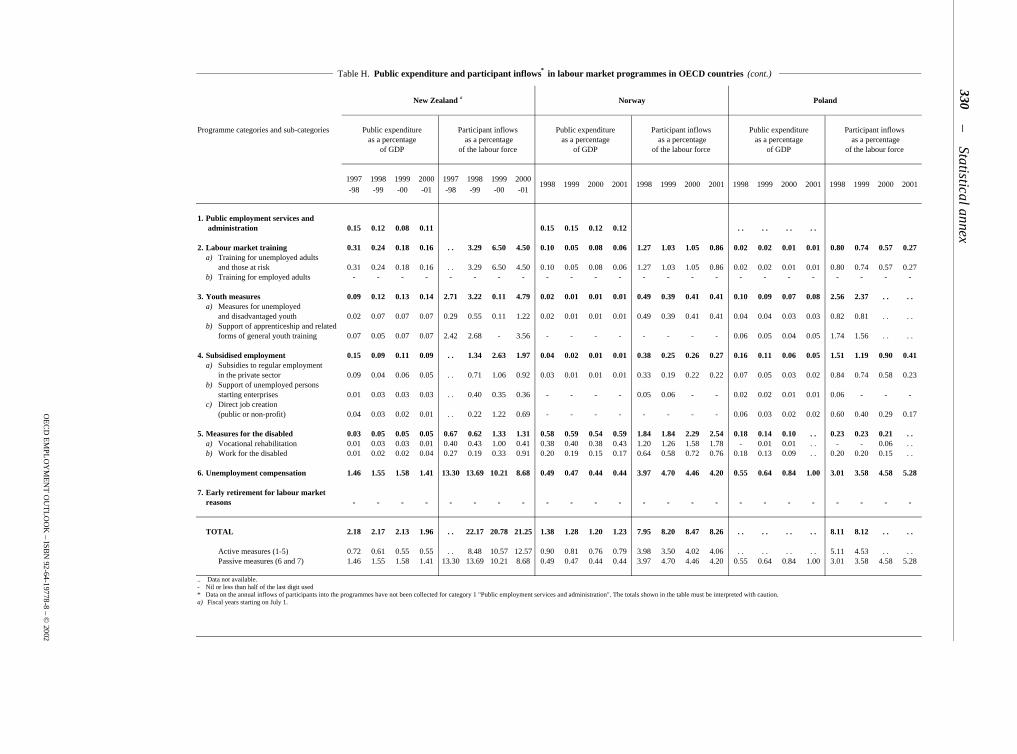
OE
CD
EM
PL
OY
ME
NT
OU
TL
OO
K – IS
BN
92-64-19778-8 – © 2002
–Statistical annex
330New Zealand a Norway Poland
Programme categories and sub-categories Public expenditure Participant inflows Public expenditure Participant inflows Public expenditure Participant inflows as a percentage as a percentage as a percentage as a percentage as a percentage as a percentage
of GDP of the labour force of GDP of the labour force of GDP of the labour force
1997-98
1998-99
1999-00
2000-01
1997-98
1998-99
1999-00
2000-01
1998 1999 2000 2001 1998 1999 2000 2001 1998 1999 2000 2001 1998 1999 2000 2001
1. Public employment services and administration 0.15 0.12 0.08 0.11 0.15 0.15 0.12 0.12 . . . . . . . .
2. Labour market training 0.31 0.24 0.18 0.16 . . 3.29 6.50 4.50 0.10 0.05 0.08 0.06 1.27 1.03 1.05 0.86 0.02 0.02 0.01 0.01 0.80 0.74 0.57 0.27a) Training for unemployed adults
and those at risk 0.31 0.24 0.18 0.16 . . 3.29 6.50 4.50 0.10 0.05 0.08 0.06 1.27 1.03 1.05 0.86 0.02 0.02 0.01 0.01 0.80 0.74 0.57 0.27b) Training for employed adults - - - - - - - - - - - - - - - - - - - - - - - -
3. Youth measures 0.09 0.12 0.13 0.14 2.71 3.22 0.11 4.79 0.02 0.01 0.01 0.01 0.49 0.39 0.41 0.41 0.10 0.09 0.07 0.08 2.56 2.37 . . . .a) Measures for unemployed
and disadvantaged youth 0.02 0.07 0.07 0.07 0.29 0.55 0.11 1.22 0.02 0.01 0.01 0.01 0.49 0.39 0.41 0.41 0.04 0.04 0.03 0.03 0.82 0.81 . . . .b) Support of apprenticeship and related
forms of general youth training 0.07 0.05 0.07 0.07 2.42 2.68 - 3.56 - - - - - - - - 0.06 0.05 0.04 0.05 1.74 1.56 . . . .
4. Subsidised employment 0.15 0.09 0.11 0.09 . . 1.34 2.63 1.97 0.04 0.02 0.01 0.01 0.38 0.25 0.26 0.27 0.16 0.11 0.06 0.05 1.51 1.19 0.90 0.41a) Subsidies to regular employment
in the private sector 0.09 0.04 0.06 0.05 . . 0.71 1.06 0.92 0.03 0.01 0.01 0.01 0.33 0.19 0.22 0.22 0.07 0.05 0.03 0.02 0.84 0.74 0.58 0.23b) Support of unemployed persons
starting enterprises 0.01 0.03 0.03 0.03 . . 0.40 0.35 0.36 - - - - 0.05 0.06 - - 0.02 0.02 0.01 0.01 0.06 - - -c) Direct job creation
(public or non-profit) 0.04 0.03 0.02 0.01 . . 0.22 1.22 0.69 - - - - - - - - 0.06 0.03 0.02 0.02 0.60 0.40 0.29 0.17
5. Measures for the disabled 0.03 0.05 0.05 0.05 0.67 0.62 1.33 1.31 0.58 0.59 0.54 0.59 1.84 1.84 2.29 2.54 0.18 0.14 0.10 . . 0.23 0.23 0.21 . .a) Vocational rehabilitation 0.01 0.03 0.03 0.01 0.40 0.43 1.00 0.41 0.38 0.40 0.38 0.43 1.20 1.26 1.58 1.78 - 0.01 0.01 . . - - 0.06 . .b) Work for the disabled 0.01 0.02 0.02 0.04 0.27 0.19 0.33 0.91 0.20 0.19 0.15 0.17 0.64 0.58 0.72 0.76 0.18 0.13 0.09 . . 0.20 0.20 0.15 . .
6. Unemployment compensation 1.46 1.55 1.58 1.41 13.30 13.69 10.21 8.68 0.49 0.47 0.44 0.44 3.97 4.70 4.46 4.20 0.55 0.64 0.84 1.00 3.01 3.58 4.58 5.28
7. Early retirement for labour marketreasons - - - - - - - - - - - - - - - - - - - - - - - -
TOTAL 2.18 2.17 2.13 1.96 . . 22.17 20.78 21.25 1.38 1.28 1.20 1.23 7.95 8.20 8.47 8.26 . . . . . . . . 8.11 8.12 . . . .
Active measures (1-5) 0.72 0.61 0.55 0.55 . . 8.48 10.57 12.57 0.90 0.81 0.76 0.79 3.98 3.50 4.02 4.06 . . . . . . . . 5.11 4.53 . . . .Passive measures (6 and 7) 1.46 1.55 1.58 1.41 13.30 13.69 10.21 8.68 0.49 0.47 0.44 0.44 3.97 4.70 4.46 4.20 0.55 0.64 0.84 1.00 3.01 3.58 4.58 5.28
.. Data not available.- Nil or less than half of the last digit used* Data on the annual inflows of participants into the programmes have not been collected for category 1 "Public employment services and administration". The totals shown in the table must be interpreted with caution.a) Fiscal years starting on July 1.
Table H. Public expenditure and participant inflows* in labour market programmes in OECD countries (cont.)
AnnStat.fm
Page 330 Friday, June 7, 2002 9:50 A
M
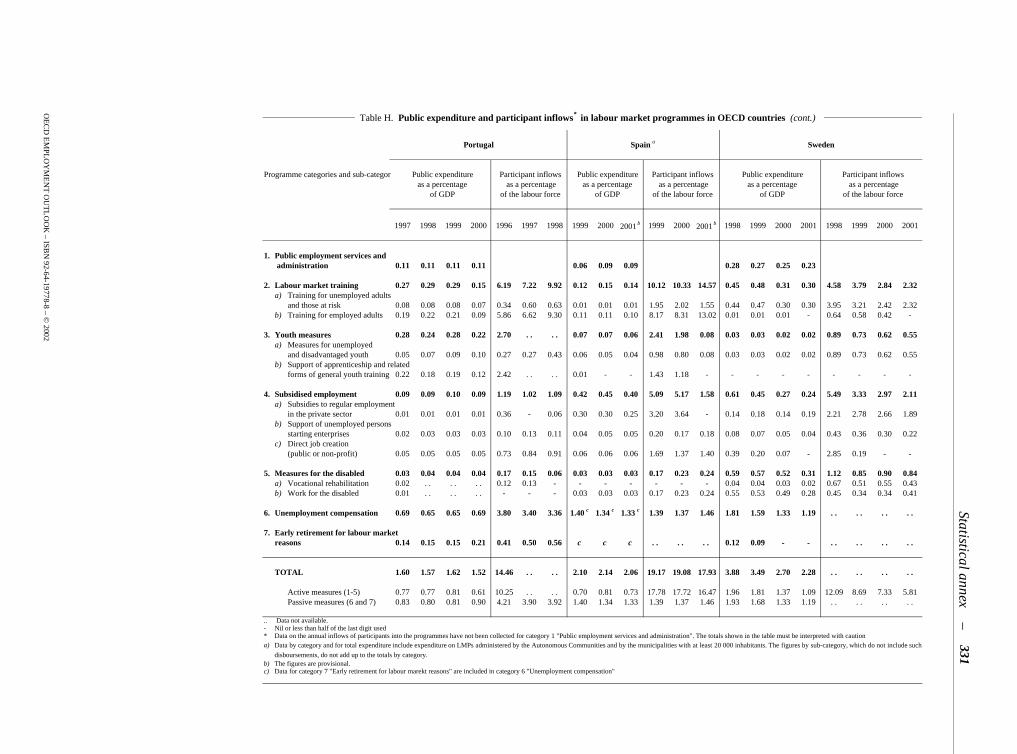
OE
CD
EM
PL
OY
ME
NT
OU
TL
OO
K – IS
BN
92-64-19778-8 – © 2002
Statistical annex–
331
Portugal Spain a Sweden
Programme categories and sub-categor Public expenditure Participant inflows Public expenditure Participant inflows Public expenditure Participant inflows as a percentage as a percentage as a percentage as a percentage as a percentage as a percentage
of GDP of the labour force of GDP of the labour force of GDP of the labour force
1997 1998 1999 2000 1996 1997 1998 1999 2000 2001 b 1999 2000 2001 b 1998 1999 2000 2001 1998 1999 2000 2001
1. Public employment services and administration 0.11 0.11 0.11 0.11 0.06 0.09 0.09 0.28 0.27 0.25 0.23
2. Labour market training 0.27 0.29 0.29 0.15 6.19 7.22 9.92 0.12 0.15 0.14 10.12 10.33 14.57 0.45 0.48 0.31 0.30 4.58 3.79 2.84 2.32a) Training for unemployed adults
and those at risk 0.08 0.08 0.08 0.07 0.34 0.60 0.63 0.01 0.01 0.01 1.95 2.02 1.55 0.44 0.47 0.30 0.30 3.95 3.21 2.42 2.32b) Training for employed adults 0.19 0.22 0.21 0.09 5.86 6.62 9.30 0.11 0.11 0.10 8.17 8.31 13.02 0.01 0.01 0.01 - 0.64 0.58 0.42 -
3. Youth measures 0.28 0.24 0.28 0.22 2.70 . . . . 0.07 0.07 0.06 2.41 1.98 0.08 0.03 0.03 0.02 0.02 0.89 0.73 0.62 0.55a) Measures for unemployed
and disadvantaged youth 0.05 0.07 0.09 0.10 0.27 0.27 0.43 0.06 0.05 0.04 0.98 0.80 0.08 0.03 0.03 0.02 0.02 0.89 0.73 0.62 0.55b) Support of apprenticeship and related
forms of general youth training 0.22 0.18 0.19 0.12 2.42 . . . . 0.01 - - 1.43 1.18 - - - - - - - - -
4. Subsidised employment 0.09 0.09 0.10 0.09 1.19 1.02 1.09 0.42 0.45 0.40 5.09 5.17 1.58 0.61 0.45 0.27 0.24 5.49 3.33 2.97 2.11a) Subsidies to regular employment
in the private sector 0.01 0.01 0.01 0.01 0.36 - 0.06 0.30 0.30 0.25 3.20 3.64 - 0.14 0.18 0.14 0.19 2.21 2.78 2.66 1.89b) Support of unemployed persons
starting enterprises 0.02 0.03 0.03 0.03 0.10 0.13 0.11 0.04 0.05 0.05 0.20 0.17 0.18 0.08 0.07 0.05 0.04 0.43 0.36 0.30 0.22c) Direct job creation
(public or non-profit) 0.05 0.05 0.05 0.05 0.73 0.84 0.91 0.06 0.06 0.06 1.69 1.37 1.40 0.39 0.20 0.07 - 2.85 0.19 - -
5. Measures for the disabled 0.03 0.04 0.04 0.04 0.17 0.15 0.06 0.03 0.03 0.03 0.17 0.23 0.24 0.59 0.57 0.52 0.31 1.12 0.85 0.90 0.84a) Vocational rehabilitation 0.02 . . . . . . 0.12 0.13 - - - - - - - 0.04 0.04 0.03 0.02 0.67 0.51 0.55 0.43b) Work for the disabled 0.01 . . . . . . - - - 0.03 0.03 0.03 0.17 0.23 0.24 0.55 0.53 0.49 0.28 0.45 0.34 0.34 0.41
6. Unemployment compensation 0.69 0.65 0.65 0.69 3.80 3.40 3.36 1.40 c 1.34 c 1.33 c 1.39 1.37 1.46 1.81 1.59 1.33 1.19 . . . . . . . .
7. Early retirement for labour marketreasons 0.14 0.15 0.15 0.21 0.41 0.50 0.56 c c c . . . . . . 0.12 0.09 - - . . . . . . . .
TOTAL 1.60 1.57 1.62 1.52 14.46 . . . . 2.10 2.14 2.06 19.17 19.08 17.93 3.88 3.49 2.70 2.28 . . . . . . . .
Active measures (1-5) 0.77 0.77 0.81 0.61 10.25 . . . . 0.70 0.81 0.73 17.78 17.72 16.47 1.96 1.81 1.37 1.09 12.09 8.69 7.33 5.81Passive measures (6 and 7) 0.83 0.80 0.81 0.90 4.21 3.90 3.92 1.40 1.34 1.33 1.39 1.37 1.46 1.93 1.68 1.33 1.19 . . . . . . . .
.. Data not available.- Nil or less than half of the last digit used* Data on the annual inflows of participants into the programmes have not been collected for category 1 "Public employment services and administration". The totals shown in the table must be interpreted with cautiona)
b) The figures are provisional.c) Data for category 7 "Early retirement for labour marekt reasons" are included in category 6 "Unemployment compensation"
Table H. Public expenditure and participant inflows* in labour market programmes in OECD countries (cont.)
Data by category and for total expenditure include expenditure on LMPs administered by the Autonomous Communities and by the municipalities with at least 20 000 inhabitants. The figures by sub-category, which do not include such
disboursements, do not add up to the totals by category.
AnnStat.fm
Page 331 Friday, June 7, 2002 9:50 A
M
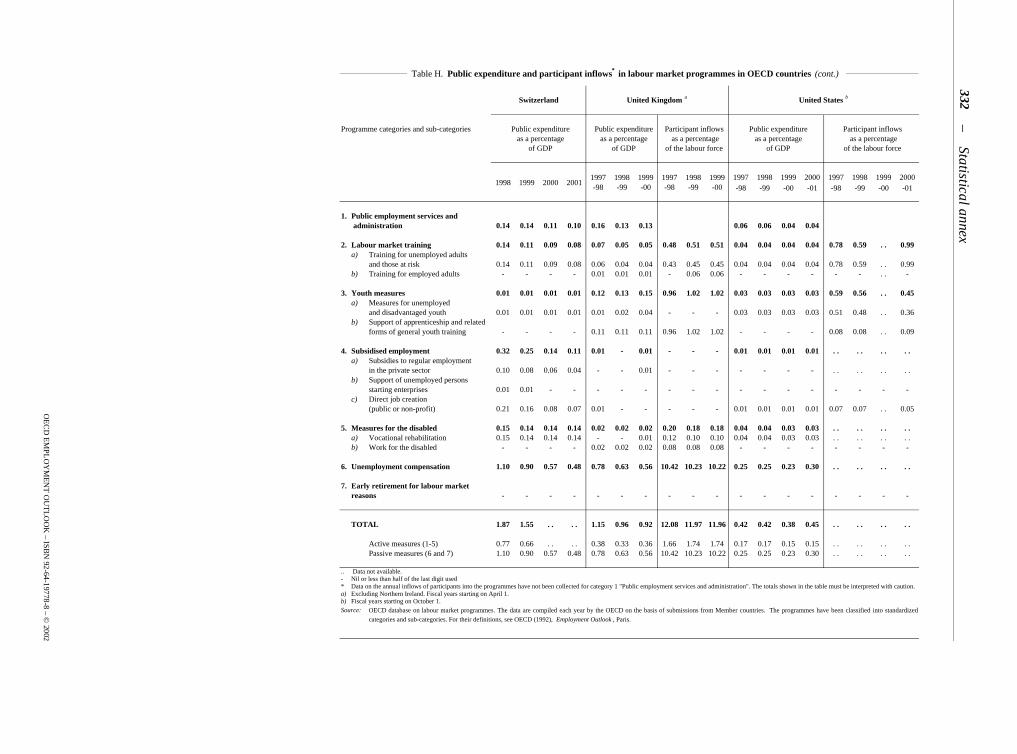
OE
CD
EM
PL
OY
ME
NT
OU
TL
OO
K – IS
BN
92-64-19778-8 – © 2002
–Statistical annex
332Switzerland United Kingdom a United States b
Programme categories and sub-categories Public expenditure Public expenditure Participant inflows Public expenditure Participant inflows as a percentage as a percentage as a percentage as a percentage as a percentage
of GDP of GDP of the labour force of GDP of the labour force
1998 1999 2000 20011997-98
1998-99
1999-00
1997-98
1998-99
1999-00
1997-98
1998-99
1999-00
2000-01
1997-98
1998-99
1999-00
2000-01
1. Public employment services and administration 0.14 0.14 0.11 0.10 0.16 0.13 0.13 0.06 0.06 0.04 0.04
2. Labour market training 0.14 0.11 0.09 0.08 0.07 0.05 0.05 0.48 0.51 0.51 0.04 0.04 0.04 0.04 0.78 0.59 . . 0.99a) Training for unemployed adults
and those at risk 0.14 0.11 0.09 0.08 0.06 0.04 0.04 0.43 0.45 0.45 0.04 0.04 0.04 0.04 0.78 0.59 . . 0.99b) Training for employed adults - - - - 0.01 0.01 0.01 - 0.06 0.06 - - - - - - . . -
3. Youth measures 0.01 0.01 0.01 0.01 0.12 0.13 0.15 0.96 1.02 1.02 0.03 0.03 0.03 0.03 0.59 0.56 . . 0.45a) Measures for unemployed
and disadvantaged youth 0.01 0.01 0.01 0.01 0.01 0.02 0.04 - - - 0.03 0.03 0.03 0.03 0.51 0.48 . . 0.36b) Support of apprenticeship and related
forms of general youth training - - - - 0.11 0.11 0.11 0.96 1.02 1.02 - - - - 0.08 0.08 . . 0.09
4. Subsidised employment 0.32 0.25 0.14 0.11 0.01 - 0.01 - - - 0.01 0.01 0.01 0.01 . . . . . . . .a) Subsidies to regular employment
in the private sector 0.10 0.08 0.06 0.04 - - 0.01 - - - - - - - . . . . . . . .b) Support of unemployed persons
starting enterprises 0.01 0.01 - - - - - - - - - - - - - - - -c) Direct job creation
(public or non-profit) 0.21 0.16 0.08 0.07 0.01 - - - - - 0.01 0.01 0.01 0.01 0.07 0.07 . . 0.05
5. Measures for the disabled 0.15 0.14 0.14 0.14 0.02 0.02 0.02 0.20 0.18 0.18 0.04 0.04 0.03 0.03 . . . . . . . .a) Vocational rehabilitation 0.15 0.14 0.14 0.14 - - 0.01 0.12 0.10 0.10 0.04 0.04 0.03 0.03 . . . . . . . .b) Work for the disabled - - - - 0.02 0.02 0.02 0.08 0.08 0.08 - - - - - - - -
6. Unemployment compensation 1.10 0.90 0.57 0.48 0.78 0.63 0.56 10.42 10.23 10.22 0.25 0.25 0.23 0.30 . . . . . . . .
7. Early retirement for labour marketreasons - - - - - - - - - - - - - - - - - -
TOTAL 1.87 1.55 . . . . 1.15 0.96 0.92 12.08 11.97 11.96 0.42 0.42 0.38 0.45 . . . . . . . .
Active measures (1-5) 0.77 0.66 . . . . 0.38 0.33 0.36 1.66 1.74 1.74 0.17 0.17 0.15 0.15 . . . . . . . .Passive measures (6 and 7) 1.10 0.90 0.57 0.48 0.78 0.63 0.56 10.42 10.23 10.22 0.25 0.25 0.23 0.30 . . . . . . . .
.. Data not available.- Nil or less than half of the last digit used* Data on the annual inflows of participants into the programmes have not been collected for category 1 "Public employment services and administration". The totals shown in the table must be interpreted with caution.a) Excluding Northern Ireland. Fiscal years starting on April 1.b) Fiscal years starting on October 1.Source:
Table H. Public expenditure and participant inflows* in labour market programmes in OECD countries (cont.)
OECD database on labour market programmes. The data are compiled each year by the OECD on the basis of submissions from Member countries. The programmes have been classified into standardized
categories and sub-categories. For their definitions, see OECD (1992), Employment Outlook , Paris.
AnnStat.fm
Page 332 Friday, June 7, 2002 9:50 A
M
OECD EMPLOYMENT OUTLOOK – ISBN 92-64-19778-8 – © 2002
Index of previous issuesof the OECD Employment Outlook, 1983-2001
1983
The Employment Imperative and Labour Market Policies
Part I. The Labour Market in the Latest RecessionChapter 1. Labour Market DevelopmentsChapter 2. Labour Market Prospects
Part II. Employment and Unemployment: Selected Medium-term DevelopmentsChapter 3. The Determinants of Working HoursChapter 4. Part-time Employment in OECD CountriesChapter 5. Long-term Unemployment in OECD CountriesChapter 6. The Nature of Youth-Adult Unemployment Differentials
1984
Jobs, Efficiency and Equity in Today’s Labour Market
Part I. The Labour Market in the RecoveryChapter 1. Labour Market DevelopmentsChapter 2. Labour Market Prospects
Part II. Selected Medium-term Developments in Employment and UnemploymentChapter 3. The Contribution of Services to EmploymentChapter 4. The Importance of Long-term Job Attachment in OECD CountriesChapter 5. Do Relative Wage Levels Affect Youth Employment?Chapter 6. Unemployment and Family Income
1985
Employment Growth, Flexibility and Job Security: A Challenge for All
Part I. Labour Market Developments in the OECD AreaChapter 1. Short-term Labour Market Developments and ProspectsChapter 2. Medium-term Labour Market Developments
Part II. Detailed Analyses of Key Labour Market IssuesChapter 3. The Labour Market Implications of International Migration in Selected OECD CountriesChapter 4. Employment in Small and Large Firms: Where Have the Jobs Come from?Chapter 5. Relatives Wages, Industrial Structure and Employment PerformanceChapter 6. Moving In and Out of Unemployment: The Incidence and Patterns of Recurrent Unemployment
in Selected OECD Countries
1986
Policies for Employment in a Changing Economy
Part I. Labour Market Developments in the OECD AreaChapter 1. Short-term Labour Market Developments and Prospects
Part II. Detailed Analyses of Key Labour Market IssuesChapter 2. Self-employment in OECD CountriesChapter 3. Concealed EmploymentChapter 4. Non-wage Labour Costs and EmploymentChapter 5. The Youth Labour Market Problem: Age and Generational Crowding
Index.fm Page 333 Friday, June 7, 2002 9:51 AM
OECD EMPLOYMENT OUTLOOK – ISBN 92-64-19778-8 – © 2002
– Index of previous issues334
1987
Editorial: Activity for All in Tomorrow’s Society
Part I. Labour Market Developments in the OECD AreaChapter 1. Recent Labour Market TrendsChapter 2. Labour Market Prospects
Part II. Detailed Analyses of Key Labour Market IssuesChapter 3. Occupational Differentials in Earnings and Labour DemandChapter 4. The Process of Job Creation and Job DestructionChapter 5. Who Are the Unemployed? Measurement Issues and their Policy ImplicationsChapter 6. On the Margin of the Labour Force: An Analysis of Discouraged Workers and Other Non-participantsChapter 7. Long-term Unemployment
1988
Editorial: Steps towards an Active Society
Chapter 1. Labour Market Trends and Prospects in the OECD AreaChapter 2. Longer-run Labour Market IssuesChapter 3. Profiles of Labour Market Budgets 1985-1987Chapter 4. Description of Unemployment Benefit Systems in OECD CountriesChapter 5. Women’s Activity, Employment and Earnings: A Review of Recent DevelopmentsChapter 6. Technology and Employment
1989
Editorial: The Path to Full Employment: Structural Adjustment for an Active Society
Chapter 1. Labour Market Trends and ProspectsChapter 2. Educational Attainment of the Labour ForceChapter 3. Regional Unemployment in OECD CountriesChapter 4. Occupational Accidents in OECD CountriesChapter 5. Characteristics of Employment in Growing and Declining Industries
1990
Editorial: Labour Markets in the 1990s: Challenges and Opportunities
Chapter 1. Labour Market Trends and Prospects in the OECD AreaChapter 2. Displacement and Job Loss: The Workers ConcernedChapter 3. Supply and Demand in Regional Labour Markets: Population Growth, Migration, Participation and
Earnings DifferentialsChapter 4. Occupational Illness in OECD CountriesChapter 5. Child Care in OECD CountriesChapter 6. Employer versus Employee Taxation: The Impact on EmploymentChapter 7. Involuntary Part-time Work as a Component of Under-employment
1991
Editorial: Labour Market Reform: Staying the Course
Part I. Labour Market Developments and ProspectsChapter 1. Recent Labour Market Developments and ProspectsChapter 2. A Review of Labour Markets in the 1980sChapter 3. Labour Markets in Dynamic Asian Economies
Part II. Key Issues for Labour Market and Social PoliciesChapter 4. Trends in Trade Union MembershipChapter 5. Entreprise-related TrainingChapter 6. Absences from Work Reported in Labour Force SurveysChapter 7. Unemployment Benefits Rules and Labour Market Policy
Index.fm Page 334 Friday, June 7, 2002 9:51 AM
OECD EMPLOYMENT OUTLOOK – ISBN 92-64-19778-8 – © 2002
Index of previous issues – 335
1992
Editorial: Fighting Unemployment: Action on Labour Market Reforms
Part I. Labour Market Prospects and DevelopmentsChapter 1. Recent Labour Market Developments and ProspectsChapter 2. Monitoring Labour Market DevelopmentsChapter 3. The Public Employment Service in Japan, Norway, Spain and the United Kingdom
Part II. Key Issues for Labour Market and Social PoliciesChapter 4. Recent Developments in Self-employmentChapter 5. Labour Market Participation and Retirement of Older WorkersChapter 6. Reforming Labour Markets in Central and Eastern Europe and the Rise of Unemployment
1993
Editorial: Growth and Employment: A Key Role for Human Resource Development
Part I. Monitoring Labour Market Prospects and DevelopmentsChapter 1. Labour Market Prospects and Recent DevelopmentsChapter 2. Active Labour Market Policies: Assessing Macroeconomic and Microeconomic Effects
Part II. Key Issues for Labour Market and Social PoliciesChapter 3. Long-term Unemployment: Selected Causes and RemediesChapter 4. Enterprise Tenure, Labour Turnover and Skill TrainingChapter 5. Earnings Inequality: Changes in the 1980s
1994
Editorial: Creating Viable and Productive Jobs
Part I. Labour Market Prospects and DevelopmentsChapter 1. Recent Labour Market Developments and ProspectsChapter 2. Medium-term Perspectives on Labour Supply and Occupational Change
Part II. Key Issues for Labour Market and Social PoliciesChapter 3. Job Gains and Job Losses in FirmsChapter 4. Labour Standards and Economic IntegrationChapter 5. Collective Bargaining: Levels and Coverage
1995
Editorial: Making Active Labour Market Policies more Effective
Part I. Labour Market Prospects and DevelopmentsChapter 1. Recent Labour Market Developments and ProspectsChapter 2. Supplementary Measures of Labour Market Slack: An Analysis of Discouraged and Involuntary
Part-time Workers
Part II. Key Issues for Labour Market and Social PoliciesChapter 3. The Public Employment Service in Denmark, Finland and ItalyChapter 4. Profit-sharing in OECD CountriesChapter 5. Long-term Leave for Parents in OECD Countries
1996
Editorial: Countering the Risks of Labour Market Exclusion
Chapter 1. Recent Labour Market Developments and ProspectsChapter 2. Making Work PayChapter 3. Earnings Inequality, Low-paid Employment and Earnings MobilityChapter 4. Growing into Work: Youth and the Labour Market over the 1980s and 1990sChapter 5. Employment Adjustment, Workers and Unemployment
Index.fm Page 335 Friday, June 7, 2002 9:51 AM
OECD EMPLOYMENT OUTLOOK – ISBN 92-64-19778-8 – © 2002
– Index of previous issues336
1997
Editorial: Low-wage Jobs: Stepping Stones to a Better Future or Traps?
Chapter 1. Recent Labour Market Developments and ProspectsChapter 2. Earnings Mobility: Taking a Longer Run ViewChapter 3. Economic Performance and the Structure of Collective BargainingChapter 4. Trade, Earnings and Employment: Assessing the Impact of Trade with Emerging Economies on
OECD Labour MarketsChapter 5. Is Job Insecurity on the Increase in OECD Countries?
1998
Editorial: Towards an Employment-centred Social Policy
Chapter 1. Recent Labour Market Developments and Prospects – Special focus on patterns of employmentand joblessness from a household perspective
Chapter 2. Making the Most of the Minimum: Statutory Minimum Wages, Employment and PovertyChapter 3. Getting Started, Settling In: The Transition from Education to the Labour MarketChapter 4. Work-force Ageing in OECD CountriesChapter 5. Working Hours: Latest Trends and Policy Initiatives
1999
Editorial: Giving Youth a Better Start
Chapter 1. Recent Labour Market Developments and Prospects – Special focus on the quality of part-time jobsChapter 2. Employment Protection and Labour Market PerformanceChapter 3. Training of Adult Workers in OECD Countries: Measurement and AnalysisChapter 4. New Entreprise Work Practices and their Labour Market Implications
2000
Editorial: Rewarding Work
Chapter 1. Recent Labour Market Developments and Prospects – Special focus on the evolution of employ-ment in the new OECD Member countries
Chapter 2. Disparities in Regional Labour MarketsChapter 3. Employment in the Service Economy: A ReassessmentChapter 4. Eligibility Criteria for Unemployment BenefitsChapter 5. The Partial Renaissance of Self-employment
2001
Editorial: Reconciling Social and Employment Goals
Chapter 1. Recent Labour Market Developments and Prospects – Special focus on labour market policies:how the money has been spent
Chapter 2. When Money is Tight: Poverty Dynamics in OECD CountriesChapter 3. The Characteristics and Quality of Service Sector JobsChapter 4. Balancing Work and Family Life: Helping Parents into Paid EmploymentChapter 5. The Employment of Foreigners: Outlook and Issues in OECD Countries
Index.fm Page 336 Friday, June 7, 2002 9:51 AM

OECD PUBLICATIONS, 2, rue André-Pascal, 75775 PARIS CEDEX 16
PRINTED IN FRANCE
(81 2002 08 1 P) ISBN 92-64-19778-8 – No. 52485 2002
Index.fm Page 337 Friday, June 7, 2002 9:51 AM