Embed Size (px)
Citation preview

OECD EDUCATION POLICY OUTLOOK: EQUITY AND QUALITY IN EDUCATION
Beatriz PontSenior Policy AnalystOECD Directorate for Education and Skills
CEPS 3 November 2014

Quality in education
Key levers for change and improvement
Equity and quality
Equity and quality
PreparingstudentsPreparingstudents
Evaluationand assess.Evaluationand assess.
Schoolimproveme
nt
Schoolimproveme
nt
How can schoolsbest delivereducation for
studentachievement?
How to best measure to
improve schoolsystem’s outcomes
Is the system conducive to equityfor its students?
Is the system preparing
students for the future?
How is policy makingorganised to be effective?

Improving equity and reducing school failure is a policy priority
There is a need for clear policy responses
Countries face challenges in adopting and implementing policies to improve equity in education
There is increasing evidence that equity and quality can go together and there are many different policies and strategies to improve equity
All countries are confronted with equity challenges, and they can be of different types

4
High performing systems combine equity with quality
Socially equitable distribution of learning
opportunities
Strong socio-economic
impact on student performance

0
5
10
15
20
25
30
35
40
45
Singap
ore
Chinese Taipei
Hon
g Ko
ng‐China
Korea
Japa
nSw
itzerland
Belgium
Nethe
rland
sGerman
yPo
land
Cana
daFinlan
dNew
Zealand
Australia
Austria
Fran
ceCzech Re
public
OEC
D average
United Kingdo
mLuxembo
urg
Icelan
dSlovak Rep
ublic
Ireland
Portugal
Den
mark
Italy
Norway
Israel
Hun
gary
United States
Swed
enSpain
Russian…
Greece
Chile
Brazil
Mexico
%
Equity does not necessarily hamper qualityTab I.2.1a
UK
Across OECD, 13% of students are top performers (Level 5 or 6). They can develop and work with models for complex situations, and work strategically with advanced thinking and reasoning skills.

Likelihood of positive social and economic outcomes among highly literate adults
6 Benefits of high literacy Likelihood of positive outcomes among highly literate adults,
PIAAC 2012

Key levers for change and improvementThe Education Policy Outlook : A window into countries’
education systems
Equity and quality
Equity and quality
Preparingstudents for the
future
Preparingstudents for the
future
Schoolimprovement
Schoolimprovement
Evaluationand
assessment
Evaluationand
assessment

Key levers for change and improvementThe Education Policy Outlook: A window into countries’
education systems
Equity and quality
Equity and quality
Preparingstudents for the
future
Preparingstudents for the
future
Schoolimprovement
Schoolimprovement
Evaluationand
assessment
Evaluationand
assessment
Is the system equitable for its
students?

Reducing school failure pays off
Education failure imposes high costs to individuals and to society
It limits capacity of economies to grow and innovate
Damages social cohesion and mobility and is expensive:
Higher public health expendituresHigher welfare, increased criminality
.. and the crisis has brought equity to the forefront
0
10
20
30
40
50
60
70
80
Korea
Ja
pan
Switzerland
2.5 Belgium
3.9 Nethe
rland
s‐3.9 German
y‐7.7 Polan
d3.7 Can
ada
5.5 Finland
7.6 New
Zealand
5.3 Australia
Austria
0.7 OEC
D average
2003
5.7 France
4.4 Czech Rep
ublic
2.6 Luxem
bourg
6.5 Icelan
d7.5 Slovak Re
public
Irelan
d‐5.2 Portugal
Den
mark
‐7.3 Italy
Norway
5.1 Hun
gary
United States
9.8 Swed
en Spa
in‐10.2 Turkey
Greece
‐11.2 M
exico
Proportion of 15 year olds that do not reach a minimum level (below level 2), PISA 2003 and 2012
The challenge: that all students reach a minimum

The challenge: to reduce dropout rates% of individuals who have not completed upper secondary education by age group
0
10
20
30
40
50
60
70
80Ko
rea
Slov
ak R
epub
licCz
ech R
epub
licPo
land
Slov
enia
Cana
daSw
eden
Finlan
dSw
itzer
land
Austr
iaUn
ited S
tates
Israe
lEs
tonia
Germ
any
Hung
ary
Irelan
dDe
nmar
kCh
ileFr
ance
Luxe
mbou
rgNo
rway
Belgi
umAu
strali
aNe
therla
nds
Unite
d King
dom
OECD
aver
age
New
Zeala
ndGr
eece Italy
Icelan
dSp
ainPo
rtuga
lMe
xico
Turke
y
Perce
ntage
of po
pulat
ion
25-34 25-64

The challenge: to reduce the risk of low achievement due to personal circumstances (fairness)
Relative risk of scoring below in bottom quarter depending on personal circumstances, PISA 2012
Low
risk
Hig
h ris
k
0,0
0,5
1,0
1,5
2,0
2,5
3,0
Hun
gary
New
Zealand
Fran
ce
Israel
Belgium
German
y
Luxembo
urg
Chile
Den
mark
Austria
Portug
al
Czech Re
public
Spain
Poland
OEC
D average
Australia
Ireland
Switzerland
Greece
Sloven
ia
United States
Nethe
rland
s
Japa
n
Swed
en
Italy
Finlan
d
United…
Mexico
Cana
da
Norway
Turkey
Korea
Icelan
d
Estonia
Relative risk of sc
oring in bottom quarter in
PISA
mathe
matics 2
012
Students in the bottom quarter of the ESCS index Immigrant students

The mathematics gap between immigrant and native students
% of students above baseline level (level 3 or above by immigrant status, PISA 2012
0
10
20
30
40
50
60
70
80
90
100
Hon
g Ko
ng‐China
Singap
ore
Liechten
stein
Switzerland
Nethe
rland
sMacao
‐China
Estonia
Finlan
dGerman
yBe
lgium
Cana
daAu
stria
Luxembo
urg
Den
mark
Fran
ceIre
land
Sloven
iaAu
stralia
Czech Re
public
New
Zealand
OEC
D average
Icelan
dUnited Kingdo
mNorway
Spain
Portug
alLatvia
Italy
Swed
enRu
ssian Fede
ratio
nUnited States
Hun
gary
Israel
Croa
tiaGreece
Serbia
Kazakh
stan
Malaysia
Mon
tene
gro
Mexico
United Arab
Emira
tes
Costa Rica
Brazil
Argentina
Jordan
Qatar
Percen
tage of stude
nts a
bove th
e baseline level
(Level 3 or a
bove)
Non‐immigrant students Second‐generation students First‐generation students

Policies to achieve more equitable education systems and reduce dropout
Invest early and through upper secondary
Support low performing
disadvantaged schools
Eliminate system level obstacles to
equity
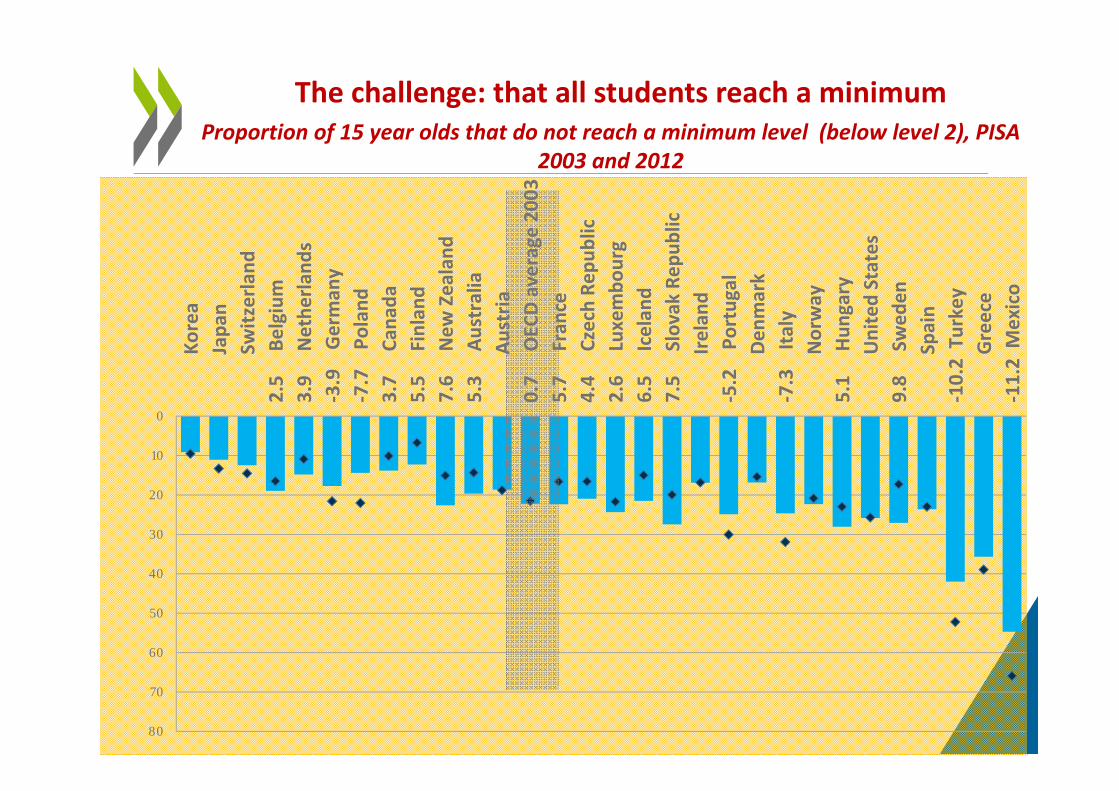
1) Avoid system level policies that hinder equity
More equitable
system level policies
ECECAustralia/Canada/Chile/Mexico/Nordic/France/
Spain
Comprehensive education and postpone tracking
Nordic/Austria/Germany
Equivalent upper secondary pathways
Nordic/Alberta Manage school choice to avoid
inequities Neths/Chile
Make funding responsive to
needs Chile/Netherlands/Australia/On
tario

Policy options to postpone tracking to upper secondary
Comprehensive school to upper secondary
Suppress low-level tracksSuppress low-level tracks
Limit selection to specific subjects or flexible settings

Upper secondary pathways
0
10
20
30
40
50
60
70
80
90
100
Austria
Czech Re
public
Belgium
Slovak Rep
ublic
Finland
Nethe
rland
sSw
itzerland
Sloven
iaLuxembo
urg
Italy
Swed
enNorway
Germany
China
Russian Fede
ratio
nAu
stralia
Denm
ark
Poland
OEC
D average
France
Spain
Turkey
New
Zealand
Portugal
Israel
Ireland
Chile
Iceland
Estonia
Greece
United Kingdo
mHu
ngary
Korea
Japan
Brazil
Mexico
Canada
India
Percen
tage of stude
nts
General Vocational
Braz
il
India
Enrolment in upper secondary by programme

Upper secondary pathways: promote more work‐oriented skills
Academic and vocational tracks
should be
equivalent to ensure
transferability and avoid dead ends
VET should provide high level
generic skills in addition to professional
Guidance and counselling
services need to engage more fully
with the
world of work
+ strategies for those at risk of dropping out
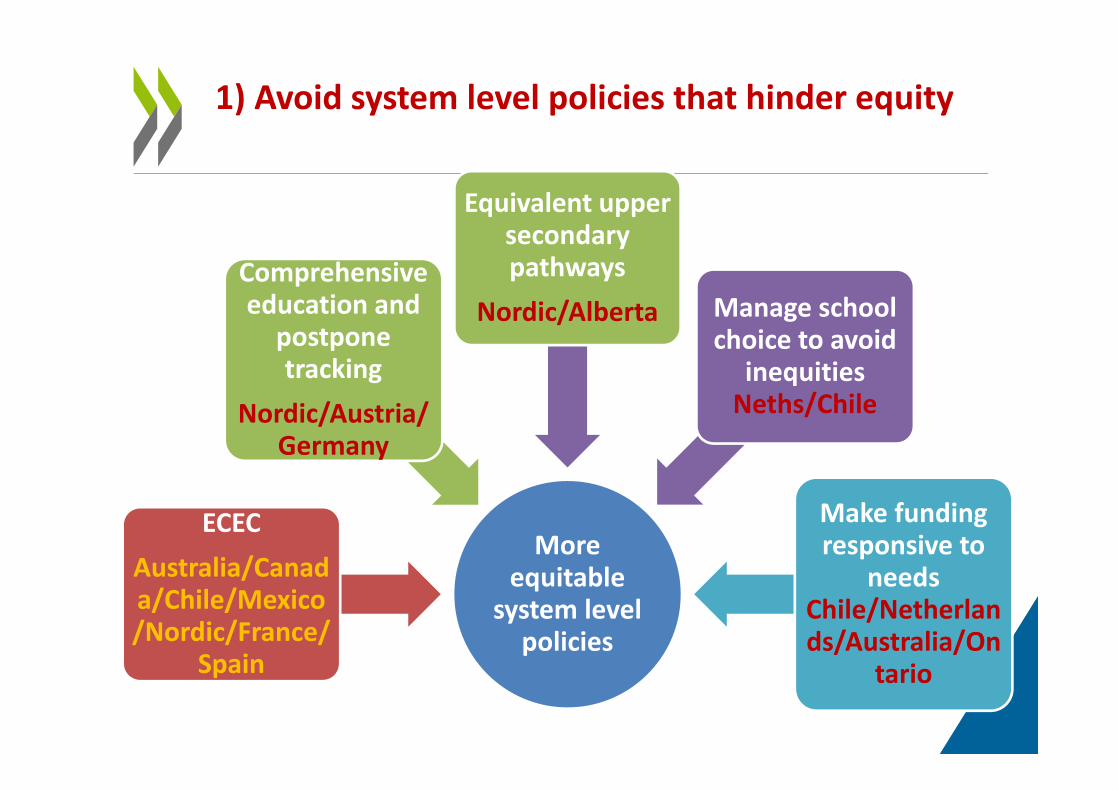
Manage school choice
Opt for higher quality
schools, and might foster efficiency, spur
innovation and raise quality overall.
Choice can result in a greater sorting and
segregationof students by ability, income and ethnic
background.
Choice
Equity

-1,50
-1,30
-1,10
-0,90
-0,70
-0,50
-0,30
-0,10
0,10
0,30
0,50
Mex
ico
New
Zea
land
Turk
eyU
nite
d S
tate
sA
ustra
liaC
hile
Sw
eden
Isra
elIre
land
Gre
ece
Pola
ndC
anad
aJa
pan
OE
CD
ave
rage
Luxe
mbo
urg
Icel
and
Bel
gium
Fran
ceS
witz
erla
ndP
ortu
gal
Spai
nD
enm
ark
Italy
Cze
ch R
epub
licN
ethe
rland
sE
ston
iaH
unga
ryS
love
nia
Aus
tria
Sin
gapo
reKo
rea
Ger
man
yU
nite
d K
ingd
omN
orw
ayFi
nlan
d
Mea
n in
dex
diffe
renc
e
Difference between socio-economically disadvantaged and socio-economically advantaged schools
Educational resources are more problematic in disadvantaged schools in most countries
Advantaged and private schools reported better educational resources
Disadvantaged and public schools reported better educational resources
Fig IV.3.8

Make funding more responsive to needs
Take into consideration
that the instructional
costs of disadvantaged students may be
higher
Targeting resources to areas with a
high concentration of low performing disadvantaged
students

Policies to achieve more equitable education systems and reduce dropout
Invest early and through upper secondary
Support low performing
disadvantaged schools
Eliminate system level obstacles to
equity

Insufficient systemic support
Schools’ inadequate response to student needs
Insufficient support for
staff
Poor manageme
nt
Impact of student’s socio‐
economic backgroun
d
Wider range of abilities
Challenging school climate
Poor school
environments
Disadvantaged schools are confronted to multiple challenges
Demanding learning
environment
Inadequate support systems

Students may have different opportunities depending on schools they attend
24
0,0
0,5
1,0
1,5
2,0
2,5
3,0
3,5
4,0
4,5
Nethe
rland
sHu
ngary
Belgium
Luxembo
urg
Germany
Sloven
iaAu
stria
Israel
Japan
Greece
Slovak Rep
ublic
Italy
Ireland
Korea
Portugal
OEC
D average
Czech Re
public
New
Zealand
Chile
United States
Mexico
United Kingdo
mAu
stralia
Spain
Turkey
Denm
ark
Poland
Switzerland
Canada
Iceland
Swed
enEstonia
Finland
Norway
Students in socio‐economically disadvantaged schools
Students in socio‐economically average schools
Students in socio‐economically advantaged schools
Relative risk of scoring in the bottom quarter of the performance distribution, PISA 2012

2) Support low performing disadvantaged schools
Supporting disadvantaged
schools
General strategies
IRL/FIN/AUST/N. ZEAL/GER
Supportive school
climates/dataH.
PERF./DK/FR
Quality professionalsAUSTR/NOR
Effective classroom strategies
Parental and community engagementMX/NETH

Examples of systemic support to disadvantaged groups/schools
•OFIP targeted support to schools•2002/03- 2010/11: from 19% to 6% reduction .
Ontario
•Smarter schools national partnership for disadvantaged schools
•Aboriginal and torres islanders action plan.
Australia
•Ireland Delivering Equality of Opportunity (DEIS, 2005)
•System for identifying levels of disadvantage and providing tailored support
•n Schools (DEIS, 2005):
Ireland
•Maori and pasifika islanders strategy
•Cultural competencies for teachers
New Zealand
•Action programme to promote equal opportunity in education(2013) lower gender differences, impact of SES and disadvantaged.
•One year preparatory education for immigrants (2014).
Finland
•Québec “Act differently”:•Database of effective practices for intervention to develop schools’ expertise (189 schools in 2007/08).
•School boards, through resources and coordination, support the school leadership team.
Quebec
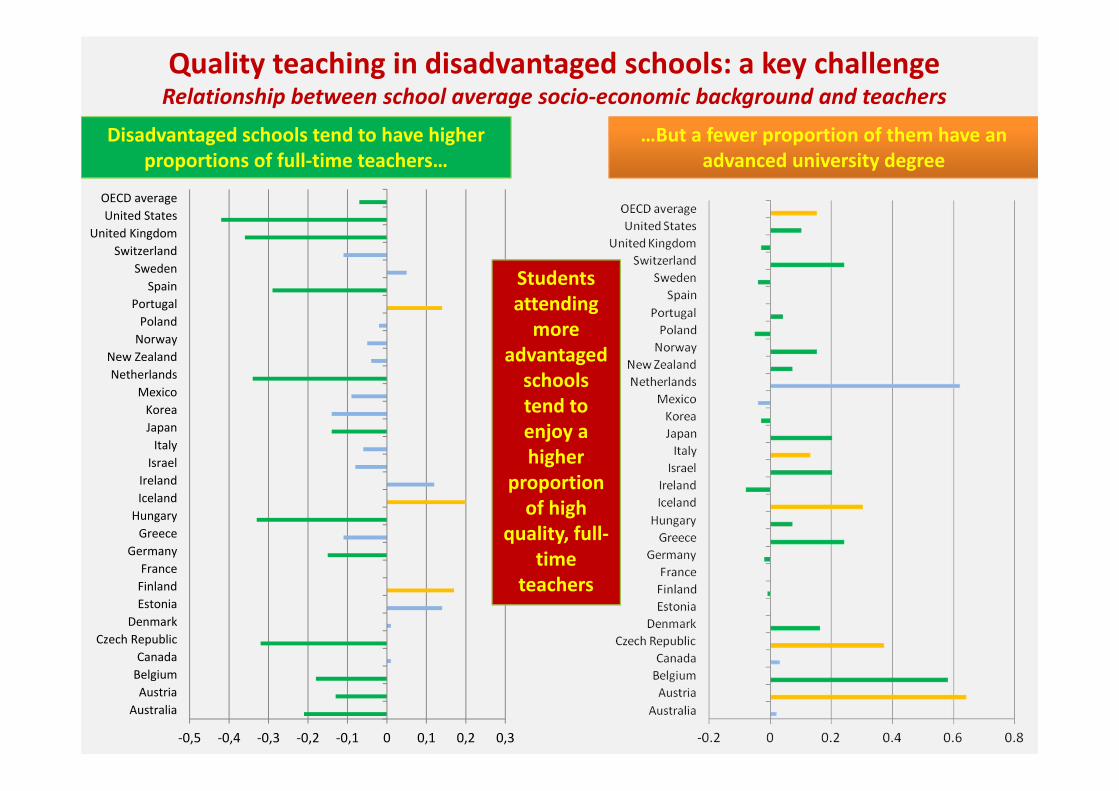
Quality teaching in disadvantaged schools: a key challengeRelationship between school average socio‐economic background and teachers
‐0,5 ‐0,4 ‐0,3 ‐0,2 ‐0,1 0 0,1 0,2 0,3
AustraliaAustriaBelgiumCanada
Czech RepublicDenmarkEstoniaFinlandFrance
GermanyGreece
HungaryIcelandIrelandIsraelItaly
JapanKorea
MexicoNetherlandsNew Zealand
NorwayPoland
PortugalSpain
SwedenSwitzerland
United KingdomUnited StatesOECD average
Disadvantaged schools tend to have higher proportions of full‐time teachers…
…But a fewer proportion of them have an advanced university degree
Studentsattendingmore
advantagedschoolstend to enjoy a higher
proportion of high
quality, full‐time
teachers

Disadvantaged schools face difficulties in attracting and retaining staff
• Teachers in schools with higher proportions of low-SES or minority students have higher propensity to leave.
United States
• Rural schools with higher proportions of aboriginal students are seen as less desirable, making it harder to recruit and retain teachers.
Australia
• School leaders report that it is difficult to recruit and retain teachers to work in schools with children born abroad.
Japan
• Teachers in schools with higher proportions of low socio-economic status students have higher propensity to leave.
New Zealand
• Schools with higher levels of minority students harder to staff and teachers are significantly more likely to leave.
Norway
• Better qualified teachers are less likely to teach in schools containing minority and disadvantaged children.
France

More effective classroom strategies for disadvantaged students
Effective classroom strategies
Diversified and flexible pedagogic strategies
Summative and
formative assessment
Curriculum with high
expectations

Policies to achieve more equitable education systems and reduce dropout
Invest early and through upper secondary
Support low performing
disadvantaged schools
Eliminate system level obstacles to
equity
No single model for success in the implementation of education reforms Reforms are specific to country’s education system context.
Some factors for effective implementation:
Placing the student and learning at the centre;
Invest in capacity‐building; Leadership and coherence; Stakeholder engagement; Clear and actionable plans.

Main sources for further information at OECD
Education Policy Outlookwww.oecd.org/edu/policyoutlook.htmwww.oecd.org/edu/equity

Context
Reforms
Challenges
Education Policy Outlook: Country ProfilesA comparative OECD insight into a country’s context, challenges and policy responses

For further information at OECD Education: Beatriz Pont, [email protected]
www.oecd.org/edu/policyoutlook.htm
www.oecd.org/pisa