Embed Size (px)
Citation preview

OECD CAPITAL MARKET SERIES
OECD Capital Market Review of Romania 2021
Mapping Report


OECD Capital Market Review of Romania 2021
MAPPING REPORT

This work is published under the responsibility of the Secretary-General of the OECD. The opinions expressed and arguments employed herein do not necessarily reflect the official views of OECD member countries. This document, as well as any data and any map included herein, are without prejudice to the status of or sovereignty over any territory, to the delimitation of international frontiers and boundaries and to the name of any territory, city or area.
© OECD 2021
Please cite this report as: OECD (2021), OECD Capital Market Review of Romania 2021: Mapping Report, OECD Capital Market Series. http://www.oecd.org/corporate/OECD-Capital-Market-Review-Romania.htm
This report was produced with the financial assistance of the European Commission via the Directorate General for Structural Reform Support (DG REFORM). The views expressed herein can in no way be taken to reflect the official opinion of the European Union.
This report is part of the OECD Capital Market Series. More information about the series is available at: www.oecd.org/corporate/capital-markets

OECD Capital Market Review of Romania 2021: Mapping Report 3
ABOUT THIS REPORT
In the years before the COVID-19 pandemic, Romania enjoyed strong economic growth which reduced the gap in terms of income per capita with high-income European Union (EU) economies and resulted in a decline in unemployment. The pandemic-induced crisis has halted this trend and caused financial challenges for many companies due to sharp declines in revenues. The crisis has also revealed a number of long-term structural challenges in the Romanian corporate sector and capital markets. In particular, unlike many other economies, the Romanian corporate sector did not have access to long-term market-based financing during 2020. The recovery phase and the long-term strength of the Romanian corporate sector are dependent on providing corporations with access to a wider range of financing options, such as equity and corporate bonds, and a more dynamic capital market. In particular, a better balance between traditional bank lending and corporate access to sources of market-based financing will help advance Romania’s integration into the European financial system. Against this background, the Romanian Financial Supervisory Authority in collaboration with the Ministry of Finance has requested support from the European Commission under the Structural Reform Support Programme to undertake a comprehensive review of capital markets in Romania and to develop a national capital market strategy. The OECD was designated as the implementing partner for the project. The OECD’s work will lead to a Final Report which will include a mapping of capital markets in Romania, an assessment of the main issues identified and policy recommendations on how to improve Romanian companies’ use of market-based financing. The final report is expected to inform and guide the preparation of a Romanian capital market strategy for growth. This Mapping Report is a first step towards building a comprehensive diagnostic of the Romanian capital markets.
In preparation of this report, the OECD Secretariat conducted substantive research to understand the trends and the functioning of capital markets in Romania. A detailed description of data sources and the methodology for data collection and analysis are provided in the Annex. The content and methodologies in this report will be further refined in discussion with
Romanian authorities, market participants and experts. The OECD Secretariat welcomes any comments and suggestions. The Report was prepared by a team led by Serdar Çelik, Acting Head of Corporate Governance and Corporate Finance Division within the OECD Directorate for Financial and Enterprise Affairs, composed of Adriana De La Cruz, Carl Magnus Magnusson, Alejandra Medina, Tugba Mulazimoglu and Yun Tang. The report was produced with the financial assistance of the European Commission via the Directorate-General for Structural Reform Support (DG REFORM).


OECD Capital Market Review of Romania 2021: Mapping Report 5
TABLE OF CONTENTS
ABOUT THIS REPORT .................................................................................................................3
EXECUTIVE SUMMARY ............................................................................................................. 11
CHAPTER I. THE ROMANIAN CORPORATE SECTOR ................................................................ 15
1.1. Overview of the economy................................................................................................... 15
1.2. Business demographics ..................................................................................................... 22
1.3. Company categories in Romania ........................................................................................ 26
1.4. Non-financial company performance and profitability ........................................................... 30
1.5. Leverage levels ................................................................................................................. 33
1.6. Capitalisation and equity capital misallocation ..................................................................... 36
1.7. The impact of COVID-19 on the corporate sector................................................................. 40
1.8. Government relief programmes to the corporate sector ........................................................ 42
CHAPTER II. THE ROMANIAN PUBLIC EQUITY MARKET ........................................................... 45
2.1. Stock market developments in Romania ............................................................................. 45
2.2. Stock market infrastructure ................................................................................................ 46
2.3. Segments of the regulated market in the exchange.............................................................. 47
2.4. Overview of the listed corporate sector ............................................................................... 49
2.5. Trends in initial public offerings........................................................................................... 51
2.6. Trends in secondary public offerings ................................................................................... 53
2.7. Trends in secondary stock market activity ........................................................................... 55
2.8. Investors and ownership structure in the Romanian stock market ......................................... 56
CHAPTER III. CORPORATE BOND MARKET IN ROMANIA ......................................................... 59
3.1. Trends in corporate bond issuance ..................................................................................... 59
3.2. Investors in non-financial corporate bonds .......................................................................... 62
3.3. Market segments for corporate bond listing in Romania ....................................................... 63
CHAPTER IV. PRIVATE CAPITAL MARKET ................................................................................ 65
4.1. Overview of private equity activity in Romania ..................................................................... 65
4.2. Fundraising, investment and divestment trends ................................................................... 67
REFERENCES ........................................................................................................................... 73
ANNEX – METHODOLOGY FOR DATA COLLECTION AND CLASSIFICATION ............................ 76

6 OECD Capital Market Review of Romania 2021: Mapping Report
FIGURES
Figure 1. GDP growth in Romania and selected European countries.................................................................... 16 Figure 2. Inflation and unemployment .................................................................................................................... 16 Figure 3. GDP growth contribution and current account composition in Romania................................................. 17 Figure 4. Investment trends in Romania and selected European countries........................................................... 18 Figure 5. Labour productivity and wage share ....................................................................................................... 20 Figure 6. Banking sector loan trends in Romania and selected European countries............................................. 21 Figure 7. Fiscal balance and gross public debt of Romania .................................................................................. 22 Figure 8. Employment distribution by firm size ...................................................................................................... 24 Figure 9. Labour productivity by firm size .............................................................................................................. 25 Figure 10. Employment distribution in Romania by company size and industry .................................................... 25 Figure 11. Labour productivity by firm size for selected industries ........................................................................ 26 Figure 12. Company categories’ contribution to sales and employment by industry ............................................. 29 Figure 13. Growth in the number of companies and median asset size ................................................................ 30 Figure 14. Profitability and sales of Romanian non-financial companies ............................................................... 31 Figure 15. Median ROE and share of loss-making companies by category .......................................................... 31 Figure 16. Share of loss-making companies by industry ....................................................................................... 32 Figure 17. Profitability of non-financial companies for Romania and selected European countries ...................... 32 Figure 18. Leverage of Romanian non-financial companies .................................................................................. 33 Figure 19. Short and long-term debt of non-financial companies in Romania and selected European countries . 33 Figure 20. Aggregate leverage levels by company categories in Romania ........................................................... 34 Figure 21. Leverage measured as total liabilities as a share of total assets .......................................................... 35 Figure 22. Share of firms with high debt-to-EBITDA ratio ...................................................................................... 36 Figure 23. Capitalisation levels for different categories of Romanian companies.................................................. 37 Figure 24. Company capitalisation for Romania and selected European countries............................................... 38 Figure 25. Share of zombie and negative-equity companies in the Romania ........................................................ 38 Figure 26. Share of zombie and negative-equity companies across different groups ........................................... 39 Figure 27. Companies with negative equity in Romania and selected European countries .................................. 39 Figure 28. Economic sentiment and confidence across industries in Romania and EU-27 ................................... 40 Figure 29. Financial market indicators in Romania ................................................................................................ 41 Figure 30. Quarterly sales YoY changes 2019-2020 ............................................................................................. 42 Figure 31. Industry composition, by number of companies.................................................................................... 50 Figure 32. Newly listed and delisted companies .................................................................................................... 51 Figure 33. Initial public offerings ............................................................................................................................ 52 Figure 34. Industry distribution of IPOs by total proceeds ..................................................................................... 53 Figure 35. Secondary public offerings.................................................................................................................... 54 Figure 36. Romanian SPOs ................................................................................................................................... 54 Figure 37. Industry distribution of SPOs by total proceeds .................................................................................... 55 Figure 38. Stock market turnover ratio ................................................................................................................... 55 Figure 39. Industry composition of listed companies in Romania .......................................................................... 56 Figure 40. Ownership landscape at the country level ............................................................................................ 56 Figure 41. Ownership concentration ...................................................................................................................... 57 Figure 42. Public sector and institutional investor ownership in Romania ............................................................. 58 Figure 43. Corporate ownership in Romania ......................................................................................................... 58 Figure 44. Global corporate bond issuances ......................................................................................................... 59 Figure 45. Corporate bond issuances by non-financial European companies ....................................................... 60 Figure 46. Corporate bond issuances by companies from CEE countries and Romania ...................................... 60 Figure 47. Corporate bonds issued by non-financial companies in Romania and selected European countries .. 61

FIGURES
OECD Capital Market Review of Romania 2021: Mapping Report 7
Figure 48. Characteristics of corporate bonds by total proceeds ........................................................................... 62 Figure 49. Ownership of outstanding non-financial corporate bonds .................................................................... 63 Figure 50. Corporate bond issuance in the Romanian market............................................................................... 64 Figure 51. Characteristics of non-financial corporate bonds .................................................................................. 64 Figure 52. Private equity activity in CEE region and Europe ................................................................................. 66 Figure 53. Private equity activity in Romania as share in CEE region ................................................................... 67 Figure 54. Private equity activity in Romania and selected European countries ................................................... 67 Figure 55. PE fundraising by origin of investors in Romania and selected European countries ............................ 68 Figure 56. PE fundraising by type of investors in Romania and selected European countries .............................. 69 Figure 57. PE investment in Romania and selected European countries .............................................................. 70 Figure 58. PE investment by industry in Romania and selected European countries............................................ 71 Figure 59. PE divestment volume in CEE Region and Romania ........................................................................... 71 Figure 60. PE divestment by exit forms in Romania and selected European countries ........................................ 72

8 OECD Capital Market Review of Romania 2021: Mapping Report
TABLES
Table 1. Key Economic Indicators for Romania ..................................................................................................... 15 Table 2. Company distribution by firm size ............................................................................................................ 23 Table 3. Comparison of the OECD-ORBIS Corporate Finance dataset and the Eurostat universe ...................... 27 Table 4. Company categories of the non-financial business sector in Romania.................................................... 29 Table 5. Key dates and developments for the Bucharest Stock Exchange ........................................................... 46 Table 6. Main Market admission requirements ...................................................................................................... 47 Table 7. AeRO Market admission requirements .................................................................................................... 48 Table 8. Post-listing requirements.......................................................................................................................... 49 Table 9. Fees in the Bucharest Stock Exchange ................................................................................................... 49 Table 10. Number of listed companies................................................................................................................... 50 Table 11. Romanian IPOs ...................................................................................................................................... 52 Table 12. Listing requirements and targeted investors .......................................................................................... 63

OECD Capital Market Review of Romania 2021: Mapping Report 9
ACRONYMS AND ABBREVIATIONS
ASF Autoritatea de Supraveghere Financiară (Financial Supervisory Authority) ATS alternative trading system AUM assets under management BSTDB Black Sea Trade and Development Bank BNR Banca Naţională a României (National Bank of Romania) BVB Bursa de Valori Bucuresti (Bucharest Stock Exchange) CCP central counterpart CEE Central and Eastern Europe CPI consumer price index CSD central securities depository
DEG German Investment and Development Society DVP delivery versus payment EBITDA earnings before interest, taxes, depreciation, and amortisation EBRD European Bank for Reconstruction and Development EC European Commission ECB European Central Bank EDC European Data Cooperative EIB European Investment Bank EIF European Investment Fund EU European Union FDI foreign direct investment FEAS Federation of Euro-Asian Stock Exchanges FESE Federation of European Securities Exchanges FNGCIMM Fondul National de Garantare a Creditelor pentru Intreprinderile Mici si Mijlocii FMO Netherlands Development Finance Company FSA financial service authority GAAP Generally Accepted Accounting Principles GDP gross domestic product GFCF gross fixed capital formation IFRS International Financial Reporting Standards IPO initial public offering IRIS issuers reporting information system ISIC international standard industrial classification of all economic activities IMF International Monetary Fund MTF multilateral trading facility MTS multilateral trading system NPL non-performing loan OECD Organisation for Economic Co-operation and Development PE private equity PPP purchasing power parity PPS purchasing power standards R&D research and development REIT real estate investment trust ROA return on assets ROE return on equity

ACRONYMS AND ABBREVIATIONS
10 OECD Capital Market Review of Romania 2021: Mapping Report
RON Romanian Leu SA Societate pe Actiuni (joint-stock company in Romania) S&G Stability and Growth Pact SME small and medium-sized enterprise
SOE state-owned enterprise SPO secondary public offering (follow-on offering) VAT value-added tax WFE World Federation of Exchanges

OECD Capital Market Review of Romania 2021: Mapping Report 11
EXECUTIVE SUMMARY
As in all countries, the COVID-19 crisis has had a dramatic impact on the Romanian corporate sector and the economy at large. The outbreak and related containment measures affected the activity in almost all sectors of the economy. In the second quarter of 2020, all industries among the listed companies on the Bucharest Stock Exchange, except the technology industry, experienced sharp reductions in sales. The economy contracted in the last three quarters compared to the previous year, although the decline was less pronounced following the easing of containment measures in May. In order to help corporations cope with the crisis, the Romanian government has adopted a range of support measures spanning from deferral of payments and loan guarantees to direct financial aid. In many economies around the world, capital markets are playing a key role in helping companies access the financing needed to navigate through the COVID-19 crisis and to mitigate liquidity shortages. For instance, long-term corporate bond borrowing by non-financial companies globally reached record highs in 2020. The number of companies and the amount of money raised through public equity markets were also significantly higher than previous years. In Romania, however, the use of market-based financing by the corporate sector since the outbreak of the pandemic has been very limited. In 2020, there were no new equity listings on the domestic market and only a few companies issued bonds. Looking ahead, it is crucial to facilitate Romanian companies’ access to affordable market-based financing. This will not only help strengthen the long-term resilience of the corporate sector and help companies endure future shocks, but it will also improve Romanian business dynamics and support innovation. Well-functioning capital markets will also provide additional options for managing household savings and the pension system. This mapping report includes the following key findings:
Investment in Romania has been on a downward trajectory since the 2008 financial crisis. Still, compared with regional peers the headline figures remain favourable, with a split between business, public and household investment similar to that of the EU average. However, compared with other EU economies, non-financial corporate investment in Romania appears to be concentrated in a much smaller number of firms, as the country has one of the lowest shares of companies in the economy investing. Importantly, research and development expenditure as a share of GDP has been around 0.5% since 2010. This is less than a quarter of the EU average and around one-seventh of Germany and Austria’s levels.
Labour productivity growth (measured as GDP per hour worked) in Romania was strong in the past decade, far outpacing regional peers and more advanced European economies. It should be noted, however, that labour productivity started from a significantly lower level than that of peer countries (for example, in 2010, USD 23 was produced for each hour worked in Romania, compared to USD 36 in the Czech Republic and USD 61 in Germany). As a result, and despite the strong growth, labour productivity remains low compared to the Central and Eastern European (CEE) region as well as in a broader European context. Notably, the productivity level of
EXECUTIVE SUMMARY
12 OECD Capital Market Review of Romania 2021
medium-sized and large Romanian companies was on average more than USD 30 thousand below that of similar companies in other European economies.
The corporate sector in Romania was severely hit by the 2008 financial crisis, as sales dropped by 14% in 2009, profit margins fell from 3% to 1% and aggregate return on equity (ROE) from 8% to 3%. After remaining at lower levels for a number of years, the aggregate profitability ratios started to pick up gradually in 2013, reaching pre-crisis levels in 2018. Sales growth, however, has remained subdued compared to pre-2008 levels.
At 14%, Romania had the highest ratio of negative-equity firms – companies with higher liabilities than assets – among European peer countries in 2018. The value of their assets made up 8% of total non-financial corporate assets, which is also significantly higher than in peer countries. According to the National Bank of Romania, by the end of 2019, the capital needs of non-financial companies with negative equity amounted to 16.8% of Romanian GDP. Moreover, negative-equity companies made up 67% of overdue payments in the economy and around 35% of non-performing loans from local credit institutions.
Romanian non-financial companies’ leverage ratios have decreased gradually over the past decade. This drop has primarily been a result of a decline in long-term debt and driven by highly leveraged companies lowering their indebtedness. Firm-level data analysis shows that the Romanian corporate sector has a relatively lower level of indebtedness compared with other European countries. This is consistent with the fact that the bank credit stock to the corporate sector in Romania is one of the lowest in the region at around 26% of GDP. On the other hand, when non-financial debt such as trade payables is included, total liabilities accounts on average for 60% of total assets for Romanian companies. Importantly, as of 2018, the average share of short-term liabilities to total liabilities for Romanian companies was 65%, compared to 23% in Austria and 46% in Germany. Further, Romanian non-financial companies are heavily dependent on non-resident creditors and foreign currency debt.
As in other markets around the world, the listed corporate sector in Romania suffered a large contraction in valuations as volatility in financial markets increased in the first phase of the COVID-19 crisis. The local index of the Bucharest Stock Exchange (BVB) saw a sharp contraction of 30% from the end of 2019 to its lowest index value in March. However, by the end of 2020, the domestic index had almost recovered its value compared to the start of the year, a rebound faster than those in Hungary and the Czech Republic.
Since 2000, 18 Romanian companies have conducted initial public equity offerings (IPO), raising total proceeds of EUR 1.3 billion. From 2000 to 2009, 11 companies went public, but the proceeds accounted for only 16% of the amount raised over the entire 2000-2019 period. During the 2010-2017 period, 7 companies raised 84% of the total proceeds (EUR 1.1 billion). No companies have gone public since 2018. It is noteworthy that among the largest five IPOs since 2000, four were state-owned companies from the Utilities and Energy industries.
Private corporations and holding companies is the largest investor category in the Romanian stock market, holding 30% of the listed equity. Their relative importance as owners in the equity market is much higher compared to other European peer markets. The public sector ranks close second, holding 29% of the total market capitalisation. Institutional investors own only 15% of the total market capitalisation compared to 29% in Poland and 34% in Hungary. In addition, the ownership structure is fairly

EXECUTIVE SUMMARY
OECD Capital Market Review of Romania 2021: Mapping Report 13
concentrated in Romania as in six out of ten listed companies, the largest single shareholder holds over 50% of the equity capital.
While the past decade has seen a remarkable increase in corporate bond issuance by non-financial companies worldwide, in Romania and in the CEE region corporate bond activity has remained relatively low. In Europe the issuance increased by 46% in real terms after the 2008 financial crisis period compared with the previous decade. However, in the overall CEE region, proceeds from corporate bond issues between 2009 and 2019 amounted to just 0.4% of GDP. This is well below the European level of 2%. The same ratio for Romania was only 0.01% compared to 0.3% for Hungary and 0.5% for Poland. It is important to note that since the launch of the Romanian AeRO market by BVB in 2015, which is designed for SMEs, the number of issues has increased dramatically while the total amounts raised remained low due to smaller issue sizes. With respect to the investor base, domestic investors hold only 8% of corporate bonds issued by Romanian non-financial corporations, which is much lower than peer countries.
Private equity (PE) and venture capital activity in the CEE region has been far below general European levels. For instance, the overall value of private equity investments in Europe was 0.53% of GDP in 2019, whereas the corresponding figure for the CEE region was 0.17%. In Romania, between 2007 and 2019 private equity firms raised a total amount of EUR 222 million. This represented only 1% of the total amount of private equity capital raised in the CEE region and was well below Romania’s average annual share in CEE GDP for the same period (11.7%). Importantly, funds of funds, which play a significant role in other European markets, have not been active in the Romanian PE market. Between 2007 and 2019, 69% of the committed capital in Romania was raised from non-domestic European investors – a ratio twice as high as the average CEE level. Unlike the fundraising activity trends, however, Romania’s share in PE investments in the region was significantly higher at 11%.


OECD Capital Market Review of Romania 2021: Mapping Report 15
CHAPTER I. THE ROMANIAN CORPORATE SECTOR
Romania had a period of strong economic growth in the five years up to 2020, which helped the country improve living standards and reduce unemployment. However, it has had twin fiscal and current account deficits for the past two decades, and investment growth has lagged general economic growth. Further, competitiveness is held back by shortcomings such as lack of skills, poor innovation and uncertainty with respect to the regulatory environment. At the same time, the financial system is heavily bank-dependent, in particular on foreign-owned banks, while capital markets play a very limited role in providing financing to the non-financial corporate sector. This chapter provides indicators and analysis of non-financial Romanian companies’ demographics, capital structure and long-term performance. Although some data in the chapter represent the pre-COVID-19 landscape, they still provide useful insights for understanding the underlying structural challenges facing the Romanian economy and the corporate sector.
1.1. Overview of the economy
Economic growth in Romania was on average 4.7% per year between 2015 and 2019, leading to lower unemployment and improved per capita income levels converging towards those of advanced European economies (Table 1).
Table 1. Key Economic Indicators for Romania
2010 2011 2012 2013 2014 2015 2016 2017 2018 2019
Real GDP growth (%) (3.9) 1.9 2.0 3.8 3.6 3.0 4.7 7.3 4.5 4.1 Real GDP per capita (Euro, PPS, thousands) 12.8 13.3 14.0 14.3 14.8 15.5 16.9 18.7 19.9 21.6 Unemployment rate (%) 7.0 7.2 6.8 7.1 6.8 6.8 5.9 4.9 4.2 3.9 Headline inflation (%) 6.1 5.8 3.3 4.0 1.1 (0.6) (1.6) 1.3 4.6 3.8 Labour productivity growth (%) (2.0) 3.9 2.7 4.7 3.4 5.6 4.6 6.0 4.1 3.9 Fiscal balance (% of GDP) (6.9) (5.4) (3.7) (2.1) (1.2) (0.6) (2.6) (2.6) (2.9) (4.4) Primary fiscal balance (% of GDP) (5.6) (4.0) (2.3) (0.7) 0.2 0.7 (1.4) (1.6) (2.0) (3.5) Gross government debt to GDP (%) 29.6 34.0 37.1 37.6 39.2 37.8 37.4 35.1 34.7 35.3 Current account balance (% of GDP) (5.2) (5.0) (4.9) (0.9) (0.2) (0.5) (1.4) (2.7) (4.3) (4.6) Investment (GFCF, % of GDP) 26.1 27.2 27.5 24.7 24.4 24.8 22.9 22.4 21.1 23.6 Non-performing loans to total lending (%) 11.9 14.3 18.2 21.9 20.7 13.4 9.7 6.6 5.0 4.3
Source: Romanian National Institute of Statistics, OECD Economic Outlook 108, OECD Productivity Statistics, Eurostat, World Bank.
Even including the global crises of 2008 and 2020, which had significant impacts on Romanian economic growth, the economy has been expanding by an average of 3.7% annually in real terms since 2000, far above the EU average (Figure 1, Panel A). The economy grew at 6.1% per annum from 2000 to 2008, followed by a protracted downturn after the 2008 crisis and the subsequent European sovereign debt crisis. It was only in recent years that it began to pick up again, reaching 7.3% in 2017. Prior to the pandemic, this development appeared set to continue into 2020, as real GDP in Q1-2020 was 2.4% higher than the same quarter in 2019. However, as an effect of the pandemic-induced crisis, Romania’s real GDP growth for

CHAPTER I. THE ROMANIAN CORPORATE SECTOR
16 OECD Capital Market Review of Romania 2021: Mapping Report
2020 was -3.9%. This is set to recover modestly with GDP reaching its pre-crisis level only in 2022. While Romania’s per capita real GDP is still low compared with more advanced European countries and in the lower range of CEE peers, the growth in recent years has led to a convergence towards general EU levels (Figure 1, Panel B).
Figure 1. GDP growth in Romania and selected European countries A. Real GDP growth B. Real GDP per capita, % of EU27
Note: In Panel A, the figures provided in dashed lines for the 2021 and 2022 are OECD forecasts. Source: Romanian National Institute of Statistics, OECD Economic Outlook 108, Eurostat.
After remaining persistently elevated at around 7% between 2000 and 2015, the Romanian unemployment rate began to decrease gradually in 2016, falling to a record low of 3.9% in 2019. However, this is partly an effect of a sustained decrease in the labour force following a reduction in the working age population coupled with outward migration of skilled labour (EC, 2019a; EC, 2020). The current structure of the labour force has been cited as leading to challenges in the recruitment process and driving the wage growth in the country (EC, 2019a). Further, as a result of the COVID-19 crisis, unemployment has increased markedly, reaching 5.0% in 2020 (Figure 2, Panel A).
Figure 2. Inflation and unemployment A. Headline inflation and unemployment in
Romania B. CPI changes between 2008 and 2019
(2008=100)
Source: Romanian National Institute of Statistics and OECD Economic Outlook 108 for Panel A; Eurostat for Panel B.
-7%
-3%
1%
5%
9%
2008 '10 '12 '14 '16 '18 '20 '22E
EU27 Romania
0%
30%
60%
90%
120%
150%
2000 '05 '10 '15 '19
Romania Germany
Austria Poland
Czech Republic Hungary
% of EU27
0%
2%
4%
6%
8%
10%
-5%
5%
15%
25%
35%
45%
55%
2000 '05 '10 '15 '20
Headline inflationUnemployment (RHS)
85
100
115
130
145
Romania Germany Austria Poland CzechRepublic
Hungary
2019 2015 2008

CHAPTER I. THE ROMANIAN CORPORATE SECTOR
OECD Capital Market Review of Romania 2021: Mapping Report 17
Simultaneously, price inflation in Romania has fallen from high levels in the early 2000s to more subdued levels since the 2008 financial crisis, in line with the more general European pattern of pervasive low inflation (Figure 2, Panel A). Still, in 2019 price inflation in Romania was the highest among EU countries (Eurostat, 2021a). Indeed, between 2008 and 2019 consumer prices saw a cumulative increase of almost 40%, the highest among peer countries (Figure 2, Panel B). Despite a period of deflation in 2015 and 2016, in recent years there are signs that inflation has begun to increase again, driven by hikes in food and energy prices as well as internal factors (EC, 2019a). GDP growth in Romania over the past decade was driven by consumption. Of the cumulative real GDP contribution between 2012 and 2019, 91% was made up by consumption, with gross fixed capital formation (investment) representing only 16% (inventories and net exports contributed -6% and -4%, respectively). This consumption-led growth model has not only led to pressure on the current and fiscal accounts but is also hampering Romania’s sustainable economic convergence towards general EU living standards (EC, 2019a; EC, 2020). The sustainability of such a growth model is fragile if consumption is financed with debt or driven by a wealth effect resulting from e.g. a rise in real house prices. In both cases, future spending may be constrained as a result of deleveraging or a reversal in housing prices (Kharroubi and Kohlscheen, 2017).
The consumption-dependent growth is also reflected in the long-standing Romanian current account deficit, which is driven primarily by large goods imports, coupled with relatively low export growth (Figure 3, Panel B). The net export contribution to GDP growth has been negative in every year since 2014 (Figure 3, Panel A). These developments have contributed to the diminishing competitiveness of Romanian corporations in domestic and foreign markets (IMF, 2019a). Specifically, the average annual current account deficit since 2000 has been over 5%, with a corresponding goods deficit of almost 10%. This has been slightly offset by an average services export surplus of around 3.6% and an average secondary income surplus of 2.5%.
Figure 3. GDP growth contribution and current account composition in Romania A. GDP growth contribution B. Current account as share of GDP,
by components
Source: Romanian National Institute of Statistics for Panel A; Eurostat for Panel B.
Investment in Romania has been on a downward trajectory since the 2008 financial crisis (Figure 4, Panel A). Still, compared to regional peers the headline figures remain favourable,
-6%
-3%
0%
3%
6%
9%
2012 2013 2014 2015 2016 2017 2018 2019
Net exportsInventoriesGFCFFinal consumptionReal GDP change (YoY)
-30%
-20%
-10%
0%
10%
20%
2000 '05 '10 '15 '19
Secondary IncomePrimary IncomeServicesGoodsCurrent account balance
Share of GDP

CHAPTER I. THE ROMANIAN CORPORATE SECTOR
18 OECD Capital Market Review of Romania 2021: Mapping Report
with a split between business, public and household investment similar to that of the EU average (Figure 4, Panel B). Non-financial corporate investment has been improving since 2017, both in terms of shares of gross value added and when compared to peer countries. However, it should be noted that the investment rate only reflects fixed investment and as such is typically higher for less advanced economies that have a smaller capital stock to begin with (Figure 4, Panel C). Finally, compared to other EU economies, non-financial corporate investment in Romania appears to be concentrated in a much smaller number of firms, as the country has one of the lowest shares of domestic companies investing (Pal et al., 2019).
Figure 4. Investment trends in Romania and selected European countries A. Romania, investment by sector,
% of GDP B. Investment by sector, % of GDP,
average 2008-2019
C. Investment rate, non-financial corporations D. Research and development, % of GDP
Note: In Panel B gross fixed capital formation consists of resident producers' acquisitions, less disposals of fixed assets plus certain additions to the value of non-produced assets realised by productive activity, such as improvements to land. In Panel C the gross investment rate is defined as gross fixed capital formation divided by gross value added. Data for Hungary are unavailable in Panel C. Research and development in Panel D covers basic and applied research as well as experimental development. Source: Eurostat for Panels A, B, C; World Bank for Panel D.
To compare the level of intangible investment across economies, research and development (R&D) expenditure is a relevant indicator. Romania shows by far the lowest level of R&D as a share of GDP among its peers at around 0.5% annually since 2010. This is less than a quarter of the EU average and around one seventh of Germany and Austria’s levels (Figure 4, Panel D). Lack of R&D investment may hamper future technological progress, productivity increases and innovation in the economy. It is important to note that in order to support such intangible, relatively riskier investments, some form of market-based financing is often required, which is why underinvestment in intangibles is also a reflection of the state of capital markets.
0%
10%
20%
30%
40%
2000 '05 '10 '15 '19
Household Public Business
0%
5%
10%
15%
20%
25%
30%
Romania Germany Austria Poland CzechRep.
Hungary EU27
Household Public Business
15%
20%
25%
30%
35%
40%
2017Q4 2018Q4 2019Q4
Romania GermanyCzech Republic AustriaPoland
0%
1%
2%
3%
4%
2010 '12 '14 '16 '18
Romania GermanyAustria Poland
Czech Republic Hungary

CHAPTER I. THE ROMANIAN CORPORATE SECTOR
OECD Capital Market Review of Romania 2021: Mapping Report 19
Moreover, financial soundness is low in the Romanian corporate sector, which has the highest share of companies with negative equity in Europe (see Section 1.6). Together with the closely related phenomenon of higher financing costs, this represents an important factor hindering companies’ access to external financing, thereby limiting their investment capacity (EIB, 2019). In addition, according to a survey on companies’ views on investment obstacles by the European Investment Bank (2019), the level of uncertainty in the economy as well as challenging business and labour market regulations are pointed out as key issues for Romanian firms. Labour productivity growth (measured as GDP per hour worked) in Romania was strong in the past decade, far outpacing regional peers and more advanced European economies (Figure 5, Panel A). It should be noted, however, that at the start of the analysed period labour productivity was significantly lower than that of peer countries (for example, in 2010 USD 23 was produced for each hour worked in Romania, compared to USD 36 in the Czech Republic and USD 61 in Germany). As a result, and despite the growth, it remains low in dollar terms both in a CEE and in a broader European context (Figure 5, Panel C). In addition, wages have outgrown productivity in recent years, notably since 2015. The increase in unemployment after the 2008 crisis and the subsequent Euro crisis led to a year-on-year decrease in Romanian unit labour costs in 2009, 2011 and 2015. However, between 2015 and 2019 unit labour costs increased by 36%, far exceeding the increase in labour productivity of 20% (Figure 5, Panels A and B).
Still, while due attention should be paid to the relation between wage and productivity growth over the longer term, it should be noted that the wage share of GDP has historically been low in Romania (Figure 5, Panel D). Since labour productivity/wage comparisons do not account for the initial relation between wages and productivity, cross-country comparisons should be contextualised with the wage share of GDP. Wages and salaries as a share of GDP have been rising since the second half of 2015, as a result of increments in public sector wages, minimum wage increases and a tightening labour market. In spite of this, wages in Romania are still low relative to much of the rest of the EU and they are expected to continue growing. One factor to have in mind is that wage growth in excess of productivity gains could lead to losses in competitiveness. Boosting productivity-enhancing investments is therefore key for the Romanian economy.

CHAPTER I. THE ROMANIAN CORPORATE SECTOR
20 OECD Capital Market Review of Romania 2021: Mapping Report
Figure 5. Labour productivity and wage share
A. Labour productivity (2010 = 100) B. Unit labour cost per hour worked (2010 = 100)
C. GDP per hour worked D. Wages and salaries, % of GDP
Source: OECD Productivity Statistics, OECD Stat Database.
Further, domestic bank credit to the private sector as a share of GDP stood at 26% in Romania at the end of 2019, the lowest among its peer countries, and the share has been decreasing since the 2008 crisis (Figure 6, Panel A). The non-bank financial system is even smaller and does not fill this financing gap. While the banking financial system represented 53% of GDP in Q2-2020, the non-bank financial system represented less than 13% (ASF, 2020a). Moreover, Romanian non-financial companies are heavily reliant on non-resident financial institutions for loan financing, which is a cause for financial stability concerns. As of the end of 2019, loans from non-resident financial institutions were 1.2 times higher than loans from resident financial institutions (BNR, 2020a). Rather than bank loans or capital markets, Romanian companies’ main sources of external financing are overdrafts and credit lines. Together with the lack of bank financing to the corporate sector, the underdevelopment of the capital market is likely to negatively impact economic growth (EC, 2020). Both the bank and non-bank financial sectors are instead heavily exposed to Romanian government securities, raising risks of excessive interdependence between banks and the state (World Bank & IMF, 2018; ASF, 2020b). As of November 2020, government bonds made up 68% of mandatory pension funds’ assets and 64% of optional pension funds’ assets (ASF, 2020a).
90
100
110
120
130
140
150
'10 '15 '19
Romania Germany Austria
Poland Czech Rep. Hungary
90
100
110
120
130
140
150
2010 '15 '1990
100
110
120
130
2010 '15 '19
0
20
40
60
80
Romania Germany Austria Poland Czech Rep. Hungary
2012 2005 2019
USD constant 2015 PPP
25%
30%
35%
40%
45%
'13 '16 '19

CHAPTER I. THE ROMANIAN CORPORATE SECTOR
OECD Capital Market Review of Romania 2021: Mapping Report 21
Figure 6. Banking sector loan trends in Romania and selected European countries A. Domestic credit to private sector by banks B. Gross non-performing loans, % of total gross
loans
Note: For panel B data from 2014 onwards comes from Eurostat (except for the Czech Republic, 2014-15). Prior years use World Bank data. Source: Eurostat, World Bank.
Despite low levels of credit to the private sector, Romania had the highest share of non-performing loans (NPLs) among its peer countries after the 2008 financial crisis and the subsequent Euro crisis (Figure 6, Panel B). In 2014, it had the fifth highest share in the European Union (Eurostat, 2021b). Since then, the National Bank of Romania (BNR) has pursued a number of initiatives in order to reduce pressure on banks’ balance sheets with respect to NPLs, including more prudent provisioning, disposal of NPLs and annual bank-by-bank supervisory targets for NPL reductions (IMF, 2018). In addition to the significant decrease in the NPL ratio between 2015 and 2019 (more than nine percentage points), at the end of 2019, the non-performing loan coverage ratio in Romania exceeded 60% which is far above the EU average of 44.6% (BNR, 2020a). However, there is a substantial risk that NPL ratios will increase again in the wake of the COVID-19 crisis. According to the National Bank of Romania, the average probability of bank loan default estimated for non-financial corporations is expected to increase significantly and reach 13% in March 2021. In addition, the Romanian economy has a significant level of overdue payments, amounting to 9% of GDP at the end of 2018 (BNR, 2020a). In spite of sustained fiscal deficits over the past decade and the additional pressure from the COVID-19 crisis, Romanian sovereign indebtedness remains well below the threshold stipulated in the Stability and Growth Pact (S&G) of the European Union 1 and modest compared with many other European countries (ECB, 2020). Still, gross government debt almost tripled as a share of GDP between 2008 and 2019 (from 12% to 35%), and the fiscal deficit has remained larger than the 3% laid out in the S&G Pact for many years (Figure 7, Panels A and B). Moreover, according to the European Commission (2020), the debt-to-GDP ratio is projected to exceed 90% by 2030, mainly driven by a projected significant increase in pension spending.
1 The Stability & Growth Pact limits the debt-to-GDP ratio to 60% and fiscal deficits to 3% annually.
0%
20%
40%
60%
80%
100%
120%
'05 '10 '15 '19
Romania GermanyAustria PolandCzech Republic HungaryEuropean Union
Share of GDP
0%
5%
10%
15%
20%
25%
'05 '10 '15 '19
Romania Germany
Austria Poland
Czech Republic Hungary
% of total gross loans

CHAPTER I. THE ROMANIAN CORPORATE SECTOR
22 OECD Capital Market Review of Romania 2021: Mapping Report
Figure 7. Fiscal balance and gross public debt of Romania A. Fiscal balance, % of GDP B. Gross government debt, % of GDP
C. Primary and total fiscal balance, % of GDP D. Interest payments, % of revenue
Source: Eurostat, OECD Economic Outlook 108, World Bank.
It should be noted that the primary and total fiscal balances differ markedly in Romania (Figure 7, Panel C). While the average fiscal deficit over the 2008-2019 period was almost 4% of GDP, the primary deficit was below 3%, meaning interest payments make up a significant part of the Romanian deficit. Indeed, interest payments as a share of total revenue has increased substantially since 2008, even as interest rates have fallen to historical lows in Romania (BNR, 2021) and around the world (Figure 7, Panel D). This was a joint effect of falling government revenue in 2009 and a sharp increase in borrowing from 12% of GDP in 2008 to 22% in 2009 (Eurostat, 2021c). For this reason, it should also be considered that even while debt levels are modest, lower “tolerance” for debt has been observed in emerging economies compared to advanced economies. Therefore, the sustainable level of sovereign borrowing for Romania is likely to be lower than advanced economies.
1.2. Business demographics
In 2018, small and medium enterprises (SMEs) accounted for 99.8% of all firms in the non-financial business sector in the European Union, employing 66.6% of the total workforce (EC, 2019b). Similarly, in Romania, at the end of 2018 SMEs made up 99.7% of total non-financial corporations (Table 2). Although the share of the number of SMEs is very similar
-10%
-8%
-6%
-4%
-2%
0%
2%
4%
'09 '11 '13 '15 '17 '19
Romania GermanyCzech Republic HungaryEU27
0%
20%
40%
60%
80%
100%
'09 '11 '13 '15 '17 '19
Romania GermanyCzech Republic HungaryEU27
(10.0%)
(8.0%)
(6.0%)
(4.0%)
(2.0%)
0.0 %
2.0 %
-10%
-8%
-6%
-4%
-2%
0%
2%
'09 '11 '13 '15 '17 '19
Fiscal balance Primary fiscal balance
0%
2%
4%
6%
8%
'08 '10 '12 '14 '16 '18
Share of revenue

CHAPTER I. THE ROMANIAN CORPORATE SECTOR
OECD Capital Market Review of Romania 2021: Mapping Report 23
across peer countries, the composition of subcategories within SMEs varies considerably. For instance, the share of micro firms in the Czech Republic, Hungary and Poland averages 95%, whereas in Germany and Austria micro firms account for only 85% and small firms for over 10%. Romania stands in the middle with micro firms representing 89.3% (1 to 9 employees), small firms 8.7% (10 to 49 employees) and medium-sized firms 1.6% (50 to 249 employees). Large firms (over 250 employees) represent 0.3% of all Romanian non-financial companies. Notably, the share of large non-financial companies is larger than the corresponding share in the Czech Republic, Hungary or Poland, but lower than in Austria and Germany, where large firms constitute 0.4% of all firms. Over the past years, the distribution of Romanian companies has remained quite stable, with micro firms growing from 88.9% in 2010 to 89.3% in 2018. The total number of non-financial firms has grown from 440 000 in 2010 to almost 500 000 in 2018, a 12% increase. This increase exceeds those in Austria, the Czech Republic and Hungary but is smaller than those in Germany and Poland, which have seen their total number of non-financial firms increase by almost 30% from 2010 to 2018.
Table 2. Company distribution by firm size 2010 2018
Micro Small Medium Large No. of firms Micro Small Medium Large No. of
firms Romania 88.9% 9.0% 1.7% 0.3% 443 736 89.3% 8.7% 1.6% 0.3% 498 010 Austria 87.4% 10.7% 1.6% 0.3% 300 252 86.8% 11.2% 1.7% 0.4% 315 150 Czech Republic 95.7% 3.4% 0.7% 0.1% 968 539 96.0% 3.2% 0.7% 0.2% 1 035 354 Germany 82.2% 14.8% 2.6% 0.5% 2 063 310 83.2% 14.2% 2.2% 0.4% 2 587 234 Hungary 94.6% 4.5% 0.7% 0.1% 547 724 94.4% 4.7% 0.8% 0.2% 592 517 Poland 95.3% 3.4% 1.1% 0.2% 1 460 288 94.8% 4.3% 0.8% 0.2% 1 940 618
Note: In accordance with the International Standard Industrial Classification of All Economic Activities (ISIC) Rev. 4, the total corresponds to the Business economy, except financial and insurance activities. Source: OECD SDBS Structural Business Statistics.
In Romania, the non-financial business sector employs 4.1 million workers (21% of the total population), compared to an average of 3.2 million in Austria, the Czech Republic and Hungary, representing on average 32% of the total population. In Poland and Germany, the shares are 26% (10 million employees) and 38% (31 million employees) of the total population, respectively. SMEs in Romania account for 64% of total employment, similar to its peer countries with the exception of Germany, where SMEs represent 59% of total employment (Figure 8). Moreover, while in terms of the number of firms, large firms account for the smallest portion of non-financial companies in all the selected countries, they employ the largest share of workers. In Romania, 36% of the labour force is employed by large firms.

CHAPTER I. THE ROMANIAN CORPORATE SECTOR
24 OECD Capital Market Review of Romania 2021: Mapping Report
Figure 8. Employment distribution by firm size, in 2018
Note: The figure corresponds to the sector “Business economy, except financial and insurance activities” according to the International Standard Industrial Classification of All Economic Activities (ISIC) Rev. 4. Source: OECD SDBS Structural Business Statistics.
In general, labour productivity levels tend to be higher for large firms than for smaller ones. For instance, in Romania labour productivity of micro firms is USD 31 thousand (2016 PPP) per person employed, whereas it is USD 53 thousand for large firms (Figure 9). German and Austrian firms are the most productive with over USD 60 thousand per person employed across firm size categories. In particular, large German and Austrian firms generate USD 94 thousand and USD 103 thousand respectively per person employed annually. In contrast, Romanian companies rank the lowest in terms of labour productivity when compared to their peer countries, with the exception of micro firms, where Romanian firms are more productive than Polish and Hungarian peers.
19% 23% 24%30% 33% 34%
23%21% 23%
17%19% 17%
17%20% 18% 19% 16% 16%
41% 36% 35% 33% 32% 33%
0%
20%
40%
60%
80%
100%
Germany Romania Austria Czech Republic Hungary Poland
Large
Medium
Small
Micro

CHAPTER I. THE ROMANIAN CORPORATE SECTOR
OECD Capital Market Review of Romania 2021: Mapping Report 25
Figure 9. Labour productivity by firm size, in 2016 A. Micro B. Small
C. Medium D. Large
Note: The figures correspond to the sector “Business economy, except financial and insurance activities” according to the International Standard Industrial Classification of All Economic Activities (ISIC) Rev. 4. Source: OECD SDBS Structural Business Statistics.
Another aspect of the Romanian business landscape relates to the employment distribution across industries. Manufacturing companies dominate, employing 31% of the Romanian workforce (Figure 10). Moreover, the share of employment in the Manufacturing industry increases with company size, representing 11% of the employment in micro firms, 23% in small firms, 39% in medium firms and 44% in large firms. Wholesale and retail trade companies rank second in total employment in Romania with a share of 23%. This industry represents on average 32% of employment in micro and small companies, 16% in medium firms and 14% in large firms. The Transportation and storage industry ranks third representing 10% of total employment, followed by the Construction industry, which is important among SMEs.
Figure 10. Employment distribution in Romania by company size and industry in 2018
Note: In accordance with the International Standard Industrial Classification of All Economic Activities (ISIC) Rev. 4, the total corresponds to the Business economy, except financial and insurance activities. Source: OECD SDBS Structural Business Statistics
24 27 31 34
61 65
0
20
40
60
80
100
Poland Hungary Romania CzechRepublic
Germany Austria
Thousand USD constant 2016 PPP
35 44 47
55 59 72
0
20
40
60
80
100
Romania Hungary CzechRepublic
Poland Germany Austria
Thousand USD constant 2016 PPP
40 56 62 65
77
97
0
20
40
60
80
100
Romania Hungary CzechRepublic
Poland Germany Austria
Thousand USD constant 2016 PPP
53
74 76 83 94
103
0
20
40
60
80
100
Romania Hungary CzechRepublic
Poland Germany Austria
Thousand USD constant 2016 PPP
0%
20%
40%
60%
80%
100%
Micro Small Medium Large
Wholesale and retail trade; repair of motor vehicles
Water supply; sewerage, waste management
Transportation and storage
Real estate activities
Professional, scientific and technical activities
Manufacturing
Information and communication
Electricity, gas, steam and air conditioning supply
Construction
Administrative and support service activities
Accommodation and food service activities

CHAPTER I. THE ROMANIAN CORPORATE SECTOR
26 OECD Capital Market Review of Romania 2021: Mapping Report
Manufacturing, Wholesale and retail trade, and Transportation and storage account for a significant share of employment in Romania. A detailed analysis of labour productivity for these three industries is shown by firm size in Figure 11. As seen in the figure, Austrian Manufacturing large firms show the highest level of productivity with USD 135 thousand (2016 PPP) per person employed against only USD 50 thousand (2016 PPP) for large Romanian companies in the same industry (Figure 9, Panel D). Among micro firms, Romanian Manufacturing firms show a labour productivity of USD 30 thousand, greater than firms in the Czech Republic, Hungary or Poland. In the rest of the firm category sizes – small, medium and large – Wholesale and retail trade companies in Romania appear to be the most productive ones when compared to the other two industries. Notably, large Romanian Wholesale and trade firms rank second with USD 64 thousand per person employed just behind German Wholesale and trade large firms.
Figure 11. Labour productivity by firm size for selected industries, in 2016
A. Micro B. Small
C. Medium D. Large
Note: Sectors classification is in accordance with the International Standard Industrial Classification of All Economic Activities (ISIC) Rev. 4. Source: OECD SDBS Structural Business Statistics.
1.3. Company categories in Romania
This section describes how companies are classified and grouped for the analysis in the following sections of this part the report. Using financial and ownership information from the ORBIS database, sections 1.4 to 1.6 present an analysis of the business dynamics in Romania, including comparisons with selected European peer countries. The analysis is limited to non-financial companies with more than 10 employees. The rationale for choosing a size threshold of 10 employees is twofold: first, data coverage typically increases with firm size which means that the coverage for smaller firms is less reliable, hampering comparability.
0
40
80
120
Romania Austria Czech Republic Germany Hungary Poland
Manufacturing Transportation and storage Wholesale and retail trade
0
40
80
120
Romania Austria CzechRepublic
Germany Hungary Poland
Thousand USD constant 2016 PPP
0
40
80
120
Romania Austria CzechRepublic
Germany Hungary Poland
Thousand USD constant 2016 PPP
0
40
80
120
Romania Austria CzechRepublic
Germany Hungary Poland
Thousand USD constant 2016 PPP
0
40
80
120
Romania Austria CzechRepublic
Germany Hungary Poland
Thousand USD constant 2016 PPP

CHAPTER I. THE ROMANIAN CORPORATE SECTOR
OECD Capital Market Review of Romania 2021: Mapping Report 27
Second, the focus of this report is market-based financing and micro-firms are generally unlikely to tap capital markets. The OECD-ORBIS Corporate Finance dataset includes financial and ownership information for non-financial companies between 2005 and 2018. To evaluate the representativeness of the data against the official statistics, Table 3 compares the coverage of the OECD-ORBIS Corporate Finance dataset with the Eurostat business statistics. The OECD-ORBIS dataset generally has similar coverage as Eurostat for small firms and a higher coverage for medium and large firms. Moreover, the distribution of firms across different size groups is also similar for both datasets. For Romania, the total coverage is almost identical in both datasets. Large companies are defined as having 250 or more employees, medium-sized companies as having between 50 and 249 employees, and small companies as having less than 50 employees. In the case that employment figures are unavailable, companies are classified based on their asset size. The asset size thresholds used are: above EUR 20 million for large firms, between EUR 4 million and EUR 20 million for medium firms and less than EUR 4 million (but larger than EUR 350 000) for small firms.
Table 3. Comparison of the OECD-ORBIS Corporate Finance dataset and the Eurostat universe Large Share of total Medium Share of total Small Share of total Romania - Eurostat 1 662 3% 7 955 15% 43 643 82% Romania - ORBIS 1 693 3% 7 918 15% 44 424 82% Czech Rep. - Eurostat 1 654 4% 7 057 17% 32 763 79% Czech Rep. - ORBIS 1 372 6% 4 869 20% 17 551 74% Germany - Eurostat 12 139 3% 61 634 14% 375 504 84% Germany - ORBIS 9 804 4% 47 335 20% 175 057 75% Hungary - Eurostat 941 3% 4 515 13% 28 033 84% Hungary - ORBIS 1 208 3% 5 838 15% 32 909 82% Poland - Eurostat 3 364 3% 15 474 15% 82 709 81% Poland - ORBIS 3 819 6% 14 548 23% 45 139 71%
Note: All data are as of end-2018, with the exception of Germany, for which 2017 data are used due to limited availability in 2018 from both ORBIS and Eurostat. Source: OECD-ORBIS Corporate Finance dataset and Eurostat; see Annex for details.
One potential weakness of analysing the investment and financing structure of the business sector in an economy is treating the whole non-financial corporate sector as one entity without taking into account differences with respect to key characteristics, such as size, listing status and industry. From a corporate finance perspective, it may also be important to know if a company is part of a larger company group. To overcome these shortcomings, non-financial companies in Romania and peer countries are divided into four categories: Category 1: Listed companies
This category includes, on average, 287 non-financial listed corporations per year with median assets of around EUR 8.3 million. Since being listed on a stock exchange requires the adaption of certain transparency and disclosure standards as well as other corporate governance practices, listing status may have a strong impact on a corporation’s financing conditions. A listed company typically passes a certain threshold in terms of its formal and institutional structure, which may make outside investors more willing to provide funds and which facilitates access to a wider range of financing options, including private equity as well as public and private debt markets. This category includes corporations that were listed on multilateral trading facilities (MTFs). Companies that were listed on the discontinued (since 2015) alternative equity market Rasdaq were excluded. As presented in Figure 12, in 2018

CHAPTER I. THE ROMANIAN CORPORATE SECTOR
28 OECD Capital Market Review of Romania 2021: Mapping Report
listed companies accounted for 3% of the employment in the economy and generated 5% of aggregate sales. Category 2: Large unlisted companies
This category includes, on average, 216 non-financial corporations with assets larger than EUR 89 million (USD 100 million) in 2019 real terms. Their median asset size was EUR 166 million in 2018, which is significantly larger than that of listed companies. This is mainly a result of the inclusion of smaller MTF-listed companies in the listed company category.2 Compared with publicly listed companies, less information is available for large unlisted companies, reducing their available financing options or potentially resulting in less favourable financing conditions. However, companies in this category can generally be classified as professionally managed, formal companies. In 2018, large unlisted companies represented around 35% of total sales and 15% of employment in the economy. Category 3: Small and mid-sized companies that are part of a group This category includes all small and mid-sized enterprises controlled by a listed (Category 1) or a large unlisted corporation (Category 2). SMEs based in Romania but controlled by a non-Romanian company are also included in this category. Category 3 contains, on average, 1 964 companies per year with median assets of EUR 4.5 million. Since the financial results of SMEs that are part of a group are consolidated into a parent company, unconsolidated accounts are used in the analysis to identify their own structure. In general, the information available for SMEs is relatively limited, but being part of a group can help them access financing on better conditions compared with independent SMEs. By creating an internal capital market, an economic group can also improve the available financing options for group companies. Category 4: Independent small and mid-sized companies The last category includes all SMEs identified to be controlled by individuals and those with no available ownership information. For this category, only unconsolidated accounts are available. The group of Independent SMEs is the largest in terms of number of companies (an average of 40 540 companies per year), but the smallest in terms of size (median assets of around EUR 0.39 million). The information available for these companies is limited and unlike SMEs that are part of a group, Independent SMEs do not benefit from the financing advantages related to a group structure. As of end-2018, independent SMEs made up more than half of the total employment in the economy, but only 33% of total sales. Table 4 below shows the distribution of these four categories of non-financial companies in Romania with respect to their number and their median assets.
2 Around 75% of listed companies in the sample are listed on the AeRO market, which is the ATS market run by Bucharest Stock Exchange.

CHAPTER I. THE ROMANIAN CORPORATE SECTOR
OECD Capital Market Review of Romania 2021: Mapping Report 29
Table 4. Company categories of the non-financial business sector in Romania Category 1:
Listed companies Category 2:
Large unlisted companies Category 3:
SMEs part of a group Category 4:
Independent SMEs No. of
companies Median assets
(EUR K) No. of
companies Median assets
(EUR K) No. of
companies Median assets
(EUR K) No. of
companies Median assets
(EUR K) 2005 325 5 113 104 207 801 1 546 3 024 32 745 271 2006 320 6 213 142 181 782 1 587 3 842 35 923 338 2007 318 8 087 191 172 845 1 696 4 399 39 303 383 2008 315 8 157 208 171 499 1 832 4 419 39 909 399 2009 305 8 181 206 163 619 1 820 4 402 35 188 419 2010 296 8 641 221 171 535 1 876 4 524 34 945 430 2011 288 8 640 221 172 637 2 032 4 663 38 951 394 2012 294 8 729 219 190 497 2 083 4 572 41 116 382 2013 288 8 945 213 173 276 2 084 4 587 42 341 370 2014 281 8 538 226 168 614 2 162 4 761 43 193 385 2015 270 8 804 256 157 895 2 268 4 723 44 952 395 2016 245 8 747 266 151 430 2 167 4 939 46 262 397 2017 246 8 883 268 158 618 2 239 5 094 46 225 411 2018 232 9 905 279 165 573 2 098 5 538 46 509 445 Avg. 287 8 256 216 171 973 1 964 4 535 40 540 387
Source: OECD-ORBIS Corporate Finance dataset; see Annex for details.
Figure 12. Company categories’ contribution to sales and employment by industry, 2018
A. Contribution to sales
B. Contribution to employment
Note: For each category, sales and employment numbers are presented as shares of economy totals. Calculations for the total economy take into account the group structure of companies and avoid considering companies that are already consolidated in the accounts of domestic non-financial parent companies. The figure does not show the category SMEs part of a group as these companies are accounted for in the financial statements of their parent company. The categories in this figure are subsamples of the economy constructed for characterisation and comparison purposes and do not consider parent companies with less than EUR 89 (USD 100) million in assets. As a result, they do not add up to 100%. Source: OECD-ORBIS Corporate Finance dataset, see Annex for details.
1%
12%
7%
7%
5%
1%
6%
4%
7%
9% 4%
3%
4% 2%
0% 5% 10% 15% 20% 25% 30% 35% 40%
Listedcompanies
Largeunlisted
companies
IndependentSMEs
Manufacturing | Retail Trade | Transport, Comm.& Util.| Wholesale Trade | Service | Mining | Construction| Agri.
1%
6%
15%
3%
7%
6%
5%
1%
5% 11% 6% 2%
0% 10% 20% 30% 40% 50%
Listedcompanies
Largeunlisted
companies
IndependentSMEs
Manufacturing | Retail Trade | Transport, Comm.& Util.| Wholesale Trade | Service | Mining | Construction| Agri.

CHAPTER I. THE ROMANIAN CORPORATE SECTOR
30 OECD Capital Market Review of Romania 2021: Mapping Report
1.4. Non-financial company performance and profitability
In Romania, the number of companies in all four categories has grown since 2005, except for the number of listed companies, which is now significantly lower than it was in 2005. Simultaneously, the median asset size of listed companies has increased substantially, resulting in fewer but larger listed companies. Asset size has also increased for SMEs that are part of a group and independent SMEs, while it has decreased somewhat among large unlisted companies. Figure 13 below illustrates the development with respect to the number of companies and median asset size for each category between 2005 and 2018, where 2005 is indexed to a baseline value of 100.
Figure 13. Growth in the number of companies and median asset size, 2005-2018 (2005 = 100)
Note: Median assets are inflation adjusted per 2019, thus the change in median assets size reflects real change. Source: OECD-ORBIS Corporate Finance dataset; see Annex for details.
The corporate sector in Romania was severely hit by the 2008 financial crisis, as sales dropped by 14% in 2009, profit margins fell from 3% to 1% and aggregate ROE from 8% to 3% (Figure 14, Panels A and B). This decline is observed for both high and low performing firms in terms of return on equity (ROE) and return on assets (ROA) (Figure 14, Panels C and D). After remaining at lower levels for a number of years, the aggregate profitability ratios started to pick up gradually in 2013. While sales growth has remained subdued compared to pre-2008 levels, the aggregate profit margin reached pre-crisis levels in 2018. It should be noted that there is a marked difference in performance between the top and bottom groups of non-financial corporations in Romania, as illustrated in Panels C and D below. While the differences between the 75th and the 25th percentiles in terms of both ROE and ROA were actually decreasing during the period between 2005 and 2012, the gap has been widening again since 2013.
50
75
100
125
150
175
200
225
25 50 75 100 125 150 175 200 225 250 275 300
Median asset size
Number of companies
Listed companies Large unlisted companies SMEs part of a group Independent SMEs

CHAPTER I. THE ROMANIAN CORPORATE SECTOR
OECD Capital Market Review of Romania 2021: Mapping Report 31
Figure 14. Profitability and sales of Romanian non-financial companies
A. Aggregate sales and profit margin B. Aggregate return on equity and sales growth
C. Return on equity by percentile D. Return on assets by percentile
Source: OECD-ORBIS Corporate Finance dataset; see Annex for details.
Financial performance, measured as ROE and the share of loss-making companies,3 differs significantly across company categories (Figure 15). Generally, the lower the share of loss-making companies, the higher the median ROE. Independent SMEs exhibit by far the highest median ROE and the lowest share of loss-making companies, while the reverse is true for listed companies.
Figure 15. Median ROE and share of loss-making companies by category
Source: OECD-ORBIS Corporate Finance dataset; see Annex for details.
3 The share of firms with negative net income in the total number of firms.
0%
2%
4%
6%
0
100
200
300
'06 '08 '10 '12 '14 '16 '18
Thousands
Aggregate sales Aggregate profit margin (RHS)
2019 EUR, billions
-20%
0%
20%
40%
'06 '08 '10 '12 '14 '16 '18
Aggregate ROE Aggregate sales growth
0%
20%
40%
60%
80%
'06 '08 '10 '12 '14 '16 '18
25th pct. 50th pct. 75th pct.
-5%
0%
5%
10%
15%
20%
25%
'06 '08 '10 '12 '14 '16 '18
25th pct. 50th pct. 75th pct.
0%
10%
20%
30%
40%
50%
2008 2013 2018 2008 2013 2018 2008 2013 2018 2008 2013 2018
Listed companies Large unlisted companies SMEs part of group Independent SMEs
Median RoE Share of loss-making companies

CHAPTER I. THE ROMANIAN CORPORATE SECTOR
32 OECD Capital Market Review of Romania 2021: Mapping Report
In 2018 the Mining industry showed the highest share of loss-making companies in Romania, followed by the Transport, Communication and Utility industry (Figure 16). The Mining industry is also the only one that had a larger share of loss-making companies in 2018 than it did in 2008. Wholesale Trade had the lowest share in 2018 with 12% of all the companies in the industry. A general observation is that the share of loss-making companies has declined for all industries since 2013, although to varying degrees.
Figure 16. Share of loss-making companies by industry
Source: OECD-ORBIS Corporate Finance dataset; see Annex for details.
A comparison with peer countries reveals that Romanian non-financial companies’ profitability ranks second highest in terms of return on equity and close third in terms of return on assets in 2018. This is a significant improvement from both 2008 and 2013, when Romania ranked last for both metrics.
Figure 17. Profitability of non-financial companies for Romania and selected European countries
A. Aggregate return on equity B. Aggregate return on assets
Source: OECD-ORBIS Corporate Finance dataset; see Annex for details.
0%
10%
20%
30%
40%
Agriculture, Forestry&
Fishing
Construction Manufacturing Mining Retail Trade Services Transport,Communication &
Utility
WholesaleTrade
2008 2013 2018
5%
7%
9%
11%
13%
15%
17%
Romania Austria CzechRepublic
Germany Hungary Poland
2008 2013 2018
0%
1%
2%
3%
4%
5%
6%
7%
Romania Austria CzechRepublic
Germany Hungary Poland
2008 2013 2018

CHAPTER I. THE ROMANIAN CORPORATE SECTOR
OECD Capital Market Review of Romania 2021: Mapping Report 33
1.5. Leverage levels
Romanian non-financial companies have seen a slight decrease in leverage ratios (financial debt over total assets) over the past decade, which is mainly a result of the decline in long-term debt from 7% in 2010 to 5% in 2018. This drop can primarily be attributed to highly leveraged companies lowering their indebtedness. Specifically, companies in the 90th percentiles saw a 2 percentage point decline in 2015.
Figure 18. Leverage of Romanian non-financial companies A. Aggregate leverage B. Leverage by percentile
Source: OECD-ORBIS Corporate Finance dataset; see Annex for details.
A comparison with peer countries shows that the Romanian corporate sector has a relatively low level of indebtedness, particularly with regards to long-term debt (Figure 19, Panel B). This is consistent with the fact that the bank credit stock to the corporate sector in Romania has remained one of the lowest in the region at around 26% of GDP (see Figure 6, Panel A). Notably, since 2005 Romanian corporations have always been the ones with the lowest level of long-term debt. The opposite is true for Austrian and German firms, which show lower levels of short-term debt, as they instead rely mainly on long-term debt. High reliance on short-term debt can expose companies to economic downturns and is not considered appropriate for financing strategic productivity-enhancing investments.
Figure 19. Short and long-term debt of non-financial companies in Romania and selected European countries
A. Short-term debt B. Long-term debt
Source: OECD-ORBIS Corporate Finance dataset; see Annex for details.
Among the four categories of non-financial companies in Romania, independent SMEs are the ones with the lowest leverage levels, remaining at around 10% throughout the period
0%
5%
10%
15%
2010 '11 '12 '13 '14 '15 '16 '17 '18
Short-term debt Long-term debt
0%
10%
20%
30%
2010 '11 '12 '13 '14 '15 '16 '17 '18
p25 p50 p75 p90
0%1%2%3%4%5%6%7%8%9%
Romania Austria CzechRepublic
Germany Hungary
2010 2014 2018
0%
2%
4%
6%
8%
Romania Austria CzechRepublic
Germany Hungary Poland
% of assets
0%
10%
20%
30%
40%
50%
Romania Austria CzechRepublic
Germany Hungary Poland
% of assets

CHAPTER I. THE ROMANIAN CORPORATE SECTOR
34 OECD Capital Market Review of Romania 2021: Mapping Report
(Figure 20, Panel D). SMEs that are part of group have the highest aggregate leverage levels, with short-term debt almost 5 percentage points higher than independent SMEs (Figure 20, Panel C).
Figure 20. Aggregate leverage levels by company categories in Romania
A. Listed companies B. Large unlisted companies
C. SMEs part of a group D. Independent SMEs
Source: OECD-ORBIS Corporate Finance dataset; see Annex for details.
Listed companies, which typically have higher levels of capitalisation, are much less dependent on debt financing. As presented in Panel A of Figure 20, in 2012 listed companies increased their average debt level rather sharply from 11% to 13%, which may be a result of companies raising funds to cope with the crisis. Since then, leverage in listed companies saw a stable decrease from 13% in 2012 to 9% in 2018. The same trend can be observed in large unlisted companies, where average leverage decreased from 14% in 2012 to 10% in 2018 (Figure 20, Panel B). It is also important to point out that these two groups of companies have a higher ratio of long-term debt to total debt compared to SMEs. Only a small share of the total number of companies in Romania reported that they had any financial debt on their balance sheets. Therefore, in order to improve the comparability of the analysis, Figure 21 shows an alternative leverage measure which also includes non-financial liabilities (e.g. trade payables). Total liabilities over total assets was around 60% throughout the period for Romanian companies, with current liabilities accounting for almost two thirds of the total liabilities (Figure 21, Panel A). However, there is heterogeneity across company categories and over time. The alternative leverage ratio for listed companies was significantly lower compared with the other three categories at 49% in 2005 and 33% in 2018. While the leverage level for the independent SMEs category was the lowest when only financial debt is considered, it is the highest when total liabilities are taken into account. However, they also saw a decline in leverage from 70% in 2005 to 62% in 2018 (Figure 21, Panel B). The two other groups, large unlisted companies and SMEs part of a group, had relatively stable levels of liabilities as a share of total assets over the period.
0%5%10%15%20%'10 '11 '12 '13 '14 '15 '16 '17 '18
Short-tem debt Long-term debt
0%
5%
10%
15%
20%
2010 '11 '12 '13 '14 '15 '16 '17 '180%
5%
10%
15%
20%
2010 '11 '12 '13 '14 '15 '16 '17 '18
0%
5%
10%
15%
20%
2010 '11 '12 '13 '14 '15 '16 '17 '180%
5%
10%
15%
20%
2010 '11 '12 '13 '14 '15 '16 '17 '18

CHAPTER I. THE ROMANIAN CORPORATE SECTOR
OECD Capital Market Review of Romania 2021: Mapping Report 35
Companies in the CEE region are typically more heavily reliant on short-term liabilities in their financing structure than other European peers. In 2018, the average share of current liabilities to total liabilities for Romania, the Czech Republic, Hungary and Poland was 65%, compared to 23% in Austria and 46% in Germany (Figure 21, Panels C and D).
Figure 21. Leverage measured as total liabilities as a share of total assets A. Maturity structure of liabilities, Romania B. Leverage by company category, Romania
C. Current liabilities,
Romania and selected European countries D. Non-current liabilities,
Romania and selected European countries
Source: OECD-ORBIS Corporate Finance dataset; see Annex for details.
One important indicator to measure a company’s ability to service its debt is the debt-to-EBITDA ratio, which shows the indebtedness level against the operational profit-generating capacity of the company. This measure provides a proxy for debt sustainability: a higher value reflects a lower debt service capacity. It is typically considered that a ratio over 4 puts a company in a higher risk category (Standard & Poor’s Global, 2013). Panel A of Figure 22 shows that the share of Romanian firms with a high debt-to-EBITDA ratio (>4) increased significantly after the 2008 crisis and during the European sovereign debt crisis, as profitability decreased. As the economy has recovered gradually in recent years, coupled with a decrease in indebtedness, the share of firms with high debt-to-EBITDA ratios has since dropped significantly.4 In 2018, around 9% of companies in Romania had a debt-to-EBITDA ratio over 4, which is significantly lower than other peer countries such as Poland (17%) and the Czech Republic (14%). Among different categories of companies, listed companies appear to have the largest portion of companies in the higher risk category at around 40%, while the independent SMEs category
4 Note that debt here refers to financial debt, not total liabilities.
0%
20%
40%
60%
80%
2005 '08 '10 '12 '14 '16 '18
Current Liabilities Non-Current Liabilities
20%
40%
60%
80%
2005 '08 '10 '12 '14 '16 '18
Listed companiesLarge unlisted companiesSMEs part of a groupIndependent SMEs
0%
10%
20%
30%
40%
50%
Romania Austria CzechRepublic
Germany Hungary Poland
2018 2013 2008
0%
10%
20%
30%
40%
50%
60%
Romania Austria CzechRepublic
Germany Hungary Poland
2018 2008 2013

CHAPTER I. THE ROMANIAN CORPORATE SECTOR
36 OECD Capital Market Review of Romania 2021: Mapping Report
has the smallest portion (Figure 22, Panel B). Large unlisted companies and SMEs that are part of a group reached 40% in 2012 during the crisis, after which the portion of companies with high debt-to-EBITDA ratios declined gradually, reaching around 29% in 2018.
Figure 22. Share of firms with high debt-to-EBITDA ratio A. Total economy B. Categories of companies
Note: In Panel A, companies that reported both financial debt and negative EBITDA are included in the high-leverage companies to reflect their incapacity to generate operational profit to be used towards repaying debt. Source: OECD-ORBIS Corporate Finance dataset; see Annex for details.
An issue of great importance with respect to corporate leverage is the structure of the debt, in particular the currency composition. Non-financial companies in Romania are heavily dependent on non-resident creditors and foreign currency debt, which has financial stability implications. Foreign direct investment in the form of loans and direct loans from non-resident financial institutions make up more than half of all non-financial corporate debt in Romania. At the end of 2019, foreign financing was 1.2 times higher than from resident financial institutions. More importantly, loans from non-resident entities make up 72% of total foreign currency debt (BNR, 2020a). This reliance on foreign creditors and currencies carries potential financial stability risks, including spill-overs from macroeconomic fluctuations in the currency issuing country, especially to the extent that there is a mismatch between the debtor companies’ revenues (local currency) and their debt service (foreign currency). Overall, the debt composition of Romanian non-financial corporations add to the already strong rationale for developing domestic capital markets.
1.6. Capitalisation and equity capital misallocation
During the 2008 financial crisis, Romanian non-financial companies saw a sharp drop in their capitalisation levels (total shareholders’ equity as a share of total assets). The decline in aggregate equity capital as share of total assets was 3 percentage points, from 41% in 2007 to 38% in 2011 (Figure 23). Listed companies have had the highest capitalisation level since 2008, and following the initial drop in capitalisation they also managed to increase their equity capital significantly from 56% in 2012 to 67% in 2018. Large unlisted companies, however, saw a continued decrease in capitalisation over the same period. SMEs that are part of a group experienced a decline from 37% to 34% from 2007 to 2011. After remaining at this level for a number of years, their equity levels began to improve, reaching 38% in 2018. The capitalisation level of independent SMEs has seen a modest upward trend since 2005.
0%
5%
10%
15%
20%
25%
30%
2010 '12 '14 '16 '18
Debt-to-EBITDA > 4 Negative EBITDA
0%
10%
20%
30%
40%
50%
2010 '11 '12 '13 '14 '15 '16 '17 '18
Listed companies Large unlisted companies
SMEs part of a group Independent SMEs

CHAPTER I. THE ROMANIAN CORPORATE SECTOR
OECD Capital Market Review of Romania 2021: Mapping Report 37
Figure 23. Capitalisation levels for different categories of Romanian companies
Source: OECD-ORBIS Corporate Finance dataset; see Annex for details.
A comparison between Romania and peer countries shows that Romanian listed companies have a much higher aggregate capitalisation level (Figure 24, Panel A). This generally holds across the distribution of capitalisation (i.e. both for high and low capitalisation companies) and over time. However, large unlisted companies have a lower level of capitalisation (41%) compared with countries such as the Czech Republic (55%) and Poland (47%) (Figure 24, Panel B). In addition, both groups of SMEs have relatively low capitalisation levels compared to regional peers (Figure 24, Panels C and D). In recent years, there has been an increasing concern worldwide about companies that do not even generate enough profits to service their debt, so-called zombie companies. In addition, some companies have suffered an erosion of their equity capital over time as a result of continued low profitability and are currently in a situation where they have negative equity. While zombie companies are defined as those that are incapable of covering their interest payments with operating income, negative-equity firms are those firms for which liabilities exceed assets.5 These two group of companies are still alive either due to the protection of creditors or because they are related to a more solvent economic group or parent company. Having a large share of zombie and negative-equity companies can pose a threat to the resilience of the corporate sector as a whole (Banerjee and Hofmann, 2018). Importantly, it may not only be detrimental to the individual company but to the economy as a whole, since zombie companies are locking in resources that could be allocated to more productive activities. Continued support for zombie companies distorts the market functioning and hinders recovery and reallocation (Scope, 2019).
5 More specifically, in the following analysis zombie companies are defined as companies that are more than 9 years old and which have had interest payments in excess of EBIT during at least the last 3 years.
0%
20%
40%
60%
80%
2005 '06 '07 '08 '09 '10 '11 '12 '13 '14 '15 '16 '17 '18
Listed companies Large unlisted companiesSMEs part of a group Independent SMEsTotal economy

CHAPTER I. THE ROMANIAN CORPORATE SECTOR
38 OECD Capital Market Review of Romania 2021: Mapping Report
Figure 24. Company capitalisation for Romania and selected European countries (2018) A. Listed companies B. Large unlisted companies
C. SMEs part of a group D. Independent SMEs
Source: OECD-ORBIS Corporate Finance dataset; see Annex for details.
In Romania, the share of zombie firms is relatively small. This is to some extent driven by the fact that smaller companies report low levels of financial debt. In 2015, it was estimated that out of 460 000 enterprises active in the country at the time, less than 28% fell within banks’ minimum financial criteria (World Bank & IMF, 2018). Panel A of Figure 25 shows that the share of zombie firms increased significantly in the build-up and aftermath of the 2008 crisis, after which it began decreasing in 2012. Romanian companies have also experienced an increase in firms with negative equity. The share of firms with negative equity peaked in 2014 at 20% of all companies and then declined slightly to 14% in 2018 (Figure 25, Panel B).
Figure 25. Share of zombie and negative-equity companies in the Romania A. Share of zombie companies B. Share of negative-equity companies
Source: OECD-ORBIS Corporate Finance dataset; see Annex for details.
The share of zombie and negative-equity companies differs considerably between different groups of companies. Importantly, the portion of listed zombie companies more than tripled
67%
41%38%
33%
54% 52%
0%
20%
40%
60%
80%
Romania Austria CzechRepublic
Germany Hungary Poland
41% 40%
55%
36%42%
47%
0%
20%
40%
60%
Romania Austria CzechRepublic
Germany Hungary Poland
38% 37%
51%
32%
41% 41%
0%
20%
40%
60%
Romania Austria CzechRepublic
Germany Hungary Poland
38% 36%
50%
39%
49%45%
0%
20%
40%
60%
Romania Austria CzechRepublic
Germany Hungary Poland
0%
1%
2%
3%
'06 '08 '10 '12 '14 '16 '180%
5%
10%
15%
20%
25%
'06 '08 '10 '12 '14 '16 '18

CHAPTER I. THE ROMANIAN CORPORATE SECTOR
OECD Capital Market Review of Romania 2021: Mapping Report 39
between 2008 and 2018 (Figure 26). Similar to listed companies, large unlisted companies also saw a significant increase in zombie companies in the aftermath of the 2008 financial crisis and during the European sovereign debt crisis, reaching 7% in 2012; a level at which it remained in 2018. Both groups of SMEs, particularly independent SMEs, have rather low share of zombie firms. However, they have the highest ratio of negative-equity companies. Independent SMEs saw a dramatic increase in negative-equity companies from 13% in 2008 to 20% in 2012.
Figure 26. Share of zombie and negative-equity companies across different groups
Source: OECD-ORBIS Corporate Finance dataset; see Annex for details.
Both zombie and negative-equity firms can reduce the efficiency of capital allocation in the economy as capital locked up in such firms could potentially be used by more productive companies. Despite having a modest share of zombie firms, Romania was the country with the highest ratio of negative-equity firms in 2018 (Figure 27). The share of companies and assets associated with negative-equity companies are 14% and 8% respectively, which is significantly higher than in peer countries. According to the National Bank of Romania, by the end of 2019, the capital needs of non-financial companies with negative equity amounted to 16.8% of Romanian GDP. Moreover, negative-equity companies accounted for 67% of overdue payments in the economy and around 35 % of non-performing loans from local credit institutions. The NPL ratio of those firms was 20% at the end of 2019 (BNR, 2020a). Figure 27. Companies with negative equity in Romania and selected European countries (2018)
A. Share of companies B. Share of total assets
Source: OECD-ORBIS Corporate Finance dataset; see Annex for details.
0%
5%
10%
15%
20%
25%
2008 2012 2015 2018 2008 2012 2015 2018 2008 2012 2015 2018 2008 2012 2015 2018
Listed companies Large unlisted companies SMEs part of group Independent SMEs
Share of zombie firms Share of negative-equity firms
6%
8%
9%
12%
13%
14%
0% 4% 8% 12% 16%
Germany
Hungary
Czech Republic
Poland
Austria
Romania
1%
1%
2%
3%
4%
8%
0% 2% 4% 6% 8%
Germany
Czech Republic
Hungary
Poland
Austria
Romania

CHAPTER I. THE ROMANIAN CORPORATE SECTOR
40 OECD Capital Market Review of Romania 2021: Mapping Report
1.7. The impact of COVID-19 on the corporate sector
The COVID-19 pandemic is having an unprecedented impact on economies around the world. Measures such as social distancing, travel restrictions and prohibitions to engage in social activities implemented to contain the transmission of the virus led to a widespread shutdown of businesses during the initial and subsequent waves of the pandemic. As a result, the world economy has seen a record slowdown in activity. The OECD expects a 3.4% contraction in global GDP in 2020 (OECD, 2021a). The sharp drop in sales experienced by the corporate sector has also caused acute liquidity pressures and growing insolvency concerns in many economies and industries. The estimated decline in profits is sizeable, amounting to on average between 40% and 50% of normal-time profits according to OECD research. In such a scenario, around 7-9% of otherwise viable European companies could become distressed and around one-third of the companies may not be able to cover their interest expenses (OECD, 2021b). It is forecasted that as the crisis evolves, some existing businesses will recover after a temporary downturn while others will be phased out. Importantly, this shock came at a time when there was already widespread concerns about the high levels of debt in the corporate sector and the declining quality of the outstanding stock of debt around the world. In the third quarter of 2020, global activity recovered in some sectors as a result of significant measures taken by governments and central banks. Government interventions have played an important role in helping firms address the liquidity shortfall (OECD, 2021c). However, some service activities remain limited due to physical distancing. The collapse in employment observed at the start of the pandemic has partially reversed, but a large number of people still remain unemployed. Most firms have survived, but are in many cases financially weak. Vaccination programmes, health policies and government financial support are expected to lift global GDP by 5.6% in 2021 (OECD, 2021a).
Figure 28. Economic sentiment and confidence across industries in Romania and EU-27
A. Economic sentiment B. Industrial confidence C. Services confidence
D. Retail confidence E. Construction confidence F. Consumer confidence
Note: The Economic Sentiment Indicator is scaled to a long-term mean of 100 and a standard deviation of 10. Values above 100 indicate above-average economic sentiment and vice versa. The confidence indicators are published as the difference between positive and negative answers (in percentage points of total answers). Source: European Commission - DG ECFIN.
-40
-20
0
20
Jan-20
Romania European Union - 27 countries
60
80
100
120
Jan-20 May-20 Aug-20 Dec-20
-40
-20
0
20
Jan-20 May-20 Aug-20 Dec-20
-60
-40
-20
0
20
Jan-20 May-20 Aug-20 Dec-20
-40
-20
0
20
Jan-20 May-20 Aug-20 Dec-20
-60
-40
-20
0
20
Jan-20 May-20 Aug-20 Dec-20
-40
-20
0
Jan-20 May-20 Aug-20 Dec-20

CHAPTER I. THE ROMANIAN CORPORATE SECTOR
OECD Capital Market Review of Romania 2021: Mapping Report 41
As in all other countries, the uncertainty about the future developments of the COVID-19 pandemic has significantly weakened expectations about economic growth and business sector confidence in Romania. The economic sentiment indicator in Romania saw a sharp decline during the initial phase of the pandemic, much in line with the EU-27 (Figure 28, Panel A). After May 2020, expectations started to pick up. Still, uncertainties kept expectations lower than the level at the beginning of 2020 and the Romanian economic sentiment was lower than the average EU-27 by the end of 2020. The confidence indicator across industries reached its lowest level in April 2020. Confidence loss was particularly strong in the Services and Construction industries. Similar to economic sentiment, confidence levels have not yet recovered, and perceptions at the industry level remain overall pessimistic. Confidence in the Retail industry has recovered faster in Romania than the general EU-27 level (Figure 28, Panel D). The listed corporate sector in Romania has also suffered a large contraction in valuations while volatility in financial markets has increased. As a result of the pandemic, current and forecasted corporate revenues have declined significantly. The local index of the Bucharest Stock Exchange experienced a sharp contraction of 30% from the end of 2019 to its lowest index value in March. By the end of 2020 the domestic index had almost recovered its value compared to the start of the year, recovering more quickly than the stock market indices in Hungary and the Czech Republic (Figure 29, Panel A). The contraction in stock market valuations varied across industries. For example, Industrial companies had seen a 42% contraction by October 2020 followed by Energy companies and the Financial sector, which fell by 30% and 25%, respectively. Technology companies in Romania did not experience any change in their valuations, whereas Utilities companies showed an 8% increase (Figure 29, Panel B).
Figure 29. Financial market indicators in Romania
A. Stock market B. Valuations, by industry
Note: Panel B compares stock market values between end-October and the beginning of 2020. Source: Thomson Reuters Eikon, Bucharest Stock Exchange, BNR.
In the first quarter of 2020, among the listed companies on the Bucharest Stock Exchange, five industries saw an increase in total sales compared to the same quarter in 2019 (Figure 30). However, in the second quarter all industries experienced a drop in reported sales compared to the second quarter of 2019, with the exception of Technology companies. Energy, Basic Materials and Industrials saw sharp falls in total sales in the third quarter of 2020. At the same time, Healthcare, Technology and Utilities companies exhibited higher sales.
0
40
80
120
160
0
3
6
9
12
Mill
ions
Volume traded (RHS)BET Index
Points '000 RON millions
-50% -40% -30% -20% -10% 0% 10%
Basic materials
Cons. cyclicals
Cons. non-cyclicals
Energy
Financials
Healthcare
Industrials
Technology
Utilities

CHAPTER I. THE ROMANIAN CORPORATE SECTOR
42 OECD Capital Market Review of Romania 2021: Mapping Report
Figure 30. Quarterly sales YoY changes 2019-2020
Source: Thomson Reuters Datastream.
1.8. Government relief programmes to the corporate sector
In response to the COVID-19 pandemic, the Romanian government has implemented a range of measures to support households, jobs and businesses. The authorities have also implemented measures to support specific industries affected by the pandemic. To help companies maintain their workforce, the government started partially covering the wages of the self-employed and partially subsidising the wages of workers with reduced working hours. Subsidies were allocated to workers returning to work. To alleviate the liquidity needs of corporations, the government has introduced a deferral of utilities payments for SMEs. Other measures include faster reimbursement of VAT, suspending foreclosures on overdue debtors, discounts on corporate income taxes, postponement of the property tax, exempting hospitality companies from the industry specific tax for 90 days. In addition, the government has issued legislation that requires banks to defer loan repayments for households and businesses affected by the crisis by up to nine months. In October 2020 a EUR 103 million Romanian guarantee scheme was established to support the trade credit insurance market with a view to secure the continuity of the trade credit insurance to all companies, to avoid the need for buyers of goods or services to pay in advance, therefore reducing their immediate liquidity needs. In November 2020, another EUR 216 million scheme was introduced to support SME liquidity through guarantees of the factoring products. The scheme applies only to factoring products with recourse against the seller. The support was offered in the form of state guarantees of up to 50% issued by the National Guarantee Fund for SMEs through the SME Factor programme. The approved ceiling for 2021 is RON 1 billion.
To help companies access financing, in 2020 the government enabled a state aid scheme under the Temporary Framework developed by the European Commission to support the economy in the context of the coronavirus outbreak. The aid was provided in the form of state guarantees for loans (the guarantee ceiling in 2020 was RON 20 billion) and direct grants to cover interest and some related fees. The aim of the scheme is to help businesses cover their immediate working capital or investment needs, thus ensuring the continuation of their activities. A guarantee scheme of about RON 1.5 billion (0.15% of GDP) was also adopted to
-50%
-40%
-30%
-20%
-10%
0%
10%
20%
30%
Basicmaterials
Consumercyclicals
Consumernon-cyclicals Energy Financials Healthcare Industrials Technology Utilities
Q1-YoY Q2-YoY Q3-YoY

CHAPTER I. THE ROMANIAN CORPORATE SECTOR
OECD Capital Market Review of Romania 2021: Mapping Report 43
support the procurement of work equipment by SMEs. In July, the EC approved an additional RON 4 billion (approximately EUR 800 million) Romanian scheme to support companies affected by the coronavirus outbreak. The scheme offered subsidised loans and state guarantees on loans to SMEs with a turnover over RON 20 million (approximately EUR 4 million) in 2019 and to large companies. The scheme is managed by the development bank arm of Export Import Bank of Romania (“EximBank”), acting on behalf of the Romanian State. In August, another EUR 935 million was made available to support SMEs active in specific sectors and certain large companies related to the eligible SMEs. The help was provided in the form of direct grants for working capital and productive investments and was co-financed by the European Regional Development Fund. In addition, the government has established the programme IMM Invest Romania, which is aimed at facilitating SME’s access to financing. Under the programme, companies are able to receive financing to support their activities and investments through banks loans guaranteed up to 90% by the Fondul National de Garantare a Creditelor pentru Intreprinderile Mici si Mijlocii (FNGCIMM). Additionally, the state aid covers the payment of the interest costs for the first 8 month of each loan. The total ceiling of guarantees in 2020 was RON 20 billion, with an additional RON 15 billion in 2021. By the end of December 2020, 25 586 guarantees had been issued by FNGCIMM for a total amount of almost RON 12 billion.
To help companies acquire equipment, the Romanian authorities implemented the SME leasing of equipment and machinery programme to encourage and stimulate the development of SMEs. The programme supports SMEs' access to financing for the purchase of new or second-hand equipment and provides the necessary financial flows through specific sell-and-lease-back operations. In 2020, the total ceiling of guarantees that could be granted under the programme was RON 1.5 billion. In 2021 it is RON 2 billion. To help the airline industry, a EUR 1 million scheme was established to support the airlines resuming or starting flights to and from Oradea airport in Romania. The aid was in the form of direct grants and was accessible to all interested airlines, with a limit of EUR 800 000 per company. An additional EUR 1.7 million scheme was approved to support airlines resuming or starting flights to and from Sibiu airport in Romania. In addition, in August 2020, the EC approved a Romanian direct grant of approximately EUR 1 million (RON 4.8 million) to compensate the Timișoara Airport for the high operating losses incurred in the context of the coronavirus outbreak. In November, another EUR 4.4 million was assigned to compensate regional airport operators for the damage suffered due to the COVID-19 pandemic. The scheme was targeted at operators of Romanian airports with an annual traffic turnover of between 200 000 to 3 million passengers, which are to be compensated with direct grants for net losses incurred between March 16th and June 30th 2020. Two airline companies have also received direct aid. In October 2020, a loan guarantee of up to the equivalent of about EUR 62 million was granted to the Romanian airline Blue Air and in December the Romanian state-owned airline, TAROM, received a loan guarantee of up to the equivalent of about EUR 19.3 million. To help companies active in the pig and poultry breeding sectors, as well as wine producers, two schemes with a total budget of EUR 47.4 million were established in September 2020. The support will be provided in the form of direct grants. The aim of the schemes is to help companies address their liquidity needs and continue their operations in order to ultimately secure food and feed materials for the food industry and to maintain jobs. For each of the sectors, the schemes are expected to benefit over 1 000 companies. On November 2020, the EC authorised a EUR 12.4 million scheme to support wine producers. The support is offered in the form of direct grants and is also expected to benefit over 1 000 producers (European

CHAPTER I. THE ROMANIAN CORPORATE SECTOR
44 OECD Capital Market Review of Romania 2021: Mapping Report
Commission, IMF Policy Tracker). In 2021, as part of the SME Invest Romania programme, AGRO SME Invest was established to support SMEs operating in the agriculture, fisheries, aquaculture and food sectors. For 2021, from the total RON 15 billion ceiling approved for the SME Invest Programme, an amount of RON 1 billion will be allocated to the AGRO SME Invest programme. In addition to the above mentioned measures, on April 2020 the Romanian Financial Supervisory Authority (ASF) increased the threshold for private pension funds to invest in government securities. In particular, private pension funds were allowed to invest up to 70% of the total value of the fund’s assets in government securities issued by the Romanian state or by other EU countries. In addition, in March 2020, the ASF lowered the notification threshold for net short positions in relation to shares traded on the regulated market to 0.1% of the issuer’s share capital (Schonherr, 2020). The ASF has also established a 25% discount on all tariffs, taxes, quotas and contributions collected from regulated entities during the state of emergency (ASF, 2020c).

OECD Capital Market Review of Romania 2021: Mapping Report 45
CHAPTER II. THE ROMANIAN PUBLIC EQUITY MARKET
Equity capital plays an important role in financing long-term investments that include research, development and innovation with uncertain outcomes. Equity is particularly well-suited to finance investments in intangible assets without strict collateral requirements compared to loan financing. Equity capital also plays an important role in providing companies with the financial soundness and flexibility that is needed to endure crises and meet financial obligations. For example, following the outbreak of the COVID-19 pandemic in 2020, both already and new listed companies raised significantly higher amounts of equity capital through the public markets worldwide compared with the previous years. This chapter describes the equity market landscape in Romania, including the market infrastructure and recent developments. It provides an overview of the listed corporate sector and the main trends in the use of equity markets with respect to both initial public offerings (IPOs) and secondary public offerings (SPOs) as well as delistings from the stock market. It also illustrates the ownership structure of listed companies in Romania.
2.1. Stock market developments in Romania
After a long period of inactivity, the Bucharest Stock Exchange (BVB) was re-established as a public interest institution in 1995 and later that year the first trading session took place. In 1997, the exchange listed the first companies of national importance and created the first stock market index BET. The exchange was demutualised and became a joint-stock company in 2005. The BVB also merged with Rasdaq, the Electronic Exchange of Securities from Bucharest that same year. In 2010, the BVB became a listed company with its shares trading on the Regulated Market. In 2015, the exchange launched the AeRO market, an alternative trading system (ATS) dedicated to serving SMEs. By the end of 2020, 72.17% of BVB’s share capital was in the hands of Romanian institutional investors, 5.25% was owned by foreign institutional investors and 19.96% by Romanian private individuals (BVB, 2021). The Financial Supervisory Authority (FSA) had as one of its main objectives since 2014 to develop the capital market. An important milestone for the Romanian capital market was the upgrade from Frontier to Secondary Emerging market status by the global index provider FTSE Russell. The decision was made in 2019 after Romania had been on the monitoring list for three years and it took effect in September 2019. The reclassification as secondary emerging market increases the visibility of the Romanian stock market and decreases the country risk premium since the new status places Romania in the investable universe of a wider range of investors. In addition, a series of measures were adopted aiming at increasing transparency, easing market access overall raising the attractiveness of the local capital market.

CHAPTER II. THE ROMANIAN PUBLIC EQUITY MARKET
46 OECD Capital Market Review of Romania 2021: Mapping Report
Table 5. Key dates and developments for the Bucharest Stock Exchange
2020 EBRD launched an analysis and research programme to develop medium-sized listed companies. 2019 FTSE Russell promoted Romania to the status of Secondary Emerging Market from Frontier Market.
2016 FTSE Russell included Romania in the list of countries with potential to be upgraded to Emerging Market. Launch of the Issuers Reporting Information System (IRIS). Launch of the new version of the ArenaXT Web trading platform.
2015 Launch of AeRO market. BVB became a partner exchange to the United Nations Sustainable Stock Exchanges Initiative. BVB became a member of the United Nations Sustainable Stock Exchanges Initiative.
2014 BVB organised the first forum for retail investors and adopted the 10 Steps towards civic shareholding. Implementation of changes to trading system and practices, and measures targeting issuers. Legislative measures supported by the Great Barriers Shift Task Force.
2010 On June 8, the Bucharest Stock Exchange listed its own shares on the Regulated Market.
2007 Romania became a member of the European Union. BVB became an affiliated member of the World Federation of Exchanges (WFE).
2006 The Central Securities Depository was established. BVB became a member of the World Federation of Exchanges.
2005 BVB became a joint-stock company. The merger with Rasdaq market was finalised.
2003 Introduction of the new trading system Arena. BVB became a full member of the Federation of Euro-Asian Stock Exchanges (FEAS).
2002 BVB became a correspondent member of the Federation of the European Securities Exchanges (FESE). 1997 Launch of the first market index: BET. 1995 BVB was re-established as a public interest institution. 1882 BVB was officially established.
Source: Bucharest Stock Exchange.
2.2. Stock market infrastructure
The reform process that took place in Romania during the 1990s provided the legal and regulatory framework for the creation and operation of private corporations. The enterprise reform of 1990 (Law no.15/1990) gave birth to commercial companies and the country also adopted the Commercial Companies Law to regulate the functioning of these entities. The process was accompanied by market reforms including a competition law and price liberalisation. As part of the reform process, the capital market in Romania was fully recreated in 1994 with the Law no. 52/1994 about the functioning of securities and stock exchanges (OECD, 2001). In April 1995, the Bucharest Stock Exchange was re-established as a public interest institution. In 2006, the Central Securities Depository (CSD) was established, with the mission to ensure the clearing and settlement of transactions. This institution keeps records of the issuers’ shareholder registries. Today, the BVB remains the major shareholder of the CSD holding a 69% stake, the rest being in hands of other private entities. As in other countries, the central securities depository in Romania is a key institution for the functioning of the capital market. It provides and maintains securities accounts at the top tier level in the RoClear system (‘central maintenance service’) and provides the initial recording
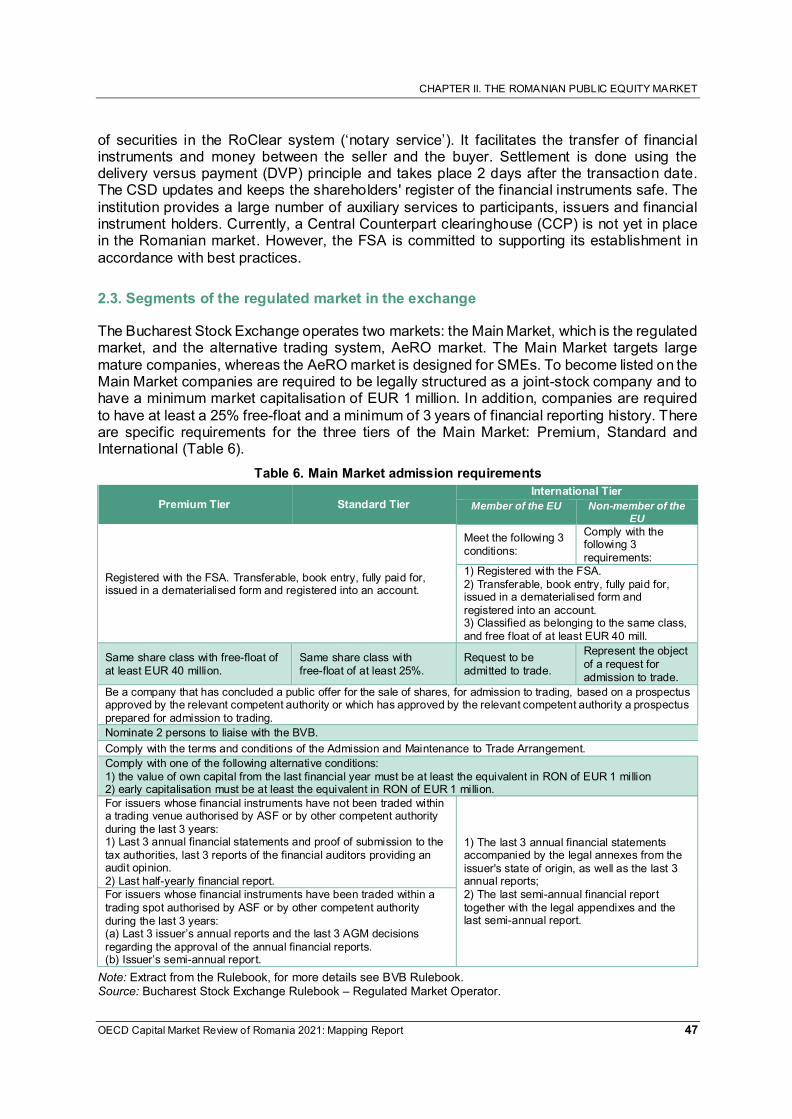
CHAPTER II. THE ROMANIAN PUBLIC EQUITY MARKET
OECD Capital Market Review of Romania 2021: Mapping Report 47
of securities in the RoClear system (‘notary service’). It facilitates the transfer of financial instruments and money between the seller and the buyer. Settlement is done using the delivery versus payment (DVP) principle and takes place 2 days after the transaction date. The CSD updates and keeps the shareholders' register of the financial instruments safe. The institution provides a large number of auxiliary services to participants, issuers and financial instrument holders. Currently, a Central Counterpart clearinghouse (CCP) is not yet in place in the Romanian market. However, the FSA is committed to supporting its establishment in accordance with best practices.
2.3. Segments of the regulated market in the exchange
The Bucharest Stock Exchange operates two markets: the Main Market, which is the regulated market, and the alternative trading system, AeRO market. The Main Market targets large mature companies, whereas the AeRO market is designed for SMEs. To become listed on the Main Market companies are required to be legally structured as a joint-stock company and to have a minimum market capitalisation of EUR 1 million. In addition, companies are required to have at least a 25% free-float and a minimum of 3 years of financial reporting history. There are specific requirements for the three tiers of the Main Market: Premium, Standard and International (Table 6).
Table 6. Main Market admission requirements
Premium Tier Standard Tier International Tier
Member of the EU Non-member of the
EU
Registered with the FSA. Transferable, book entry, fully paid for, issued in a dematerialised form and registered into an account.
Meet the following 3 conditions:
Comply with the following 3 requirements:
1) Registered with the FSA. 2) Transferable, book entry, fully paid for, issued in a dematerialised form and registered into an account. 3) Classified as belonging to the same class, and free float of at least EUR 40 mill.
Same share class with free-float of at least EUR 40 million.
Same share class with free-float of at least 25%.
Request to be admitted to trade.
Represent the object of a request for admission to trade.
Be a company that has concluded a public offer for the sale of shares, for admission to trading, based on a prospectus approved by the relevant competent authority or which has approved by the relevant competent authority a prospectus prepared for admission to trading. Nominate 2 persons to liaise with the BVB. Comply with the terms and conditions of the Admission and Maintenance to Trade Arrangement. Comply with one of the following alternative conditions: 1) the value of own capital from the last financial year must be at least the equivalent in RON of EUR 1 million 2) early capitalisation must be at least the equivalent in RON of EUR 1 million. For issuers whose financial instruments have not been traded within a trading venue authorised by ASF or by other competent authority during the last 3 years: 1) Last 3 annual financial statements and proof of submission to the tax authorities, last 3 reports of the financial auditors providing an audit opinion. 2) Last half-yearly financial report.
1) The last 3 annual financial statements accompanied by the legal annexes from the issuer's state of origin, as well as the last 3 annual reports; 2) The last semi-annual financial report together with the legal appendixes and the last semi-annual report.
For issuers whose financial instruments have been traded within a trading spot authorised by ASF or by other competent authority during the last 3 years: (a) Last 3 issuer’s annual reports and the last 3 AGM decisions regarding the approval of the annual financial reports. (b) Issuer’s semi-annual report.
Note: Extract from the Rulebook, for more details see BVB Rulebook. Source: Bucharest Stock Exchange Rulebook – Regulated Market Operator.

CHAPTER II. THE ROMANIAN PUBLIC EQUITY MARKET
48 OECD Capital Market Review of Romania 2021: Mapping Report
The AeRO market is designed to serve the needs of SMEs that do not yet meet the size or the time-of-operation criteria necessary for listing on the Main Market. In order for a company to be listed on AeRO, it needs to have an anticipated market value of at least EUR 250 000 and a minimum of 10% free-float or at least 30 shareholders. Companies seeking to raise capital on the AeRO market have to be established as a joint-stock company (SA) prior to the listing. A summary of the main requirements are listed in Table 7 below.
Table 7. AeRO Market admission requirements Premium Tier Standard Tier MTS International
Registered with the ASF. Request the trade within MTS. Confirmation of Central Depository regarding the fulfilment of clearing - settlement and registration conditions, or performed by another central depository of another state.
Be freely transferable, fully paid, issued in dematerialised form and evidenced by registration in the account Free-float to be at least 10% of the issued shares or the number of shareholders to be at least 30. Foreseeable capitalisation of at least the EUR 250 000.
A request from a participant who assumes the obligations of market maker. The company must have a contract with an Authorised Advisor and to
remain in it at least 12 months after the admission to trading.
Have an agreement with the Central Depository or, to have the confirmation of the Central Depository regarding the fulfilment of conditions of clearing, settlement and registration necessary for the trading of the respective financial instruments.
Financial Instruments issued in a third country and traded on a market equivalent to a regulated market in that country can be introduced to trading on MTS International only if they are “share” type. Sign the Contract between BVB and Issuer provided in Appendix
no. 2 of the current Rulebook. Note: Extract from the Rulebook, for more details see BVB Rulebook. Source: Bucharest Stock Exchange Rulebook – Multilateral Trading System.
In 2008, the Bucharest Stock Exchange (BVB) adopted a corporate governance code to be implemented by listed companies on a comply-or-explain basis. The code was most recently revised in 2015 and then entered into force in January 2016. The BVB also provides a manual and a compendium of Corporate Governance Practices to help companies implement the code. All companies listed on the Main Market are supposed to implement the Corporate Governance Code. They shall include a corporate governance statement in their annual report containing a self-assessment on how the “provisions to comply with” are observed and include the measures taken to comply with provisions that are not fully met. The code establishes some specific requirements for the companies listed on the Standard and Premium tiers. For example, companies listed on the Standard tier should have at least one independent board member in their board of directors or in the supervisory board. For companies listed on the Premium tier, no less than two non-executive members of the board of directors or supervisory board should be independent. In addition, these companies are required to set up a nomination committee formed of non-executives, which will lead the process for board appointments and make recommendations to the board. Additionally, the majority of the members of the nomination committee of the Board of Premium tier companies should be independent. Moreover, regarding the risk management and internal control system the boards of companies listed on any of the three tiers of the Main Market should set up an audit committee with at least one independent non-executive member. In the case of Premium tier companies, the audit committee should be composed of at least three members and the majority should be independent.

CHAPTER II. THE ROMANIAN PUBLIC EQUITY MARKET
OECD Capital Market Review of Romania 2021: Mapping Report 49
Table 8. Post-listing requirements Main Market AeRO
Initial promises fulfilment Investors need to be informed if the funds raised were spent in line with the company’s prospectus.
Mandatory reporting obligations
Investors need to be updated and informed regarding important events in the company's life. Major contracts, acquisitions, new product releases, litigations or other major developments should be communicated to the market, this also includes negative information.
Companies listed on the Main Market have to submit financial reports on a quarterly basis and it is recommended to do so in both Romanian and English.
AeRO listed companies have to submit annual reports, half-year reports and current reports. Quarterly reports are not mandatory, but highly recommended.
Financial Reporting
Best practices suggest that quarterly financial reports should be accompanied by conference calls or meetings with analysts and investors. The Main Market requires financial reporting in line with IFRS standards.
Investor Relations A contact point has to be established after a company lists its shares or bonds in order to carry out communication between the company and its investors, both current and potential.
Corporate Governance
Companies listed on the Main Market have to adhere to the highest standards of governance, as defined in the Bucharest Stock Exchange’s Code of Corporate Governance (in force since January 2016).
Companies listed on AeRO have no obligation to adhere to the BVB’s Code of Corporate Governance. Instead, the BVB has developed a specific set of Principles of Corporate Governance for companies listed on AeRO.
Source: Bucharest Stock Exchange.
In addition to the fees paid to the investment banks for underwriting their securities and to the auditors, companies also pay listing fees to the exchange and to the ASF (a percentage of the offering) as well as a prospectus fee and a registration fee (both also to the ASF). There are also fees related to the central depository functions. The fees paid to the exchange are comprised of a fixed processing fee, a variable admission fee and a maintenance fee (Table 9).
Table 9. Fees in the Bucharest Stock Exchange, as of December 2020 Processing Fee Admissions Fee Maintenance Fee
Premium Tier
RON 1 200 ~ EUR 246
RON 11 100 – 21 000 ~ EUR 2 275 – 4 303
RON 25 000 – 50 000 ~ EUR 5 123 – 10 246
Standard Tier RON 3 600 – 7 500 ~ EUR 738 – 1 537
RON 12 000 – 25 000 ~ EUR 2 459 – 5 123
International Shares Tier RON 3 600 – 7 500 ~ EUR 738 – 1 537
RON 25 000 – 50 000 ~ EUR 5 123 – 10 246
Source: Bucharest Stock Exchange.
2.4. Overview of the listed corporate sector
The Bucharest Stock Exchange has two segments, the Main Market – which is split into three tiers: Standard, Premium and International – and the Alternative Trading System (ATS) AeRO which includes the AeRO Base, AeRO Standard, AeRO Premium and the International Multilateral Trading System (MTS) tiers. The Main Market has 76 listed companies (as of December 2020), of which 54 (71%) are listed on the Standard tier (Table 10). The market capitalisation of the Main Market totals EUR 28.5 billion, with EUR 1.7 billion corresponding to the Standard tier, EUR 15.3 billion to the Premium and EUR 11.5 billion to the

CHAPTER II. THE ROMANIAN PUBLIC EQUITY MARKET
50 OECD Capital Market Review of Romania 2021: Mapping Report
International tier. The AeRO Market has 256 listed companies of which 222 (87%) are in the Standard tier. The market capitalisation of this segment adds up to EUR 718 billion, although 99.8% of this capitalisation corresponds to the 15 German companies present in the MTS tier.
Table 10. Number of listed companies, as of December 2020 Segment Tier No. of companies Market capitalisation (EUR M)
Main Market Standard 54 1 665 Premium 19 15 285 International 3 11 501
ATS
AeRO Base 3 2 AeRO Standard 222 1 050 AeRO Premium 16 147 International-MTS 15 716 757
Note: Excluding investment funds and REITs. Source: Bucharest Stock Exchange.
With respect to the industry distribution of the listed companies of the BVB, Industrials accounts for 26% and 36% of the number of listed companies on the Main Market and the AeRO Market, respectively (Figure 31). Companies from the Consumer cyclicals are also important issuers on the BVB, representing more than 20% of the listed companies on both segments. While 11% of the companies listed on the Main Market are Financials (8 companies), their share on the AeRO market is 2% (5 companies). Moreover, 8% of the companies on the Main Market are Technology and Healthcare companies and in the AeRO Market their share totals only 2%.
Figure 31. Industry composition, by number of companies as of December 2020
Note: Excluding investment funds and REITs. Source: Bucharest Stock Exchange.
Since 2000, 31 new listings and 52 delistings have taken place on the Main Market of the Bucharest Stock Exchange (Figure 32, Panel A). Net listings were positive until 2007, a period when not a single company delisted from the market. However, since then, delistings have surpassed new listings and since 2018 no new listings have taken place on the Main Market. Since its inception in 2010, the ATS Market – AeRO – had 31 new company listings (Figure 31, Panel B). Regarding delistings, starting from the first delisting in 2015, a total of 31 companies delisted until 2019. In 2020, net listings on the AeRO Market were at a historical low level with only 2 new company listings and 13 delistings. In November 1996, the Rasdaq market was launched as an alternative equity exchange in which around 5 000 Romanian companies – following the Mass Privatisation Programme – were listed. Similar to the experiences in other transition economies, many of the listed companies were not able to meet the listing requirements and were subsequently forced to delist from the market (Pop, Georgescu and Balint, 2014). In December 2005, the Bucharest
13%
12%
21%
29%
5%
15%
12%
4%
11% 5% 26%
36%
3% 4%
0% 10% 20% 30% 40% 50% 60% 70% 80% 90% 100%
MainMarket
ATS
Basic Materials Cons. Cyclicals Cons. Non-Cyclicals Energy Financials
Healthcare Industrials Technology Telecomm. Utilities

CHAPTER II. THE ROMANIAN PUBLIC EQUITY MARKET
OECD Capital Market Review of Romania 2021: Mapping Report 51
Stock Exchange acquired Rasdaq and converted it into an over-the-counter electronic stock market. Over the 1996-2000 period Rasdaq’s reputation was plagued by share theft, price manipulation and severe opacity. In addition, in 2010, the absence of a legal status for Rasdaq as a trading platform added to the existing reputational concerns leading to a decline in the trading volume from 2012. Thus, after the BVB acquisition, only 8 new listings occurred coupled with more than 3 000 delistings until its dissolution in 2015, when almost 300 companies were transferred to the AeRO segment (Figure 32, Panel C).6
Figure 32. Newly listed and delisted companies
A. Main Market B. AeRO Market C. Rasdaq
Note: Excluding investment funds and REITs. Source: Bucharest Stock Exchange.
2.5. Trends in initial public offerings
A company wishing to raise equity can do so by listing its shares on one or more stock exchanges by conducting an initial public offering (IPO). This section describes the IPO activity in Romania and selected peer European countries during the last 20 years. Since 2000, 18 Romanian companies have conducted an IPO and together raised EUR 1.3 billion in proceeds. While from 2000 to 2009, 11 companies went public, the proceeds accounted for only 16% of the amount raised over the entire 2000-2019 period. During the 2010-2017 period, 7 companies raised 84% of the total proceeds (EUR 1.1 billion). No companies went public in 2018 and 2019. Although the IPO activity was more dynamic in Romania in the last 10 years compared to the early 2000s, the market has not yet fully developed as the number of companies making use of public equity markets remain limited and it still lags behind regional peers such as the Czech Republic, Austria, Poland and Germany. It only surpassed the IPO activity observed in Hungary, where a total of 15 IPOs raised a modest EUR 544 million since 2000 (Figure 33). Romanian IPOs accounted for only 0.24% of the total funds raised by EU companies through IPOs over the entire period.
6 These 300 companies transferred to the AeRO segment were not considered as new listings.
-15
-10
-5
0
5
10
'00 '04 '08 '12 '16 '20
New listings Delistings Net listings
-15
-10
-5
0
5
10
2000 '04 '08 '12 '16 '20
-15
-10
-5
0
5
10
2000 '04 '08 '12 '16 '20-1 300
-300
700
1 700
2 700
3 700
1996 '00 '04 '08 '12 '16 '20

CHAPTER II. THE ROMANIAN PUBLIC EQUITY MARKET
52 OECD Capital Market Review of Romania 2021: Mapping Report
Figure 33. Initial public offerings, 2000-2019
Source: OECD Capital Market Series dataset; see Annex for details.
The largest IPO by a Romanian company took place in 2014 when the electricity distribution and supply company Electrica SA raised a record amount of EUR 460 million, with a primary listing on the Bucharest Stock Exchange and a secondary listing on the London Stock Exchange (Table 11). Similarly, the natural gas production company SNGN Romgaz SA raised almost EUR 400 million in its IPO in 2013 with its primary listing on the BVB and secondary listing on the London Stock Exchange. Notably, 5 out of the 18 Romanian IPOs were conducted by a state-owned company, representing almost 90% of the total proceeds raised since 2000. The most recent 3 Romanian IPOs took place in 2017, when Sphera Franchise Group SA raised EUR 64 million, Transilvania Broker de Asigurare SA EUR 2 million and SC AAGES SA EUR 1.2 million.
Table 11. Romanian IPOs
Issuer Name Economic Sector SOE Year Proceeds (EUR K)
Electrica SA Utilities Yes 2014 456 234 SNGN Romgaz SA Energy Yes 2013 398 928 Societatae Nationala Nuclearelectrica SA Utilities Yes 2013 75 717 Transgaz SA Utilities Yes 2007 69 112 Sphera Franchise Group SA Cons. Cyclicals No 2017 63 999 MedLife SA Healthcare No 2016 43 388 Transelectrica SA Utilities Yes 2006 34 380 SC Teraplast SA Cons. Cyclicals No 2008 14 938 Flamingo International SA Technology No 2005 12 288 Alumil Rom Industry SA Cons. Cyclicals No 2006 8 892 Contor Group Industrials No 2008 3 258 Casa de Bucovina Club de Munte SA Cons. Cyclicals No 2007 2 747 Transilvania Broker de Asigurare SA Financials No 2017 1 961 M.J. Maillis Romania SA Basic Materials No 2001 1 579 SC AAGES SA Industrials No 2017 1 210 Vrancart SA Basic Materials No 2005 712 BRD Groupe Societe Generale SA Financials No 2002 31 SSIF BRK Financial Group SA Cons. Non-Cyclicals No 2005 3
Note: A company is considered as an SOE if the Public sector (see Section 2.8) holds over 20% of the equity capital. Source: OECD Capital Market Series dataset; see Annex for details.
0 5 10 15 20 25
Hungary
Romania
Czech Republic
Austria
Poland
Thousands
572
No. of IPOs
0 100 200 300 400 500 600
Germany
European Union
Thousands
Amount issued, 2019 EUR billions
748
52
14
18
15
3 684

CHAPTER II. THE ROMANIAN PUBLIC EQUITY MARKET
OECD Capital Market Review of Romania 2021: Mapping Report 53
Utilities company IPOs in Romania accounted for more than half of the total proceeds raised over the 2000-2019 period, followed by Energy companies that raised 33% of the total proceeds (Figure 34). This trend differs from other European peers where Utilities IPOs are much less common, representing only 19% of the proceeds in Poland and being almost absent in Austria, Germany, Hungary and the Czech Republic. While Consumer cyclicals IPOs make up 20% and 17% of the funds raised in the Czech Republic and Germany, respectively, in Romania their share was only 8%. Importantly, the Technology and Healthcare industries together account for only 5% of the Romanian IPOs, whereas in the European Union they make up 17% of total proceeds.
Figure 34. Industry distribution of IPOs by total proceeds, 2000-2019
Source: OECD Capital Market Series dataset; see Annex for details.
2.6. Trends in secondary public offerings
Companies that are already listed can raise additional equity on the primary public equity markets through secondary public offerings (SPOs or follow-on offerings). A company can make use of this recapitalisation source several times depending on its funding needs. The proceeds from the SPOs may be used for a variety of purposes and can also help fundamentally sound companies bridge a temporary downturn in economic activity. SPOs played an important role in providing the corporate sector with equity capital in the wake of the 2008 financial crisis and through the 2020 COVID-19 crisis. In the European Union, companies made extensive use of SPOs, raising almost EUR 2 trillion over the last 20 years (Figure 35). German firms alone raised almost 20% of the EU’s total proceeds. Austrian and Polish companies also tapped the SPO market regularly over the 2000-2019 period, with proceeds of EUR 42 billion and EUR 30 billion respectively. However, companies in the Czech Republic, Hungary and Romania together accounted for only 0.36% of the total EU proceeds, amounting to EUR 6.4 billion.
0% 10% 20% 30% 40% 50% 60% 70% 80% 90% 100%
Hungary
Romania
Czech Republic
Austria
Poland
Germany
European Union
Basic Materials Cons. Cyclicals Cons. Non-Cyclicals Energy Financials
Healthcare Industrials Technology Telecomm. Utilities

CHAPTER II. THE ROMANIAN PUBLIC EQUITY MARKET
54 OECD Capital Market Review of Romania 2021: Mapping Report
Figure 35. Secondary public offerings, 2000-2019
Source: OECD Capital Market Series dataset; see Annex for details.
Since 2000, Romanian companies have conducted 28 SPOs raising a total of EUR 1.9 billion, the lowest amount among the European peer countries (Figure 36). Indeed, until 2008, SPO activity in Romania was non-existent, with the exception of one Consumer cyclicals company back in 1996. Since 2008, an average of 2 SPOs have taken place annually. In terms of proceeds raised, 2011 saw a record amount of EUR 554 million to a large extent driven by the state-controlled energy company OMV Petrom SA’s first SPO. In 2016, the SPO activity in Romania was driven by the second SPO of OMV Petrom SA and the offering by another state-controlled energy company SNGN Romgaz SA that together raised a total amount of EUR 305 million. Importantly, in 2018 and 2019 only one company did an SPO.
Figure 36. Romanian SPOs
Source: OECD Capital Market Series dataset; see Annex for details.
Financial companies are usually frequent users of secondary offerings. In the European Union, Financials account for 37% of the total proceeds raised through SPOs since 2000 (Figure 37). Particularly, Polish and Austrian financial companies accounted for more than half of the total proceeds raised in those countries. In Germany, Financials represented 32%, in the Czech Republic 27% and in Romania for 26% of the proceeds raised. In Hungary, Financials are less prominent, representing only 9% of the total proceeds. Apart from Financials, Energy and Basic materials companies have been important users of SPOs in Romania, accounting for 43% and 24% of the amount raised, respectively. While in the European Union, Technology and Healthcare SPOs together represent 9% of the funds raised, in Romania companies from those two industries have never conducted an SPO.
0 10 20 30 40
Romania
Hungary
Czech Republic
Poland
Austria
Thousands
1 426
No. of SPOs
0 500 1 000 1 500 2 000
Germany
European Union
Thousands
Amount issued, 2019 EUR billions
147
799
10
13
28
9 464
0
2
4
6
8
0
200
400
600
2008 '09 '10 '11 '12 '13 '14 '15 '16 '17 '18 '19
Total proceeds Number of SPOs (RHS)
2019 EUR, millions No. of SPOs

CHAPTER II. THE ROMANIAN PUBLIC EQUITY MARKET
OECD Capital Market Review of Romania 2021: Mapping Report 55
Figure 37. Industry distribution of SPOs by total proceeds, 2000-2019
Source: OECD Capital Market Series dataset; see Annex for details.
2.7. Trends in secondary stock market activity
The level of liquidity in the secondary stock market is an important factor influencing investors’ demand for stocks, as greater liquidity reduces the risk premium of holding stocks and increases the efficiency of the price discovery mechanism. A liquid market may also help attract more issuers, who would expect the market to price their securities more accurately. Importantly, empirical evidence shows that low liquidity levels can increase the cost of equity for companies wanting to raise capital as investors require a higher expected return to compensate for the extra risk of reduced liquidity (IMF, 2016). Over the past years, liquidity measured as the turnover ratio has been low in Romania, averaging 6.8% since 2015 on the Main Market of the BVB. The situation is not different on the alternative AeRO market, where the average turnover ratio has been 3.1% (Figure 38, Panel A). Other markets in the CEE region such as the Czech Republic, Austria, Hungary or Poland also had liquidity levels well below the EU average of 58%, but Romania ranked by far the lowest as shown in Panel B of Figure 38.
Figure 38. Stock market turnover ratio A. Romania, 2015-2020 B. European peers (2019)
Note: Turnover ratio in Panel A corresponds to the total value traded over the market capitalisation. In Panel B, the turnover ratio is the value of domestic shares traded divided by their market capitalisation. The value is annualised by multiplying the monthly average by 12. Source: Bucharest Stock Exchange, World Federation of Exchanges.
0% 10% 20% 30% 40% 50% 60% 70% 80% 90% 100%
Romania
Hungary
Czech Republic
Poland
Austria
Germany
European Union
Basic Materials Cons. Cyclicals Cons. Non-Cyclicals Energy FinancialsHealthcare Industrials Technology Telecomm. Utilities
0%
2%
4%
6%
8%
10%
2015 '16 '17 '18 '19 '20
Main Market AeRO
0% 20% 40% 60%
Romania
Czech Republic
Austria
Hungary
Poland
European Union
Germany

CHAPTER II. THE ROMANIAN PUBLIC EQUITY MARKET
56 OECD Capital Market Review of Romania 2021: Mapping Report
2.8. Investors and ownership structure in the Romanian stock market
By the end of 2019, there were 77 companies listed on the regulated market of the Bucharest Stock Exchange. Industrials companies accounted for over one-quarter of the total, followed by Consumer cyclical companies that represent 21%. However, by market capitalisation, Energy companies account for almost half of the total listed equity with financial companies representing another 26%.
Figure 39. Industry composition of listed companies in Romania A. Number of listed companies by industry B. Market capitalisation by industry
Source: OECD Capital Market Series dataset, FactSet, Thomson Reuters, Bloomberg; see Annex for details.
Ownership information was available for 59 of the listed companies on the regulated market of the exchange. To identify the ownership structure, investors were classified into the following categories of investors: corporations, public sector, strategic individuals, institutional investors and other free-float (De La Cruz, Medina and Tang, 2019). At the market level, private corporations and holding companies is the largest investor category holding 30% of the listed equity (Figure 40). Their relative importance as owners in the equity market is much higher compared with other European peer countries and the EU. The public sector ranks second owning 29% of the total market capitalisation. Institutional investors are not large investors in the Romanian market compared with their relevance in other European markets such as Germany, Hungary and Poland where they own around 30% of the listed equity.
Figure 40. Ownership landscape at the country level, 2019
Source: OECD Capital Market Series dataset, FactSet, Thomson Reuters, Bloomberg; see Annex for details.
14%
0
5
10
15
20
25
1
Basic materials Cons. cyclicals Cons. non-cyclicals Energy Financials Healthcare Industrials Technology Utilities
14%
21%
5%
12%10%
5%
26%
3% 4%
Basic materials Cons. cyclicalsCons. non-cyclicals EnergyFinancials HealthcareIndustrials TechnologyUtilities
3%
48%26%
4%
2%4%
10%
Basic materials Cons. cyclicalsCons. non-cyclicals EnergyFinancials HealthcareIndustrials TechnologyUtilities
23%
21%
17%
20%
20%
30%
16%
20%
34%
7%
9%
17%
29%
8%
6%
8%
5%
12%
2%
10%
25%
25%
30%
34%
29%
15%
32%
27%
20%
38%
33%
22%
24%
35%
0% 20% 40% 60% 80% 100%
Austria
Czech Republic
Germany
Hungary
Poland
Romania
EU
Corporations Public sector Strategic individuals Institutional investors Other free-float

CHAPTER II. THE ROMANIAN PUBLIC EQUITY MARKET
OECD Capital Market Review of Romania 2021: Mapping Report 57
The ownership structure in the Romanian stock market is fairly concentrated (Figure 41, Panel A). In six of every ten listed companies the largest single shareholder holds over 50% of the equity capital. This level of control and concentration is much higher than what is observed in other European countries shown in the figure. More importantly, corporations and holding companies are not only the largest owners at the aggregate level, they are also the most common largest shareholders at the company level as they own on average 54% of the equity in almost 40% of the listed companies (Figure 41, Panel B). The public sector is also an important owner, but in fewer companies. They hold an average of 56% of the listed equity in 17% of the listed companies. The institutional investors that are the largest owner in 19% of the companies are predominantly mutual funds and investment advisors.
Figure 41. Ownership concentration, 2019 A. Share of listed companies where the largest
shareholder owns >50% equity capital B. Identity of the largest owner in Romania
Source: OECD Capital Market Series dataset, FactSet, Thomson Reuters, Bloomberg; see Annex for details.
The public sector plays an important role in the Romanian economy as the country is reported to have the largest number of SOEs in Europe (Statecapture, 2018). Indeed, by the end of 2016 Romanian SOEs accounted for a high share in total employment and contribution to the total value added compared to SOEs from many countries in the region (IMF, 2019). The government is also a majority shareholder in 10 listed companies. At the industry level, public sector holdings are concentrated in Utilities and Energy companies (Figure 42, Panel A). As of end 2020, almost half of the market capitalisation related to the Energy industry, which is the largest industry in the stock market, was held by the public sector. With respect to the ownership by institutional investors, two-thirds was in the hands of domestic institutional investors and one-third was held by foreign institutions (Figure 42, Panel B).
0%
20%
40%
60%
CzechRepublic
Romania Hungary Austria Poland Germany0
10
20
30
40
50
60
Corporate Public sector Strategicindividuals
Institutionalinvestors
Ownership (share of equity) Share of companies
per cent

CHAPTER II. THE ROMANIAN PUBLIC EQUITY MARKET
58 OECD Capital Market Review of Romania 2021: Mapping Report
Figure 42. Public sector and institutional investor ownership in Romania (as of end 2020) A. Public sector ownership B. Institutional investor ownership
Source: OECD Capital Market Series dataset, FactSet, Thomson Reuters, Bloomberg; see Annex for details.
As mentioned above, private corporations and holding companies is the largest category of investors in the Romanian stock market holding 30% of the listed equity. Domestic corporate investors concentrate their holdings in Telecommunications and Industrials companies, while foreign corporate investors hold significant stakes in the Healthcare, Financials, Energy, Consumer non-cyclicals and Basic materials industries (Figure 43, Panel A). Foreign corporate investors account for 87% of corporate investors’ total holdings in Romania. Half of the foreign corporations and holding companies who invest in the Romanian equity market are from Austria; 26% are from France and 6% are from the Netherlands (Figure 43, Panel B).
Figure 43. Corporate ownership in Romania A. Corporate ownership at the industry level B. Foreign corporate investors
Source: OECD Capital Market Series dataset, FactSet, Thomson Reuters, Bloomberg; see Annex for details.
83%
50%
10%
9%
8%
4%
2%
2%
1%
0% 20% 40% 60% 80%
Utilities
Energy
Financials
Healthcare
Industrials
Consumer non-cyclicals
Basic materials
Telecomm.
Consumer cyclicals
34%
66%
0%
10%
20%
30%
40%
50%
60%
70%
Foreign Domestic
0% 20% 40% 60% 80% 100%
Basic materialsCons.cyclicals
Cons. non-cyclicalsEnergy
FinancialsIndustrials
Telecomm.Utilities
Basic materialsCons.cyclicals
Cons. non-cyclicalsEnergy
FinancialsIndustrialsHealthcare
Dom
estic
For
eign
Austria50%
Czech Rep.5%
France26%
Kazakhstan5%
Netherlands6%
Russia4%
UK4%

OECD Capital Market Review of Romania 2021: Mapping Report 59
CHAPTER III. CORPORATE BOND MARKET IN ROMANIA
Corporate bond markets have become an increasingly important source of financing for non-financial corporations over the past decade. They played a crucial role when banks tightened credit conditions after the 2008 financial crisis and during the market contraction in 2020. During these two periods, many companies around the world were able to tap the corporate bond market to roll over their existing debt, create a financial buffer to overcome an economic downturn or immediately use the proceeds to meet their obligations to employees, suppliers and customers. At the same time, since corporate bonds typically allow the borrower to issue debt at longer maturities compared to bank loans, they are also well-suited to finance long-term investments. This chapter provides an overview of the trends in corporate bond markets both in Romania and at the global level. It also presents selected features of the corporate bonds issued by companies from Romania and peer countries, such as the maturity structure, currency composition and listing market.
3.1. Trends in corporate bond issuance
The last two decades have seen a remarkable increase in global debt levels, and corporate bonds are no exception to this trend. Particularly, non-financial companies have seen a stable increase in bond issuances. With the significant contraction of bank lending to non-financial companies during and after the global financial crisis, non-financial companies resorted to corporate bonds as an alternative source of financing. As shown in Panel A of Figure 44, non-financial corporations have raised an average of EUR 1.4 trillion annually between 2008 and 2019, which is almost twice the annual amount of EUR 801 billion that they raised between 2000 and 2007. A look into the regional distribution indicates that each region has seen a different evolution of the corporate bond market (Figure 44, Panel B). Europe has experienced a relatively slow nominal increase compared to other regions, and thus its share of proceeds decreased from around 30% of the global amount issued before the 2008 crisis to 20% in 2019.
Figure 44. Global corporate bond issuances A. Sectoral distribution of issuances B. Regional distribution of issuances
by non-financial corporations
Source: OECD Capital Market Series dataset, Thomson Reuters Eikon; see Annex for details.
0
1 000
2 000
3 000
'01 '03 '05 '07 '09 '11 '13 '15 '17 '19
Financials Non-financials
2019 EUR, billions
0
500
1 000
1 500
2 000
2 500
'01 '03 '05 '07 '09 '11 '13 '15 '17 '19
Th
ou
san
ds
United States EuropeChina Other Advanced MarketsOther Emerging Economies
2019 EUR, billions

CHAPTER III. CORPORATE BOND MARKET IN ROMANIA
60 OECD Capital Market Review of Romania 2021: Mapping Report
Within Europe, companies from the United Kingdom, France and the Netherlands have been the largest users of corporate bonds, together accounting for over half of total European proceeds. Corporate bonds issued by CEE companies represent only about one to two percent of the European proceeds, which is much lower than the CEE region share in European GDP (Figure 45). 2019 was an exception, as corporate bond issuances by non-financial companies from CEE countries reached EUR 22 billion amounting to 6% of the European total proceeds. However, this was mainly driven by one large bond issue carried out by a Polish construction company.
Figure 45. Corporate bond issuances by non-financial European companies
Note: Nordic countries include Denmark, Finland, Norway and Sweden. Source: OECD Capital Market Series dataset, Thomson Reuters Eikon; see Annex for details.
A closer look at the bond issuances by CEE companies shows an increasing use of corporate bonds after the financial crisis when banks strengthened borrowing requirements. As shown in Panel A of Figure 46, in 2012, corporate bond issuances reached a total of more than EUR 16 billion, issued by 332 companies, the second highest over the analysed period. Meanwhile, corporate bond activity has remained relatively low in Romania, where non-financial companies raised only EUR 349 million over the last decade (Figure 46, Panel B). The number of companies issuing corporate bonds decreased significantly after 2011, and only one company issued bonds in 2015. However, since the launch of the AeRO market in 2015, which targets SME financing, the number of issues have seen a significant increase.
Figure 46. Corporate bond issuances by companies from CEE countries and Romania A. CEE countries B. Romania
Source: OECD Capital Market Series dataset, Thomson Reuters Eikon; see Annex for details.
0%
1%
2%
3%
4%
5%
6%
7%
0
100
200
300
400
500
2 000 '01 '02 '03 '04 '05 '06 '07 '08 '09 '10 '11 '12 '13 '14 '15 '16 '17 '18 '19
CEE United Kingdom France GermanyItaly Luxembourg Netherlands Nordic countriesOthers Share of CEE (RHS)
2019 EUR, billions
0
100
200
300
400
0
10
20
30
'01 '03 '05 '07 '09 '11 '13 '15 '17 '19
Non-financials Financials Number (RHS)
2019 EUR, billions
0
4
8
12
16
0
400
800
1 200
'01 '03 '05 '07 '09 '11 '13 '15 '17 '19
Non-financials Financials Number (RHS)
2019 EUR, millions

CHAPTER III. CORPORATE BOND MARKET IN ROMANIA
OECD Capital Market Review of Romania 2021: Mapping Report 61
Corporate bond activity in CEE countries still lags behind the rest of Europe as the average proceeds of non-financial companies during the 2009-2019 period amount to 0.4% of GDP, which is well below the European level of 2% (Figure 47, Panel A). In Romania, the value of corporate bond issuances between 2009 and 2019 represented only around 0.01% of GDP, compared with 0.3% for Hungary and 0.5% for Poland.
Figure 47. Corporate bonds issued by non-financial companies in Romania and selected European countries
A. Proceeds, % of GDP B. Industry distribution
Source: OECD Capital Market Series dataset, Thomson Reuters Eikon; see Annex for details.
The industry composition of European non-financial companies issuing corporate bonds is more evenly distributed across industries compared to the bonds issued by companies from the CEE region, where around 63% of the proceeds come from three industries: Utilities, Consumer cyclicals and Energy (Figure 47, Panel B). In the case of Romania, almost 72% of proceeds are from companies in the Utilities and Telecommunications services industries. Moreover, with the recent launch of the AeRO market targeting SMEs, there has been a few Technology companies issuing corporate bonds, although the amounts are relatively small.
One of the main advantages of corporate bonds is that they can offer the issuer longer maturities. It is documented that corporate bonds have about 4-5 years longer maturity than syndicated loans in developed countries and 1-2 years longer for developing countries (Cortina-Lorente, Didier and Schmukler, 2016). In recent years, as a result of the general low level of interest rates, companies have been lengthening the maturity of their issuances (Çelik, Demirtaş and Isaksson, 2020). In Europe, it is observed that most of the volume issued has a maturity of between 5 to 10 years. Bonds issued by non-financial companies from the CEE region show an even higher share of the volume issued with maturities in that range (Figure 48, Panel A). However, the share of the volume issued with maturities over 10 years is higher for European issuers than for issuers from the CEE region. Particularly, over 35% of the amount raised by European companies via corporate bonds has a maturity longer than ten years, compared to 16% for issuers from the CEE region. Indeed, 27% of bond issuances by Romanian companies have a maturity of less than five years, compared to 3% and 10% for Hungarian and Polish companies. Notably, during the entire period, there was no single Romanian corporate bond issuance with a maturity over ten years. Only 8% of the total number of corporate bonds issued by Romanian non-financial companies are listed on the Bucharest Stock Exchange (Figure 48, Panel B). This is much less than in Hungary and Poland where 34% and 67% of non-financial corporate bonds are listed on the local stock exchanges.
0% 1% 2%
Poland
Hungary
Czech Rep.
Romania
CEE
Germany
Austria
Europe
2009-2019
2000-2008
0% 20% 40% 60% 80% 100%
Poland
Hungary
Czech Rep.
Romania
CEE
Germany
Austria
Europe
Technology Healthcare Basic MaterialsConsumer Non-Cyclicals Energy UtilitiesConsumer Cyclicals Industrials Telecommunications Services

CHAPTER III. CORPORATE BOND MARKET IN ROMANIA
62 OECD Capital Market Review of Romania 2021: Mapping Report
As most Romanian corporate bonds issued are listed on non-domestic exchanges they are also issued in foreign currencies. Indeed, as shown in Panel C of Figure 48, Romania is the country with the lowest ratio (6%) of corporate bonds denominated in local currency, Romanian Leu. The rest of is denominated either in Euro (54%) or in US dollars (40%). In contrast, in Poland and Hungary 70% and 38% of the corporate bonds are issued in local currency, respectively. It is also important to note that no issuances denominated in the Romanian Leu have been listed on foreign exchanges, whereas for all other CEE peer countries, between 2%-3% of corporate bonds denominated in local currency are issued on foreign exchanges.
Figure 48. Characteristics of corporate bonds by total proceeds, 2000-2019 A. Maturity B. Exchange of listing C. Currency
Source: OECD Capital Market Series dataset, Thomson Reuters Eikon; see Annex for details.
3.2. Investors in non-financial corporate bonds
Romania has a very low presence of domestic investors in the corporate bond market. Only 8% of the outstanding stock of non-financial corporate bonds are held by domestic investors, compared to 86% in Poland and 72% in Hungary (Figure 49, Panel A). Generally, there is a significant heterogeneity in the domestic ownership of corporate bonds across countries. Typically, the financial sector (including monetary financial institutions, investment funds, insurance corporations and pension funds, and other financial institutions) plays a significant role as owner of corporate bonds. Particularly, two categories of financial investors - monetary financial institutions, as well as insurance corporations and pension funds - hold a large share of corporate bonds issued by non-financial corporations in most countries. They make up 85% of domestic bond ownership in Hungary, 58% in Germany and 54% in Austria (Figure 49, Panel B). This differs sharply for Romania, where their holdings are much smaller. Domestic monetary financial institutions hold only 8% of the outstanding stock of domestic non-financial corporate bonds; whereas domestic insurance corporations and pension funds are reported not to hold any of the outstanding stock. Instead, investment funds hold 50% of the non-financial corporate bond stock in Romania.
Non-financial corporations and households hold only a modest share of the outstanding stock of corporate bonds in most countries, except for the Czech Republic where households and non-financial corporations together hold 51% of the corporate bond stock. In Romania,
0% 20% 40% 60% 80% 100%
Poland
Hungary
CzechRepublic
Romania
CEE
Germany
Austria
Europe
Less than five years
Five to ten years
Over ten years
0% 20% 40% 60% 80% 100%
Poland
Hungary
CzechRepublic
Romania
CEE
Germany
Austria
Europe
London OTC
Other exchanges Local
No Listing Luxembourg
0% 20% 40% 60% 80% 100%
Poland
Hungary
CzechRepublic
Romania
CEE
Germany
Austria
Europe
Local Currency Euro
U.S. Dollar Other Currency

CHAPTER III. CORPORATE BOND MARKET IN ROMANIA
OECD Capital Market Review of Romania 2021: Mapping Report 63
households and non-financial corporations also own a relatively large share of corporate bonds, representing 25% and 14% of total domestic bonds.
Figure 49. Ownership of outstanding non-financial corporate bonds (Q3-2020) A. Total ownership B. Domestic ownership
Source: ECB statistics.
3.3. Market segments for corporate bond listing in Romania
The Bucharest Stock Exchange offers two segments for listing corporate bonds: the regulated Main Market and the alternative trading system, the AeRO Market. On both segments companies can list bonds for trading, however the Main Market targets larger companies and the AeRO market targets small and medium-sized enterprises. The AeRO market is only regulated by the BVB’s rules and obligations, and was established in order to provide issuers a market with less stringent reporting obligations while maintaining a good level of transparency for investors. As there is no minimum issuance value and no prospectus requirement, the AeRO market offers smaller companies an easier way of accessing the corporate bond market.
Table 12. Listing requirements and targeted investors Main Market AeRO
Listing requirement
The minimum value of the issuance must be the RON equivalent of EUR 200 000. If the value is lower, ASF may issue a special approval for listing.
Prospectus is required.
No minimum value for issuances. No prospectus is required.
Targeted investors Local and foreign institutional investors, local and foreign individual investors.
Specialised and smaller investment funds targeting SMEs, individual investors.
Source: Bucharest Stock Exchange.
Since the creation of the AeRO market in 2015, there have been 23 issuances raising a total of EUR 29.2 million (Figure 50, Panel B). Non-financial companies make up 74% of issuances on the AeRO market. In fact, almost all bond issuances by non-financial companies in Romania are listed on the AeRO market. In contrast to the AeRO market, most issuances on the Main Market are by financial companies and only 9.2% of issuances are done by non-financial companies. Over the last five years, a total of 12 issuances raised EUR 831 million on the Main Market (Figure 50, Panel A). Out of these, only one in 2017 was by a non-financial company. The proceeds raised on the Main Market are typically much larger
14%
28%
58%
66%
76%
92%
0% 50% 100%
Poland
Hungary
Germany
Czech Rep.
Austria
Romania
Non-domestic
Domestic
0% 20% 40% 60% 80% 100%
Poland
Hungary
Germany
Czech Rep.
Austria
Romania
Non-financial corporations Monetary financial institutionsInvestment funds Other financial institutionsInsurance corporations and pension funds General governmentHouseholds

CHAPTER III. CORPORATE BOND MARKET IN ROMANIA
64 OECD Capital Market Review of Romania 2021: Mapping Report
than those on the AeRO market. While the average proceeds per deal raised on the Main Market is EUR 47.8 million, it is only EUR 1.27 million on the AeRO market.
Figure 50. Corporate bond issuance in the Romanian market A. Main Market B. AeRO
Note: Issuance below EUR 1 million have also been included in the above figures. Source: OECD Capital Market Series dataset, Thomson Reuters Eikon; see Annex for details.
In 2016, Bittnet Systems became the first technology company in Romania to ever issue a corporate bond. Since then, there have been six technology companies making 10 issuances, raising a total of EUR 14 million. By the end of 2019, more than half of the corporate bonds listed on the AeRO market are issued by Technology companies (Figure 51, Panel A). Apart from technology companies, companies from Industrials, Healthcare and Consumer cyclicals have also been using the AeRO market to raise funds. Meanwhile, the Main Market has hosted a handful of companies from Utilities and Consumer cyclicals, apart from financial companies. Regarding the length of maturity, nearly all issuances on the Main Market have a maturity over five years, whereas on the AeRO market almost 81% of issuances have a maturity of less than five years (Figure 51, Panel B).
Figure 51. Characteristics of non-financial corporate bonds, 2000-2019 A. Industry distribution B. Maturity
Note: The figure shows the distribution by proceeds. Issuance below EUR 1 million have also been included in the above figures. Source: OECD Capital Market Series dataset, Thomson Reuters Eikon; see Annex for details.
0
4
8
0
100
200
300
400
'03 '05 '07 '09 '11 '13 '15 '17 '19
Non-financials Financials Number (RHS)
2019 EUR, millions
0
4
8
12
0
4
8
12
16
'15 '16 '17 '18 '19
Non-financials FinancialsNumber (RHS)
2019 EUR, millions
Consumer Cyclicals
Healthcare
Industrials
TechnologyUtilities
0%
20%
40%
60%
80%
100%
Main AeRo0%
20%
40%
60%
80%
100%
Main AeRo
Less than five years More than five years

OECD Capital Market Review of Romania 2021: Mapping Report 65
CHAPTER IV. PRIVATE CAPITAL MARKET
Private capital markets have grown significantly in recent years. By the end of June 2019, total assets in private capital markets reached USD 6.5 trillion globally. In private capital markets, private equity (PE) is by far the largest asset class. Its global net asset value has increased eight-fold since 2000 and assets under management (AUM) of PE funds reached USD 3.9 trillion by the end of June 2019 (McKinsey, 2020). Private equity and venture capital serve as an alternative source of financing for non-financial corporations especially for start-up firms, private medium-sized firms, firms in financial distress and public firms seeking buyout financing. This chapter provides an overview of private equity trends in Romania and offers a comparison with selected peer European countries. It presents a detailed analysis of the three main stages of private equity activity: fundraising, investment and divestment. The analysis addresses, among other things, issues relevant to the geographical and institutional source of fundraising, the industry distribution of investments and divestment forms.
4.1. Overview of private equity activity in Romania
There are three main stages of the private equity investment process. The initial stage is fundraising where general partners of the private equity firms raise funds from investors, including institutional investors and high net worth individuals. In the second stage of the process, funds are invested in companies at different stages of their lifecycle. Private equity funds generally have a defined investment horizon within which they are expected to exit their investments. Divestment, the third stage of the process, occurs when private equity firms sell their stake in investee companies. There are a number of options for PE funds to divest their holdings, including initial public offerings and sales to other private equity firms. During the 2007-2019 period, EUR 20 billion was raised by private equity firms in the Central and Eastern Europe (CEE) region.7 This amount represented only 2.2% of the total private equity capital raised in Europe (Figure 52, Panel A). In the CEE region, PE investment and divestment activity is slightly higher compared to the fundraising activity as a share in European investment and divestment volumes. CEE private equity firms invested EUR 28 billion and divested EUR 13 billion between 2007 and 2019. This represented 3.4% and 2.9% of the total European investment and divestment activity, respectively (Figure 52, Panel A). Another comparison with Europe reveals that PE activity in the CEE region is also far below European levels. PE activity measured as the volume of PE investment to GDP represented 0.53% of European GDP in 2019, whereas the corresponding figure for the CEE region was only 0.17%. In each year between 2007 and 2019, except for 2009, the CEE region PE investment activity has been less than a half of the European PE investment activity (Figure 52, Panel B). A similar trend can be seen for the CEE PE fundraising and divestment activity.
7 CEE countries include: Bosnia Herzegovina, Bulgaria, Croatia, Czech Republic, Estonia, Hungary, Latvia, Macedonia, Moldova, Montenegro, Poland, Romania, Slovak Republic, Slovenia, Serbia, Ukraine.

CHAPTER IV. PRIVATE CAPITAL MARKET
66 OECD Capital Market Review of Romania 2021: Mapping Report
The volume of funds raised in Europe in 2019 was 0.62% of European GDP, while the corresponding share was very modest for the CEE region at only 0.08% of the CEE GDP. PE divestment as a share of GDP represented 0.18% of European GDP in 2019, while for the CEE region, the corresponding share was 0.06%.
Figure 52. Private equity activity in CEE region and Europe A. Share of CEE Region in
Europe, (2007-2019) B. PE investment activity as a share of GDP
Source: Invest Europe / EDC.
The private equity market in Romania is still in the development phase. Between 2007 and 2019 private equity firms in Romania raised EUR 222 million. This represented only 1% of the total amount of private equity capital raised in the CEE region and was well below Romania’s average annual share in CEE GDP for the same period (11.7%). In fact, during this period, the fundraising activity in Romania was concentrated in only six years. Yet, during the last three years, PE firms were able to raise an annual average of EUR 31 million. Poland and Hungary ranked first and second in the CEE fundraising activity and together accounted for almost 40% of all the funds raised in the region. Compared to fundraising, Romania’s share in PE investment in the CEE region volume was significantly higher. Between 2007 and 2019, PE investment in Romania was, on average, EUR 226 million per year. This means that Romania’s investments are equivalent to 11% of the regional total and close to its share in CEE GDP (Figure 53, Panel A). The PE investment activity in Romania has shown an upward trend since 2012 (Figure 53, Panel B). Romanian divestments between 2007 and 2019 amounted to EUR 909 million, representing 7% of divestment in CEE countries. Poland and the Czech Republic ranked first and second, respectively, in PE investment and divestment in the CEE region. Their activity together represented 53% of the PE investment and 59% of the PE divestment of the regional total.
2.2%
3.4%
2.9%
0%
1%
2%
3%
4%
Fundraising Investment Divestment0.0%
0.2%
0.4%
0.6%
2007 '09 '11 '13 '15 '17 '19
Europe CEE

CHAPTER IV. PRIVATE CAPITAL MARKET
OECD Capital Market Review of Romania 2021: Mapping Report 67
Figure 53. Private equity activity in Romania as share in CEE region (2007-2019) A. Private equity activity in CEE region B. Investment and divestment activity
Note: In Panel A, CEE region includes EUR 8 billon of funds raised of which the target country information not specified. Source: Invest Europe / EDC.
Compared to the selected peer countries, Romania lags behind in its PE activity over the last five years, particularly in fundraising and divestment (Figure 54). In countries such as the Czech Republic and Poland, PE fundraising between 2015 and 2019 represented on average 0.22% and 0.10% of their respective GDP, while the corresponding figure for Romania was only 0.01%. Moreover, PE divestments over the same period accounted for only 0.05% of Romania’s GDP, which is also below the CEE average of 0.08%. The exception is PE investment to GDP, for which Romania with 0.16% is almost at the same level as the CEE average of 0.17% of GDP.
Figure 54. Private equity activity in Romania and selected European countries, % of GDP A. Fundraising B. Investment C. Divestment
Note: The shares represent the 5 year average between 2015 and 2019, in Panel A, CEE region includes EUR 8 billon fundraising of which the target country information not specified. Source: Invest Europe / EDC.
4.2. Fundraising, investment and divestment trends
PE fundraising activity in Romania is modest compared to the CEE regional volumes. The Romanian private equity firms mostly rely on foreign investors when raising funds. Between
1%
11%7%
10% 10%
14%
4%
16%
25%
29%
37% 34%
0%
10%
20%
30%
40%
Fundraising Investment Divestment
Romania Hungary Czech Republic Poland
0%
5%
10%
15%
20%
2007 '09 '11 '13 '15 '17 '19
Romania PE Investment / CEE InvestmentRomania PE Divetsment / CEE DivestmentAverage Romanian GDP / CEE GDP
0.04%
0.11%
0.54%
0.22%
0.06%
0.10%
0.01%
0.09%
0.00% 0.20% 0.40% 0.60%
Austria
Germany
Europe
CzechRepublic
Hungary
Poland
Romania
CEE
0.17%
0.32%
0.44%
0.15%
0.10%
0.24%
0.16%
0.17%
0.00% 0.15% 0.30% 0.45% 0.60%
Austria
Germany
Europe
CzechRepublic
Hungary
Poland
Romania
CEE
0.08%
0.15%
0.25%
0.09%
0.07%
0.11%
0.05%
0.08%
0.00% 0.10% 0.20% 0.30%
Austria
Germany
Europe
CzechRepublic
Hungary
Poland
Romania
CEE

CHAPTER IV. PRIVATE CAPITAL MARKET
68 OECD Capital Market Review of Romania 2021: Mapping Report
2007 and 2019, 69% of the committed capital in Romania was raised from other European investors (Figure 55, Panel B). This is almost twice as high as the total CEE non-domestic share of 34%. Moreover, a modest amount of the Romanian funds have been raised from investors outside of Europe, while for the CEE region as a whole, around 14% of funds were raised from non-European investors (Figure 55, Panel C). In Poland, 45% of the funds were raised from other European countries and 22% from non-European countries. However, other CEE countries rely heavily on their domestic market for raising funds, notably in Hungary where 77% of total funds raised come from domestic investors (Figure 55, Panel A). Generally, CEE countries depend heavily on the domestic market and on other European markets which together account for 66% of the total funds raised, while for Europe the corresponding share is 50%.
Figure 55. PE fundraising by origin of investors in Romania and selected European countries (2007-2019)
A. Domestic B. Non-domestic Europe C. Non-Europe
Note: The analysis only includes funds raised where the origin of the investor is specified. Source: Invest Europe / EDC.
In the 2007-2019 period, pension funds were the largest investors providing 24% of the total funds raised in Europe (Figure 56, Panel A). For the CEE region, however, pension funds provided only 8% of total funds raised, while government agencies and sovereign wealth funds was the single largest source of funds contributing 27% of total funds raised. This situation is even more accentuated in Romania where government agencies8 account for 62% of all the funds raised between 2007 and 2019. (Figure 56, Panel B). This is to a large extent the result of increased PE activity by government agencies in Eastern Europe, including Romania, to offset investment outflows in the wake of the 2008 global financial crisis and the 2012 Euro crisis (Mihai, 2015). Additionally, in Romania individual investors and banks represent 10% and 5% of the funds raised, respectively. Importantly, funds-of-funds, which otherwise
8 Government agencies refer to the amounts raised by two funds “Balkan Accession Fund” and “Emerging Europe Accession Fund” managed by the private equity firm Access Capital Partners SA. The Balkan Accession Fund targets investment in Bulgaria, Romania and other south-east European countries and the lead investors of the fund are Black Sea Trade and Development Bank (BSTDB), the German Investment and Development Society (DEG), EBRD and the Netherlands Development Finance Company (FMO).The Emerging Europe Accession Fund targets companies based in South-Eastern Europe and fund’s lead investors are BSTDB, DEG, EBRD and European Investment Fund (EIF).
43%
44%
28%
45%
77%
14%
13%
32%
0% 20% 40% 60% 80%
Austria
Germany
Europe
CzechRepublic
Hungary
Poland
Romania
CEE
29%
16%
22%
18%
8%
45%
69%
34%
0% 20% 40% 60% 80%
Austria
Germany
Europe
CzechRepublic
Hungary
Poland
Romania
CEE
6%
5%
33%
2%
5%
22%
2%
14%
0% 10% 20% 30% 40%
Austria
Germany
Europe
CzechRepublic
Hungary
Poland
Romania
CEE

CHAPTER IV. PRIVATE CAPITAL MARKET
OECD Capital Market Review of Romania 2021: Mapping Report 69
play a significant role in PE fundraising especially in Europe, were not active in the Romanian PE market.
Figure 56. PE fundraising by type of investors in Romania and selected European countries (2007-2019)
A. Pension Funds B. Government agencies and sovereign wealth funds
C. Funds of funds
Note: CEE region includes EUR 8 billon fundraising of which the target country information not specified, as a result, the specific country level data of the capital providers for that amount is not available. Source: Invest Europe / EDC.
Private equity firms mainly specialise in buyouts, venture capital and growth investment. The AUM of the three account for 54%, 25% and 18% of the total PE AUM, respectively as of June 2019 (McKinsey, 2020). The buyout segment of private equity markets provides funds for the acquisition of more mature companies to improve their operations, thereby enhancing the efficiency and increasing the valuation of the company. Generally, the buyout segment of PE investment focuses on under-performing companies, the investment aims to foster corporate restructuring and enhance productivity (OECD, 2007). Venture capital investors typically focus on early-stage firms, for example companies in technology-intensive industries, which may have difficulties raising funds from the banking sector or the primary financial markets. It has been argued, that an efficient venture capital market contributes to economic growth, employment creation and long-term competitiveness by enabling access to financing for high-growth firms (ECB, 2005). The growth segment of PE refers to the investment in relatively mature companies that require capital for their growth objectives. As discussed before, the investment activity in Romania, unlike fundraising, shows a level of activity closer to its contribution to GDP in the CEE region. Among different types of PE investments, buyout transactions dominate investment volumes across countries and regions. Buyout transactions typically involve high levels of debt financing, with the aim of acquiring a controlling share of the company to facilitate the restructuring process. In both Europe and the CEE region, buyout deals accounted for almost 70% of the total PE investment value between 2007 and 2019. A cross-country comparison shows that the share of buyout deals in investments (58%) is relatively low in Romania (Figure 57, Panel A). Growth investments accounted for 35% of the total PE investments in Romania between 2007 and 2019 (Figure 57 Panel A). This investment type represents the highest share of total PE investment in Romania compared to its peer countries. The latter was mainly driven by the increase in growth investments during the last three years when the share of growth investment went from 35% in 2017 to almost 70% of the total PE investment in 2019 (Figure 57,
2%
6%
24%
0.14%
0.15%
9%
0.26%
8%
0% 10% 20% 30%
Austria
Germany
Europe
CzechRepublic
Hungary
Poland
Romania
CEE
30%
13%
13%
14%
42%
17%
62%
27%
0% 20% 40% 60% 80%
Austria
Germany
Europe
CzechRepublic
Hungary
Poland
Romania
CEE
4%
7%
12%
4%
2%
25%
15%
0% 10% 20% 30%
Austria
Germany
Europe
CzechRepublic
Hungary
Poland
Romania
CEE

CHAPTER IV. PRIVATE CAPITAL MARKET
70 OECD Capital Market Review of Romania 2021: Mapping Report
Panel B). It is also worth mentioning that the share of venture capital stood at 5% of the total investment over the whole period, a modest level compared to 20% in Hungary and 14% in Austria. Among many other explanations to the low level of venture capital activity in Romania, the total R&D intensity measured as the gross R&D expenditure to GDP has been found closely linked to the early stage and the expansion stage of the venture capital activity in Romania (Diaconu, 2012). It is expected that for their innovative projects, enterprises create a demand for venture capital, therefore initiating an increasing activity in the venture capital market. However, Romania shows by far the lowest level of R&D measured as a share of GDP, among its peers (see Section 1.1, Figure 4). This could be, to a certain extent associated with the low level of venture capital activity in Romania.
Figure 57. PE investment in Romania and selected European countries A. Types of PE investments (2007-2019) B. Type of PE investments in Romania
Source: Invest Europe / EDC.
During the 2007-2019 period, most PE investments in Europe and in the CEE region were concentrated in three industries: Technology including biotech, healthcare, computers and electronics; Consumer goods and services; and Business products and services. These three industries accounted for more than 75% of the total PE investments in Europe as well as in the CEE region, with Europe at large being more focused on the Business products and services industry compared to the CEE region (Figure 58). In Romania, the largest industry is Technology, which attracted 45% of the total PE investments over the 2007-2019 period.
0%
20%
40%
60%
80%
100%
Europe CEE Romania Austria Germany CzechRepublic
Hungary Poland
Venture Capital Growth Buyout Others
0
100
200
300
400
500
600
2007 '08 '09 '10 '11 '12 '13 '14 '15 '16 '17 '18 '19
Venture Capital Growth Buyout Others
2019 EUR, millions

CHAPTER IV. PRIVATE CAPITAL MARKET
OECD Capital Market Review of Romania 2021: Mapping Report 71
Figure 58. PE investment by industry in Romania and selected European countries (2007-2019)
Source: Invest Europe / EDC.
The final stage of private equity investment is divestment, where private equity funds exit their investments at the end of the fund’s lifecycle. There are several forms of divestments including sale through public offerings, sale to other private equity firms or f inancial institutions, buyback by managers or owners, repayment of preference shares/loans and write-offs. Divestment activity in the CEE region has shown a decreasing trend since 2015 (Figure 59 Panel A). In 2019, total divestments in the CEE region amounted to EUR 946 million, a decline of 21% compared to 2018. This decrease is in line with broader European divestment trends, where the total divestment amount decreased by 16% between 2018 and 2019. Divestment by companies from the CEE region in 2019 accounted for 3% of total European divestments. In 2019, Romania recorded the lowest level of divestment since 2013 at EUR 53 million corresponding to only five companies (Figure 59, Panel B). This placed divestment volumes in Romania fourth in the CEE region after Serbia, Poland and the Czech Republic.
Figure 59. PE divestment volume in CEE Region and Romania A. CEE region B. Romania
Source: Invest Europe / EDC.
Among the different forms of divestment, the sale to another private equity firm and trade buyers are the most common forms accounting for 57% and 65% of the total aggregate divestment value for Europe and the CEE region, respectively (Figure 60). In Romania, these two forms of exits account for 79% of all the divestments. In particular, exit through the sale
29%
35%
33%
48%
42%
21%
45%
36%
5%
16%
23%
24%
23%
42%
24%
30%
37%
29%
22%
7%
6%
15%
6%
9%
9%
3%
7%
7%
5%
7%
7%
9%
12%
3%
5%
9%
11%
8%
6%
8%
0% 10% 20% 30% 40% 50% 60% 70% 80% 90% 100%
Austria
Germany
Europe
CzechRepublic
Hungary
Poland
Romania
CEE
Biotech, healthcare, computer and electronics Consumer goods and services Business products and services
Financial and insurance activities Energy and environment Chemicals and materials
0
40
80
120
160
0
500
1 000
1 500
2 000
2007 '09 '11 '13 '15 '17 '19
Thousands
Total divestment Companies divested (RHS)
No. of companies2019 EUR, million
0
5
10
15
20
0
40
80
120
160
2007 '09 '11 '13 '15 '17 '19
Total divestment Companies divested (RHS)
No. of companies2019 EUR, million

CHAPTER IV. PRIVATE CAPITAL MARKET
72 OECD Capital Market Review of Romania 2021: Mapping Report
to another private equity firm makes up more than 40% of the total exit value. Importantly, while the divestment through a public offering represents 14% and 7% of the total exit value for the Europe and the CEE region, respectively, it represents only 3% in Romania.
Figure 60. PE divestment by exit forms in Romania and selected European countries (2007-2019)
Source: Invest Europe / EDC.
39%
32%
30%
48%
59%
34%
36%
42%
23%
26%
27%
9%
34%
22%
43%
23%
13%
13%
14%
8%
13%
3%
7%
7%
11%
8%
4%
4%
3%
5%
21%
17%
6%
13%
0% 10% 20% 30% 40% 50% 60% 70% 80% 90% 100%
Austria
Germany
Europe
CzechRepublic
Hungary
Poland
Romania
CEE
Sale to trade buyers Sale to another private equity firm
Divestment by public offering Write off
Sale to financial institutions Repayment of preference shares/ loans or mezzanine
Divestment by other means Management/Owner buy-back

OECD Capital Market Review of Romania 2021: Mapping Report 73
REFERENCES
ASF (2020a), Monthly Market Report, 11/2020. https://asfromania.ro/files/engleza/ASF%20Monthly%20Report%2012%20-%20EN_site24122020.pdf.
ASF (2020b), Report on the Non-Bank Financial Markets Stability, 1/2020. https://asfromania.ro/files/engleza/ReportFinancialStability_1.2020.
ASF (2020c), Annual Report 2019, https://asfromania.ro/files/engleza/ASF%20Annual%20report%202019_site14092020.pdf.
Banerjee, R. and B. Hofmann (2018), “The rise of zombie firms: causes and consequences”, BIS Quarterly Review September.
Bernoth K., R. Colavecchio and M. Sass (2010), “Drivers of private equity investment in CEE and Western European countries””, DIW Discussion Papers, No. 1002, Deutsches Institut für Wirtschaftsforschung (DIW), Berlin.BNR (2021), Statistics report – BNR’s interest rates, www.bnr.ro/Statistics-report-1124.aspx.
BNR (2020a), Annual report 2019, www.bnr.ro/Regular-publications-2504.aspx#ctl00_ctl00_CPH1_CPH1_6877_panelBox.
BNR (2020b), Financial Stability Report-June 2020, www.bnr.ro/Regular-publications-2504.aspx#ctl00_ctl00_CPH1_CPH1_6877_panelBox.
BVB (2021), Shareholding structure as of December 31, 2020, The Bucharest Stock Exchange website, accessed on January 2021, www.bvb.ro/infocont/infocont21/BVB_20210115174758_RO-BVB-Raport-curent-structura-actionariat-31122020.pdf.
Çelik, S., G. Demirtas and M. Isaksson (2020), “Corporate bond market trends, emerging risks and monetary policy”, www.oecd.org/corporate/ca/Corporate-Bond-Market-Trends-Emerging-Risks-Monetary-Policy.pdf.
Cortina-Lorente, J. J., T. Didier and S. L. Schmukler (2016), “How Long Is the Maturity of Corporate Borrowing?”, https://openknowledge.worldbank.org/handle/10986/25060.
De La Cruz, A., A. Medina and Y. Tang (2019), “Owners of the World’s Listed Companies”, OECD Capital Market Series, Paris, www.oecd.org/corporate/Owners-of-the-Worlds-Listed-Companies.htm.
Diaconu, M. (2012), “Characteristics and drivers of venture capital investment activity in Romania”, Theoretical and Applied Economics, Volume XIX, No. 7(572), pg. 111-132.
EC (2020), “European Semester Country Report Romania-2020”, https://eur-lex.europa.eu/legal-content/EN/TXT/PDF/?uri=CELEX:52020SC0522&from=EN.
EC (2019a), “European Semester Country Report Romania-2019”, https://ec.europa.eu/info/sites/info/files/file_import/2019-european-semester-country-report-romania_en.pdf.
EC (2019b), “Annual Report on European SMEs 2018/2019”, Research & Development and Innovation by SMEs, https://op.europa.eu/en/publication-detail/-/publication/cadb8188-35b4-11ea-ba6e-01aa75ed71a1/language-en.
ECB (2020), “Convergence Report”, June 2020, www.ecb.europa.eu/pub/pdf/conrep/ecb.cr202006~9fefc8d4c0.en.pdf.

REFERENCES
74 OECD Capital Market Review of Romania 2021: Mapping Report
ECB (2005), “The Development of Private Equity and Venture Capital in Europe”, ECB Monthly Bulletin, October 2005, www.ecb.europa.eu/pub/pdf/other/mb200510_focus02.en.pdf.
EIB (2019), “Investment: What holds Romanian firms back?”, Economics-Working Papers 2019/08. www.eib.org/attachments/efs/economics_working_paper_2019_08_en.pdf.
Eurostat (2021a), HIPC – inflation rate, Annual average rate of change (%), http://appsso.eurostat.ec.europa.eu/nui/show.do?dataset=tec00118&lang=en.
Eurostat (2021b), Gross non-performing loans, domestic and foreign entities - % of gross loans https://ec.europa.eu/eurostat/web/products-datasets/-/tipsbd10.
Eurostat (2021c), Government revenue, expenditure and main aggregates, https://ec.europa.eu/eurostat/databrowser/view/GOV_10A_MAIN/default/table.
Fitch Ratings (2020), “Rating Action Commentary - Fitch Revises Romania's Outlook to Negative; Affirms at 'BBB-' “, www.fitchratings.com/research/sovereigns/fitch-revises-romania-outlook-to-negative-affirms-at-bbb-17-04-2020.
IMF (2019a), “Staff Report for the 2019 Article IV Consultation for Republic of Romania”, www.imf.org/en/Publications/CR/Issues/2019/08/30/Romania-2019-Article-IV-Consultation-Press-Release-Staff-Report-Staff-Supplement-and-48634.
IMF (2019b), “Reassessing the Role of State-Owned Enterprises in Central, Eastern, and Southeastern Europe”, IMF Working Paper, Vol. 19/11.
IMF (2018), “Romania - Financial Sector Assessment Program”, www.imf.org/en/Publications/CR/Issues/2018/06/08/Romania-Financial-Sector-Assessment-Program-45961.
IMF (2016), “Stock Market Liquidity in Chile“, IMF Working Paper Series, WP/16/223, www.imf.org/en/Publications/WP/Issues/2016/12/31/Stock-Market-Liquidity-in-Chile-44405.
Kharroubi, E. and E. Kohlscheen (2017), “Consumption-led expansions”, BIS Quarterly Review, March 2017, https://www.researchgate.net/publication/327111739_Consumption-led_expansions.
McKinsey (2020), “A new decade for private markets”, McKinsey Global Private Markets Review 2020, February 2020, www.mckinsey.com/.
Mihai, P. (2015), “What drives private equity investment in Romania”, Studia Universitatis “Vasile Goldis” Arad. Economics Series Vol 25 Issue 4/2015, ISSN 1584-2339, Pages 25 – 42.
Moody’s Investor Services (2020), “Rating Action: Moody’s changes Romania’s outlook to negative from stable; affirms Baa3 rating”, www.moodys.com/research/Moodys-changes-Romanias-outlook-to-negative-from-stable-affirms-Baa3--PR_419169.
OECD (2021a), OECD Economic Outlook, Interim Report March 2021, OECD Publishing, Paris, https://doi.org/10.1787/34bfd999-en.
OECD (2021b), “Insolvency and debt overhang following the COVID-19 outbreak: Assessment of risks and policy responses” OECD Economics Department Working Papers no. 1651, https://dx.doi.org/10.1787/747a8226-en.
OECD (2021c), “Liquidity shortfalls during the Covid-19 outbreak: assessment and policy responses”, OECD Economics Department Working Papers no. 1647, https://doi.org/10.1787/581dba7f-en.
OECD (2020), OECD Economic Outlook, Volume 2020 Issue 2, No. 108, OECD Publishing, Paris, https://doi.org/10.1787/39a88ab1-en.
OECD (2007), “The Private Equity Boom: Causes and Policy Issues” www.oecd.org/finance/financial-markets/40973739.pdf.

REFERENCES
OECD Capital Market Review of Romania 2021: Mapping Report 75
OECD (2001), “Corporate Governance in Romania”, www.oecd.org/corporate/ca/corporategovernanceprinciples/2390703.pdf.
Pal, R., P. Wruuck, A. Stamate and C.C. Dumitrescu (2019), “Investment: What holds Romanian firms back?”, EIB Working Papers, No. 2019/08, European Investment Bank (EIB), Luxembourg. http://dx.doi.org/10.2867/011088.
Pop, C., A. Georgescu and C. Balint, (2014), “Was RASDAQ doomed from the start? A preliminary investigation”, International Finance and Banking Conference, FI BA 2014.
Scope (2019), “Fallen angels and zombies: Potential risks in a downturn”, Scope Ratings www.scoperatings.com/ScopeRatings.
Schonherr (2020), CEE Legislation Tracker, www.schoenherr.eu/content/cee-legislation-tracker-romania/.
Standard & Poor’s Global (2013), “Corporate Methodology”, November 2013, www.spratings.com/scenario-builder-portlet/pdfs/CorporateMethodology.pdf.
Statecapture (2018), “National Report Romania”, www.statecapture.eu/wp-content/uploads/2018/01/RO_c.pdf.
World Bank & IMF (2018), “Financial Sector Assessment – Romania”, July 2018. http://documents1.worldbank.org/curated/fr/658491532921446622/pdf/Romania-FSAP-Update-2018-FSA-07172018.pdf.

76 OECD Capital Market Review of Romania 2021: Mapping Report
ANNEX – METHODOLOGY FOR DATA COLLECTION AND CLASSIFICATION
A. Company financial and ownership information
The information presented in Chapter I is mainly based on the OECD-ORBIS Corporate Finance database. The extract of information presented in Chapter I includes financial statement and ownership information for non-financial companies between 2005 and 2018. Company categories construction Chapter I in Part II shows the following four non-financial firm categories: Category 1 “Listed companies”, Category 2 “Large unlisted companies”, Category 3 “Small and mid-sized companies part of a group”, and Category 4 “Independent small and mid-sized companies”. The construction of the company categories is based on the ownership, industry, legal information and financial information tables. The procedure starts by identifying all listed and unlisted companies with assets over USD 100 million in the entire ORBIS universe. Non-financial listed companies are classified immediately as Category 1 and large unlisted non-financial companies as Category 2. For these groups, the consolidated financial statements are used, if available. The following steps identify the countries of interest and uses their ownership-country-year tables to identify companies in Category 3 and Category 4. ORBIS provides many records of owners at different points in time from different sources. Two criteria are used to clean the ownership information and to be left out with only one record for each owner-firm-year observation: the largest owner is kept and the latest information is prioritised. The largest owner can be either the global ultimate owner at 50%, the global ultimate owner at 25%, or the largest direct owner with over 25% holdings. Once the sample has a unique owner-firm-year record, owners are classified as corporations or natural persons. Using the ownership records generated in the previous step, the routine starts by identifying the subsidiaries of the listed and large unlisted companies. Three types of companies are identified: 1) domestic subsidiaries with a local parent, 2) domestic subsidiaries with a foreign parent, and 3) companies controlled by a person. Some companies that are classified as subsidiaries in this step were already identified as large unlisted companies at the beginning. In these cases, since the subsidiary was already consolidated, its data were not used to avoid duplications. The domestic subsidiaries with a local parent in Category 1 or 2, or with foreign parents Category 1 or 2 are classified as Category 3. Please note that this category includes the non-financial domestic subsidiaries of financial domestic parent and foreign parents as these parents are excluded as they do not meet the industry requirement or because they are not incorporated in the domestic market under analysis. The companies where the largest owner is a person (over 25% ownership) are classified as Category 4. Economy-wide calculations take into account the ownership structure of companies and avoid considering companies that are already consolidated in the accounts of domestic non-financial parent companies. Thus, economy wide calculations include companies from Category 1, Category 2, Category 4, companies without ownership information, and companies from Category 3 that had a foreign parent or a financial domestic parent.

ANNEX – METHODOLOGY FOR DATA COLLECTION AND CLASSIFICATION
OECD Capital Market Review of Romania 2021: Mapping Report 77
Financial information cleaning The company category classification described in the previous section also incorporates different types of financial reporting (consolidated and unconsolidated reports). Large companies in the universe commonly report consolidated financial statements as well as unconsolidated financial statements. For the listed and large unlisted non-financial company categories, consolidated accounts are considered, if available. For the remaining categories, unconsolidated financial statements are used. The raw financial dataset contains several firm-year observations when a company has multiple consolidation codes or it reports for different purposes. To construct a panel with a unique firm-year observation, the following steps are applied:
1. Financial companies are excluded. 2. The fiscal year is recorded as the previous calendar year of the closing date whenever the
closing date of the financial statement is before June 30th. 3. Financial statements covering a 12-month period are used, preferably. 4. When multiple observations within the same year exist, accounts with closing dates closer to
year-end are preferred to accounts with older closing dates. 5. Published annual reports are preferred to local registry filings. Local Registry filings are
preferred to unknown filing types. 6. Accounts using IFRS are preferred to those using GAAP, accounts using GAAP are preferred
to those using unknown accounting practices. 7. For companies with multiple consolidation codes, the following criteria apply: for companies
that release consolidated financial statements, C1 is preferred when both C1 and C2 exist; for companies that release unconsolidated statements the observation from annual reports are preferred over others.
8. Financial information is adjusted by annual EUR Consumer Price Index changes and information is reported in 2019 constant million EUR.
9. Companies with at least one observation showing negative assets or negative fixed assets are dropped from the sample.
10. Companies with equal or less than 10 employees are dropped from the sample. When employee number is not available companies with total assets below EUR 35 000 are dropped from the sample.
11. Financial statement information is winsorized at 1% for both tails within companies’ categories. 12. In the case that there are single-year gaps in the financial data, these are populated by
interpolation using the average value of the preceding and the succeeding year for major items. Sub-items are then calculated using accounting identities. Such interpolation is reserved for single year gaps, and is not applied for data gaps with two or more years.
Industry classification The OECD-ORBIS Corporate Finance uses the 1-digit SIC industry classification.
Standard Industrial Classification (SIC) Agriculture, Forestry and Fishing Mining Construction Manufacturing Transportation, Communications, Electric, Gas and Sanitary service Wholesale Trade Retail Trade Finance, Insurance and Real Estate Services Public Administration

ANNEX – METHODOLOGY FOR DATA COLLECTION AND CLASSIFICATION
78 OECD Capital Market Review of Romania 2021: Mapping Report
B. Public equity data
The information on initial public offering (IPOs) and secondary public offerings (SPOs) presented in Chapter of Part II is based on transaction and/or firm-level data gathered from several financial databases, such as Thomson Reuters Eikon, Thomson Reuters Datastream, FactSet and Bloomberg. Considerable resources have been committed to ensuring the consistency and quality of the dataset. Different data sources are checked against each other and, whenever necessary, the information is also controlled against original sources, including regulator, stock exchange and company websites and financial statements. Country coverage and classification The dataset includes information about all initial public offerings (IPOs) and secondary public offerings (SPOs or follow-on offerings) by financial and non-financial companies for 6 European economies (Romania, Austria, Czech Republic, Germany, Hungary and Poland) for the period from January 1995 to December 2019. All public equity listings following an IPO, including the first time listings on an exchange other than the primary exchange, are classified as a SPO. If a company is listed in more than one exchange within 180 days, those transactions are consolidated under one IPO. The country breakdown is carried out based on the domicile country of the issuer. In the dataset, the country of issue classification is also made based on the stock exchange location of the issuer. It is possible that a company becomes listed in more than one country when going public. The financial databases record a dual listing as multiple transactions for each country where the company is listed. However, there is also a significant number of cases where dual listings are reported as one transaction only based on the primary market of the listing. For this reason, the country breakdown based on the stock exchange is currently carried out based on the primary market of the issuer. Going forward, the objective is to allocate proceeds from an IPO to respective markets where the issuance is listed at the same time. Currency conversion and inflation adjustment The IPO and SPO data, and related financial statement data, such as total assets before the offering, are collected on a deal basis via commercial databases in current USD values. The information is aggregated at the annual frequency and, in some tables, presented at the year-industry level. Issuance amounts initially collected in USD were adjusted by US Consumer Price Index (CPI) and finally converted to 2019 EUR using the average exchange rate EUR/USD for 2019. Industry classification Initial public offering and secondary offerings statistics are presented in this report using the Thomson Reuters Business Classification (TRBC). The economic sectors used in the analysis are the followings:
Thomson Reuters Economic Sector Basic Materials Cyclical Consumer Goods / Services Energy Financials Healthcare Industrials Non-Cyclical Consumer Goods / Services Technology Telecommunications Services Utilities

ANNEX – METHODOLOGY FOR DATA COLLECTION AND CLASSIFICATION
OECD Capital Market Review of Romania 2021: Mapping Report 79
Exclusion criteria With the aim of excluding IPOs and SPOs by trusts, funds and special purpose acquisition companies the following industry categories are excluded:
Financial companies that conduct trust, fiduciary and custody activities Asset management companies such as health and welfare funds, pension funds and their
third-party administration, as well as other financial vehicles Companies that are open-end investment funds Companies that are other financial vehicles Companies that are grant-making foundations Asset management companies that deal with trusts, estates and agency accounts Special Purpose Acquisition Companies (SPACs) Closed-end funds Listings on an over-the-counter (OTC) market Security types classified as “units” and “trust” Real Estate Investment Trusts Transactions with missing or zero proceeds
C. Ownership data
The main source of information is FactSet Ownership database. This dataset covers companies with a market capitalisation of more than USD 50 million and accounts for all positions equal to or larger than 0.1% of the issued shares. Data is collected as of end of 2019 in current USD, thus no currency nor inflation adjustment is needed. The data is complemented and verified using Thomson Reuters Eikon and Bloomberg. Market information for each company is collected from Thomson Reuters Eikon. For each of the following six economies (Austria, Czech Republic, Germany, Hungary, Romania and Poland), the information presented in Chapter II section 2.8. corresponds to all listed companies in those markets. Next, the information for all the owners reported as of the end of 2019 is collected for each company. Some companies can have up to 5 000 records in their list of owners. Each record contains the name of the institution, the percentage of outstanding shares owned, the investor type classification, the origin country of the investor, the ultimate parent name, among others. Each owner record is re-classified into the following investor classes: Private corporations, Public sector, Strategic individuals, Institutional investors and Other free-float. When the ultimate parent was recognised as a Government, the investor record is, by default, classified as Public sector. For example, public pension funds that are regulated under public sector law are classified as government, and sovereign wealth funds are also included in that same category.
D. Corporate bond data
Data shown on corporate bond issuances in Chapter III is based on original OECD calculations using data obtained from Thomson Reuters Eikon that provides international deal-level data on new issues of corporate bonds, which are underwritten by an investment bank. Corporate bond data from Romania, Hungary, Poland and Czech Republic also includes the non-underwritten ones retrieved through Thomson Reuters Eikon’s Bond Search application. The database provides a detailed set of information for each corporate bond issue, including the identity, nationality and sector of the issuer; the type, interest rate structure, maturity date and rating category of the bond, the amount of and use of proceeds obtained from the issue. For corporate bond data in Romania, information from the Bucharest Stock Exchange is also added to complement the original dataset. The initial dataset covers observations in the period from 1 January 2000 to 31 December 2019. From this initial set, convertible bonds, deals that were registered but not consummated, preferred shares,

ANNEX – METHODOLOGY FOR DATA COLLECTION AND CLASSIFICATION
80 OECD Capital Market Review of Romania 2021: Mapping Report
sukuk bonds, bonds with an original maturity less than 1 year or an issue size less than USD 1 million are excluded. The country breakdown is carried out based on the domicile country of the issuer. Issuance amounts initially collected in USD were adjusted by US Consumer Price Index (CPI) and finally converted to 2019 EUR using the average exchange rate EUR/USD for 2019.
E. Private Equity data
The main source of information for the private equity data presented in Chapter IV is Invest Europe / EDC. The information provided by Invest Europe is made up of firms managing investment vehicles or pools of capital (Funds) and primarily investing equity capital in enterprises not quoted on a stock market. Firms are included in the analysis as long as at least one of the funds they manage qualifies to the inclusion conditions; however, only the activity of the qualifying funds is taken into consideration. The countries included when referring to Europe statistics are: Austria, Baltic countries (Estonia, Latvia, Lithuania), Belgium, Bulgaria, Czech Republic, Denmark, Finland, France, Germany, Greece, Hungary, Ireland, Italy, Luxembourg, Netherlands, Norway, Other CEE (Bosnia-Herzegovina, Croatia, Macedonia, Moldova, Montenegro, Serbia, Slovenia, Slovakia), Poland, Portugal, Romania, Spain, Sweden, Switzerland, Ukraine, United Kingdom. The fundraising activities are classified according to the country that corresponds to the location of the advisory team of the fund. For the CEE region, fundraising activity is the sum of funds managed from the CEE region plus funds that have declared CEE as their target region. The amount reported under investments includes equity, quasi-equity, mezzanine, unsecured debt and secured debt. Secured debts amounts within all investments packages are removed, unless the debt originates from private equity funds. Investment activities are recorded according to the location of the portfolio company. Divestment amounts are recorded at cost (i.e. the total amount divested is equal to the total amount invested previously). Private equity statistics are collected in current Euros. Amounts are then adjusted by using Euro CPI to express them in constant 2019 EUR. The categories of private equity entities that are excluded from the Invest Europe Universe are: Fund of Funds, Hedge Funds, Real Estate, Project Financing/ Infrastructure, Secondary Funds, Distress Debt, Venture Credit, Participative Loans, Incubators, Accelerators, Business Angels and Holding companies.


www.oecd.org/corporate/capital-markets
Co-funded by the European Union