Embed Size (px)
Citation preview

Environmental Engineering and Management Journal November 2013, Vol.12, No. S11, Supplement, 185-188
http://omicron.ch.tuiasi.ro/EEMJ/
“Gheorghe Asachi” Technical University of Iasi, Romania
ODOUR IMPACT ASSESSMENT IN THE INDUSTRIAL AREA OF NARNI
Extended abstract
Selena Sironi1, Laura Capelli1, Licinia Dentoni1, Adriano Rossi2, Caterina Austieri2, Ilaria Boraga2
1Chemical Engineering “Giulio Natta”, Piazza L. da Vinci 32, 20133, Milano, Italy
2ARPA Umbria, Dipartimento Provinciale di Terni, via Carlo Alberto dalla Chiesa, 05100, Terni, Italy
Background
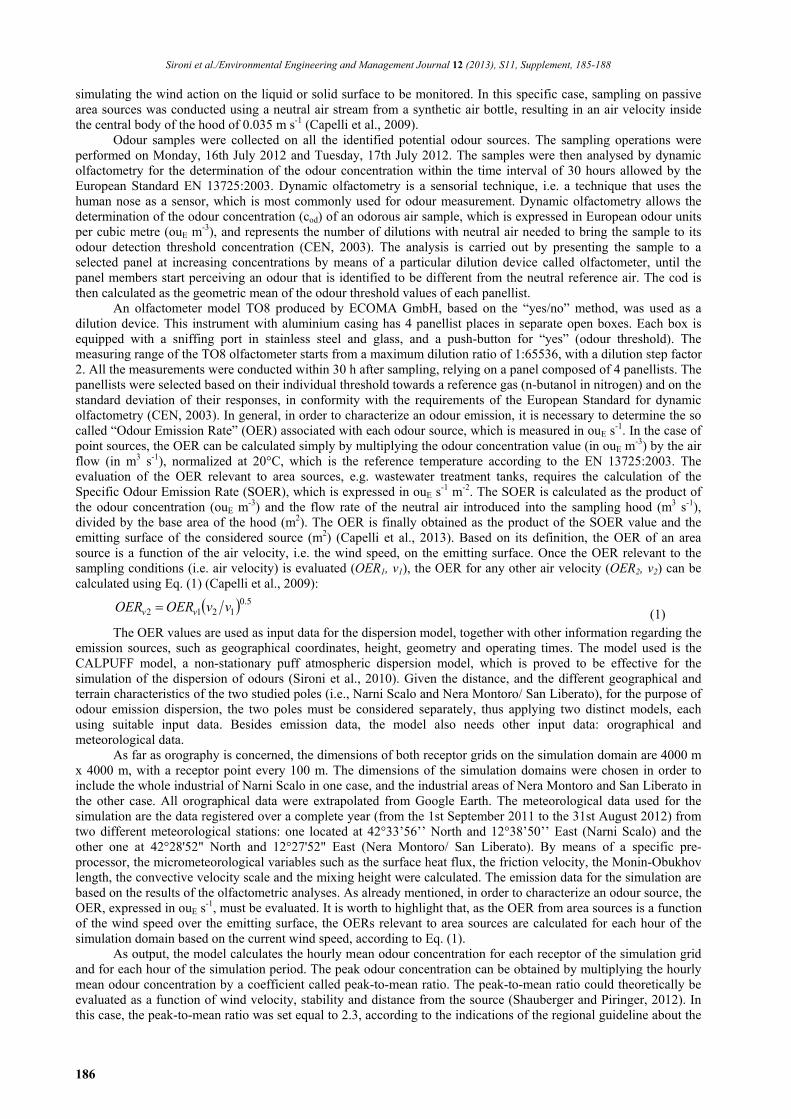
Most of biogas is produced during anaerobic digestion of organic matter (e.g., manure, vegetable wastes, municipal solid In the last 30 years odours have become a serious environmental concern, and odour nuisance problems are particularly worrying when more industrial activities exist near residential areas (Nicell, 2009). Odour nuisance problems are particularly worrying when more industrial activities exist near residential areas. One example of this situation is represented by the town of Narni (ca. 20’000 inhabitants), located in the Region of Umbria, in central Italy. Narni is a medieval town rising on a hill, at the foot of which there is a huge industrial area, which can be divided into two distinct industrial poles: one located in Narni Scalo, and the other one between Nera Montoro and San Liberato, both poles including several plants characterized by different activities and productions (
Fig. 1).
Fig. 1. Localization of the industrial poles and the considered odour sources
In order to evaluate the entity of the problem and to investigate its origins, an odour impact study was conducted, meaning the identification of the principal odour sources of the three industrial poles of the city, the quantification of emissions by specific techniques for odour sampling and measurement (dynamic olfactometry) and the simulation of the dispersion of odour emissions on the territory by application of a suitable mathematical model.
Methods
The first important step for odour impact evaluation is the identification of the major odour sources to be monitored, which was achieved with an accurate survey of the industrial poles under study. 35 emission sources distributed over 11 plants (8 in the industrial pole of Nera Montoro/San Liberato and 3 in that one of Narni Scalo) were identified. These include point sources, i.e. conveyed emissions, e.g. through a stack, as well as area sources, i.e. liquid or solid surfaces without an outward flow. The source typology must be taken into account in order to adopt specific sampling strategies and consequently to evaluate emissions correctly (Capelli et al., 2013). In the case of point sources, sampling involves the withdrawal of a fraction of the conveyed air flow In the case of passive area sources (e.g., wastewater treatment tanks), sampling is performed using so called “hood” methods, whereby a hood is positioned over the emitting surface and a neutral air stream is introduced at known airflow rate into the hood, thus Author to whom all correspondence should be addressed: e-mail: [email protected]
Sironi et al./Environmental Engineering and Management Journal 12 (2013), S11, Supplement, 185-188
186
simulating the wind action on the liquid or solid surface to be monitored. In this specific case, sampling on passive area sources was conducted using a neutral air stream from a synthetic air bottle, resulting in an air velocity inside the central body of the hood of 0.035 m s-1 (Capelli et al., 2009).
Odour samples were collected on all the identified potential odour sources. The sampling operations were performed on Monday, 16th July 2012 and Tuesday, 17th July 2012. The samples were then analysed by dynamic olfactometry for the determination of the odour concentration within the time interval of 30 hours allowed by the European Standard EN 13725:2003. Dynamic olfactometry is a sensorial technique, i.e. a technique that uses the human nose as a sensor, which is most commonly used for odour measurement. Dynamic olfactometry allows the determination of the odour concentration (cod) of an odorous air sample, which is expressed in European odour units per cubic metre (ouE m-3), and represents the number of dilutions with neutral air needed to bring the sample to its odour detection threshold concentration (CEN, 2003). The analysis is carried out by presenting the sample to a selected panel at increasing concentrations by means of a particular dilution device called olfactometer, until the panel members start perceiving an odour that is identified to be different from the neutral reference air. The cod is then calculated as the geometric mean of the odour threshold values of each panellist.
An olfactometer model TO8 produced by ECOMA GmbH, based on the “yes/no” method, was used as a dilution device. This instrument with aluminium casing has 4 panellist places in separate open boxes. Each box is equipped with a sniffing port in stainless steel and glass, and a push-button for “yes” (odour threshold). The measuring range of the TO8 olfactometer starts from a maximum dilution ratio of 1:65536, with a dilution step factor 2. All the measurements were conducted within 30 h after sampling, relying on a panel composed of 4 panellists. The panellists were selected based on their individual threshold towards a reference gas (n-butanol in nitrogen) and on the standard deviation of their responses, in conformity with the requirements of the European Standard for dynamic olfactometry (CEN, 2003). In general, in order to characterize an odour emission, it is necessary to determine the so called “Odour Emission Rate” (OER) associated with each odour source, which is measured in ouE s-1. In the case of point sources, the OER can be calculated simply by multiplying the odour concentration value (in ouE m-3) by the air flow (in m3 s-1), normalized at 20°C, which is the reference temperature according to the EN 13725:2003. The evaluation of the OER relevant to area sources, e.g. wastewater treatment tanks, requires the calculation of the Specific Odour Emission Rate (SOER), which is expressed in ouE s-1 m-2. The SOER is calculated as the product of the odour concentration (ouE m-3) and the flow rate of the neutral air introduced into the sampling hood (m3 s-1), divided by the base area of the hood (m2). The OER is finally obtained as the product of the SOER value and the emitting surface of the considered source (m2) (Capelli et al., 2013). Based on its definition, the OER of an area source is a function of the air velocity, i.e. the wind speed, on the emitting surface. Once the OER relevant to the sampling conditions (i.e. air velocity) is evaluated (OER1, v1), the OER for any other air velocity (OER2, v2) can be calculated using Eq. (1) (Capelli et al., 2009):
5.01212 vvOEROER vv (1)
The OER values are used as input data for the dispersion model, together with other information regarding the emission sources, such as geographical coordinates, height, geometry and operating times. The model used is the CALPUFF model, a non-stationary puff atmospheric dispersion model, which is proved to be effective for the simulation of the dispersion of odours (Sironi et al., 2010). Given the distance, and the different geographical and terrain characteristics of the two studied poles (i.e., Narni Scalo and Nera Montoro/ San Liberato), for the purpose of odour emission dispersion, the two poles must be considered separately, thus applying two distinct models, each using suitable input data. Besides emission data, the model also needs other input data: orographical and meteorological data.
As far as orography is concerned, the dimensions of both receptor grids on the simulation domain are 4000 m x 4000 m, with a receptor point every 100 m. The dimensions of the simulation domains were chosen in order to include the whole industrial of Narni Scalo in one case, and the industrial areas of Nera Montoro and San Liberato in the other case. All orographical data were extrapolated from Google Earth. The meteorological data used for the simulation are the data registered over a complete year (from the 1st September 2011 to the 31st August 2012) from two different meteorological stations: one located at 42°33’56’’ North and 12°38’50’’ East (Narni Scalo) and the other one at 42°28'52" North and 12°27'52" East (Nera Montoro/ San Liberato). By means of a specific pre-processor, the micrometeorological variables such as the surface heat flux, the friction velocity, the Monin-Obukhov length, the convective velocity scale and the mixing height were calculated. The emission data for the simulation are based on the results of the olfactometric analyses. As already mentioned, in order to characterize an odour source, the OER, expressed in ouE s-1, must be evaluated. It is worth to highlight that, as the OER from area sources is a function of the wind speed over the emitting surface, the OERs relevant to area sources are calculated for each hour of the simulation domain based on the current wind speed, according to Eq. (1).
As output, the model calculates the hourly mean odour concentration for each receptor of the simulation grid and for each hour of the simulation period. The peak odour concentration can be obtained by multiplying the hourly mean odour concentration by a coefficient called peak-to-mean ratio. The peak-to-mean ratio could theoretically be evaluated as a function of wind velocity, stability and distance from the source (Shauberger and Piringer, 2012). In this case, the peak-to-mean ratio was set equal to 2.3, according to the indications of the regional guideline about the
Odour impact assessment in the industrial area of Narni
187
characterization and authorization of gaseous emissions from odour emitting activities, which has recently (2012) been issued in the Region of Lombardia, and is already used as a reference all over Italy (DGR 15 February 2012 – n. IX/3018). Also the choice of how to represent the modelling results should be based on current regulations about odour impact evaluation. According to the above mentioned regional guideline, which suggests the 98th percentile methodology for odour impact evaluation, the 98th percentiles were extracted from the matrix of the ground peak odour concentration values. The results of the odour dispersion simulation are therefore represented in maps reporting the isopleths relevant to the 98th percentile of the hourly peak concentrations.
Results and discussion
The measured odour concentrations and the OER values for each source, expressed in ouE m-3 and in ouE s-1, respectively, are reported in Table 1, together with a short description of the activity of the plant where the samples were collected. It is important to highlight that, as far as area sources are concerned, Table 1 reports the OER values referred to the sampling conditions, which correspond to an air velocity of 0.035 m s-1, whereas for the dispersion modelling the OERs were calculated for each hour of the simulation domain based on the current wind speed.
Table 1. Odour concentrations and OER values relevant to the considered odour sources
Industrial area
No. Plant Plant activity Sample name Type cod (ouE/m3) OER
(ouE/s) 2 SGL Carbon E202 PS 810 1439
3-4 SGL Carbon Production of graphite
electrodes E25 PS 885 120586 5 Tarkett E38 PS 580 3583 6 Tarkett E60 PS 810 2167 7 Tarkett E8 PS 970 4285 8 Tarkett E52 PS 860 2089 9 Tarkett
Linoleum production
E41 PS 910 758 25 WWTP Narni Funaria Sludge storage AS 410 32 26 WWTP Narni Funaria Biological oxidation AS 140 57 27 WWTP Narni Funaria Sludge aerobic stabilization AS 150 132
Nar
ni S
calo
28 WWTP Narni Funaria
Wastewater treatment
Wastewater arrival AS 720 140 17 Adica E 28 PS 720 1600 20 Adica
Production of fertilizers and plant protection products E 30 PS 770 1143
24 Uniplast E1 PS 180 633 24 Uniplast
Production of plastic packing E2 PS 180 636
29 Alcantara Sludge storage AS 19000 1583 30 Alcantara S40-41-42 AS 25000 26389 31 Alcantara Sedimentation (MS50-41) AS 6500 6640 32 Alcantara Biological treatment (S50) AS 290 434 33 Alcantara MS52a AS 25000 7778 36 Alcantara E4-15 PS 170 950 40 Alcantara
Textile production (Alcantara®)
E1-16a PS 200 552
Ner
a M
onto
ro,
San
Lib
erat
o
41 SCB Asphalt production E3 PS 44000 391856
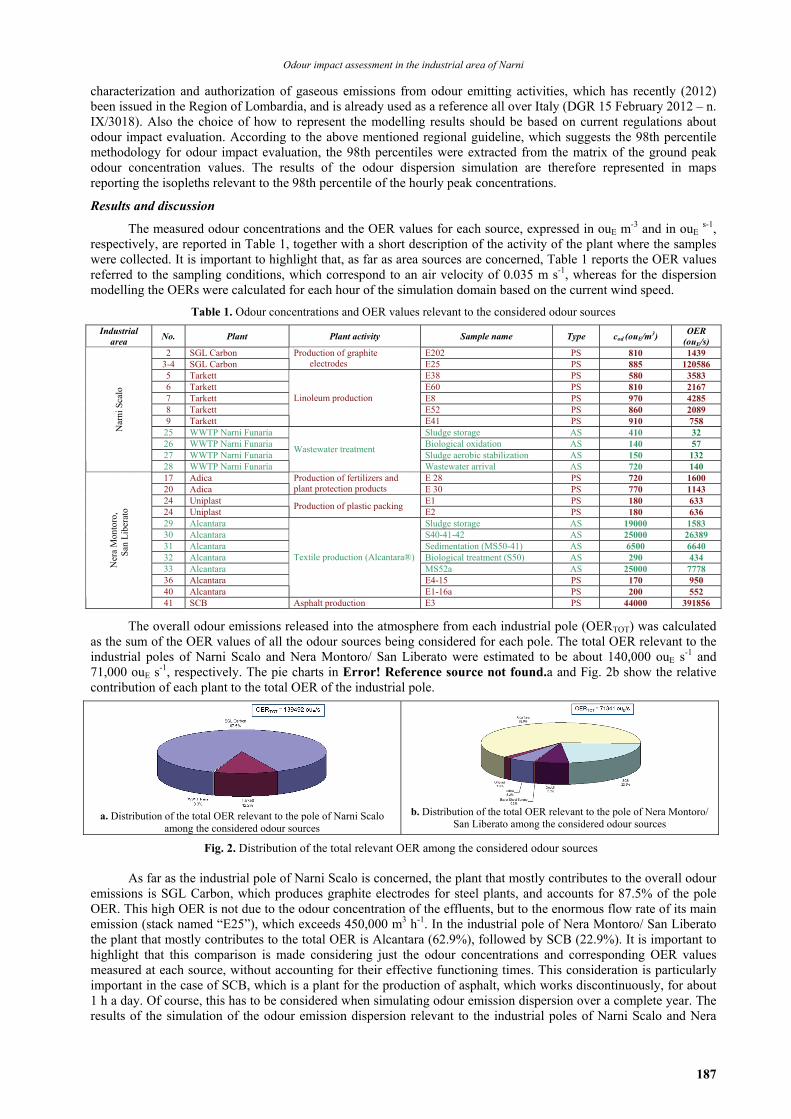
The overall odour emissions released into the atmosphere from each industrial pole (OERTOT) was calculated as the sum of the OER values of all the odour sources being considered for each pole. The total OER relevant to the industrial poles of Narni Scalo and Nera Montoro/ San Liberato were estimated to be about 140,000 ouE s-1 and 71,000 ouE s-1, respectively. The pie charts in Error! Reference source not found.a and Fig. 2b show the relative contribution of each plant to the total OER of the industrial pole.
a. Distribution of the total OER relevant to the pole of Narni Scalo
among the considered odour sources
b. Distribution of the total OER relevant to the pole of Nera Montoro/
San Liberato among the considered odour sources
Fig. 2. Distribution of the total relevant OER among the considered odour sources As far as the industrial pole of Narni Scalo is concerned, the plant that mostly contributes to the overall odour
emissions is SGL Carbon, which produces graphite electrodes for steel plants, and accounts for 87.5% of the pole OER. This high OER is not due to the odour concentration of the effluents, but to the enormous flow rate of its main emission (stack named “E25”), which exceeds 450,000 m3 h-1. In the industrial pole of Nera Montoro/ San Liberato the plant that mostly contributes to the total OER is Alcantara (62.9%), followed by SCB (22.9%). It is important to highlight that this comparison is made considering just the odour concentrations and corresponding OER values measured at each source, without accounting for their effective functioning times. This consideration is particularly important in the case of SCB, which is a plant for the production of asphalt, which works discontinuously, for about 1 h a day. Of course, this has to be considered when simulating odour emission dispersion over a complete year. The results of the simulation of the odour emission dispersion relevant to the industrial poles of Narni Scalo and Nera
Sironi et al./Environmental Engineering and Management Journal 12 (2013), S11, Supplement, 185-188
188
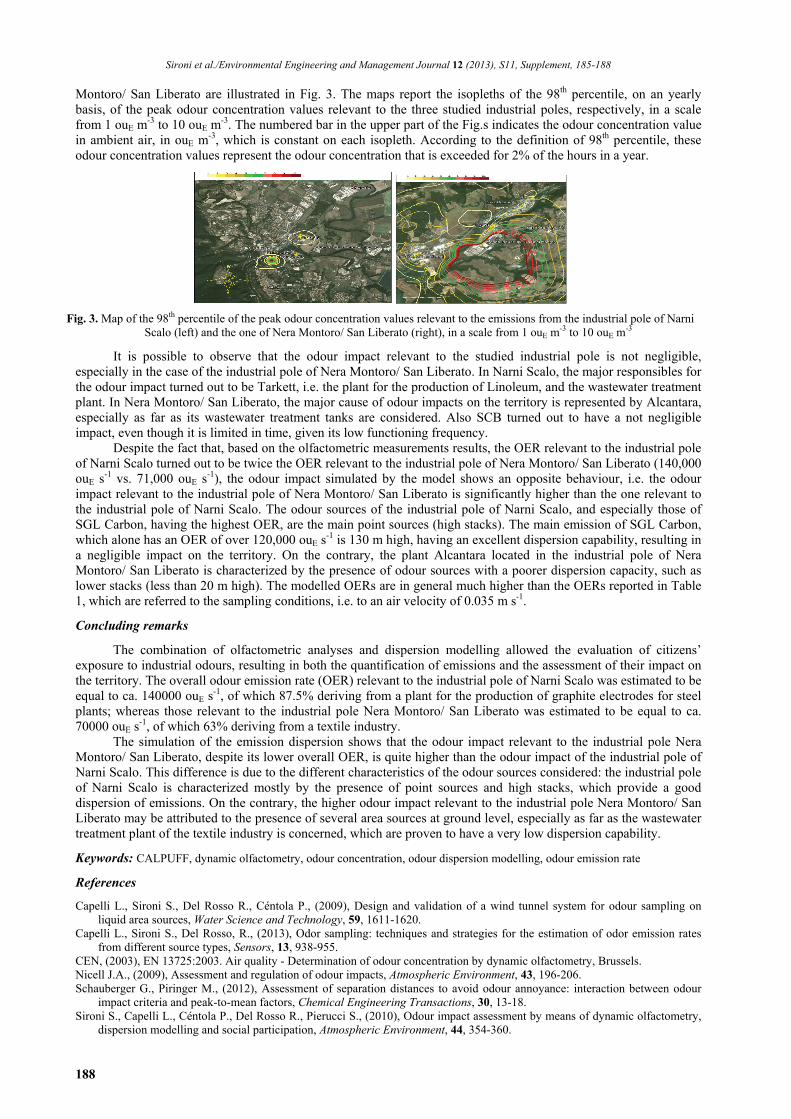
Montoro/ San Liberato are illustrated in Fig. 3. The maps report the isopleths of the 98th percentile, on an yearly basis, of the peak odour concentration values relevant to the three studied industrial poles, respectively, in a scale from 1 ouE m-3 to 10 ouE m-3. The numbered bar in the upper part of the Fig.s indicates the odour concentration value in ambient air, in ouE m-3, which is constant on each isopleth. According to the definition of 98th percentile, these odour concentration values represent the odour concentration that is exceeded for 2% of the hours in a year.
Fig. 3. Map of the 98th percentile of the peak odour concentration values relevant to the emissions from the industrial pole of Narni Scalo (left) and the one of Nera Montoro/ San Liberato (right), in a scale from 1 ouE m-3 to 10 ouE m-3
It is possible to observe that the odour impact relevant to the studied industrial pole is not negligible, especially in the case of the industrial pole of Nera Montoro/ San Liberato. In Narni Scalo, the major responsibles for the odour impact turned out to be Tarkett, i.e. the plant for the production of Linoleum, and the wastewater treatment plant. In Nera Montoro/ San Liberato, the major cause of odour impacts on the territory is represented by Alcantara, especially as far as its wastewater treatment tanks are considered. Also SCB turned out to have a not negligible impact, even though it is limited in time, given its low functioning frequency.
Despite the fact that, based on the olfactometric measurements results, the OER relevant to the industrial pole of Narni Scalo turned out to be twice the OER relevant to the industrial pole of Nera Montoro/ San Liberato (140,000 ouE s-1 vs. 71,000 ouE s-1), the odour impact simulated by the model shows an opposite behaviour, i.e. the odour impact relevant to the industrial pole of Nera Montoro/ San Liberato is significantly higher than the one relevant to the industrial pole of Narni Scalo. The odour sources of the industrial pole of Narni Scalo, and especially those of SGL Carbon, having the highest OER, are the main point sources (high stacks). The main emission of SGL Carbon, which alone has an OER of over 120,000 ouE s-1 is 130 m high, having an excellent dispersion capability, resulting in a negligible impact on the territory. On the contrary, the plant Alcantara located in the industrial pole of Nera Montoro/ San Liberato is characterized by the presence of odour sources with a poorer dispersion capacity, such as lower stacks (less than 20 m high). The modelled OERs are in general much higher than the OERs reported in Table 1, which are referred to the sampling conditions, i.e. to an air velocity of 0.035 m s-1.
Concluding remarks
The combination of olfactometric analyses and dispersion modelling allowed the evaluation of citizens’ exposure to industrial odours, resulting in both the quantification of emissions and the assessment of their impact on the territory. The overall odour emission rate (OER) relevant to the industrial pole of Narni Scalo was estimated to be equal to ca. 140000 ouE s-1, of which 87.5% deriving from a plant for the production of graphite electrodes for steel plants; whereas those relevant to the industrial pole Nera Montoro/ San Liberato was estimated to be equal to ca. 70000 ouE s-1, of which 63% deriving from a textile industry.
The simulation of the emission dispersion shows that the odour impact relevant to the industrial pole Nera Montoro/ San Liberato, despite its lower overall OER, is quite higher than the odour impact of the industrial pole of Narni Scalo. This difference is due to the different characteristics of the odour sources considered: the industrial pole of Narni Scalo is characterized mostly by the presence of point sources and high stacks, which provide a good dispersion of emissions. On the contrary, the higher odour impact relevant to the industrial pole Nera Montoro/ San Liberato may be attributed to the presence of several area sources at ground level, especially as far as the wastewater treatment plant of the textile industry is concerned, which are proven to have a very low dispersion capability.
Keywords: CALPUFF, dynamic olfactometry, odour concentration, odour dispersion modelling, odour emission rate
References
Capelli L., Sironi S., Del Rosso R., Céntola P., (2009), Design and validation of a wind tunnel system for odour sampling on liquid area sources, Water Science and Technology, 59, 1611-1620.
Capelli L., Sironi S., Del Rosso, R., (2013), Odor sampling: techniques and strategies for the estimation of odor emission rates from different source types, Sensors, 13, 938-955.
CEN, (2003), EN 13725:2003. Air quality - Determination of odour concentration by dynamic olfactometry, Brussels. Nicell J.A., (2009), Assessment and regulation of odour impacts, Atmospheric Environment, 43, 196-206. Schauberger G., Piringer M., (2012), Assessment of separation distances to avoid odour annoyance: interaction between odour
impact criteria and peak-to-mean factors, Chemical Engineering Transactions, 30, 13-18. Sironi S., Capelli L., Céntola P., Del Rosso R., Pierucci S., (2010), Odour impact assessment by means of dynamic olfactometry,
dispersion modelling and social participation, Atmospheric Environment, 44, 354-360.


![Panasonic...Durian odour 6 Natural reduction 60tmin.] Sweat odour Nonanoic acid Natural reduction 120[min.] Garbage odour Methylmercaptan Natural reduction 601minJ Scalp odour Panasonic](https://img.pdfslide.us/doc/110x75/60d72199474aa2073d394000/panasonic-durian-odour-6-natural-reduction-60tmin-sweat-odour-nonanoic-acid.jpg)