Embed Size (px)
Citation preview

October 4, 2017
Northern
Interior
Southeast
Southwest
Gulf Coast
Anchorage/
Mat-Su
STATE OF ALASKA Department of Health and Social Services Division of Public Health Section of Epidemiology
http://dhss.alaska.gov/dph/Epi/id/Pages/tb.aspx

Alaska 2016 TB Report 2
Table of Contents
Executive Summary ………………………………………… 3 Summary Statistics ………………………………………… 4 Trends in Tuberculosis ………………………………………… 5 Demographics ………………………………………… 9 Treatment Indicators ………………………………………… 17
Resources and Links ………………………………………… 23 Acknowledgements: Tuberculosis prevention and control in Alaska is a multiagency activity from assisting in screening activities to collecting and analyzing laboratory specimens to ensuring that patients receive appropriate medication. We thank all public health and clinical partners who contribute to this effort. Data were compiled by Alaska Division of Public Health, Section of Epidemiology staff with special thanks to Megan Tompkins, MPH, Infectious Disease Program Information System Coordinator.

Alaska 2016 TB Report 3
Executive Summary In 2016, Alaska reported 57 confirmed cases of tuberculosis (TB), or 7.7 cases per 100,000 people. Southwest and Northern regions continue to record the highest rates in the state, and the Alaska Native population continues to bear a disproportionate burden. There are numerous unique challenges in Alaska which continue to contribute to high rates of disease. A historically very high rate of TB in the mid-20th century has led to large numbers of latently infected individuals in rural regions of the state. Social challenges, such as household crowding, in some of these areas and the great distances often required to receive medical care can facilitate the transmission of TB. In spite of these ongoing challenges, notable successes and improvements in TB control occurred in 2016. A transition to a risk-based school screening system has resulted in a focus on testing for children only with factors that put them at higher risk of TB exposure, and in a marked cost-savings to the State. Continued adoption of shorter course treatment for latent infection with a 3-month isoniazid and rifapentine regimen has led to improved treatment completion. Continued focus on enhanced contact investigations has led to improved outcomes for individuals at high risk for TB infection and disease. An interactive training module for community-based directly observed therapy aides was piloted and then adopted. Finally, much progress was made with regard to the harmonization and streamlining of the Alaska electronic TB databases, which has improved all facets of case management. A shift towards identifying and successfully treating individuals at high risk for latent TB infection (LTBI) has been discussed as a further strategy to decrease TB rates, as the effectiveness of traditional approaches seems to have plateaued. In the coming years, it will be important for Alaska to not only continue the current TB control efforts but also move towards a more systematic approach towards LTBI surveillance and treatment.

Alaska 2016 TB Report 4
Tuberculosis Cases Summary Statistics, Alaska, 2012-2016
Statistic 2012 2013 2014 2015 2016
Total annual TB case count 66 71 62 68 57
Alaska population 732,298 736,399 736,337 737,625 739,828
Alaska case rate (per 100,000)
9.0 9.6 8.4 9.2 7.7
U.S. case rate (per 100,000)
3.2 3.0 3.0 3.0 2.9
Alaska population 0-14 years
158,865 159,860 159,846 158,116 158,935
Cases 0-14 yrs old (% total)
Cases/100,000
9 (14%)
5.7
10 (14%)
6.3
2 (3%) 1.3
12 (17%)
7.6
7 (12%)
4.4
Cases foreign-born (% total)
12 (18%)
16 (23%)
12 (19%)
8 (12%)
11 (19%)
Cases homeless (% total)
6 (9%)
7 (10%)
16 (23%)
9 (13%)
2 (4%)
Cases isoniazid-resistant 2 5 6 11 5
Cases multiple drug resistant TB (MDR-TB)
1 0 1 0 1*
Cases offered HIV testing (% of total)
55 (83%)
62 (87%)
58 (94%)
54 (79%)
51 (89%)
Cases infected with HIV 0 0 0 0 1
Cases with drug use (IV & non-IV) (% total)
15 (23%)
7 (10%)
6 (10%)
14 (21%)
15 (26%)
Cases with excessive alcohol use (% total) aged >14
30 (52%)
21 (35%)
25 (42%)
21 (40%)
16 (28%)
*Current guidance from the CDC requires conventional drug susceptibility test results to confirm a diagnosis of MDR TB, and does not allow molecular susceptibility results as the single diagnostic test.

Alaska 2016 TB Report 5
Trends in Tuberculosis
Incidence of Tuberculosis In 2016, 57 cases of tuberculosis (TB) were reported to the Alaska Tuberculosis Program for an incidence of 7.7 cases per 100,000 population, a decline from the rate of 9.2 in 2015. The United States TB incidence was 2.9 cases per 100,000 in 2016, slightly less than the 3.0 rate in 2015.
Historically, Alaska experienced some of the highest rates of TB morbidity and mortality in the early and mid-20th century. Great progress was made in rapidly reducing the burden of disease seen during this time, as noted in the figure below. Much of the TB activity in Alaska today is related to this legacy and the ongoing challenges in Alaska of health care infrastructure and geography.
9.7 9.4
15.3
13.3
16.0
12.8
8.99.8
17.2
8.57.6
8.8
6.5
8.910.4
7.5 7.5
5.3
8.09.3 9.0 9.6
8.49.2
7.710.59.8 9.4
8.78 7.4 6.8 6.4 5.8 5.6 5.2 5.1 4.9 4.8 4.6 4.4 4.2 3.8 3.6 3.4 3.1 3 3 3 2.9
0.0
2.0
4.0
6.0
8.0
10.0
12.0
14.0
16.0
18.0
20.0
19
92
19
93
19
94
19
95
19
96
19
97
19
98
19
99
20
00
20
01
20
02
20
03
20
04
20
05
20
06
20
07
20
08
20
09
20
10
20
11
20
12
20
13
20
14
20
15
20
16
Cas
es/
10
0,0
00
Tuberculosis Rates – Alaska and the United States,1992-2016
AK
U.S.
0100200300400500600
Cas
es/
10
0,0
00
Year
Tuberculosis Rates – Alaska, 1952-1991

Alaska 2016 TB Report 6
In 2016, Alaska was one of 12 reporting areas with a tuberculosis rate that exceeded the U.S. national average. The states with the highest TB rates are listed below.
States with Highest TB Incidence, 2016* State or District Number Cases Incidence of TB Population
Alaska 57 7.7 739,828
Hawaii 119 8.3 1,433,735
California 2,073 5.3 39,113,207
Texas 1,250 4.5 27,777,778
New York 768 3.9 19,692,308 *https://www.cdc.gov/mmwr/volumes/66/wr/mm6611a2.htm?s_cid=mm6611a2_w#T1_down
Tuberculosis by Case Definition Cases of active TB can be classified as either a laboratory-confirmed or a clinical case, based on CDC definition: https://wwwn.cdc.gov/nndss/conditions/tuberculosis/case-definition/2009/. Laboratory-confirmed cases include those with isolation of Mycobacterium tuberculosis from a clinical specimen, demonstration of M. tb with nucleic acid amplification, or demonstration of acid-fast bacilli when a culture is not possible or is falsely negative. While clinical cases lack laboratory confirmation, they must include certain criteria such as signs and symptoms of TB, treatment with two or more TB medications, a completed diagnostic evaluation, and either tuberculin skin test or interferon gamma release assay results. The vast majority of TB cases in Alaska are laboratory-confirmed, with between 3 and 10 clinical cases diagnosed each year from 2012-2016.
56
6459 61
49
107
37 8
0
10
20
30
40
50
60
70
2012 2013 2014 2015 2016
Cas
es
(n)
Tuberculosis Cases by Case Definition – Alaska, 2012-2016
Lab confirmed
Clinical diagnosis

Alaska 2016 TB Report 7
Smear Status Individuals suspected of having pulmonary TB disease have sputum specimens sent to the laboratory to look for TB bacteria. Specimens are monitored for growth of TB bacteria for 6 weeks. Those with initial positive smears upon examination are considered to be more infectious than those with negative smears. From 2012-2016, between 32-41% of TB cases had positive smears.
Deaths Related to Tuberculosis Most years in Alaska there are deaths attributable to TB. While individuals with TB may also die from unrelated causes, 14 TB-related deaths occurred from 2012-2016.
41
35
3941
32
0
5
10
15
20
25
30
35
40
45
2012 2013 2014 2015 2016
Pe
rce
nta
ge (
%)
Percentage of Tuberculosis Patients Who Were Smear Positive – Alaska, 2012-2016
3
2
3
4
2
0
1
2
3
4
5
2012 2013 2014 2015 2016
Nu
mb
er
(n)
Deaths Related to Tuberculosis – Alaska, 2012-2016

Alaska 2016 TB Report 8
Reason for Initial Evaluation Individuals diagnosed with TB disease in Alaska are most frequently initially evaluated for TB due to TB symptoms such as cough, fever, weight loss or night sweats. Another large proportion of TB cases are identified as part of contact investigations. Targeted testing for individuals with risk factors for TB (such as being from a country with high rates of TB), and following up on abnormal radiographs obtained for other reasons are other common ways that individuals with TB are first evaluated.
0
5
10
15
20
25
30
Nu
mb
er
(n)
Reason Initially Evaluated for Tuberculosis – Alaska, 2012-2016
2012
2013
2014
2015
2016
Alaska 2016 TB Report 9
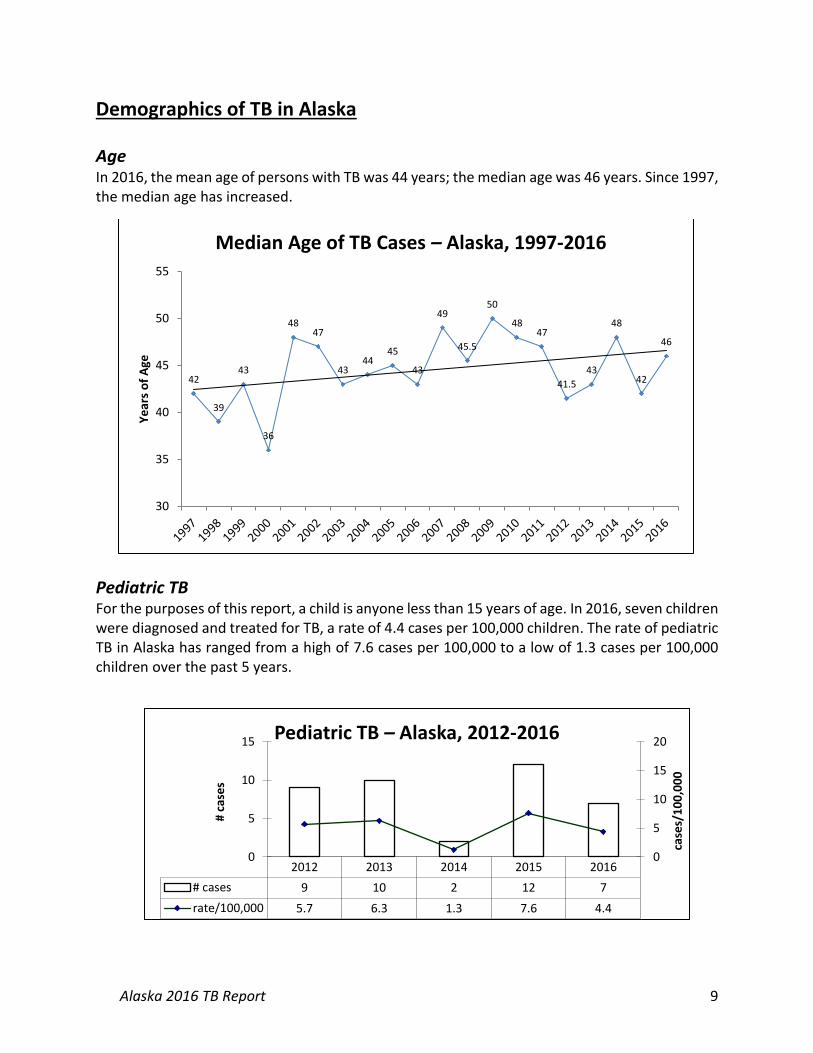
Demographics of TB in Alaska
Age In 2016, the mean age of persons with TB was 44 years; the median age was 46 years. Since 1997, the median age has increased.
Pediatric TB For the purposes of this report, a child is anyone less than 15 years of age. In 2016, seven children were diagnosed and treated for TB, a rate of 4.4 cases per 100,000 children. The rate of pediatric TB in Alaska has ranged from a high of 7.6 cases per 100,000 to a low of 1.3 cases per 100,000 children over the past 5 years.
42
39
43
36
4847
4344
45
43
49
45.5
50
4847
41.5
43
48
42
46
30
35
40
45
50
55
Ye
ars
of
Age
Median Age of TB Cases – Alaska, 1997-2016
2012 2013 2014 2015 2016
# cases 9 10 2 12 7
rate/100,000 5.7 6.3 1.3 7.6 4.4
0
5
10
15
20
0
5
10
15
case
s/1
00
,00
0
# ca
ses
Pediatric TB – Alaska, 2012-2016

Alaska 2016 TB Report 10
Race Alaska Native and foreign-born persons continue to bear a disproportionate burden of TB in Alaska.
TB Incidence Rates per 100,000 by Race Categories – Alaska, 2012-2016
Race 2012 2013 2014 2015 2016*
White 0.8 0.8 0.4 0.6 0.4
Black/African-American 0.0 0.0 0.0 0.0 4.3
Alaska Native 43 44 38 50.8 37.1
Asian/Pacific Islander 15 23 23 17 21.6
Foreign-Born 19.8 33.9 21.5 12.8 17.6
Statewide TB incidence rate, all races 8.9 9.7 8.4 9.2 7.7
*The Alaska Department of Labor and Workforce Development reports population estimates annually as of July each year. The 2016 population estimates are not yet available. To determine the rates for 2016, the population estimates from July 2015 were therefore used.
Sex In 2016, 53% of TB case-patients were male. Over the past 10 years, 62% of 585 cases were male and 38% were female.
2007 2008 2009 2010 2011 2012 2013 2014 2015 2016
Male 9.8 9.5 6.8 9.9 11.4 9.2 12.3 9.9 11.6 7.8
Female 7.4 7.4 3.8 6.5 7.3 8.8 6.7 6.7 6.9 7.5
0
2
4
6
8
10
12
14
Cas
es/
10
0,0
00
Incidence of TB by Gender, Alaska, 2007-2016

Alaska 2016 TB Report 11
Homelessness In 2016, two of 57 (4%) TB case-patients were reported to be homeless. Both cases were from Anchorage. The estimated total homeless persons for Alaska in 2016 was 1,940 (2016 Annual Homeless Assessment Report, https://www.hudexchange.info/resource/5178/2016-ahar-part-1-pit-estimates-of-homelessness/), providing a rate of 103 homeless persons with TB per 100,000.
Number and Location of Homeless Persons with TB, 2012-2016, Alaska Region 2012 2013 2014 2015 2016
Anchorage/Mat-Su Region 2 5 8 6 2
Northern Region 2 1 3 2 0
Southwest Region 2 1 2 1 0
Southeast Region 0 0 0 0 0
Gulf Coast Region 0 0 0 0 0
Interior Region 0 0 1 0 0
Statewide Total Homeless Cases
6 7 14 9 2
%TB cases homeless 9% 10% 23% 13% 4%
Statewide Homeless Population Estimate
1,913 1,946 1,784 1,956 1,940
Homeless case rate per 100,000
314 360 784 460 103
During 2014, a dramatic spike in the case rate per 100,000 homeless individuals was seen. The rate has since trended downward to a 5-year low of 103 per 100,000 in 2016. TB screening for homeless individuals is an ongoing challenge. A high proportion of homeless people have long-standing latent TB infection. Therefore TB skin testing is not useful for measuring ongoing TB transmission in shelters and other organizations that serve this population. Symptom screening coupled with sputum tests have become the tools of choice in this population. The Municipality of Anchorage Department of Health and Human Services performs targeted TB screening among the homeless population on a regular basis.
Excessive Alcohol Use Heavy alcohol use is associated with TB. Both a pathogenic impact on the immune system and social links likely play a role in this association. Poorer outcomes such as death during treatment, treatment interruptions, and suboptimal culture conversion have been associated with excessive alcohol use. Nationally, approximately 15% of TB patients have excessive alcohol use documented. In Alaska, between 28-52% of individuals diagnosed with TB from 2012-2016 had documented excessive alcohol use.

Alaska 2016 TB Report 12
Regional trends The incidence of tuberculosis is not evenly distributed throughout the state. The highest rates are found in the Northern and Southwest regions of the state, which also have relatively higher proportions of Alaska Native residents. The six regions of the state are shown in the map on the title page of this document.
Number and Incidence of TB Cases by Region – Alaska, 2012-2016
Region 2012
(cases/100,000) 2013
(cases/100,000) 2014
(cases/100,000) 2015
(cases/100,000) 2016
(cases/100,000)
Anch/Mat-Su 10 (2.5) 25 (6.3) 22 (5.5) 18 (4.5) 19 (4.7)
Gulf Coast 3 (3.7) 4 (5.0) 0 (0.0) 2 (2.5) 1 (1.2)
Interior 4 (3.5) 1 (0.9) 4 (3.6) 6 (5.3) 3 (2.7)
Northern 16 (58.6) 10 (36.3) 17 (61.7) 7 (25.2) 7 (25.2)
Southeast 5 (6.7) 1 ( 1.3) 2 (2.7) 0 (0.0) 2 (2.7)
Southwest 28 (66.6) 30 (70.5) 17 (39.9) 35 (82.5) 27 (63.9)
STATE TOTAL 66 (9.0) 71 (9.6) 62 (8.4) 68 (9.2) 57 (7.7)
52
35
4240
28
0
10
20
30
40
50
60
2012 2013 2014 2015 2016
Pe
rce
nta
ge (
%)
TB Cases Aged 14+ Years with Excessive Alcohol Use – Alaska, 2012-2016

Alaska 2016 TB Report 13
The Northern Region includes the North Slope Borough, Nome Census Area, and Northwest Arctic Borough. This region reported case rates of 25.2 cases per 100,000 for both 2015 and 2016, which was a decline from the rate of 61.7 in 2014. The Southwest Region includes the East and West Aleutians, Bethel Census Area, Bristol Bay, Dillingham Census Area, Kusilvak Census Area, and Lake and Peninsula Borough. This region has had the highest rate of TB in Alaska for 7 of the 10 previous years. The case rate per 100,000 had shown a promising decline to 39.9 in 2014, but it again increased to 82.5 in 2015 and 63.9 in 2016. Small, rural village-based outbreaks continue to pose an ongoing challenge to TB control in Alaska.
Village and Community Outbreaks All isolates grown at the Alaska State Public Health Laboratory are sent to CDC for genotyping. The descriptions of notable village-based outbreaks below include genotyping (and GENTYPE) information. Village A The single largest YK Delta village outbreak for many years occurred in 2013: a total of 17 cases of active TB were detected in this village of less than 1,000 people. One case had compatible symptoms and was PCR positive, but smear and culture negative. The remaining 16 case-patients had positive cultures (four gastric, 12 sputa), and all shared GENTYPE G13072. Ages ranged from under 5 to over 70 years of age. Thirteen of the case-patients were male. Two additional TB cases with matching G13072 GENTYPE were identified in 2014 from this and a neighboring village, with one additional in 2015, and two more in 2016.
0
10
20
30
40
50
60
70
80
90
2007 2008 2009 2010 2011 2012 2013 2014 2015 2016
Cas
es/
10
0,0
00
Incidence of TB by Region, Alaska, 2007-2016
Anchorage/Mat-Su Gulf Coast Interior Northern SE SW

Alaska 2016 TB Report 14
Village B Village B is located in the YK Delta Region and the last outbreak occurred in 1987, when 11 cases of TB were reported. After 19 years without any TB, a single case was reported in 2009, followed by four cases in 2010. More than 2.5% of this community had active TB. Of four isolates available for testing, all were genotype cluster AK_0017 (PCR00015). Two more cases with this genotype were discovered in this village in 2011. In 2012, four further cases with this GENTYPE (G10422) were identified in Alaska, two from this village, one from Anchorage and one from a village in the Northern Region with travel reported to the Southwest, although no direct contact to known active TB cases. In 2013, four new active TB cases with G10422 were reported, one from Village B. In 2014, one further case with matching GENTYPE was discovered in village B, with another in a neighboring village. After multiple village-wide assessments, no further cases with this genotype were identified anywhere in the state in 2015 or 2016. Village C In 2013, six TB cases were reported from a village of under 700 persons, Village C, in the Northern Region, all with GENTYPE G11428. One case involved a patient who was successfully treated in 2009. Six cases with matching GENTYPE were reported in 2012 in the town which serves as the hub for the village. In 2014, six further cases were detected with matching GENTYPE in village C, with four additional cases detected in the hub town and one in an additional nearby village. Ongoing focused screening continues in village C, where two further cases were identified in 2015, and one in 2016. This village continues to be a focus of targeted investigation and testing through biannual TB village screening assessments. Village D Prior to 2015, the last confirmed case of TB in village D, a village in the Southwest Region of under 700 persons, was in 1985. In January of 2015, an adult female and infant from village D were diagnosed with TB with GENTYPE G08423, a GENTYPE previously seen predominantly in Anchorage homeless persons. Subsequent contact investigations in village D identified eight further cases of TB in this village, all with the same GENTYPE, for a rate of over 1,400 per 100,000 persons. This GENTYPE was identified in 3 additional geographically disparate cases in 2016. Village E After no TB cases detected since 2011, village E, a village of under 800 in the Southwest Region, experienced an outbreak of TB in 2015. In February 2015, TB was diagnosed in a young man from this village. Subsequent village-wide contact investigations identified an additional nine cases of TB in 2015; however, only one was identified in 2016. All of these cases with specimens available have been isoniazid-resistant, with the same GENTYPE (G15522) not seen elsewhere in Alaska or in the entire United States. Village F A village of fewer than 700 persons in the Southwest region which had seen no cases of active TB since 2011 has been a source of recent outbreak activity. In 2016, 10 cases were diagnosed. Of the 10 cases from 2016, seven were female and three were male, with an average age of 45 years.

Alaska 2016 TB Report 15
One case had smear positive sputa. Eight cases in this outbreak have all been identified as GENTYPE G32335, which has been seen nowhere else in the state or the rest of the country during the past 10 years. Focused interventions ongoing in this village include biannual TB screening assessments and thorough contact investigation.
Foreign-born Persons with TB In 2016, 11 (19%) of 57 TB cases were in foreign-born individuals, compared to 8 (12%) in 2015, 12 (19%) in 2014, 16 (23%) in 2013 and 11 (17%) in 2012. Seven individuals were originally from the Philippines, and one individual each were from Cambodia, China, Ethiopia, and Lao People’s Democratic Republic respectively. In comparison, nationally 68% of all TB case-patients were foreign-born in 2016.
Between 2012 and 2016, 58 foreign-born persons were diagnosed with tuberculosis in Alaska, representing 18% of total TB cases. They originated from 13 different countries. The Philippines was the country of origin for 50% (29) of foreign-born TB cases.
Country of Origin for TB Cases Foreign-Born, >1 Case – Alaska, 2012-2016
Country of Origin TB Cases (% of all foreign-born cases, 2012-16)
China 2 (3.4%)
Ethiopia 2 (3.4%)
Philippines 29 (50.0%)
Laos 6 (10.3%)
Korea, Republic of 7 (12.1%)
Mexico 3 (5.2%)
50 5037
57
67 6671
6268
57
16%
24%24%
18%
24%
17%
23%19%
12%
19%
0%
10%
20%
30%
40%
50%
0
10
20
30
40
50
60
70
80
2007 2008 2009 2010 2011 2012 2013 2014 2015 2016
% F
ore
igh
-bo
rn
Tota
l TB
Cas
es
Total TB Cases and Percent Foreign-born – Alaska, 2007-2016
# TB Cases % Foreign-born

Alaska 2016 TB Report 16
Non-pulmonary Tuberculosis In 2016, nine individuals had extra-pulmonary TB only and the remaining 48 individuals had pulmonary TB only. In the past 5 years, approximately 10% of all TB cases involved an extra-pulmonary site.
Body Site of Non-Pulmonary TB – Alaska, 2012-2016 Site 2012 2013 2014 2015 2016 Total
Lymphatic: cervical 2 2 4
Genitourinary 1 1 1 3
Pleural 2 1 1 4 8
Lymphatic: intrathoracic 1 1
Bone/Joint 1 2 2 5
Pericardium 1 1
Meningeal 2 2
Other 1 1 2
Lymphatic: other 2 1 3
Eye and Ear 1 1
Peritoneal 2 2
Gastrointestinal/Colon 1 1
Pancreas 1 1
Total for year 6 5 6 8 9 34

Alaska 2016 TB Report 17
Treatment Indicators
Completion of Treatment For individuals without multidrug resistant TB, completion of therapy within 12 months is a priority, and most individuals complete therapy within 6 months. It is not unusual for the treatment period to be extended because patients develop adverse reactions to medications, requiring an alternative regimen. On other occasions, patients are non-compliant or lost to follow-up, often due to underlying social issues. State public health law has not been particularly effective in helping to assure treatment of non-compliant patients. Analysis of completion rates excludes those who died before completion of treatment, or those for whom treatment longer than 12 months was indicated.
*Data through 2015, as 2016 data will not be finalized until cases have had time to complete treatment.
Contact Investigation There have been steady improvements in identification of contacts to active TB cases and the percentage of contacts that complete therapy for latent TB infection in the past 5 years.
8993 93 94
90
0
10
20
30
40
50
60
70
80
90
100
2011 2012 2013 2014 2015
Pe
rce
nta
ge (
%)
Treatment Completed Within 12 Months –Alaska, 2011-2015

Alaska 2016 TB Report 18
Contact Investigation Measures by Year – Alaska, 2012-2016
Measure 2012 2013 2014 2015 2016
Total Cases 66 71 62 68 57
Percentage of smear positive TB cases with contacts identified
100% 96% 100% 100% 100%
Percentage of contacts evaluated for TB infection and disease
86% 90% 83% 89% 84%
Percentage of infected contacts started on therapy
74% 80% 60% 100% 100%
Percentage of contacts who completed therapy
72% 82% 67% 94% 88%
Recommended Initial Therapy Public health nurses and providers in Alaska accept the standard four-drug regimen as the standard of care for treatment of TB disease. In cases where the TB patient is epidemiologically linked to another case with known susceptibilities, the patient may be started on a 3-drug regimen as ethambutol would not be necessary as a guard against resistant organisms. For four of the past five years, over 75% of patients have started on a four-drug regimen. In 2015, eight patients (11.7% of cases) were from a village outbreak with known isoniazid (INH) resistance and were intentionally not started on INH for this reason.
Treatment Initiation With the vast geography and limited health care infrastructure that TB control in Alaska faces, getting individuals diagnosed with TB started on therapy quickly will always be a challenge.
92% 93% 94%
75%
84%
0%
10%
20%
30%
40%
50%
60%
70%
80%
90%
100%
2012 2013 2014 2015 2016
Pe
rce
nta
ge (
%)
Patients Started on 4-Drug Regimen –Alaska, 2012-2016
Alaska 2016 TB Report 19
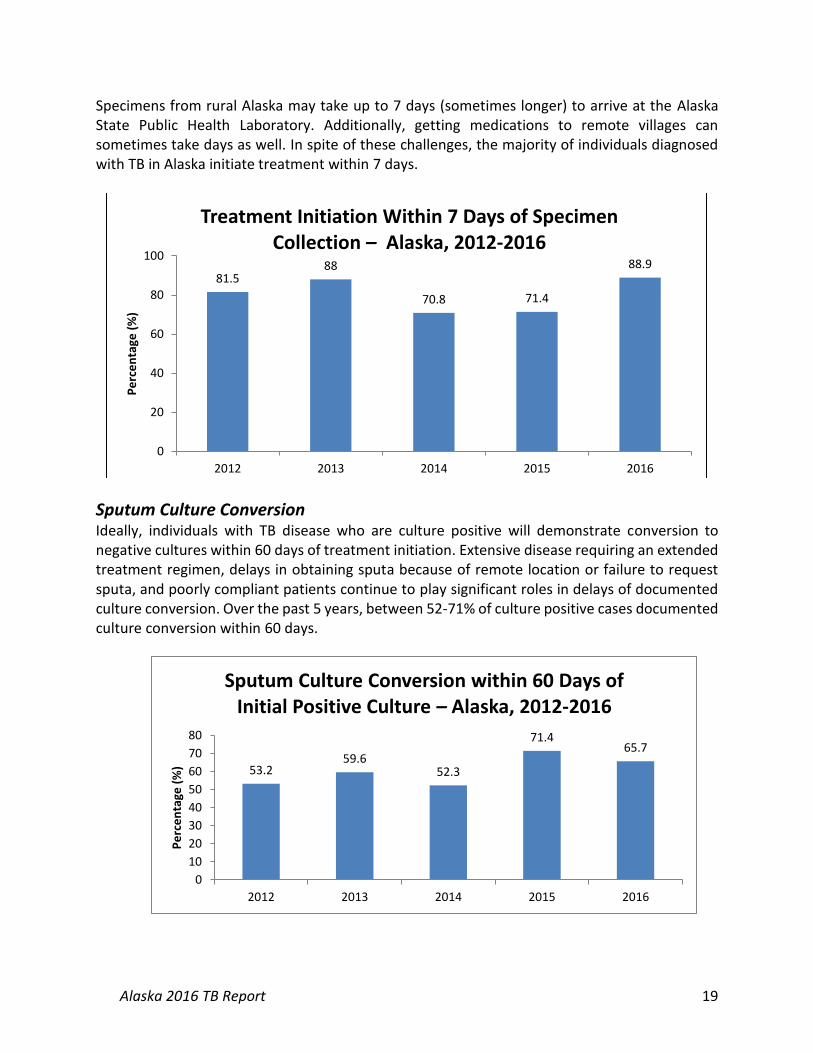
Specimens from rural Alaska may take up to 7 days (sometimes longer) to arrive at the Alaska State Public Health Laboratory. Additionally, getting medications to remote villages can sometimes take days as well. In spite of these challenges, the majority of individuals diagnosed with TB in Alaska initiate treatment within 7 days.
Sputum Culture Conversion Ideally, individuals with TB disease who are culture positive will demonstrate conversion to negative cultures within 60 days of treatment initiation. Extensive disease requiring an extended treatment regimen, delays in obtaining sputa because of remote location or failure to request sputa, and poorly compliant patients continue to play significant roles in delays of documented culture conversion. Over the past 5 years, between 52-71% of culture positive cases documented culture conversion within 60 days.
81.588
70.8 71.4
88.9
0
20
40
60
80
100
2012 2013 2014 2015 2016
Pe
rce
nta
ge (
%)
Treatment Initiation Within 7 Days of Specimen Collection – Alaska, 2012-2016
53.259.6
52.3
71.465.7
0
10
20
30
40
50
60
70
80
2012 2013 2014 2015 2016
Pe
rce
nta
ge (
%)
Sputum Culture Conversion within 60 Days of Initial Positive Culture – Alaska, 2012-2016

Alaska 2016 TB Report 20
Drug Resistance One multidrug resistant (MDR) case was diagnosed each in 2012 and 2014. The case of MDR TB in 2012 was from an individual whose only other risk factor for TB was spending less than 10 months volunteering at various sites in a former Russian republic country just prior to illness. The case from 2014 was in a foreign-born individual from Southeast Asia. Alaska had 11 isoniazid resistant cases of TB in 2015, and no MDR cases. One village in Alaska, which experienced an outbreak of TB in 2015, had a circulating isoniazid-resistant strain which was responsible for all TB from this village and thus accounted for the high number of isoniazid-resistant cases in 2015. During 2016, one case of MDR-TB was diagnosed in a foreign-born individual originally from an Asian country. Current guidance from the CDC requires conventional drug susceptibility test results to confirm a diagnosis of MDR TB, and does not allow molecular susceptibility results as the single diagnostic test. The State of Alaska is treating and counting this particular case as an MDR patient, but within CDC publications, this case will not be listed as MDR. Future case counting guidance from the CDC will continue to adapt to the progress and developments made in molecular testing, and may provide consideration for molecular susceptibility tests.
Known HIV Status There has been overall acceptance of HIV testing by both providers and TB patients, and there are few barriers to HIV testing, even in the most remote parts of the state.
2
5
6
11
5
1
0
1
0
1
0
2
4
6
8
10
12
2012 2013 2014 2015 2016
Co
un
t (n
)
Isoniazid Resistant and Multidrug Resistant Tuberculosis Cases – Alaska, 2012-2016
Isoniazid resistant
Multidrug resistant

Alaska 2016 TB Report 21
Laboratory Testing The Alaska State Public Health Laboratory (ASPHL) is capable of processing patient samples, identifying mycobacteria, performing first-line drug susceptibilities, and performing nucleic acid amplification testing (NAAT) on specimens. All cultures are sent to CDC laboratories for genotyping.
81.5 85.995.1
82.191.1
0
20
40
60
80
100
2012 2013 2014 2015 2016
Pe
rce
nta
ge (
%)
Percentage of Cases with Known HIV Status – Alaska, 2012-2016
57255405
4604
4251
4837
0
1000
2000
3000
4000
5000
6000
2012 2013 2014 2015 2016
Nu
mb
er
(n)
Clinical Specimens Processed and Cultured – Alaska, 2012-2016

Alaska 2016 TB Report 22
ASPHL developed and validated in-house NAAT testing in 2011, and this test has proved invaluable in rapidly identifying TB DNA in specimens. ASPHL currently processes close to 200 specimens per year.
111
145
190179
170
0
20
40
60
80
100
120
140
160
180
200
2012 2013 2014 2015 2016
Nu
mb
er
(n)
Number of Patients who Received NAAT Testing –Alaska, 2012-2016

Alaska 2016 TB Report 23
Resources and Links
State of Alaska TB Control Program Website
http://dhss.alaska.gov/dph/Epi/id/Pages/tb.aspx TB Control Program Annual Report http://dhss.alaska.gov/dph/Epi/id/SiteAssets/Pages/TB/TB_Report_2016.pdf Section of Epidemiology TB Bulletins http://epibulletins.dhss.alaska.gov/Bulletin/DisplayClassificationBulletins/39 Alaska TB Control Manual
http://dhss.alaska.gov/dph/Epi/id/SiteAssets/Pages/TB/TB_Manual.pdf
Centers for Disease Control and Prevention Main TB Website https://www.cdc.gov/tb/ National TB Indicators Project
http://www.cdc.gov/tb/publications/factsheets/statistics/ntip.htm TB Glossary of terms
https://www.cdc.gov/tb/topic/basics/glossary.htm