Embed Size (px)
Citation preview

October 31, 2019
Dear Senator Warren:
We write regarding the impact of your Medicare for All plan on national health expenditures(NHE) and federal government spending. We have reviewed prior cost analyses, applied existingresearch literature, and evaluated the specific policy features you have outlined. Based on ouranalysis, we estimate that your Medicare for All plan will decrease NHE to just under the$52 trillion projected under current law for the ten-year period from 2020-2029 and willrequire new federal spending of approximately $20.5 trillion over the 2020-2029 budgetwindow.
Prior cost analyses have produced a wide range of cost estimates for Medicare for All, differingby trillions of dollars. The total cost of a Medicare for All system ultimately depends on a seriesof policy choices, including, for example, the scope of covered benefits, the use (or not) ofbeneficiary cost sharing, how much providers are paid and under what payment models, the waythat drug prices (and other prices) are negotiated and set, and which existing public revenues areredirected toward Medicare for All. A large portion of the uncertainty around the cost ofMedicare for All can be resolved by describing such policy features that are not fully specified inthe Medicare for All Act of 2019 (S. 1129).
Another factor explaining the wide disparities among cost estimates is that analysts have useddifferent assumptions when trying to predict the behavioral impacts of single-payer insurance onproviders, patients, and others – that is, how families, doctors, and hospitals will interactdifferently with the health care system once Medicare for All is in place, compared to the statusquo. Projected NHE varies a great deal with those predicted behavioral changes.
This letter presents our analysis of the specific policy features that you have outlined andexplains the methodology underlying our cost estimate. Throughout the letter, we use the UrbanInstitute’s 2019 estimate of a “single-payer enhanced” plan as a reference point, identifying,where needed, how your plan differs from the plan they modeled. While it is of course the casethat any shift to Medicare for All would require a significant transition period, because Urbanestimates the costs of a single-payer proposal as if it were fully implemented and at steady-statestarting in 2020, we use the same approach in our analysis for ease of comparison.
First, compared to both the current health care system and the single-payer systemanalyzed by the Urban Institute, your plan would reduce national health expenditures from2020-2029. Under the “single-payer enhanced” proposal modeled by Urban, NHE would be $59trillion from 2020-2029, compared to $52 trillion under current law.1 We find that yourproposal’s approach to prescription drug price negotiation, provider payments, administrativespending, and cost growth would bring NHE for the ten-year budget window to just under $52trillion. This represents a more than $7 trillion reduction in health expenditures when compared
1Linda J. Blumberg et al., “Don’t Confuse Changes in Federal Health Spending with National Health Spending.”Urban Institute, October 2019. https://www.urban.org/urban-wire/dont-confuse-changes-federal-health-spending-national-health-spending
1
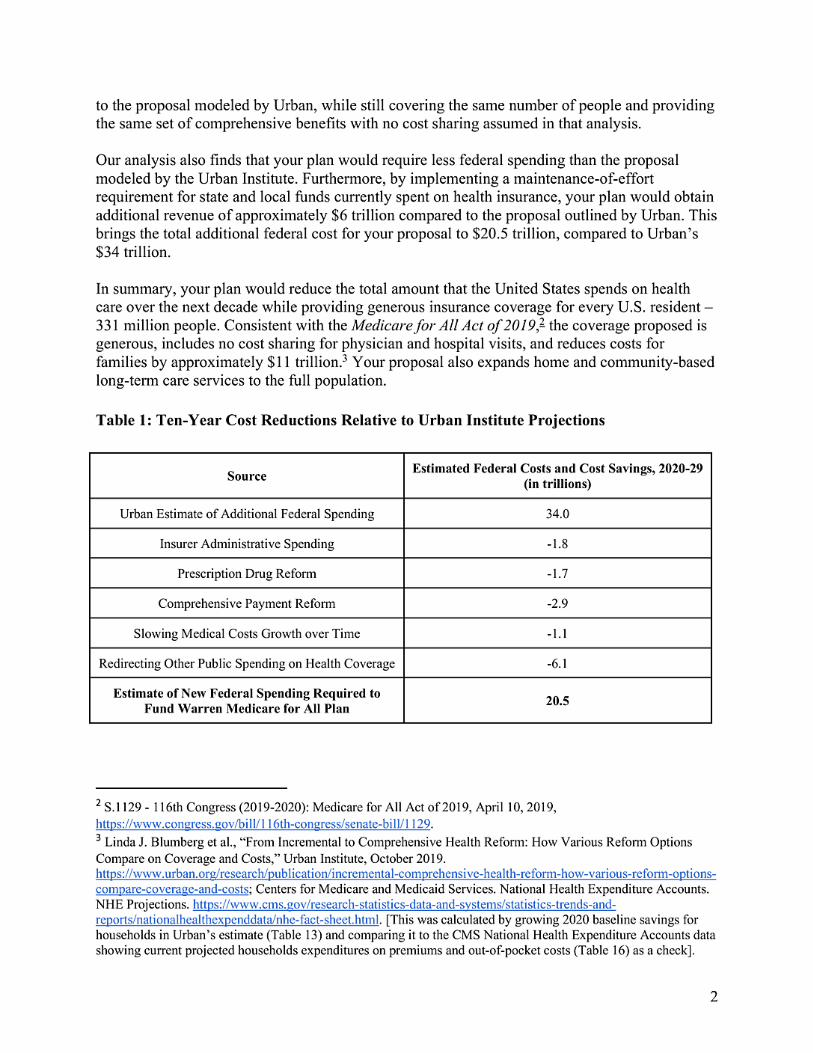
to the proposalmodeledby Urban,while still covering the same number of people and providingthe same set of comprehensivebenefitswith no cost sharing assumed in that analysis.
Our analysisalso finds that your plan would require less federal spending than the proposalmodeledby the Urban Institute.Furthermore,by implementinga maintenance-of-effortrequirement for state and local funds currently spent on health insurance,your plan would obtainadditional revenue of approximately$6 trillion compared to the proposal outlined by Urban.Thisbrings the total additional federal cost for your proposal to $20.5 trillion, compared to Urban’s$34 trillion.
Insummary,your plan would reduce the total amount that the UnitedStatesspends on healthcare over the next decade while providinggenerous insurance coverage for every U.S. resident –331millionpeople.Consistent with the Medicare for All Act of 2019,2 the coverage proposed isgenerous, includesno cost sharing for physicianand hospitalvisits, and reduces costs forfamilies by approximately$11trillion.3 Your proposal also expandshome and community-basedlong-termcare services to the full population.
Table 1:Ten-Year Cost ReductionsRelativeto UrbanInstituteProjections
Source EstimatedFederalCosts and Cost Savings,2020-29(intrillions)
UrbanEstimate of AdditionalFederal Spending 34.0
Insurer Administrative Spending -1.8
PrescriptionDrugReform -1.7
Comprehensive Payment Reform -2.9
SlowingMedical Costs Growthover Time -1.1
RedirectingOther Public Spending on Health Coverage -6.1
Estimate of New FederalSpendingRequiredtoFundWarrenMedicare for All Plan 20.5
2 S.1129 - 116thCongress (2019-2020):Medicare for All Act of 2019,April 10,2019,https://www.congress.gov/bill/116th-congress/senate-bill/1129.3 Linda J. Blumberg et al., “FromIncrementalto Comprehensive Health Reform: How Various Reform OptionsCompare on Coverageand Costs,” Urban Institute,October 2019.https://www.urban.org/research/publication/incremental-comprehensive-health-reform-how-various-reform-options-compare-coverage-and-costs;Centers for Medicare and Medicaid Services.National Health Expenditure Accounts.NHE Projections.https://www.cms.gov/research-statistics-data-and-systems/statistics-trends-and-reports/nationalhealthexpenddata/nhe-fact-sheet.html.[This was calculated by growing 2020 baseline savings forhouseholds in Urban’sestimate (Table 13) and comparing it to the CMS National Health Expenditure Accounts datashowingcurrent projected householdsexpenditureson premiumsand out-of-pocketcosts (Table 16) as a check].
2

Background
The United States spends a far greater amount per capita on health care than any other nation inthe world.4 American health care costs are higher because the U.S.pays higher prices for hospitalcare, physician services, medical equipment, and prescriptiondrugs – and because the U.S. hasmuch higher levelsof administrative spending.5 Your plan for Medicare for All reduces NHEwhile covering more people and providing more generousbenefitsbecause it uses the leverage ofa single, integrated payment system to address the root causes of our high health spending and tohelp reduce waste across the system.
Your fully-implementedMedicare for All system adoptsall the features of the Medicare for Allsystem described in S.1129, The Medicare for All Act of 2019: a single public insurer covering acomprehensive set of benefits, including long-term care, for all U.S. residents,with virtually nocost sharing.6 You have also provided additional policy details related to how your plan wouldhandle administration,payment to providers,and payment for pharmaceuticals– details not fullyspecified in the Medicare for All Act of 2019 – allowing for a more precise cost estimate of yourapproach to Medicare for All.
Inpreparing this estimate, we reviewed seven previously published cost analyses that estimateNHE and federal spending under single-payer health insurance reform.
Among the analyseswe reviewed,estimates of the impact on NHE vary widely. Two factorsexplain the substantial disparities among single-payer cost estimates. First, a single-payerprogram can be prescriptively designed in numerous ways through policy choices aroundbenefits, cost sharing, and payments,which strongly affect both costs and revenue demands.Second, analysts have made different predictive assumptionsabout changes in utilizationof care.Because designs and behavioral assumptionsdiffer, these estimatesare not directly comparableto one another.
Because of these differences, it is not surprising that these analysesproduce cost estimatesvarying by trillions of dollars. For instance,estimatesof changes in NHE cumulatively over tenyears range from a $12.5 trillion decrease (Friedman) to a $7 trillion increase (Urban) whencompared to current policies.Estimates of the new federal spending required also vary widely,from a low of $14 trillion (PERI) to a high of $33 trillion (Blahous)and $34 trillion (Urban).7
4 “OECD Health SpendingPer Capita 2019,” OECD,2018,.https://data.oecd.org/healthres/health-spending.htmthin5 Irene Papanicolas,Liana R.Woskie, and Ashish K.Jha, “Health Care Spending in the United States and OtherHigh-Income Countries,” JAMA 319, no.10 (March13,2018): 1024–39,https://doi.org/10.1001/jama.2018.1150.6 S.1129 - 116thCongress (2019-2020):Medicare for All Act of 2019, April 10,2019,https://www.congress.gov/bill/116th-congress/senate-bill/1129.7 Robert Pollinet al., “Economic Analysis of Medicare for All,” PoliticalEconomy ResearchInstitute,November30, 2018, https://www.peri.umass.edu/publication/item/1127-economic-analysis-of-medicare-for-all;CharlesBlahous,“The Costs of a National Single-Payer Healthcare System,” MercatusCenter,2018,https://doi.org/10.2139/ssrn.3232864.;Gerald Friedman,“Yes,We Can Have Improved Medicare for All,” TheHopbrook Institute.March2019. https://www.hopbrook-institute.org/single-post/2019/03/29/Working-Paper-No-2-Yes-We-Can-Have-Improved-Medicare-for-All;Linda J. Blumberget al., “From Incrementalto ComprehensiveHealthReform:How Various ReformOptions Compare on Coverage and Costs,” Urban Institute,October 2019,
3

Our goal in this analysis is to produce a conservative, upper-bound estimate of NHE and newfederal spending under your Medicare for All proposal. As such, we benchmark our analysis tothe Urban Institute estimate, which projects the highest NHE and new federal spending of anypublished analysis, in addition to including long-term care. We have provided more informationabout our assumptions and methods in three appendices that follow this discussion.
https://www.urban.org/research/publication/incremental-comprehensive-health-reform-how-various-reform-options-compare-coverage-and-costs.
4
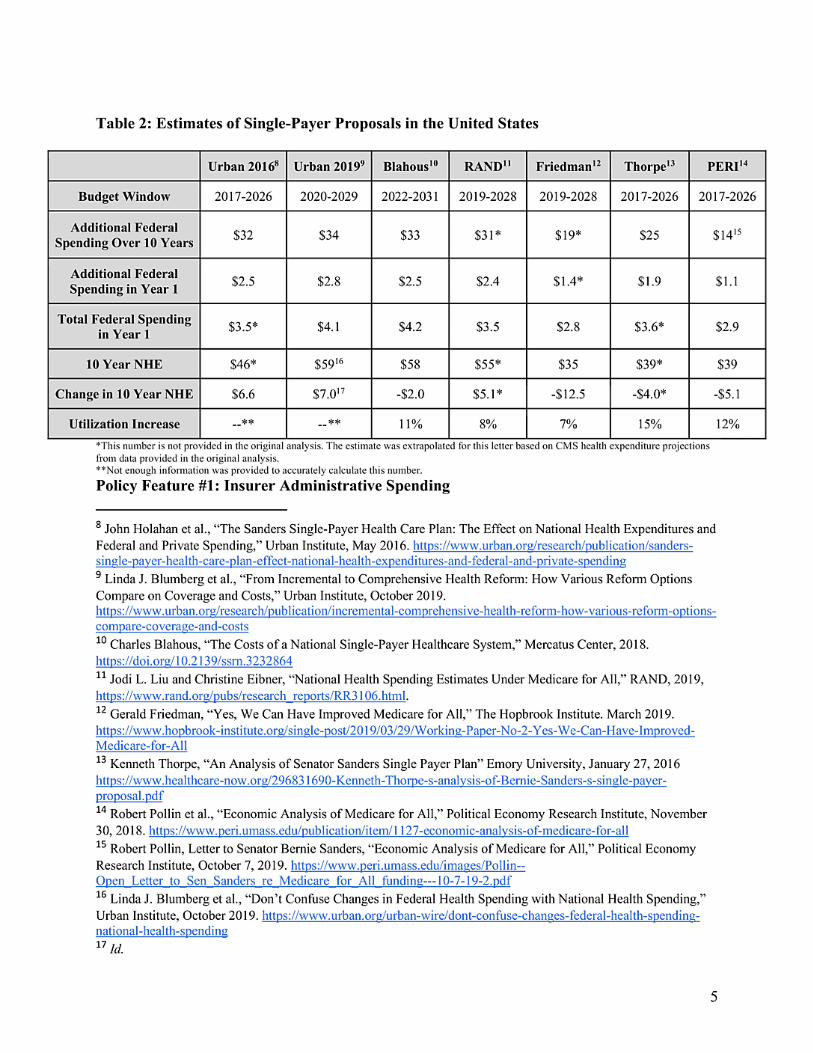
Table 2: Estimatesof Single-Payer Proposals in the UnitedStates
Urban 20168 Urban20199 Blahous10 RAND11 Friedman12 Thorpe13 PERI14
Budget Window 2017-2026 2020-2029 2022-2031 2019-2028 2019-2028 2017-2026 2017-2026
Additional FederalSpending Over 10 Years
$32 $34 $33 $31* $19* $25 $1415
Additional FederalSpending inYear 1
$2.5 $2.8 $2.5 $2.4 $1.4* $1.9 $1.1
Total Federal Spendingin Year 1
$3.5* $4.1 $4.2 $3.5 $2.8 $3.6* $2.9
10 Year NHE $46* $5916 $58 $55* $35 $39* $39
Change in10 Year NHE $6.6 $7.017 -$2.0 $5.1* -$12.5 -$4.0* -$5.1
UtilizationIncrease --** --** 11% 8% 7% 15% 12%
*This number is not provided in the original analysis. The estimate was extrapolated for this letter based on CMS health expenditure projectionsfrom data provided in the original analysis.**Not enough information was provided to accurately calculate this number.Policy Feature #1: Insurer Administrative Spending
8 John Holahan et al., “The Sanders Single-Payer Health Care Plan: The Effect on National Health Expenditures andFederal and Private Spending,” Urban Institute,May 2016. https://www.urban.org/research/publication/sanders-single-payer-health-care-plan-effect-national-health-expenditures-and-federal-and-private-spending9 Linda J. Blumberg et al., “From Incremental to Comprehensive Health Reform: How Various Reform OptionsCompare on Coverage and Costs,” Urban Institute,October 2019.https://www.urban.org/research/publication/incremental-comprehensive-health-reform-how-various-reform-options-compare-coverage-and-costs10 Charles Blahous, “The Costs of a NationalSingle-Payer Healthcare System,” Mercatus Center, 2018.https://doi.org/10.2139/ssrn.323286411 Jodi L.Liuand Christine Eibner, “National Health Spending Estimates Under Medicare for All,” RAND,2019,https://www.rand.org/pubs/research_reports/RR3106.html.12 Gerald Friedman,“Yes, We Can Have Improved Medicare for All,” The Hopbrook Institute.March 2019.https://www.hopbrook-institute.org/single-post/2019/03/29/Working-Paper-No-2-Yes-We-Can-Have-Improved-Medicare-for-All13 Kenneth Thorpe, “An Analysis of Senator Sanders Single Payer Plan” Emory University,January 27, 2016https://www.healthcare-now.org/296831690-Kenneth-Thorpe-s-analysis-of-Bernie-Sanders-s-single-payer-proposal.pdf14 Robert Pollin et al., “Economic Analysis of Medicare for All,” PoliticalEconomy Research Institute,November30, 2018. https://www.peri.umass.edu/publication/item/1127-economic-analysis-of-medicare-for-all15 Robert Pollin,Letter to Senator Bernie Sanders, “Economic Analysis of Medicare for All,” PoliticalEconomyResearch Institute,October 7, 2019. https://www.peri.umass.edu/images/Pollin--Open_Letter_to_Sen_Sanders_re_Medicare_for_All_funding---10-7-19-2.pdf16 Linda J. Blumberg et al., “Don’t Confuse Changes in Federal Health Spending with National Health Spending,”Urban Institute,October 2019. https://www.urban.org/urban-wire/dont-confuse-changes-federal-health-spending-national-health-spending17 Id.
5

The U.S. health care system has far higher administrative costs than any comparable health caresystem in the world, and administrative complexity is one of the largest sources of waste inAmerican health care.18 A major attraction of Medicare for All as a strategy for achievinguniversal coverage is the ability to significantly streamline that administrative apparatus,potentially saving hundreds of billions of dollars every year.
The cost of administering our health insurance system is higher than other nations largelybecause of our greater reliance on private insurance companies in the financing of medical care.In 2017, private insurers spent 12.2% of total premiums collected on administrative costs.19According to the Medicare Trustees Report, the administrative costs of traditional Medicare(Parts A and B) are 2.3%.20 In addition to lacking the economies of scale that Medicare enjoys,private insurers incur higher administrative costs due to spending on marketing, executivesalaries, brokers and other business costs – and the need to retain a portion of paid premiums asprofit.21A system built around multiple payers also produces expensive variations andcomplexities in processes for billing, coding, benefits adjudication, reporting, and measurement.
You propose to set administrative spending at 2.3% of total program costs. This matches the rateof administrative spending in traditional Medicare, which is structured similarly to yourMedicare for All program.22 This level of administrative expenditure is consistent with the levelsfound in other major comprehensive international health insurance systems, including single-payer systems.23
In its base case analysis, the Urban Institute assumes administrative spending of 6%. Using thedata provided in Urban’s sensitivity analysis, we find that setting the administrative spending ofMedicare for All to 2.3% would decrease NHE and federal spending by $1.8 trillion over ten
18 Irene Papanicolas, Liana R.Woskie, and Ashish K.Jha, “Health Care Spending in the United States and OtherHigh-Income Countries,” JAMA 319, no. 10 (March 13,2018): 1024–39, https://doi.org/10.1001/jama.2018.1150;William H. Shrank, Teresa L.Rogstad, and Natasha Parekh, “Waste in the US Health Care System,” JAMA 322, no.15 (October 7, 2019):1501-1509, https://jamanetwork.com/journals/jama/article-abstract/2752664.19 Centers for Medicare and Medicaid Services. National Health Expenditure Accounts. NHE Projections.https://www.cms.gov/research-statistics-data-and-systems/statistics-trends-and-reports/nationalhealthexpenddata/nhe-fact-sheet.html. The figure reported here is the Net Cost of Health Insurance,which includes profits.20 2019 Medicare Trustees Report, Boards of Trustees of the Federal Hospital Insurance and Federal SupplementaryMedical Insurance Trust Funds (April 22, 2019),https://www.cms.gov/Research-Statistics-Data-and-Systems/Statistics-Trends-and-Reports/ReportsTrustFunds/Downloads/TR2019.pdf. See Appendix A and AppendixC for further detail.21 U.S. Congressional Budget Office, Private Health Insurance Premiums and Federal Policy (Washington, D.C.,2016), http://www.cbo.gov/sites/default/files/114th-congress-2015-2016/reports/51130-Health_Insurance_Premiums.pdf.22 2019 Medicare Trustees Report, Boards of Trustees of the Federal Hospital Insurance and Federal SupplementaryMedical Insurance Trust Funds (April 22, 2019), https://www.cms.gov/Research-Statistics-Data-and-Systems/Statistics-Trends-and-Reports/ReportsTrustFunds/Downloads/TR2019.pdf.23 Irene Papanicolas, Liana R.Woskie, and Ashish K.Jha, “Health Care Spending in the United States and OtherHigh-Income Countries,” JAMA 319, no. 10 (March 13,2018): 1024–39, https://doi.org/10.1001/jama.2018.1150.
6
years. See Appendix A for further discussion of the literature on administrative spending rates inthe existing Medicare program.
Policy Feature #2: Prescription Drug Reform
America pays, on average, nearly four times more for drugs than individuals in other similarcountries – in some cases, over 60 times more for the same drug.24 A recent analysis by theHouse Committee on Ways and Means found that individual drug prices in the U.S. ranged from70% to 4,833% higher than the combined mean price for that same drug in 11other similarcountries.25 In 2016, annual pharmaceutical spending per capita was $1,220 in the U.S., driving$457 billion in spending on combined retail (dispensed at the pharmacy) and non-retail(dispensed in physician offices) drugs.26
Your Medicare for All plan addresses prescription drug costs and availability with a series ofreforms affecting payment for drugs, competition and the patent system, and innovation in drugdevelopment. You propose a net savings target of 70% below current Medicare prices for brandname prescription drugs and a net 30% reduction in Medicare prices for generics, which youpropose to achieve by using a suite of policies - principally through price negotiation, backed bycompulsory licensing and generic manufacturing where necessary. Given that U.S. prices are 3.7times higher, this reduction, when done in a balanced manner that targets high-cost branded andgeneric drugs, would bring U.S. branded drug prices more in line with similar high incomecountries.27 Presented another way, this proposal would aim for overall average prices forbranded drugs slightly below current Medicaid prices. As such, this price reduction essentiallyextends the decades of savings to Medicaid on drugs relative to other payers due to its inflationrebate, which requires manufacturers to refund Medicaid the difference in price increases aboveinflation, translating those inflation-pegged prices to drug spending across the rest of thepopulation.28 Though aggressive, we believe this savings target can be achieved using the policytools you have outlined. We also note that because your Medicare for All proposal will increasethe utilization of drugs by improving access, the change in overall pharmaceutical spending willbe less significant than the change in unit prices.
Prescription Drug Price NegotiationYou propose a negotiation mechanism for prescription drugs based on H.R. 3, the LowerPrescription Drug Costs Now Act, H.R. 1046, the Medicare Negotiation and CompetitiveLicensing Act of 2019, and S. 3375, the Affordable Drug Manufacturing Act. Specifically, yourapproach adopts the negotiation mechanism in H.R. 3, utilizing excise taxes as an incentive to
24 U.S. House of Representative Committee on Ways and Means. “Painful Pill to Swallow: U.S. vs. InternationalPrescription Drug Prices.” September 2019.https://waysandmeans.house.gov/sites/democrats.waysandmeans.house.gov/files/documents/U.S.%20vs.%20International%20Prescription%20Drug%20Prices_0.pdf.25 Id.26 Id.27 Id.28 Office of the Inspector General. U.S.Department of Health and Human Services. “Medicaid Rebates for BrandedDrugs Brand-Name Drugs Exceed Part D Rebate by a Substantial Margin.” April 2015.https://oig.hhs.gov/oei/reports/oei-03-13-00650.asp.
7

bring manufacturers to the table to negotiate prices. However,your approach strengthens thesenegotiationparameters by (i) includingboth branded and generic drugs in the negotiationprocess; (ii) reducing the maximum price to 1.1times the average internationalmarket (AIM)price from 1.2 times the AIMin H.R. 3; (iii) eliminating the limit on the total number of drugsfor which the Secretary can negotiate; (iv) removing requirementsthat the Secretary shall acceptthe target price linked to the lowest price in one of the six reference countries; and (v) adding aninflation rebate, similar to that in Medicaid.
This approach would allow Medicare for All to negotiate appropriate price reductions for drugs,recognizing that different drugs would individually experience different reductions in price. Weanticipate that most of these savings will derive from reductions in spending on brand namedrugs. Given its three-year phase in,CBO estimates that H.R.3 would save Medicare Part D$369 billion over the 2023-2029 window.29 As Part D Spending was only $154 billion of the$333 billion of retail drug spending in 2017, we project that the budgetary savings achieved bythe negotiationmechanism in H.R. 3 would be significantly higher if applied to the entirepopulation under a single-payer system that is reimbursingat Medicare rates (see Appendix C forfurther discussion).30 Moreover,we project that your proposal would generate savings beyondthose implied by the CBO estimate, because your plan incorporatesgeneric drugs and makesseveral design changes that strengthen Medicare for All’s negotiatingpower.
ReducingCosts Further while EnsuringAccess when NegotiationFailsIn the event that negotiation fails and a manufacturer chooses not to sell the drug in the U.S., youpropose to fall back on the compulsory licensing and government manufacturingprovisionsofH.R.1046 and S. 3375. This will ensure patient access to medicinesby allowing the governmentto either override the patent and licensing it to another manufacturer or provide governmentsupport for manufacturingthese drugs. These tools are likely to be most effective in cases wheremanufacturingprocesses can be quickly implementedby other producers.Because these leversallow for alternate manufacturingfor small molecule drugs, they reduce companies’ ability to putpressure on price negotiations by threatening to leave the U.S. market.We therefore expect thisbackstop to drive down negotiated costs and improve access to medications.
PharmaceuticalInnovationand Health Improvementunder Medicare for AllYou also indicated your intention to use the monopsony power of Medicare for All to increasethe utilizationand better incentivize the development of drugs that improve health and reducelong-term costs, including in areas such as cancer cures, antibiotics,and vaccines. We believethis approach would lead to increased research and development on these products– improvingoverall health and reducing system-wide costs.
29 CongressionalBudget Office. “Effects of DrugPrice Negotiation Stemming From Title 1 of H.R.3, the LowerDrugCosts Now Act of 2019, on Spendingand Revenues Related to Part D of Medicare.” October 11,2019.https://www.cbo.gov/publication/55722.30 Centers for Medicare and MedicaidServices.NationalHealthExpenditure Accounts.NHEProjections.Table 11.https://www.cms.gov/research-statistics-data-and-systems/statistics-trends-and-reports/nationalhealthexpenddata/nhe-fact-sheet.html;The Advisory Board.“What's driving higher drug spending inMedicare and Medicaid?” March 19,2019. https://www.advisory.com/daily-briefing/2019/03/19/drug-dashboard.
8
Due to market failures, our current health system does not incentivize the development orreimbursement of less expensive drugs with better long-term effects on cost and health (likeantibiotics) or long-term research (like early-stage cancer cures).31 As the purchaser ofprescription drugs for the entire U.S. population, Medicare for All has the power tofundamentally realign incentives, increase innovation, and drive the development of moresocially beneficial drugs.
Private health insurers are not incentivized to pay for cures in the form of drugs that may costmore up front but ultimately help patients and provide significant long-term economic benefit tosociety by lowering overall health care costs. Because insurance is tied to employment in theU.S., many individuals often move health insurance plans when they change employment –which was one-quarter of the workforce in 2018.32 Non-group plans also experience significantchurn.33 As such, a private insurer who pays for a costly treatment or cure will probably notrealize the economic gains that accrue from averting the need for more expensive care later inthat patient’s life. Under Medicare for All, early investments in upstream care could pay offdownstream, not just in health and wellbeing, but also financially.
As a single-payer, Medicare for All would rebalance innovation incentives that are currentlyskewed due to the many disparate payers in our health care system.34 Furthermore, the entity thatpays for the drug is also the entity that realizes the economic payoff later, making the drug worthhigher spending in the long run due to lower health care costs. And because the U.S. patentsystem and exclusivity regime grants monopolies to drug manufacturers, these companies willhave an automatic customer base of 331 million people in a Medicare for All system. Becauseour overall estimate is a conservative one, we do not estimate the potential cost savings from thisalignment of incentives, but we do acknowledge that they have the potential to be significant.
By our analysis, Urban’s 25-30% reduction to Medicare payments for prescription drugs wouldresult in around $60-$65 billion annual savings relative to the current law baseline, or around$770 billion over the budget window. Because your policy holds generic price reductions at that30%, we do not estimate any additional savings on generic drugs. However, we estimate thattotal savings from a 70% reduction below Medicare branded drug payments, driven by thereforms you outline combined, are $1.7 trillion beyond those already captured in Urban’sestimate.
31 Eric Budish, Benjamin N. Roin, and Heidi Williams, “Do Firms Underinvest in Long-Term Research? Evidencefrom Cancer Clinical Trials,” American Economic Review 105, no. 7 (July 2015): 2044–85,https://doi.org/10.1257/aer.20131176.32 Bureau of Labor Statistics. U.S. Department of Labor. “Jobs Openings and Labor Turnover - August 2019.”https://www.bls.gov/news.release/pdf/jolts.pdf.33 Elizabeth Austic, Emily Lawton, Melissa Riba and Marianne Udow-Phillips. “Insurance Churning.” Universityof Michigan Center for Healthcare Research and Transformation. November 2016.https://poverty.umich.edu/research-publications/policy-briefs/insurance-churning/.34 Rachel E. Sachs and Austin B. Frakt, “Innovation–Innovation Tradeoffs in Drug Pricing,” Annals of InternalMedicine 165, no. 12 (December 20, 2016): 871, https://doi.org/10.7326/M16-2167.
9

Policy Feature #3: Comprehensive Payment Reform
Medicare for All has tremendous potential to improve the health care payment system in the U.S.Your Medicare for All plan resets and rebalances payment rates to health care providers andembraces a series of payment reforms to improve Medicare. Importantly, Medicare for All willallow a speedier and more comprehensive transition from today’s fee-for-service paymentmodels to models of value-based payment and population-based budgets that can encouragemuch more focus on the needs of patients and families, improving the quality and continuity ofcare, reducing administrative complexity, and investing in prevention and supports to peoplewith chronic illness and behavioral health care needs. Such a reformed payment system willboth improve care and reduce costs.
Hospital and Provider Administrative CostsHospitals, physician practices, and other health care providers incur significant administrativecosts interacting with our current complex and fragmented private insurance system. Accordingto a report from the Institute of Medicine (IOM; now known as the National Academy ofMedicine), billing and insurance-related (BIR) administrative expenses are estimated to be 13%of revenue for physician practices, 8.5% of revenue for hospitals, and 10% of revenue for otherproviders.35 A recent study using time-driven, activity-based costing corroborates the IOMfigures, finding BIR costs equivalent to 14.5% of professional revenue for primary care visits,8.0% for inpatient medicine visits, 13.4% for ambulatory surgical procedures, and 25.2% foremergency department visits.36 Based on the IOM figures, RAND estimates that in 2019 BIRcosts for providers totaled $279.4 billion, or 7.3% of NHE.37 (Note that this is separate from andin addition to administrative spending by public and private insurers, estimated at $301.4 billionin 2019, or 7.9% of NHE).38
Comparing the administrative burden on providers in the U.S. and Canada, the IOM reportestimated that providers in the Canadian single-payer system had half the BIR costs as providersin the U.S. system.39 A subsequent study found that the administrative costs incurred byCanadian physician practices interacting with the Ontario single-payer were 73% lower than theadministrative costs incurred by American physician practices interacting with multiple public
35 Pierre L. Yong, Robert S. Saunders, and LeighAnne Olsen, The Healthcare Imperative: Lowering Costs andImproving Outcomes (National Academy of Sciences, 2010),https://www.ncbi.nlm.nih.gov/books/NBK53920/pdf/Bookshelf_NBK53920.pdf.36 Phillip Tseng et al., “Administrative Costs Associated With Physician Billing and Insurance-Related Activities atan Academic Health Care System,” JAMA, February 2018,https://jamanetwork.com/journals/jama/fullarticle/2673148.37 Jodi L. Liu and Christine Eibner, “National Health Spending Estimates Under Medicare for All,” RAND, 2019,https://www.rand.org/pubs/research_reports/RR3106.html.38 Id.39 Pierre L. Yong, Robert S. Saunders, and LeighAnne Olsen, The Healthcare Imperative: Lowering Costs andImproving Outcomes (National Academy of Sciences, 2010),https://www.ncbi.nlm.nih.gov/books/NBK53920/pdf/Bookshelf_NBK53920.pdf.
10
and private payers.40 These administrative savings should be incorporated into the overallanalysis of the impact that Medicare for All would have on providers.
Physician PaymentYour proposal would set reimbursement for physicians and non-hospital providers at 100% ofcurrent Medicare rates, which is consistent with the single-payer proposal modeled by Urban.Your proposal would also implement a budget-neutral rebalancing of rates that increasesreimbursement for primary care and reduces reimbursement to overpaid specialties. For hospitalsthat serve large Medicaid populations, this change would actually increase reimbursement forthat patient population by raising rates to Medicare levels. 41The average all-payer rate forphysician payment – weighted between commercial insurance, Medicare, and Medicaid – hasbeen estimated to be 107% of current Medicare rates.42 All else equal, this implies that settingphysician payment at 100% of current Medicare rates would represent a 6.5% reduction in grossincome for physician practices. If Medicare for All allows physician practice BIR costs (13% ofrevenue) to fall to Canadian levels (73% decrease), physician practices would recoup 9.5% ofrevenue on average, meaning that net incomes of physician practices would increase on average.Alternatively, if Medicare for All allows physician practice BIR costs to fall by half, physicianpractices would recoup 6.5% of revenue, helping substantially to offset the income loss frompayment at 100% of current Medicare rates.
To exert genuine financial pressure on physicians – rather than set rates that primarily serve torecoup BIR savings – a single-payer system could set physician payment rates below currentMedicare rates. Your proposal to set physician payment rates equal to Medicare rates undercurrent law puts little if any pressure on aggregate physician incomes and physician practicespending, when reasonable BIR cost savings are assumed. For individual physician practices, thenet impact will depend importantly on specialty and payer mix: in particular, Medicare rates arelower than current private insurance rates, but higher than the rates paid by Medicaid and theChildren’s Health Insurance Program, which cover 72 million individuals.
In financial terms, reduced administrative burden benefits physician practices in two ways:increased time to spend on reimbursable patient care and decreased expense on administrativestaffing. One study estimated that physicians in outpatient settings currently spend nearly onehour per workday interacting with health plans; this time is primarily spent on navigating theformulary requirements of different insurers and on submitting prior authorizations.43 UnderMedicare for All, physicians would gain back much of this time for additional patient care,increasing their billable hours. For each physician, nursing staff spends an additional 21hours
40 Dante Morra et. al, “US Physician Practices Versus Canadians: Spending Nearly Four Times As Much MoneyInteracting With Payers,” Health Affairs 30, no. 8 (August 2011): 1443-1450,https://www.healthaffairs.org/doi/10.1377/hlthaff.2010.0893.41 Kaiser Family Foundation. “Medicaid-to-Medicare Fee Index.” https://www.kff.org/medicaid/state-indicator/medicaid-to-medicare-fee-index/42 Jodi L.Liu and Christine Eibner, “National Health Spending Estimates Under Medicare for All,” RAND, 2019,https://www.rand.org/pubs/research_reports/RR3106.html.43 Dante Morra et. al, “US Physician Practices Versus Canadians: Spending Nearly Four Times As Much MoneyInteracting With Payers,” Health Affairs 30, no. 8 (August 2011): 1443-1450,https://www.healthaffairs.org/doi/10.1377/hlthaff.2010.0893.
11
per week interacting with insurers (including 13 hours on prior authorizations) and clerical staffspends an additional 53 hours interacting with insurers (including 45.5 hours on claims andbilling tasks).44 These administrative requirements would be substantially relieved by Medicarefor All.
Your proposal to pay physicians at 100% of current Medicare rates matches the policy modeledby Urban, so there is no impact on NHE from this policy feature compared to Urban.
Hospital PaymentHigh and rising hospital prices are among the greatest threats to the financial sustainability of theU.S. health care system. A central attraction of single-payer health insurance reform is the abilityto reduce the price of hospital care. You propose to pay hospitals at an average of 110% ofcurrent Medicare rates under Medicare for All, consistent with the current Medicare programincluding existing geographic adjustments, and with additional appropriate adjustments forhospitals with unique or challenging cost structures, like rural hospitals, teaching hospitals, andothers. Compared to Urban’s single-payer proposal which reimburses at 115% of Medicare rates,your proposal reduces NHE by $0.6 trillion over ten years.
To evaluate the impact of these rates on hospitals, it is important to analyze how hospital costshave evolved over time. In the period from 1996 to 2001, private insurer payment rates tohospitals were approximately 110% of Medicare rates, resulting in a blended rate below yourcurrent proposal.45 This difference has widened enormously, however, since 2001, with privateinsurer payment rates reaching 175% percent of Medicare rates by 2012.46 According to onerecent study, private sector hospital prices are now 240% of Medicare rates.47 This growing gapis driven by rapidly rising prices in the private sector; for instance, between 2007 and 2014inpatient hospital prices for the private market increased by 42%.48 This increase in hospitalprices for the private sector reflect several trends in the U.S. health care system, including theswift (and ongoing) consolidation of the hospital sector, which by 2016 had left 90% ofMetropolitan Statistical Areas designated as highly concentrated for hospitals.49
This rapid increase in private-payer hospital payment rates has led to higher hospital costs. Asexplained by MedPAC, when providers “receive high payment rates from insurers, they face lesspressure to keep their costs low.”50 In other words, when private insurers are unable to exertfinancial pressure on certain hospitals, these hospitals develop inflated cost structures. After all,
44 Id.45 Thomas M.Selden et al., “The Growing Difference Between Public and Private Payment Rates For InpatientHospital Care,” Health Affairs, December 2015, https://www.healthaffairs.org/doi/full/10.1377/hlthaff.2015.0706.46 Id.47 Chapin White & Christopher Whaley, “Prices Paid to Hospitals By Private Health Plans Are High Relative ToMedicare And Vary Widely,” RAND,2019, https://www.rand.org/pubs/research_reports/RR3033.html48 Zach Cooper, et al., “Hospital Prices Grew Substantially Faster Than Physician Prices For Hospital-Based Care in2007-14,” Health Affairs 28, no. 2 (February 2019):184-189.49 Brent D.Fulton, “Health Care Market Concentration Trends InThe United States: Evidence And PolicyResponses,” Health Affairs, September 2017, https://www.healthaffairs.org/doi/abs/10.1377/hlthaff.2017.055650 Medicare Payment Advisory Commission. “Report to the Congress: Medicare Payment Policy.” March 2019.http://www.medpac.gov/docs/default-source/reports/mar19_medpac_entirereport_sec_rev.pdf?sfvrsn=0.
12

it is far simpler for a hospitalto raise prices than to controlcosts and achieveoperationalefficiencies.
It is in this context that hospitalsin 2017 reportedaverage Medicaremarginsof -9.9%.Thisimpliesthat payinghospitalsat 110%of Medicare rateswould approximatelycover the currentcosts of care. However,as outlinedabove,hospitals’reportedcosts of care reflect decades of lowfinancialpressurefrom private insurers,leadingto significantinflationin these reportedcosts.(Asa point of comparison,MedPACtracksa cohort of “relativelyefficient”hospitalsthatconsistentlyperformwell on measuresof cost and quality.In2017 the Medicaremarginsofthese hospitalswere -2%, implyingthat 102%of current Medicarerates would be sufficient tocover the costsof an efficient hospital.)51
HospitalCostsYour approachto pay hospitalsat 110%of Medicarerates would approximatelycover thecurrent costs of care reportedby hospitals.Importantly,by exertingfinancial pressure onhospitalsthat have reliedon highprivate-payerrates to avoidcontrollingcostsand searchingforefficiencies,your policy would be expectedto drive greater efficienciesin the hospital sectorthan seen in the current system,resultingin lower hospitalcosts.
Furthermore,Medicarefor All would allowhospitalsto achievesavings on administrativecostsand drug costsand would generateadditionalhospitalrevenueby eliminatinguncompensatedcare and increasingaccessto care. These four financialbenefitswould allow the hospitalsectorto generatepositivemarginsat payment ratesthat are designedto cover current operatingcosts.AlthoughUrbandoesnot consider these factors in itsanalysis,the single-payerprogram that itmodelsdoes implicitlydeliver these same savings.
AdministrativecostsAdministrativecosts account for over 25% of U.S.hospitalexpenditures,including8.5% ofrevenuespent directly on billingand insurance-related(BIR)costs.52 If single-payerinsurancereform allows these BIR costs to fall by half,Medicarefor All would decrease hospitals’operatingcostsby more than 4% comparedto the current system.
Prescriptiondrug pricesInadditionto reducingthe price of drugs obtainedby patients in pharmacies,Medicarefor Allwould reduce the price of drugspurchasedby and administeredinhospitals.Drugcosts are agrowingconcernfor hospitals:averagedrug spendingper admissionincreased18.5%from 2015to 2017, far above the rate of medicalcost growth.53Nearly two-thirdsof hospitalsreportedthatrisingdrug prices had a moderateor severe impact on their ability to managehospitalbudgets.54Medicarefor All would decreasehospitaloperatingcostsby loweringthese prices.
51 Id.52 David Himmselstein,et al. “A comparisonof hospitaladministrativecosts in eight nations: UScosts exceed allothers by far.” HealthAff (Millwood).2014 Sep;33(9):1586-94.https://doi.org/10.1377/hlthaff.2013.1327.53 NORCat the Universityof Chicago,“Recent Trends In HospitalDrugSpendingAnd ManufacturerShortages”(Jan.15,2019),https://www.aha.org/system/files/2019-01/aha-drug-pricing-study-report-01152019.pdf.54 Id.
13

Elimination of uncompensated careBy providing universal coverage with no cost sharing for hospital services, Medicare for Allwould essentially eliminate uncompensated care. The American Hospital Association reports thatuncompensated care accounts for 4.2% of total hospital costs.55 Hospitals would recoup thesecosts under your policy, getting reimbursed at 110% of current Medicare rates for all care.
Increased access to servicesBy providing health coverage to 32 million uninsured U.S. residents and by eliminating costsharing, Medicare for All would allow more patients to access and use hospital services.56 Forhospitals, this increased access means increased volume and enhanced revenues. This newutilization would be particularly beneficial for hospitals’ financial outlook: because hospitalshave high fixed costs, hospitals’ marginal profit per patient at current Medicare rates is 8%.Furthermore, hospitals in most areas appear to have excess capacity to absorb additional volume;in 2017, the average hospital occupancy rate was 62.5%.57
Taken together, the slate of financial benefits delivered by Medicare for All – loweradministrative costs, lower drug costs, eliminated uncompensated care, and increased access tocare – would allow hospitals to generate positive margins under your plan.
Rural HospitalsSome critics have worried that rural hospitals would be more vulnerable to closure underMedicare for All than under our current system. On the contrary, universal coverage is perhapsthe most powerful strategy to protect the financial sustainability of rural hospitals. First, ruralhospitals have a larger payer mix of Medicare and Medicaid patients than other hospitals,meaning that a shift to 110% of Medicare rates will be a significant payment bump that makes uptheir -8.2% Medicare margins.58 Higher rates of health insurance coverage are a significant boonto hospitals: for instance, the Affordable Care Act’s Medicaid expansion was associated withimproved hospital financial performance and fewer closures, particularly in rural areas.59 In ruralareas and small towns located in states that have not expanded Medicaid, the uninsured rate is
55 American Hospital Association, “Trendwatch Chartbook 2018” (2018), https://www.aha.org/system/files/2018-07/2018-aha-chartbook.pdf.56 Linda J. Blumberg et al., “Don’t Confuse Changes in Federal Health Spending with National Health Spending.”Urban Institute,October 2019. https://www.urban.org/urban-wire/dont-confuse-changes-federal-health-spending-national-health-spending.57 Medicare Payment Advisory Commission. “Report to the Congress: Medicare Payment Policy.” March 2019.http://www.medpac.gov/docs/default-source/reports/mar19_medpac_entirereport_sec_rev.pdf?sfvrsn=0.58 American Hospital Association. “Challenges Facing Rural Communities and the Roadmap to Ensure LocalAccess to High-quality,Affordable Care.” 2019. https://www.aha.org/system/files/2019-02/rural-report-2019.pdf;Kaiser Family Foundation. “Medicaid-to-Medicare Fee Index: 2016.” https://www.kff.org/medicaid/state-indicator/medicaid-to-medicare-fee-index.59 Richard C. Lindrooth,Marcelo C. Perraillon, Rose Y. Hardy, and Gregory J. Tung. “Understanding TheRelationship Between Medicaid Expansions And Hospital Closures.” Health Affairs. 37, No.1:Culture of Health,Medicare & More. https://www.healthaffairs.org/doi/pdf/10.1377/hlthaff.2017.0976.
14
currently 32%.60 Covering this populationunder Medicare for All would be an enormous benefitto both the patients and hospitals in these areas.
Payment FlexibilitySome critics of Medicare for All plans worry that vulnerable hospitals and providers,such as inrural and safety-net care systems, could be more vulnerable under a single-payer system. Wepoint out that, as a policy matter, the opposite can be true. With proper monitoringof the statusof these critically important institutions,Medicare for All can and should, over time, maketargeted adjustments to payment levels to better support the vulnerable institutions and reallocatepayments from those that are experiencing very high margins to those that are struggling. Thattype of adjustment isnot possible in the current, complex, multi-payer system.
IncreasedAntitrust Scrutiny on HospitalsRecent evidence suggests that concentrated hospital markets (i.e. after mergers) result in higherprices for care.61Furthermore,evidence finds that the quality of care and patient satisfactiondecreases when a hospital market becomes less competitive.62 Given evidence from other single-payer systems, we knowthat patients respond to perceived care quality and interpersonalinteractionwith providers when markets are more competitive.Hospital competition will be animportant feature of a single-payer system to ensure that providers are competing for patients onthe basis of care quality and experience.63
You propose to better fund U.S.antitrust enforcement efforts to evaluate hospital marketcompetition and mergersto protect patient choice among providers.You also propose allowinghospitals to voluntarily divest holdings to restore competition to U.S.hospital markets.Whilethere is reason to believe that increased competition would lower prices and create savings, evenwhen a government payer is regulatingprices, we do not in this letter estimate any specificsavings in national health spending from increased competition in provider markets.
Payment Reformsto MedicareAs part of your Medicare for All proposal, you enact a set of payment reforms to improveMedicare’s system of paying providersthat were not part of the single-payer system analyzed byUrban.These reforms,when taken at the CBO estimate for Medicare and applied to a U.S.single-payer population, lead to a total of $2.3 trillion savings below the Urban projection overthe ten-year window.
60 Joan Alker, Jack Hoadley,and Mark Holmes,“Health Insurance Coverage inSmall Towns and Rural America:The Role of Medicaid Expansion.” GeorgetownUniversity HealthPolicy Institute and NorthCarolina Rural HealthResearchProgram(2018),https://ccf.georgetown.edu/wp-content/uploads/2018/09/FINALHealthInsuranceCoverage_Rural_2018.pdf.61 Zack Cooper et al., “The Price Ain’t Right? HospitalPrices and HealthSpending on the Privately Insured,” 134Quarterly Journal of Economics. 1,96–102, (2019).https://isps.yale.edu/research/publications/isps15-027.62 MarahNoelShort and Vivian Ho,“Weighing the Effectsof Vertical IntegrationVersus Market Concentration onHospitalQuality,” Health Economics,Policy and Law 13,492–508, (2019).https://journals.sagepub.com/doi/10.1177/1077558719828938.63 Chi-ChenChen, Shou-Hsia Cheng; “Hospitalcompetitionand patient-perceivedquality of care: Evidence from asingle-payer system inTaiwan,” Health Policy 98, 65–73, (2010).https://www.ncbi.nlm.nih.gov/pubmed/20650538.
15
Site neutral payments.64 Paying all hospital-owned physician offices located off-campusat the physician office rate will reduce costs in Medicare for All by $0.5 trillion.
Post-acute care reforms.65 Making post-acute payments budget neutral, risk adjusted, andset prospectively on an annual basis with episode grouping will reduce costs in Medicarefor All by $0.5 trillion.
Bundled payment reforms.66 Instituting bundled payments for inpatient care and 90 daysof post-acute care will reduce costs by $1.2 trillion.
While the site neutral and post-acute payment reforms are pure extrapolations of the CBOanalysis, we further adjusted the bundled payment extrapolation to reflect the desired policyoutcome of reducing this spending. Given the increase in hospital payment rates under thispolicy as compared to the Medicare program on which CBO’s analysis is based and the shift of alarge population out of private insurance (that more actively manages utilization) into a fee-for-service system, the policy proposed an additional reduction to achieve the spending aim.Evidence demonstrates that this spending is significantly higher in fee-for-service Medicarewhen compared to Medicare Advantage. 67
Moving Away from Fee-for-ServiceNumerous tests of value-based payment models under the Affordable Care Act, such asexpanding bundled payment and various forms of Accountable Care Organizations (ACOs), havealready yielded many lessons about savings and improvements achievable with new paymentmodels. Your proposal will allow for rapid building on those lessons and for accelerated progresstoward even more productive, new payment models including global budgets for health caresystems and full-risk population-based payment models. Medicare for All can be a powerfulforce for such change toward paying for value to patients rather than volume of care.
We estimate that new payment models can achieve better care for patients and much lower costsof care. Urban did not attribute savings to those effects of Medicare for All. These new paymentmodels are widely recognized as important vehicles for improving care while reducing costs, andwhile we do not estimate the cost impacts associated with these specific reforms, we believe theywould produce meaningful savings.68 However, we have not claimed these savings here becauseour current fragmented system has made their implementation challenging, which in turn makesaccurately estimating their cost-saving ability challenging.
64 Congressional Budget Office. “Proposals Affecting Medicare—CBO’s Estimate of the President’s Fiscal Year2020 Budget”. May 2019. https://www.cbo.gov/system/files/2019-05/55210-medicare.pdf65 Id.66 Congressional Budget Office. “Bundle Medicare’s Payments to Health Care Providers”. November 2013.https://www.cbo.gov/budget-options/2013/44898.67 Vilsa Curto, et al. “Health Care Spending and Utilization in Public and Private Medicare.” National Bureau ofEconomic Research. Working Paper 23090. January 2017. https://www.nber.org/papers/w23090.pdf.68 K. John McConnell, PhD; et al. “Early Performance in Medicaid Accountable Care Organizations: A Comparisonof Oregon and Colorado.” JAMA Intern Med. 2017;177(4):538-545.https://doi.org/10.1001/jamainternmed.2016.9098.
16
The bulk of these savings would come from reduceduse of hospitalcare and post-acute care asintegratedcare systems substitute it with much better forms of care, such as home-basedservices,primary care homes, telehealth services,community-basedparamedicine,self-careopportunities,community-basedsupports,and strengthenedbehavioralhealth care – all of whichwill be stronger under the comprehensivebenefit structure of Medicare for All. As one exampleof such progress,one integratedhealth care system in the U.S.now claims that more than 50% ofall patient encounterswith doctorsare telemedicinevisits, saving time and money and producingmuch more responsive care.69 A surge of interest is developingin “hospital at home” alternativesto costly and risky in-hospital stays. Similarly,progress is rapidnowin understanding“Age-FriendlyHealthSystem” care, which can improveoutcomesfor elders, who otherwise mightspend long and costly periods in hospitals.70And community paramedicine is changing the entirerole of ambulance servicesfrom mere transport services to outreach care systems capable ofpreventingunneededtrips to the hospital. Medicarefor All can and should accelerate progresson innovationssuch as these, which lower cost and are better for patients.
While they are not the only advancedpayment model worth exploring,MedicareACOs havealready demonstratedtheir success.McWilliams(2018) finds that physician-groupMedicareACOs loweredutilizationof hospitalcare, emergency department visits, post-acute facility stays,and days in post-acute facility.71After accountingfor bonus payments,the total savings toMedicareamountedto 2.4% of total spending for the cohort enrolled in the programfor at leastthree years.72
ACOs are likely to be more effective in a single-payer system than they are in the existingmulti-payer system, where it is common for patientsto “churn” betweendifferent insuranceplansastheir income or job status changes,or when their employer decides to change the planson offer.Inone study, over the course of one year only 62% of patientson Medicaidwere continuouslyenrolled in a Medicaidplan,and only 47% of patients with individuallypurchasedprivatecoverage and 72% of patients with employer-sponsoredcoverage were continuously enrolled.73This churn frequently causesdisruptions in patient care,74 and also counteracts the ACOincentivestructure by discouraginginvestment in programsthat reduce costsonly over the long
69 Dave Barkholz.“Kaiser Permanente Chief Says MembersAre Flocking to Virtual Visits”. ModernHealthcare.(April21, 2017).https://www.modernhealthcare.com/article/20170421/NEWS/170429950/kaiser-permanente-chief-says-members-are-flocking-to-virtual-visits70 Victor Tabbush et al., “The Business Case for Becomingan Age-Friendly Health System”.Institute forHealthcareImprovement.2019.http://www.ihi.org/Engage/Initiatives/Age-Friendly-Health-Systems/Documents/IHI_Business_Case_for_Becoming_Age_Friendly_Health_System.pdf71 J. MichaelMcWilliamset al., “MedicareSpending after 3 Years of the Medicare Shared SavingsProgram,” NewEngland Journal of Medicine 379,no.12 (September 20, 2018): 1139–49,https://doi.org/10.1056/NEJMsa1803388.72 Id.(Savingscalculatedfrom data providedin Table 3, applied to the pre-entrymean.)73 Austic E,LawtonE,Riba M,and Udow-PhillipsM.Insurance Churning.University of Michigan Center forHealthcare Researchand Transformation.November 2016. https://poverty.umich.edu/research-publications/policy-briefs/insurance-churning/.74 BenjaminD.Sommerset al., “Insurance Churning Rates For Low-IncomeAdults Under Health Reform: LowerThan Expected But StillHarmfulFor Many,” Health Affairs 35, no.10 (October 2016):1816–24,https://doi.org/10.1377/hlthaff.2016.0455.
17
term. In a single-payer system, people would be enrolled in Medicare for All for life, whichincentivizes investments that both improve health and save money over the long term.
The total savings from these reforms are $2.9 trillion:� Paying hospitals 110% of current Medicare rates: $0.6 trillion� Savings from other payment reforms: $2.3 trillion
Policy Feature #4: Slowing Medical Costs Growth Rates over Time
In recent decades, U.S. health spending has consistently grown at rates above GDP growth,rising from 6.9% of GDP in 1970 to 17.9% of GDP in 2017.75 Historically, U.S. spending growthfor health consumption expenditures was notably higher than similar countries’ spendinggrowth.76 The United States’ higher spending compared to that in other countries is largely basedon the wide divergence in this cost growth in previous decades.
The proposal you outline will certainly work to lower cost growth over time. In addition to thepolicies above, we anticipate that a shift to Medicare for All will reduce growth over time fromthat level. This is due to the aggressive approach you take on brand name drug pricing and yourshift from fee for service across the system by implementing various payment reforms to bettermanage care. The Center for Medicare and Medicaid Services projects 5.5% cost growth overroughly the next decade. Using Urban’s growth of the 2020 increased federal spending to theten-year figure, we inferred a 4.5% growth rate for their projection of total ten-year NHE.However, we look to other single-payer systems like Taiwan, which has effectively slowedgrowth to 3.2% on average in recent years, since transitioning from a private insurance system.77
We believe future growth will fall in line with U.S. GDP, which CBO projects to be an averageof 3.9% for the next decade.78 In addition, this growth rate falls close to the WHO’s estimates ofhealth care spending growth in high-income countries, which has been around 4% annually.79And if costs do grow above GDP, you have several policy levers you could choose to exercise tokeep them near GDP growth, including global budgets, population-based budgets, and automaticrate reductions. To estimate the savings from this lower growth rate, we first took the full set ofcost reductions that result from your proposal so as to avoid double counting savings by reducingthe base year funding levels. Then, we applied that number to total 2020 NHE of $3.7 trillion
75 Rabah Kamal and Cynthia Cox. How has U.S. spending on healthcare changed over time? Kaiser FamilyFoundation (December 10,2018), https://www.healthsystemtracker.org/chart-collection/u-s-spending-healthcare-changed-time/#item-health-spending-generally-grows-faster-than-general-economic-inflation_201776 Bradley Sawyer and Cynthia Cox. How does health spending in the U.S. compare to other countries? KaiserFamily Foundation, December 7, 2018, https://www.healthsystemtracker.org/chart-collection/health-spending-u-s-compare-countries/#item-start,77 Tsung-Mei Cheng.Health Care Spending InThe US And Taiwan: A Response To It’s Still The Prices, Stupid,And A Tribute To Uwe Reinhardt.” Health Affairs Blog. February 6, 2019.https://www.healthaffairs.org/do/10.1377/hblog20190206.305164/full/78 Congressional Budget Office. “An Update to the Budget and Economic Outlook: 2019 to 2029.” August 2019.https://www.cbo.gov/publication/55551.79 World Health Organization,. “Countries are spending more on health, but people are still paying too much out oftheir own pockets,”.February 20, 2019, https://www.who.int/news-room/detail/20-02-2019-countries-are-spending-more-on-health-but-people-are-still-paying-too-much-out-of-their-own-pockets.
18

(see Table 3). We find that this change to the growth rate resultsin $1.1trillion in savingswhencompared to Urban’sestimate.80
Table 3: 2020 NHE Savings under Warren Medicare for All Plan
Source EstimatedExpendituresand Savings (inbillions)
Urban Estimate of 2020 NHE 4,216.5
Insurer Administrative Spending -143.9
PrescriptionDrugReform -133.3
Comprehensive Payment Reform -208.4
2020 Estimate of NHEunder WarrenMedicare forAll Plan* 3,730.8
*Excludes $534.3 billion in spending on items outside the Medicare for All program, likehealth spending by the Department of Defense,Veterans Affairs, Indian Health Service, and federal, state, and local publichealth agencies. Urban excludes these same spending categories fromthe main analyses included in its report and so we havedone so here for ease of comparison. It is true that the 2020 NHE estimateunder thispolicy is higher than the estimate undercurrent law, but total NHE over the ten-year budget window is just under the $52 trillion projection undercurrent law.
Total NationalHealthExpenditureSavingsof Warren Medicare for All Plan
Table 4: NHE Changes,2020-29
Source EstimatedSavings (intrillions)
UrbanEstimate of NHE 59
Insurer Administrative Spending -1.8
PrescriptionDrugReform -1.7
Comprehensive Payment Reform -2.9
SlowingMedicalCosts Growthover Time -1.1
Estimate of NHEinWarrenMedicare for All Plan 52
Current Law Projectionsfor NHE 52*Total NHE estimates rounded to the nearest trillion.
Based on the analyses above, we estimate that your Medicare for All proposal would reduceNHE to just under the $52 trillion projectedover ten years under current law.81Thus, yourproposal would cover every single resident of the U.S.with much more generouscoverage and
80 Using Urban’s 2020 increasedfederal spendinggrowth to the ten-year figure, we inferreda 4.5% growth rate.81 Projected NHE savings under your approach range from $100-$500billion over the period from 2020-2029.However,in order to be conservative,we are projecting10-year NHEto be substantially equal to Urban’s projectionunder current law.
19

virtually no cost sharing at a total cost just under the amount the U.S. is currently set to spend onhealth care under our existing system.
Policy Feature #5: Redirecting Other Public Spending on Health Coverage
The policies outlined in your Medicare for All proposal would redirect $6.1 trillion of existingstate and local government spending on health care into the Medicare for All system. Thismaintenance-of-effort is comprised of two funding streams: $3.4. trillion in Medicaid and theChildren’s Health Insurance Program (CHIP) funding and $2.7 trillion in employer contributionsto private insurance premiums of government employees.82 These amounts total $6.1 trillion inadditional revenue over the ten-year window.
Conclusion
In total, we estimate that your proposal will decrease NHE to just under the $52 trillionprojected under current law for the ten-year period from 2020-2029 and will require new federalrevenues of approximately $20.5 trillion over the 2020-2029 budget window, as shown in Table1. We expect this suite of policies to expand care to 32 million U.S. residents who are currentlyuninsured and improve the health benefits available to many millions more, drasticallyimproving their health and well-being.
While our findings of the policies you outlined are based on strong analysis using publiclyavailable data, we do note that, like the other estimates, our projections contain someassumptions that could influence these numbers. However, we have not counted any potentialsavings from realigning innovation incentives, provider-led care policies like ACOs, or anadjustment to the utilization assumptions in Urban’s work. This more measured approachsuggests that the total savings to the health system may be higher (and thus, total federalrevenues required may be lower) than $20.5 trillion relative to Urban’s projections.
Sincerely,
Dr. Donald M. BerwickFormer Administrator of the Centers for Medicare and Medicaid Services (CMS), underPresident Barack Obama,President Emeritus and Senior Fellow at the Institute for Healthcare Improvement,andLecturer in the Department of Health Care Policy at Harvard Medical School
Simon JohnsonFormer Chief Economist, International Monetary FundandRonald A. Kurtz (1954) Professor of EntrepreneurshipSloan School of Management, MIT
82 See Appendix C for more information.
20

APPENDIX A: Medicare Administrative Costs
Why have some analysts assumed that Medicare for All would have administrative costs of 6%?Five arguments have been made as to why Medicare for All’s administrative costs should beassumed to be higher than traditional Medicare.
Claim 1: Medicare’s reported administrative costs are falsely low because they fail to countrelevant categories of administrative spending: the costs of collecting taxes or Part Bpremiums, the costs of claims processing by private intermediaries inthe Medicare fee-for-service program, the salaries of CMS employees, and the building costs incurred by CMS.
These assertions are incorrect. Medicare’s administrative costs are reported annually in theMedicare Trustees Report.83 Among other categories, the following are counted as administrativecosts: salaries and expenses of CMS, expenses of Medicare Administrative Contractors, and theadministrative costs incurred by the Department of the Treasury (including the Internal RevenueService) and the Social Security Administration in collecting taxes and premiums for theMedicare program. Sullivan (2013) provides the definitive scholarly treatment of themisunderstanding surrounding the reporting of Medicare’s administrative costs.84
The administrative costs incurred by private Medicare Advantage plans in the Part C programand private plans in Part D are not included in the Medicare Trustees Report, which is why wehave excluded Parts C and D from our report of traditional Medicare’s administrative costs. As apercentage of Medicare’s overall expenditures – Parts A, B, C, and D – the administrative costsincurred by the federal government are 1.3%, with the remainder incurred by private plans.Within the traditional Medicare program (Parts A and B, excluding Part C benefits), theadministrative costs incurred by the federal government are 2.3%, with no additionaladministrative costs incurred by private plans.
Claim 2: Medicare’s administrative costs appear low only because the elderly have highermedical needs and higher total spending, and so the percentage of administrative spendingis misleadingly low given the inflated denominator.
If this claim were true, administrative costs in Medicare Advantage (MA) should also be low,given that these plans serve the same elderly population as traditional Medicare. However, theclaim is refuted by the fact that MA plans have administrative costs comparable to or even higherthan private insurers in the under-65 market – the most recent Government Accountability Officereport on the subject found that Medicare Advantage plans had administrative costs of 13.7%.85
83 The Board of Trustees, Federal Hospital Insurance and Federal Supplementary Medical Insurance Trust Funds.2019 Annual Report of the Boards of Trustees of the Federal Hospital Insurance and Federal SupplementaryMedical Insurance Trust Funds; 2019. https://www.cms.gov/Research-Statistics-Data-and-Systems/Statistics-Trends-and-Reports/ReportsTrustFunds/Downloads/TR2019.pdf84 Sullivan K.How to think clearly about Medicare administrative costs: data sources and measurement. J HealthPolit Policy Law. 2013;38(3):479-504. https://doi.org/10.1215/03616878-2079523.85 MEDICARE ADVANTAGE: 2011 Profits Similar to Projections for Most Plans, but Higher for Plans withSpecific Eligibility Requirements. Government Accountability Office; 2013,
21
This suggests that management by a private insurance company – not the age of beneficiaries– drives high administrative spending.
Claim 3: Medicare’s overall administrative costs are about 6%, and Medicare for Allestimates should assume this figure.
The Urban Institute justifies its assumption of 6% administrative costs by stating: “We base ouradministrative cost estimates on Medicare’s costs to administer the entire Medicare program.”Because roughly one third of Medicare beneficiaries are enrolled in private MA plans,86 in 2017the weighted average of administrative costs over the entire Medicare program was about 6%.87But Medicare for All beneficiaries would all be enrolled in a public plan with restrictions onadministrative expenses, so a figure based on having a third of beneficiaries in a privateinsurance alternative whose administrative expenses are not currently restricted is not relevant.
Claim 4: The administrative requirements of Medicare for All would be so large thatcurrent levels of administrative spending would need to increase.
The Urban Institute report states that “far too many administrative functions must be conducted”for administrative spending to fall below 6% under Medicare for All, citing the need to set ratesfor providers, process claims, promulgate regulations, and monitor for fraud. The obvious flaw inthis argument is that traditional Medicare already performs all of these functions withadministrative spending of 2.3%, according to our calculations. It is reasonable to expectadministrative spending to expand proportionally as health care spending increases, but there isno convincing argument that administrative spending would increase exponentially.
Claim 5: While it is technically possible to restrict administrative costs, it is unwise to do sobecause it will encourage excess utilization.
While there is certainly room for thoughtful discussion about the ideal level of administrativespending for a large public insurer, there is significant independent evidence suggesting thatMedicare’s current levels of administrative spending are more than adequate even under anational system.
The first line of evidence comes from international health systems. A recent comprehensiveanalysis of eleven countries found that in countries other than the U.S., the average costs ofadministering the insurance system are 2.7% (compared to 8% in the U.S.).88 Countries in thestudy with administrative spending above 3% – like Germany and Switzerland – use private
https://www.gao.gov/assets/660/659836.pdf. The figure reported here includes nonmedical expenses and profits inTable 1.86 Medicare Advantage. Henry J Kaiser Family Foundation. June 2019. https://www.kff.org/medicare/fact-sheet/medicare-advantage/.87 Centers for Medicare and Medicaid Services. National Health Expenditure Accounts, Table 4.https://www.cms.gov/Research-Statistics-Data-and-Systems/Statistics-Trends-and-Reports/NationalHealthExpendData/NationalHealthAccountsHistorical.html.88 Papanicolas I,Woskie LR, Jha AK. Health Care Spending in the United States and Other High-Income Countries.JAMA. 2018;319(10):1024-1039. https://doi.org/10.1001/jama.2018.1150.
22

insurers comparatively more, while the single-payer systems had administrative costs between1% and 3%. When looking at these other countries there is little evidence that a single-payerprogram needs to have administrative costs above traditional Medicare in order to operateeffectively.
The second important piece of evidence is the study by Wallace and Song89 which demonstratedthat when people with private insurance turn 65 and enter traditional Medicare, there is nounusual increase in their utilization of services tied to their enrollment – despite the fact thattraditional Medicare has administrative costs that are approximately one-fifth of administrativecosts in private insurance.
A final consideration is that Medicare’s increasing reliance on alternative payment models mayobviate the need for many of the tactics traditionally used by payers to restrain utilization,instead building these incentives directly into payment models.
89 Wallace J, Song Z. Traditional Medicare Versus Private Insurance: How Spending, Volume, And Price ChangeAt Age Sixty-Five. Health Aff (Millwood). 2016;35(5):864-872. https://doi.org/10.1377/hlthaff.2015.1195.
23
APPENDIX B: Predicting Health Care Utilizationunder Medicare for All
A key element in estimating how Medicare for All would affect NHE is predicting how patientswill respond to changes in health coverage in terms of their utilization of health care services.
Five of the seven cost estimates we reviewed projected utilization increases between 7% and15% under Medicare for All as compared to current law.90 The two Urban Institute reports do notprovide an estimate of how overall health care utilization would change under Medicare for All,although such a utilization change is implicit in their estimate of total spending. Urban’s 2019report estimates that total health care spending will increase by 20.6% in 2020 [Table 13]. Thispredicted spending increase occurs in the context of reduced prices for care, given that Urbanmodeled a policy with reduced prices compared to current law for hospital care, physicianservices, and prescription drugs (in addition to estimating lower costs for health planadministration). Because Spending = Price x Utilization, the utilization increases implied by theUrban report are above 20.6% for 2020. Without further information from the Urban Institute, itis not possible to infer how much higher the utilization projections are above the spendingprojections.
The figures in the above paragraph are for aggregate utilization increases, combining increasesthat result from covering the uninsured, eliminating cost sharing, and covering new benefitsincluding LTSS. Excluding LTSS, Urban estimates a spending increase of 13.8% in 2020, whichmeans the implied utilization increase for non-LTSS services is above 13.8% for 2020.91 (Again,with the provided information it is not possible to infer how much higher the utilizationprojections are above this spending projection.)
Because Urban does not provide estimates for utilization increases – neither overall nor fordifferent populations – it is difficult to conduct a proper evaluation of the utilization predictionsmade by Urban’s model. There is recent peer-reviewed literature on the effects of covering theuninsured and on the impact of health insurance deductibles that would be useful to compareagainst the predictions made by Urban’s microsimulation model.92 While we cannot conduct athorough evaluation without further information from the Urban Institute, we note that theutilization predictions implied by the Urban estimate fall at the high end of the publishedliterature. As such, we consider the estimate provided in this letter – which implicitly relies onthe utilization predictions made by Urban – to represent an upper bound on projected NHE underMedicare for All. In terms of sensitivity to these predictions, NHE over 2020-2029 woulddecrease by approximately $1trillion for each 2 percentage points that actual utilization levelsturn out to be below the levels predicted by Urban.
90 Josh Katz, Keavin Quealy, Margo Sanger-Katz. “ Would ‘Medicare for All’ Save Billions or Cost Billions?.”New York Times. October 16,2019. https://www.nytimes.com/interactive/2019/04/10/upshot/medicare-for-all-bernie-sanders-cost-estimates.html.91Calculation based on data provided by Urban Institute study authors that $238.3 billion of the spending increasein 2020 is attributable to LTSS.92 See, e.g, Baicker K,Taubman SL, Allen HL,et al. The Oregon Experiment — Effects of Medicaid on ClinicalOutcomes. N Engl J Med. 2013;368(18):1713-1722. https://doi.org/10.1056/NEJMsa1212321; Brot-Goldberg ZC,Chandra A, Handel BR, Kolstad JT. What does a Deductible Do? The Impact of Cost-Sharing on Health CarePrices, Quantities, and Spending Dynamics. Q J Econ. 2017;132(3):1261-1318. https://doi.org/10.1093/qje/qjx013.
24
APPENDIX C: Assumptions and Methodology
Benchmark single-payer estimateOur analysis uses the Urban Institute’s October 2019 estimate of a “single-payer enhanced”system (Reform 8) as the benchmark to which additional policy changes are compared. Urban’sReform 8 consists of a single-payer system with no cost sharing at the point of care and acomprehensive benefit package, including dental, vision, hearing, and home- and community-based long-term services and supports. Urban’s Reform 8 provides coverage to all U.S. residents,including undocumented immigrants. These reforms are consistent with the statutoryrequirements for a fully-implemented single-payer system laid out in S. 1129, The Medicare forAll Act of 2019. Urban estimates that its Reform 8 would increase federal government spendingby $34 trillion over ten years and $2.8 trillion in 2020.
Medicare for All administrative costsMedicare for All administrative costs are set based on the percentage of administrative spendingin traditional Medicare. The source of this data is the 2019 Medicare Trustees Report, TableII.B1, and is calculated for Parts A and B: (5.2+4.2)/((303-101.7)+(333-131)). Note that thisexcludes Part C benefits. Urban’s sensitivity analysis 8-3 provides an estimate of the savingsachieved by reducing the administrative spending of Medicare for All from 6% to 3%. Weextrapolate from this figure to calculate the savings achieved by reducing the administrativespending of Medicare for All from 6% to 2.3%, amounting to $1.8 trillion in savings over tenyears.
Hospital payment ratesHospital payment rates are decreased to 110% of current law Medicare rates, approximately inline with average reported hospital costs per MedPAC analysis. This is a 5 percentage pointdecrease from the single-payer proposal modeled by the Urban Institute, which adopts hospitalpayment rates at 115% of current law Medicare rates. We calculate the savings from this policychange by referencing Urban’s sensitivity analysis 8-1, which estimates the spending change thatresults from increasing hospital payment rates by 35 percentage points (from 115% Medicare to140% Medicare). We use this figure to calculate the spending change that results fromdecreasing hospital payment rates by 5 percentage points (from 115% Medicare to 110%Medicare), which amounts to $574 billion over 10 years.
Payment Reform to Medicare Fee-for-ServiceThe Urban Institute’s microsimulation uses data from current Medicare payment and commercialinsurers to simulate rates in Medicare for All in elderly and non-elderly populations,respectively. These rates weight towards a fee-for-service (FFS) reimbursement model, which isthe traditional model in the U.S. system. CBO has estimated the savings to the Medicare programfor a series of payment reforms that adjust spending in Medicare FFS. To estimate the savingsgenerated by applying these payment reforms to a full single-payer system, we multiplyextrapolated CBO estimates by the ratio of single-payer spending in Urban’s model divided bynet Medicare spending under current law in Urban’s model (5.63). This is done to account for thefact that these savings would now apply to a much greater portion of health care spending thancurrently proposed policies that only affect the current Medicare program, and because CBOestimates of Medicare reforms do not include the premium and/or cost sharing savings that
25
beneficiaries accrue. We note that if these savings estimates were adjusted to reflect paymentrates now being set at 110% of current Medicare rates for services in hospitals and 100% ofcurrent Medicare rates for services provided by physicians and differential utilization of theaffected services across the populations covered by different payers, the savings resulting fromthis policy could increase total federal cost 2-3% above the amount we report in our baseanalysis. However, because it is difficult to exactly model the effects of increased utilization ininpatient and post-acute care amongst the uninsured, responses to increased reimbursements forthe Medicaid population, and the bundling of common inpatient stays not often funded byMedicare (like maternity stays), we adopted the baseline analysis approach.
Site neutral payment reformThis reform consists of two components: (1) All hospital-owned physician offices (i.e., hospitaloutpatient departments or HOPDs) located off-campus would be paid at the physician office rate,according to the physician fee schedule (PFS); (2) On-campus HOPDs would be paid atphysician office rates for certain services, such as clinic visits, that could alternatively beprovided in freestanding physicians’ offices. Savings estimates come from CBO estimates of thePresident's FY2020 budget, and are multiplied by 5.63 to extend the policy from currentMedicare to the population as a whole.
Post-acute care reformGiven strong evidence of Medicare overpayment for post-acute care (PAC) services, this reformwould reduce PAC payment rates by the cumulative amount that would arise from four years ofreduced Medicare payment updates. The savings estimate comes from CBO estimates of thePresident's FY2020 budget and are multiplied by 5.63 to extend the policy from currentMedicare to the population as a whole. The President's budget policy phases in, but this estimateassumes the full policy is implemented in year 1.
Bundled payment reformThis reform would implement bundled payments for episodes consisting of inpatient care and 90days of PAC. Savings estimates for this reform are drawn from a CBO budget option in 2013,extrapolated forward to the current budget window based on the annual savings as a share of netMedicare benefits in that year. Under the reform scored by CBO, the spending that would bebundled accounts for about one third of gross nondrug outlays in the Medicare FFS program, andbundled payments are set at levels 5 percent lower than Medicare’s projected average paymentsper episode under current law. Given estimates of large spending differentials on post-acute carein Medicare Advantage compared to traditional Medicare, we model a version of this reform thatgenerates twice the level of savings as the CBO-scored policy option by adjusting the level atwhich the bundled payments are set as specified in the plan. The 2020 steady state estimateeliminates the phase in of this policy by applying the ratio of annual savings-to-net Medicarebenefits at the end of the budget window to 2020 net Medicare benefits estimate.
Prescription Drug NegotiationThe Urban Institute estimates that prescription drug prices will drop to the average of Medicareand Medicaid drug prices under the single-payer system modeled in its report. Data from a 2015CBO report allows us to estimate that net Medicaid drug prices are roughly 50% of Medicare
26
drug prices.93 Therefore, we assume Urban modeled prescription drugs prices within its single-payer system at 25-30% below current Medicare prices. To take a measured approach, we usethe larger reduction of 30% below Medicare prices for our analysis. The savings target of 70%below current Medicare prices for brand name drug spending represents an additional 40percentage point reduction to Medicare prices compared to the Urban analysis, equivalent to $1.7trillion in additional cost savings over ten years.
In order to evaluate the policy changes necessary to achieve the 70% savings target, weexamined the CBO score of H.R. 3. CBO estimates that H.R. 3 would reduce drug spending inMedicare by $369 billion over a ten year window with three of those years being “phase in” andgenerating no real savings – meaning that the real savings are likely near $700 billion for a fulldecade with a phased-in policy, just in Medicare Part D.94 As we explain in the text, based onCBO’s estimate and current Part D spending as a portion of total prescription drug spending andthe fact that private insurance payment for drugs is nearly at par with Medicare Part D prices, webelieve it will generate significant savings (potentially in the trillions) over a decade whenapplied to a single-payer system. This is especially true when accounting for the fact that drugprices for the Medicaid program actually increase under Urban’s modeling to 70% of Medicarefrom their current rate at about 50% of Medicare.
CBO estimates that the first cohort of negotiated drugs would see prices fall by 55% on average.However, this policy applies only to branded drugs, includes a limit on the number of drugs innegotiation, sets the maximum price at 20% above the average international market price in theother six reference countries, and sets a target price at the lowest price in the reference countriesthat the Secretary must accept. Loosening these constraints in the negotiation mechanism ofH.R. 3 and taking stricter approach to negotiation, when taken together with the compulsorylicensing and government manufacturing proposals that would continue to enable access to mostsmall molecule drugs in the event of failed negotiation, would strengthen Medicare for Allprogram’s negotiating ability and enable Medicare for All to negotiate significantly deeperdiscounts and achieve the 70% cost reduction target set in the proposal.
Medicare for All growth rateFrom analyzing the Urban Institute’s 2020 NHE spending and the ten-year budget window, weinferred that Urban used a 4.5%-4.7% growth rate of health expenditures under Reform 8. Wealso infer that Urban assumes a growth rate of 5.0% under current law. To model the effects of agrowth rate limit for health care spending under Medicare for All that is equal to the projectedGDP growth rate, we apply savings from all other policies before calculating the impact of GDP-pegged growth. We first calculated new 2020 NHE by deducting all estimated 2020 savings fromthe 2020 single-year NHE number estimated by Urban. We then applied the GDP growth rate tothis 2020 NHE base to calculate NHE for the 2020-2029 window under the growth rate limit.The difference between projected ten-year NHE under the GDP-pegged growth rate and ten-yearNHE with all policies other than the growth rate limit in effect is $1.1 trillion.
93 Congressional Budget Office, “Prices for and Spending on Specialty Drugs in Medicare Part D and Medicaid.”March 2019. https://www.cbo.gov/publication/5496494 Congressional Budget Office, “Effects of Drug Price Negotiation Stemming From Title 1 of H.R. 3, the LowerDrug Costs Now Act of 2019, on Spending and Revenues Related to Part D of Medicare.” October 2019.https://www.cbo.gov/publication/55722.
27
Maintenance-of-effort from States and Local Governments
Using the projected spending data in the National Health Expenditure Accounts Table 16, wecalculated the total projected health care spending for states and local governments on employee
health coverage ($2.7 trillion), Medicaid ($3.3 trillion), and the Children’s Health Insurance
Program ($17 billion) for a total of $6.0 trillion in projected spending over ten years. This
maintenance -of-effort is held constant as a consistent percentage of overall Medicare for All
spending and grows with system cost growth, which we note above will be below current lawprojected growth. As a result, states will pay less over time than they would under current law.
28