Embed Size (px)
Citation preview

Annual Report
2017October 31,
Global Premier Properties Fund

Alpine Global Premier Properties Fund (the “Fund”), acting in accordance with an exemptive order received from the Securities and ExchangeCommission (the ‘’SEC”) and with approval of its Board of Trustees (the “Board”), has adopted a level distribution policy (the “Policy”) with thepurpose of distributing over the course of each year, through periodic distributions as nearly equal as practicable and any required special distri-butions, an amount closely approximating the total taxable income of the Fund during such year and all of the returns of capital paid by portfoliocompanies to the Fund during such year. In accordance with its Policy, the Fund distributes a fixed amount per common share, currently $0.05,each month to its common shareholders. This amount is subject to change from time to time in the discretion of the Board. Although the level ofdistributions is independent of Fund performance, the Fund expects such distributions to correlate with its performance over time. However,there is no assurance that the Fund will be able to do so. Each monthly distribution to shareholders is expected to be at the fixed amount estab-lished by the Board, except for extraordinary distributions and potential increases or decreases in the final dividend periods for each year in lightof the Fund’s performance for the entire calendar year and to enable the Fund to comply with the distribution requirements imposed by the In-ternal Revenue Code of 1986, as amended. Over time, the Fund expects that the distribution rate in relation to the Fund’s net asset value(“NAV”) will approximately equal the Fund’s total return in relation to the Fund’s NAV.
The fixed amount of distributions will be reviewed by the Board at regular intervals with consideration of the level of investment income and realized gains. The Board strives to establish a level regular distribution that will meet the Fund’s requirement to pay out all taxable income (including amounts representing return of capital paid by portfolio companies) with a minimum of special distributions. The Fund’s total returnin relation to changes in NAV is presented in the financial highlights table. Shareholders should not draw any conclusions about the Fund’s investment performance from the amount of the current distribution or from the terms of the Fund’s level distribution policy. The Board mayamend or terminate the level distribution policy without prior notice to Fund shareholders.
Shareholders should note that the Fund’s Policy is subject to change or termination as a result of many factors. The Fund is subject to risksthrough ownership of its portfolio company holdings including, but not limited to, declines in the value of real estate held by the portfolio company, risks related to general and local economic conditions, and portfolio company losses. Moreover, an economic downturn could have amaterial adverse effect on the real estate markets and on real estate companies in which the Fund invests, which in turn could result in the Fundnot achieving its investment or distribution objectives thereby jeopardizing the continuance of the Policy. Please refer to the prospectus for afuller description of the Fund’s risks.
89563_02_Alpine_AR.qxp_02 12/22/17 8:20 PM Page IFC1

Alpine View 1
Manager Commentary 4
Schedule of Portfolio Investments 13
Statement of Assets and Liabilities 16
Statement of Operations 17
Statements of Changes in Net Assets 18
Financial Highlights 19
Notes to Financial Statements 20
Report of Independent Registered Public Accounting Firm 27
Additional Information 28
TABLE OF CONTENTS
89563_02_Alpine_AR.qxp_02 12/22/17 8:20 PM Page toc1

[THIS PAGE INTENTIONALLY LEFT BLANK]
89563_02_Alpine_AR.qxp_02 12/22/17 8:20 PM Page toc2

Alpine ViewOctober 31, 2017
TAX CUTS
An element of uncertainty has been introduced by the U.S. RepublicanCongress which is planning to put forth an economic stimulativeprogram, packaged as tax reform. This has been cooked up in oldschool D.C. style, in back rooms with no transparency, nor based onspecific intellectual precepts or schools of thought, this grab bagrestructuring of the tax code is in some ways progressive, in otherways regressive, both positive and negative, and which will no doubtbe beneficial to some and negative for others in our economy. On thesurface, it is positive for corporations, many of whom should seelower tax rates and it is intended to stimulate capital investment inthe short-term through accelerated depreciation of new investments(as low as one year down from five to twenty!), which offsets taxes.Companies which repatriate capital from overseas will have very low(6-12%) recapture rates if they bring money home (estimates that $1-2 trillion may come back over several years). However, investment inresearch and development (R&D) for better future products do notreceive such benefit. This should be positive for stocks in that it willno doubt lead to more corporate buy-backs and special dividends forshareholders, and we may well see a short-term investment boomover the next 12-18 months. Such a jumpstart would have been usefulback in 2009 or 2010 but may create a boom/bust surge in activitywhich could induce the Fed to rapidly defend against inflation. Ofcourse, we do not know what percentage of the trillions held abroadheld by companies such as Apple and Microsoft, among others, willbe repatriated nor, the final details of the tax rates. So, we await andhope it will be more rational than feared. Nevertheless, thesignificance will likely be a short-term stimulus effect, with potentialnegative implications for the long-term when the payback for thesetax cuts could come in the form of deficits which need to be reduced.That said capital markets may take a long-term perspective, pushinginterest rates higher to reflect this. Fundamentally, just as the U.S.(and global) economy is getting stronger, we believe it would be betterto stimulate future growth by targeting better infrastructure andeducation and R&D for promising technologies and products, ratherthan to get a quick boost followed by rapidly rising interest rates.
INTEREST RATES
The Fed has made it clear that they are looking forward to raisinginterest rates in December 2017 and then again up to four times in2018. We believe that it may only be two or three increases after theFed Funds Rate rises from 1.16% today to above 1.25% in December,probably to 1.5% by early Summer 2018, and at least 1.75% by year-end 2018. It should be noted that the Fed’s dot plot has rates risingto over 2% by year end 2018 and over 2.5% by year end 2019. Muchdepends on the impact of the aforementioned new tax plan and therate at which other central banks begin to withdraw from quantitativeeasing. Our concern is that the current ‘Goldilocks’ environment ofvery low interest rates and moderate economic activity, which hasbeen so beneficial for the stock market, may be upset if interest ratesrise more quickly than the Fed has guided and if funds retreat fromthe capital markets.
Dear Shareholders:
During the fiscal year ended October 31, 2017, the equity marketsfinally side-stepped their broad apprehension, which has been acharacteristic of market sentiment since the great financial collapseof 2008. As we pointed out in prior reports to shareholders, themarket was greatly concerned about either the risks of imminentinflation due to the stimulative effects of loose monetary policy, oralternatively, a deflation drag due to over-capacity and structuralimbalances remaining from prior expansions. Following the U.S.Federal Reserve’s (Fed) warning of an imminent transition fromquantitative easing (QE) towards normalization back in May of 2013,the capital markets suffered from a ‘taper tantrum’ before assumingan alternating risk-on/risk-off mode that persisted well into 2015.However, in the fourth quarter of 2015, a speculative commodityboom that had become a bust lasting into February of 2016, re-engaged persistent fears of global economic deflation. As it turnedout, the economy found its footing and markets recovered through2016, and ultimately produced double-digit returns this year, asinvestors have bought equities to capture corporate growth. Strongeconomic reports have become more consistent and corporateearnings and revenue growth appears more sustainable as weapproach 2018.
The equity markets focus this year has been particularly strong forgrowth stocks, as opposed to value stocks or stocks of stabledefensive companies. In particular, the market has been focused ontop-line revenue growth and companies with strong profitability.Interestingly, the market has also favored companies with relativelylow financial leverage and, thus, a greater margin of safety. Stockswhich combined these characteristics performed particularly well.Notably, we appear to be in the midst of a synchronized globaleconomic recovery in which Gross Domestic Product (GDP) has beensupported by strong orders for goods and services, witness regionaland national purchasing managers’ indices (PMI) and improvingemployment data. This has given corporations the ability to increasesales volumes, which has historically improved profit margins, andin combination with tightening labor markets, is leading to the firstsigns of wage growth in select sectors and geographies. Wage growthmay lead to increased consumption patterns as growing jobconfidence and incomes induce people to spend more freely, whichin turn can stimulate corporations to increase their capitalexpenditures for new production facilities and equipment. This, inturn, leads to more jobs and new products for consumers. Since theU.S. accounts for roughly 25% of the global GDP, it is natural for usto lead the rest of the world out of periods of economic doldrums.China is almost 15% of the global GDP and it too has been growingquite strongly, until the past quarter or so when it has shown signsof moderating. That said, the Eurozone, which is slightly larger thanChina, and Japan, which is roughly half its size, are both picking upthe slack, so we expect continued global recovery over the nextseveral quarters at a minimum.
Annual Report | October 31, 2017 1
89563_02_Alpine_AR.qxp_02 12/22/17 8:20 PM Page 1

2
EQUITIES
In Alpine’s view, the fundamental reason for the growth in stockmarket performance for the past year lies principally with the growthin corporate earnings. Particular focus on companies growingbusiness sales which can provide double-digit earnings growth hasbeen very appealing at a time when many investment returns,notably interest or rental yields, are producing low single-digitreturns. For next year, the equity markets are forecast to growearnings on the order of 6-12% depending on whether or not therewill be a notable tax benefit. This compares with about 8-15% foremerging markets, which have also performed strongly in the pastyear. So even though stock market multiples appear high by historicalstandards, we are still enjoying the rare combination of double-digitearnings growth and single-digit interest rates. Thus, dividends couldprovide an attractive support for equity prices. Our focus willcontinue to be on what we have in the past called growth values, andon the transformative potential of mispriced stocks.
SECTORS
We believe that certain sectors of the equity market are now morefavored than others as the markets rotate more thoroughly towardsgrowth. This could be perceived as a very positive environment forfinancial stocks which showed a spurt from investor interest at thebeginning of the fiscal year and now may find a more sustainedinterest with a steeper yield curve and continued growing demandfor capital. Industrial companies should certainly perform well asgeneral consumption and strengthening business patterns continue.Needless to say, this could be further stimulated by a potentiallylower tax regime. Also typical of strengthening economic conditionsis demand for both raw materials and processed products ready forproduction. Admittedly all these groups have already run higher abit this year, but we think there is potentially more upside fromearnings growth. We are generally positive for selected informationtechnology stocks and energy companies which will be asked to fuelthe prospective economic recovery. Nevertheless, we think theenvironment will be mixed for consumer discretionary, healthcareand real estate companies, favoring those with greater sensitivity toeconomic expansion or highly desired products and services. Ingeneral, we are more cautious on consumer staples and utilitieswhich are perceived as defensive.
SENTIMENT
While we continue to favor growth, we believe value will besustained selectively by merger and acquisition (M&A) activity. Manycompanies see such M&A opportunities as a short cut through whichto expand or reinvigorate their business. Since the current globalbusiness cycle may last for another two to even perhaps several moreyears, we think many companies will focus on strategic realignmentsin order to achieve longer-term growth. Such mature cycle strategiescould become a major factor in driving equity market sentiment overthe next year.
While some market participants are concerned that marketsentiment might be too buoyant, we just wish to comment on thebitcoin frenzy, which we think represents a true bubble. Theintroduction of bitcoin trading to futures and derivative markets isperhaps leading some investors to equate it with currencies orcommodities. In fact, these exchanges are allowing speculators tobuy or sell derivatives based on a synthetic instrument (the bitcoin)which does not have a traditional store of value or representsovereign strength or wealth as do currencies. Rather, it is simply apotential method of commerce which is benefiting from significantscarcity value. Notably, of the 16 million bitcoin units in existence,estimates that only half are believed to be in active trading accountsso the daily volume traded is not significant. Like prior booms ofyesteryear, such as railroads, canals and even dot.com internetstocks, the appeal is in a future potential, which may hold greatpromise. However, one can only imagine what continued innovationand new competition (other coins or digital measures) and broaderaccess can do to impact what may be more concept than reality.
The reality of the current extended stock market up-cycle is that it isbased on rising earnings, which have continued to grow. The long climbto recovery from the losses of 2008, and recently positive returnsreflecting the current and prospective growth of corporate earningsappears to be increasingly durable. Indeed, since the S&P 500(r) Index(S&P) peak in October 2007 through, as recently as, May of 2015, theIndex had generated a total return of 36.14% or only 4.13% per annum.Since that peak in May of 2015, through the end of October of thisyear, the S&P has gained almost 21%, or an annualized 8.04%. Notethat this last period includes the commodity bust in late 2015 whichculminated in the S&P decline of 14% from May of 2015 through mid-February, 2016. Thus, we think the markets have accelerated beyondtheir prior caution and uncertainty over long term trends.
2018: STILL A BIT UNCLEAR
Despite market enthusiasm at the end of 2017 for a tax policy boostto the economy, no meaningful policies have yet been put in placeby the Trump Administration in a manner that has yet had significanteconomic impact. Certainly, a ‘feel good’ factor over the potential oflessened regulation, lower taxes and potentially increased spendingon our infrastructure has been supportive, but not actionable. In fact,it is not clear that the U.S. economy needs this stimulus at this time.The policies do not appear fully thought out, as they are not focusedplans with targeted benefits and impact. Rather, we suspect thatmany decisions are made to accommodate the wishes of selectgroups or special interests and meet the needs of targetedlawmakers. It seems the “swamp” is as mucky as ever, if not worse.
While the tax stimulus (or so-called “reform”) on top of the growingU.S. economy could provide an extra boost over the next 12-18months, we are mindful that it could risk bringing a sharperadjustment by the Fed than is currently expected by the capitalmarkets. That could lead to a negative short-term impact on equityprices if pronounced. Frankly, we would view such an event as anopportunity for renewed investments as such dislocations inevitablyre-shuffle the deck. In essence, we believe that active management
Alpine View (Continued)October 31, 2017
89563_02_Alpine_AR.qxp_02 12/22/17 8:20 PM Page 2

Annual Report | October 31, 2017 3
will continue to be presented with a range of opportunities frommarket shifts, initial public offerings (IPOs), M&A and the potentialfor businesses benefitting from longer-term economic growth. For2017, we benefitted from the dynamics of this unique investmentenvironment and we view 2018 as another year of potentialopportunity.
For now, we remain positive on equity markets, cautious on fixedincome with a bias towards the short end of the curve and lowduration. Our only caveat is that one must be flexible and able toadjust to changes in the economic, political, and increasinglydifferentiated world.
We appreciate your continued interest in our Funds and your supportfor our efforts to provide meaningful investment alternatives for you.
Sincerely,
Samuel A. LieberPresident
Past performance is not a guarantee of future results. The specificmarket, sector or investment conditions that contribute to aFund’s performance may not be replicated in future periods.
Investing involves risk. Principal loss is possible. Please refer toindividual letters for risks specific to that Fund.
This letter and the letter that follows represent the opinions of theFunds’ management and are subject to change, are not guaranteed andshould not be considered recommendations to buy or sell any security.The information provided is not intended to be, and is not, a forecastof future events, a guarantee of results, or investment advice.
Duration is a commonly used measure of the potential volatility ofthe price of a debt securities, prior to maturity. Securities with a longerduration generally have more volatile prices than securities ofcomparable quality with a shorter duration.
Quasar Distributors, LLC provides filing administration for Alpine’sclosed-end funds. The Funds are not bought or sold through QuasarDistributors; the Alpine closed-end funds are bought and sold throughnon-affiliated broker/dealers and trade on nationally recognized stockexchanges.
This is a closed-end fund and does not continuously offer shares.
Alpine View (Continued)October 31, 2017
89563_02_Alpine_AR.qxp_02 12/22/17 8:20 PM Page 3

4
Manager CommentaryOctober 31, 2017
Dear Shareholders:
We present below the 2017 Annual report for the Alpine GlobalPremier Properties Fund (AWP). For the twelve-month period endedOctober 31, 2017, the net asset value (NAV) per share was $7.18versus $6.38 for year-end 2016, which, in combination with theannual distribution of $0.60 per share, produced a total return of24.34% compared with the total return of the Fund’s primarybenchmark, the FTSE EPRA/NAREIT Global Real Estate Index of 9.91%over the same time period. For the same period, AWP’s market pricewas $6.48 versus $5.28 for the prior period end, which incombination with the $0.60 per share annual distribution produceda total return of 35.59%. The Fund’s shares traded at an averagediscount to net asset value of 13.1% during the fiscal year.
Market Overview
The period under review kicked off a week before Trump’sunexpected US presidential election victory and ended just days afterPresident Xi Jinping consolidated virtually absolute power in Chinaat the 19th National Congress. Over those twelve months global realestate equity returns experienced respectable returns and exhibiteda degree of resilience in the face of a series of geopolitical shocksand the uncertainty of monetary policy from G7 central banks, butnonetheless underperformed very strong global equity markets by awide margin. The Trump victory immediately galvanized expectationsfor an expansionary fiscal policy which set off a backing up of globalyields as the reflationary impulse drove a reflexive sell off of bondproxies including real estate investment trusts (REITs). The dramaticsell off of the so-called interest rate sensitive sectors proved to beshort lived and offered a good opportunity for active managers toaccumulate oversold stocks. There were further headwinds on thehorizon as the Federal Reserve (Fed) hiked rates at a measured paceand announced its much-anticipated balance sheet unwind, but realestate equities continued to grind out positive returns. Underpinningperformance during the period was indeed a reflation trade, but notof the Trump variety as no substantive legislative measures tosupport the campaign rhetoric have been enacted to date. Thereflation came in large part from emerging Asia, driven by resurgingcyclical momentum in China and to a lesser degree India-as well as arobust recovery and positive election outcomes across Europeanmarkets. This rising tide lifted most boats-including real estate-as theimproving global economic outlook sparked continued momentumin physical real estate markets. However sentiment for global realestate relative to broader equities was ultimately tempered bysensitivity to shifts in yield curves as well as concerns over the realestate fundamentals, particularly in developed markets, reaching amature point in the cycle.
At the country level, the US REIT sector as a whole significantly laggedthe broad equity market as expectations for interest rate increasescontinued to present a headwind for the group as the 10-yearTreasury yield shifted from 1.83% to 2.38% during the year.Expectations for further Fed tightening and balance sheet unwindpresented headwinds and uncertainty with respect to the impact ofpending tax reform and further dampened sentiment for the group.As throughout most of the year there was notable dispersion of
returns as subsectors exhibiting pricing power, such as industrial anddata centers, outperformed those sectors experiencing tenantconcerns and pressure on cap rates, such as healthcare and malls.Retail store closings and the so-called “Amazon effect” dominatedheadlines, which added further pressure to the mall and shoppingcenter stocks.
In Japan, the JREITs were notable underperformers as the pace ofnet outflows from local investment trusts continued and local banksreversed course and became large net sellers into period end. TheJapanese developers saw positive returns but underperformed on arelative basis. Despite healthy fundamentals (vacancy rates in centralTokyo have fallen to 3.17% while office rents in bellwether areas suchas Marunochi and Otemachi have seen contract rents tick up for thefirst time in eight quarters) and reasonable valuations globalinvestors are still on the sidelines in Japan as they wait for thecompanies to pursue more policies aimed at maximizing shareholdervalue such as share buybacks.
All European real estate benchmarks saw strong absolute returns butunderperformed on a relative basis primarily due to the strength offinancials in the broad-based equity indicies. It was a strong year ingeneral for European markets which were bolstered by reducedpolitical risk (which may prove fleeting with the recent tensions inSpain) as well as cyclical improvements in the economic data.Standout performance in Italy, Austria and Spain was modestly offsetby relative underperformance in France and Switzerland.
In the UK, real estate securities posted an impressive rally from a lowbase but nevertheless fell short of the broad index. There are stillfew signs of stress in the London commercial market yet most UKREITs trade at steep discounts to NAV. Transactions during the yearsuch as the sale of Facebook’s headquarters (Rathbone Square), thesale of the Cheesegrater (the Leadenhall building) and the sale of theWalkie Talkie (20 Fenchurch Street) have been supportive ofvaluations and have prompted a spate of special dividend paymentsfrom the proceeds. Yields appear to have stabilized and occupierdemand has underpinned resilient top line rental values, howeverincentives are increasing while lease durations and break yearoptions are coming in. Investment appetite for UK shopping centershas been far less robust. Brexit risks remain front and center andshare volatility could swing based on sentiment toward thenegotiations and any news of financial sector tenants shiftingpersonnel out of London.
The Australian real estate market was resilient yet underperformedthe broader market as it too was a casualty of the threat of the backup in interest rates. Fundamentals of the office market remain stable,yet Amazon’s entry into the market and a cyclical downshift inconsumption has weighed on retail names. The returns in Singaporebear mentioning as real estate developers posted strongperformance underpinned by a demand recovery for primary andsecondary transactions. Finally, EM real estate saw exceedinglystrong overall results driven by a strong China outlook heading intothe National Congress, a surging recovery in earnings and a stableUSD. All of this despite expectations for further rate hikes from theFed, fears over protectionist trade policies from the Trump
89563_02_Alpine_AR.qxp_02 12/22/17 8:20 PM Page 4

Manager Commentary (Continued)October 31, 2017
Annual Report | October 31, 2017 5
administration and geopolitical tensions ramping up in North Koreaand the Middle East, among others.
Portfolio Overview
The portfolio’s top ten holdings shifted notably during the period asonly five of the ten holdings remained. In aggregate the top tenrepresented 24.35% of the portfolio versus 25.80% a year ago. TheIrish hotel owner/operator Dalata, the UK-based IWG (formerlyRegus), the US. office REIT Kilroy, CyrusOne a US data centercompany and Hispania the Spanish SOCIMI (local REIT) dropped outof the top ten. They were replaced by the Japanese developerSumitomo Realty, the European mall owner Unibail, a UShomebuilder William Lyon Homes, a mortgage REIT Two Harbors andthe data center operator QTS Realty Trust.
The Fund’s country allocations adjusted during the period as ourassessment of the macroeconomic conditions, stock valuations,investment opportunities and risks evolved. The Fund maintained itsunderweight in the US but narrowed it considerably, primarilythrough the addition of select datacenter REITs and homebuilders tothe portfolio. The Fund’s next largest exposure is in Japan, where theportfolio pared back its overweight position, focusing on areassessment of our JREIT exposure. While the economic data out ofJapan has not met expectations, we remain encouraged by a modestrecovery in real estate fundamentals, potential policy tailwinds andcontinued strength in the physical property market. The Fund’s thirdlargest allocation was to the UK which, although it was reduced, stillmanaged to stay marginally ahead of the positioning in Ireland, Spainand France.
Other noteworthy adjustments to the portfolio included establishinga position in UK-based real estate service company Purplebricks, aswell as increasing exposure to Germany through the purchase ofPatrizia and Aroundtown, and to European homebuilders throughparticipation in the IPOs of Neinor and Aedes in Spain, and Glenveaghin Ireland. The purchases were primarily funded by reducingexposure to select J REITs and Chinese residential developersthroughout the period.
Broadly speaking the Fund was underweight in emerging markets(EMs), but held overweight positions in selective markets. The mostnoteworthy shifts were in Mexico, China/Hong Kong, India andspecific Association of Southeast Asian Nations (ASEAN) markets. Theoverweight in Mexico was trimmed due to uncertainty over NAFTArenegotiations, the pending elections and currency weakness.Positions in China/Hong Kong were pared back after strongoutperformance and to reflect our tactical caution regarding theChinese government reining in its aggressive level of policy stimulusafter the National Congress. India remains a fundamentally attractivemarket but the Fund modestly pared back its large overweight aftervaluations for select names approached fair value and our concernsover the short term impact of demonetization, as well as theimplementation of the Goods & Services Tax Law (GST) and RealEstate Regulation Act (RERA). Nonetheless, India continues topresent an interesting risk/reward dynamic over a longer term view.The aggressive reform agenda will bear fruit over time and the
headwinds facing many of the real estate developers could dissipatein our view as demand recovers and credit becomes more accessible.The issuance of a REIT structure in India is closer to becoming areality, which could provide much needed capital to de-lever balancesheets and bring greater diversification to the sector as a whole. Theallocation across certain ASEAN markets, primarily in Thailand andthe Philippines, was reduced due to our assessment of growthprospects and valuation levels. The Fund remains underweight toHong Kong, Australia and Canada. Finally, the Fund hedged itscurrency exposure to the yen, euro and pound.
Top Contributors
The top five contributors to the Fund’s absolute returns over theperiod under discussion were Global Logistic Properties, CyrusOne,Dalata Hotel Group, William Lyons Homes and LGI Homes.
• Global Logistic Properties (GLP), is a Singapore-based owner,developer and manager of logistics assets in China, Japan, Braziland the US. The company accepted a buyout bid from amanagement-led Chinese consortium, which narrowed thediscount to NAV significantly.
• CyrusOne is an owner, developer and operator of data centerslocated in the US, with a concentration in Texas and Ohio, the UKand Singapore. The data center sub-sector is currently enjoyingrobust demand trends and the company has an established trackrecord for capturing that growth through development and M&A.Lease up trends continue to track favorably and managementrecently increased top line and FFO/share guidance.
• Dalata Hotel Group is an owner/operator of hotels in Ireland andthe UK. Management continued to demonstrate its ability tocapitalize on opportunities in the severely undersupplied marketof Dublin and regional Ireland. Strong operating performance, itslarge and visible development/extension pipeline and plans forexpansion into 20 regional UK markets have led to strongperformance of the shares.
• William Lyons is engaged in the design, construction, marketingand sale of detached and attached single-family homes in theWestern US. The builder has achieved above-peer growth as itwas able to ramp up deliveries from several larger strategic assetsin higher demand and higher priced communities in California,Washington and Oregon, increasing revenues by 26% andexpanding gross margins 150 basis points (bps) on a year-over-year basis.
• LGI Homes designs and builds affordable homes that appeal toentry-level buyers in ten states across the US. The homebuildingsector in the US has enjoyed a solid year of growth, boosted by agrowing share of first-time buyers entering the market. LGI’sunique sales and marketing approach has driven above-averageabsorption levels and its aggressive expansion of its business —coinciding with a strengthening of demand from first-time buyers,has allowed it to achieve year-over-year revenue and homeclosings growth of 69% and 64%, respectively.
89563_02_Alpine_AR.qxp_02 12/22/17 8:20 PM Page 5

6
Manager Commentary (Continued)October 31, 2017
The top five negative contributors to the Fund’s performance duringthe fiscal year ended October 31, 2017 were Colony NorthStar, Ichigo,Simon Property Group, GGP and Vesta.
• Colony NorthStar is a US listed global real estate and investmentmanagement firm with REIT status that resulted from a recently-completed merger between Colony Capital, NorthStar Realty andNorthStar Asset Management. Share price weakness after thecompletion of the merger was due primarily to concerns overintegration risk and the potential for short-term deterioration inearnings quality which led to a reduction in management’s 2017outlook. As the company continues to streamline its portfolio andlower its cost of funding we believe it could lead to renewedearnings growth and support for an attractive dividend.
• Ichigo, is an asset manager in Japan. The share performance wasweak as management conservatively guided in January 2017 forits first profit decline in six years due to temporary delays in assetsales to its JREITs and infrastructure fund. We remain constructiveon the name due to its ability to grow its underlying assetmanagement business, attractive valuation and its support of theshares through buybacks and cash dividends.
• Simon Property Group, a US. REIT, is one of the largest ownersand operators of malls and premium outlets globally. On theground metrics such as sales per square foot, base minimum rentsand leasing spreads remain in respectable territory, however achallenging retail environment, viz, increasing level of highlyvisible retail bankruptcies and conventional wisdom promotingthe narrative of the death of brick and mortar retail, has madethe entire sector an easy place for investors to avoid.
• GGP is another US REIT owning and operating malls in the U S. Achallenging retail environment, viz, increasing level of highlyvisible retail bankruptcies and conventional wisdom promotingthe narrative of the death of brick and mortar retail, continuedto weigh on the shares. Brookfield, which currently owns 34.6%of the company, has recently made an unsolicited offer to takethe company private and the negotiations are continuing.
• Vesta is a developer, owner and operator of industrial assetsacross Mexico with a tenant focus on aerospace and automotivemultinationals. The shares and the peso sold off sharply after theunexpected outcome of the US presidential election but managedto recover during the year. However ongoing NAFTA renegotiationshave reignited volatility of the shares.
Outlook
Indicators of growth have gained renewed momentum and appearmore broad-based as a cyclical upswing has taken hold across abalanced cross section of sectors of the global economy. Inflationremains anchored for the most part, but a continued rally ofcommodities could ultimately drive inflation expectations and forcethe hands of central banks. For the time being, financial conditionscontinue to be supportive of a robust earnings recovery driving asynchronous move across developed and emerging markets. Theprospects for tax cut legislation to pass in the U S could further
bolster the growth narrative into 2018. As such increased riskappetite and the resurgence of a reflation trade have extended thecurrent low-volatility regime across asset classes despite ongoinggeopolitical hurdles. In general, we continue to feel comfortable withour approach of guarded optimism as signals of a pro-cyclical surgebecome more pronounced. Signs of momentum in the cyclicalrecovery, modest inflation and a measured tightening of interestrates have generally been supportive for real estate returns on anhistorical basis, however, political uncertainties, a flattening yieldcurve and a maturing cycle keep us vigilant for downside risks.
In the US REIT market, we continue to expect a wideningdifferentiation of operating data between segments but an overallhealthy (but peaking) same-store rental outlook supporting netoperating income (NOI) growth for the remainder of 2017. Whilelong-end rates have ticked up, intraday spreads between the two-and thirty-year yields fell to levels not seen since before the financialcrisis. Thus far early guidance for 2018 has been limited but we wouldexpect the majority of management teams to err on the side ofcaution. The lingering question of price discovery, ie what is anappropriate cap rate for an A-grade mall given the so-called Amazoneffect and mounting capex spend, has been answered as Brookfieldproposed to acquire the shares they don’t own in GGP at a 5.9%current/6.2% forward cap rate. The sector received some positiveclarification to its tax status with the newly introduced Houselegislation which as currently written provides for continuedallowance of interest expense deduction, use of IRS Section 1031exchanges and the existing commercial property cost-recovery/depreciation regime. It is still very early stages for the bill,and it’s likely to see multiple revisions before a vote, but for themoment the impact is better than initially expected.
There continue to be encouraging signs of cyclical momentum inEuropean markets and the European Central Bank (ECB) remainssupportive, however the recent regional flare up in Spain cannot beignored. We remain less constructive on the UK market as it facesheadwinds from Brexit uncertainty and late cycle fundamentals butfurther we are finding it increasingly difficult to square the seemingdislocation between overall resilience in NAVs with our assessmentof the risk and the operating outlook. It’s true that Savills’ reportedthe highest quarterly take up on record of West End offices in Q32017, but it is less clear to what extent the quality of this lettingvolume has deteriorated due to rent free periods moving out andlease durations shortening. A recent rate hike by the Bank of England(BoE) (the first in over a decade) could further muddy the waters.
Japanese real estate, including the developers and JREITs, continuedto underperform but we have not shied away from our belief thatit’s only a matter of time before equity returns reflect underlyingfundamentals and robust transaction levels in the physical market.On current valuations it seems markets are still pricing in adeflationary environment for the developers. Bank of Japan (BoJ)policy and Abenomics have provided a significant tailwind for so-called Japan Inc. but we have yet to see this passed throughmaterially to wage increases, capex plans or shareholder returns.Abe’s recent election success could mark an inflection point as it
89563_02_Alpine_AR.qxp_02 12/22/17 8:20 PM Page 6

Annual Report | October 31, 2017 7
Manager Commentary (Continued)October 31, 2017
might embolden him to pressure corporations with carrots: taxbreaks for capital spending and boosting wages-and/or sticks: taxeson retained earnings.
Emerging markets (EMs) continue to exhibit a strong recovery inearnings as a clear recovery in domestic demand and a stabilization oftrade and commodity prices have provided a tailwind. Inflation acrossEMs is touching its lowest level since the global financial crisis whichshould provide some flexibility for policymakers to maintainaccommodative rate regimes. One needs to look no further than Brazil,which has shaved 650bps off of the Sistema Especial de Liquidacao eCustodia (SELIC) since October 2016 while its inflation gauge (IPCA-15Index) hit a low of 2.56% on September 30, 2017, down from a high of10.84% registered in February 2016. The next leg of the recovery couldbe driven by the efficacy of reform agendas, whether it is pensionreform in Brazil, tax reform in the Philippines or the ongoing reformsin China. If there are clouds on the horizon they could come from theelection calendar for the remainder of the year and through 2018including in South Africa, Mexico, Brazil and Thailand.
For the time being China remains the bellwether for the direction ofEMs. The government’s intervention leading up to the NationalCongress meetings bolstered cyclical momentum in its economy,providing much of the heavy lifting for the global reflation trade YTD2017. Now that Xi has consolidated power markets expect temperedgrowth for the remainder of the year as the push for reforms takecenter stage anew. We remain firmly of the view that slowdowns inChina are based on policy shifts not sharp decelerations in demand.Periodic volatility in the growth, foreign exchange and geopoliticaloutlooks for China could reverberate through global markets andremain a critical driver of macro instability, particularly with respectto EMs. Now that the National Congress is behind us we reiterate ourcautiously optimistic view that China can avoid any so-called “hardlanding” in its economy through a mix of political reforms as well asmonetary and fiscal measures.
It’s now been more than four years since the taper tantrum andalmost a decade since quantitative easing (QE) was first introducedand yet central bankers are still top of mind for most investors.Financial conditions remain easy, yield curves are flattening, creditspreads are tight and the US dollar is range bound. Despite our beliefthat global monetary policy could remain accommodative over themedium term there are early signs that we could be nearing aninflection point for the QE regimes of G7 central banks as investorsbegin to contend with the implications of unwinding monetarystimulus. Of particular concern is the potential trade off of the Fed’sapproach to tightening, whether through further rate hikes orthrough shrinking its balance sheet. As the details unfold they willbe of critical importance for investors primarily because each channelcould have distinct and quite varied cross asset implications-perhapsmost importantly through the impact on currencies and any spilloverfrom such a potential shock. Inflation, or the lack thereof, should holdthe key to the velocity and slope of shifts in the yield curve. Therecent appointment of Jay Powell to replace Yellen in 2018 shouldpreserve continuity at the Fed, at least over the near term, but itremains to be seen to what extent the structural impact of a lower
“normal” neutral rate is going to influence return expectations overthe longer term.
With respect to the other major central banks, the Bank of Japan(BoJ) is expected to stay the course in its battle against deflation andto augment its current approach with further fiscal initiatives.Current market talk is rife with uneasiness regarding the EuropeanCentral Bank (ECB) reducing its monthly asset purchases into 2018and what this policy shift could ultimately mean for bond yields,especially in Spain and Italy. Given the cyclical improvement inEurope and that the ECB’s balance sheet is currently larger inaggregate than the Fed’s it stands to reason that markets would besensitive to the ECB tapering its bond purchases in the medium term.However, inflation remains well below target in the Eurozone and itis our view that the ECB would not want to undermine a recovery atthis time, especially given that the spillover effects of any Fedtightening remain unknown.
In our view the geopolitical landscape represents one of the mostsignificant pressures to our outlook as equity markets have becomeincreasingly more phlegmatic about political risks over time. Thenuclear aspirations of North Korea and tensions in the Middle East(most recently in Saudi Arabia) could pose challenges to the outlookfor continued recovery. In the UK and Europe uncertainty over thedirection of Brexit could add to volatility in asset markets. Coalitionbuilding in Germany and pending Italian elections could presentfurther challenges for the Eurozone outlook while the recent uprisingin Catalonia has the potential to ripple through like-minded regionsacross Europe and undermine the cohesion of the EU. And finallyperhaps the biggest wild card in the outlook is that after nine monthsof a new US administration there are more questions than answerssurrounding the role and vision that the US will adhere to goingforward.
In the current environment, differentiation remains a guidinginvestment principle and underscores the importance of allocatingcapital to those companies which embody best in class managementteams, strong operating platforms with diverse value creationopportunities, balance sheet discipline and the ability to drivedividend growth over time. Markets have exhibited a wide dispersionof returns by sector and geography, making this an attractiveenvironment for active management. Alpine believes it is essentialto maintain a diversified portfolio in terms of geography, asset mixand income distribution potential.
Thank you for your continued interest and support.
Sincerely,
Samuel A. LieberJoel E.D. WellsBruce EbnotherPortfolio Managers
Past performance is not a guarantee of future results.
Diversification does not guarantee a profit or protect from lossin a declining market.
89563_02_Alpine_AR.qxp_02 12/22/17 8:20 PM Page 7

8
Manager Commentary (Continued)October 31, 2017
Please refer to the Schedule of Portfolio Investments for fund holdingsinformation. Fund holdings and sector allocations are subject tochange and should not be considered a recommendation to buy or sellany security.
This letter represents the opinions of the Fund’s management and issubject to change, is not guaranteed and should not be considered arecommendation to buy or sell any security.
The information provided is not intended to be, and is not, a forecastof future events, a guarantee of future results, or investment advice.Views expressed may vary from those of the firm as a whole.
Favorable tax treatment of Fund distributions may be adverselyaffected, changed or repealed by future changes in tax laws. Alpinemay not be able to anticipate the level of dividends that companieswill pay in any given timeframe.
The Fund’s monthly distributions may consist of net investmentincome, net realized capital gains and/or a return of capital. If adistribution includes anything other than net investment income, theFund will provide a notice of the best estimate of its distributionsources when distributed, which will be posted on the Fund’s website;www.alpinefunds.com, or can be obtained by calling 1-800-617-7616For fiscal annual period ended October 31, 2017, the Alpine GlobalPremier Properties Fund did not pay any distributions through a returnof capital. A return of capital distribution does not necessarily reflectthe Fund’s performance and should not be confused with “yield” or“income.” Final determination of the federal income tax characteristicsof distributions paid during the calendar year will be provided on U.S.Form 1099-DIV, which will be mailed to shareholders. Please consultyour tax advisor for further information.
The Fund may invest in equity-linked securities and various otherderivative instruments, which can be illiquid and which maydisproportionately increase losses, and have a potentially large impacton Fund performance.
Fund investing involves risk. Principal loss is possible. The Fundis subject to risks, including the following in alphabetical order:
Concentration Risk – The Fund’s strategy of concentrating incompanies in a specific industry means that its performance will beclosely tied to the performance of a particular market segment. TheFund’s concentration in these companies may present more risks thanif it were broadly diversified over numerous industries and sectors ofthe economy. A downturn in these companies would have a largerimpact on the Fund than on a mutual fund that does not concentratein such companies. At times, the performance of these companies willlag the performance of other industries or the broader market as awhole.
Currency Risk – The value of investments in securities denominatedin foreign currencies increases or decreases as the rates of exchangebetween those currencies and the U.S. dollar change. Currencyconversion costs and currency fluctuations could erase investmentgains or add to investment losses. Currency exchange rates can bevolatile, and are affected by factors such as general economicconditions, the actions of the U.S. and foreign governments or centralbanks, the imposition of currency controls and speculation.
Cybersecurity Risk – Cybersecurity incidents may allow anunauthorized party to gain access to Fund assets, customer data(including private shareholder information), or proprietaryinformation, or cause the Fund, the Adviser and/or its serviceproviders (including, but not limited to, Fund accountants, custodians,sub-custodians, transfer agents and financial intermediaries) to sufferdata breaches, data corruption or lose operational functionality.
Equity Securities Risk – The stock or other security of a companymay not perform as well as expected, and may decrease in value,because of factors related to the company (such as poorer thanexpected earnings or certain management decisions) or to the industryin which the company is engaged (such as a reduction in the demandfor products or services in a particular industry). Holders of commonstock generally are subject to more risks than holders of preferredstock or debt securities because the right to repayment of commonstockholders’ claims is subordinated to that of preferred stock anddebt securities upon the bankruptcy of the issuer.
Foreign Currency Transactions Risk – Foreign securities are oftendenominated in foreign currencies. As a result, the value of the Fund’sshares is affected by changes in exchange rates. The Fund may enterinto foreign currency transactions to try to manage this risk. TheFund’s ability to use foreign currency transactions successfullydepends on a number of factors, including the foreign currencytransactions being available at prices that are not too costly, theavailability of liquid markets and the ability of the Adviser toaccurately predict the direction of changes in currency exchange rates.
Foreign and Emerging Market Securities Risk – The Fund’sinvestments in securities of foreign issuers or issuers with significantexposure to foreign markets involve additional risk. Foreign countriesin which the Fund may invest may have markets that are less liquid,less regulated and more volatile than U.S. markets. The value of theFund’s investments may decline because of factors affecting theparticular issuer as well as foreign markets and issuers generally, suchas unfavorable or unsuccessful government actions, reduction ofgovernment or central bank support and political or financialinstability. Lack of information may also affect the value of thesesecurities. To the extent the Fund focuses its investments in a singlecountry or only a few countries in a particular geographic region,economic, political, regulatory or other conditions affecting suchcountry or region may have a greater impact on Fund performancerelative to a more geographically diversified fund. The risks of foreigninvestments are heightened when investing in issuers in emergingmarket countries. Emerging market countries tend to have economic,political and legal systems that are less fully developed and are lessstable than those of more developed countries. They are oftenparticularly sensitive to market movements because their marketprices tend to reflect speculative expectations. Low trading volumesmay result in a lack of liquidity and in extreme price volatility.
Growth Stock Risk – Growth stocks typically are very sensitive tomarket movements because their market prices tend to reflect futureexpectations. When it appears those expectations will not be met, theprices of growth stocks typically fall. Growth stocks as a group maybe out of favor and underperform the overall equity market while themarket concentrates on undervalued stocks.
89563_02_Alpine_AR.qxp_02 12/22/17 8:20 PM Page 8

Annual Report | October 31, 2017 9
Manager Commentary (Continued)October 31, 2017
Initial Public Offerings and Secondary Offerings Risk – The Fundmay invest a portion of its assets in shares of IPOs or secondaryofferings of an issuer. IPOs and secondary offerings may have amagnified impact on the performance of a fund with a small assetbase. The impact of IPOs and secondary offerings on the Fund’sperformance likely will decrease as the Fund’s asset size increases,which could reduce the Fund’s returns. IPOs and secondary offeringsmay not be consistently available to the Fund for investing. IPO andsecondary offering shares frequently are volatile in price due to theabsence of a prior public market, the small number of shares availablefor trading and limited information about the issuer. Therefore, theFund may hold IPO and secondary offering shares for a very shortperiod of time. This may increase the turnover of the Fund and maylead to increased expenses for the Fund, such as commissions andtransaction costs. In addition, IPO and secondary offering shares canexperience an immediate drop in value if the demand for the securitiesdoes not continue to support the offering price.
Leverage Risk – The Fund may use leverage to purchase securities.Increases and decreases in the value of the Fund’s portfolio will bemagnified when the Fund uses leverage. The Fund may also have tosell assets at inopportune times to satisfy its obligations. The use ofleverage is considered to be a speculative investment practice and mayresult in the loss of a substantial amount, and possibly all, of theFund’s assets.
Liquidity Risk – Some assets held by the Fund may be impossibleor difficult to sell, particularly during times of market turmoil. Theseilliquid securities may also be difficult to value. Markets may becomeilliquid when, for instance, there are few, if any, interested buyers orsellers or when dealers are unwilling or unable to make a market forcertain securities. If the Fund is forced to sell an illiquid asset to meetredemption requests or other cash needs, the Fund may be forced tosell at a loss.
Management Risk – The Adviser’s judgment about the quality,relative yield or value of, or market trends affecting, a particularsecurity or sector, or about interest rates generally, may be incorrect.The Adviser’s security selections and other investment decisionsmight produce losses or cause the Fund to underperform whencompared to other funds with similar investment objectives andstrategies.
Market Risk – The price of a security held by the Fund may fall dueto changing market, economic or political conditions.
Micro Capitalization Company Risk – Stock prices of microcapitalization companies are significantly more volatile, and morevulnerable to adverse business and economic developments than thoseof larger companies. Micro capitalization companies often havenarrower markets for their goods and/or services and more limitedmanagerial and financial resources than larger, more establishedcompanies, including small or medium capitalization companies.
Real Estate Investment Trusts (“REITs”) Risk – REITs’ shareprices may decline because of adverse developments affecting the realestate industry including changes in interest rates. The returns fromREITs may trail returns from the overall market. Additionally, there
is always a risk that a given REIT will fail to qualify for favorable taxtreatment.
Real Estate Securities Risk – Risks associated with investment insecurities of companies in the real estate industry include: declines inthe value of real estate; risks related to local economic conditions,overbuilding and increased competition; increases in property taxesand operating expenses; changes in zoning laws; casualty orcondemnation losses; variations in rental income, neighborhoodvalues or the appeal of properties to tenants; changes in interest ratesand changes in general economic and market conditions.
Small and Medium Capitalization Company Risk – Securities ofsmall or medium capitalization companies are more likely toexperience sharper swings in market values, less liquid markets, inwhich it may be more difficult for the Adviser to sell at times and atprices that the Adviser believes appropriate and generally are morevolatile than those of larger companies.
Undervalued Stock Risk – The Fund may pursue strategies that mayinclude investing in securities, which, in the opinion of the Adviser,are undervalued. The identification of investment opportunities inundervalued securities is a difficult task and there is no assurance thatsuch opportunities will be successfully recognized or acquired. Whileinvestments in undervalued securities offer opportunities for above-average capital appreciation, these investments involve a high degreeof financial risk and can result in substantial losses.
The following are definitions of some of the terms used in this report:
Basis Point is a value equaling one one-hundredth of a percent (1/100of 1%).
Cash flow measures the cash generating capability of a company byadding non-cash charges (e.g. depreciation) and interest expense topretax income.
Capital Expenditure (capex) is funds used by a company to acquire,maintain and upgrade physical assets.
Capitalization rate (or “cap rate”) is the ratio between the netoperating income produced by an asset and its capital cost (theoriginal price paid to buy the asset) or alternatively its current marketvalue.
FTSE EPRA/NAREIT® Developed Index is an unmanaged indexdesigned to track the performance of publicly traded real estatecompanies, defined as the ownership, trading and development ofincome-producing real estate, in developed markets worldwide.
FTSE EPRA/NAREIT Global Real Estate Index is a total returnindex that is designed to represent general trends in eligible real estateequities worldwide.
FTSE The funds or securities referred to herein are not sponsored,endorsed, or promoted by the index providers, and the indexproviders bear no liability with respect to any such funds orsecurities or any index on which such funds or securities are based.The prospectus contains a more detailed description of the limitedrelationship the index providers have with the licensee and anyrelated funds.
89563_02_Alpine_AR.qxp_02 12/22/17 8:20 PM Page 9

Funds from Operations (FFO) refers to the figure used by REITs todefine cash flow from their operations.
MSCI REIT Index is a total return index comprising the mostactively traded real estate i Source: MSCI. MSCI data may not bereproduced or used for any other purpose. MSCI provides nowarranties, has not prepared or approved this report, and has noliability hereunder.
Net Operating Income is a calculation used to analyze real estateinvestments that generate income.
Real Estate Investment Trust (REIT) is a security that trades like astock on the major exchanges and invests in real estate directly, eitherthrough properties or mortgages. REITs receive special taxconsiderations and typically offer investors high yields, as well as ahighly liquid method of investing in real estate.
Sistema Especial de Liquidacao e Custodia (SELIC) is the BrazilianCentral Bank’s system for performing open market operations inexecution of monetary policy.
Yield Curve is a line that plots the interest rates, at a set point in time,of bonds having equal credit quality but differing maturity dates.
An investor cannot invest directly in an index.
This is a closed-end fund and does not continuously offer shares.
10
Manager Commentary (Continued)October 31, 2017
89563_02_Alpine_AR.qxp_02 12/22/17 8:20 PM Page 10

Annual Report | October 31, 2017 11
Manager Commentary (Continued)October 31, 2017
PERFORMANCE(1) As of October 31, 2017 (Unaudited) Ending Value Since
as of 10/31/17 1 Year 3 Years 5 Years 10 Years Inception(2)
Alpine Global Premier Properties Fund | NAV (3) $7.18 24.34% 7.35% 7.98% 1.31% 1.08%Alpine Global Premier Properties Fund | Market Price $6.48 35.59% 8.26% 7.00% 1.67% -0.36%FTSE EPRA/NAREIT Global Index 9.91% 5.04% 7.30% 2.06% 1.97%MSCI US REIT Index 5.56% 5.89% 9.54% 5.56% 4.43%
(1) Performance information calculated assuming reinvestment of dividends and distributions including returns of capital, if any.(2) Commenced operations on April 26, 2007. IPO price of $20 used in calculating performance information for the market price.(3) Performance at NAV includes fees and expenses.
To the extent that the Fund’s historical performance resulted from gains derived from participation in Initial Public Offerings (“IPOs”) and/orSecondary Offerings, there is no guarantee that these results can be replicated in future periods or that the Fund will be able to participate to thesame degree in IPO/Secondary Offerings in the future.
All figures represent past performance and are not a guarantee of future results. Investment returns and principal value of the Fund will fluctuateso that shares, when redeemed, may be worth more or less than their original cost. Current performance may be higher or lower than theperformance quoted. Call 1(800)617.7616 or visit www.alpinefunds.com for current month-end performance.
FTSE EPRA/NAREIT Global Index is a total return index that is designed to represent general trends in eligible real estate equities worldwide.
MSCI US REIT Index is a gross, total return, free float-adjusted market capitalization index that is comprised of equity REITs. The index is basedon MSCI USA Investable Market Index (IMI) its parent index which captures large, mid and small caps securities. With 144 constituents, it representsabout 99% of the US REIT universe and securities are classified in the REIT sector according to the Global Industry Classification Standard (GICS®).It however excludes mortgage REIT and selected specialized REITs. This index reinvests as much as possible of a company’s dividend distributions.The reinvested amount is equal to the total dividend amount distributed to persons residing in the country of the dividend-paying company. Grosstotal return indexes do not, however, include any tax credits. (Source: MSCI.) MSCI data may not be reproduced or used for any other purpose.MSCI provides no warranties, has not prepared or approved this report, and has no liability hereunder.
TOP 10 HOLDINGS* (unaudited)Colony NorthStar, Inc.-Class A 3.89% United StatesSumitomo Realty & Development
Co., Ltd. 3.24% JapanStarwood Property Trust, Inc. 2.63% United StatesEquinix, Inc. 2.27% United StatesADO Properties SA 2.26% GermanySimon Property Group, Inc. 2.22% United StatesUnibail-Rodamco SE 2.04% FranceWilliam Lyon Homes-Class A 2.00% United StatesTwo Harbors Investment Corp. 1.91% United StatesQTS Realty Trust, Inc.-Class A 1.89% United StatesTop 10 Holdings 24.35%
TOP 5 COUNTRIES* (unaudited)United States 37.5%Japan 13.0%Germany 7.1%Spain 6.1%France 6.1%
PORTFOLIO DISTRIBUTIONS* (Unaudited)
* Portfolio Distributions percentages are based on total investments. The Top 10 Holdings and Top 5 Countries do not include short-term investmentsand percentages are based on total net assets. Portfolio holdings and sector distributions are as of 10/31/17 and are subject to change. Portfolioholdings are not recommendations to buy or sell any securities.
0.3% - Mortgage/Finance3.9% - Industrials
5.5% - Office7.3% - Lodging
10.2% - Other
9.3% - Financials
12.9% - Retail
Residential - 28.1%
Diversified - 22.5%
89563_02_Alpine_AR.qxp_02 12/22/17 8:20 PM Page 11

12
Manager Commentary (Continued)October 31, 2017
REGIONAL ALLOCATION** As of October 31, 2017 (Unaudited)
** As a percentage of total investments, excluding any short-term investments.
NAV AND MARKET PRICE As of October 31, 2017 (Unaudited)
44.4% North America 31.4% Europe
1.2% Australia
20.9% Asia
2.1% South America
$4.50
$5.00
$5.50
$6.00
$6.50
$7.00
$7.50
$8.00
$8.50
Oct
31,
201
5
Dec
31,
201
5
Feb
29, 2
016
Apr
30,
201
6
Jun
30, 2
016
Aug
31,
201
6
Oct
31,
201
6
Dec
31,
201
6
Feb
28, 2
017
Oct
31,
201
7
Aug
31,
201
7
Jun
30, 2
017
Apr
30,
201
7
Market Price
NAV
89563_02_Alpine_AR.qxp_02 12/22/17 8:20 PM Page 12

Annual Report | October 31, 2017 13
Schedule of Portfolio InvestmentsOctober 31, 2017
Security Shares Description Value
Security Shares Description Value
EUROPE�28.3%Belgium-0.6% 58,333 VGP NV (a) $3,886,013
France-6.1% 210,222 Accor SA 10,489,306 50,000 Carmila SA 1,384,715 30,993 Kaufman & Broad SA 1,369,355 219,474 Klepierre SA 8,729,312 48,000 Nexity SA (a) 2,949,399 50,000 Unibail-Rodamco SE 12,513,396
37,435,483Germany-7.1% 281,160 ADO Properties SA (b) 13,824,159 1,463,317 Aroundtown SA 10,278,401 979,000 Dream Global Real Estate
Investment Trust 8,461,243 217,993 NorthStar Realty Europe Corp. 2,936,366 113,204 PATRIZIA Immobilien AG (a) 2,388,086 237,945 TLG Immobilien AG 5,507,370
43,395,625Ireland-4.0% 757,380 Dalata Hotel Group PLC (a) 4,719,951 4,800,000 Glenveagh Properties PLC (a)(b) 6,290,187 3,755,442 Green REIT PLC 6,605,532 4,057,500 Hibernia REIT PLC 6,971,406
24,587,076Italy-0.9% 525,028 COIMA RES SpA (b) 5,290,155
Netherlands-1.2% 58,855 InterXion Holding NV (a) 3,142,269 90,000 Wereldhave NV 4,090,194
7,232,463Norway-0.2% 75,000 Olav Thon Eiendomsselskap ASA 1,482,921
Spain-6.1% 319,770 Aedas Homes SAU (a)(b) 11,174,518 374,174 Hispania Activos Inmobiliarios
Socimi SA 6,452,854 563,045 Lar Espana Real Estate Socimi SA 5,524,987 525,000 Merlin Properties Socimi SA 6,928,816 361,756 Neinor Homes SA (a)(b) 7,435,449
37,516,624
COMMON STOCKS�90.2%
ASIA�18.9%China-1.9% 438,840 CapitaLand Retail China Trust $534,425 500,000 China Resources Land, Ltd. 1,490,117 2,200,000 China State Construction
International Holdings, Ltd. 3,090,727 1,800,000 China Vanke Co., Ltd.-Class H 6,402,697
11,517,966India-3.0% 4,163,536 DB Realty, Ltd. (a) 2,426,593 1,946,423 Prestige Estates Projects, Ltd. 9,219,562 787,492 The Phoenix Mills, Ltd. 6,418,234
18,064,389Japan-13.0% 1,000,309 Hulic Co., Ltd. 10,248,978 1,000 Hulic REIT, Inc. 1,393,958 2,819,999 Ichigo, Inc. 9,970,007 12,662 Invincible Investment Corp. 5,133,619 2,000 Japan Hotel REIT Investment Corp. 1,320,962 500,621 Mitsui Fudosan Co., Ltd. 11,561,767 225,000 Open House Co., Ltd. 8,627,589 216,372 Resorttrust, Inc. 4,234,006 300,000 Seibu Holdings, Inc. 5,326,943 600,000 Sumitomo Realty & Development
Co., Ltd. 19,867,200 342,000 Tokyu Fudosan Holdings Corp. 2,225,760
79,910,789United Arab Emirates-1.0% 2,800,000 Emaar Properties PJSC 6,320,232
TOTAL ASIA(Cost $116,670,415) 115,813,376
AUSTRALIA�1.0%Australia-1.0%
1,000,000 Goodman Group 6,398,325
TOTAL AUSTRALIA(Cost $6,391,745) 6,398,325
The accompanying notes are an integral part of these financial statements.
89563_02_Alpine_AR.qxp_02 12/22/17 8:20 PM Page 13

14
Schedule of Portfolio Investments (Continued)October 31, 2017
COMMON STOCKS �con�nued�United Kingdom-2.1% 1,400,000 Countryside Properties PLC (b) $6,608,343 33,635 IWG PLC 96,224 798,536 LondonMetric Property PLC 1,870,856 893,610 Purplebricks Group PLC (a) 4,317,160
12,892,583
TOTAL EUROPE(Cost $145,570,168) 173,718,943
NORTH & SOUTH AMERICA�42.0%Brazil-0.8% 440,310 Cyrela Commercial Properties SA
Empreendimentos e Participacoes 1,016,887 15,000 Cyrela Commercial Properties SA
Empreendimentos eParticipacoes-ADR (b) 133,157
1,329,807 Direcional Engenharia SA (a) 2,378,067 108,240 Sao Carlos Empreendimentos e Participacoes SA 1,350,642
4,878,753Chile-1.1% 2,255,723 Parque Arauco SA 6,517,833
Mexico-2.7% 5,326,924 Concentradora Fibra Hotelera
Mexicana SA de CV (b) 3,562,073 2,507,723 Corp. Inmobiliaria Vesta SAB de CV 3,100,032 8,045,154 Grupo GICSA SA de CV (a) 4,867,776 3,191,232 PLA Administradora Industrial S de RL de CV (a) 4,890,445
16,420,326
United States-37.4% 250,000 Altisource Residential Corp. $2,667,500 200,000 Arbor Realty Trust, Inc. 1,654,000 35,000 Boston Properties, Inc. 4,241,300 150,000 Brookdale Senior Living, Inc. (a) 1,504,500 33,000 Camden Property Trust 3,010,920 300,000 CBL & Associates Properties, Inc. 2,352,000 285,549 Century Communities, Inc. (a) 8,152,424 1,941,454 Colony NorthStar, Inc.-Class A 23,841,055 30,000 CoreSite Realty Corp. 3,322,500 110,000 CyrusOne, Inc. 6,752,900 30,000 Equinix, Inc. 13,905,000 304,639 Extended Stay America, Inc. 6,037,945 575,000 Five Point Holdings LLC-Class A (a) 7,388,750 550,000 GGP, Inc. 10,703,000 46,364 Hilton Worldwide Holdings, Inc. 3,351,190 5,209 Jones Lang LaSalle, Inc. 674,513 45,000 Kilroy Realty Corp. 3,205,350 150,000 Lennar Corp.-Class A 8,350,500 54,707 LGI Homes, Inc. (a) 3,300,473 326,196 NRG Yield, Inc.-Class A 5,985,697 100,000 NRG Yield, Inc.-Class C 1,860,000 2,885 NVR, Inc. (a) 9,466,752 51,739 Park Hotels & Resorts, Inc. 1,489,566 150,000 Pattern Energy Group, Inc. 3,460,500 200,000 PulteGroup, Inc. 6,046,000 200,000 QTS Realty Trust, Inc.-Class A 11,570,000 87,665 Simon Property Group, Inc. 13,617,005 15,000 SL Green Realty Corp. 1,435,200 750,944 Starwood Property Trust, Inc. 16,152,805 225,000 Taylor Morrison Home Corp.-
Class A (a) 5,433,750 482,411 TerraForm Power, Inc.-Class A 6,478,780 30,000 The Howard Hughes Corp. (a) 3,828,900 1,196,931 Two Harbors Investment Corp. 11,729,924 300,000 VEREIT, Inc. 2,367,000 250,000 Washington Prime Group, Inc. 1,957,500 441,771 William Lyon Homes-Class A (a) 12,259,145
229,554,344
TOTAL NORTH & SOUTH AMERICA(Cost $258,448,492) 257,371,256
Security Shares Description Value
Security Shares Description Value
The accompanying notes are an integral part of these financial statements.
89563_02_Alpine_AR.qxp_02 12/22/17 8:20 PM Page 14
Annual Report | October 31, 2017 15
Schedule of Portfolio Investments (Continued)October 31, 2017
The accompanying notes are an integral part of these financial statements.
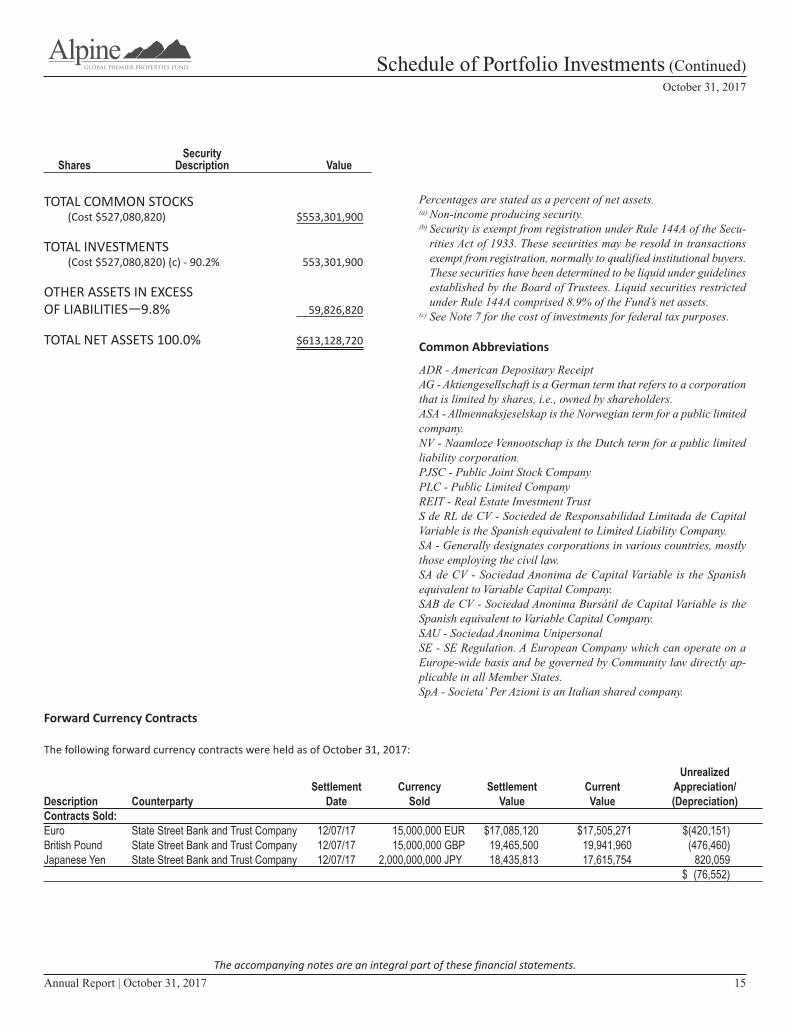
TOTAL COMMON STOCKS(Cost $527,080,820) $553,301,900
TOTAL INVESTMENTS(Cost $527,080,820) (c) - 90.2% 553,301,900
OTHER ASSETS IN EXCESSOF LIABILITIES�9.8% 59,826,820
TOTAL NET ASSETS 100.0% $613,128,720
Percentages are stated as a percent of net assets.(a) Non-income producing security.(b) Security is exempt from registration under Rule 144A of the Secu-
rities Act of 1933. These securities may be resold in transactionsexempt from registration, normally to qualified institutional buyers.These securities have been determined to be liquid under guidelinesestablished by the Board of Trustees. Liquid securities restrictedunder Rule 144A comprised 8.9% of the Fund’s net assets.
(c) See Note 7 for the cost of investments for federal tax purposes.
Common Abbrevia�ons
ADR - American Depositary ReceiptAG - Aktiengesellschaft is a German term that refers to a corporationthat is limited by shares, i.e., owned by shareholders.ASA - Allmennaksjeselskap is the Norwegian term for a public limitedcompany.NV - Naamloze Vennootschap is the Dutch term for a public limitedliability corporation.PJSC - Public Joint Stock CompanyPLC - Public Limited CompanyREIT - Real Estate Investment TrustS de RL de CV - Socieded de Responsabilidad Limitada de CapitalVariable is the Spanish equivalent to Limited Liability Company.SA - Generally designates corporations in various countries, mostlythose employing the civil law.SA de CV - Sociedad Anonima de Capital Variable is the Spanishequivalent to Variable Capital Company.SAB de CV - Sociedad Anonima Bursátil de Capital Variable is theSpanish equivalent to Variable Capital Company.SAU - Sociedad Anonima UnipersonalSE - SE Regulation. A European Company which can operate on aEurope-wide basis and be governed by Community law directly ap-plicable in all Member States.SpA - Societa’ Per Azioni is an Italian shared company.
Security Shares Description Value
Forward Currency Contracts
The following forward currency contracts were held as of October 31, 2017:
Unrealized Settlement Currency Settlement Current Appreciation/ Description Counterparty Date Sold Value Value (Depreciation)Contracts Sold:Euro State Street Bank and Trust Company 12/07/17 15,000,000 EUR $17,085,120 $17,505,271 $(420,151)British Pound State Street Bank and Trust Company 12/07/17 15,000,000 GBP 19,465,500 19,941,960 (476,460)Japanese Yen State Street Bank and Trust Company 12/07/17 2,000,000,000 JPY 18,435,813 17,615,754 820,059 $ (76,552)
89563_02_Alpine_AR.qxp_02 12/22/17 8:20 PM Page 15

The accompanying notes are an integral part of these financial statements.
Statement of Assets and LiabilitiesOctober 31, 2017
16
ASSETS:
Investments, at value(1) $553,301,900Cash 173,545,398Receivable from investment securities sold 35,243,566Dividends receivable 318,234Tax reclaim receivable 128,876Unrealized appreciation on forward currency contracts 820,059Prepaid expenses and other assets 58,885Total assets 763,416,918
LIABILITIES:
Payable for investment securities purchased 147,682,505Payable to custodian 855,203Unrealized depreciation on forward currency contracts 896,611Accrued expenses and other liabilities: Investment advisory fees (Note 4) 533,255 Trustee fees (Note 4) 13,089 Administration fees (Note 4) 41,466 Compliance fees 23,597 Other 242,472Total liabilities 150,288,198Net Assets $613,128,720
NET ASSETS REPRESENTED BY:
Paid-in-capital $696,633,536Distributions in excess of net investment income (7,833,737)Accumulated net realized loss from investments and foreign currency transactions (101,775,523)Net unrealized appreciation/(depreciation) on: Investments 26,221,080 Foreign currency translations (40,084) Forward currency contracts (76,552)Net Assets $613,128,720Net asset value Net assets $613,128,720 Shares of beneficial interest issued and outstanding 85,407,951 Net asset value per share $7.18
(1) Total cost of investments $527,080,820
89563_02_Alpine_AR.qxp_02 12/22/17 8:20 PM Page 16

Statement of OperationsFor the Year Ended October 31, 2017
Annual Report | October 31, 2017 17
INVESTMENT INCOME:
Dividend income $17,058,860Less: Foreign taxes withheld (717,508)Interest and other income (Note 9) 101,583Total investment income 16,442,935
EXPENSES:
Investment advisory fee (Note 4) 6,042,750Interest on loan (Note 8) 453,947Administration fee (Note 4) 130,835Printing and mailing fees 111,166NYSE fees 107,624Audit and tax fees 89,199Legal fees 70,254Trustee fees (Note 4) 53,344Accounting and custody fees 53,170Insurance fees 30,447Compliance fees 23,597Other fees 247,379Total expenses 7,413,712Net investment income 9,029,223
NET REALIZED AND UNREALIZED GAIN/(LOSS) ON INVESTMENTS, FOREIGN CURRENCY ANDFORWARD CURRENCY CONTRACTS:
Net realized gain from: Investments 88,392,349 Foreign currency transactions 16,520 Forward currency contracts 5,916,347Net realized gain from investments, foreign currency and forward currency contracts 94,325,216Change in net unrealized appreciation/(depreciation) on: Investments 19,980,006 Foreign currency translations (7,813) Forward currency contracts (3,743,530)Change in net unrealized appreciation on investments, foreign currency and forward currency contracts 16,228,663Net gain on investments, foreign currency and forward currency contracts 110,553,879Increase in net assets from operations $119,583,102
The accompanying notes are an integral part of these financial statements.
89563_02_Alpine_AR.qxp_02 12/22/17 8:20 PM Page 17

Statements of Changes in Net Assets
18
The accompanying notes are an integral part of these financial statements.
For the For the Year Ended Year Ended October 31, 2017 October 31, 2016OPERATIONS:
Net investment income $9,029,223 $14,844,500Net realized gain (loss) from: Investments 88,392,349 24,157,271 Foreign currency transactions 16,520 (180,490) Forward currency contracts 5,916,347 (4,435,162)Change in net unrealized appreciation/(depreciation) on: Investments 19,980,006 (61,776,356) Foreign currency translations (7,813) (16,589) Forward currency contracts (3,743,530) 3,717,946Increase (decrease) in net assets from operations 119,583,102 (23,688,880)
DISTRIBUTIONS TO COMMON SHAREHOLDERS (NOTE 5):
From net investment income (51,244,771) (30,878,905)From tax return of capital — (20,365,866)Decrease in net assets from distributions to shareholders (51,244,771) (51,244,771)Net increase (decrease) in net assets 68,338,331 (74,933,651)Net Assets: Beginning of year 544,790,389 619,724,040 End of year* $613,128,720 $544,790,389
CAPITAL SHARE TRANSACTIONS:
Common shares outstanding – beginning of year 85,407,951 85,407,951Common shares outstanding – end of year 85,407,951 85,407,951
* Including distributions in excess of net investment income of: $(7,833,737) $(11,507,296)
89563_02_Alpine_AR.qxp_02 12/22/17 8:20 PM Page 18

Financial Highlights(For a share outstanding throughout each year)
Annual Report | October 31, 2017 19
The accompanying notes are an integral part of these financial statements.
Years Ended October 31, 2017 2016 2015† 2014† 2013†PER COMMON SHARE OPERATING PERFORMANCE:Net asset value per share, beginning of year $6.38 $7.26 $7.82 $8.17 $7.75Income from investment operations: Net investment income 0.11 0.17 0.14 0.22 0.34 Net realized and unrealized gain (loss) 1.29 (0.45) (0.11) 0.03 0.68Total from investment operations 1.40 (0.28) 0.03 0.25 1.02
LESS DISTRIBUTIONS:
Net investment income (0.60) (0.36) (0.53) (0.32) (0.45)Tax return of capital — (0.24) (0.07) (0.28) (0.15)Total distributions (0.60) (0.60) (0.60) (0.60) (0.60)Anti-Dilutive effect of share repurchase program — — 0.01 — —Net asset value per share, end of year $7.18 $6.38 $7.26 $7.82 $8.17Per share market value, end of year $6.48 $5.28 $6.14 $6.88 $7.47
Total return based on: Net Asset Value(a) 24.34% (2.18)% 1.71% 4.06% 14.04% Market Value(a) 35.59% (4.28)% (2.23)% 0.13% 10.40%
RATIOS/SUPPLEMENTAL DATA:
Net Assets at end of year (000) $613,129 $544,790 $619,724 $672,125 $702,414Ratio of total expenses to average net assets(b) 1.28% 1.33% 1.28% 1.29% 1.33%Ratio of net investment income to average net assets 1.56% 2.61% 1.86% 2.75% 4.11%Portfolio turnover 61% 40% 41% 58% 49%
Borrowing at End of yearAggregate Amount Outstanding (000) N/A $12,602 $53,158 $15,216 $38,542Asset Coverage Per $1,000 (000) N/A $44,230 $12,658 $45,171 $19,224
† Beginning with the year ended October 31, 2015, the Fund was audited by Ernst & Young LLP. The previous years were audited by another inde-pendent registered public accounting firm.
(a) Total investment return is calculated assuming a purchase of a common share at the opening on the first day and a sale at closing on the last dayof each period reported. Dividends and distributions, if any, are assumed for purposes of this calculation to be reinvested at prices obtained underthe Fund’s dividend reinvestment plan. Total investment returns do not reflect brokerage commissions paid directly by the Fund’s common share-holders. Past performance is not a guarantee of future results.
(b) Ratio of total expenses to average net assets excluding interest expense was 1.20%, 1.24%, 1.22%, 1.23% and 1.26% for the years ended October31, 2017, 2016, 2015, 2014 and 2013, respectively.
89563_02_Alpine_AR.qxp_02 12/22/17 8:20 PM Page 19

20
Notes to Financial StatementsOctober 31, 2017
1. Organization:
Alpine Global Premier Properties Fund (the “Fund”) is a diversified,closed-end management investment company. The Fund wasorganized as a Delaware statutory trust on February 13, 2007, andhad no operating history prior to April 26, 2007. The Board ofTrustees (the “Board”) authorized an unlimited number of shareswith no par value. The Fund’s primary investment objective is capitalappreciation. The Fund’s secondary investment objective is highcurrent income.
The Fund is an investment company and accordingly follows theinvestment company accounting and reporting guidance of theFinancial Accounting Standards Board (“FASB”) Accounting StandardsCodification Topic (“ASC”) 946 Financial Services - InvestmentCompanies.
2. Significant Accounting Policies:
The following is a summary of significant accounting policiesconsistently followed by the Fund in the preparation of its financialstatements. The policies are in conformity with accounting principlesgenerally accepted in the United States of America (“GAAP”), whichrequire management to make estimates and assumptions that affectamounts reported herein. Actual results could differ from thoseestimates. Changes in the economic environment, financial marketsand any other parameters used in determining these estimates couldcause actual results to differ.
A. Valuation of Securities:
The net asset value (“NAV”) of shares of the Fund is calculated bydividing the value of the Fund’s net assets by the number ofoutstanding shares. NAV is determined each day the New York StockExchange (“NYSE”) is open as of the close of regular trading(normally, 4:00 p.m., Eastern Time). In computing NAV, portfoliosecurities of the Fund are valued at their current fair valuesdetermined on the basis of market quotations or if market quotationsare not readily available or determined to be unreliable, throughprocedures and/or guidelines established by the Board. In computingthe Fund’s NAV, equity securities that are traded on a securitiesexchange in the United States, except for those listed on NASDAQGlobal Market, NASDAQ Global Select Market and NASDAQ CapitalMarket exchanges (collectively, “NASDAQ”) and option securities arevalued at the last reported sale price as of the time of valuation.Securities traded on NASDAQ will be valued at the NASDAQ OfficialClosing Prices (“NOCP”). If, on a particular day, an exchange tradedor NASDAQ security does not trade, then the mean between themost recent quoted bid and asked prices will be used. For equityinvestments traded on more than one exchange, the last reportedsale price on the exchange where the stock is primarily traded isused. Equity-linked structured notes are valued by referencing thelast reported sale or settlement price of the underlying security on
the day of valuation. Foreign exchange adjustments are applied tothe last reported price to convert the underlying security’s tradingcurrency to the equity-linked structured note’s settlement currency.Each option security traded on a securities exchange in the UnitedStates is valued at the last current reported sales price as of the timeof valuation if the last current reported sales price falls within theconsolidated bid/ask quote. If the last current reported sale pricedoes not fall within the consolidated bid/ask quote, the security isvalued at the mid-point of the consolidated bid/ask quote for theoption security. Forward currency contracts are valued based onthird-party vendor quotations. Each security traded in the over-the-counter market and quoted on the NASDAQ National Market Systemis valued at the NOCP, as determined by NASDAQ, or lacking anNOCP, the last current reported sale price as of the time of valuationby NASDAQ, or lacking any current reported sale on NASDAQ at thetime of valuation, at the mean between the most recent bid andasked quotations. Each over-the-counter option that is not tradedthrough the Options Clearing Corporation is valued by thecounterparty of the option, or if the counterparty’s price is notreadily available, then by using the Black-Scholes method. Debt andshort-term securities are valued based on an evaluated bid price asfurnished by pricing services approved by the Board, which may bebased on market transactions for comparable securities and variousrelationships between securities that are generally recognized byinstitutional traders, a computerized matrix system, or appraisalsderived from information concerning the securities or similarsecurities received from recognized dealers in those securities. Eachother security traded over-the-counter is valued at the meanbetween the most recent bid and asked quotations.
Securities that are principally traded in a foreign market are valuedat the last current sale price at the time of valuation or lacking anycurrent or reported sale, at the time of valuation, at the meanbetween the most recent bid and asked quotations as of the closeof the appropriate exchange or other designated time. Trading insecurities on European and Far Eastern securities exchanges andover-the-counter markets is normally completed at various timesbefore the close of business on each day on which the NYSE is open.Trading of these securities may not take place on every NYSE businessday. In addition, trading may take place in various foreign markets onSaturdays or on other days when the NYSE is not open and on whichthe Fund’s NAV is not calculated.
When market quotations are not readily available or when thevaluation methods mentioned above are not reflective of a fair valueof the security, the security is valued at fair value followingprocedures and/or guidelines approved by the Board. The Fund mayalso use fair value pricing, if the value of a security it holds is,pursuant to the Board guidelines, materially affected by eventsoccurring before the Fund’s NAV is calculated but after the close ofthe primary market or market transactions for comparable securitiesand various relationships between securities that are generallyrecognized by institutional traders, a computerized matrix system, or
89563_02_Alpine_AR.qxp_02 12/22/17 8:20 PM Page 20

Annual Report | October 31, 2017 21
Notes to Financial Statements (Continued)October 31, 2017
appraisals derived from information concerning the securities orsimilar securities received from recognized dealers in thosesecurities. The Board has approved the use of a third-party pricingvendor’s proprietary fair value pricing model to assist in determiningcurrent valuation for foreign equities and over-the-counterderivatives traded in markets that close prior to the NYSE. When fairvalue pricing is employed, the value of the portfolio security used tocalculate the Fund’s NAV may differ from quoted or official closingprices. The Fund may also fair value a security if the Fund or Adviserbelieves that the market price is stale. Other types of securities thatthe Fund may hold for which fair value pricing might be requiredinclude illiquid securities including restricted securities and privateplacements for which there is no public market.
For securities valued by the Fund, valuation techniques are used tomeasure fair value that are consistent with the market approachand/or income approach, depending on the type of security and theparticular circumstance. The market approach uses prices and otherrelevant information generated by market transactions involvingcomparable securities. The income approach uses valuationtechniques to discount estimated future cash flows to present value.
The Board of Trustees adopted procedures which utilize fair valueprocedures when any assets for which reliable market quotations arenot readily available or for which the Fund’s pricing service does notprovide a valuation or provides a valuation that in the judgment ofthe Adviser does not represent fair value. The Board of Trustees hasestablished a Valuation Committee which is responsible for: (1)monitoring the valuation of Fund securities and other investments;and (2) as required, when the Board of Trustees is not in session,reviewing and approving the fair value of illiquid and other holdingsafter consideration of all relevant factors, which determinations arereported to the Board of Trustees.
Fair Value Measurement:
In accordance with FASB ASC 820, “Fair Value Measurement” (“ASC820”), defines fair value as the value that the Fund would receive tosell an investment or pay to transfer a liability in a timely transactionwith an independent buyer in the principal market, or in the absenceof a principal market the most advantageous market for theinvestment or liability. ASC 820 uses a three-tier hierarchy to
establish classification of fair value measurements for disclosurepurposes. Inputs refer broadly to the assumptions that marketparticipants would use in pricing the asset or liability, includingassumptions about risk. Inputs may be observable or unobservable.Observable inputs are inputs that reflect the assumptions marketparticipants would use in pricing the asset or liability that aredeveloped based on market data obtained from sources independentof the reporting entity. Unobservable inputs are inputs that reflectthe reporting entities’ own assumptions about the assumptionsmarket participants would use in pricing the asset or liability that aredeveloped based on the best information available.
Level 1 - Unadjusted quoted prices in active markets for identicalinvestments.
Level 2 - Other significant observable inputs (including quoted pricesfor similar instruments, interest rates, prepayment speeds,credit risk, yield curves, default rates, etc.).
Level 3 - Significant unobservable inputs (including the Fund’s ownassumptions in determining the fair value of investments).
The availability of observable inputs can vary from security to securityand is affected by a wide variety of factors, including, for example, thetype of security, whether the security is new and not yet establishedin the marketplace, the liquidity of markets, and other characteristicsparticular to the security. To the extent that valuation is based onmodels or inputs that are less observable or unobservable in themarket, the determination of fair value requires more judgment.Accordingly, the degree of judgment exercised in determining fairvalue is greatest for instruments categorized in Level 3.
The inputs used to measure fair value may fall into different levels ofthe fair value hierarchy. In such cases, for disclosure purposes, thelevel in the fair value hierarchy within which the fair valuemeasurement falls, is determined based on the lowest level inputthat is significant to the fair value measurement in its entirety.
Various inputs are used in determining the value of the Fund’sinvestments as of the reporting period end. The designated inputlevels are not necessarily an indication of the risk or liquidityassociated with these investments. These inputs are categorized inthe following hierarchy under ASC 820.
89563_02_Alpine_AR.qxp_02 12/22/17 8:20 PM Page 21

22
Notes to Financial Statements (Continued)October 31, 2017
B. Security Transactions and Investment Income:
Security transactions are accounted for on a trade date basis.Realized gains and losses are computed on the identified cost basis.Dividend income is recorded on the ex-dividend date or in the caseof some foreign securities, on the date thereafter when the Fund ismade aware of the dividend. Upon notification from issuers, someof the dividend income received from a real estate investment trustmay be redesignated as a reduction of cost of the related investmentand/or realized gain. Interest income is recorded on the accrual basisand includes accretion of discounts and amortization of premiums,where applicable. To the extent any issuer defaults or a credit eventoccurs that impacts the issuer, the Fund may halt any additionalinterest income accruals and consider the realizability of interestaccrued up to the date of default or credit event.
C. Federal and Other Income Taxes:
It is the Fund’s policy to comply with the Federal income and excisetax requirements of the Internal Revenue Code of 1986 (the “Code”),as amended, applicable to regulated investment companies and totimely distribute all of its investment company taxable income andnet realized capital gains to shareholders in accordance with thetiming requirements imposed by the Code. Therefore, no Federalincome tax provision is required. Capital gains realized on someforeign securities are subject to foreign taxes. Dividends and interestfrom non-U.S. sources received by the Fund are generally subject tonon-U.S. withholding taxes at rates ranging up to 30%. Such capitalgains and withholding taxes, which are accrued as applicable, maybe reduced or eliminated under the terms of applicable U.S. incometax treaties, and the Fund intends to undertake procedural steps toclaim the benefits of such treaties. Where available, the Fund will filerefund claims for foreign taxes withheld.
FASB (ASC 740-10) “Income Taxes” - overall sets forth a minimumthreshold for financial statement recognition of the benefit of a taxposition taken or expected to be taken in a tax return. Managementhas analyzed the Fund’s tax positions taken on income tax returns
for all open tax years and has concluded that as of October 31, 2017,no provision for income tax is required in the Fund’s financialstatements. The Fund’s Federal and state income and Federal excisetax returns for tax years for which the applicable statutes oflimitations have not expired are subject to examination by theInternal Revenue Service and state departments of revenue. As ofOctober 31, 2017, open Federal and New York tax years include thetax years ended October 31, 2014 through 2017. Also, the Fund hasrecognized no interest and penalties related to uncertain tax benefits.The Fund is also not aware of any tax positions for which it isreasonably possible that the total amounts of unrecognized taxbenefits will significantly change in the next twelve months.
Foreign taxes withheld, if any, represent amounts withheld by foreigntax authorities, net of refunds recoverable. Foreign capital gains oncertain foreign securities may be subject to foreign taxes, which areaccrued as applicable. As of October 31, 2017, there were nooutstanding balances of accrued capital gains taxes for the Fund.
D. Distributions to Shareholders:
On July 5, 2011, the Fund, acting in accordance with an exemptiveorder received from the SEC and with approval of the Board, adopteda level distribution policy under which the Fund intends to makeregular monthly cash distributions to common shareholders, statedin terms of a fixed amount per common share. With this policy, theFund can include long-term capital gains in its distribution asfrequently as twelve times a year. The Board views approval of thispolicy as a potential means of further supporting the market priceof the Fund through the payment of a steady and predictable levelof cash distributions to shareholders.
The level distribution rate may be modified or eliminated by theBoard from time to time. If a monthly distribution exceeds the Fund’smonthly estimated investment company taxable income (which mayinclude net short-term capital gain) and net tax exempt income, theexcess could result in a tax-free return of capital distribution fromthe Fund’s assets. The determination of a tax-free return of capital is
The following is a summary of the inputs used to value the Fund’s assets and liabilities carried at fair value as of October 31, 2017:
Valuation InputsInvestments in Securities at Value* Level 1 Level 2 Level 3 Total ValueCommon Stocks $ 553,301,900 $ — $ — $ 553,301,900Total $ 553,301,900 $ — $ — $ 553,301,900
Valuation InputsOther Financial Instruments Level 1 Level 2 Level 3 Total ValueAssets
Forward Currency Contracts $ — $ 820,059 $ — $ 820,059Liabilities
Forward Currency Contracts — (896,611) — (896,611)Total $ — $ (76,552) $ — $ (76,552)
* For detailed industry descriptions, see accompanying Schedule of Portfolio Investments.
89563_02_Alpine_AR.qxp_02 12/22/17 8:20 PM Page 22

Annual Report | October 31, 2017 23
Notes to Financial Statements (Continued)October 31, 2017
made on an annual basis as further described below. The Fund’s finaldistribution for each calendar year will include any remaininginvestment company taxable income and net tax exempt incomeundistributed during the year, as well as all net capital gains, if any,realized during the year. If the total distributions made in any fiscalyear exceed annual investment company taxable income, net taxexempt income and net capital gain, such excess distributed amountwould be treated as ordinary dividend income to the extent of theFund’s current and accumulated earnings and profits. Distributionsin excess of the accumulated investment company taxable income,net tax-exempt income and net capital gain would first be a tax-freereturn of capital to the extent of the adjusted tax basis in the shares.After such adjusted tax basis is reduced to zero, the distributionwould constitute capital gain (assuming the shares are held as capitalassets). Distributions to shareholders are recorded by the Fund onthe ex-dividend date and are determined in accordance with incometax regulations, which may differ from GAAP.
The current monthly distribution rate is $0.05 per share. The Boardcontinues to evaluate its monthly distribution policy in the light ofongoing economic and market conditions and may change theamount of the monthly distributions in the future.
E. Foreign Currency Translation Transactions:
The Fund may invest in foreign securities. In the event that the Fundexecutes a foreign security transaction, the Fund will generally enterinto a forward foreign currency contract to settle the foreign securitytransaction. The Fund does not isolate the portion of each portfolioinvested in foreign securities of its net realized and unrealized gainsand losses on investments resulting from changes in foreign exchangerates from the impact arising from changes in market process. Suchfluctuations are included with net realized and unrealized gain or lossfrom investments. Net realized foreign currency transaction gainsand losses arise from sales of foreign currencies, currency gains orlosses realized between the trade and settlement dates on securitiestransactions, and the differences between the amounts of dividends,interest and foreign withholding taxes recorded on the Fund’s booksand the U.S. dollar equivalent of the amounts actually received orpaid. Net unrealized foreign currency translation gains and lossesarise from changes in the value of assets and liabilities, other thaninvestments in securities, resulting from changes in the exchangerates. The books and records of the Fund are maintained in U.S.dollars. Non-U.S. dollar-denominated amounts are translated intoU.S. dollars as follows, with the resultant translation gains and lossesrecorded in the Statement of Operations:
i) fair value of investment securities and other assets andliabilities at the exchange rate on the valuation date.
ii) purchases and sales of investment securities, income andexpenses at the exchange rate prevailing on the respectivedate of such transactions.
F. Risks Associated with Foreign Securities and Currencies:
Investments in securities of foreign issuers carry certain risks notordinarily associated with investments in securities of domestic issuers.Such risks include future political and economic developments and thepossible imposition of exchange controls or other foreigngovernmental laws and restrictions. In addition, with respect to certaincountries, there is a possibility of expropriation of assets, confiscatorytaxation, political or social instability or diplomatic developments,which could adversely affect investments in those countries. Generally,when the U.S. dollar rises in value against a foreign currency, the Fund’sinvestments denominated in that currency will lose value because thatcurrency is worth fewer U.S. dollars; the opposite effect occurs if theU.S. dollar falls in relative value.
Certain countries may also impose substantial restrictions oninvestments in their capital markets by foreign entities, includingrestrictions on investments in issuers or industries deemed sensitiveto relevant national interests. These factors may limit the investmentopportunities available to the Fund or result in a lack of liquidity andhigh price volatility with respect to securities of issuers fromdeveloping countries.
G. Equity-Linked Structured Notes:
The Fund may invest in equity-linked structured notes. Equity-linkedstructured notes are securities which are specially designed tocombine the characteristics of one or more underlying securities andtheir equity derivatives in a single note form. The return and/or yieldor income component may be based on the performance of theunderlying equity securities, and equity index, and/or optionpositions. Equity-linked structured notes are typically offered inlimited transactions by financial institutions in either registered ornon-registered form. An investment in equity-linked structured notescreates exposure to the credit risk of the issuing financial institution,as well as to the market risk of the underlying securities. There is noguaranteed return of principal with these securities and theappreciation potential of these securities may be limited by amaximum payment or call right. In certain cases, equity-linkedstructured notes may be more volatile and less liquid than complexsecurities or other types of fixed-income securities. Such securitiesmay exhibit price behavior that does not correlate with other fixed-income securities. The Fund did not hold equity-linked structurednotes as of October 31, 2017.
H. Forward Currency Contracts:
The Fund is subject to foreign currency exchange rate risk in thenormal course of pursuing its investment objective. The Fund mayuse forward currency contracts to gain exposure to or economicallyhedge against changes in the value of foreign currencies. A forwardcurrency contract (“forward”) is an agreement between two partiesto buy and sell a currency at a set price on a future date. The market
89563_02_Alpine_AR.qxp_02 12/22/17 8:20 PM Page 23

Notes to Financial Statements (Continued)October 31, 2017
24
value of the forward contract fluctuates with changes in forwardcurrency exchange rates. The forward contract is marked-to-marketdaily and the change in market value is recorded by the Fund asunrealized appreciation or depreciation. When the forward contractis closed, a Fund records a realized gain or loss equal to thefluctuation in value during the period the forward contract was open.A Fund could be exposed to risk if a counterparty is unable to meetthe terms of a forward or if the value of the currency changesunfavorably. The Fund’s forward contracts are not subject to a masternetting agreement or similar agreement. The Fund entered intoforward currency contracts during the reporting period toeconomically hedge against changes in the value of foreigncurrencies. During the year ended October 31, 2017, the Fundentered into fourteen forward contracts. The average monthlyprincipal amount for forward contracts held by the Fund throughoutthe period was $87,672,005. This is based on amounts held as ofeach month-end throughout the year. Forward currency contractsoutstanding at year end, if any, are listed after the Fund’s Scheduleof Investments.
I. Derivative Instruments:
The following tables provide information about the effect ofderivatives on the Fund’s Statement of Assets and Liabilities andStatement of Operations as of and for the year ended October 31,2017. The first table provides additional detail about the amounts andsources of unrealized appreciation/(depreciation) on derivatives atthe end of the year. The second table provides additional informationabout the amounts and sources of net realized gain/(loss) and thechange in net unrealized appreciation/(depreciation) resulting fromthe Fund’s derivatives during the year.
The effect of derivative instruments in the Statement of Assets andLiabilities as of October 31, 2017:
Unrealized Statement of Assets Appreciation/Derivatives and Liabilities Location (Depreciation)Forward CurrencyContractsForeign exchange Unrealized appreciation onrisk forward currency contracts $ 820,059
Foreign exchange Unrealized depreciation onrisk forward currency contracts $(896,611)
The effect of derivative instruments in the Statement of Operationsfor the year ended October 31, 2017:
Statement of Change in Operations Net Realized Net Unrealized Derivatives Location Gain DepreciationForwardCurrencyContractsForeign Net realized gain/(loss)exchange from forward currency risk contracts $5,916,347
Foreign Change in net unrealizedexchange appreciation/(depreciation)risk on forward currency contracts $(3,743,530)
3. Purchases and Sales of Securities:
Purchases and sales of securities (excluding short-term securities) forthe year ended October 31, 2017 are as follows:
Purchases Sales$ 364,777,352 $ 458,240,182
The Fund did not have purchases and sales of U.S. GovernmentObligations during the year ended October 31, 2017.
4. Investment Advisory Agreement, AdministrationAgreement and Other Affiliated Transactions:
Alpine Woods Capital Investors, LLC (“Alpine Woods”) serves as theFund’s investment adviser pursuant to an Investment AdvisoryAgreement with the Fund. As compensation for its services to theFund, Alpine Woods receives an annual investment advisory fee of1.00% based on the Fund’s average daily Managed Assets, computeddaily and payable monthly. Managed Assets is defined as being“equal to the net asset value of the Fund’s common shares plus theprincipal amount of any borrowings for investment purposes that areoutstanding and the liquidation preference of any preferred shares.”
State Street Bank and Trust Company (“SSBT”) serves as thecustodian and fund accounting agent. The custodian is responsiblefor the safekeeping of the assets of the Fund and the fund accountingagent is responsible for calculating the Fund’s NAV. SSBT, as theFund’s custodian and fund accounting agent, is paid on the basis ofnet assets and transaction costs of the Fund. SSBT also serves as theadministrator for the Fund. SSBT, as the Fund’s administrator, is paidon the basis of net assets of the Fund.
Boston Financial Data Services, Inc. (“BFDS”) serves as the transferagent to the Fund. BFDS is paid on the basis of net assets, per accountfees and certain transaction costs.
89563_02_Alpine_AR.qxp_02 12/22/17 8:20 PM Page 24

Annual Report | October 31, 2017 25
Notes to Financial Statements (Continued)October 31, 2017
Certain officers and trustees of the Funds are also officers and/ortrustees of the Adviser. No interested trustee, who is deemed aninterested person due to current or former service with the Adviseror an affiliate of the Adviser, receives compensation from the Funds.
5. Capital Transactions:
During the year ended October 31, 2016 and October 31, 2017, therewere no shares repurchased.
6. Concentration of Risk:
The Fund invests a substantial amount of their assets in the equitysecurities of issuers engaged in the real estate industry, including realestate investment trusts (REITs). As a result, the Fund may be moreaffected by economic developments in the real estate industry thanwould a general equity fund.
7. Income Tax Information:
GAAP requires that certain components of net assets be reclassifiedto reflect permanent differences between financial and tax reporting.These reclassifications have no effect on net assets or net asset valueper share of the Fund.
Classification of Distributions:
Net investment income/(loss) and net realized gain/(loss) may differfor financial statement and tax purposes. The character ofdistributions made during the year from net investment income ornet realized gains may differ from its ultimate characterization forFederal income tax purposes.
The tax character of the distributions paid by the Fund during theyear ended October 31, 2017 were as follows:
Distributions paid from:Ordinary Income $51,244,771Total $51,244,771
Tax components of distributable earnings are determined inaccordance with income tax regulations which may differ from thecomposition of net assets reported under GAAP. GAAP requires thatcertain components of net assets be reclassified to reflect permanentdifferences between financial reporting and tax reporting. Thepermanent differences are primarily due to differing treatment ofgains (losses) related to foreign currency transactions, expired capitalloss carryforward, tax treatment of spin-offs, and taxableoverdistributions. Accordingly, for the year ended October 31, 2017,the effect of certain differences were reclassified. The Fund increasedaccumulated net investment by $45,889,107 and increasedaccumulated net realized loss by $281,308,854, and decreased paidin capital by $327,197,961. These differences were primarily due to
the differing tax treatment of foreign currency and certain otherinvestments. Net assets of the Fund were unaffected by thereclassifications.
As of October 31, 2017, the Fund utilized $72,743,304 of capital losscarryovers. As of October 31, 2017, the Fund had available for taxpurposes unused capital loss carryovers of $67,561,774. As of October31, 2018, the Fund had available for tax purposes unused capital losscarryovers of $32,169,593. During the year ended October 31, 2017,the Fund expired $296,867,529 of capital loss carryovers.
Under the Regulated Investment Company (“RIC”) Modernization Actof 2010, post-enactment capital losses that are carried forward willretain their character as either short-term or long-term capital lossesrather than being considered all short-term as under previous law.However, any losses incurred during those future taxable years willbe required to be utilized prior to the losses incurred in pre-enactment taxable years, which carry an expiration date. As a resultof this ordering rule, pre-enactment capital loss carryovers may bemore likely to expire unused.
As of October 31, 2017, the components of distributable earnings ona tax basis were as follows:
Accumulated capital loss $(99,731,367)Unrealized appreciation 16,226,528Total $(83,504,839)
As of October 31, 2017 net unrealized appreciation/(depreciation)of investments, excluding foreign currency, based on Federal tax costswas as follows:
Gross Gross Net unrealized Cost of unrealized unrealized appreciation/
investments appreciation depreciation (depreciation)$537,200,019 $57,377,124 $(41,150,602) $16,226,522
The differences between book and tax net unrealized appreciationand cost were primarily due to deferral of losses from wash sales andto the different tax treatment of certain other investments.
8. Line of Credit:
On December 1, 2010, the Fund entered into a lending agreementwith BNP Paribas Prime Brokerage International Ltd. (“BNPP PB”)which allows the Fund to borrow on an uncommitted and securedbasis. The terms of the lending agreement indicate the rate to be theFederal Funds rate plus 0.95% per annum on amounts borrowed. TheBNPP PB facility provides a secured, uncommitted line of credit forthe Fund where selected Fund assets are pledged against advancesmade to the Fund. The Fund has granted a security interest in allpledged assets used as collateral to the BNPP PB facility. The Fund ispermitted to borrow up to 33.33% of the total assets for
89563_02_Alpine_AR.qxp_02 12/22/17 8:20 PM Page 25
26
extraordinary or emergency purposes. Additionally the Fund ispermitted to borrow up to 10% of the managed assets for investmentpurposes, but in no event shall outstanding borrowings exceed33.33% of total assets. On October 31, 2017, the amount availablefor investment purposes was $76,341,692. Either BNPP PB or theFund may terminate this agreement upon delivery of written notice.During the year ended October 31, 2017, the average borrowing bythe Fund was $23,797,553 with an average rate on borrowings of1.88%. During the year ended October 31, 2017, the maximumborrowing by the Fund was $44,385,628. Interest expense related tothe line of credit for the year ended October 31, 2017 was $453,947.As of October 31, 2017, there was no loan outstanding for the Fund.
9. Other Income:
Other income of $95,611 is recognized by the Fund as a result of aclass action settlement related to improper foreign exchangecontract transactions conducted the Fund’s former Custodian.
10. Subsequent Events:
Distributions: The Fund paid a distribution of $4,270,398 or $0.05per common share on November 30, 2017 to common shareholdersof record on November 22, 2017.
The Fund will also pay a distribution of $4,270,398 or $0.05 percommon share payable on December 29, 2017 to commonshareholders of record on December 21, 2017.
At a meeting held December 14th, 2017 the Board of Trustees hasapproved a new investment advisory agreement with AberdeenAsset Managers Limited (“AAML”) and subadvisory agreement withAberdeen Asset Management Inc. ("AAMI"), subject to approval byeach Fund's shareholders of the investment advisory agreement. Ifshareholders approve the new investment advisory and subadvisoryagreements, AAML will become the investment adviser and AAMIwill become the subadviser of the Fund and will assumeresponsibility for the design and implementation of the Fund'sinvestment program.
A special meeting of shareholders of the Fund is scheduled to be heldon March 14, 2018 (the “Special Meeting”) to consider the new advisoryarrangements at which shareholders of record on December 14, 2017will be entitled to vote.
Notes to Financial Statements (Continued)October 31, 2017
89563_02_Alpine_AR.qxp_02 12/22/17 8:20 PM Page 26

Annual Report | October 31, 2017 27
Report of Independent Registered Public Accounting FirmOctober 31, 2017
To the Shareholders and Board of Trustees ofAlpine Global Premier Properties Fund:
We have audited the accompanying statement of assets and liabilities, including the portfolio of investments, of Alpine Global Premier PropertiesFund (the “Fund”) as of October 31, 2017, and the related statement of operations for the year then ended, the statements of changes in netassets for each of the two years in the period then ended and the financial highlights for each of the three years in the period then ended. Thesefinancial statements and financial highlights are the responsibility of the Fund’s management. Our responsibility is to express an opinion on thesefinancial statements and financial highlights based on our audits. The financial highlights for each of the two years in the period ended October 31,2014 were audited by another independent registered public accounting firm whose report, dated December 29, 2014, expressed an unqualifiedopinion on those financial statements and financial highlights.
We conducted our audits in accordance with the standards of the Public Company Accounting Oversight Board (United States). Those standardsrequire that we plan and perform the audit to obtain reasonable assurance about whether the financial statements and financial highlights arefree of material misstatement. We were not engaged to perform an audit of the Fund’s internal control over financial reporting. Our audits includedconsideration of internal control over financial reporting as a basis for designing audit procedures that are appropriate in the circumstances, butnot for the purpose of expressing an opinion on the effectiveness of the Fund’s internal control over financial reporting. Accordingly, we expressno such opinion. An audit also includes examining, on a test basis, evidence supporting the amounts and disclosures in the financial statementsand financial highlights, assessing the accounting principles used and significant estimates made by management, and evaluating the overallfinancial statement presentation. Our procedures included confirmation of securities owned as of October 31, 2017, by correspondence with thecustodian and others or by other appropriate auditing procedures where replies from others were not received. We believe that our audits providea reasonable basis for our opinion.
In our opinion, the financial statements and financial highlights referred to above present fairly, in all material respects, the financial position ofthe Alpine Global Premier Properties Fund at October 31, 2017, the results of its operations for the year then ended, the changes in its net assetsfor each of the two years in the period then ended, and the financial highlights for each of the three years in the period then ended in conformitywith U.S. generally accepted accounting principles.
New York, NYDecember 22, 2017
89563_02_Alpine_AR.qxp_02 12/22/17 8:20 PM Page 27

Dividend Reinvestment Plan
Unless the registered owner of common shares elects to receive cashby contacting Boston Financial Data Services, Inc. (the “PlanAdministrator”), all dividends or other distributions (together,“Dividends” and each, a “Dividend”) declared on common shares willbe automatically reinvested by the Plan Administrator forshareholders in the Fund’s Dividend Reinvestment Plan (the “Plan”),in additional common shares of the Fund. Shareholders who are notpermitted to participate through their broker or nominee or whoelect not to participate in the Plan will receive all Dividends in cashpaid by check mailed directly to the shareholder of record (or, if thecommon shares are held in street or other nominee name, then tosuch nominee) by the Plan Administrator, as dividend disbursingagent. You may elect not to participate in the Plan and to receive allDividends in cash by contacting the Plan Administrator, as dividenddisbursing agent, at the address set forth below. Participation in thePlan is completely voluntary and may be terminated or resumed atany time without penalty by notice if received and processed by thePlan Administrator prior to the dividend record date; otherwise suchtermination or resumption will be effective with respect to anysubsequently declared Dividend. If you hold your shares through abroker, and you wish for all Dividends declared on your commonshares to be automatically reinvested pursuant to the Plan, pleasecontact your broker.
The Plan Administrator will open an account for each shareholderunder the Plan in the same name in which such shareholder’scommon shares are registered. Whenever the Fund declares aDividend payable in cash, non-participants in the Plan will receive cashand participants in the Plan will receive the equivalent in commonshares. The common shares will be acquired by the Plan Administratorfor the participants’ accounts, depending upon the circumstancesdescribed below, either (i) through receipt of additional unissued butauthorized common shares from the Fund (“Newly Issued commonshares”) or (ii) by purchase of outstanding common shares on theopen market (“Open-Market Purchases”) on the NYSE or elsewhere.If, on the payment date for any Dividend, the closing market price plusestimated brokerage commissions per share is equal to or greaterthan the NAV per share, the Plan Administrator will invest theDividend amount in Newly Issued common shares on behalf of theparticipants. The number of Newly Issued common shares to becredited to each participant’s account will be determined by dividingthe dollar amount of the Dividend by the NAV per share on thepayment date; provided that, if the NAV is less than or equal to 95%of the closing market value on the payment date, the dollar amountof the Dividend will be divided by 95% of the closing market price pershare on the payment date. If, on the payment date for any Dividend,the NAV per share is greater than the closing market value plusestimated brokerage commissions, the Plan Administrator will investthe Dividend amount in common shares acquired on behalf of theparticipants in Open-Market Purchases.
In the event of a market discount on the payment date for anyDividend, the Plan Administrator will have until the last business daybefore the next date on which the common shares trade on an “ex-dividend” basis or 30 days after the payment date for such Dividend,whichever is sooner (the “Last Purchase Date”), to invest the Dividendamount in common shares acquired in Open-Market Purchases. If,before the Plan Administrator has completed its Open-MarketPurchases, the market price per share exceeds the NAV per share, theaverage per share purchase price paid by the Plan Administrator mayexceed the NAV of the common shares, resulting in the acquisition offewer common shares than if the Dividend had been paid in NewlyIssued common shares on the Dividend payment date. Because of theforegoing difficulty with respect to Open-Market Purchases, the Planprovides that if the Plan Administrator is unable to invest the fullDividend amount in Open-Market Purchases during the purchaseperiod or if the market discount shifts to a market premium duringthe purchase period, the Plan Administrator may cease making Open-Market Purchases and may invest the uninvested portion of theDividend amount in Newly Issued common shares at the NAV pershare at the close of business on the Last Purchase Date provided that,if the NAV is less than or equal to 95% of the then current marketprice per share, the dollar amount of the Dividend will be divided by95% of the market price on the payment date for purposes ofdetermining the number of shares issuable under the Plan.
The Plan Administrator maintains all shareholders’ accounts in the Planand furnishes written confirmation of all transactions in the accounts,including information needed by shareholders for tax records.Common shares in the account of each Plan participant will be held bythe Plan Administrator on behalf of the Plan participant, and eachshareholder proxy will include those shares purchased or receivedpursuant to the Plan. The Plan Administrator will forward all proxysolicitation materials to participants and vote proxies for shares heldunder the Plan in accordance with the instructions of the participants.
In the case of the Fund’s shareholders such as banks, brokers ornominees which hold shares for others who are the beneficialowners, the Plan Administrator will administer the Plan on the basisof the number of common shares certified from time to time by therecord shareholder’s name and held for the account of beneficialowners who participate in the Plan.
There will be no brokerage charges with respect to common sharesissued directly by the Fund. However, each participant will pay a prorata share of brokerage commissions incurred in connection withOpen-Market Purchases. The automatic reinvestment of Dividendswill not relieve participants of any U.S. Federal, state or local incometax that may be payable (or required to be withheld) on suchDividends. See “Federal and Other Income Taxes.” Participants thatrequest a sale of common shares through the Plan Administrator aresubject to brokerage commissions.
Additional Information (Unaudited)October 31, 2017
28
89563_02_Alpine_AR.qxp_02 12/22/17 8:20 PM Page 28

Additional Information (Unaudited) (Continued)October 31, 2017
Annual Report | October 31, 2017 29
Shareholders participating in the Plan may receive benefits notavailable to shareholders not participating in the Plan. If the marketprice plus commissions of the Fund’s shares is higher than the NAV,participants in the Plan will receive shares of the Fund for less thanthey could otherwise purchase them and will have shares with a cashvalue greater than the value of any cash distribution they would havereceived on their shares. If the market price plus commissions isbelow the net asset value, participants receive distributions of shareswith a NAV greater than the value of any cash distribution they wouldhave received on their shares. However, there may be insufficientshares available in the market to make distributions in shares atprices below the NAV. Also, because the Fund does not redeem itsshares, the price on resale may be more or less than the NAV.
The Fund reserves the right to amend or terminate the Plan. Thereis no direct service charge to participants with regard to purchasesin the Plan; however, the Fund reserves the right to amend the Planto include a service charge payable by the participants.
All correspondence or question concerning the Plan should bedirected to the Plan Administrator, Boston Financial Data Services,Inc., c/o Alpine Closed-End Funds, PO Box 8128, Boston, MA 02266-8128 or by calling toll-free 1 (800) 617.7616.
Availability of Proxy Voting Information
The policies and procedures used in determining how to vote proxiesrelating to portfolio securities are available without a charge, uponrequest, by contacting the Fund at 1(800) 617.7616 and on the SEC’sweb site at http://www.sec.gov. Information regarding how the Fundvoted proxies relating to portfolio securities during the most recenttwelve-month period ended June 30 is available without charge,upon request, by contacting the Fund at 1(800) 617.7616 and on theSEC’s web site at http://www.sec.gov.
Portfolio Holdings
The Fund files its complete schedule of portfolio holdings with theSEC for the first and third quarters of each fiscal year on Form N-Qwithin 60 days after the end of the period. Copies of the Fund’s FormsN-Q are available without a charge, upon request, by contacting theFund at 1(800) 617.7616 and on the SEC’s web site athttp://www.sec.gov. You may also review and copy Form N-Q at theSEC’s Public Reference Room in Washington, D.C. For moreinformation about the operation of the Public Reference Room,please call the SEC at 1 (800) SEC.0330.
Designation Requirements
Of the distributions paid by the Fund from ordinary income for theyear ended October 31, 2017, the following percentages met therequirements to be treated as qualifying for the corporate dividendsreceived deduction and qualified dividend income, respectively.
Dividends Received Deduction 13.28%Qualified Dividend Income 36.17%
Notice
Notice is hereby given in accordance with Section 23(c) of theInvestment Company Act of 1940 that the Fund may purchase atmarket prices from time to time its common shares in the openmarket.
Fund Governance
On September 28, 2017, the Board of Trustees of the Fund approvedand adopted Amended and Restated By-Laws (“A&R By-Laws”) of theFund. The A&R By-Laws are effective as of September 28, 2017. Insummary, the A&R By-Laws update the processes, timing andprocedures that shareholders of the Fund must follow (e.g., torequire the shareholder who has made the proposal or nomination(or a qualified representative) to be present at the meeting wherethe proposed business is to be transacted), and specifies additionalinformation that shareholders of the Fund must provide, whenproposing trustee nominations at any annual or special meeting ofshareholders or other business to be considered at an annualmeeting of shareholders (e.g., a description of certain agreements,arrangements, understandings or other relationships between oramong the trustee nominee and significant shareholders). The A&RBy-Laws, in part, align the timing of submission of shareholderproposals or nominations with certain regulatory requirements. TheA&R By-Laws now specify qualification requirements that trusteenominees must meet (e.g., age thresholds, disqualifying conduct,other directorships, relationships to other investments advisers andothers). It also sets forth the exclusive forum for certain litigation inthe State of Delaware. The A&R By-Laws were filed as an exhibit tothe 8-K filed on October 4, 2017.
On September 28, 2017, the Board of Trustees of the Fund alsoapproved and adopted an updated Nominating and CorporateGovernance Committee Charter (the “Charter”). The Charter wasupdated to include additional information regarding the proceduresthat shareholders of the Fund must follow when proposing Trusteecandidates directly to the Nominating and Corporate GovernanceCommittee. It was also updated to specify qualification requirementsthat the Trustee candidates must meet in order to be considered bythe Nominating and Corporate Governance Committee. The Chartercan be found on the Fund’s website at www.alpinefunds.com.
89563_02_Alpine_AR.qxp_02 12/22/17 8:20 PM Page 29

Additional Information (Unaudited) (Continued)October 31, 2017
30
The Fund’s Statement of Additional Information includes additional information about Trust Trustees and is available, without charge and uponrequest, by visiting www.alpinefunds.com.
INDEPENDENT TRUSTEES Number of Portfolios in Term of Office Fund Complex Name, Address Position(s) Held and Length of Principal Occupation During Overseen by Other Directorships and Year of Birth with the Trusts Time Served Past Five Years Trustee* Held by Trustee
H. Guy Leibler Independent Trustee Indefinite, since President, Simone Healthcare 12 Chairman Emeritus, (1954) the Trust’s Development (since 2013); White Plains Hospital inception Private investor (since 2007). Center (since 1988);
Trustee of each of theAlpine Trusts (1996 toPresent).**
Jeffrey E. Wacksman Independent Trustee Indefinite, Partner, Loeb, Block & Partners 12 Director, International (1960) since 2004 LLP (law firm) (since 1994). Succession Planning
Association (since2008); Director, BondiIcebergs Inc. (women’ssportswear) (since1994); Director, MHProperties, Inc. (a realestate holding com-pany) (since 1996);Trustee of each of theAlpine Trusts.**
Eleanor T.M. Hoagland Independent Trustee Indefinite, since Principal, VCS Advisory, LLC 12 Trustee of each of the (1951) October 2012 (since 2011); Chief Compliance Alpine Trusts.**
Officer and Senior Managing Director of Magni Asset Management LLC (since 2011) and Park Fifth Capital Management LLC (2011 to 2013).
89563_02_Alpine_AR.qxp_02 12/22/17 8:20 PM Page 30

Additional Information (Unaudited) (Continued)October 31, 2017
Annual Report | October 31, 2017 31
INTERESTED TRUSTEE & OFFICERS Term of Office # of Name, Address Position(s) Held and Length of Principal Occupation During Portfolios in Other Directorships and Year of Birth with the Trusts Time Served Past Five Years Fund Complex* Held by Trustee
Samuel A. Lieber*** Interested Trustee Indefinite, since Chief Executive Officer, Alpine 12 Trustee of each of the (1956) and President the Trust’s Woods Capital Investors, LLC Alpine Trusts.**
inception (since 1997); President of Alpine Trusts (since 1998).
Stephen A. Lieber**** Vice President Indefinite, since Chairman and Senior Portfolio 12 N/A(1925) the Trust’s Manager, Saxon Woods Advisors,
inception LLC (since 1999).
Kenneth Corrado Chief Compliance Indefinite, since Chief Compliance Officer, Alpine 12 N/A(1964) Officer July 2013 Woods Capital Investors, LLC
(since July 2013); Independent Compliance Consultant (2012 to 2013); Vice President and Deputy Chief Compliance Officer, Artio Global Management, LLC (2007 to 2012).
Ronald G. Palmer, Jr. Chief Financial Officer Indefinite, since Chief Financial Officer, Alpine 12 N/A(1968) 2010 Woods Capital Investors, LLC
(since January 2010).
Joe C. Caruso Treasurer Indefinite, since Fund Accountant, Alpine Woods 12 N/A(1971) July 2013 Capital Investors, LLC since 2011;
Independent Tax Consultant (2010 to 2011); Assistant Vice President Global Fund Services, Deutsche Bank AG (2009 to 2010).
Andrew Pappert Secretary Indefinite, since Director of Fund Operations, Alpine 12 N/A(1980) 2009 Woods Capital Investors, LLC
(since September 2008).
* Alpine Woods Capital Investors, LLC currently manages twelve portfolios within the six investment companies that comprise the Alpine Trusts.The Alpine Equity Trust, Alpine Series Trust and Alpine Income Trust are each registered as an open-end management investment company.The Alpine Global Dynamic Dividend Fund, Alpine Total Dynamic Dividend Fund and Alpine Global Premier Properties Fund are each registered as a closed-end management investment company. The Trustees currently oversee twelve portfolios within the six Alpine Trusts.
** The Trustees are members of the Board of Trustees for each of the Alpine Equity Trust, Alpine Income Trust, Alpine Series Trust, AlpineGlobal Dynamic Dividend Fund, Alpine Total Dynamic Dividend Fund and Alpine Global Premier Properties Fund (the “Alpine Trusts”).
*** Denotes Trustees who are “interested persons” of the Trust or Fund under the 1940 Act.
**** Stephen A. Lieber is the father of Samuel A. Lieber.
89563_02_Alpine_AR.qxp_02 12/22/17 8:20 PM Page 31

[THIS PAGE INTENTIONALLY LEFT BLANK]
89563_02_Alpine_AR.qxp_02 12/22/17 8:20 PM Page 32

[THIS PAGE INTENTIONALLY LEFT BLANK]
89563_02_Alpine_AR.qxp_02 12/22/17 8:20 PM Page 33

[THIS PAGE INTENTIONALLY LEFT BLANK]
89563_02_Alpine_AR.qxp_02 12/22/17 8:20 PM Page 34

Global Premier_Cover.indd 3 12/28/12 6:23 PM
1(800) 617.7616
www.alpinefunds.com
INVESTORINFORMATION

Trustees
Samuel A. Lieber
Eleanor T.M. Hoagland
H. Guy Leibler
Jeffrey E. Wacksman
Investment Adviser
Alpine Woods Capital Investors, LLC
2500 Westchester Ave., Suite 215
Purchase, NY 10577
Administrator &
Custodian
State Street Bank & Trust Company
One Lincoln Street
Boston, MA 02111
Transfer Agent
Boston Financial Data Services, Inc.
2000 Crown Colony Drive
Quincy, MA 02171
independent registered
public accounting firm
Ernst & Young, LLP
5 Times Square
New York, NY 10019
Fund Counsel
Willkie Farr & Gallagher LLP
787 7th Ave.
New York, NY 10019
shareholder |investor information1(800) 617.7616
www.alpinefunds.com