Embed Size (px)
Citation preview
October 25, 2013
Diego VillarrealSHP – Columbia University
Oil

2
Introduction
3
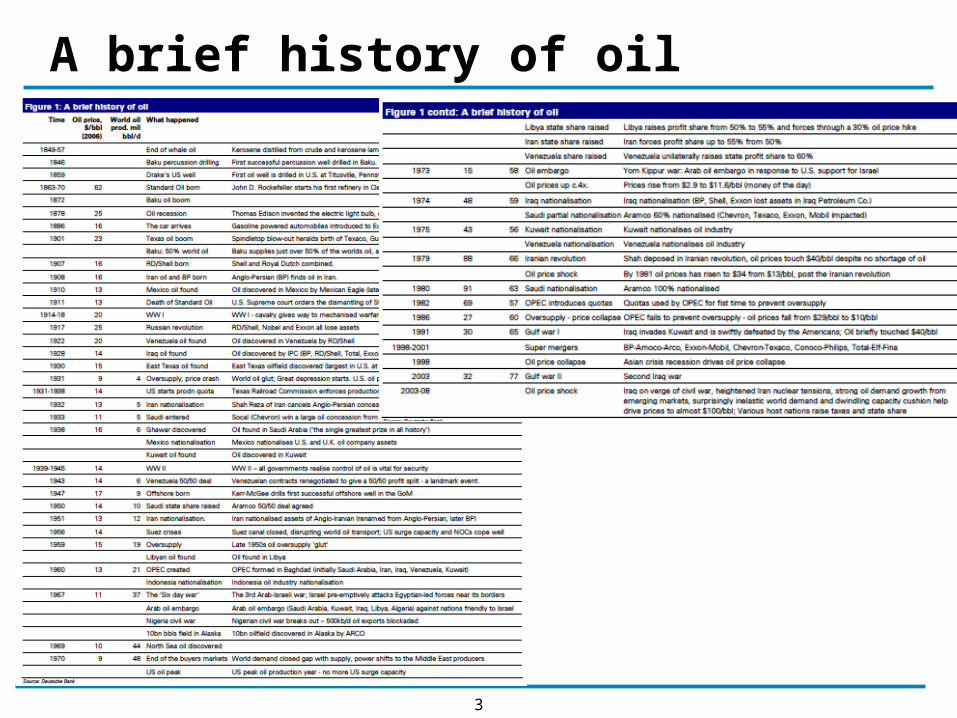
A brief history of oil
4
Oil in our economy
• Petroleum is the fuel with the largest share in global TPES (32.4%).• It is the most important fuel for transportation and is source for a lot
of important feedstock used in throughout the petrochemical and pharmaceutical industry.
• Currently the world consumes about 90 million barrels of oil per day. • It is hard to imagine to our economy without a steady and reliable
access to oil flows.• U.S. consumption 18 mbd• Saudi production 7-10 mbd• Russian production 7-8 mbd• US production 6 mbd
○ No other country > 5 mbd• Because oil is a fossil fuel, its use has some environmental
externalities associated with it.○ CO2
○ Environmental degradation during extraction○ Potential spills into the environment

5
How is oil used (world)

6
TPES in the US
US EIA Monthly Energy Review (April 2013). Supplies in quadrillion BTUs.

7
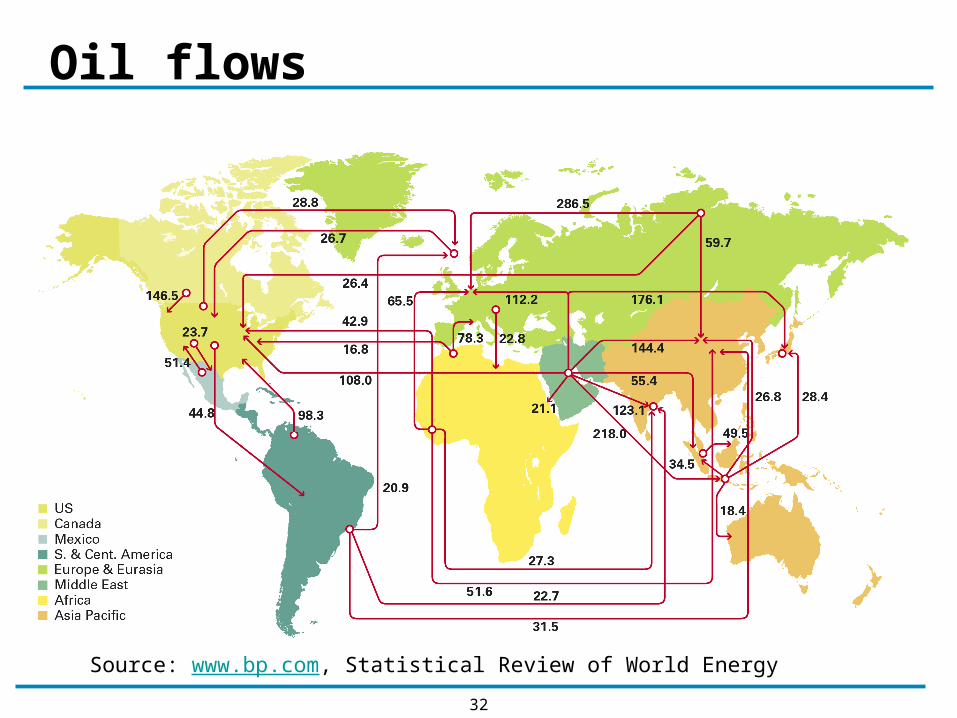
Oil flows (US)
8
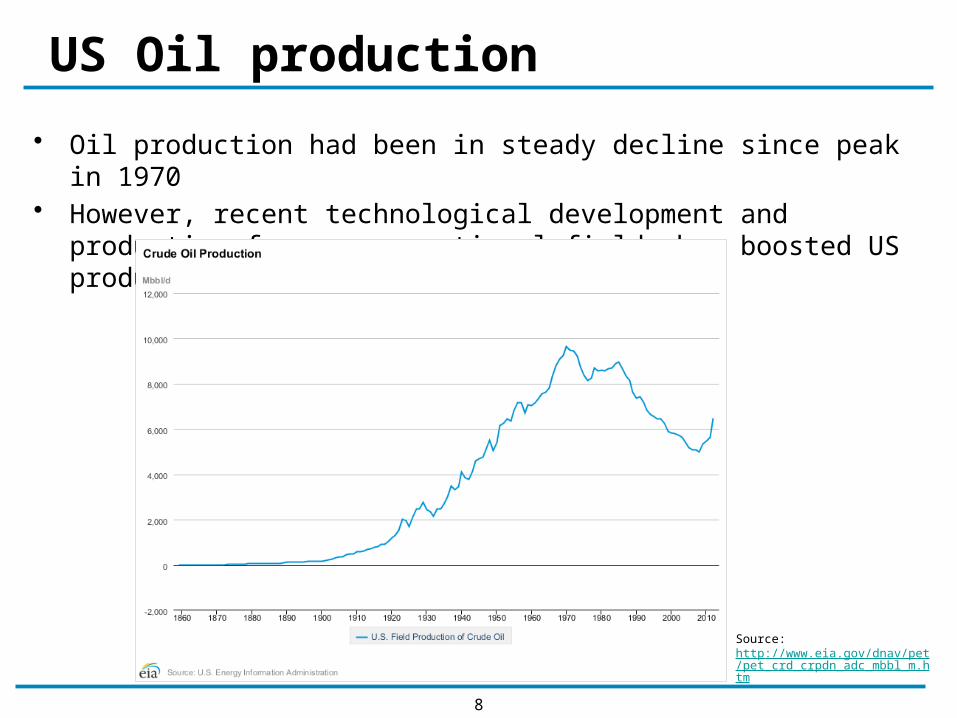
US Oil production
• Oil production had been in steady decline since peak in 1970• However, recent technological development and production
from unconventional fields has boosted US production dramatically.
Source: http://www.eia.gov/dnav/pet/pet_crd_crpdn_adc_mbbl_m.htm
9
US Imports by Country
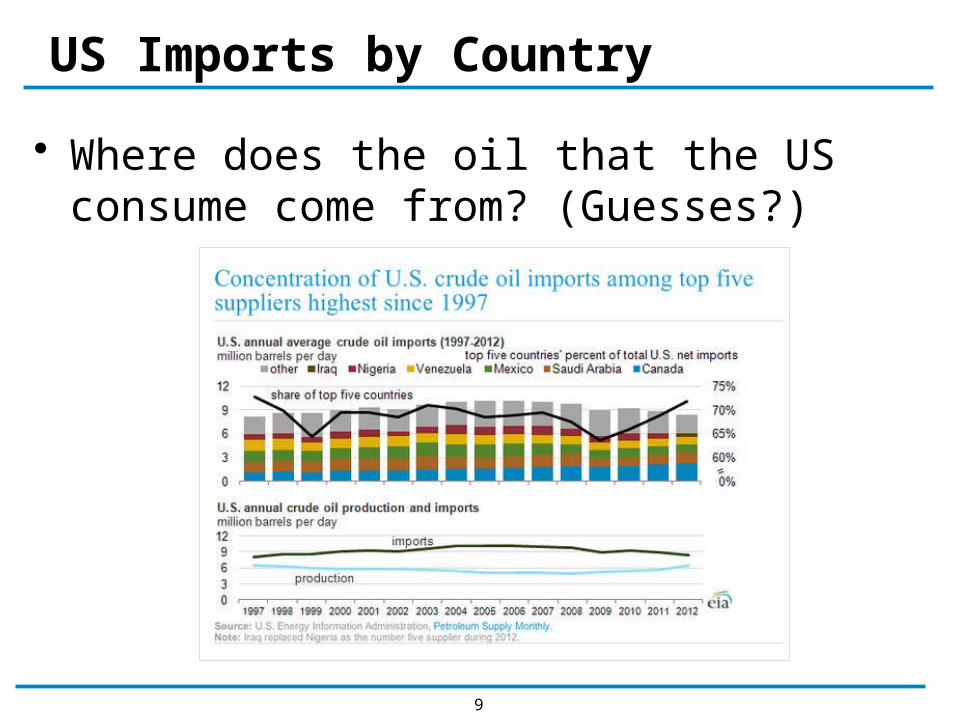
• Where does the oil that the US consume come from? (Guesses?)
10
Production/Consumption by region
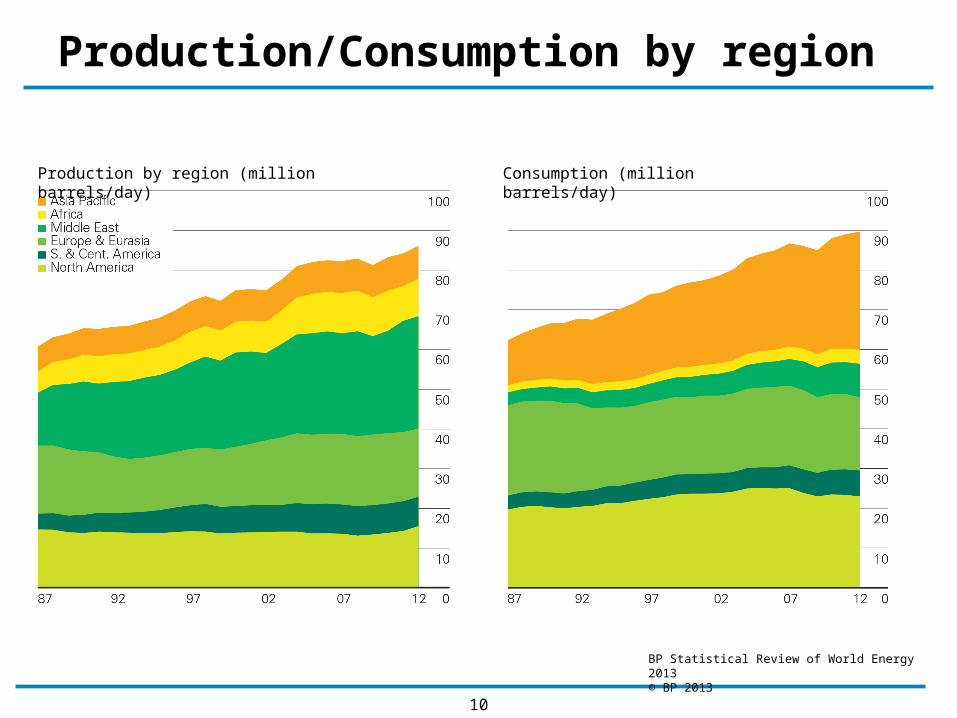
Production by region (million barrels/day)
Consumption (million barrels/day)
BP Statistical Review of World Energy 2013 © BP 2013
11
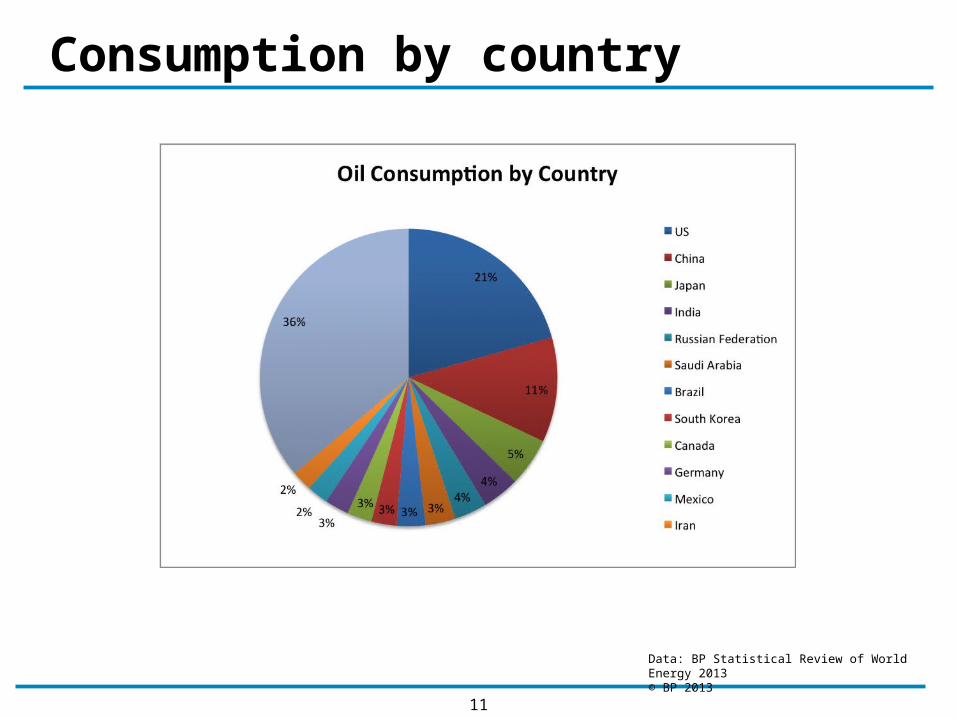
Consumption by country
Data: BP Statistical Review of World Energy 2013 © BP 2013
12
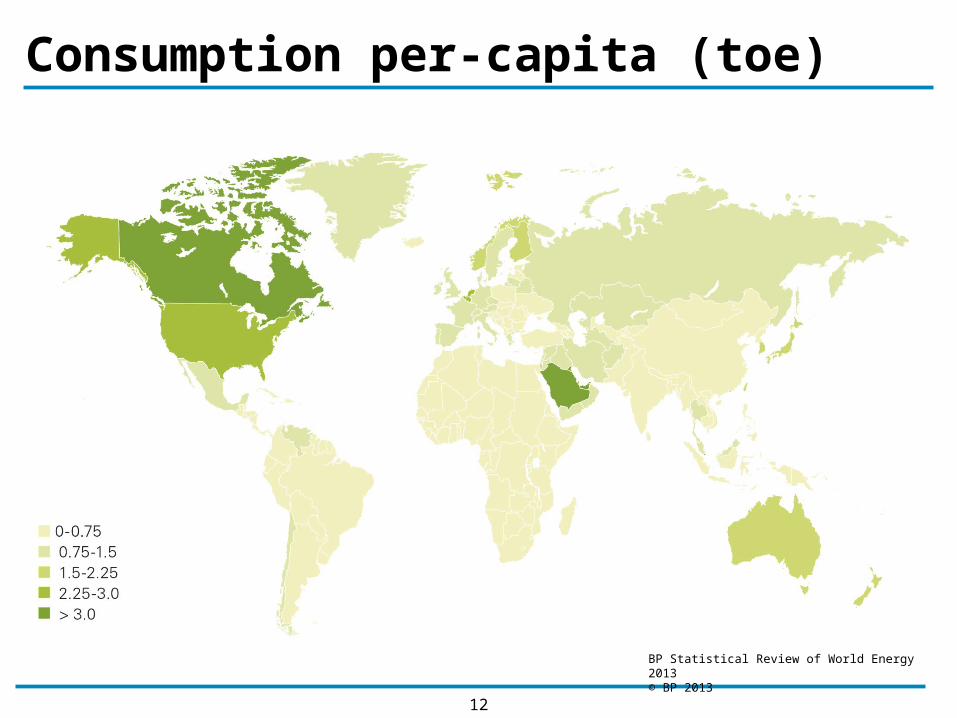
BP Statistical Review of World Energy 2013 © BP 2013
Consumption per-capita (toe)
13
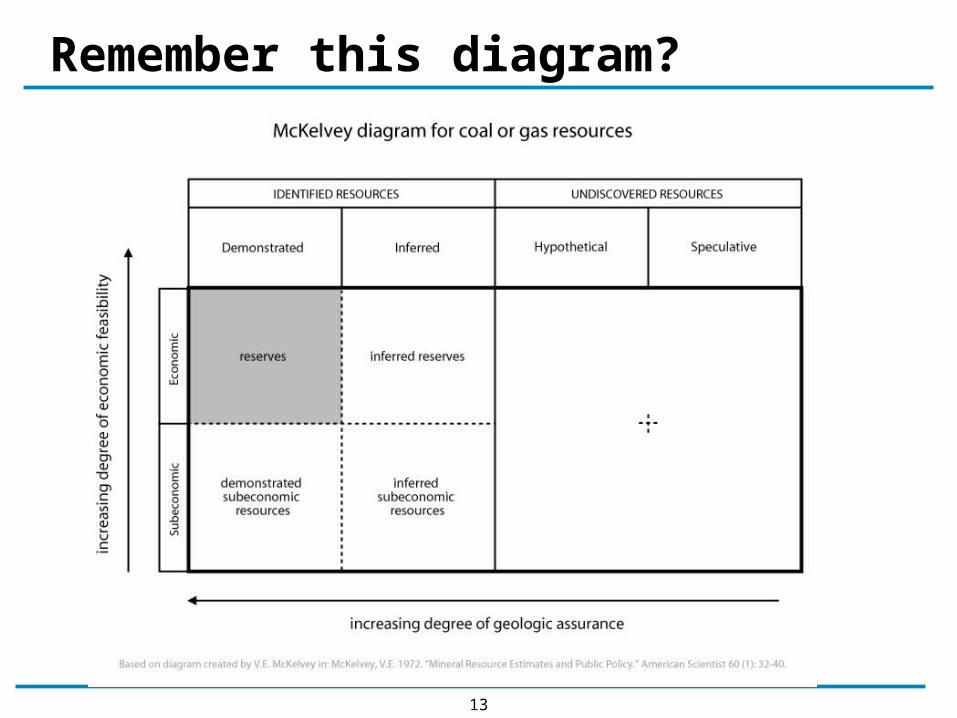
Remember this diagram?

14
Oil reserves-to-production (R/P) ratiosYears
• The reserves to production ratio is a measurement to estimate how much oil remains at a given point in time.
• RPR = Amount of know resource/ amount used per year• Remember reserves depend on price and tech, so numerator changes
every year.Source: BP Statistical Review of World Energy 2013
2012 by region
History
15
BP Statistical Review of World Energy 2013 © BP 2013
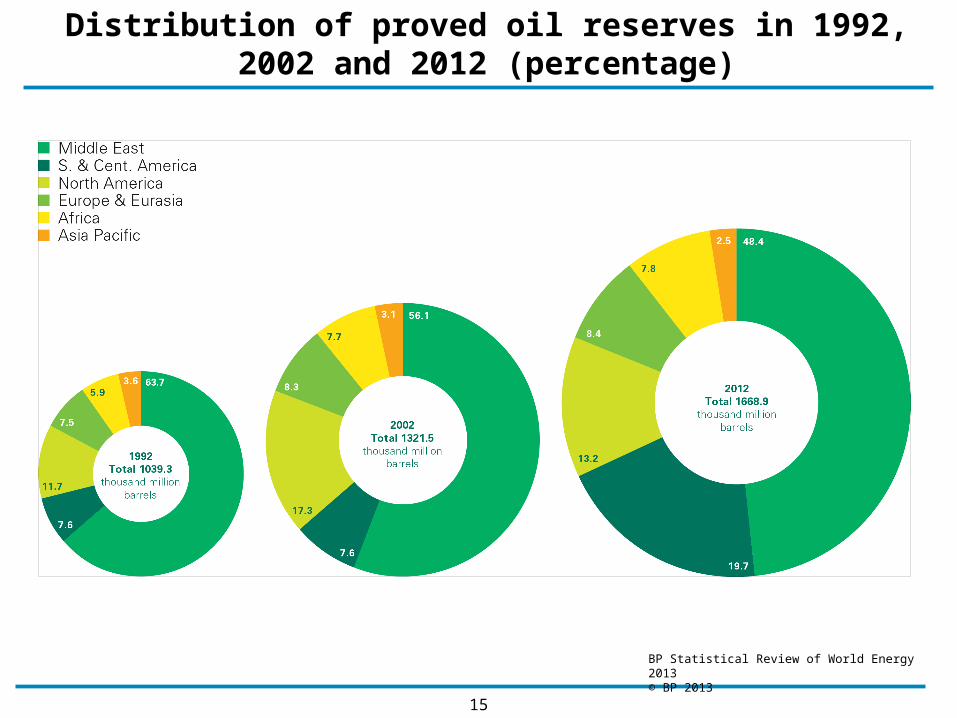
Distribution of proved oil reserves in 1992, 2002 and 2012 (percentage)

16
TECHNICAL CONSIDERATIONS
17
General Info• Crude oil, or petroleum, is the term used to describe the
unprocessed oil that comes out of the ground.• Crude oil is the principal source of liquid fuels and other
important hydrocarbon-derived products including lubricant, polymers, fibers, chemicals and pharmaceuticals.
• Petroleum consists of a complex mix of hydrocarbons and organic and inorganic compounds, depending on the formation from which the crude comes from.
• Hydrocarbons in crude are mostly alkanes, cycloalkanes and various aromatic hydrocarbons.
• These complex mixtures are separated through the refining process, were the different hydrocarbons are separated according to their boiling points.
18
Types of Oil
• Conventional – Usually refers to oil that can be extracted using conventional techniques. That is, liquid oil flows out on its own or upon pressurization. Geology & crude composition determines if it is conventional or not.
• Unconventional – Refers to the oil that requires much more sophisticated techniques to be extracted. “Mined” rather than drilled. Much more expensive to extract○ Tar sands○ Heavy crude○ Shale Oil.
• Important to remember that decision to extract is a function of price & technological breakthroughs, so conventional vs. unconventional change over time.
• Because the break-even costs of unconventionals are much higher, extracting it requires high oil prices (i.e. today).
19
Recovery
• Oil recovery divided into Primary, Secondary and Tertiary. • Primary – Underground pressure sufficient to drive oil to the
top. As field matures, pressure drops and eventually decreases past a point where oil needs to be forced out by other mechanisms. Recovery factor ~ 5-15%
• Secondary – Because the well pressure has decreased beyond a critical value, energy needs to be supplied in order to push the oil out. After secondary recovery, recovery factor ~ 30-35%○ Generally CH4, water or air injected to increase pressure.
○ Cost energy required determine whether secondary methods are applied.
• Tertiary – Describes methods used to change the viscosity of oil to enhance mobility. Allows for another 5-10% increase in recovery○ Usually involves adding steam and or dissolving CO2
○ Tertiary recovery only used when oil prices is high, as it requires a lot of energy.

20
Elemental composition
• Crude composition varies depending on where it comes from. On average, crude has the following molecular composition (by weight):
Element %
Carbon 83-87
Hydrogen 10-14
Nitrogen 0.1-2
Oxygen 0.05-1.5
Sulfur 0.05-6
Metals <0.1
21
Hydrocarbon Groups
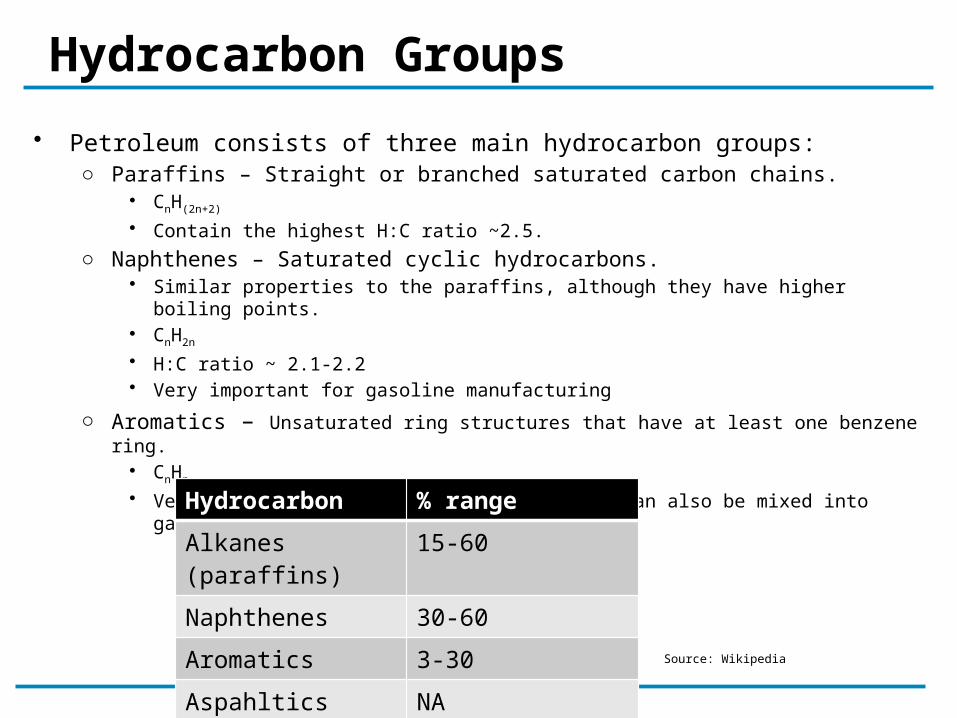
• Petroleum consists of three main hydrocarbon groups:○ Paraffins – Straight or branched saturated carbon chains.
• CnH(2n+2)
• Contain the highest H:C ratio ~2.5.
○ Naphthenes – Saturated cyclic hydrocarbons.• Similar properties to the paraffins, although they have higher boiling points. • CnH2n
• H:C ratio ~ 2.1-2.2• Very important for gasoline manufacturing
○ Aromatics – Unsaturated ring structures that have at least one benzene ring.• CnHn
• Very important for petrochemical industry can also be mixed into gasoline.
Hydrocarbon % range
Alkanes (paraffins)
15-60
Naphthenes 30-60
Aromatics 3-30
Aspahltics NASource: Wikipedia
22
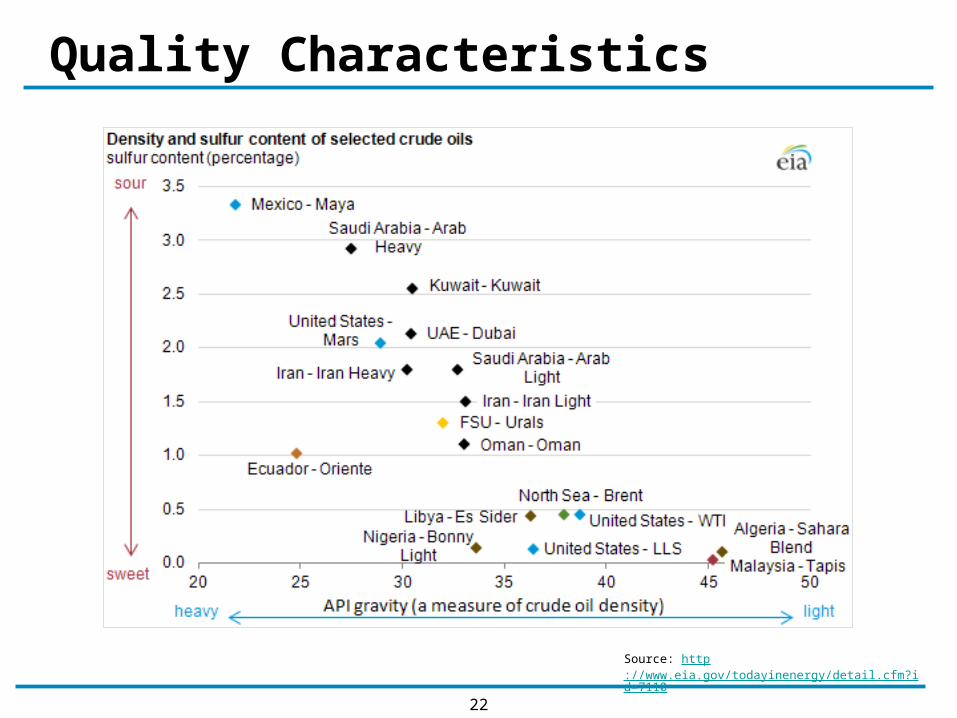
Quality Characteristics
Source: http://www.eia.gov/todayinenergy/detail.cfm?id=7110
23
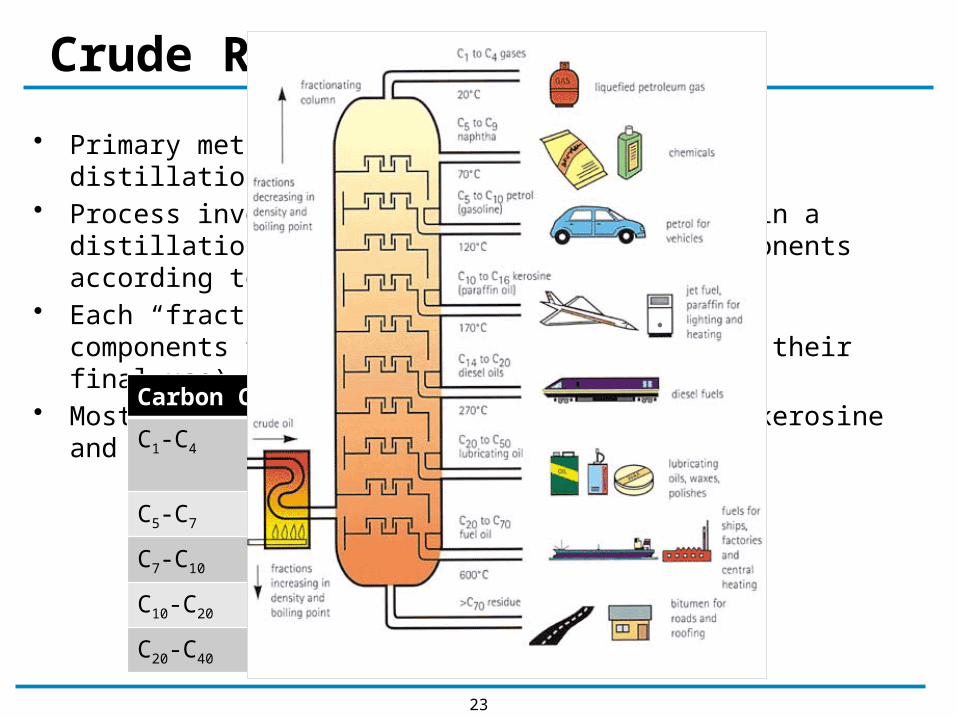
Crude Refining
• Primary method of refining is “fractional distillation”. • Process involves heating up crude (~ 350C) in a distillation
column and separating its components according to their boiling point.
• Each “fraction” contains a different mix of components that vary in value (depending on their final use).
• Most useful fractions are (LPG), naphthas, kerosine and gas oil.
Carbon Count Component
C1-C4 LPG’s (gaseous hydrocarbons)
C5-C7 Virgin Naphtha
C7-C10 Heavy Naphtha
C10-C20 Light Oil gas
C20-C40 Heavy gas oil
24
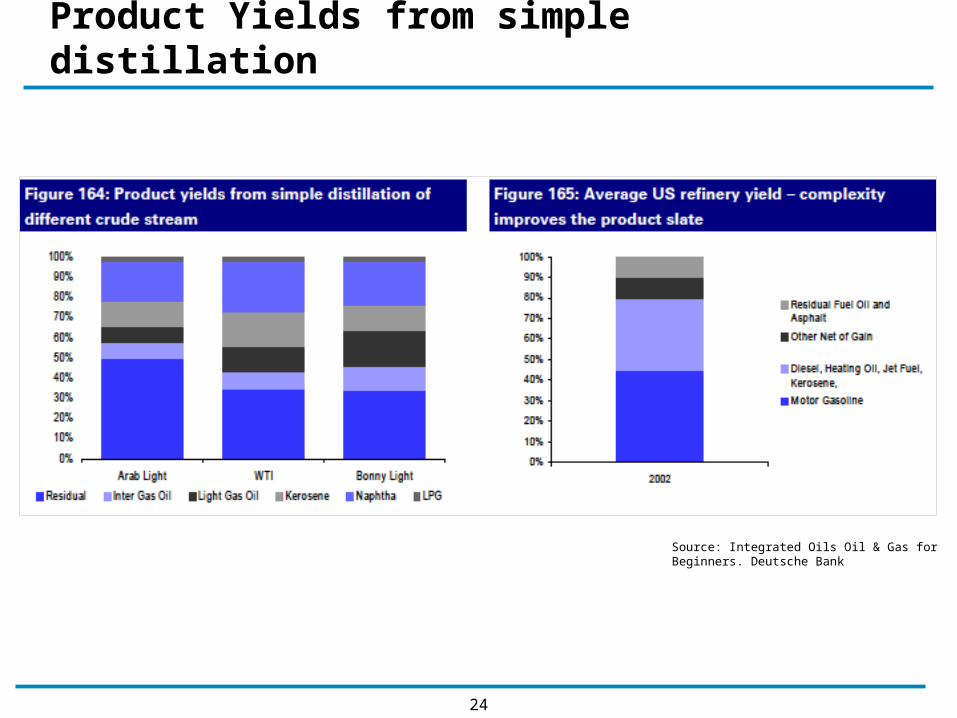
Product Yields from simple distillation
Source: Integrated Oils Oil & Gas for Beginners. Deutsche Bank
25
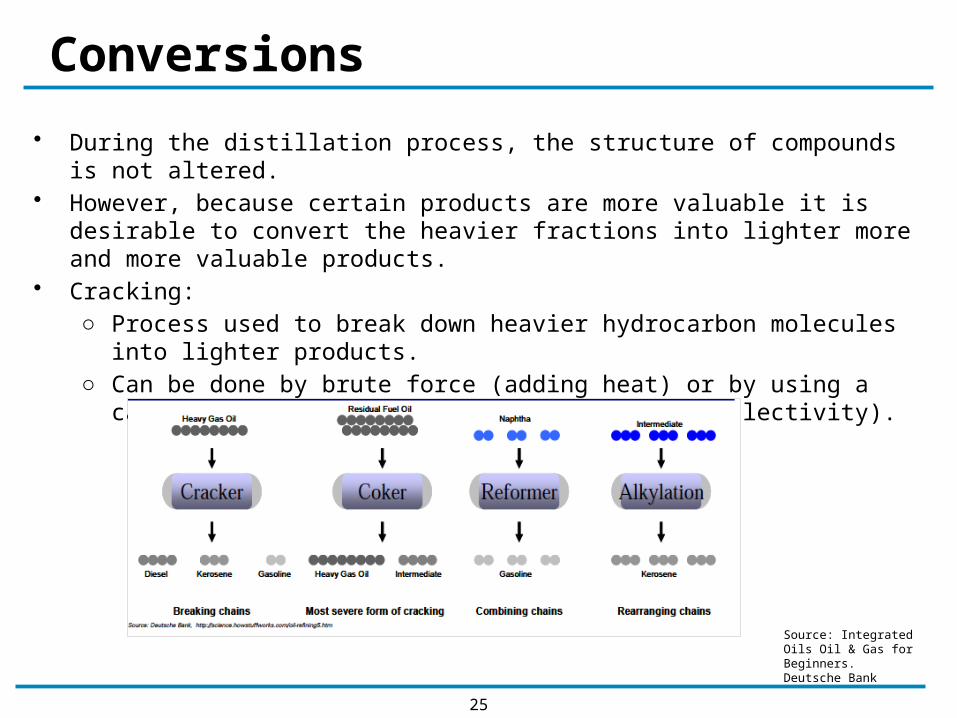
Conversions
• During the distillation process, the structure of compounds is not altered.
• However, because certain products are more valuable it is desirable to convert the heavier fractions into lighter more and more valuable products.
• Cracking: ○ Process used to break down heavier hydrocarbon molecules into
lighter products. ○ Can be done by brute force (adding heat) or by using a catalyst
(lower temps and higher degree of selectivity).
Source: Integrated Oils Oil & Gas for Beginners. Deutsche Bank
26
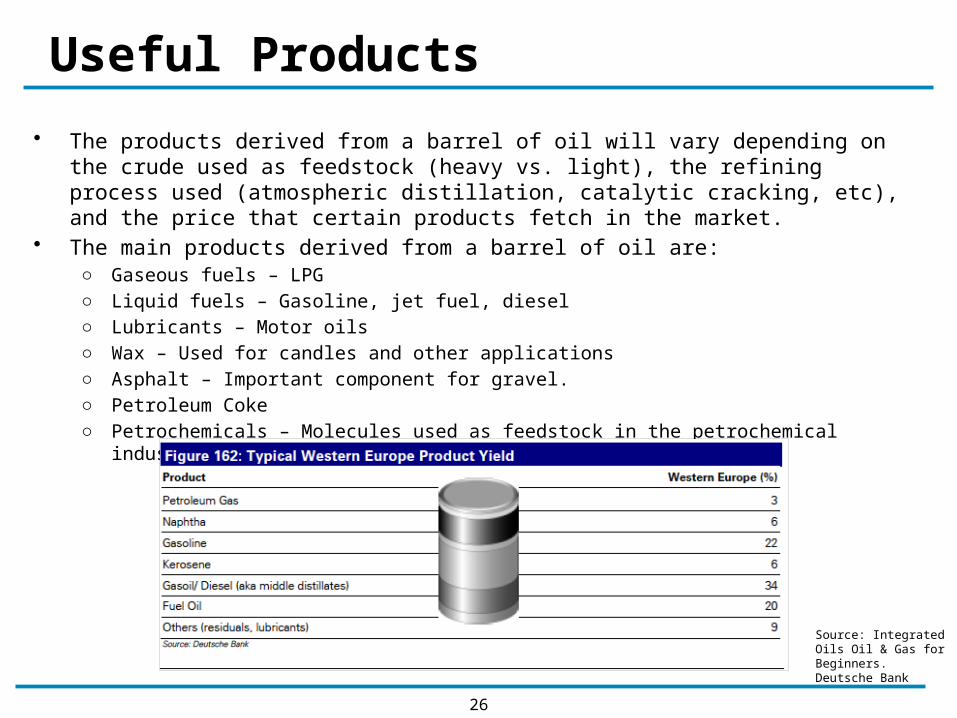
Useful Products
• The products derived from a barrel of oil will vary depending on the crude used as feedstock (heavy vs. light), the refining process used (atmospheric distillation, catalytic cracking, etc), and the price that certain products fetch in the market.
• The main products derived from a barrel of oil are:○ Gaseous fuels – LPG○ Liquid fuels – Gasoline, jet fuel, diesel○ Lubricants – Motor oils○ Wax – Used for candles and other applications○ Asphalt – Important component for gravel.○ Petroleum Coke○ Petrochemicals – Molecules used as feedstock in the petrochemical industry.
Includes aromatics,
Source: Integrated Oils Oil & Gas for Beginners. Deutsche Bank
27
OIL MARKETS
28
Markets
• The oil trade is the world’ largest, whether measured by value or volume.
• Deutsche bank estimates that physical crude oil market alone to be worth some USD1,600 billion per year!(based on 5 yr WTI average historical price of USD52.60/bbl and 2006 global demand of 83.7mb/d)
• Oil market is a global market○ Relatively easy (and cheap) to transport
• The main international exchanges for the trading of oil and oil products are the New York Mercantile Exchange (Nymex) and the Intercontinental Exchange (ICE, formerly the International Petroleum Exchange in London).
• Exchanges trade spot or physical contracts for immediate delivery and futures for delivery at a later date (hedging and speculating)
29
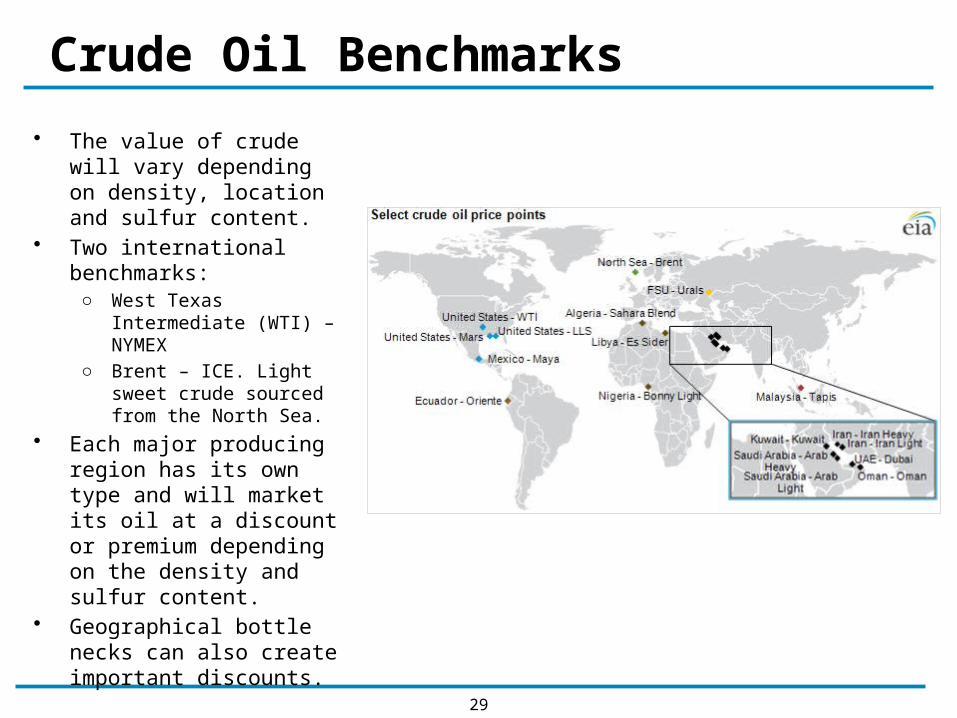
Crude Oil Benchmarks
• The value of crude will vary depending on density, location and sulfur content.
• Two international benchmarks:○ West Texas Intermediate
(WTI) – NYMEX○ Brent – ICE. Light sweet
crude sourced from the North Sea.
• Each major producing region has its own type and will market its oil at a discount or premium depending on the density and sulfur content.
• Geographical bottle necks can also create important discounts.
30
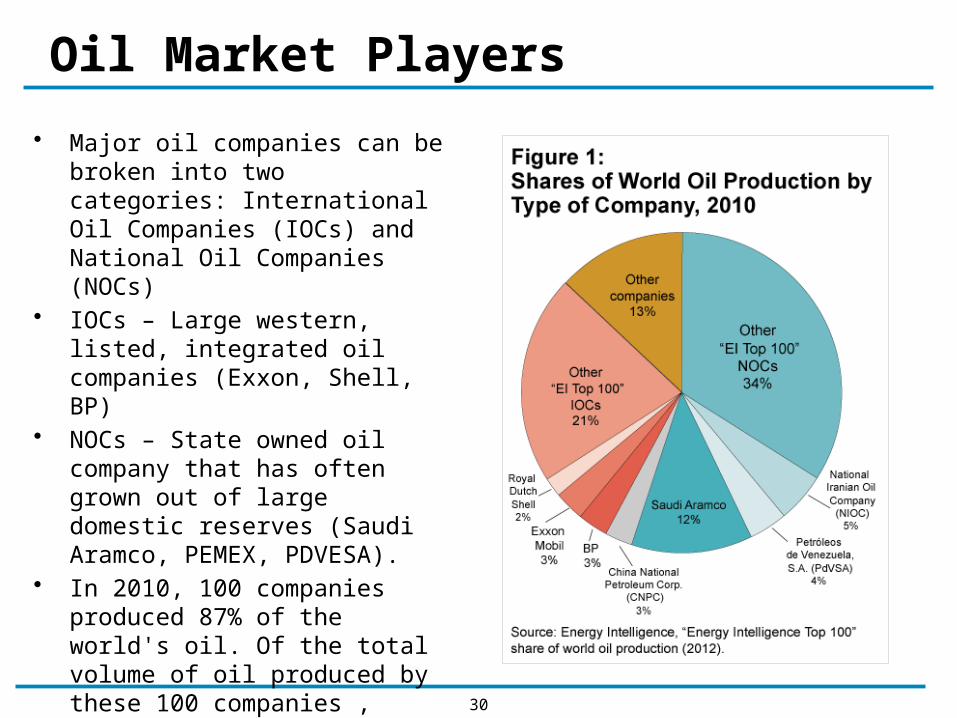
Oil Market Players
• Major oil companies can be broken into two categories: International Oil Companies (IOCs) and National Oil Companies (NOCs)
• IOCs – Large western, listed, integrated oil companies (Exxon, Shell, BP)
• NOCs – State owned oil company that has often grown out of large domestic reserves (Saudi Aramco, PEMEX, PDVESA).
• In 2010, 100 companies produced 87% of the world's oil. Of the total volume of oil produced by these 100 companies , national oil companies accounted for 55% of production.

31
OPEC
• Organization of Petroleum Exporting Countries – Organization of the world’s richest oil countries. It currently has 12 members, six in the Middle East, four in Africa, two South America. ○ Algeria○ Angola○ Ecuador○ Iran○ Iraq○ Kuwait○ Libya○ Nigeria○ Qatar○ Saudi Arabia○ UAE○ Venezuela
• OPEC manages production by establishing production quotas (targets) for each one of its members. Why would they want to do this?
• OPEC has enormous market power because it represents ~ 40% of total world production and about 60% of the total petroleum traded in the world.
33
PRICE OF OIL
34
• The price of oil was relatively stable from 1930-1970.
• Since then it has seen major spikes and considerable volatility.
• This makes forecasting the future price of oil a complex task.
• Why do we want to forecast the future price of oil?
35
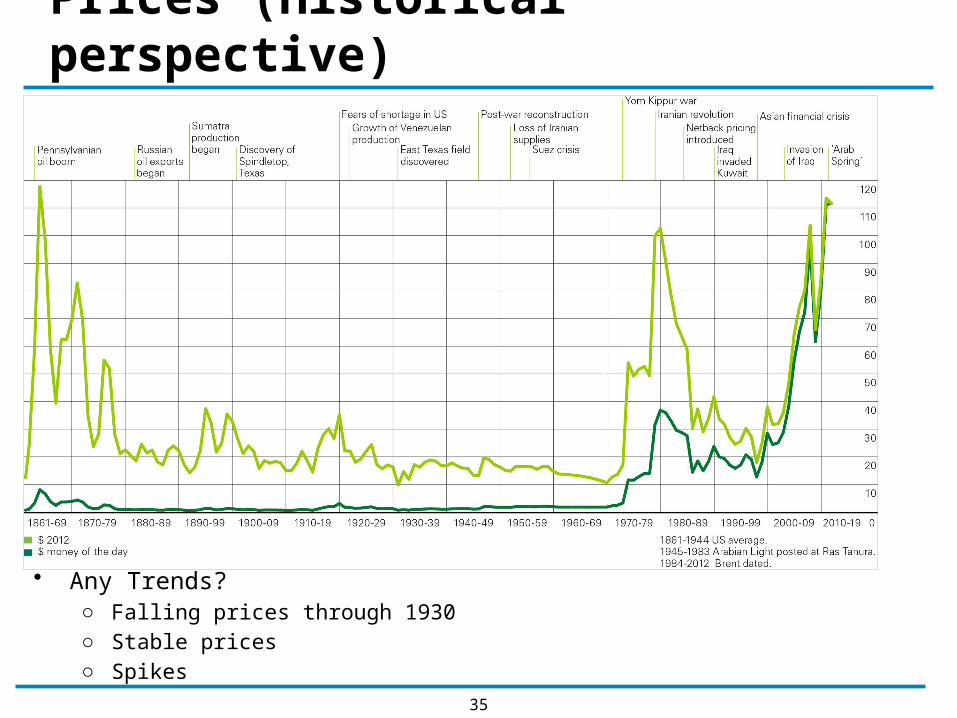
Prices (Historical perspective)
• Any Trends?○ Falling prices through 1930○ Stable prices○ Spikes

36
So what sets the price of oil?
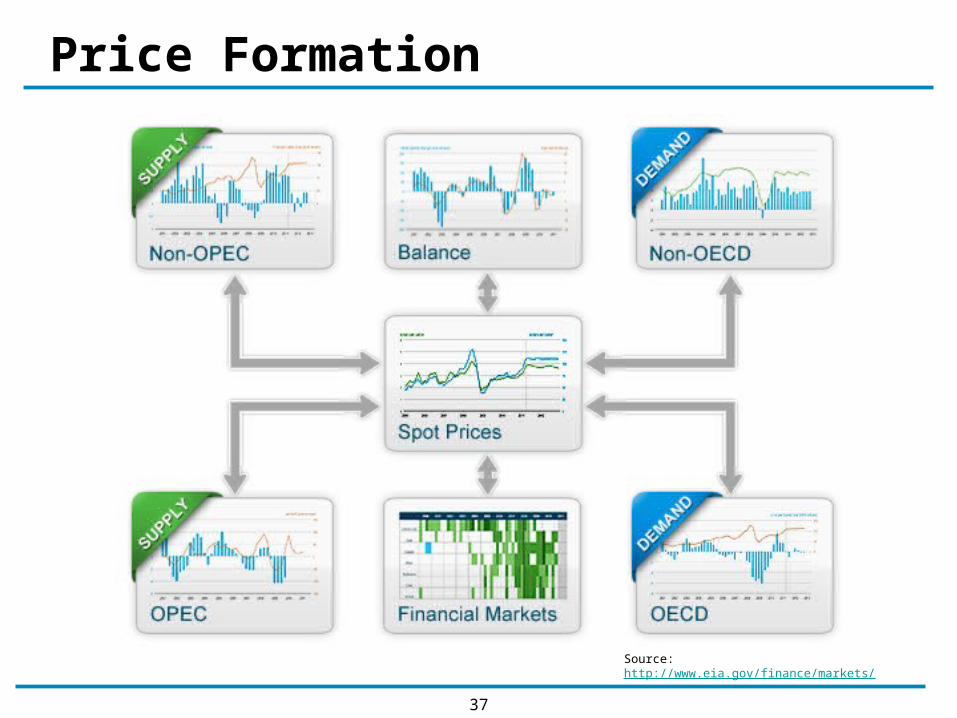
37
Price Formation
Source: http://www.eia.gov/finance/markets/
38
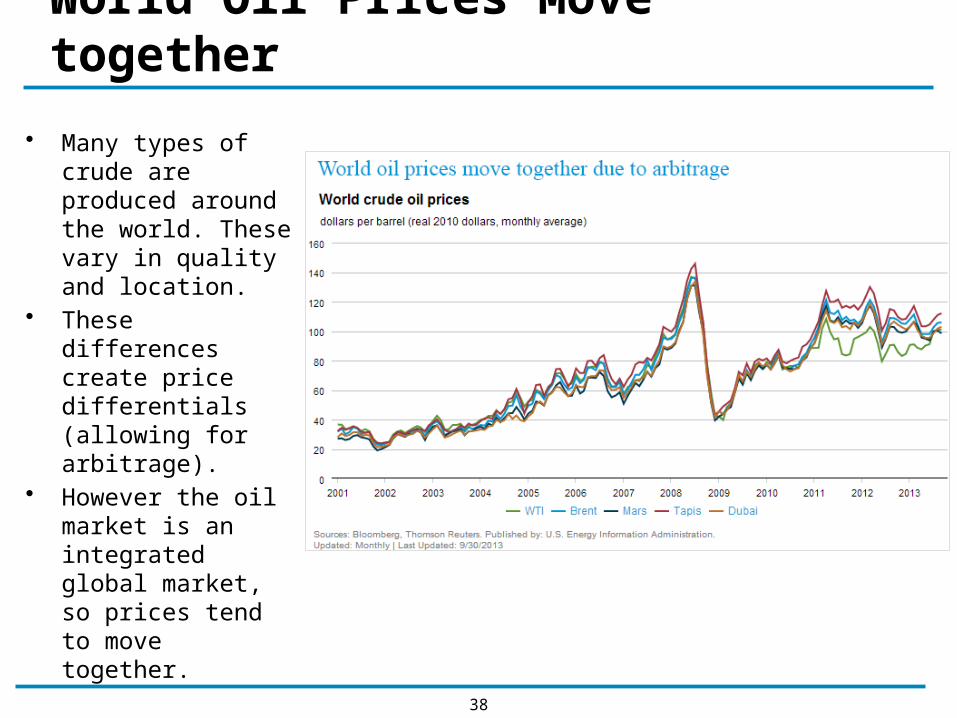
World Oil Prices Move together
• Many types of crude are produced around the world. These vary in quality and location.
• These differences create price differentials (allowing for arbitrage).
• However the oil market is an integrated global market, so prices tend to move together.
39
Supply: Non-OPEC
• Oil production from non OPEC countries ~ 60% of world supply.
• Most important areas of production are North America, FSU, North Sea
• Non-OPEC producers make independent decisions about oil production (unlike OPEC).
• Mostly IOC’s.• Generally considered price takers, that is they
respond to market prices rather than trying to influence the market by constraining or relaxing production.
• Operate near full capacity. Little spare capacity.
40
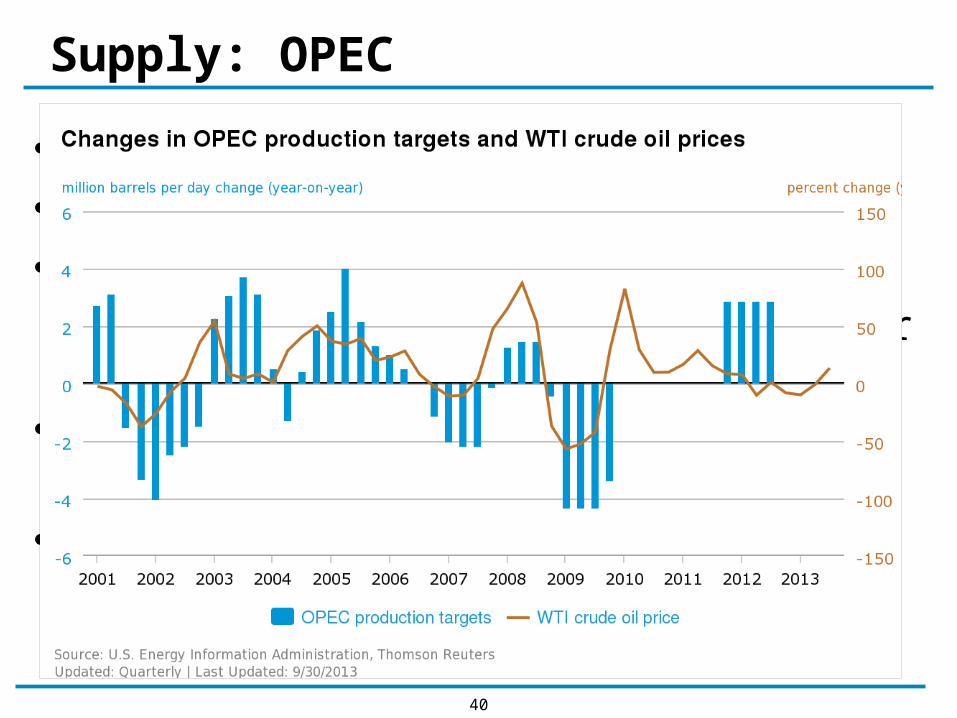
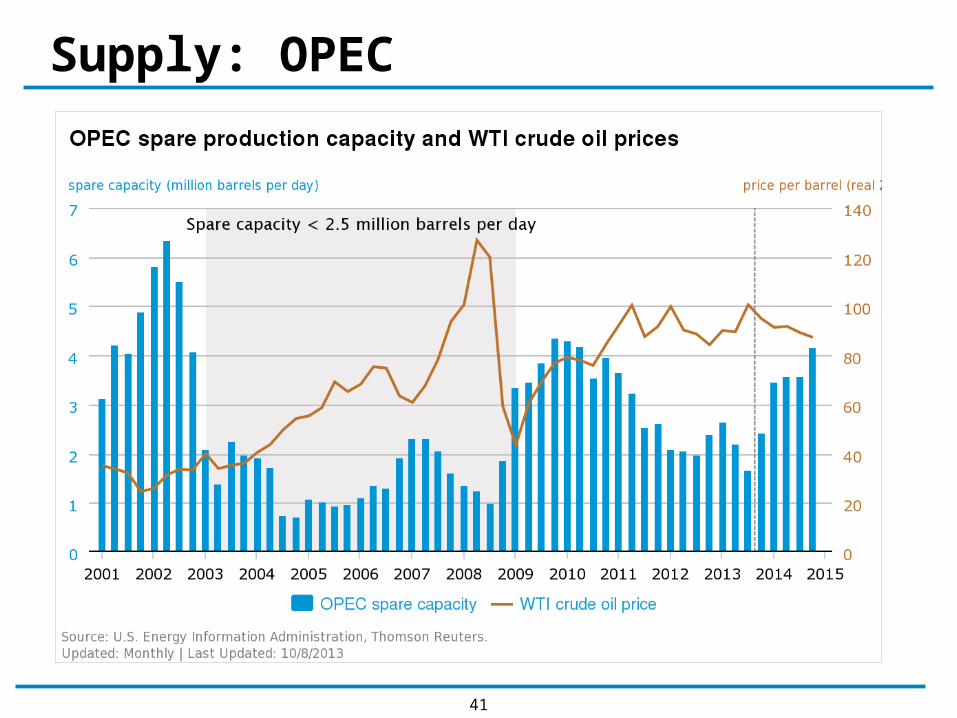
Supply: OPEC
• About 40% of world production.• 60% of oil traded in the world.• OPEC seeks to manage production by
setting production targets for its members ahead of time.
• By managing production, OPEC can influence the market.
• Reductions in OPEC production targets often lead to increases in oil prices.
41
Supply: OPEC
42
Demand: OECD
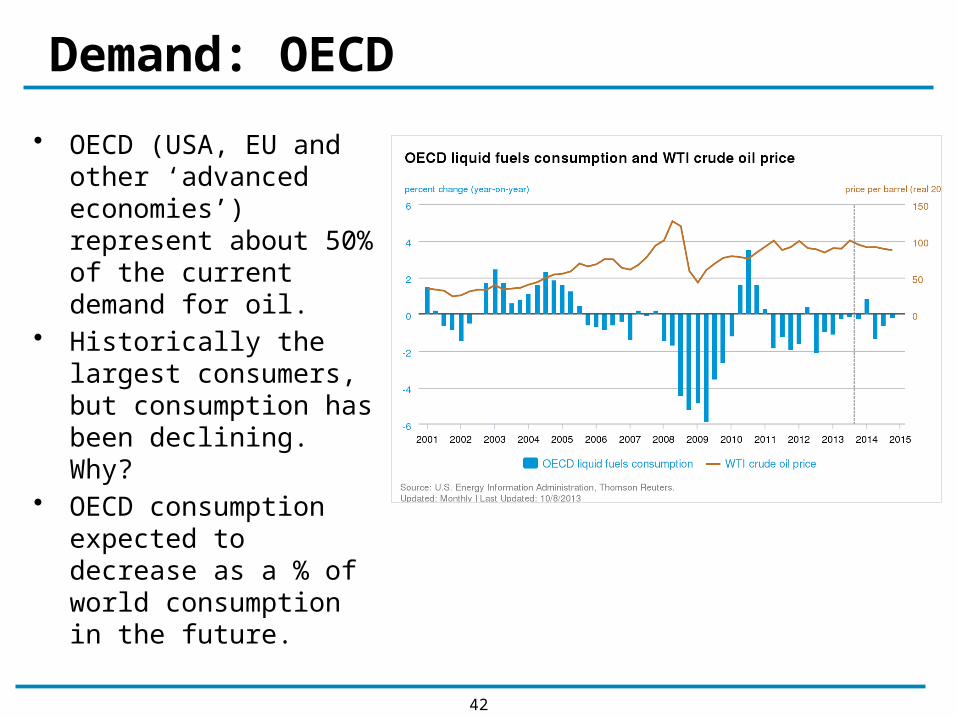
• OECD (USA, EU and other ‘advanced economies’) represent about 50% of the current demand for oil.
• Historically the largest consumers, but consumption has been declining. Why?
• OECD consumption expected to decrease as a % of world consumption in the future.
43
Demand: Non-OECD
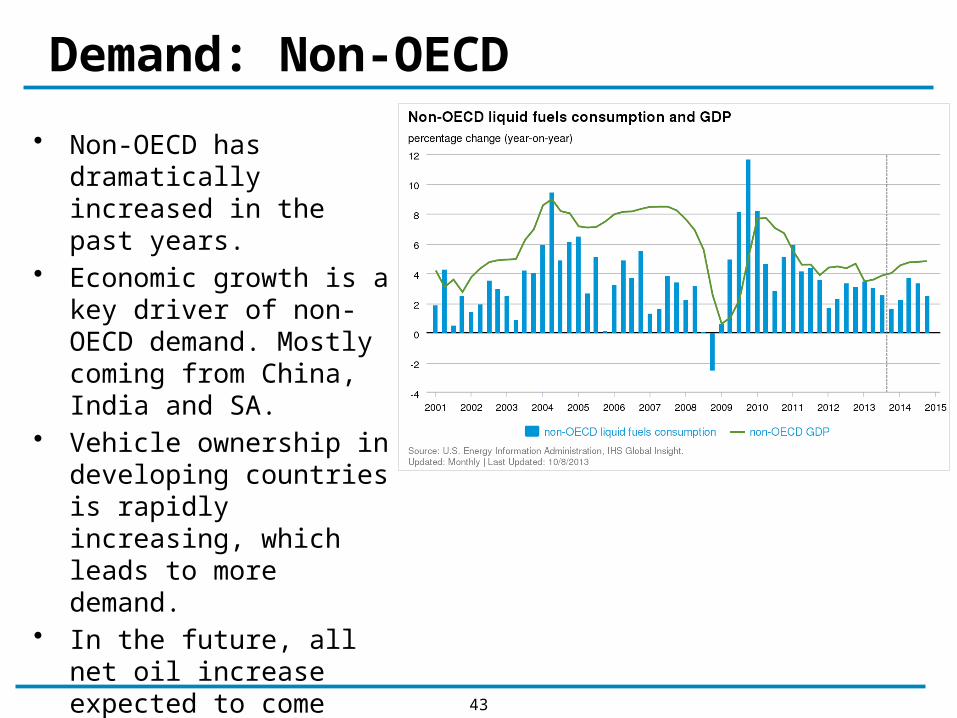
• Non-OECD has dramatically increased in the past years.
• Economic growth is a key driver of non-OECD demand. Mostly coming from China, India and SA.
• Vehicle ownership in developing countries is rapidly increasing, which leads to more demand.
• In the future, all net oil increase expected to come from non-OECD countries.

44
Inventories
45
Cost of gasoline
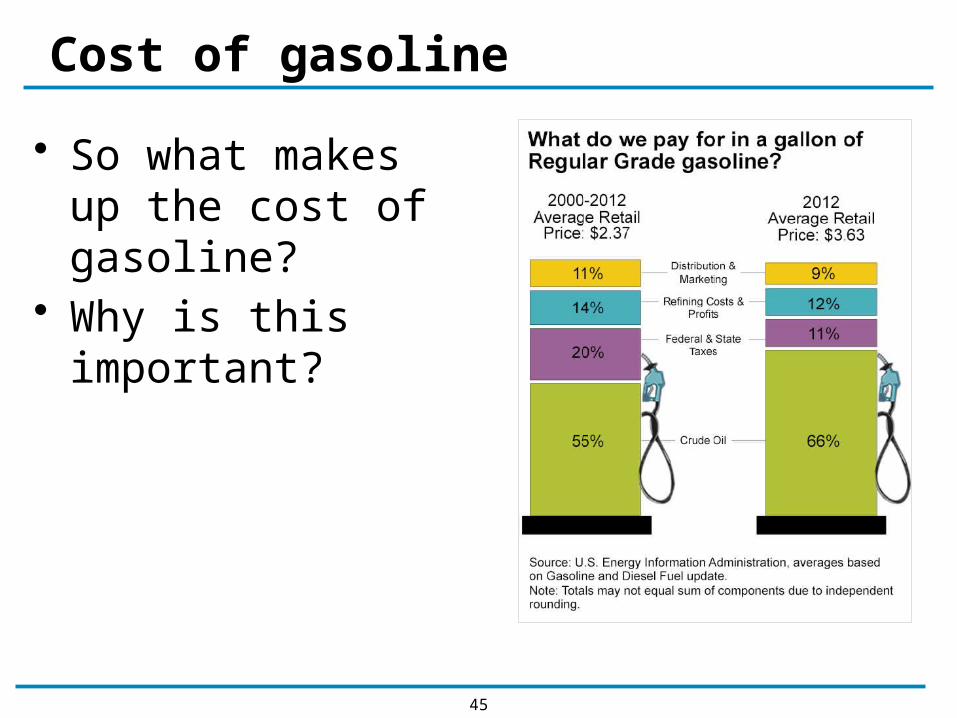
• So what makes up the cost of gasoline?
• Why is this important?

46
END
47
Are we running out?
• There is a finite amount of oil in the ground, so by definition every day there is less oil in the ground.
• Peak oil