Embed Size (px)
Citation preview

October 22, 2008Rita Bates
New Mexico Environment DepartmentAir Quality Bureau
Regional Air Quality Analysis: Four Corners
Four Corners Overview
• Arizona, Colorado, New Mexico, Utah, Navajo Nation, Ute Mountain Ute, Southern Ute Indian Tribe
• Federal agencies: NPS, USFS, BLM• San Juan Basin produces 4 billion cubic feet of
natural gas daily (1.5 trillion ft3 annually) [2004 survey]
• 6 to 8% of U.S. Natural Gas production.• California’s largest source of natural gas.• 17.6 million TPY coal mined.• Expansive untapped coal, oil and gas reserves. • 7 Class I areas within 250 km
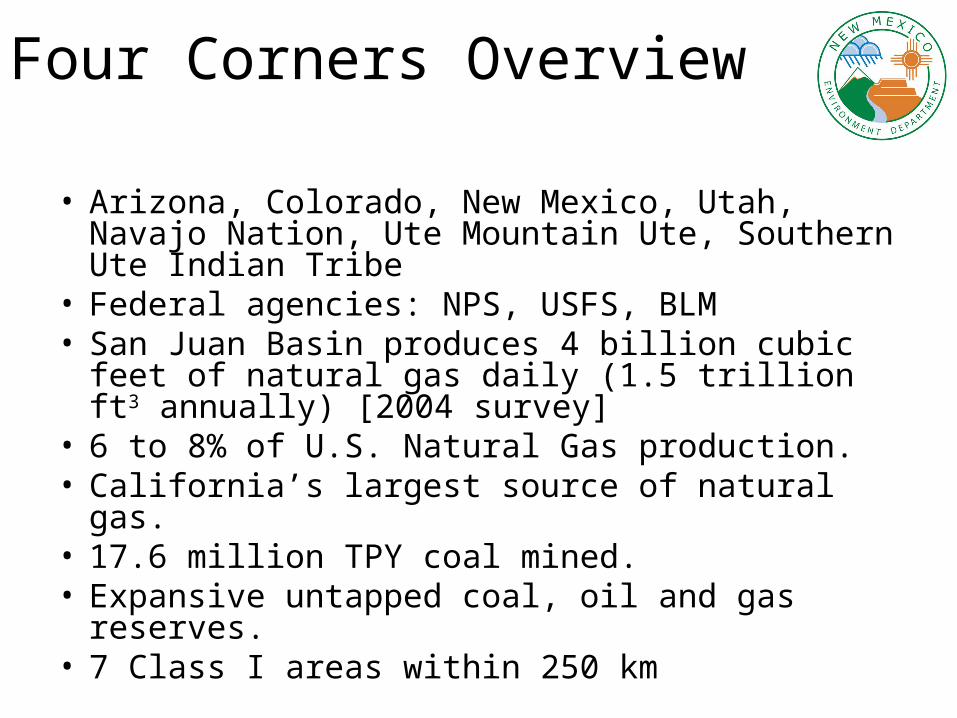
Four Corners Air Quality Task Force
• Began meeting November 2005• Approximately 250 members and
interested parties• Task Force Report final version released
November 2007– Report includes mitigation options developed
by task force members– Over 500 pages
• http://www.4cornersair.org

Four Corners Class I Areas
New Mexico
Colorado
Utah
Arizona

Energy Generation
• 3840 megawatts of existing coal fired power
• Proposed 1500 MW Desert Rock Energy Facility coal-fired power plant
• Economic pressure to develop resource
• Active environmental community

Oil and Gas Production
• 18,000 existing oil and gas wells in New Mexico part of San Juan Basin
• 10,000 projected for next 20 years in NM
• Many small unpermitted sources
• Multiple operators
• Changing field conditions

Oil & Gas Wells in Four Corners (as of 2003)


NM Action on Oil & Gas Production
• Statutory stringency limitations on new regulations.
• Existing Engines: NM is evaluating the need for new regulations. Has worked with BLM to incorporate a limit in the Permit to Drill COA
• New Engines: EPA New Source Performance Standard (NSPS) Subpart JJJJ Summary
• San Juan VISTAS program – 3 partners who have pledged to voluntarily reduce
some emissions leading to ozone, haze, & climate change
• Continued inventory and modeling work

Four Corners Agency ActionOil & Gas Production
• Federal Land Managers (BLM, FS, NPS), EPA and Tribes are working cooperatively to minimize impacts– BMPs for Tanks– Optimization, Centralization, Co-location– Control of existing/new engines in permits to drill
• EPA working on rule/protocol for using Optical imaging for leak detection
• Continued inventory and modeling work to ensure region meets federal air quality standards

Four Corners Modeling Project Objectives
• Model air quality, visibility, deposition impacts of air emissions in the Four Corners region for 2005 & 2018
• Evaluate impacts of alternative mitigation strategies
• Primary focus on impacts in Mesa Verde and Weminuche Class I areas and surrounding Class II areas.

Modeling Information Distribution
• All modeling work is now anticipated to be complete by Spring 2009
• Modeling results will be presented at a Four Corners Air Quality Group (4CAQG) update meeting scheduled for Spring/Early Summer 2009 in Durango, CO at Fort Lewis College
• Modeling results will also be made available online, http://www.4cornersair.org

Four Corners Modeling Schedule
Task: Completion Date:
Completion of 2005 base case runs with model performance evaluations.
End of August 2008
2018 ozone source apportionment (OSAT) model run. (3-4 weeks)
End of November 2008
2018 PM source apportionment (PSAT) run.
Unknown
Use 2018 OSAT and PSAT results to reevaluate the mitigation scenarios. Finalize the mitigation scenarios using more specific source (using Standard Industrial Classification (SIC) code) percent reductions associated with mitigation
Mid December
Mitigation Scenario Modeling February 2009
Complete Model & Final Report June 2009

2005 and 2018 Power Plant Emissions
Facility NameNOx SO2 NOx SO2
Four Corners Power Plant 41,7431a 12,6531a 50,9812a 17,9352a
San Juan 26,8091a 16,5691a 16,5462b** 9,3522b**
Prewitt Escalante Generating Station 3,7971a 1,2931a 3,7292c** 1,7962c**
Reeves Generating Station 1511a 01a* 1512d 02d
Milagro 1101a 31a 1102d 32d
Animas 541b 01b 542d 02d
Person Generating Project 41a 01a* 42d 02d
Desert Rock n/a n/a 3,3252e 3,3192e
Future Coal Units n/a n/a 2,6802f 2,9042f
Total Emissions (tons) 72,668 30,518 77,580 35,310
2. 2018 base case emissions data are estimated using: (a) per EPA9/Steve Frey, NOx from Acid Rain Permit, SO2 conservative estimate from FIP with 88% control; (b) Presumptive BART limits; (c) WRAP PRP18a; (d) assuming constant emissions rate from 2005 to 2018, gas plants,(e) Desert Rock Energy Facility PSD Permit Application; (f) WRAP PRP based on EIA projections.
**Prorated heat input 2005-2018 is accounted for in the calculations for San Juan Generating Station
2005 2018
1. 2005 base case emissions data are from: (a) EPA Facility & Unit Emissions reports 2005 (CEMS) data, (b) NMED 2005 emissions inventory, & (c) EPA 9 emissions 2005 inventory info estimate for PM emissions.* for Reeves & Person SO2 is <0.5 Tons (gas turbine plants)

2005 and 2018 Oil & Gas Emissions – NOxNOx - 2005
State (1) Compressor Engines
(2) Compressor Engines & Heaters
(3) Compressor Stations
(4) Compressor Station & Gas Processing Plant (5) Drill Rigs (6) Heaters
(7) Smaller NOx sources Total
Arizona 6 - - - - 6 - 13 Colorado 234 4,694 - 2,548 326 157 203 8,163 New Mexico 27,608 - - 19,834 2,042 7,445 753 57,682 Utah 14 - - 352 28 9 - 403 Navajo Nation - - - 2,570 - - - 2,570 Total 27,863 4,694 - 25,304 2,396 7,618 956 68,831
NOx - 2018
State (1) Compressor Engines
(2) Compressor Engines & Heaters
(3) Compressor Stations
(4) Compressor Station & Gas Processing Plant (5) Drill Rigs (6) Heaters
(7) Smaller NOx sources Total
Arizona 6 - - - - 6 - 13 Colorado 337 4,694 291 2,456 354 244 203 8,579 New Mexico 30,170 - 3,126 20,796 2,148 8,405 898 65,543 Utah 14 - - 233 28 9 - 284 Navajo Nation - - - 3,622 - - - 3,622 Total 30,528 4,694 3,417 27,107 2,529 8,664 1,101 78,040
(1) WRAP Area O&G + (NSJCBM + FRMP) Growth (2) 2005 SUIT Engines (3) (NSJCBM + FRMP) Growth (4) WRAP PRP18 Point O&G(5) WRAP Area O&G + 2005 SUIT + NSJCBM Growth(6) WRAP Area O&G + (NSJCBM + FRMP) Growth (7) WRAP Area O&G

2005 and 2018 Oil & Gas Emissions – VOC
VOC - 2005
State (1) Completion - Flaring & Venting (2) Flashing (3) Fugitives
(4) Gas Plants, All Compressors, Heaters
(5) All Other Engines (6) Venting Total
Arizona - 24 - 9 4 - 37 Colorado 484 224 0 3,301 64 1 4,074 New Mexico 17,718 6,528 36,988 10,947 584 44,571 117,335 Utah - 426 - 96 10 - 532 Navajo Nation - - - 293 - - 293 Total 18,202 7,201 36,988 14,646 661 44,572 122,270
VOC - 2018
State (1) Completion - Flaring & Venting (2) Flashing (3) Fugitives
(4) Gas Plants, All Compressors, Heaters
(5) All Other Engines (6) Venting Total
Arizona - 14 - 19 4 - 37 Colorado 484 224 0 3,773 66 1 4,548 New Mexico 21,438 7,935 44,773 14,274 701 53,932 143,052 Utah - 424 - 123 10 - 556 Navajo Nation - - - 1,036 - - 1,036 Total 21,922 8,597 44,773 19,224 780 53,933 149,229
Notes: (1) WRAP Area O&G (2) WRAP Area O&G (3) WRAP Area O&G + 2005 SUIT(4) WRAP Area O&G + (NSJCBM + FRMP) Growth + WRAP Point O&G + 2005 SUIT(5) WRAP Area O&G + NSJCBM Growth + 2005 SUIT(6) WRAP Area O&G + 2005 SUIT

2005 NOxSTATE Area Biogenics Off-road On-road Area Oil & Gas Point Oil & Gas EGU NonEGU Grand TotalArizona 97 1,102 2,407 4,661 13 0 0 0 8,279Colorado 302 2,731 1,910 3,757 921 2,548 0 535 12,703Navajo Nation 0 0 0 0 0 2,570 41,743 1,010 45,323New Mexico 16,036 4,032 11,219 30,182 37,848 19,834 30,925 3,615 153,692Puebla of Laguna 0 0 0 0 0 0 0 1,551 1,551Puebla of Santa Anna 0 0 0 0 0 0 0 209 209Southern Ute 0 0 0 0 0 4,694 0 0 4,694Utah 42 582 181 741 51 352 0 78 2,027Ute Mountain Reserv 0 0 0 0 0 0 0 0 0Grand Total 16,477 8,447 15,717 39,340 38,832 29,998 72,668 6,997 228,477
2018 NOxState Area Biogenics Off-road On-road Area Oil & Gas Point Oil & Gas EGU NonEGU Grand TotalArizona 117 1,102 1,217 1,934 13 1,340 0 5,724Colorado 366 2,731 1,269 1,456 946 2,456 701 9,923Farmington RMP Area 6,117 6,117Navajo Nation 3,622 54,306 955 58,883New Mexico 20,700 4,032 6,142 9,658 38,630 20,796 21,934 3,777 125,670Northern San Juan CBM Project Area 483 483Puebla of Laguna 2,038 2,038Puebla of Santa Anna 209 209Southern Ute 4,694 4,694Utah 47 582 115 337 50 233 89 1,454Ute Mountain Reserv 0 0Grand Total 21,231 8,447 8,743 13,385 39,639 38,401 77,580 7,770 215,196
%NOx differenceState Area Biogenics Off-road On-road Area Oil & Gas Point Oil & Gas EGU NonEGU Grand TotalArizona 21.49% 0.00% -49.42% -58.50% -0.02% -30.86%Colorado 21.17% 0.00% -33.59% -61.25% 2.69% -3.62% 31.14% -21.88%Farmington RMP AreaNavajo Nation 40.95% 30.09% -5.43% 29.92%New Mexico 29.08% 0.00% -45.25% -68.00% 2.07% 4.85% -29.07% 4.49% -18.23%Northern San Juan CBM Project AreaPuebla of Laguna 31.42% 31.42%Puebla of Santa Anna 0.00% 0.00%Southern Ute 0.00% 0.00%Utah 11.86% 0.00% -36.52% -54.52% -0.04% -33.79% 14.31% -28.26%Ute Mountain ReservGrand Total 28.85% 0.00% -44.37% -65.98% 2.08% 28.01% 6.76% 11.04% -5.81%

2005 VOCSTATE Area Biogenics Off-road On-road Area Oil & Gas Point Oil & Gas EGU* NonEGU Grand TotalArizona 2,204 24,028 728 3,314 37 0 0 0 30,310Colorado 3,632 83,394 4,884 2,616 891 1,257 0 348 97,022Navajo Nation 0 0 0 0 0 293 17 121 431New Mexico 26,675 90,934 5,690 17,079 109,480 7,857 264 1,849 259,828Puebla of Laguna 0 0 0 0 0 0 0 11 11Puebla of Santa Anna 0 0 0 0 0 0 0 49 49Southern Ute 0 0 0 0 0 1,926 0 0 1,926Utah 479 14,694 388 490 455 77 0 52 16,634Ute Mountain Reserv 0 0 0 0 0 0 0 0 0Grand Total 32,989 213,050 11,690 23,499 110,862 11,410 281 2,429 406,210
2018 VOCState Area Biogenics Off-road On-road Area Oil & Gas Point Oil & Gas EGU NonEGU Grand TotalArizona 2,602 24,028 469 1,848 37 41 0 29,026Colorado 4,341 83,394 3,299 1,217 892 1,246 413 94,802Farmington RMP Area 3,220 3,220Navajo Nation 1,036 184 38 1,258New Mexico 34,313 90,934 4,179 7,753 131,900 7,930 356 2,153 279,518Northern San Juan CBM Project Area 484 484Puebla of Laguna 13 13Puebla of Santa Anna 49 49Southern Ute 1,926 1,926Utah 651 14,694 246 277 453 103 72 16,495Ute Mountain Reserv 0 0Grand Total 41,906 213,050 8,193 11,094 133,282 15,945 581 2,738 426,789
%VOC differenceState Area Biogenics Off-road On-road Area Oil & Gas Point Oil & Gas EGU NonEGU Grand TotalArizona 18.09% 0.00% -35.57% -44.23% 0.00% -4.24%Colorado 19.50% 0.00% -32.44% -53.49% 0.16% -0.85% 18.66% -2.29%Farmington RMP AreaNavajo Nation 253.75% 954.60% -68.23% 191.67%New Mexico 28.63% 0.00% -26.57% -54.61% 20.48% 0.93% 34.89% 16.49% 7.58%Northern San Juan CBM Project AreaPuebla of Laguna 20.26% 20.26%Puebla of Santa Anna 0.00% 0.00%Southern Ute 0.00% 0.00%Utah 35.90% 0.00% -36.74% -43.43% -0.33% 34.30% 37.03% -0.84%Ute Mountain ReservGrand Total 27.03% 0.00% -29.92% -52.79% 20.22% 39.75% 106.45% 12.71% 5.07%

2005 SO2STATE Area Off-road On-road Area Oil & Gas Point Oil & Gas EGU NonEGU Grand TotalArizona 20 119 52 0 0 0 0 191Colorado 135 53 62 19 14 0 105 388Navajo Nation 0 0 0 0 35 12,653 179 12,867New Mexico 5,580 625 543 116 552 17,866 3,020 28,302Puebla of Laguna 0 0 0 0 0 0 0 0Puebla of Santa Anna 0 0 0 0 0 0 53 53Southern Ute 0 0 0 0 0 0 0 0Utah 54 13 12 1 0 0 1,581 1,660Ute Mountain Reserv 0 0 0 0 0 0 0 0Grand Total 5,789 809 669 136 602 30,518 4,938 43,462
2018 SO2State Area Off-road On-road Area Oil & Gas Point Oil & Gas EGU NonEGU Grand TotalArizona 24 1 20 0 1,452 0 1,496Colorado 146 5 16 19 12 141 339Farmington RMP Area 0 0Navajo Nation 155 21,253 266 21,674New Mexico 13,204 60 140 122 548 12,607 3,180 29,861Northern San Juan CBM Project Area 0 0Puebla of Laguna 0 0Puebla of Santa Anna 53 53Southern Ute 0Utah 54 0 4 1 0 2,122 2,182Ute Mountain Reserv 0 0Grand Total 13,428 66 180 142 715 35,312 5,763 55,606
%SO2 differenceState Area Off-road On-road Area Oil & Gas Point Oil & Gas EGU NonEGU Grand TotalArizona 17.72% -99.52% -61.72% 683.87%Colorado 8.63% -91.07% -74.04% 1.07% -13.85% 33.97% -12.54%Farmington RMP AreaNavajo Nation 337.34% 67.97% 48.94% 68.45%New Mexico 136.61% -90.40% -74.22% 4.92% -0.74% -29.44% 5.31% 5.51%Northern San Juan CBM Project AreaPuebla of LagunaPuebla of Santa Anna 0.00% 0.00%Southern UteUtah 0.94% -97.14% -67.24% -0.03% 78.88% 34.23% 31.42%Ute Mountain ReservGrand Total 131.97% -91.89% -73.11% 4.34% 18.94% 15.71% 16.70% 27.94%
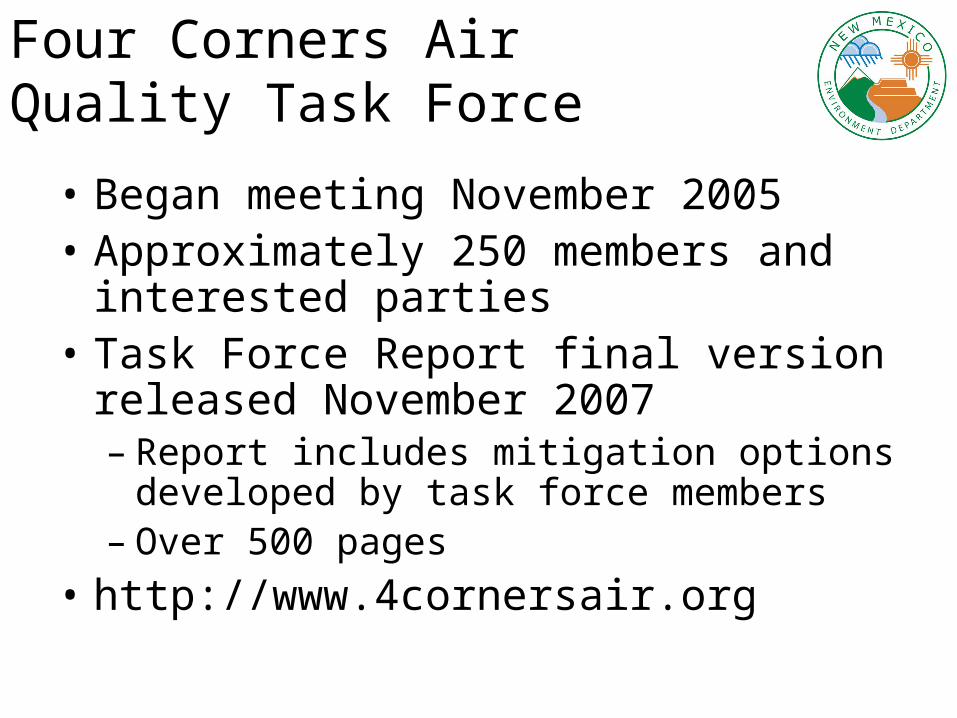
Ozone Monitoring Sites in Four Corners Area

Waterflow
SO2
NOx
Ozone
Met
PM10
PM2.5
SO2
NOx
Ozone
Met
NOx
Ozone
PM 2.5
NH3
Met
Northwestern New Mexico Air Quality Monitoring
NMED Air Monitoring website real time data: http://air.nmenv.state.nm.us/ *Also in process of installing mercury total deposition air monitor at Navajo Lake site 2008
*Four Corners Ammonia study recently published in Journal of Environmental Monitoring
NH3(airport)

8-hour Ozone --- 4th MaximumFour Corners Area
0.040
0.060
0.080
0.100
1990
1991
1992
1993
1994
1995
1996
1997
1998
1999
2000
2001
2002
2003
2004
2005
2006
2007
2008
Year
pp
m
Ute-Ignacio, CO Ute-Redmesa, CO Ute-Hw y. 550, COMesa Verde NP USFS-Shamrock Bloomfield, NMShiprock Sub, NM Navajo Lake, NM Canyonlands NP
8-hr. level of 2008 standard = 0.075 ppm
Data thru 06/30/08 or 08/15/08

*We have observed relatively high levels of ozone at Navajo Lake site this October 2008. & based on a few high days middle of October our 4th highest 8-hour average there this year increased to 77 ppb [Oct 18] (preliminary). 3-yr average exceeds 75 ppb NAAQS at Navajo Lake site.
Northwestern New Mexico Air Quality Monitoring
0.06
0.065
0.07
0.075
0.08
0.085
0.09
1999 2000 2001 2002 2003 2004 2005 2006 2007 2008 2009 2010
Substation Monitor3-year average of4th highest 8-houraverages, ppm
Bloomfield Monitor 3-year average of 4thhighest 8-houraverages, ppm
Navajo Lake Monitor3-year average of4th highest 8-houraverages, ppm
NAAQS 8-hourOzone Std

Four Corners Monitoring Information
• Monitoring data for our 3 ozone monitors in San Juan County are available online (real time & archived) as well as in summary format showing the annual design values that are compared to the federal standard for attainment status
• The 3-year average design values for the NM San Juan County ozone monitors are currently 65, 71, and 77 ppb
• Passive ozone studies and other research has been done throughout the area

San Juan VISTAS
Voluntary Innovative Strategies for Today’s Air Standards
• San Juan VISTAS is a voluntary emission control program administered by the New Mexico Environment Department (NMED) for the improvement of air quality.
VISTAS History • Began in 2005 as a result of EAC work• Modeled after EPA Gas STAR program

What’s The Purpose?
Prevent pollution
• The purpose of San Juan VISTAS is to identify, promote, and implement practices and technologies to reduce emissions that contribute to ozone, haze, and climate change.

Questions?
New Mexico Environment Department Air Quality Bureau
Farmington Office Santa Fe3400 Messina Drive 1301 Siler Rd., Bldg. BFarmington, NM 87402 Santa Fe, NM 87507(505) 566-9746 (505) 476-4300
Project Websites:Four Corners Air Quality Group: http://www.4cornersair.orgFour Corners Modeling Project: http://www.4cornersair.org – go to modeling project linkSan Juan VISTAS: http://www.nmenv.state.nm.us/aqb/projects/SJV/index.html
Homepage: http://www.nmenv.state.nm.us/aqb/