Embed Size (px)
Citation preview
October 21, 2011 C. Purdy--Graduate Seminar--Design of Experiments
1
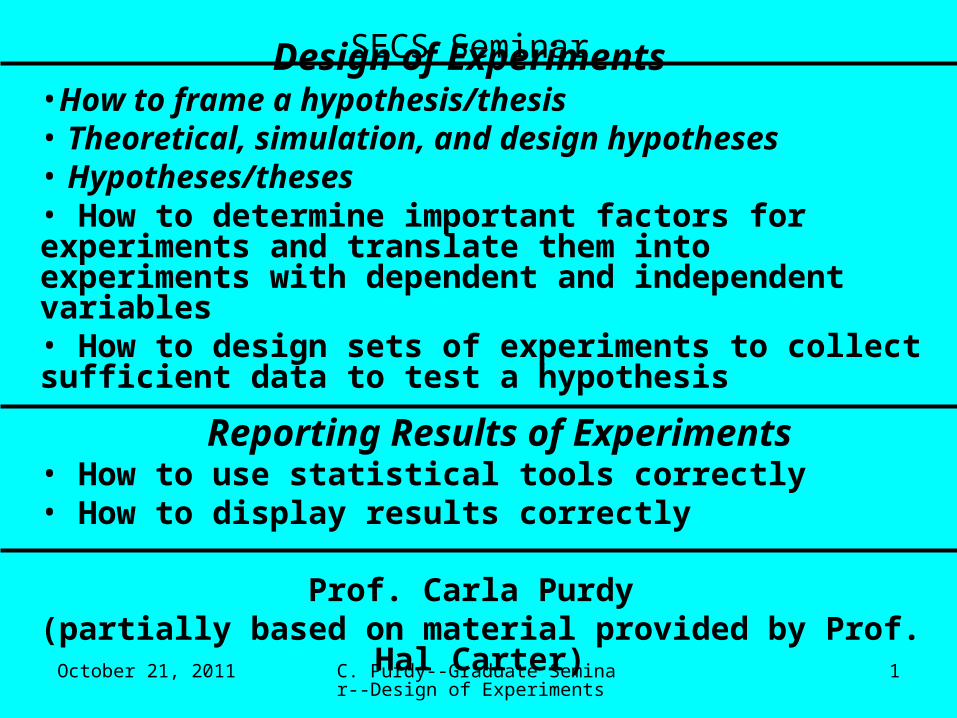
SECS SeminarDesign of Experiments
•How to frame a hypothesis/thesis • Theoretical, simulation, and design hypotheses• Hypotheses/theses• How to determine important factors for experiments and translate them into experiments with dependent and independent variables • How to design sets of experiments to collect sufficient data to test a hypothesis
Reporting Results of Experiments• How to use statistical tools correctly • How to display results correctly
Prof. Carla Purdy (partially based on material provided by Prof. Hal Carter)
October 21, 2011 C. Purdy--Graduate Seminar--Design of Experiments
2
IMPORTANT THINGS TO REMEMBER
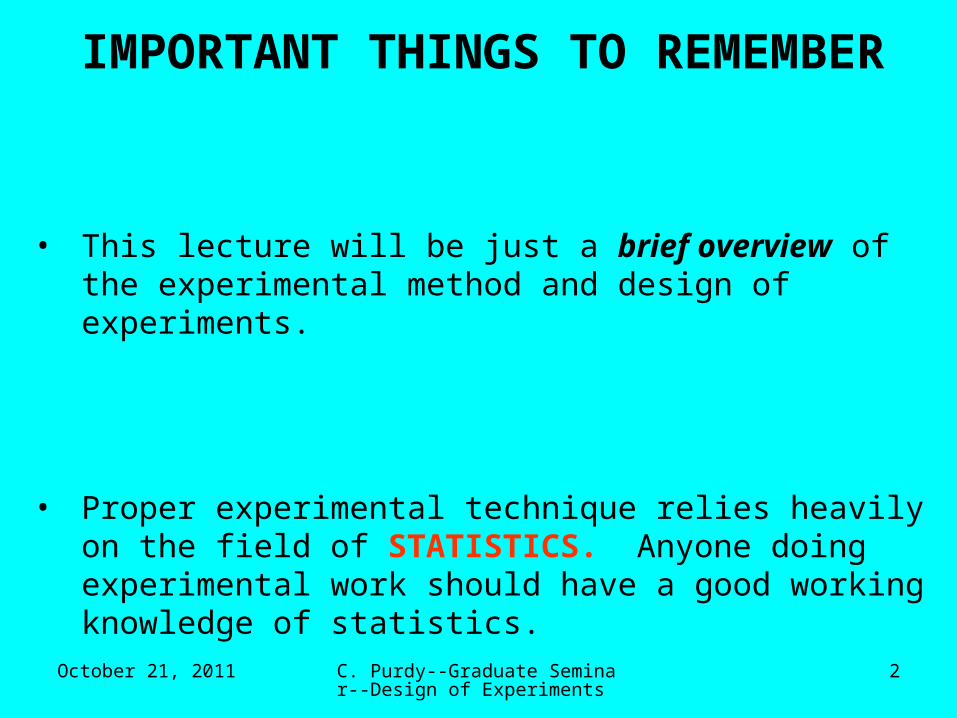
• This lecture will be just a brief overview of the experimental method and design of experiments.
• Proper experimental technique relies heavily on the field of STATISTICS. Anyone doing experimental work should have a good working knowledge of statistics.

October 21, 2011 C. Purdy--Graduate Seminar--Design of Experiments
3
World Models
Theory(Classical) Probability
Assume a coin with
P(H) = p, P(T) = 1-p
Assume each coin toss is independent of the others.
After N tosses, the expected number of heads is Np, the standard deviation is Np(1-p), ...
Experiment: Real-world Errors
Statistics
Given a coin, toss it N times.
The number of heads is K, where 0 < K < N
The number K is the sample mean.
If we repeat the experiment M times, we will have M sample means.
p = ?
October 21, 2011 C. Purdy--Graduate Seminar--Design of Experiments
4
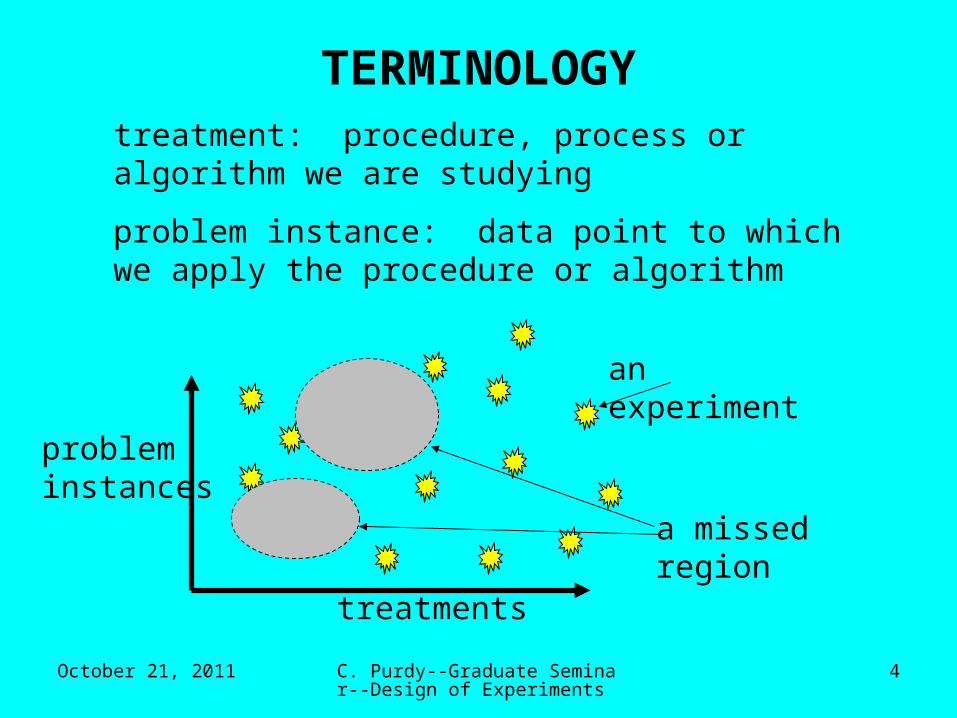
TERMINOLOGYtreatment: procedure, process or algorithm we are studying
problem instance: data point to which we apply the procedure or algorithm
treatments
probleminstances
a missed region
an experiment
October 21, 2011 C. Purdy--Graduate Seminar--Design of Experiments
5
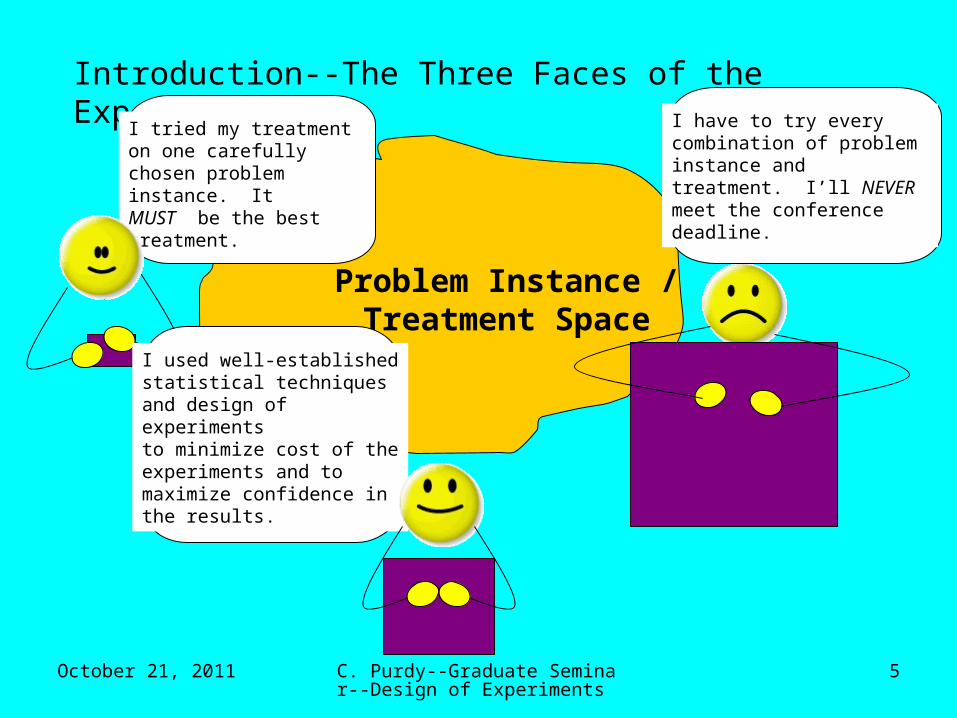
Introduction--The Three Faces of the Experimenter
Problem Instance / Treatment Space
I tried my treatmenton one carefully chosen problem instance. It MUST be the best treatment.
I have to try every combination of problem instance and treatment. I’ll NEVER meet the conference deadline.
I used well-establishedstatistical techniquesand design of experimentsto minimize cost of theexperiments and tomaximize confidence inthe results.

October 21, 2011 C. Purdy--Graduate Seminar--Design of Experiments
6
Experiment: needs a hypothesis
What is a hypothesis?
A hypothesis is an assumption not proved by experiment or observation that is made for the sake of testing its soundness.
--neurolab.isc.nasa.gov/glosseh.htm
October 21, 2011 C. Purdy--Graduate Seminar--Design of Experiments
7
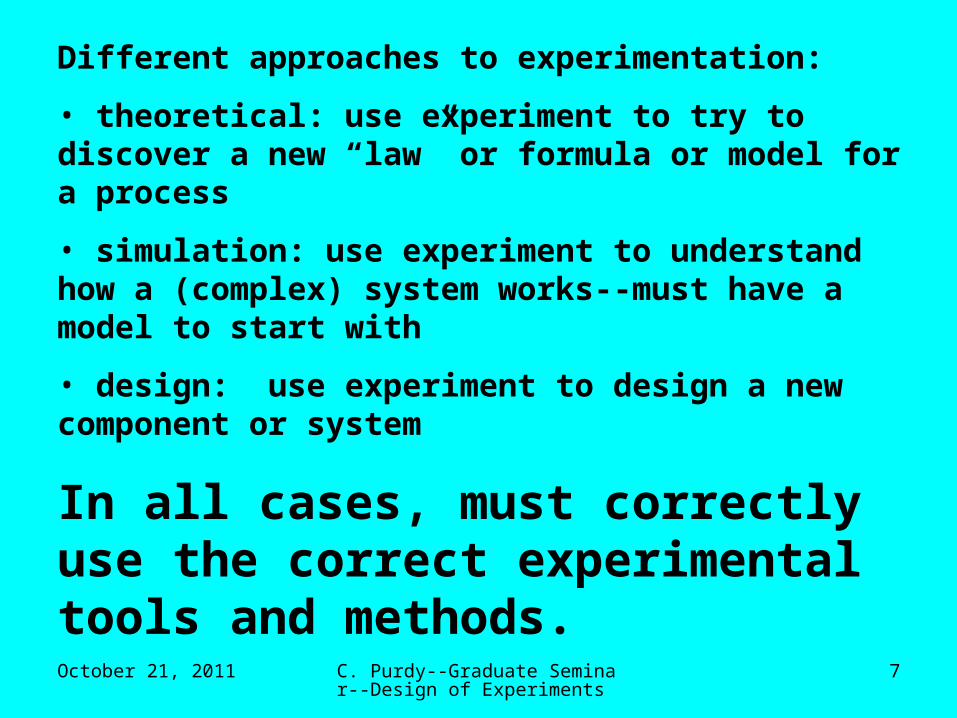
Different approaches to experimentation:
• theoretical: use experiment to try to discover a new “law” or formula or model for a process
• simulation: use experiment to understand how a (complex) system works--must have a model to start with
• design: use experiment to design a new component or system
In all cases, must correctly use the correct experimental tools and methods.

October 21, 2011 C. Purdy--Graduate Seminar--Design of Experiments
8
What is the experimental method?
experimental method - the use of controlled observations and measurements to test hypotheses
exploratory study - preliminary examination of data/treatment space to develop hypotheses which can be tested through experiment
Cohen, Empirical Methods for Artificial Intelligence, MIT Press, 1995

October 21, 2011 C. Purdy--Graduate Seminar--Design of Experiments
9
10 IMPORTANT THINGS TO REMEMBER ABOUT EXPERIMENTS:1. EXPERIMENTS ARE NOT PROOFS.
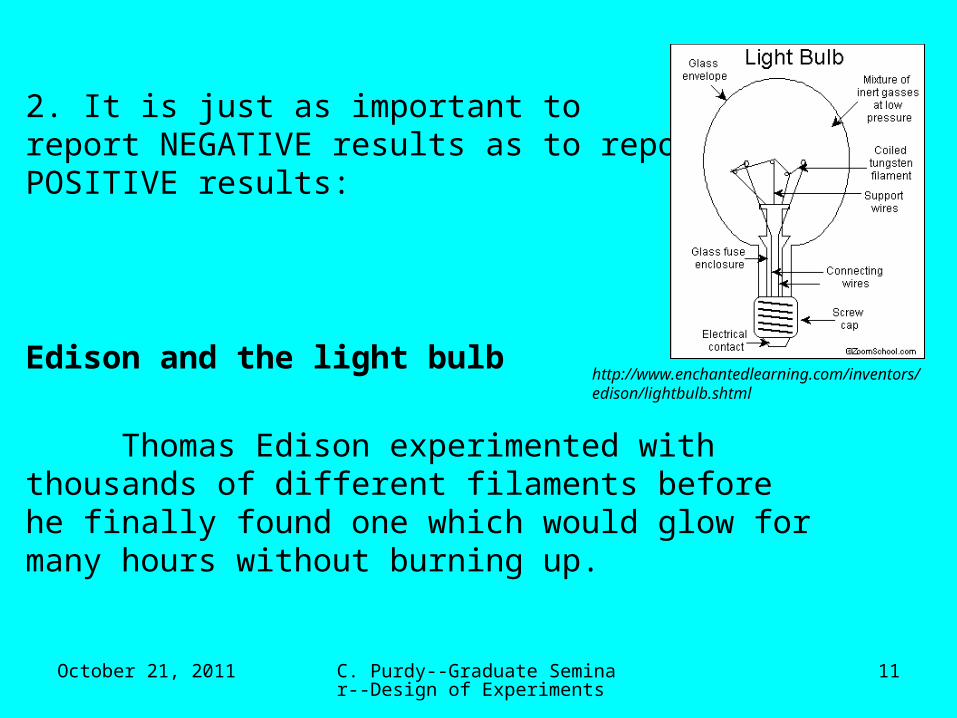
2. It is just as important to report NEGATIVE results as to report POSITIVE results.
3. IGNORING IMPORTANT FACTORS CAN LEAD TO ERRONEOUS CONCLUSIONS, SOMETIMES WITH TRAGIC RESULTS.
4. YOUR RESULTS ARE ONLY VALID FOR THE PART OF THE DATA-TREATMENT SPACE YOU HAVE EXPLORED.
5. An experiment is worthless unless it can be REPEATED.
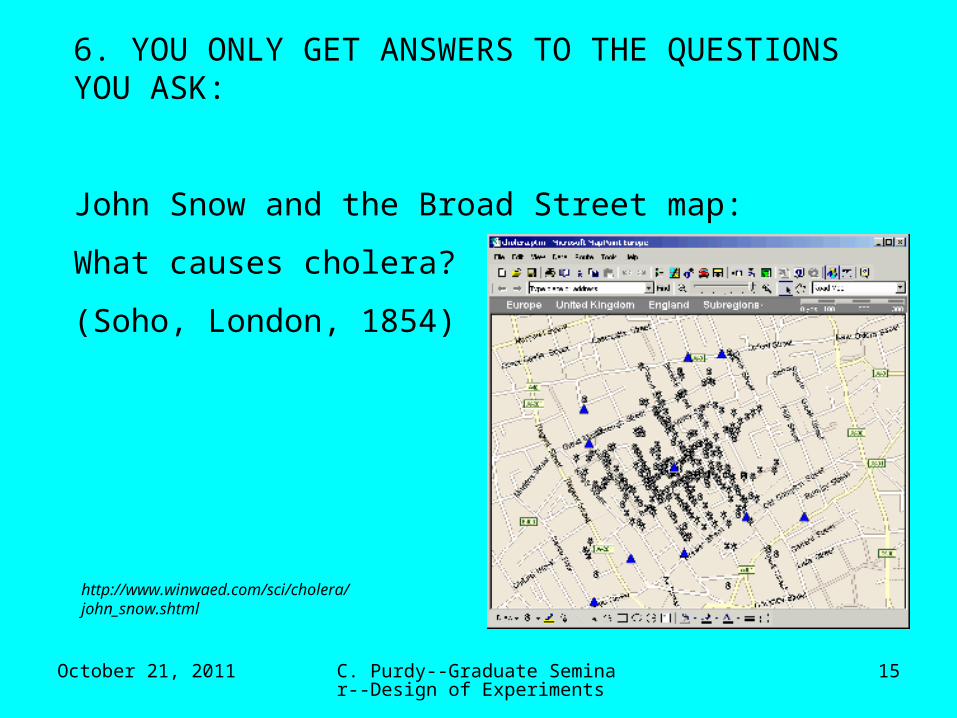
6. YOU ONLY GET ANSWERS TO THE QUESTIONS YOU ASK
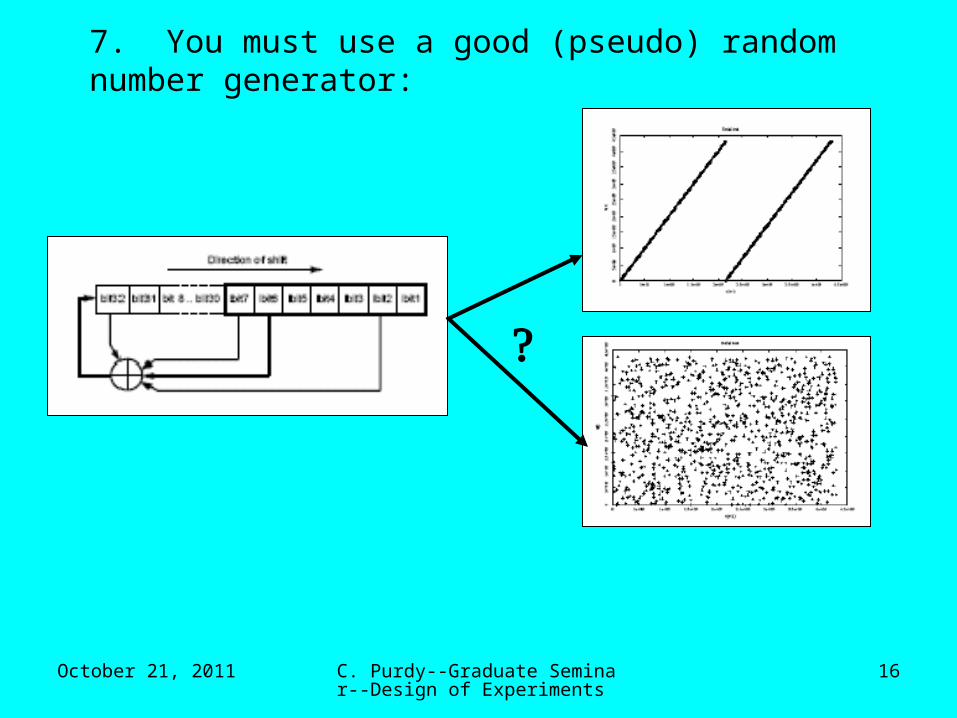
7. You must use a good (pseudo)RANDOM NUMBER GENERATOR
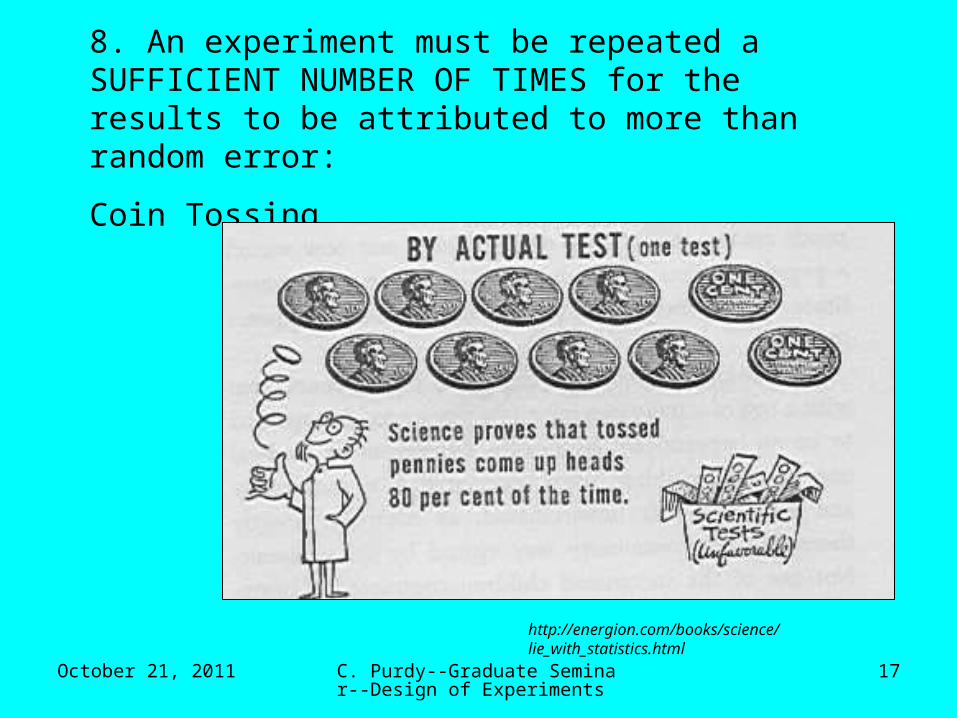
8. An experiment must be repeated a SUFFICIENT NUMBER OF TIMES for the results to be attributed to more than random error
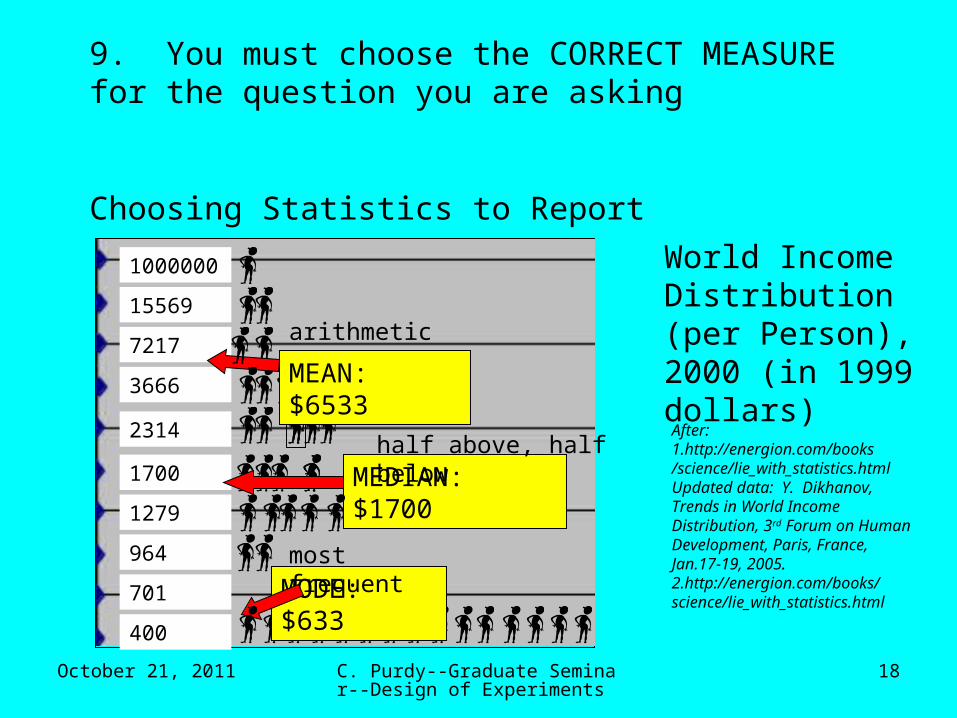
9. You must choose the CORRECT MEASURE for the question you are asking.
10. Reporting CORRECT results, PROPERLY DISPLAYED, is an integral part of a well-done experiment

October 21, 2011 C. Purdy--Graduate Seminar--Design of Experiments
10
1. EXPERIMENTS ARE NOT PROOFS:
the coelacanth
The coelacanth is a prehistoric fish which thrived about 400 million years ago and was thought to be the ancestor of certain land animals.
Scientists believed that the coelacanth became extinct about 66 million years ago.
Why did they believe this? “Experimental” evidence from the fossil record and the lack of any “newer” specimens.
BUT: in 1938 a live coelacanth was caught near South Africa. Many more specimens have since been caught.
http://www.austmus.gov.au/fishes/fishfacts/fish/coela.htm
October 21, 2011 C. Purdy--Graduate Seminar--Design of Experiments
11
2. It is just as important toreport NEGATIVE results as to reportPOSITIVE results:
Edison and the light bulb
Thomas Edison experimented withthousands of different filaments beforehe finally found one which would glow formany hours without burning up.
http://www.enchantedlearning.com/inventors/edison/lightbulb.shtml

October 21, 2011 C. Purdy--Graduate Seminar--Design of Experiments
12
3. IGNORING IMPORTANT FACTORS CAN LEAD TO ERRONEOUS CONCLUSIONS, SOMETIMES WITH TRAGIC RESULTS:
the Space Shuttle Challenger
On January 28, 1986, the Space Shuttle Challenger exploded during launch, killing its entire crew, including the first “Teacher in Space”.
Eventually, the main cause of the accident was determined to be a failure of the “O-ring” seals on one booster rocket, which did not function well in the extreme cold ( about 36o F, 15o below any previous launch).
“Of 21 launches with ambient temperatures of 61 degrees Fahrenheit or greater, only four showed signs of O-ring thermal distress; i.e., erosion or blow-by and soot. Each of the launches below 61. degrees Fahrenheit resulted in one or more O-rings showing signs of thermal distress.”--Report of the Presidential Commission on the Space Shuttle Challenger Accident, U.S. Government Printing Office : 1986 0 -157-336.)
http://news.bbc.co.uk/onthisday/hi/dates/stories/january/28/newsid_2506000/2506161.stm

October 21, 2011 C. Purdy--Graduate Seminar--Design of Experiments
13
4. YOUR RESULTS ARE ONLY VALID FOR THE PART OF THE DATA-TREATMENT SPACE YOU HAVE EXPLORED:
the Blind Men and the Elephant
...Wall? Spear? Snake?Tree? Rope?
www.plumdigital.com/0_general/blindman.html

October 21, 2011 C. Purdy--Graduate Seminar--Design of Experiments
14
5. An experiment is worthless unless it can be REPEATED:
Cold Fusion
In March 1989, Stanley Pons and Martin Fleischmann, University of Utah, announced they had succeeded in creating a method of “tabletop fusion” which would produce large amounts of cheap, clean energy. “Today the
mainstream view is that champions of cold fusion are little better than purveyors of snake oil and good luck charms.”--http://www.spectrum.ieee.org/WEBONLY/resource/sep04/0904nfus.html\
Current events: can a neutrino travel faster than light?
http://www.earthtech.org/experiments/case/setup.html
October 21, 2011 C. Purdy--Graduate Seminar--Design of Experiments
15
6. YOU ONLY GET ANSWERS TO THE QUESTIONS YOU ASK:
John Snow and the Broad Street map:
What causes cholera?
(Soho, London, 1854)
http://www.winwaed.com/sci/cholera/john_snow.shtml
October 21, 2011 C. Purdy--Graduate Seminar--Design of Experiments
16
7. You must use a good (pseudo) random number generator:
October 21, 2011 C. Purdy--Graduate Seminar--Design of Experiments
17
8. An experiment must be repeated a SUFFICIENT NUMBER OF TIMES for the results to be attributed to more than random error:
Coin Tossing
http://energion.com/books/science/lie_with_statistics.html
October 21, 2011 C. Purdy--Graduate Seminar--Design of Experiments
18
1000000
7217
15569
2314
3666
1279
1700
701
964
MEDIAN: $1700
MODE: $633most frequent
arithmetic average
9. You must choose the CORRECT MEASURE for the question you are asking
Choosing Statistics to Report
World Income Distribution (per Person), 2000 (in 1999 dollars)
After: 1.http://energion.com/books/science/lie_with_statistics.htmlUpdated data: Y. Dikhanov,Trends in World IncomeDistribution, 3rd Forum on HumanDevelopment, Paris, France,Jan.17-19, 2005.2.http://energion.com/books/science/lie_with_statistics.html
400
half above, half below
MEAN: $6533

October 21, 2011 C. Purdy--Graduate Seminar--Design of Experiments
19
10. Reporting CORRECT results, PROPERLY DISPLAYED, is an integral part of a well-done experiment:
www.edwardtufte.com
http://energion.com/books/science/lie_with_statistics.html
October 21, 2011 C. Purdy--Graduate Seminar--Design of Experiments
20
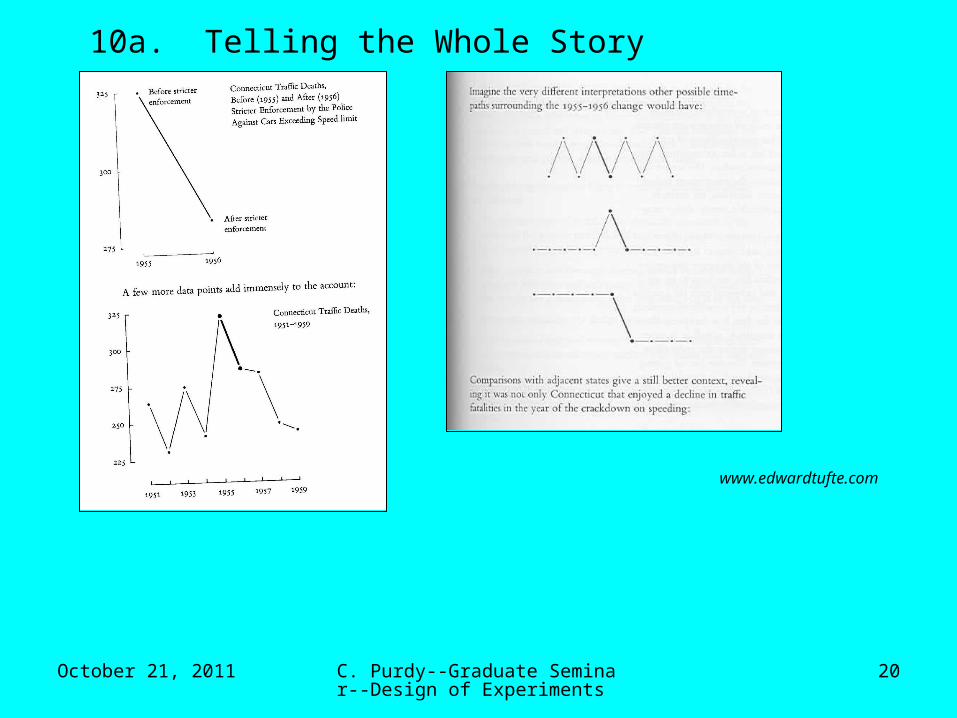
10a. Telling the Whole Story
www.edwardtufte.com
October 21, 2011 C. Purdy--Graduate Seminar--Design of Experiments
21
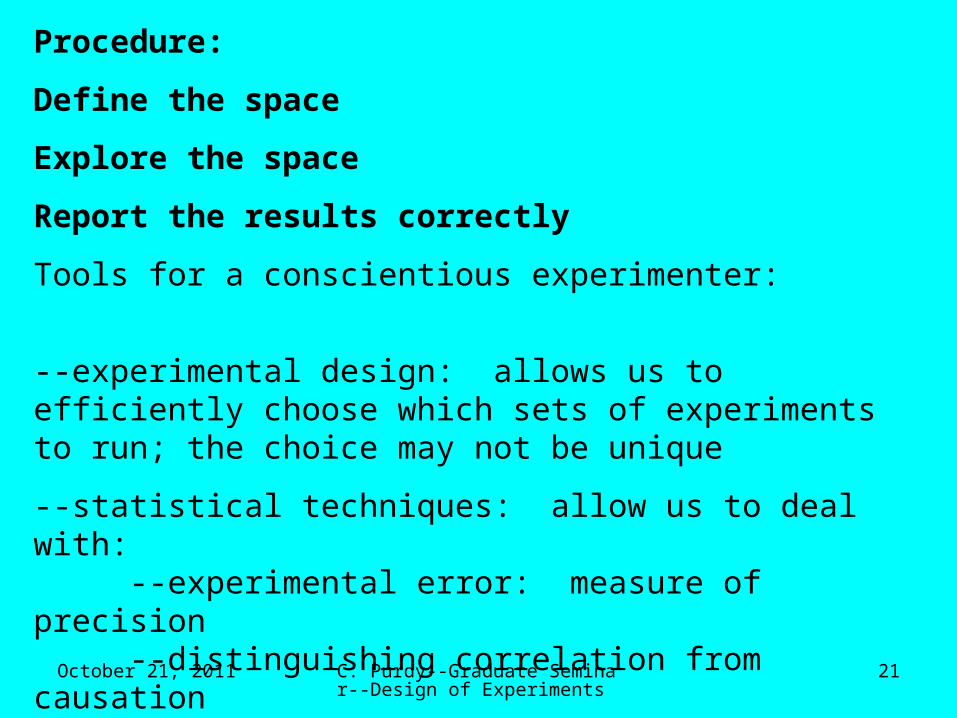
Procedure:
Define the space
Explore the space
Report the results correctly
Tools for a conscientious experimenter:
--experimental design: allows us to efficiently choose which sets of experiments to run; the choice may not be unique
--statistical techniques: allow us to deal with:--experimental error: measure of precision--distinguishing correlation from causation--complexities of the effects under study (e.g., linearities, etc.)
October 21, 2011 C. Purdy--Graduate Seminar--Design of Experiments
22
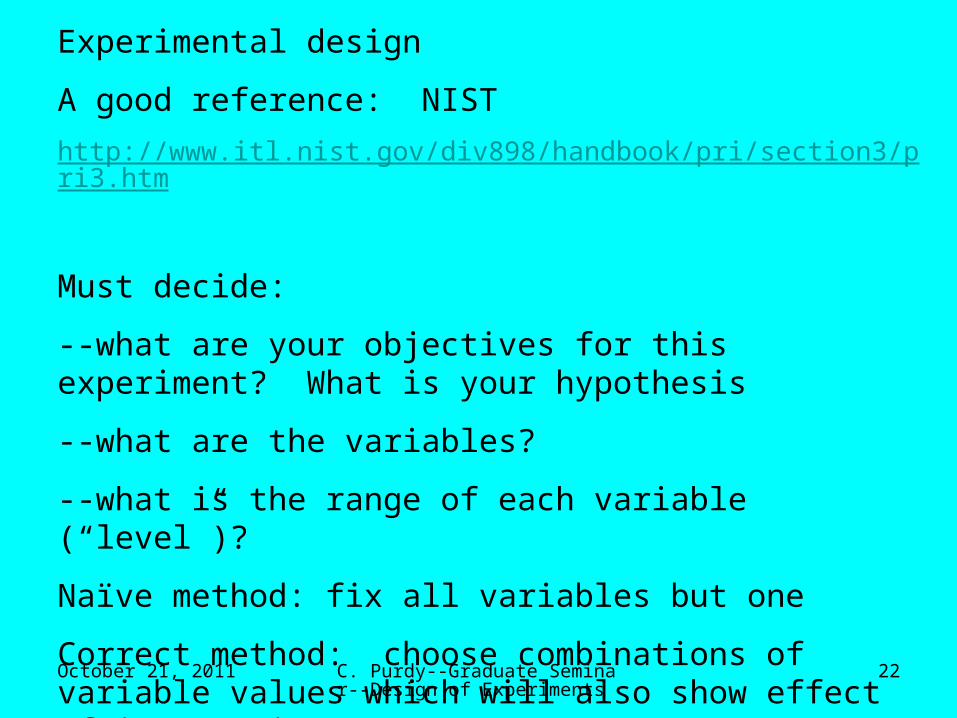
Experimental design
A good reference: NIST
http://www.itl.nist.gov/div898/handbook/pri/section3/pri3.htm
Must decide:
--what are your objectives for this experiment? What is your hypothesis
--what are the variables?
--what is the range of each variable (“level”)?
Naïve method: fix all variables but one
Correct method: choose combinations of variable values which will also show effect of interactions

October 21, 2011 C. Purdy--Graduate Seminar--Design of Experiments
23
• Analyzing and Displaying Data– Simple Statistical Analysis– Comparing Results– Curve Fitting
• Statistics for Factorial Designs– 2K Designs Including Replications– Full Factorial Designs– Fractional Factorial Designs
• Ensuring Data Meets Analysis Criteria• Presenting Your Results; Drawing Conclusions
October 21, 2011 C. Purdy--Graduate Seminar--Design of Experiments
24
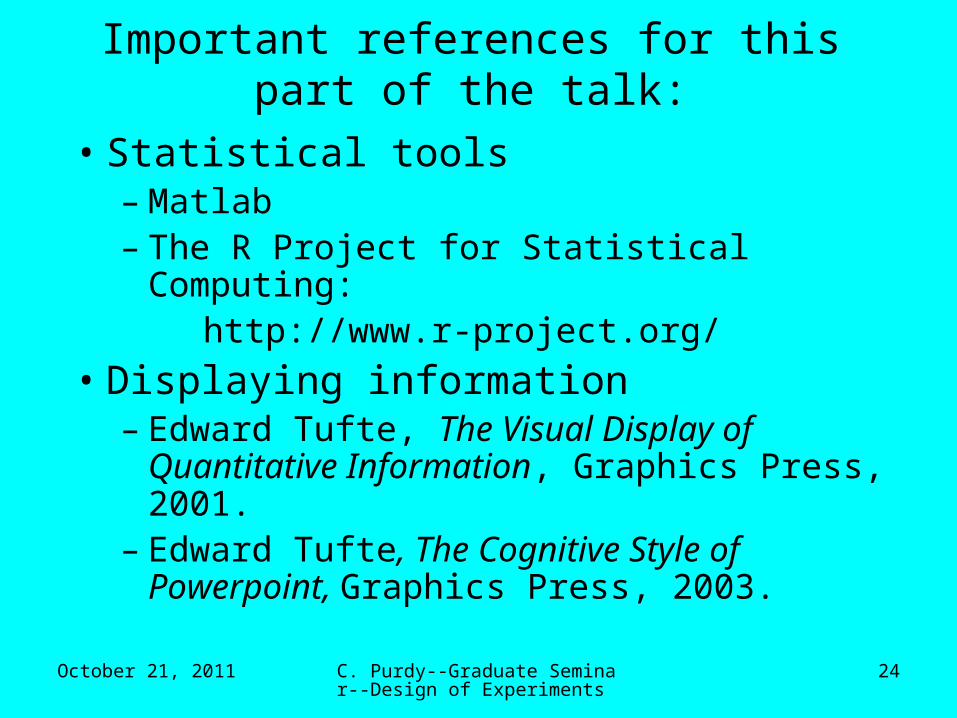
Important references for this part of the talk:
• Statistical tools– Matlab– The R Project for Statistical Computing: http://www.r-project.org/
• Displaying information– Edward Tufte, The Visual Display of
Quantitative Information, Graphics Press, 2001.
– Edward Tufte, The Cognitive Style of Powerpoint, Graphics Press, 2003.

October 21, 2011 C. Purdy--Graduate Seminar--Design of Experiments
25
Example: A System
System (“Black Box”)
SystemInputs
SystemOutputs
Factors(Experimental Conditions)
Responses(Experimental Results)
October 21, 2011 C. Purdy--Graduate Seminar--Design of Experiments
26
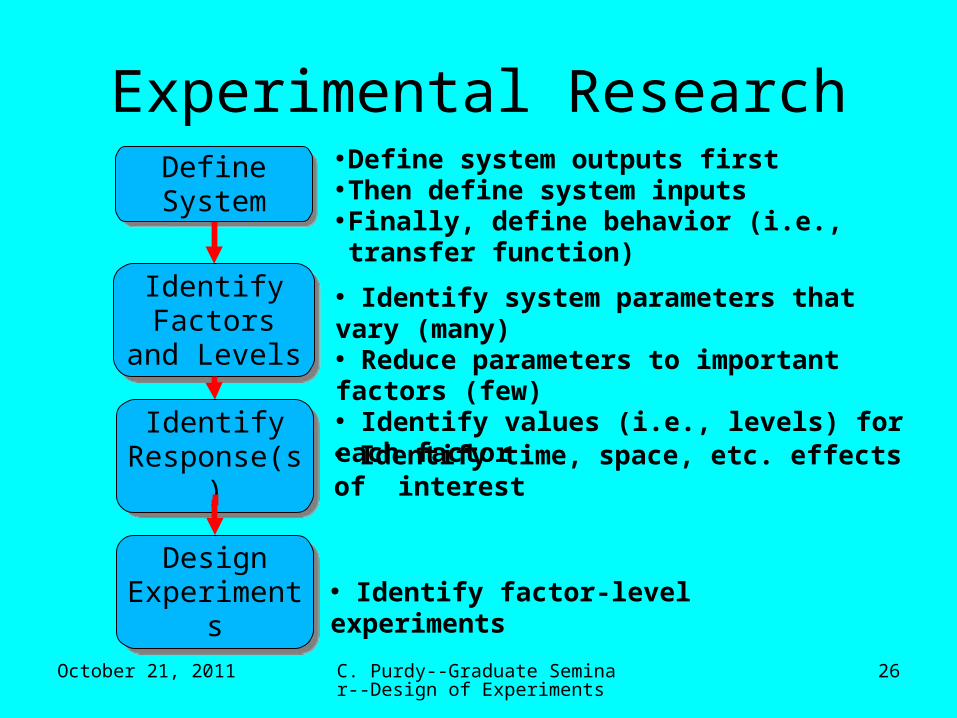
Experimental ResearchDefineSystemDefineSystem
IdentifyFactors
and Levels
IdentifyFactors
and Levels
IdentifyResponse(s)
IdentifyResponse(s)
● Define system outputs first● Then define system inputs● Finally, define behavior (i.e., transfer function)
● Identify system parameters that vary (many)● Reduce parameters to important factors (few)● Identify values (i.e., levels) for each factor
● Identify time, space, etc. effects of interest
DesignExperiments
DesignExperiments
● Identify factor-level experiments
October 21, 2011 C. Purdy--Graduate Seminar--Design of Experiments
27
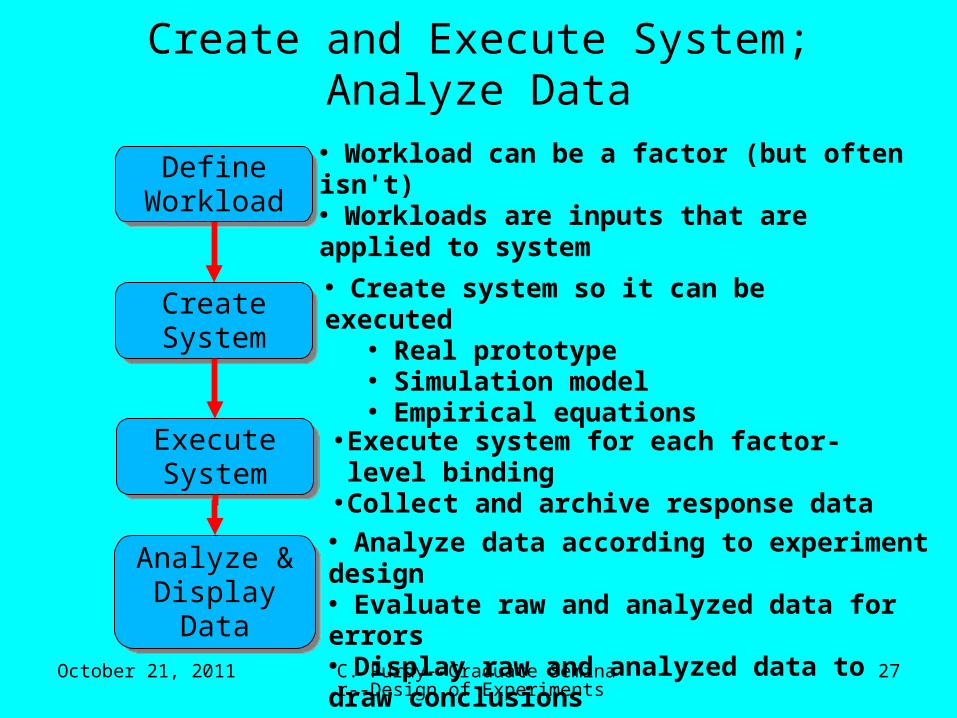
Create and Execute System; Analyze Data
DefineWorkloadDefine
Workload
CreateSystemCreateSystem
ExecuteSystem
ExecuteSystem
● Workload can be a factor (but often isn't)● Workloads are inputs that are applied to system
● Create system so it can be executed● Real prototype● Simulation model● Empirical equations
● Execute system for each factor-level binding● Collect and archive response data
Analyze &Display
Data
Analyze &Display
Data
● Analyze data according to experiment design● Evaluate raw and analyzed data for errors● Display raw and analyzed data to draw conclusions

October 21, 2011 C. Purdy--Graduate Seminar--Design of Experiments
28
Some ExamplesAnalog Simulation
– Which of three solvers is best?
– What is the system?– Responses
• Fastest simulation time
• Most accurate result• Most robust to types
of circuits being simulated
– Factors• Solver• Type of circuit model• Matrix data structure
Epitaxial growth– New method using non-
linear temp profile
– What is the system?
– Responses
• Total time
• Quality of layer
• Total energy required
• Maximum layer thickness
– Factors
• Temperature profile
• Oxygen density
• Initial temperature
• Ambient temperature
October 21, 2011 C. Purdy--Graduate Seminar--Design of Experiments
29
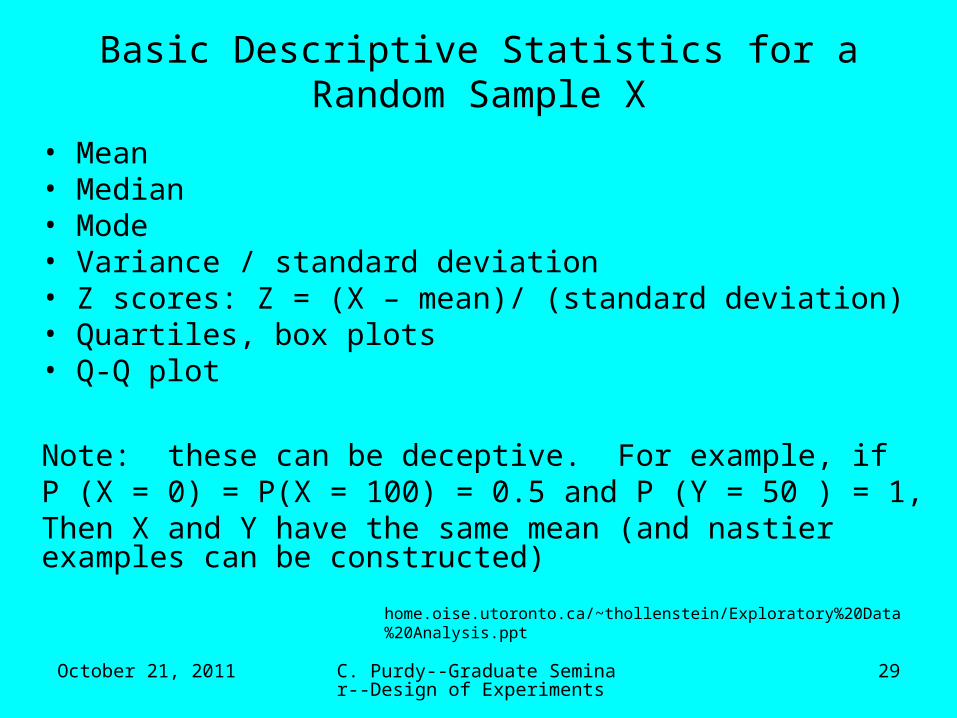
Basic Descriptive Statistics for a Random Sample X
• Mean• Median• Mode• Variance / standard deviation• Z scores: Z = (X – mean)/ (standard deviation) • Quartiles, box plots• Q-Q plot
Note: these can be deceptive. For example, ifP (X = 0) = P(X = 100) = 0.5 and P (Y = 50 ) = 1,Then X and Y have the same mean (and nastier examples can be constructed)
home.oise.utoronto.ca/~thollenstein/Exploratory%20Data%20Analysis.ppt

October 21, 2011 C. Purdy--Graduate Seminar--Design of Experiments
30
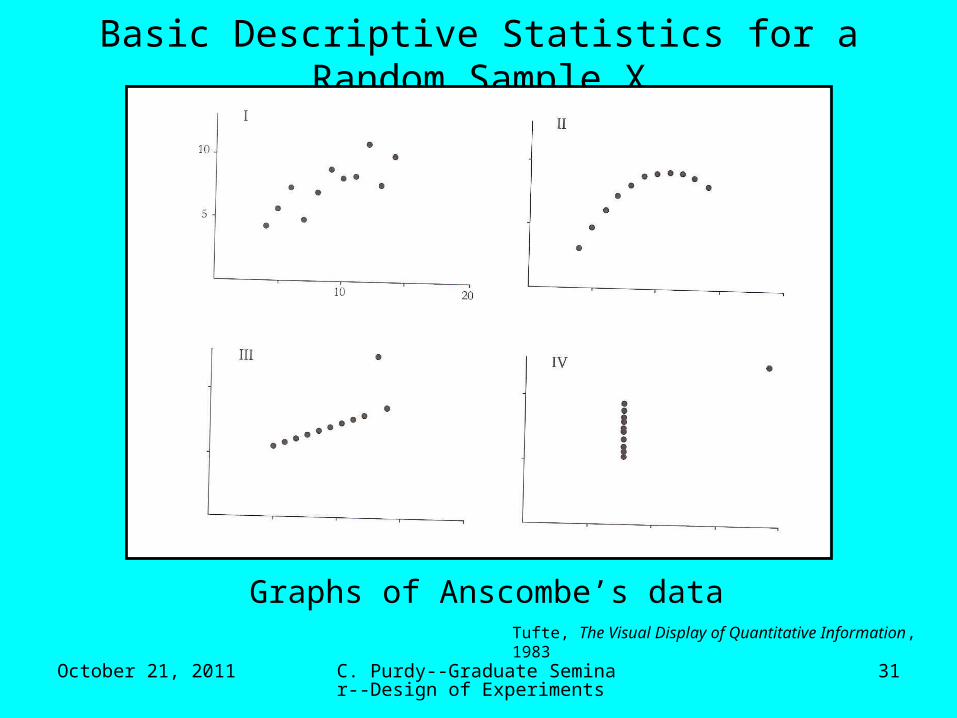
Basic Descriptive Statistics for a Random Sample X: Instructive Example
Four sets of data with the same basic descriptive statisticsAfter F.J. Anscombe, 1973
Tufte, The Visual Display of Quantitative Information, 1983
October 21, 2011 C. Purdy--Graduate Seminar--Design of Experiments
31
Basic Descriptive Statistics for a Random Sample X
Graphs of Anscombe’s dataTufte, The Visual Display of Quantitative Information, 1983
October 21, 2011 C. Purdy--Graduate Seminar--Design of Experiments
32
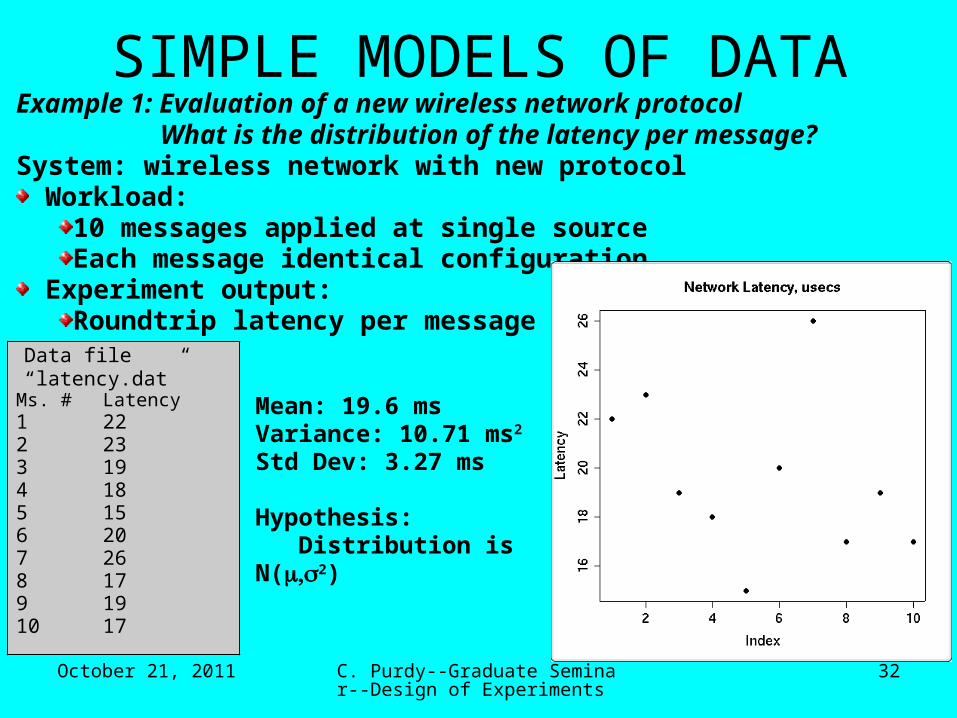
SIMPLE MODELS OF DATA
Ms. # Latency1 222 233 194 185 156 207 268 179 1910 17
Data file “latency.dat”
Example 1: Evaluation of a new wireless network protocol What is the distribution of the latency per message?System: wireless network with new protocol Workload:
10 messages applied at single sourceEach message identical configuration
Experiment output:Roundtrip latency per message (ms)
Mean: 19.6 msVariance: 10.71 ms2
Std Dev: 3.27 ms
Hypothesis: Distribution is N(2)
October 21, 2011 C. Purdy--Graduate Seminar--Design of Experiments
33
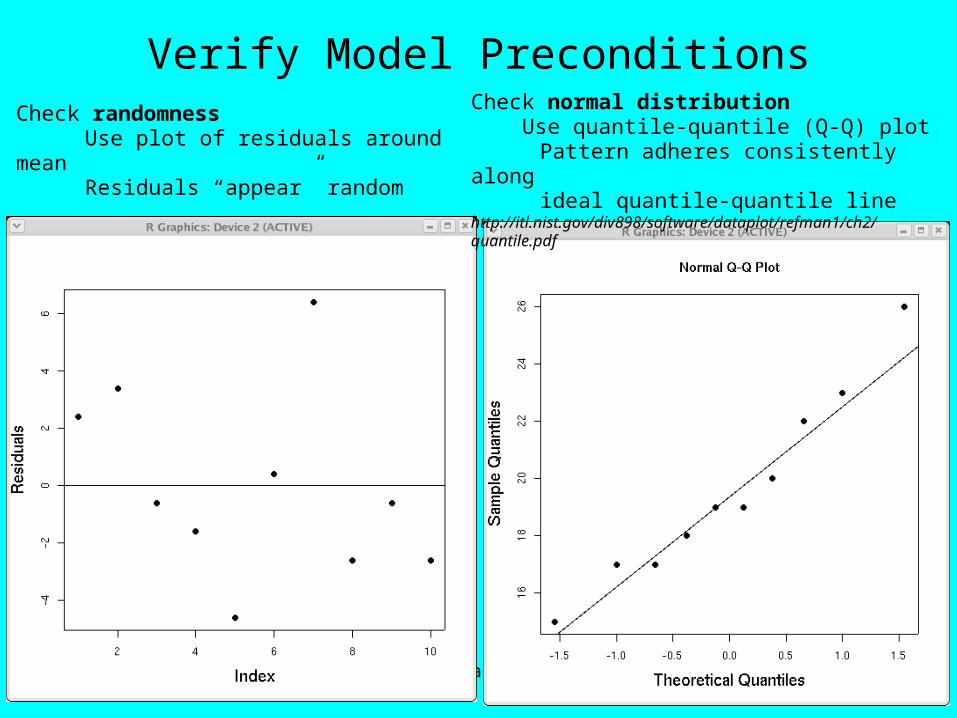
Verify Model PreconditionsCheck randomness
Use plot of residuals around meanResiduals “appear” random
Check normal distribution Use quantile-quantile (Q-Q) plot
Pattern adheres consistently alongideal quantile-quantile line
http://itl.nist.gov/div898/software/dataplot/refman1/ch2/quantile.pdf

October 21, 2011 C. Purdy--Graduate Seminar--Design of Experiments
34
Confidence Intervals
)/,/( ]2/1[]2/1[ nszxnszx aa
)/,/ ]1;2/1[]1;2/1[ nstxnstx nana
Sample mean vs Population meanIf many samples are collected, about 1 - will contain the“true mean”
CI: > 30 samples
CI: < 30 samples
For the latency data, = 19.6, a = 0.05:
(17.26, 21.94)
Raj Jain, “The Art of Computer Systems Performance Analysis,” Wiley, 1991.

October 21, 2011 C. Purdy--Graduate Seminar--Design of Experiments
35
Scatter and Line PlotsDepth Resistance
1 1.6890152 4.4867223 7.9152094 6.3623885 11.8307396 12.3291047 14.0113968 17.6000949 19.02214610 21.513802
Example 2: Relation between two variables: Resistance profile of doped silicon epitaxial layer
Expect linear resistance increase as depth increases

October 21, 2011 C. Purdy--Graduate Seminar--Design of Experiments
36
Linear Regression Statistics(hypothesis: resistance = 0 + 1*depth + error)
model = lm(Resistance ~ Depth)summary(model)
Residuals: Min 1Q Median 3Q Max-2.11330 -0.40679 0.05759 0.51211 1.57310 Coefficients: Estimate Std. Error t value Pr(>|t|)(Intercept) -0.05863 0.76366 -0.077 0.94Depth 2.13358 0.12308 17.336 1.25e-07 ***---Signif. codes: 0 `***' 0.001 `**' 0.01 `*' 0.05 `.' 0.1 ` ' 1 Residual standard error: 1.118 on 8 degrees of freedom “variance of error: (1.118)2”Multiple R-Squared: 0.9741, Adjusted R-squared: 0.9708 F-statistic: 300.5 on 1 and 8 DF, p-value: 1.249e-07 “evidence this estimate valid” (“prob. It occurred by chance”)
“reject hypotheses 0 = 0, 1 = 0”
(Using R system; based on http://www.stat.umn.edu/geyer/5102/examp/reg.html
October 21, 2011 C. Purdy--Graduate Seminar--Design of Experiments
37
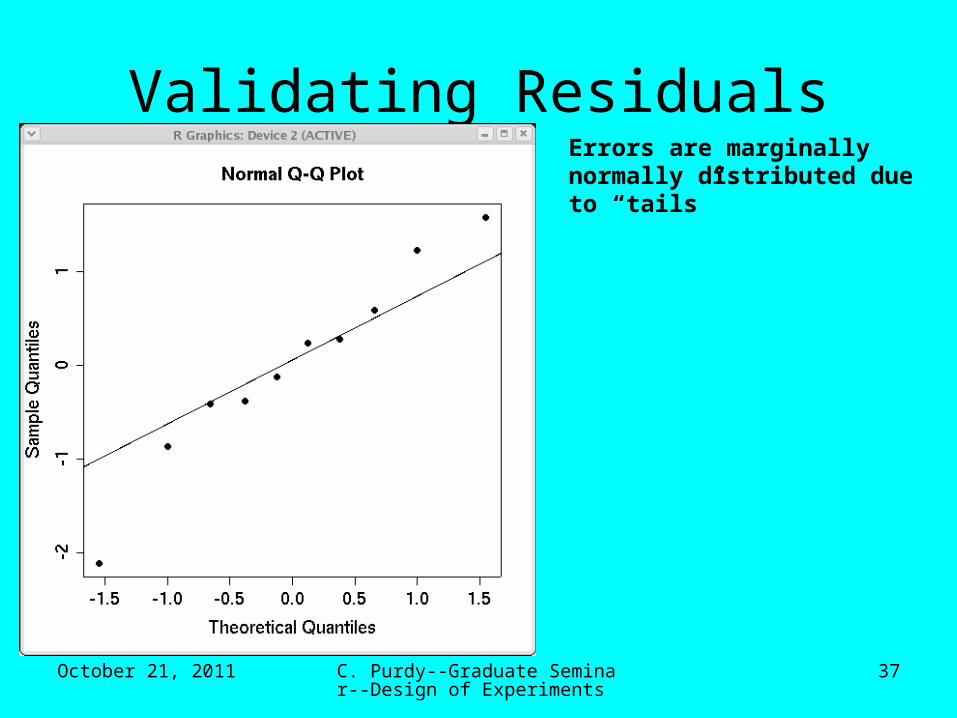
Validating ResidualsErrors are marginally normally distributed due to “tails”
October 21, 2011 C. Purdy--Graduate Seminar--Design of Experiments
38
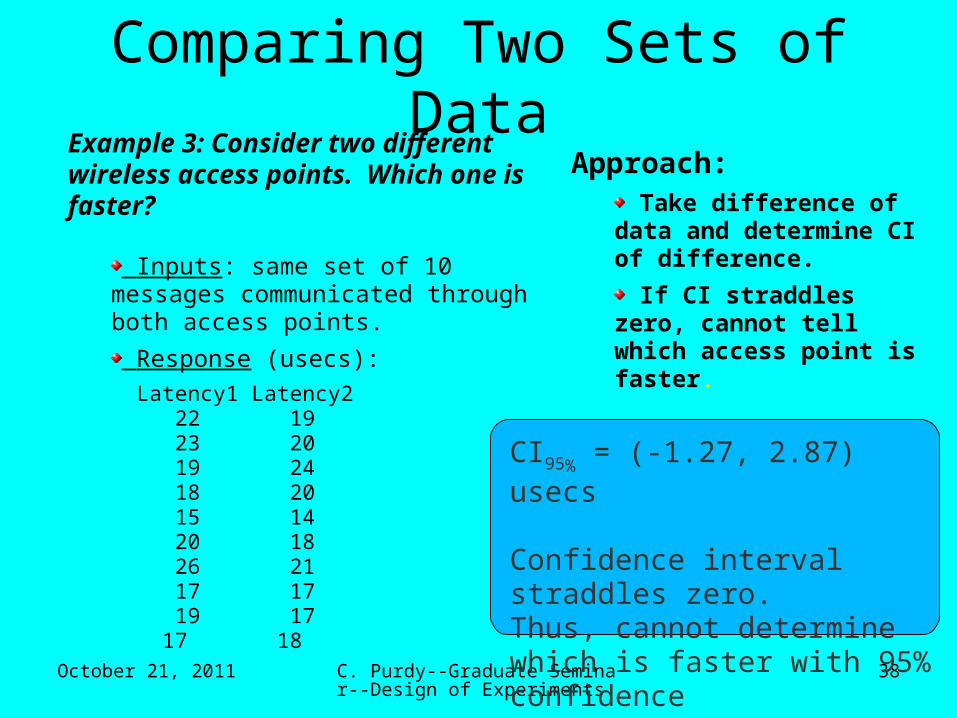
Comparing Two Sets of DataExample 3: Consider two different wireless access points. Which one is faster?
Inputs: same set of 10 messages communicated through both access points.
Response (usecs):
Latency1 Latency2 22 19 23 20 19 24 18 20 15 14 20 18 26 21 17 17 19 17
17 18
Approach: Take difference of data
and determine CI of difference.
If CI straddles zero, cannot tell which access point is faster.
CI95% = (-1.27, 2.87) usecs
Confidence interval straddles zero. Thus, cannot determine which is faster with 95% confidence
October 21, 2011 C. Purdy--Graduate Seminar--Design of Experiments
39
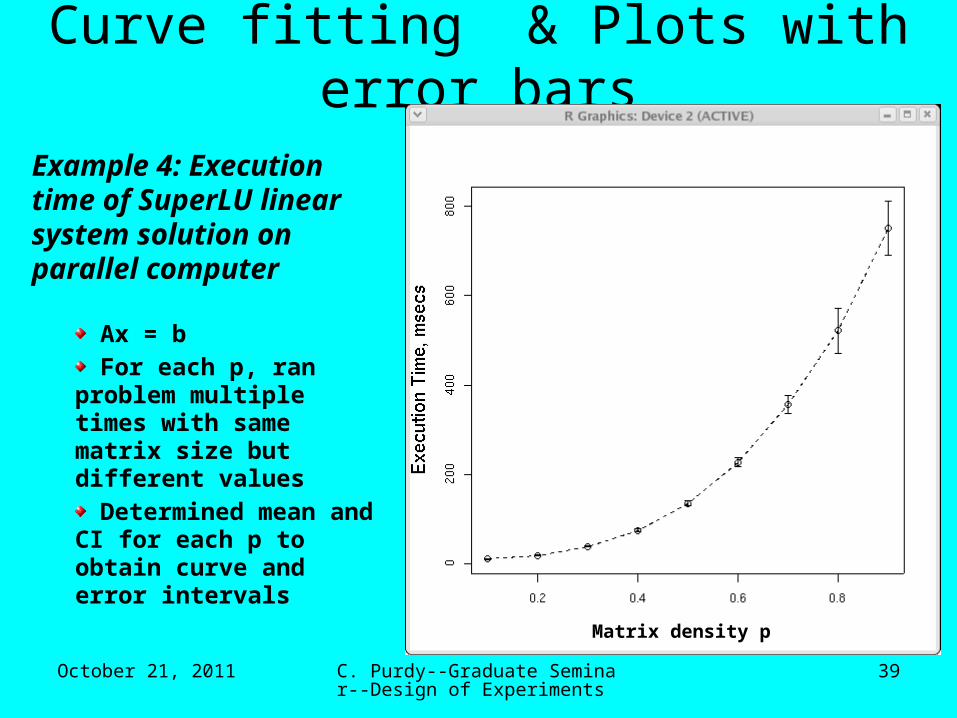
Curve fitting & Plots with error bars
Example 4: Execution time of SuperLU linear system solution on parallel computer
Ax = b For each p, ran problem
multiple times with same matrix size but different values Determined mean and CI
for each p to obtain curve and error intervals
Matrix density p

October 21, 2011 C. Purdy--Graduate Seminar--Design of Experiments
40
Curve Fitting> model = lm(t ~ poly(p,4))> summary(model) Call:lm(formula = t ~ poly(p, 4)) Residuals: 1 2 3 4 5 6 7 8 9-0.4072 0.7790 0.5840 -1.3090 -0.9755 0.8501 2.6749 -3.1528 0.9564 Coefficients: Estimate Std. Error t value Pr(>|t|)(Intercept) 236.9444 0.7908 299.636 7.44e-10 ***poly(p, 4)1 679.5924 2.3723 286.467 8.91e-10 ***poly(p, 4)2 268.3677 2.3723 113.124 3.66e-08 ***poly(p, 4)3 42.8772 2.3723 18.074 5.51e-05 ***poly(p, 4)4 2.4249 2.3723 1.022 0.364---Signif. codes: 0 `***' 0.001 `**' 0.01 `*' 0.05 `.' 0.1 ` ' 1 Residual standard error: 2.372 on 4 degrees of freedomMultiple R-Squared: 1, Adjusted R-squared: 0.9999F-statistic: 2.38e+04 on 4 and 4 DF, p-value: 5.297e-09

October 21, 2011 C. Purdy--Graduate Seminar--Design of Experiments
41
Example 5: Model Validation: y’ = ax + bR2 – Coefficient of Determination
“How well does the data fit your model?”What proportion of the “variability” is accounted for by the statistical model? (what is ratio of explained variation to total variation?)
Suppose we have measurements y1, y2, …, yn with mean m
And predicted values y1’, y2’, …, yn’ (yi’ = axi + b = yi + ei)
SSE = sum of squared errors = ∑ (yi – yi’)2 = ∑ei2
SST = total sum of squares =∑ (yi – m)2
SSR = SST – SSE = residual sum of squares = ∑ (m – yi’)2
R2 = SSR/SST = (SST-SSE)/SSTR2 is a measure of how good the model is.The closer R2 is to 1 the better.
Example: Let SST = 1499 and SSE = 97.
Then R2 = 93.5%http://www-stat.stanford.edu/~jtaylo/courses/stats191/notes/simple_diagnostics.pdf

October 21, 2011 C. Purdy--Graduate Seminar--Design of Experiments
42
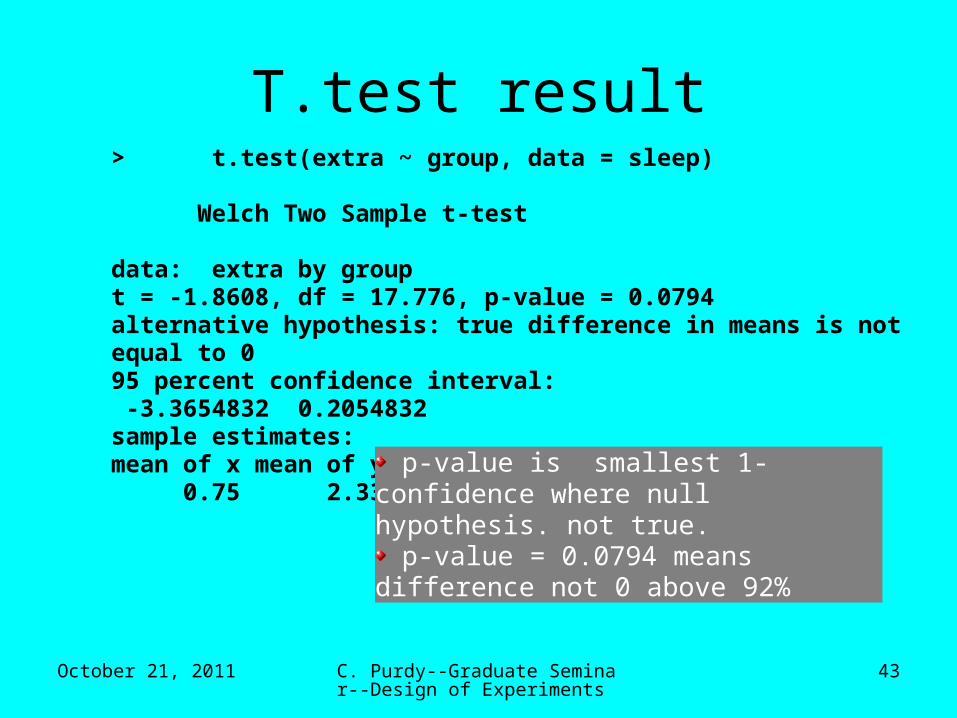
Example 6: Using the t-test to compare 2 means
extra group1 0.7 12 -1.6 13 -0.2 14 -1.2 15 -0.1 16 3.4 17 3.7 18 0.8 19 0.0 110 2.0 111 1.9 212 0.8 213 1.1 214 0.1 215 -0.1 216 4.4 217 5.5 218 1.6 219 4.6 220 3.4 2
Consider the following data (“sleep.R”)
From “Introduction to R”, http://www.R-project.org
October 21, 2011 C. Purdy--Graduate Seminar--Design of Experiments
43
T.test result
> t.test(extra ~ group, data = sleep)
Welch Two Sample t-test data: extra by groupt = -1.8608, df = 17.776, p-value = 0.0794 alternative hypothesis: true difference in means is not equal to 095 percent confidence interval: -3.3654832 0.2054832sample estimates:mean of x mean of y 0.75 2.33
p-value is smallest 1- confidence where null hypothesis. not true. p-value = 0.0794 means difference not 0
above 92%
October 21, 2011 C. Purdy--Graduate Seminar--Design of Experiments
44
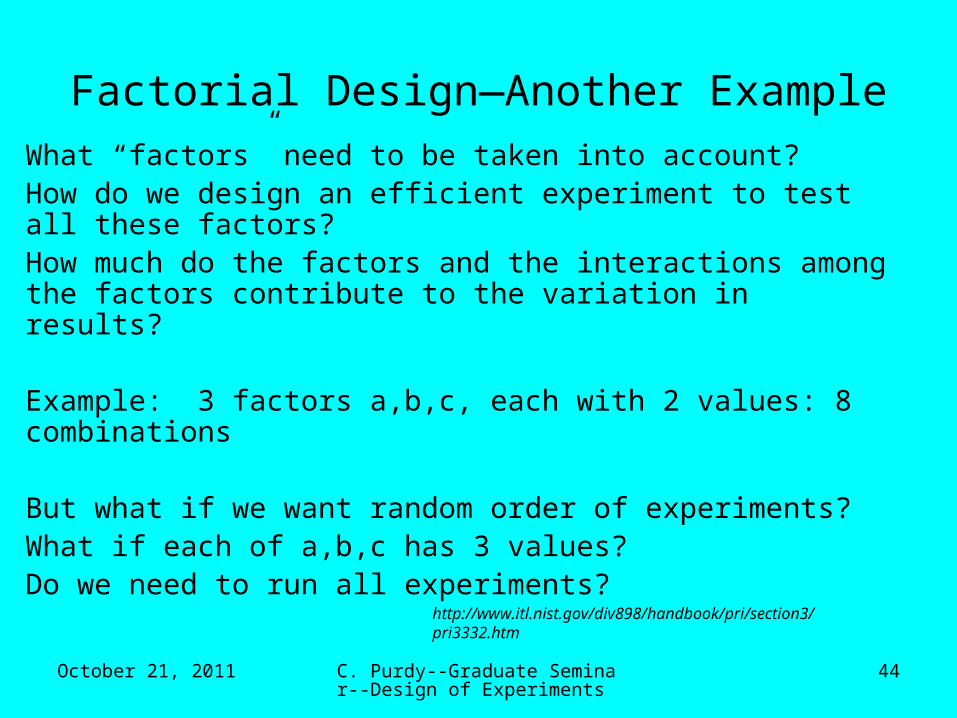
Factorial Design—Another Example
What “factors” need to be taken into account?How do we design an efficient experiment to test all these factors?How much do the factors and the interactions among the factors contribute to the variation in results?
Example: 3 factors a,b,c, each with 2 values: 8 combinations
But what if we want random order of experiments?What if each of a,b,c has 3 values?Do we need to run all experiments?
http://www.itl.nist.gov/div898/handbook/pri/section3/pri3332.htm
October 21, 2011 C. Purdy--Graduate Seminar--Design of Experiments
45
Standard Procedure-Full Factorial Design
(Example) Variables A,B,C: each with 3 values, Low, Medium, High (coded as -1,0,1)“Signs Table”:
A B C
1 -1 -1 -1
2 +1 -1 -1
3 -1 +1 -1
4 +1 +1 -1
5 -1 -1 +1
6 +1 -1 +1
7 -1 +1 +1
8 +1 +1 +1
1.Run the experiments in the table (“2 level, full factorial design”)
2.Repeat the experiments in this order n times by using rows 1,…,8,1,…,8, … (“replication”)
3.Use step 2, but choose the rows randomly (“randomization”)
4.Use step 4, but add some “center point runs”, for example, run the case 0,0,0, then use 8 rows, then run 0,0,0, …finish with a 0,0,0 case
In general, for 5 or more factors, use a “fractional factorial design”
October 21, 2011 C. Purdy--Graduate Seminar--Design of Experiments
46
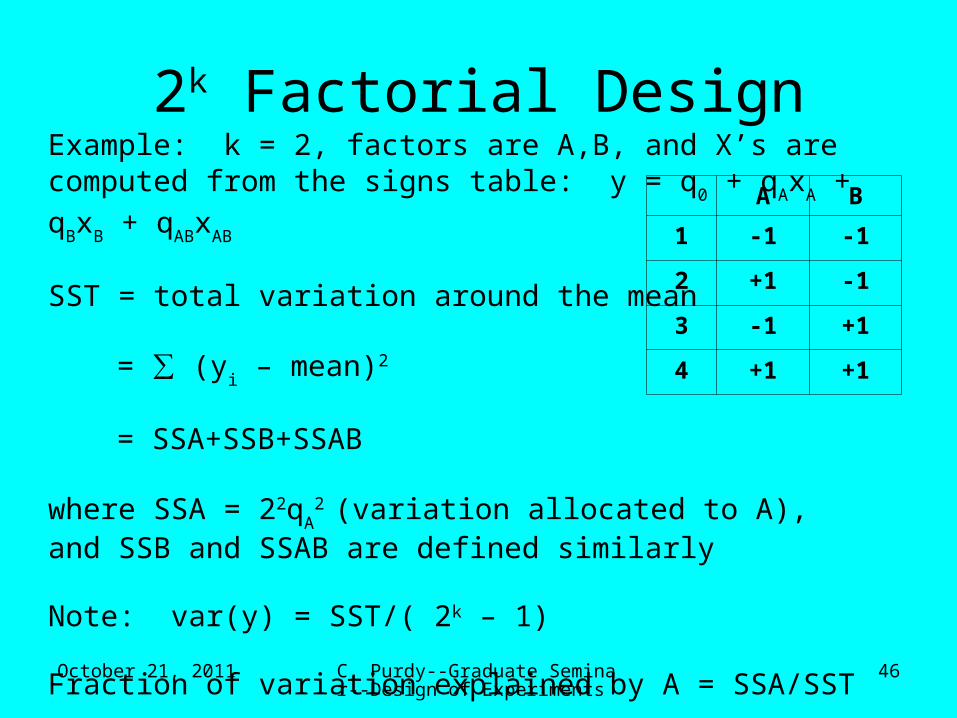
2k Factorial DesignExample: k = 2, factors are A,B, and X’s are computed from the signs table: y = q
0 + q
Ax
A + q
Bx
B + q
ABx
AB
SST = total variation around the mean = ∑ (y
i – mean)2
= SSA+SSB+SSAB where SSA = 22q
A2 (variation allocated to A), and SSB and
SSAB are defined similarly
Note: var(y) = SST/( 2k – 1)
Fraction of variation explained by A = SSA/SST
A B
1 -1 -1
2 +1 -1
3 -1 +1
4 +1 +1
October 21, 2011 C. Purdy--Graduate Seminar--Design of Experiments
47
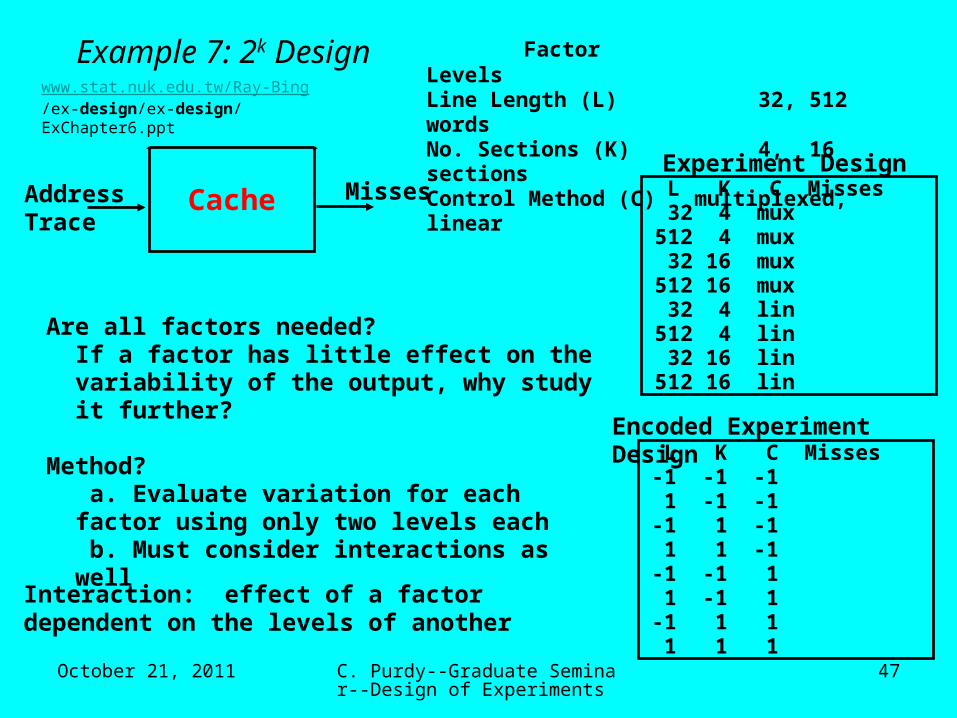
Example 7: 2k Design
Are all factors needed?If a factor has little effect on the variability of the output, why study it further?
Method? a. Evaluate variation for each factor using only two levels each b. Must consider interactions as well
Interaction: effect of a factor dependent on the levels of another
L K C Misses 32 4 mux 512 4 mux 32 16 mux 512 16 mux 32 4 lin 512 4 lin 32 16 lin 512 16 lin
Factor LevelsLine Length (L) 32, 512 wordsNo. Sections (K) 4, 16 sectionsControl Method (C) multiplexed, linear
Experiment Design
CacheAddress Trace
Misses
L K C Misses -1 -1 -1 1 -1 -1 -1 1 -1 1 1 -1 -1 -1 1 1 -1 1 -1 1 1 1 1 1
Encoded Experiment Design
www.stat.nuk.edu.tw/Ray-Bing/ex-design/ex-design/ExChapter6.ppt
October 21, 2011 C. Purdy--Graduate Seminar--Design of Experiments
48
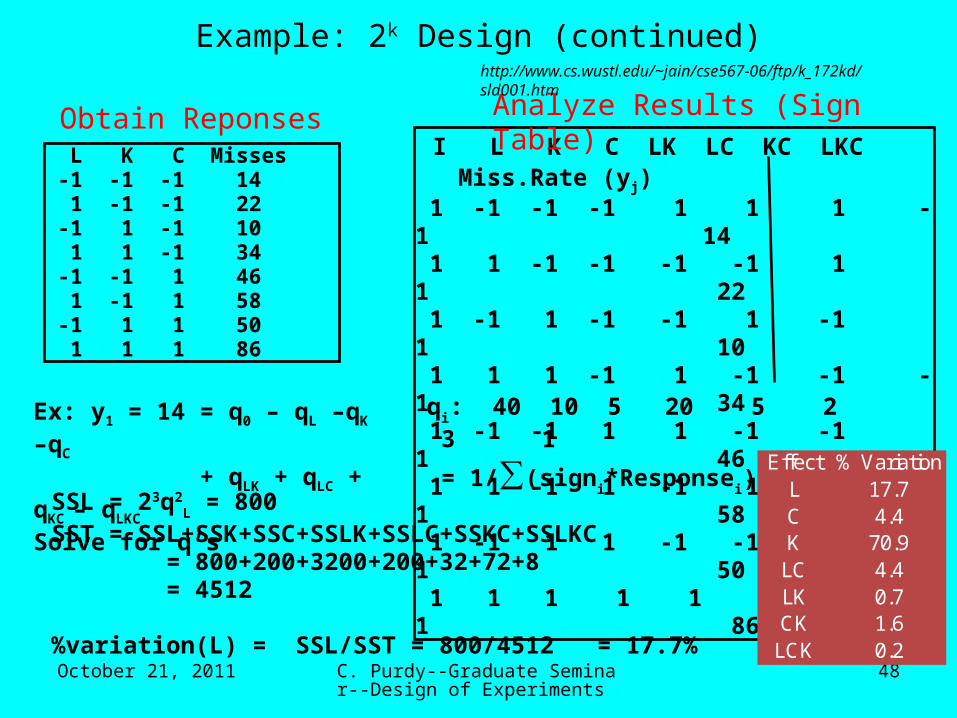
I L K C LK LC KC LKC Miss.Rate (yj) 1 -1 -1 -1 1 1 1 -1 14 1 1 -1 -1 -1 -1 1 1 22 1 -1 1 -1 -1 1 -1 1 10 1 1 1 -1 1 -1 -1 -1 34 1 -1 -1 1 1 -1 -1 1 46 1 1 -1 1 -1 1 -1 -1 58 1 -1 1 1 -1 -1 1 -1 50 1 1 1 1 1 1 1 1 86
Analyze Results (Sign Table)
qi: 40 10 5 20 5 2 3 1
= 1/∑(signi*Response
i)
SSL = 23q2L = 800
SST = SSL+SSK+SSC+SSLK+SSLC+SSKC+SSLKC = 800+200+3200+200+32+72+8 = 4512
%variation(L) = SSL/SST = 800/4512 = 17.7%
Effect % VariationL 17.7C 4.4K 70.9
LC 4.4LK 0.7CK 1.6
LCK 0.2
L K C Misses -1 -1 -1 14 1 -1 -1 22 -1 1 -1 10 1 1 -1 34 -1 -1 1 46 1 -1 1 58 -1 1 1 50 1 1 1 86
Obtain Reponses
Example: 2k Design (continued)
Ex: y1 = 14 = q0 – qL –qK –qC
+ qLK + qLC + qKC – qLKC
Solve for q’s
http://www.cs.wustl.edu/~jain/cse567-06/ftp/k_172kd/sld001.htm
October 21, 2011 C. Purdy--Graduate Seminar--Design of Experiments
49
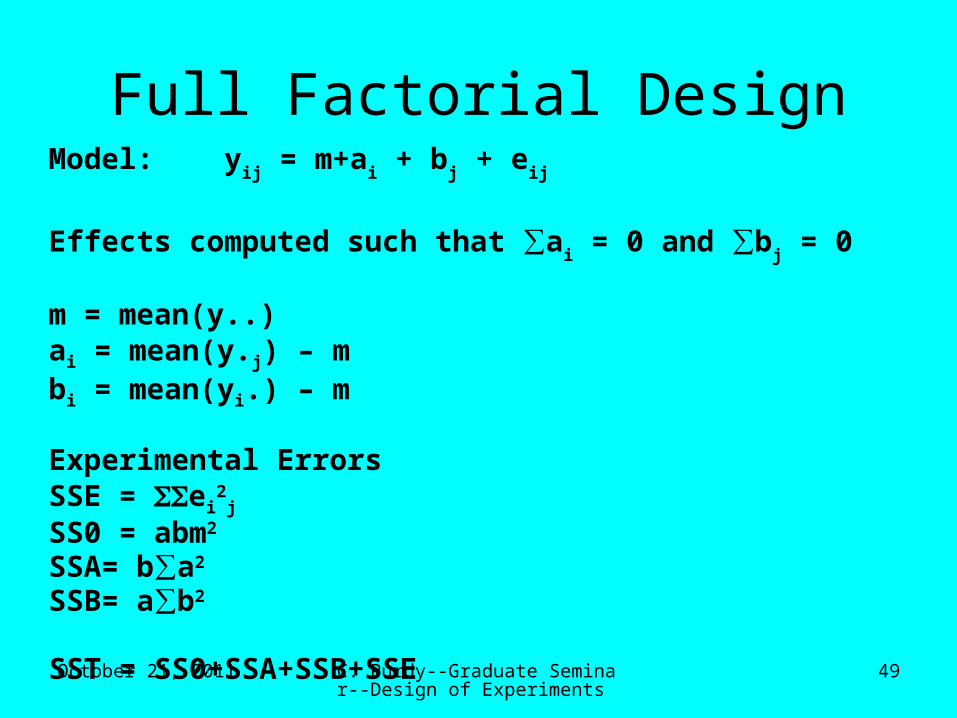
Full Factorial DesignModel: y
ij = m+a
i + b
j + e
ij
Effects computed such that ∑ai = 0 and ∑b
j = 0
m = mean(y..)ai = mean(y.j) – mbi = mean(yi.) – m
Experimental ErrorsSSE = ei
2j
SS0 = abm2
SSA= b∑a2
SSB= a∑b2
SST = SS0+SSA+SSB+SSE
October 21, 2011 C. Purdy--Graduate Seminar--Design of Experiments
50
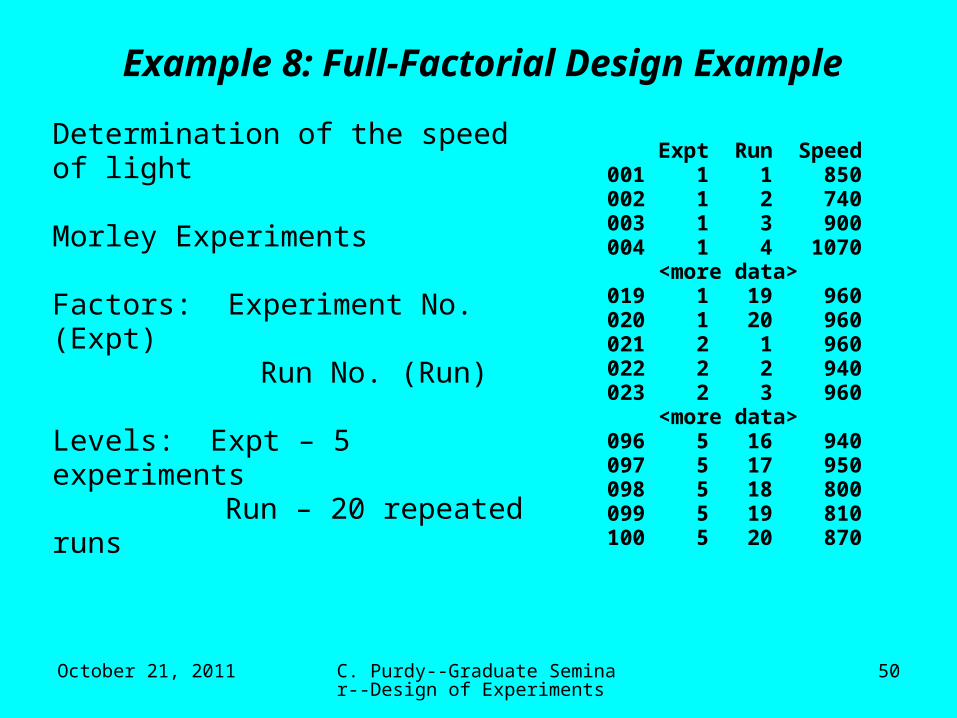
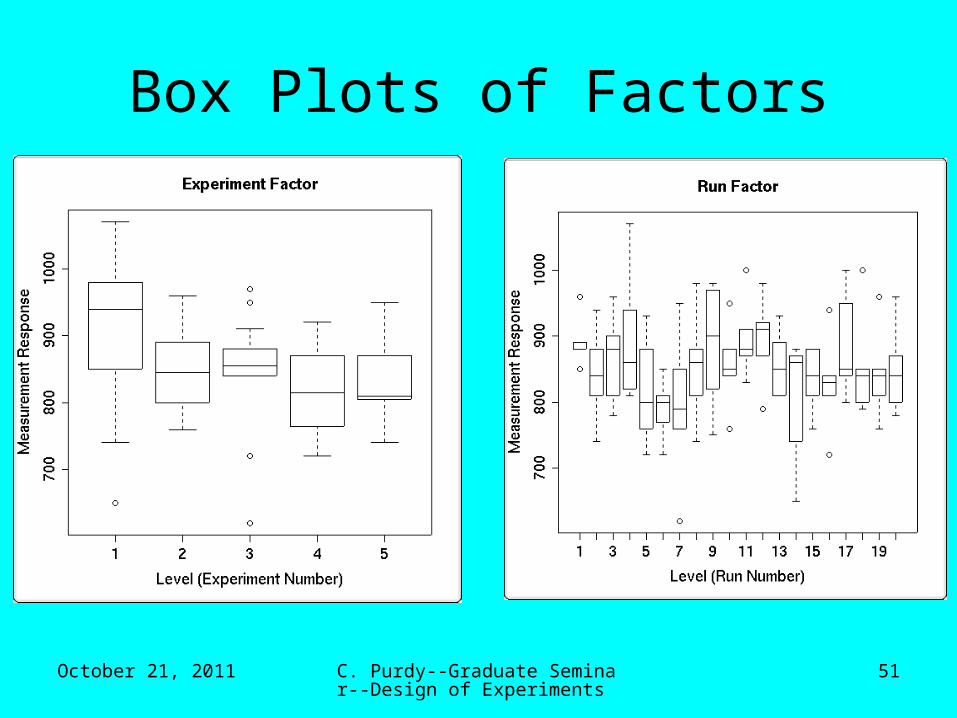
Example 8: Full-Factorial Design Example
Determination of the speed of light
Morley Experiments
Factors: Experiment No. (Expt) Run No. (Run)
Levels: Expt – 5 experiments Run – 20 repeated runs
Expt Run Speed001 1 1 850002 1 2 740003 1 3 900004 1 4 1070 <more data>019 1 19 960020 1 20 960021 2 1 960022 2 2 940023 2 3 960 <more data>096 5 16 940097 5 17 950098 5 18 800099 5 19 810100 5 20 870
October 21, 2011 C. Purdy--Graduate Seminar--Design of Experiments
51
Box Plots of Factors
October 21, 2011 C. Purdy--Graduate Seminar--Design of Experiments
52
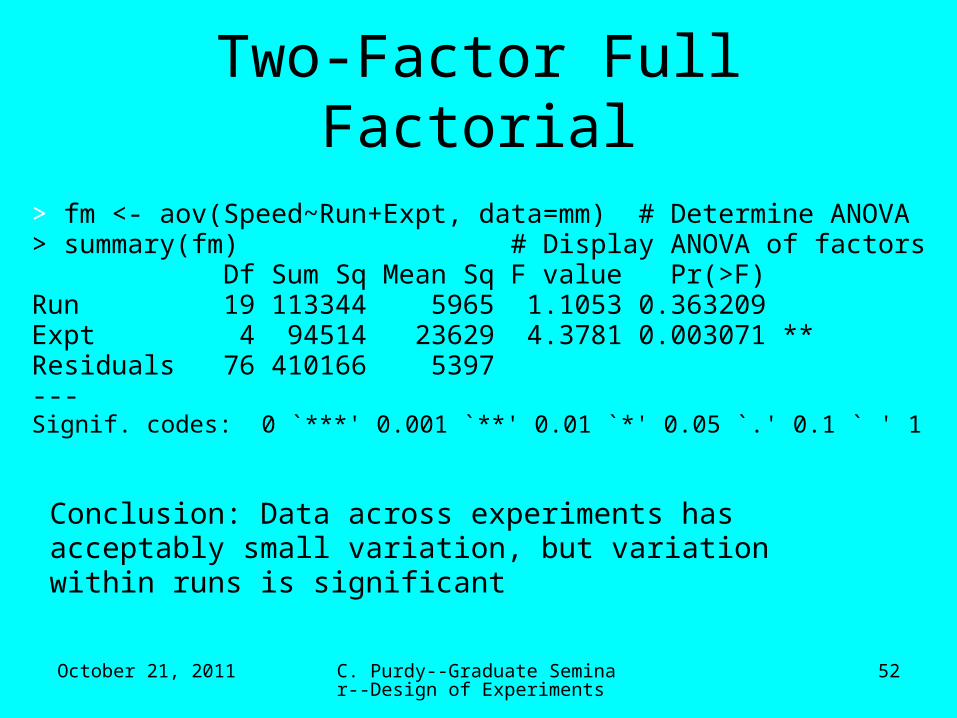
Two-Factor Full Factorial
> fm <- aov(Speed~Run+Expt, data=mm) # Determine ANOVA> summary(fm) # Display ANOVA of factors Df Sum Sq Mean Sq F value Pr(>F)Run 19 113344 5965 1.1053 0.363209Expt 4 94514 23629 4.3781 0.003071 **Residuals 76 410166 5397---Signif. codes: 0 `***' 0.001 `**' 0.01 `*' 0.05 `.' 0.1 ` ' 1
Conclusion: Data across experiments has acceptably small variation, but variation within runs is significant

October 21, 2011 C. Purdy--Graduate Seminar--Design of Experiments
53
What if there are more factors?
Total number of experiments = #levels#factors
What if there are 3 levels and 6 factors? 36 = 729 runs
If we use replication, there are even more runs
Computer experiments: not such a problem, computer is doing the work
Lab experiments:time, materials, technicians’ salaries—can add up
October 21, 2011 C. Purdy--Graduate Seminar--Design of Experiments
54
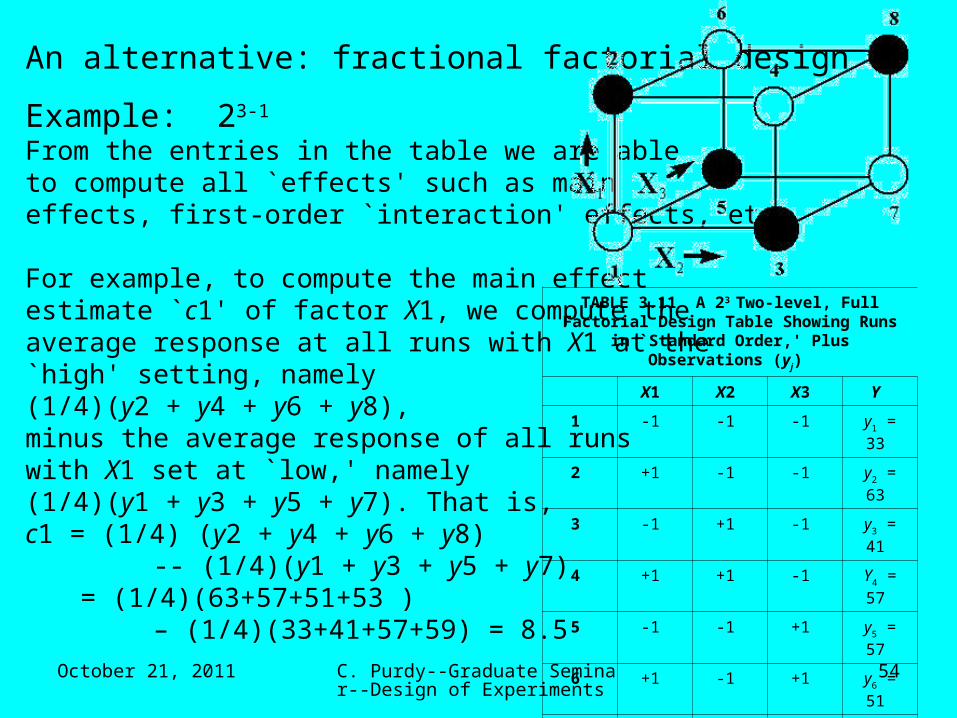
An alternative: fractional factorial design
Example: 23-1
From the entries in the table we are able to compute all `effects' such as main effects, first-order `interaction' effects, etc.
For example, to compute the main effect estimate `c1' of factor X1, we compute the average response at all runs with X1 at the `high' setting, namely (1/4)(y2 + y4 + y6 + y8), minus the average response of all runs with X1 set at `low,' namely (1/4)(y1 + y3 + y5 + y7). That is, c1 = (1/4) (y2 + y4 + y6 + y8) -- (1/4)(y1 + y3 + y5 + y7) = (1/4)(63+57+51+53 ) – (1/4)(33+41+57+59) = 8.5
TABLE 3.11 A 23 Two-level, Full Factorial Design Table Showing Runs in `Standard
Order,' Plus Observations (yj)
X1 X2 X3 Y
1 -1 -1 -1 y1 = 33
2 +1 -1 -1 y2 = 63
3 -1 +1 -1 y3 = 41
4 +1 +1 -1 Y4 = 57
5 -1 -1 +1 y5 = 57
6 +1 -1 +1 y6 = 51
7 -1 +1 +1 y7 = 59
8 +1 +1 +1 y8 = 53

October 21, 2011 C. Purdy--Graduate Seminar--Design of Experiments
55
We computed c1 = 8.5
Suppose, however, that we only have enough resources to do four runs. Is itstill possible to estimate the main effect for X1? Or any other main effect? The answer is yes, and there are even different choices of the four runs that will accomplish this. For example, suppose we select only the four light (unshaded) corners of the design cube. Using these four runs (1, 4, 6 and 7), we can still compute c1 as follows:
c1 = (1/2) (y4 + y6) - (1/2) (y1 + y7) = (1/2) (57+51) - (1/2) (33+59) = 8.
Similarly, we would compute c2, the effect due to X2, as
c2 = (1/2) (y4 + y7) - (1/2) (y1 + y6) = (1/2) (57+59) - (1/2) (33+51) = 16.
Finally, the computation of c3 for the effect due to X3 would be
c3 = (1/2) (y6 + y7) - (1/2) (y1 + y4) = (1/2) (51+59) - (1/2) (33+57) = 10.

October 21, 2011 C. Purdy--Graduate Seminar--Design of Experiments
56
We could also have used the four dark (shaded) corners of the design cube for our runs and obtained similiar, but slightly different, estimates for the main effects. In either case, we would have used half the number of runs that the full factorial requires. The half fraction we used is a new design written as 23-1.
Note that 23-1 = 23/2 = 22 = 4, which is the number of runs in this half-fraction design.

October 21, 2011 C. Purdy--Graduate Seminar--Design of Experiments
57
Constructing the 23-1 half-fraction design (example)
We start with Table I.We need to add a third column. We do it by adding the X1*X2 interaction column to get Table II.We may now substitute `X3' in place of `X1*X2' to get Table III, which amounts to theDark-shaded corners.
If we had set X3 = -X1*X2 as the rule for generating the third column of our 23-1 design, we would have obtained Table IV, the light-shaded corners.
TABLE I A Standard Order 22 Full Factorial Design
Table
X1 X2
1 -1 -1
2 +1 -1
3 -1 +1
4 +1 +1
TABLE II A 22 Design Table Augmented
with the X1*X2 Interaction Column
`X1*X2'
X1 X2 X1*X2
1 -1 -1 +1
2 +1 -1 -1
3 -1 +1 -1
4 +1 +1 +1
TABLE III A 23-1 Design Table with Column X3 set to
X1*X2
X1 X2 X3
1 -1 -1 +1
2 +1 -1 -1
3 -1 +1 -1
4 +1 +1 +1
TABLE IV A 23-1 Design Table with Column X3 set to
X1*X2
X1 X2 X3
1 -1 -1 +1
2 +1 -1 -1
3 -1 +1 -1
4 +1 +1 +1
October 21, 2011 C. Purdy--Graduate Seminar--Design of Experiments
58
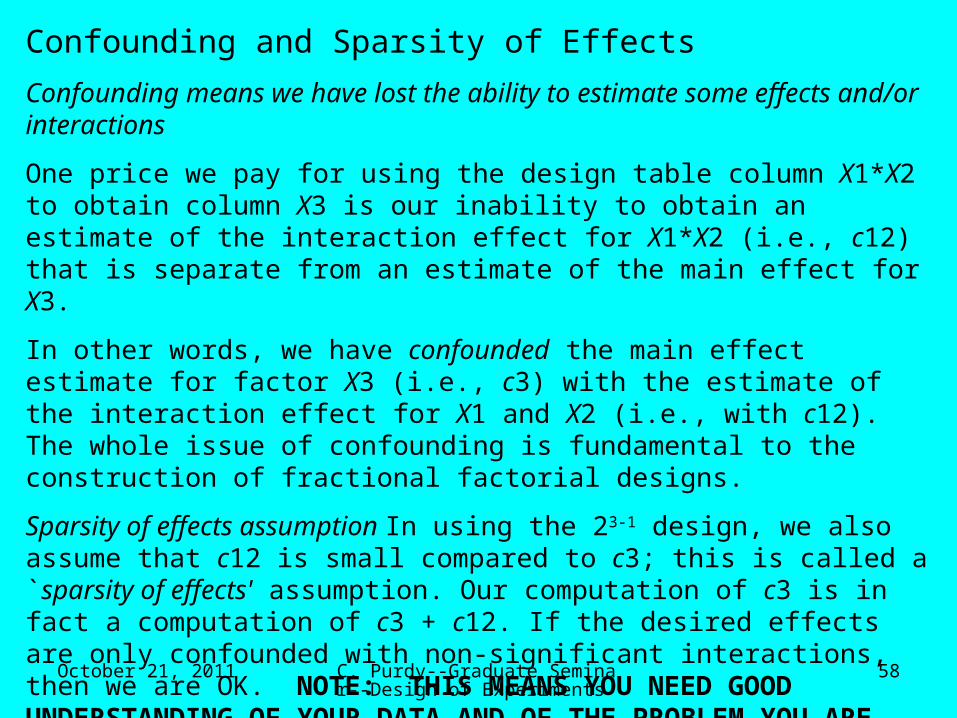
Confounding and Sparsity of Effects
Confounding means we have lost the ability to estimate some effects and/or interactions
One price we pay for using the design table column X1*X2 to obtain column X3 is our inability to obtain an estimate of the interaction effect for X1*X2 (i.e., c12) that is separate from an estimate of the main effect for X3.
In other words, we have confounded the main effect estimate for factor X3 (i.e., c3) with the estimate of the interaction effect for X1 and X2 (i.e., with c12). The whole issue of confounding is fundamental to the construction of fractional factorial designs.
Sparsity of effects assumption In using the 23-1 design, we also assume that c12 is small compared to c3; this is called a `sparsity of effects' assumption. Our computation of c3 is in fact a computation of c3 + c12. If the desired effects are only confounded with non-significant interactions, then we are OK. NOTE: THIS MEANS YOU NEED GOOD UNDERSTANDING OF YOUR DATA AND OF THE PROBLEM YOU ARE TRYING TO SOLVE!
Note: we can define general procedure to construct valid fractional designs.
October 21, 2011 C. Purdy--Graduate Seminar--Design of Experiments
59
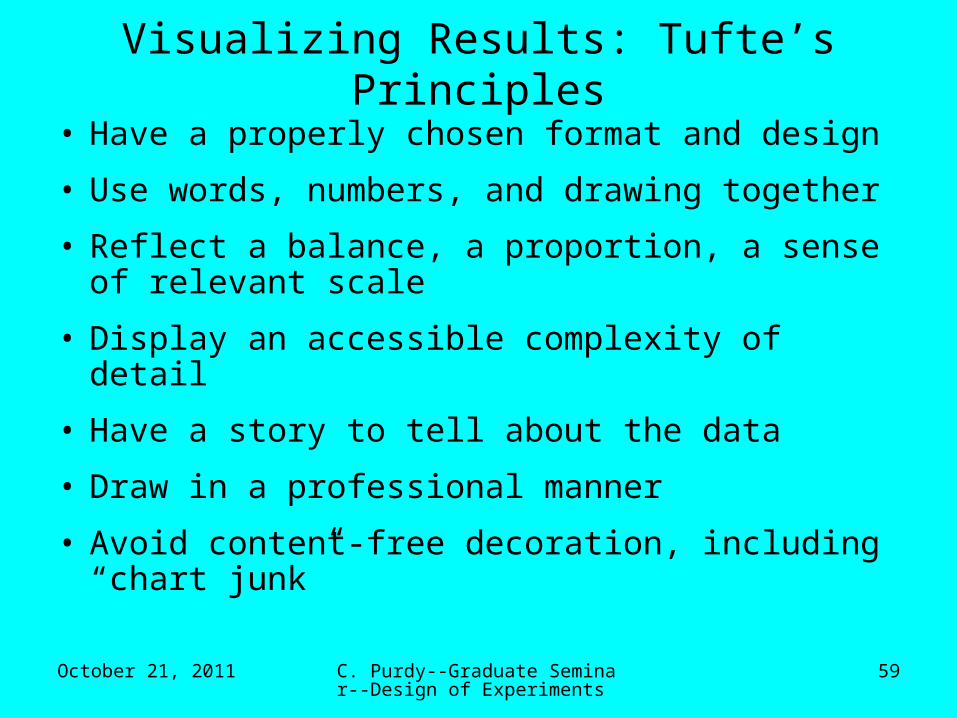
Visualizing Results: Tufte’s Principles
• Have a properly chosen format and design
• Use words, numbers, and drawing together
• Reflect a balance, a proportion, a sense of relevant scale
• Display an accessible complexity of detail
• Have a story to tell about the data
• Draw in a professional manner
• Avoid content-free decoration, including “chart junk”

October 21, 2011 C. Purdy--Graduate Seminar--Design of Experiments
60
Presenting Your Results: Dilbert on Powerpoint (PPt)
Now, about Powerpoint© presentations…….
http://www.dilbert.com/

October 21, 2011 C. Purdy--Graduate Seminar--Design of Experiments
61
A picture is not always worth 1,000 words….
http://www.dilbert.com/

October 21, 2011 C. Purdy--Graduate Seminar--Design of Experiments
62
And it is easy to get carried away by enthusiasm for your subject……
http://www.dilbert.com/

October 21, 2011 C. Purdy--Graduate Seminar--Design of Experiments
63
Presenting Your Results: Tufte on Powerpoint (PPt)****PPt REDUCES THE ANALYTICAL QUALITY of serious presentations of evidence****this is especially true for PPt ready-made templates, which CORRUPT STATISTICAL REASONING, and often WEAKEN VERBAL AND SPATIAL THINKING****statistical graphics produced by PPt are astonishingly thin, NEARLY CONTENT-FREE****for words, impoverished space encourages IMPRECISE STATEMENTS, SLOGANS, ABRUPT AND THINLY-ARGUED CLAIMSPPt suffers from NARROW BANDWIDTH & RELENTLESS SEQUENCINGaudience members need at least one mode of information that ALLOWS THEM TO CONTROL THE ORDER AND PACE OF LEARNINGex: Columbia spacecraft report (made while it was still in the air): bullets and outline format obscured the important points about the problem with the tiles (2nd disaster)

October 21, 2011 C. Purdy--Graduate Seminar--Design of Experiments
64
Visualizing Results: Tufte’s Principles Applied to PPt
• Have a properly chosen format and design
• Use words, numbers, and drawing together
• Reflect a balance, a proportion, a sense of relevant scale
• Display an accessible complexity of detail
• Have a story to tell about the data
• Draw in a professional manner
• Avoid content-free decoration, including “chart junk”
• Don’t use PPt gimmicks such as line-by-line sequencing
• Provide nonsequential medium in addition to PPt
Since there aren’t really any good alternatives,…….