Embed Size (px)
Citation preview
Joint Metro-North and Long Island Committees Meeting
October 2021MembersR. Herman (Co-Chair)K. Law (Co-Chair)F. BorelliG. BringmannN. BrownM. FleischerR. GlucksmanR. LinnD. MackH. Porr, IIIV. TessitoreN. Zuckerman
Joint Metro-North and Long Island Committees Meeting 2 Broadway
20th floor Board Room New York, NY
Monday, 10/18/2021 9:30 - 10:30 AM ET
1. Public Comments Period
2. Summary of Actions
MNR Summary of Actions MNR Summary of Actions - Page 5
LIRR Summary of Actions - None
MTA C&D Summary of Actions MTA C&D Summary of Actions - Page 6
3. Approval of Minutes - September 13, 2021
MNR MinutesMNR Minutes - Page 7
LIRR MinutesLIRR Minutes - Page 15
4. 2021 Work Plans
MNR Work PlanMNR Work Plan - Page 24
LIRR Work PlanLIRR Work Plan - Page 30
5. AGENCY PRESIDENTS' / CHIEF'S REPORTS
MNR Report
MNR Safety ReportMNR Safety Report - Page 35
LIRR Report
LIRR Safety ReportLIRR Safety Report - Page 38
MTA C&D Report - None
MTA Police ReportMTA Police Report - Page 41
6. AGENCY INFORMATION ITEMS
Joint Information Items
2022 Preliminary Budget (Public Comment)
LIRR/MNR PTC Project UpdateLIRR-MNR PTC Project Update - Page 50
MNR Information Items
Track Program Quarterly UpdateTrack Program Quarterly Update - Page 56
Breakneck Ridge hiking trail - disposition of landBreakneck Ridge hiking trail - disposition of land - Page 70
Bike Storage Pilot Permit at Grand Central TerminalBike Storage Pilot Permit at Grand Central Terminal - Page 72
LIRR Information Items
November Timetable & Trackwork Programs November Timetable & Trackwork Programs - Page 73
7. PROCUREMENTS
MNR Procurements MNR Procurements - Page 78
CompetitiveMNR Competitive - Page 82
LIRR Procurements - None
MTA C&D ProcurementsMTA C&D Procurements - Page 85
Non-Competitive - None
Competitive MTA C&D Competitive - Page 89
Ratifications - None
8. AGENCY REPORTS ON OPERATIONS, FINANCE, RIDERSHIP AND CAPITAL PROGRAM
MNR Reports
MNR Operations ReportMNR Operations Report - Page 92
MNR Performance Metrics ReportMNR Performance Metrics Report - Page 100
MNR Finance ReportMNR Finance Report - Page 103
MNR Ridership Report
MNR Ridership Report - Page 143
MNR Capital Program ReportMNR Capital Program Report - Page 165
LIRR Reports
LIRR Operations ReportLIRR Operations Report - Page 171
LIRR Performance Metrics ReportLIRR Performance Metrics Report - Page 181
LIRR Finance ReportLIRR Finance Report - Page 185
LIRR Ridership Report LIRR Ridership Report - Page 227
LIRR Capital Program ReportLIRR Capital Program Report - Page 243
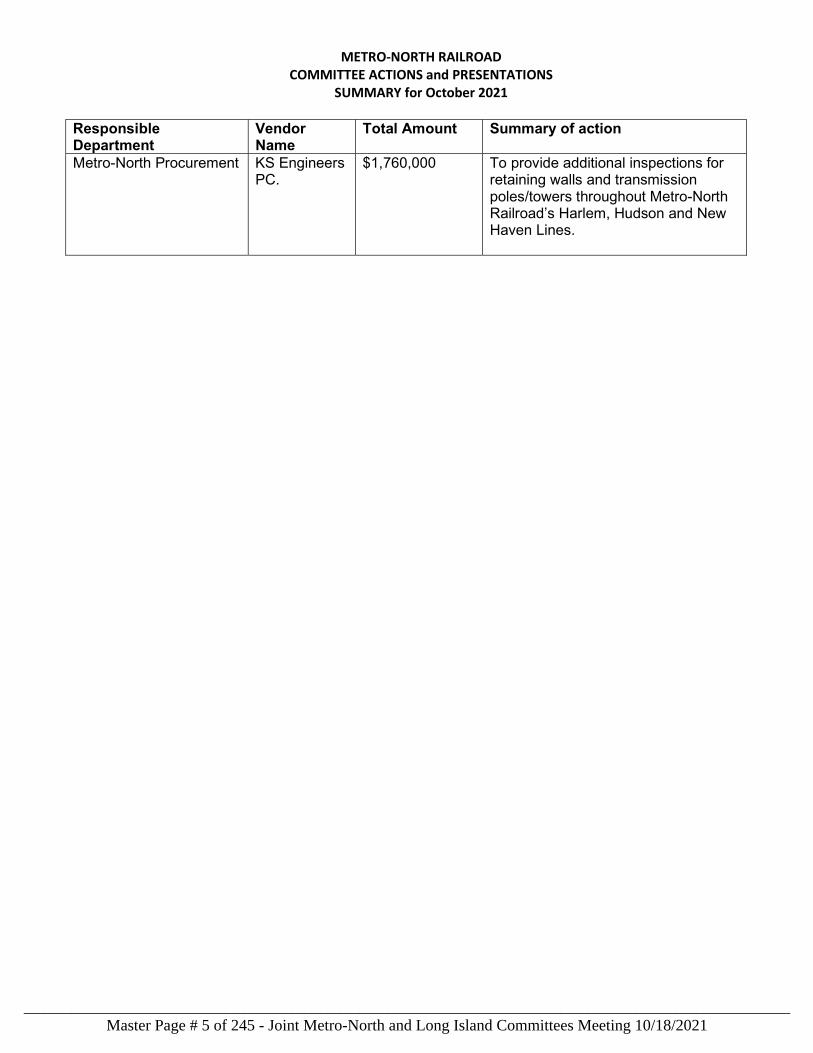
METRO-NORTH RAILROAD COMMITTEE ACTIONS and PRESENTATIONS
SUMMARY for October 2021
Responsible Department
Vendor Name
Total Amount Summary of action
Metro-North Procurement KS Engineers PC.
$1,760,000 To provide additional inspections for retaining walls and transmission poles/towers throughout Metro-North Railroad’s Harlem, Hudson and New Haven Lines.
Master Page # 5 of 245 - Joint Metro-North and Long Island Committees Meeting 10/18/2021________________________________________________________________________________
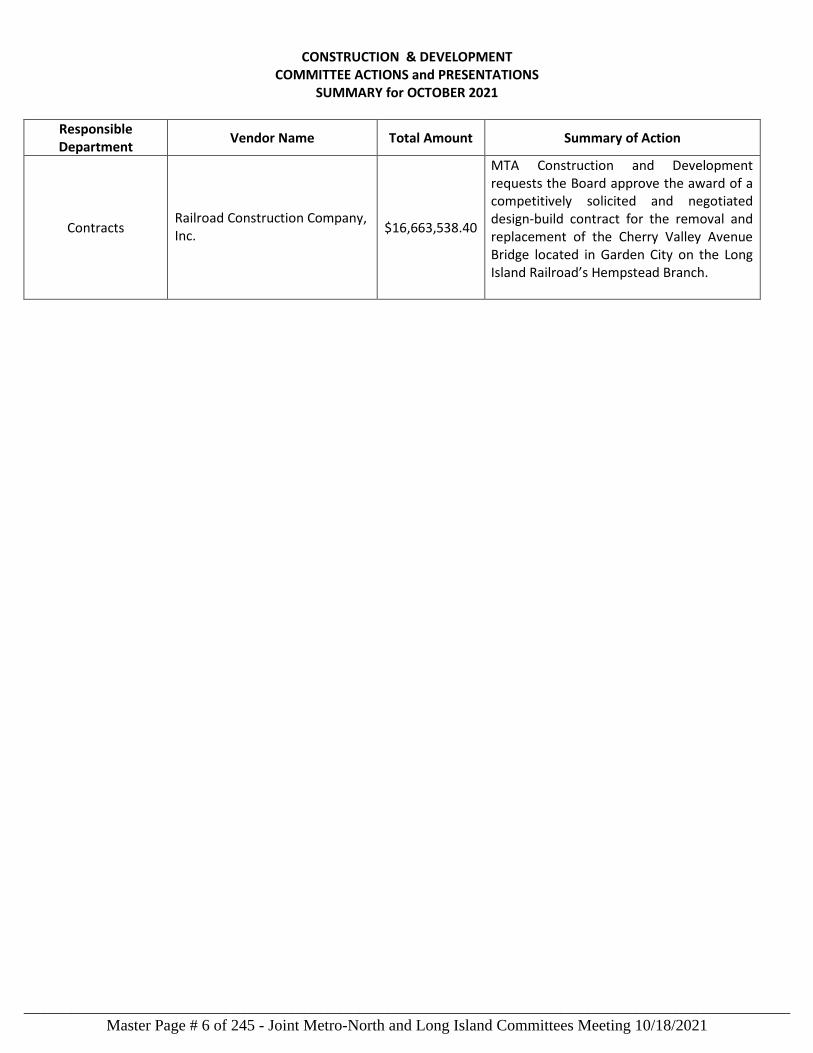
CONSTRUCTION & DEVELOPMENT COMMITTEE ACTIONS and PRESENTATIONS
SUMMARY for OCTOBER 2021
Responsible Department Vendor Name Total Amount Summary of Action
Contracts Railroad Construction Company, Inc. $16,663,538.40
MTA Construction and Development requests the Board approve the award of a competitively solicited and negotiated design-build contract for the removal and replacement of the Cherry Valley Avenue Bridge located in Garden City on the Long Island Railroad’s Hempstead Branch.
Master Page # 6 of 245 - Joint Metro-North and Long Island Committees Meeting 10/18/2021________________________________________________________________________________
Minutes of the Regular Meeting Metro-North Committee
Monday, September 13, 2021
Meeting held at 2 Broadway – 20th Floor
New York, New York 10004 9:30 a.m.
The following Board Members were present in person:
Hon. Kevin Law Hon. Randolph Glucksman Hon. Robert W. Linn Hon. Harry Porr Hon. Neal Zuckerman Hon. Vincent Tessitore, Jr. Hon. David Mack The following Board Members were present via video conference: Hon. Frank Borelli Hon. Gerard Bringmann The following Board Members were not present: Hon. Michael Fleischer Hon. Rhonda Herman Hon. Norman Brown Also present in person or via video conference: Hon. Andrew Albert Catherine Rinaldi – President Nathan Gilbertson – Vice President, Operations Support & Organizational Resiliency Susan Sarch – Vice President and General Counsel David Melillo – Vice President, Engineering Yvonne Hill-Donald – Vice President, Human Resources Ziona Rubin – Acting Vice President, Capital Programs/Construction & Development Justin Vonashek – Senior Vice President, Operations Mark Mannix – Senior Director, Corporate and Public Affairs Clyde Armstrong – Vice President, System Safety Anthony Gardner – Senior Director, Procurement and Material Management Steven Weiss – Financial Liaison, MTA Metro-North Railroad The members of the Metro-North Committee met jointly with the members of the Long Island Rail Road Committee. In addition to the Metro-North President and Metro-North staff noted above, President Eng and various staff of the Long Island Rail Road attended the joint committee meeting. The minutes of the Long Island Rail Road Committee for the meeting of September 13, 2021 should be consulted for matters addressed at the joint meeting relating to the Long Island Rail Road. Board Member Law called the joint meeting to order.
Master Page # 7 of 245 - Joint Metro-North and Long Island Committees Meeting 10/18/2021________________________________________________________________________________
PUBLIC COMMENT: The following public speakers commented on matters related to Metro-North: Shaul Picher, with the Permanent Citizen’s Advisory Committee, commented on the need to reduce fares and expand the Freedom Ticket. Lisa Daglian, Executive Director of the Permanent Citizen’s Advisory Committee, thanked everyone at Metro-North and the Long Island Rail Road who worked tirelessly through recent storms to keep the region moving. She stated that new solutions must be found to protect the MTA’s infrastructure against future storms. She recommended reconfiguring capital projects to make the system more resilient and emphasized the need for new local, state, and federal funding sources and the importance of congestion pricing. Alota Dupree commented on his recent visit to Grand Central Terminal and the importance of keeping the building looking nice. She also stated that she is looking forward to seeing Omni on the railroads and expressed concern over the need to protect conductors collecting fares on the trains. Omar Vera suggested returning to the meeting format where the railroads met jointly one month and then separately the next month. He also thanked the railroads for the swift recovery from recent storms and commented on the need to expand the Atlantic Ticket to both railroads. Jason Anthony, with Passengers United, asked Metro-North and Long Island Rail Road to consider unlimited ride ticket options and other discounts. Murray Bodin expressed his opinion that there was no reason to wear masks in the Board room. Andy Pollock stated that he was happy to see off-peak fares would remain for the rest of the year. Additional details of the comments made by the public speakers are contained in the minutes of the Long Island Rail Road Committee for the meeting of September 13, 2021. The video recording of the meeting produced by the MTA and maintained in the MTA records contains a complete record of the public comments. SUMMARY OF ACTIONS: Board Member Law stated that the Metro-North Summary of Actions was located on page five (5) of the Committee book. APPROVAL OF MINUTES: Upon motion duly made and seconded, the Committee approved the minutes of the July 21, 2021 joint Metro-North and Long Island Rail Road Committee Meeting. METRO-NORTH 2021 WORK PLAN:
President Rinaldi reported that there were no changes to the Metro-North Work Plan. The 2021 Work Plan is filed with the records of this meeting.
Master Page # 8 of 245 - Joint Metro-North and Long Island Committees Meeting 10/18/2021________________________________________________________________________________
METRO-NORTH PRESIDENT’S REPORT: President Rinaldi stated that her report this month will focus on two key areas: (1) service delivery and Metro-North’s efforts preparing for and responding to the recent storm events, and (2) Metro-North’s ridership trends and initiatives underway as riders are welcomed back. President Rinaldi reported that it looked as if the New Haven Line was going to take a direct hit from Tropical Storm Henri. This unpredictable storm, with tropical storm-force sustained winds and gusts, looked as if it would extend over much of Metro-North’s territory. Based on the ominous forecast, Metro-North implemented a proactive plan to prepare for the storm. For Sunday, August 22, 2021, Metro-North suspended service on the New Haven Line and dramatically curtailed service on the Harlem and Hudson Lines. The service plan required development of a new, diesel-only schedule by Operations Planning. Metro-North forces relocated M-8 railcars out of the New Haven Yard to higher elevations at West Haven and Bridgeport and moved some equipment into Grand Central Terminal as an added precaution. Metro-North C&S personnel removed switch motors from certain switches in the New Haven Yard because of concerns about storm surge. MofW forces mobilized to address downed trees, washouts, power problems and all the other impacts expected from a tropical storm of this magnitude. Metro-North communicated this plan to customers ahead of time so they would also be able to prepare for the storm. As it turned out, Henri, which had been tracking west for a couple of days, drifted back to the east and made landfall in western Rhode Island, greatly diminishing the impacts on Metro-North’s operations. Although the winds were not as strong as anticipated, the region saw heavy, driving rain for much of the day on Sunday. There were multiple downed trees and high-water conditions at several locations, including flooding in Grand Central Terminal’s North End Access. The decision to curtail service allowed Metro-North to address the storm’s impacts without inconveniencing customers or putting them and employees at risk. Transportation and Mechanical employees worked together to ensure that equipment was in place and ready for the resumption of normal service the next day. Stations personnel were out in force, making sure that all stations were safe and ready. Communications and other support departments worked behind the scenes to get Metro-North ready to start a new week of service. Metro-North ended August with East of Hudson on-time performance operating above goal at a high of 98.3% and West of Hudson on-time performance operated at 92.2%. Over the course of August, Metro-North also completed the deployment of PTC system software upgrades on the M8 fleet to make operational improvements and correct variances. Only ten days after Henri, the remnants of Hurricane Ida unleashed record-setting rains during the overnight of September 1st to 2nd and disrupted service for days. Ahead of the expected heavy rainfall, Metro-North took the following actions:
• Positioned staff to monitor weather and system conditions; • Deployed maintenance personnel including track, signal, and power staff at key locations; • Had public information officers and public address announcers on duty to keep customers
informed; and • Placed mobile units and diesel mobile units in strategic locations to protect the operation,
which was staffed around the clock. Simply put, Ida wreaked havoc across the service territory. Metro-North suspended service overnight due to extreme flooding conditions, downed trees and power outages. Service remained suspended all day Thursday, September 2nd as crews assessed the storm’s impact on infrastructure
Master Page # 9 of 245 - Joint Metro-North and Long Island Committees Meeting 10/18/2021________________________________________________________________________________
including washouts, mudslides, collapsed walls, flooding, fallen trees, and damage to power and signal infrastructure. Metro-North crews worked early Thursday morning and throughout the day to clear flooding and mudslide conditions and remove downed trees and debris across all three of the East of Hudson Lines. Crews cleared more than ten inches of water at two critical substations in the Bronx that allowed Metro-North to resume electric service. On the Harlem Line, crews eliminated high-water conditions in addition to clearing debris from a collapsed wall at the Williams Bridge station in the Bronx. On the New Haven Line, high water and mudslide conditions were most prevalent between Rye and Norwalk. Crews cleared debris, water, and mud from tracks, and inspected and tested switches, signals and power. President Rinaldi extended her thanks to all employees who worked tirelessly through the night and day. Thanks to their hard work, Metro-North was able to restore train service on the Harlem and New Haven Lines on Friday. Service also resumed on the Port Jervis Line on Friday morning after crews removed almost twenty fallen trees. Pascack Valley Line service started again Friday evening following infrastructure repairs by New Jersey Transit crews. Crews also continued cleanup efforts on the New Canaan and Danbury Branches, where service resumed on Saturday. The Wassaic Branch resumed service on Sunday. Service on the Hudson Line, where damage was the most severe, remained suspended until Tuesday, September 7th. Following initial post-storm inspections and clearance of trees, vegetation and debris from the tracks, crews and contractors spent day and night restoring slopes and ballast that had been washed out by floodwaters at multiple locations throughout the Hudson Line. Much of the work was between Glenwood and Greystone stations, where waters cascaded down from Warburton Avenue at multiple locations, creating mudslides onto the tracks. Contractor forces installed 600 cubic yards of heavy stone fill to stabilize areas adjoining the tracks for safe operation. At Dobbs Ferry, crews worked to rebuild a culvert washed out across all four tracks and removed debris and mud along tracks caused by flooding at Ossining. Metro-North employees worked tirelessly around the clock to restore full service as soon as possible. Work continues on segments of the Hudson Line to restore the northbound Track #3 to service. President Rinaldi stated that she cannot thank the Metro-North crews enough for the heroic work they have been doing and continue to do. She acknowledged the work of all Metro-North employees before, during, and after these storm events and unprecedented rainfall. She also extended a special thank you to Metro-North’s partners at MTA Construction & Development, especially Cathy Sheridan, who provided incredible support and coordination at the Greystone mudslide location. The way this railroad plans for and recovers from storms and executes plans is a reflection of the experience, professionalism, and dedication of the entire Metro-North workforce. On behalf of Metro-North’s customers and the entire region, President Rinaldi extended her gratitude. Reporting on ridership, President Rinaldi stated that while Metro-North focuses on protecting its infrastructure, Metro-North’s priority also remains with restoring ridership, guided by the initiatives in Metro-North’s Way Ahead – Moving Forward plan launched in June. With more New Yorkers returning to the office and school following Labor Day, and taking public transportation to get there, Metro-North must make sure the railroad is reliable, comfortable, safe, and welcoming to all. Metro-North planned and implemented a new schedule on Sunday, August 29th with service increasing to 82% of pre-pandemic levels and weekend service returning to full pre-pandemic levels. August ridership typically sees a 3-4% decline from July, the result of vacations before the school year begins. Average weekday ridership in August 2021 was indeed down approximately 6% from July 2021. Metro-North’s peak ridership this summer occurred the third week of July, with nearly 104,000 weekday riders. Weekday ridership slipped to an average of 91,300 in the last full week of August. Ridership rebounded to an average of 98,500 before Hurricane Ida struck the region. Overall
Master Page # 10 of 245 - Joint Metro-North and Long Island Committees Meeting 10/18/2021________________________________________________________________________________
weekend ridership in August was down approximately 5.5% from July, the result of the Delta variant and extremely hot weather making outdoor activities less attractive. Fortunately, early ridership data for September is favorable. On the four workdays last week, Metro-North calculated an average daily ridership of 112,468, which is the highest since the beginning of the COVID-19 pandemic. This is 42.8% of pre-COVID base ridership and 39% of the average weekday ridership in September of 2019. Last week’s average daily ridership is 8.4% higher than Metro-North’s previous highest ridership during COVID. Addressing strategies to attract riders back to the system, in addition to increasing service and travel options, Metro-North cannot wait for customers to notice:
• Metro-North stations and trains are cleaner than ever thanks to a comprehensive disinfecting regimen.
• The real-time capacity tracking feature on the Metro-North app has been made available on all three lines.
• Metro-North staff are at stations on a regular basis handing out masks to customers who may need one. With almost 100 ambassadors at outlying stations and ushers in Grand Central Terminal, Metro-North can distribute approximately 2,000 mask each week.
• Train crews also make masks available to anyone on board without one and continue to remind customers that masks are required when riding with announcements, signage, and digital advertisements.
As more and more riders continue to return to the rails, it is essential that Metro-North is doing everything it can to accommodate customers. With this in mind, last month, President Rinaldi joined Acting MTA Chair and CEO Janno Lieber and Board Member Michael Fleischer for the opening of the new, almost 600 space parking garage at the Harrison Station. Residents can now drive there to take the train to New York City or Connecticut, whether it is to pursue work opportunities or for leisure travel. Four hundred seventy-five spaces in the garage are reserved for Metro-North customers. This represents an 80% increase in available parking for riders. This project was accomplished at no capital cost to the MTA or Metro-North. Thanks to MTA Construction & Development, customers will find parking rehabilitation work recently completed at Cold Spring, while improvements continue at Beacon’s River lot and New Hamburg Station. The number of cyclists has risen considerably during the pandemic, and it is vital that mass transit plays a role in promoting that growth. That is why Metro-North and Long Island Rail Road customers are no longer required to have a bike permit to travel with bikes. While summer may be coming to a close, weekend deals on the Long Island Rail Road and Metro-North will keep on going as part of the MTA’s “Welcome Back New York” campaign. Building off the Summer Saturdays program, the railroads started this past weekend the “Autumn Weekends” promotion, which provides riders an affordable way to get out of the house, out of their cars, and onto the train for weekend trips. The fall program runs for eleven weekends through Sunday, November 21st and follows the same guidelines as the Summer Saturdays program with one big exception. Instead of limiting the program to Saturdays only, the fall initiative is available on both Saturdays and Sundays. The railroads will honor all monthly tickets for travel on weekends to and from all stations, regardless of the stations printed on the ticket. Additionally, monthly ticketholders traveling on those weekend days will be able to bring up to four additional travelers for only $1.00 per person, each way. As an added incentive for monthly ticket holders, they can bring an extra person to ride with them for only $1.00 every Wednesday beginning this week, September 15th through October 27th as part of “Friends and Family Wednesdays.” In addition, off-peak fares on the Long Island Rail Road and Metro-North will remain in effect through the end of the year, so customers using single-
Master Page # 11 of 245 - Joint Metro-North and Long Island Committees Meeting 10/18/2021________________________________________________________________________________
ride trips and ten-trip tickets can benefit from savings of up to nearly 40% off the normal price depending on distance traveled. Finally, to encourage customers to return to a more reliable, cleaner system than the one many used before the pandemic arrived in New York, Metro-North is offering new “MTA Away Deals” where riders can save on admissions to area attractions like Storm King Art Center, the Intrepid, Playland, NY Botanical Garden and other destinations. Broadway is reopening this week with several shows sold-out. Metro-North provides frequent service to bring show-goers into the City and take them home after the show. September should also be a good month for Yankees fans with seven home games at Yankee Stadium. During her report, President Rinaldi shared numerous photographs depicting the damage and devastation caused by recent storms. Board Members Law, Linn, and Glucksman commented on the extraordinary and unprecedented devastation and remarked on the unbelievable efforts of the workforce to clear the tracks. Board Member Linn asked if the MTA needs to refocus its capital efforts on infrastructure resiliency efforts and climate change. President Rinaldi agreed and stated that Metro-North has already begun to evaluate what capital efforts would be appropriate given some of the concerns with recent storms. She also remarked that while water inundation is a problem, Metro-North has invested a significant amount in its tree cutting program over recent years. Board Member Glucksman emphasized the importance of continuing to cut back trees.
The video recording of the meeting produced by the MTA and maintained in the MTA
records contains a complete record of President Rinaldi’s remarks and comments made by Board Members. METRO-NORTH SAFETY REPORT: During Long Island Rail Road’s Safety Report, Board Member Zuckerman asked about Long Island Rail Road and Metro-North COVID-19 vaccination rates and asked what the railroads and the Board can do to increase those rates. Lori Ebbighausen, Vice President – System Safety with Long Island Rail Road, emphasized the need to focus on personal employee engagement and education and then make the vaccine readily available to all those employees when they have made the decision to get vaccinated. Board Member Linn raised concerns about increased health costs associated with a lack of vaccinations. Board Member Tessitore asked the Board not to put too much pressure on the workforce and to let the “Vaccine or Test” program come full circle, be rolled out slowly, and ensure there are ample locations available to participate. He stated that he will continue to encourage the frontline workforce to get vaccinated. Clyde Armstrong, Vice President - System Safety for Metro-North, stated that Metro-North is taking employee vaccinations very seriously, is partnering with labor partners, and hopes to increase the rate of vaccinated employees through employee outreach, education, and increased availability.
During the Metro-North Safety Report, Mr. Armstrong wished Long Island Rail Road success with the rollout of its safety mascot. He also stated that Metro-North’s September Rail Safety Focus week has a number of safety events scheduled and a number of safety topics to be reviewed with employees.
Mr. Armstrong also stated that the FRA reportable customer accident rate per million
customers is 1.39% and the FRA reportable employee lost time injury rate is 1.98% for the reporting period. Metro-North has experienced zero grade crossing incidents and zero main line FRA reportable train derailments or collisions during the reporting period. Metro-North’s employee safety trainings have been very successful, including the TRACKs Program, and all trains are now fully equipped with inward and outward cameras.
Master Page # 12 of 245 - Joint Metro-North and Long Island Committees Meeting 10/18/2021________________________________________________________________________________
The full safety report is filed with the records of this meeting, and the video recording of
the meeting produced by the MTA and maintained in the MTA records contains a complete record of Mr. Armstrong’s remarks and comments made by Board Members and staff. MTAPD REPORT:
The full MTAPD report is filed with the records of this meeting.
METRO-NORTH INFORMATION ITEMS: Three Metro-North information items were presented to the Committee:
• 2022 Preliminary Budget (Public Comment) • 2021 Mid-Year Forecast
• Diversity/EEO Report – 2nd Quarter 2021
The details of the information items are contained in reports filed with the records of this
meeting. METRO-NORTH PROCUREMENTS: The Committee was presented with the following competitive Metro-North procurement:
• Board approval for a contract modification to exercise the remaining two (2)-years of the first three (3) year renewal option, totaling $5,324,852, available under the existing contract with Arrow Rail Link Service, Inc. to provide fixed route, scheduled feeder bus service (known as the Hudson Rail Link Bus Service) to and from Metro-North’s Spuyten Duyvil and Riverdale Stations located in the west Bronx on the Hudson Line. The contract was previously awarded for a four (4) year base term, ending as of June 30, 2020, and Metro-North has the right to exercise up to two (2), three (3)-year renewal options, subject to Board approval.
The Committee voted to recommend the foregoing procurement to the full Board. The details of the foregoing procurement are contained in documentation filed with the records of this meeting. The video recording of the meeting produced by the MTA and maintained in the MTA records contains a complete record of comments made by Board Members and staff. OPERATIONS, PERFORMANCE METRICS, RIDERSHIP, FINANCIAL, AND CAPITAL PROGRAM REPORTS: The details of the Operations, Performance Metrics, Ridership, Financial, and Capital Program Reports are contained in reports filed with the records of the meeting. ADJOURNMENT:
Upon motion duly made and seconded, the Committee unanimously voted to adjourn the
meeting.
Master Page # 13 of 245 - Joint Metro-North and Long Island Committees Meeting 10/18/2021________________________________________________________________________________
Respectfully submitted,
Susan Sarch
Vice President, General Counsel and Secretary
September 2021 Committee Minutes – FINAL
Master Page # 14 of 245 - Joint Metro-North and Long Island Committees Meeting 10/18/2021________________________________________________________________________________
Minutes of the Regular Meeting Long Island Rail Road Committee
Monday, September 13, 2021
Meeting held at 2 Broadway – 20th Floor
New York, New York 10004 9:30 a.m.
The following Board Members were present in person:
Hon. Kevin Law, Co-Chair Hon. Randolph Glucksman Hon. Robert W. Linn Hon. Harry Porr Hon. Neal Zuckerman Hon. Vincent Tessitore, Jr. Hon. David Mack The following Board Members were present via video conference: Hon. Frank Borelli Hon. Gerard Bringmann The following Board Members were not present: Hon. Michael Fleischer Hon. Rhonda Herman Hon. Norman Brown Also present in person: Hon. Andrew Albert Representing Long Island Rail Road: Phillip Eng, Rob Free, Loretta Ebbighausen, Francis Landers, Mark Roche, Paul Dietlin Representing MTA Construction & Development Company: David Cannon The members of the Long Island Rail Road Committee met jointly with the members of the Metro-North Committee. In addition to MTA Long Island Rail Road (“LIRR”) President Phillip Eng and members of the LIRR staff noted above, Metro-North President Catherine Rinaldi and members of the Metro-North staff attended the Joint Committee meeting. The minutes of the Metro-North Committee for the meeting of September 13, 2021 should be consulted for matters addressed at the joint meeting relating to Metro-North. Co-Chair Kevin Law called the joint meeting to order.
Master Page # 15 of 245 - Joint Metro-North and Long Island Committees Meeting 10/18/2021________________________________________________________________________________
PUBLIC COMMENT:
Paige Graves, LIRR Vice President – General Counsel & Secretary, introduced the six public speakers, followed by one pre-recorded public comment.
The following public speakers commented on matters related to LIRR:
Shaul Picher, with the Permanent Citizen’s Advisory Committee (“PCAC”) commented in support of the proposal for an expanded Freedom Ticket concept which builds on LIRR’s ticket rail study at select southeast Queens and Brooklyn stations. Lisa Daglian, Executive Director of the PCAC, thanked everyone at Metro-North and the LIRR who worked tirelessly through recent storms and heat waves to get riders where they needed to go. She stated that it is encouraging to see more riders on the rail and that it’s critical that everyone continue to mask up for our continued safety. Ms. Daglian personally thanked LIRR Conductor 6910 for her diligence in that regard. Ms. Daglian further commented that new solutions must be found to protect the MTA’s infrastructure against future storms. She recommended reconfiguring capital projects to make the system more resilient and emphasized the need for new local, state, and federal funding sources and the importance of congestion pricing. Alota Dupree commented that she is looking forward to seeing OMNY on the railroads and expressed concern about protecting conductors related to cash fare collection on trains. Omar Vera suggested returning to the meeting format where the railroads met jointly one month and then separately the next month. He thanked the railroads for the swift recovery from recent storms and commented on the need to expand the Atlantic Ticket to both railroads. Jason Anthony, Passengers United, asked Metro-North and LIRR to consider unlimited ride ticket options and other discounts. Murray Bodin expressed his opinion that wearing masks in the Board room is unnecessary. In a pre-recorded comment, Andy Pollock expressed appreciation of the extension of off-peak fares. Additional details of the comments made by the public speakers are contained in the minutes of the Metro-North Committee for the meeting of September 13, 2021. The video recording of the meeting produced by the MTA and maintained in the MTA records contains a complete record of the public comments. APPROVAL OF MINUTES: Upon motion duly made and seconded, the Committee approved the minutes of the July 21, 2021 joint Metro-North and Long Island Rail Road Committee Meeting.
Master Page # 16 of 245 - Joint Metro-North and Long Island Committees Meeting 10/18/2021________________________________________________________________________________
LIRR 2021 WORK PLAN:
President Eng reported that there were no changes to the LIRR Work Plan. The 2021 Work Plan is filed with the records of this meeting. MTA LONG ISLAND RAIL ROAD PRESIDENT’S REPORT:
President Eng stated that from the very beginning, his focus has been listening to our customers to best meet their expectations and needs. First and foremost, the reliability of the trip, getting people safely to their destinations on time. Next, the cleanliness of our stations and trains. And lastly, riders asked for accurate and real-time information to make timely decisions.
President Eng stated that over the last three years we have been doing just that. He wants the Board and the public to know that while we are an open system exposed to the elements, we continue to deliver critical work across the system that better protects and hardens our infrastructure against Mother Nature.
President Eng stated that the force and impacts from Hurricane Ida were felt across the New York metropolitan area, including Long Island. While we sustained some damage, he is confident that all this work has made a difference, minimizing impacts and allowing our heroic workforce to quickly resume service in a safe manner to most branches in under just four hours. We made the difficult decision that evening of Ida to proactively suspend service around midnight, knowing it was the best way to keep everyone safe and allow us to respond more quickly and efficiently to any issues. He commended our crews who worked hard through the night and into Thursday to get us back.
President Eng stated that Hurricane Henri had the east end of Long Island in its crosshairs and our decision to proactively suspend Montauk and Greenport service was the right call for that storm. What people don’t know is we also proactively removed some of our longest crossing gates in advance, protecting them from damage, so once it was safe to restore train service, we could do so more quickly. Looking back to Hurricane Isaias, we restored full service in just two days.
During his report, President Eng shared photographs, including depicting the damage and devastation caused by the recent storms from mudslides and flooding.
President Eng stated that the reason he points this all out is that when we launched LIRR Forward it wasn’t just a list of items to fix -- it was instilling and maintaining a sense of urgency to quickly tackle longstanding problems that repeatedly affected service and our customers. For example, when we replaced a problematic switch, we made sure to address poor drainage that contributed to the failures. President Eng stated that he is proud to say those locations did not flood during Ida, allowing us to focus our attention elsewhere.
President Eng observed that when we sought to improve grade crossing safety, we did it across all our grade crossings, not just a few improving driver visibility during storms such as Ida. We aggressively addressed overgrown vegetation along our Right-of-Way, better ensuring safety and reliability during storms with high winds and significant rainfall. This gave our locomotive engineers improved sight distance and has reduced the number of service
Master Page # 17 of 245 - Joint Metro-North and Long Island Committees Meeting 10/18/2021________________________________________________________________________________
suspensions due to fallen trees. And when we tackled potentially vulnerable utility poles, we partnered with PSEG to accelerate not only the initial planned list, but locations that were scheduled for outer years.
President Eng stated that we made it a priority to perform critical State of Good Repair work. For instance, the rehab of the viaducts in Lynbrook and Rockville Center included repairing the drainage system to extend the life of viaduct work. Concrete tie installations combined with new ballast across our system resulting in more resilient infrastructure. The larger scale work using Sandy resiliency funds to replace and raise substations, signals and key infrastructure along the Long Beach Branch kept that branch out of harm’s way during Ida.
President Eng commended our field forces who do this work, and the outstanding team in Transportation and Service Planning Departments, who figure out how to support the outages for the work and still deliver robust service which is important for riders that rely on the LIRR.
President Eng stated that the numbers tell it all. Last year we delivered the best On Time Performance (“OTP”) in modern LIRR history and this year we are on pace to beat that. President Eng reported that in July, our OTP hit 96.3% and 97.1% in August. Year-to-date, we’re at 96.2%
President Eng stated that we know we can’t stop Mother Nature – and as we all see, it’s only getting worse as storms are more frequent and more severe. There’s much more of this work to be done across our system – we're the largest commuter rail in the North America topping out at nearly 600 miles of passenger track. We are up for the challenge.
President Eng reported that we’ve officially opened the locomotive shop in Morris Park, which gives us a modern facility to better maintain our diesel fleet. On August 29th, we completed making the Port Washington Branch our first branch with full concrete ties. President Eng stated that he is confident that this work mitigated the impacts of the flooding waters from Ida. Later this month, we’ll start concrete tie and rail replacement work on the Atlantic Branch. Crews will also be out in Southampton and Hempstead performing track maintenance and surfacing.
President Eng acknowledged that, while we can’t quantify something that didn’t happen, our customers are letting us know that they are seeing and feeling the improvements and positive changes. He reiterated that every component we have made more resilient, reduces the likelihood of a failure during normal times and during storm events. President Eng observed that this adds immeasurable value, allowing us to pre-position our limited staff and equipment in a manner that helps us keep everyone safer, keep service running, and when necessary, respond more quickly to protect or restore service.
President Eng stated that understanding that storm events can change rapidly, real time and accurate information is essential for our riders. We remain committed to robust customer communications, including our industry leading LIRR TrainTime app, to provide real time information and live chat for our customers via text with an LIRR employee in our Customer Call Center.
Master Page # 18 of 245 - Joint Metro-North and Long Island Committees Meeting 10/18/2021________________________________________________________________________________
President Eng stated that our station and car maintainers continue with unprecedented cleaning and sanitization efforts in our ongoing battle against the pandemic. The HVAC in our cars exceed requirements placed on occupied building facilities continuously mixing fresh air with filtered air. fully exchanging the air 12 times an hour.
President Eng stated that we’re excited to see our ridership numbers continue to exceed the projections and he believes we’ll keep seeing the numbers rise. He noted that while monthly commutation has remained consistent for much of the pandemic, as expected we finally saw a 3% jump in monthly ticket purchases. Although a small sample size, weekday ridership after Labor Day also increased several percentage points: 48% of pre-pandemic levels and 50%, this past Friday. Weekend travel remains robust with both Saturday and Sunday seeing 75% of pre-pandemic ridership.
President Eng stated that ridership was growing breaking modern-day records before the pandemic. Growth was happening, with significant off-peak and weekend increases, which we call “non-commutation.” He reported that to help our efforts in getting customers back to the railroad, we’ve relaunched several popular initiatives that were suspended last year during the height of the pandemic, including the South Fork Commuter Connection and LIRR Getaways packages. The LIRR Getaways proved hugely popular again this summer, with the addition of new packages like our Brewery Tours, complete with special edition LIRR-themed beers. And eliminating the need for special permits to bring bikes aboard our trains makes it easier for people who want to use their bikes for that last-mile connection. President Eng added that once again, our Summer Saturdays program was a success and we were thrilled to start up Autumn Weekends this past weekend.
President Eng observed that people are using the railroad not just for work. That’s a good thing, meaning that we will see ridership where we have more capacity and our riders who need to travel during our traditional peak hours will benefit. As businesses rethink how to bring workers back, it’s the flexibility they provide that we will be monitoring, giving their employees more options to travel and giving us an opportunity to continually reimagine how we provide service.
President Eng noted that, as traffic is getting worse, he wants people to know that they can get out of their cars and ride the railroad, which is safe to use, even as we continue to make our way through this pandemic. The studies have shown that riding transit is safe. Just as we did through much of last year, just follow the advice of the health experts including properly wearing face coverings, avoid touching your mouth, eyes until you’ve had a chance to wash and sanitize your hands.
President Eng stated that he is pleased to report that with a heightened emphasis on face coverings, as Kevin mentioned anecdotally, the rate of mask usage is up. Our recent survey on September 8th showed proper mask usage back up to 92%, from the 87% we observed on August 12th. President Eng reiterated that he wants the public to hear it again: you can ride the trains safely, every day. Our train crews have been doing every day since the start of the pandemic and he couldn’t be prouder of safely riding the trains every day with them.
President Eng gave a big thanks to our MTA Police Department Explorers, who along with our Stations and T.R.A.C.K.S. team from Corporate Safety who were handing out these
Master Page # 19 of 245 - Joint Metro-North and Long Island Committees Meeting 10/18/2021________________________________________________________________________________
new “We Got You Covered Masks” at Ronkonkoma and Bethpage stations last week. These efforts go a long way to keeping everyone safe.
President Eng stated that he is so proud to be leading this agency of nearly 7,000 hardworking employees – represented and management alike – who truly give their all to their work every day. He is grateful for their expertise and their public service to the customers we serve. It’s because of them that we have come as far as we have in the past three years. President Eng stated that he is confident we will just keep getting better and better.
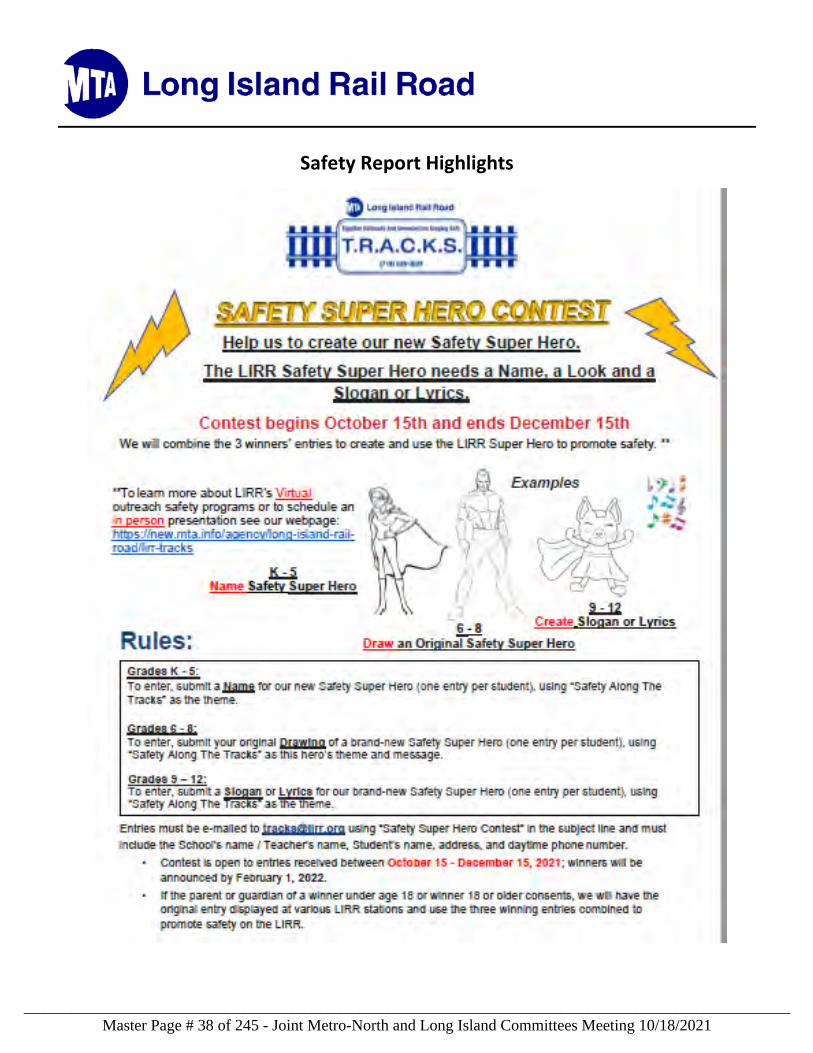
Co-Chair Law commented that it is great to see that we’re hitting 50%. Noting that a lot of New York City residents work in Long Island, he asked do we break it down with reverse commuters and are those numbers on the rebound as well? President Eng responded that we can break it down, we do have those numbers. During some of the schedules that we ran last year, where we reduced service into the City, that gave us the ability to increase service to the east direction and we saw a ridership uptick. As the ridership patterns change, with the completion of East Side Access and Third Track, along with Double Track, we’ll be able to see ridership increase in both directions, which goes hand in hand with all the development we’re seeing on Long Island. The video recording of the meeting produced by the MTA and maintained in the MTA records contains a complete record of President Eng’s report, comments and comments made by Co-Chair Law. LIRR SAFETY REPORT: Vice President – Corporate Safety Lori Ebbighausen stated that LIRR’s Safety Report appears on Page 31 of the Committee Book, reporting on safety performance through July of this year. Vice President Ebbighausen extended her deepest congratulations to Chrisann Fabio, Karen Gale and Linda Katz from our T.R.A.C.K.S. Community Relations team. Stating that we are tipping our hats to the success of Metro-Man at Metro-North, we submitted a grant to enhance our school safety contest. We’re going to have young people create our own safety superhero, an initiative we’re looking forward to that will roll out in the fall. Vice President Ebbighausen invited everyone to join us for Rail Safety Week, which is the week of September 20th. We’re going to be out at various stations engaging with out customers and with the community, to focus again on the importance of safety and how important it is that we all work together to ensure a safe environment as we’re travelling to and from our destinations. Regarding safety statistics, Vice President Ebbighausen reported that for the period ending July 2021, the average Reportable Customer Injury Rate was 3.57 injuries per million customers, down from 4.45 injuries per million customers over the same period last year. During this reporting period, the average Reportable Employee Lost Time Injury Rate was 3.73 injuries per 200,000 hours worked, which was up from 3.07 injuries per 200,000 hours worked over the same period last year. We continue to deal with soft tissue injuries. Starting in September, we’re reinvigorating our focus, including launching a new webpage and developing an employee engagement SAFER campaign to prevent sprains and strains in our physically challenging environment.
Master Page # 20 of 245 - Joint Metro-North and Long Island Committees Meeting 10/18/2021________________________________________________________________________________
Board Member Zuckerman asked about Long Island Rail Road and Metro-North COVID-19 vaccination rates, including what the railroads and the Board can do to drive vaccination rates up even further. He noted that he would ask Metro-North about this in parallel. Vice President Ebbighausen’s comments in response included that we are focusing on employee engagement and education and messaging about vaccine availability. Board Member Linn expressed concerns about increased health costs and safety risks associated with a lack of vaccinations. Board Member Tessitore asked the Board to allow the “Vaccine or Test” program to come full circle and see the results in October. Board Member Zuckerman asked him to focus on those people on the front lines. Board Member Tessitore assured him that he would, commenting that we’ve led by example and we will continue to encourage front line employees. During the LIRR Safety Report, Clyde Armstrong, Vice President – System Safety for Metro-North, offered comments on this subject from Metro-North’s perspective. The minutes of the Metro-North Committee should be consulted for his comments.
The full safety report is filed with the records of this meeting. The video recording of the
meeting produced by the MTA and maintained in the MTA records contains a complete record of Vice President Ebbighausen’s remarks and comments made by Board Members MTAPD REPORT:
The full MTAPD report is filed with the records of this meeting.
MTA CONSTRUCTION & DEVELOPMENT COMPANY
There was no MTA Construction & Development Company (“C&D”) presentation to the Committee this month. MTA CONSTRUCTION & DEVELOPMENT COMPANY ACTION ITEMS
There were no C&D Action Items for to the Committee this month. MTA CONSTRUCTION & DEVELOPMENT COMPANY PROCUREMENT ITEMS
MTA C&D presented three Procurement items, all of which relate to the East Side Access
(“ESA”) project and are as follows:
1. A modification (No. 63) to the Traction Power Systems contract (CS084) for the East Side Access (“ESA”) project to E-J Electric Installation Co. to adjust Contract Milestones, resolve Impact Cost claims, and direct the Contractor to provide for acceleration of work necessary to ensure timely commencement of revenue service for the amount of $2,250,000.
Master Page # 21 of 245 - Joint Metro-North and Long Island Committees Meeting 10/18/2021________________________________________________________________________________
2. A modification (No. 436) to the Systems Facilities Package No. 1 contract (CS179) for ESA Project to Tutor Perini Corporation to (i) install Positive Train Control (“PTC”) communication equipment furnished by the LIRR in designated Communication Rooms and interface and connect the PTC equipment to the ESA Backbone Communication System; (ii) install a PTC workstation in the ESA Train Operations Center and furnish and install power panels, conduits, cables and connections as necessary; and (iii) provide support to the LIRR during integrated testing of the PTC system throughout the ESA operations area for the amount of $2,176,500.
3. A modification (No. 9) to the Design -build Services for the Morris Park Locomotive
Shop & Employee Facility contract (6241) to RCC/AMCC JV for upgrades to the fire supply system and concrete slab replacement for the amount of $2,175,000.
Upon motion duly made and seconded, all three of these procurement action items were approved by Board.
The details of these procurements are contained in reports filed with the records of this meeting and in the video recording of the meeting, both of which are maintained in the MTA records. Those reports and video recording contain a complete record of the comments made by Board Members and staff at this Board meeting. LIRR INFORMATION ITEMS: Four LIRR information items were presented to the Committee:
2022 Preliminary Budget (Public Comment) 2021 Mid-Year Forecast
Fall Trackwork Programs
Diversity/EEO Report – 2nd Quarter 2021
The details of these information items are contained in reports filed with the records of
this meeting, maintained in the MTA records. LIRR PROCUREMENTS: There were no LIRR Procurements.
Master Page # 22 of 245 - Joint Metro-North and Long Island Committees Meeting 10/18/2021________________________________________________________________________________
OPERATIONS, PERFORMANCE METRICS, RIDERSHIP, FINANCIAL, AND CAPITAL PROGRAM REPORTS:
The details of the Operations, Performance Metrics, Ridership, Financial, and Capital Program Reports are contained in reports filed with the records of the meeting, maintained in the MTA records.
ADJOURNMENT:
Upon motion duly made and seconded, the Committee unanimously voted to adjourn the meeting at 10:59 a.m.
9
Respectfully submitted,
Is I /JtJt ,� � Paige Graves Secretary
Master Page # 23 of 245 - Joint Metro-North and Long Island Committees Meeting 10/18/2021________________________________________________________________________________
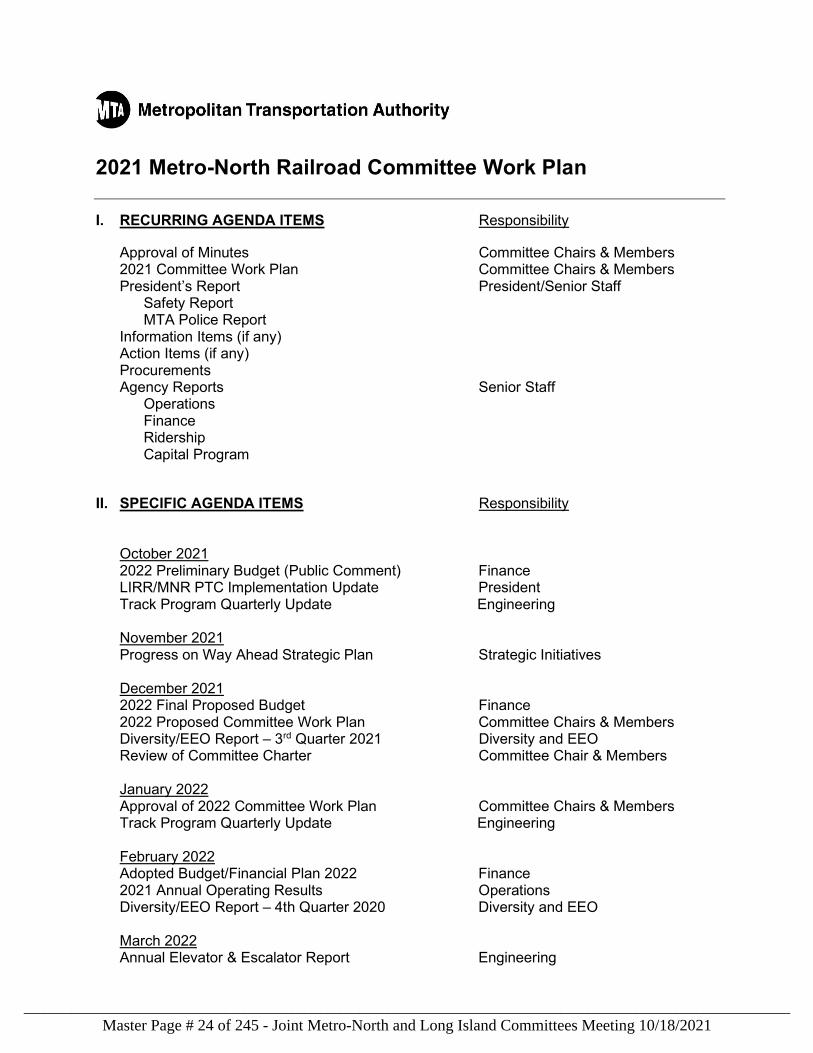
2021 Metro-North Railroad Committee Work Plan
I. RECURRING AGENDA ITEMS Responsibility
Approval of Minutes Committee Chairs & Members 2021 Committee Work Plan Committee Chairs & Members President’s Report President/Senior Staff
Safety Report MTA Police Report
Information Items (if any) Action Items (if any) Procurements Agency Reports Senior Staff
Operations Finance Ridership Capital Program
II. SPECIFIC AGENDA ITEMS Responsibility
October 2021 2022 Preliminary Budget (Public Comment) Finance LIRR/MNR PTC Implementation Update President Track Program Quarterly Update Engineering November 2021 Progress on Way Ahead Strategic Plan Strategic Initiatives December 2021 2022 Final Proposed Budget Finance 2022 Proposed Committee Work Plan Committee Chairs & Members Diversity/EEO Report – 3rd Quarter 2021 Diversity and EEO Review of Committee Charter Committee Chair & Members January 2022 Approval of 2022 Committee Work Plan Committee Chairs & Members Track Program Quarterly Update Engineering February 2022 Adopted Budget/Financial Plan 2022 Finance 2021 Annual Operating Results Operations Diversity/EEO Report – 4th Quarter 2020 Diversity and EEO March 2022 Annual Elevator & Escalator Report Engineering
Master Page # 24 of 245 - Joint Metro-North and Long Island Committees Meeting 10/18/2021________________________________________________________________________________
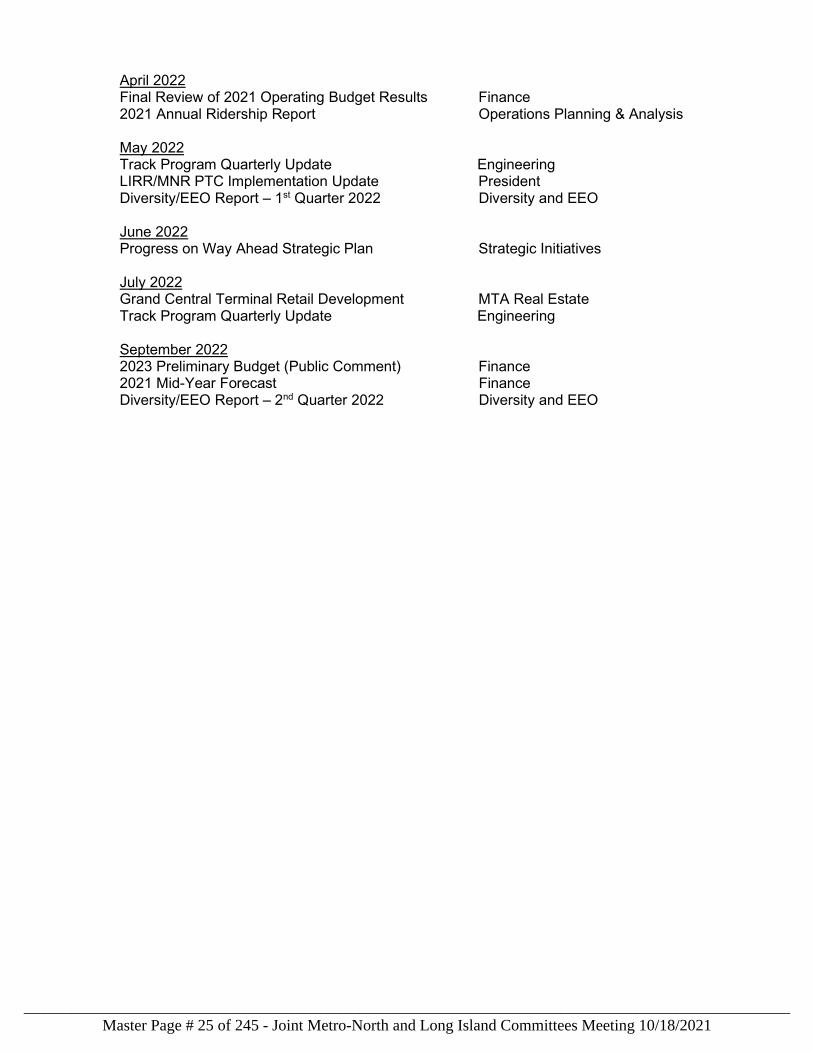
April 2022 Final Review of 2021 Operating Budget Results Finance 2021 Annual Ridership Report Operations Planning & Analysis
May 2022 Track Program Quarterly Update Engineering LIRR/MNR PTC Implementation Update President Diversity/EEO Report – 1st Quarter 2022 Diversity and EEO June 2022 Progress on Way Ahead Strategic Plan Strategic Initiatives July 2022 Grand Central Terminal Retail Development MTA Real Estate Track Program Quarterly Update Engineering September 2022 2023 Preliminary Budget (Public Comment) Finance 2021 Mid-Year Forecast Finance Diversity/EEO Report – 2nd Quarter 2022 Diversity and EEO
Master Page # 25 of 245 - Joint Metro-North and Long Island Committees Meeting 10/18/2021________________________________________________________________________________
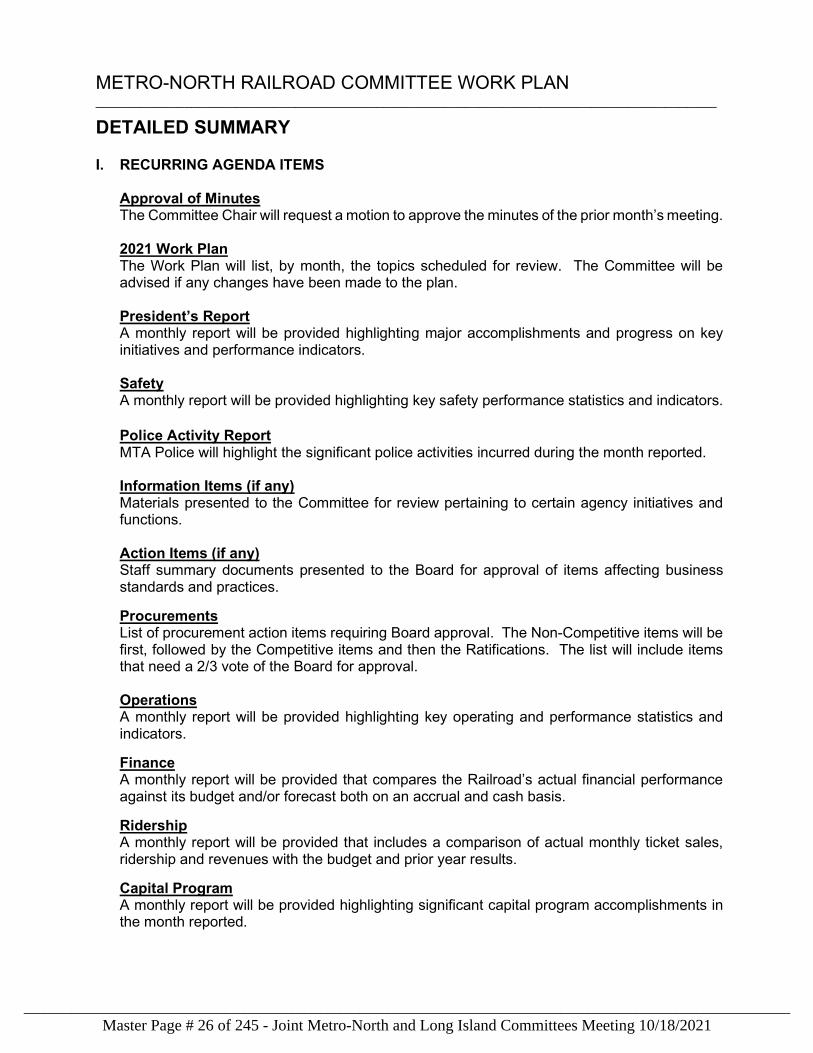
METRO-NORTH RAILROAD COMMITTEE WORK PLAN ____________________________________________________________________________________
DETAILED SUMMARY I. RECURRING AGENDA ITEMS
Approval of Minutes The Committee Chair will request a motion to approve the minutes of the prior month’s meeting. 2021 Work Plan The Work Plan will list, by month, the topics scheduled for review. The Committee will be advised if any changes have been made to the plan. President’s Report A monthly report will be provided highlighting major accomplishments and progress on key initiatives and performance indicators. Safety A monthly report will be provided highlighting key safety performance statistics and indicators. Police Activity Report MTA Police will highlight the significant police activities incurred during the month reported. Information Items (if any) Materials presented to the Committee for review pertaining to certain agency initiatives and functions. Action Items (if any) Staff summary documents presented to the Board for approval of items affecting business standards and practices.
Procurements List of procurement action items requiring Board approval. The Non-Competitive items will be first, followed by the Competitive items and then the Ratifications. The list will include items that need a 2/3 vote of the Board for approval. Operations A monthly report will be provided highlighting key operating and performance statistics and indicators.
Finance A monthly report will be provided that compares the Railroad’s actual financial performance against its budget and/or forecast both on an accrual and cash basis.
Ridership A monthly report will be provided that includes a comparison of actual monthly ticket sales, ridership and revenues with the budget and prior year results.
Capital Program A monthly report will be provided highlighting significant capital program accomplishments in the month reported.
Master Page # 26 of 245 - Joint Metro-North and Long Island Committees Meeting 10/18/2021________________________________________________________________________________
II. SPECIFIC AGENDA ITEMS
OCTOBER 2021
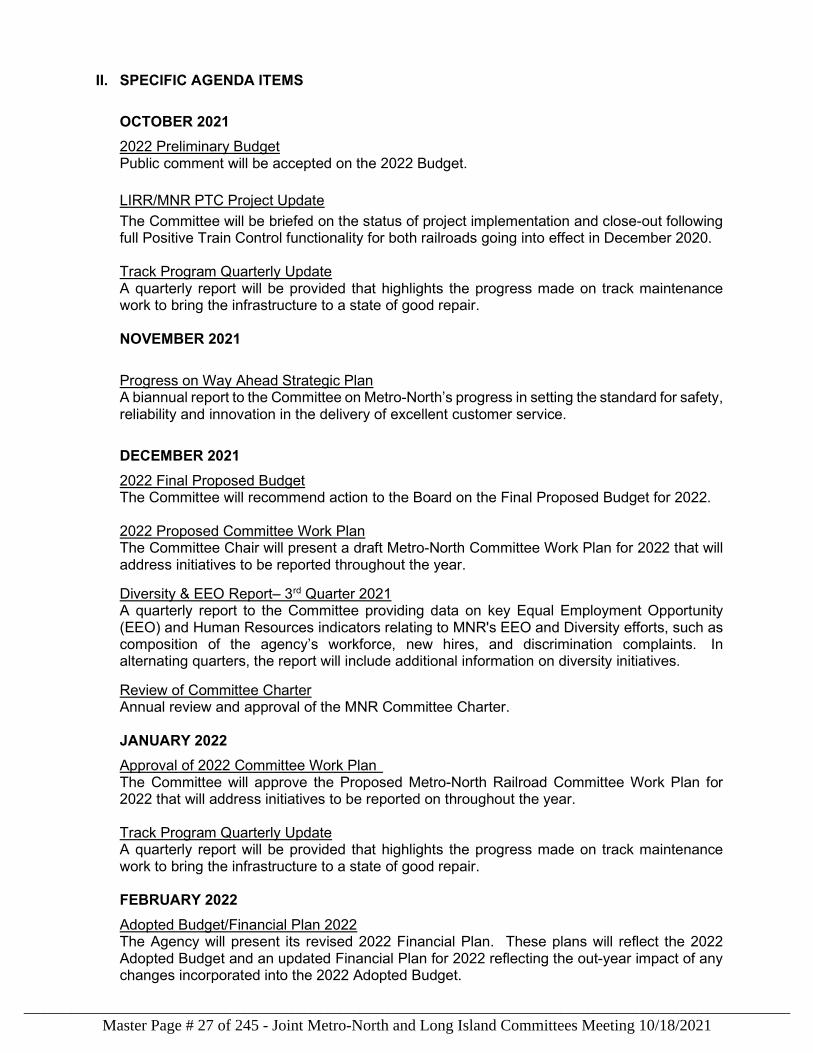
2022 Preliminary Budget Public comment will be accepted on the 2022 Budget.
LIRR/MNR PTC Project Update
The Committee will be briefed on the status of project implementation and close-out following full Positive Train Control functionality for both railroads going into effect in December 2020. Track Program Quarterly Update A quarterly report will be provided that highlights the progress made on track maintenance work to bring the infrastructure to a state of good repair. NOVEMBER 2021
Progress on Way Ahead Strategic Plan A biannual report to the Committee on Metro-North’s progress in setting the standard for safety, reliability and innovation in the delivery of excellent customer service.
DECEMBER 2021
2022 Final Proposed Budget The Committee will recommend action to the Board on the Final Proposed Budget for 2022. 2022 Proposed Committee Work Plan The Committee Chair will present a draft Metro-North Committee Work Plan for 2022 that will address initiatives to be reported throughout the year.
Diversity & EEO Report– 3rd Quarter 2021 A quarterly report to the Committee providing data on key Equal Employment Opportunity (EEO) and Human Resources indicators relating to MNR's EEO and Diversity efforts, such as composition of the agency’s workforce, new hires, and discrimination complaints. In alternating quarters, the report will include additional information on diversity initiatives.
Review of Committee Charter Annual review and approval of the MNR Committee Charter. JANUARY 2022
Approval of 2022 Committee Work Plan The Committee will approve the Proposed Metro-North Railroad Committee Work Plan for 2022 that will address initiatives to be reported on throughout the year. Track Program Quarterly Update A quarterly report will be provided that highlights the progress made on track maintenance work to bring the infrastructure to a state of good repair. FEBRUARY 2022
Adopted Budget/Financial Plan 2022 The Agency will present its revised 2022 Financial Plan. These plans will reflect the 2022 Adopted Budget and an updated Financial Plan for 2022 reflecting the out-year impact of any changes incorporated into the 2022 Adopted Budget.
Master Page # 27 of 245 - Joint Metro-North and Long Island Committees Meeting 10/18/2021________________________________________________________________________________
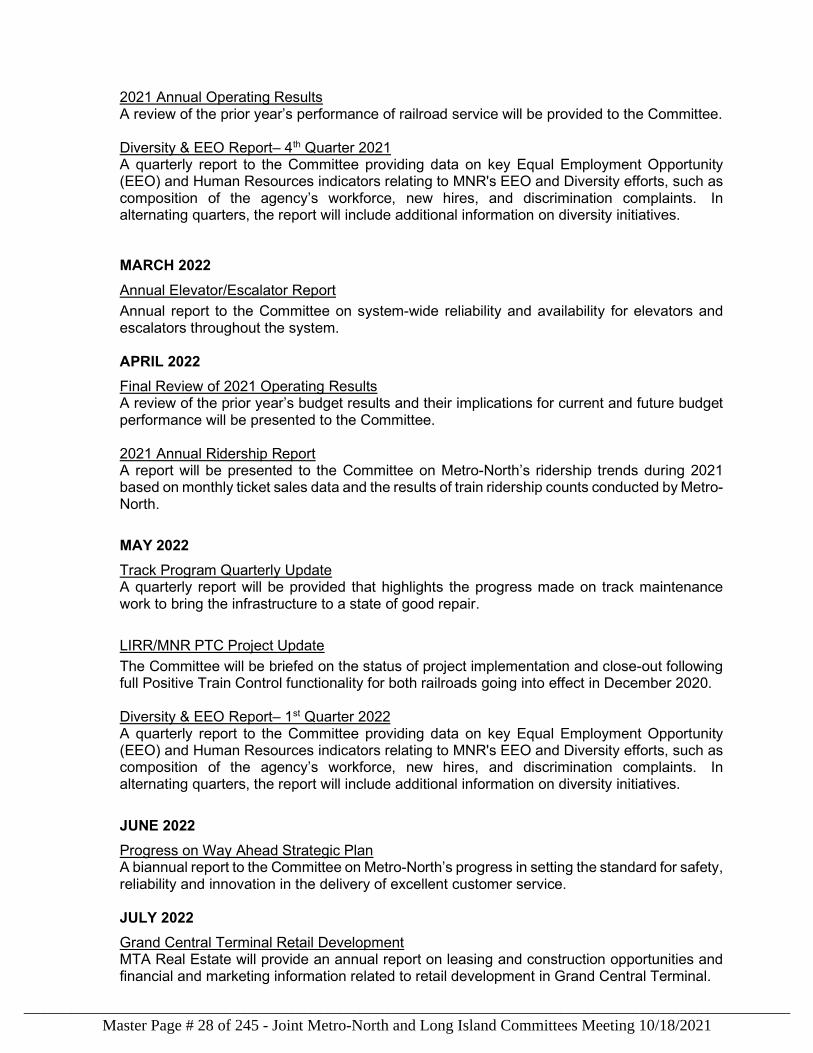
2021 Annual Operating Results A review of the prior year’s performance of railroad service will be provided to the Committee. Diversity & EEO Report– 4th Quarter 2021 A quarterly report to the Committee providing data on key Equal Employment Opportunity (EEO) and Human Resources indicators relating to MNR's EEO and Diversity efforts, such as composition of the agency’s workforce, new hires, and discrimination complaints. In alternating quarters, the report will include additional information on diversity initiatives. MARCH 2022
Annual Elevator/Escalator Report
Annual report to the Committee on system-wide reliability and availability for elevators and escalators throughout the system. APRIL 2022
Final Review of 2021 Operating Results A review of the prior year’s budget results and their implications for current and future budget performance will be presented to the Committee. 2021 Annual Ridership Report A report will be presented to the Committee on Metro-North’s ridership trends during 2021 based on monthly ticket sales data and the results of train ridership counts conducted by Metro-North.
MAY 2022
Track Program Quarterly Update A quarterly report will be provided that highlights the progress made on track maintenance work to bring the infrastructure to a state of good repair.
LIRR/MNR PTC Project Update
The Committee will be briefed on the status of project implementation and close-out following full Positive Train Control functionality for both railroads going into effect in December 2020. Diversity & EEO Report– 1st Quarter 2022 A quarterly report to the Committee providing data on key Equal Employment Opportunity (EEO) and Human Resources indicators relating to MNR's EEO and Diversity efforts, such as composition of the agency’s workforce, new hires, and discrimination complaints. In alternating quarters, the report will include additional information on diversity initiatives.
JUNE 2022
Progress on Way Ahead Strategic Plan A biannual report to the Committee on Metro-North’s progress in setting the standard for safety, reliability and innovation in the delivery of excellent customer service. JULY 2022
Grand Central Terminal Retail Development MTA Real Estate will provide an annual report on leasing and construction opportunities and financial and marketing information related to retail development in Grand Central Terminal.
Master Page # 28 of 245 - Joint Metro-North and Long Island Committees Meeting 10/18/2021________________________________________________________________________________
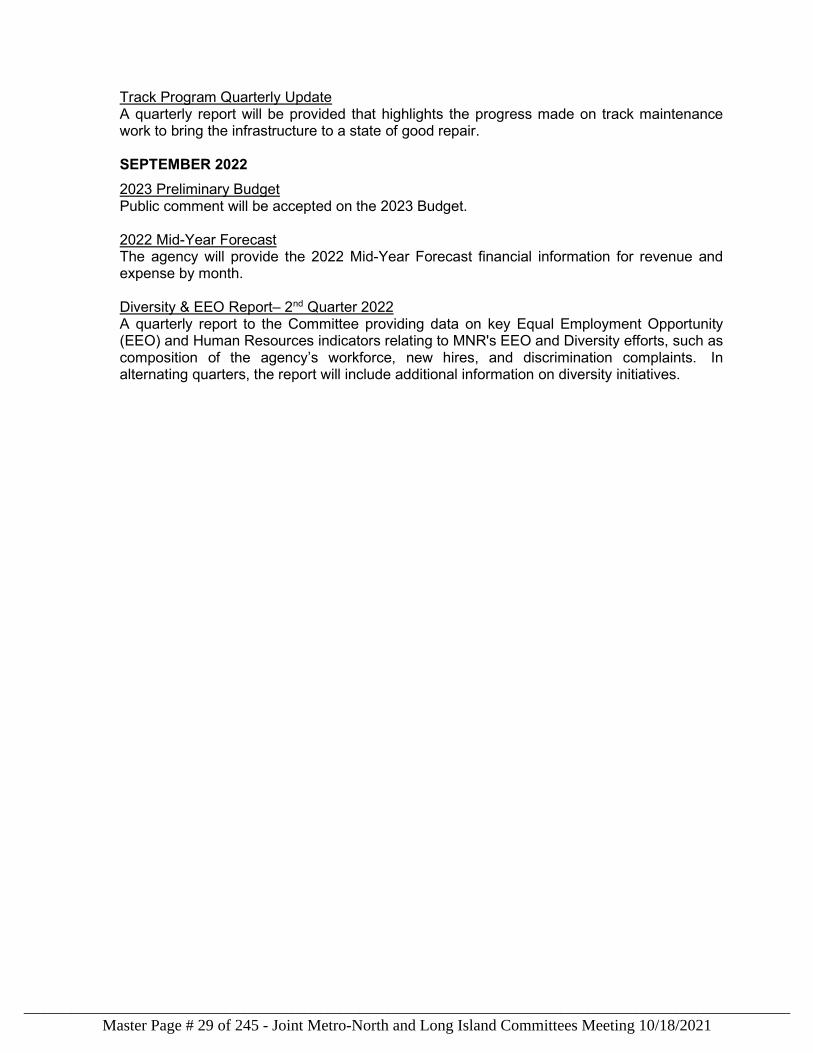
Track Program Quarterly Update A quarterly report will be provided that highlights the progress made on track maintenance work to bring the infrastructure to a state of good repair. SEPTEMBER 2022
2023 Preliminary Budget Public comment will be accepted on the 2023 Budget. 2022 Mid-Year Forecast The agency will provide the 2022 Mid-Year Forecast financial information for revenue and expense by month. Diversity & EEO Report– 2nd Quarter 2022 A quarterly report to the Committee providing data on key Equal Employment Opportunity (EEO) and Human Resources indicators relating to MNR's EEO and Diversity efforts, such as composition of the agency’s workforce, new hires, and discrimination complaints. In alternating quarters, the report will include additional information on diversity initiatives.
Master Page # 29 of 245 - Joint Metro-North and Long Island Committees Meeting 10/18/2021________________________________________________________________________________
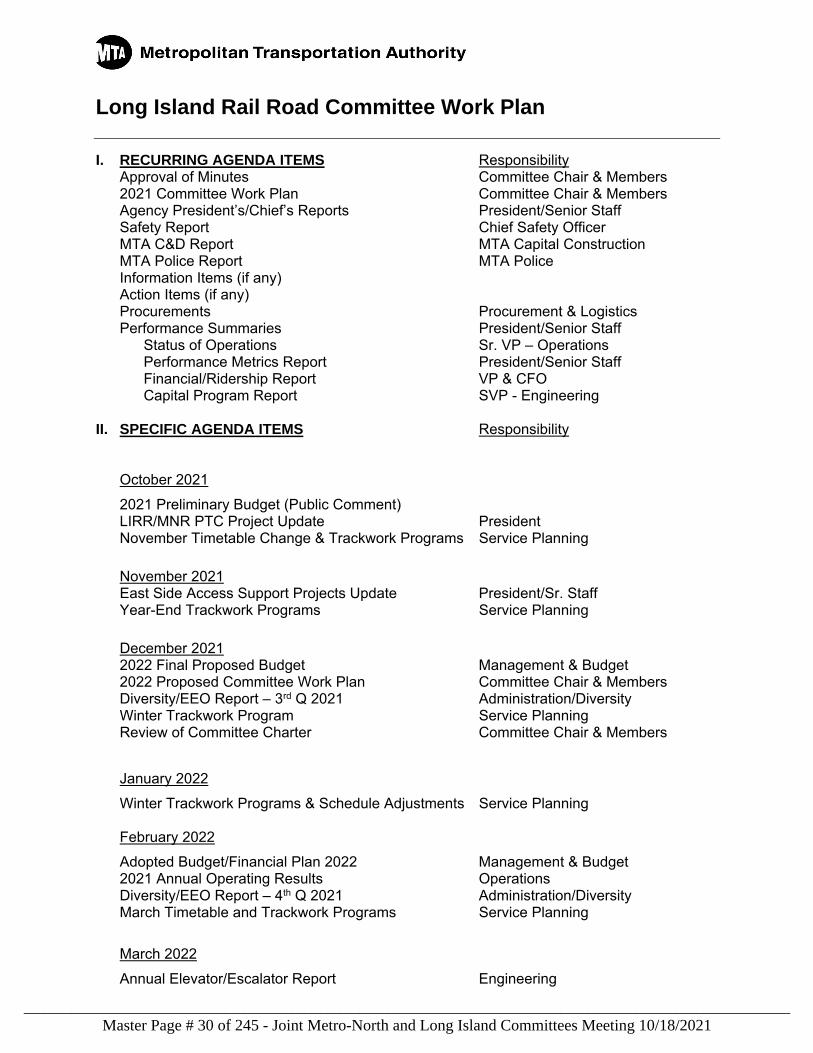
Long Island Rail Road Committee Work Plan I. RECURRING AGENDA ITEMS Responsibility
Approval of Minutes Committee Chair & Members 2021 Committee Work Plan Committee Chair & Members Agency President’s/Chief’s Reports President/Senior Staff Safety Report Chief Safety Officer MTA C&D Report MTA Capital Construction MTA Police Report MTA Police Information Items (if any) Action Items (if any) Procurements Procurement & Logistics Performance Summaries President/Senior Staff
Status of Operations Sr. VP – Operations Performance Metrics Report President/Senior Staff Financial/Ridership Report VP & CFO Capital Program Report SVP - Engineering
II. SPECIFIC AGENDA ITEMS Responsibility
October 2021 2021 Preliminary Budget (Public Comment) LIRR/MNR PTC Project Update President November Timetable Change & Trackwork Programs Service Planning
November 2021 East Side Access Support Projects Update President/Sr. Staff Year-End Trackwork Programs Service Planning
December 2021 2022 Final Proposed Budget Management & Budget 2022 Proposed Committee Work Plan Committee Chair & Members Diversity/EEO Report – 3rd Q 2021 Administration/Diversity Winter Trackwork Program Service Planning Review of Committee Charter Committee Chair & Members
January 2022 Winter Trackwork Programs & Schedule Adjustments Service Planning February 2022 Adopted Budget/Financial Plan 2022 Management & Budget 2021 Annual Operating Results Operations Diversity/EEO Report – 4th Q 2021 Administration/Diversity March Timetable and Trackwork Programs Service Planning March 2022 Annual Elevator/Escalator Report Engineering
Master Page # 30 of 245 - Joint Metro-North and Long Island Committees Meeting 10/18/2021________________________________________________________________________________
Spring Trackwork Programs Service Planning
April 2022 Final Review of 2021 Operating Budget Results Management & Budget 2021 Annual Ridership Report Finance/Marketing Spring Trackwork Programs Service Planning May 2022 June Timetable Change & Trackwork Programs Service Planning Diversity/EEO Report – 1st Q 2022 Administration/Diversity PTC Status Report President June 2022 Summer Track Work Programs Service Planning July 2022 September Timetable Change & Trackwork Programs Service Planning
September 2022 2023 Preliminary Budget (Public Comment) 2022 Mid-Year Forecast Management & Budget Fall Trackwork Programs Service Planning Diversity/EEO Report – 2nd Quarter 2022 Administration/Diversity
LONG ISLAND RAIL ROAD COMMITTEE WORK PLAN
DETAILED SUMMARY I. RECURRING AGENDA ITEMS
Approval of Minutes The Committee Chair will request a motion to approve the minutes of the prior month’s meeting. 2021 Work Plan The Work Plan will list, by month, the topics scheduled for review. The Committee will be advised if any changes have been made to the plan. President’s Report A Monthly report will be provided highlighting major accomplishments and progress on key initiatives and performance indicators.
Safety Report
A monthly report will be given highlighting key safety performance statistics and indicators MTA C&DCapital Report A monthly project update report will be provided for the month reported. Police Report MTA Police will highlight the significant police activities incurred during the month reported.
Master Page # 31 of 245 - Joint Metro-North and Long Island Committees Meeting 10/18/2021________________________________________________________________________________
Action Items (if any) Staff summary documents presented to the Board for approval of items affecting business standards and practices. Information Items (if any) Materials presented to the Committee for review pertaining to certain agency initiatives and functions. Procurements List of procurement action items requiring Board approval and items for Committee and Board information. The Non-Competitive items will be first, followed by the Competitive items and then the Ratifications. The list will include items that need a 2/3 vote of the Board for approval. Police Activity Report MTA Police will highlight the significant police activities incurred during the month reported. PERFORMANCE SUMMARIES
Operations Report A monthly report will be given highlighting key operating performance statistics and indicators. Financial Report A monthly report will be provided that compares the Railroad’s actual financial performance against its budget and/or forecast. Ridership Report A monthly report will be provided that compares actual monthly ticket sales, ridership and revenues against prior year results. Capital Program Report A report will be provided highlighting significant capital program accomplishment in the month reported.
II. SPECIFIC AGENDA ITEMS
OCTOBER 2021 2021 Preliminary Budget Public comment will be accepted on the 2021 Budget. Project Update on PTC The Committee will be briefed on the status of PTC, including activities to date and the current strategy to meet critical milestones identified in the Rail Safety Improvement Act of 2008 and as amended by the “Positive Train Control Enforcement and Implementation Act of 2015”. Highlights to include cost of PTC along with operation and implementation risks. NOVEMBER 2021 East Side Access Support Projects Update The Committee will be briefed on the status of the East Side Access Support Projects. Year-End Schedule The Committee will be informed of Agency's service plans for the Thanksgiving and Christmas/New Year's holiday periods.. DECEMBER 2021
Master Page # 32 of 245 - Joint Metro-North and Long Island Committees Meeting 10/18/2021________________________________________________________________________________
Diversity & EEO Report– 3rd Quarter 2021 Quarterly report to the Committee providing data on key EEO and Human Resources indicators relating to LIRR's Equal Employment Opportunity and Diversity efforts, such as composition of the agency’s workforce, new hires, and discrimination complaints. In alternating quarters, the report will include additional information on diversity initiatives. 2022 Final Proposed Budget The Committee will recommend action to the Board on the Final Proposed Budget for 2021. Proposed 2022 Committee Work Plan The Committee Chair will present a draft Long Island Rail Road Committee Work Plan for 2019 that will address initiatives to be reported throughout the year. Review Committee Charter Annual review of Long Island Committee Charter for Committee revision/approval. JANUARY 2022 FEBRUARY 2022 Adopted Budget/Financial Plan 2022 The Agency will present its revised 2022 Financial Plan. These plans will reflect the 2022 Adopted Budget and an updated Financial Plan for 2022 reflecting the out-year impact of any changes incorporated into the 2022 Adopted Budget. 2021 Annual Operating Results A review of the prior year’s performance of railroad service will be provided to the Committee. Diversity & EEO Report– 4th Quarter 2021 Quarterly report to the Committee providing data on key EEO and Human Resources indicators relating to LIRR's Equal Employment Opportunity and Diversity efforts, such as composition of the agency’s workforce, new hires, and discrimination complaints. In alternating quarters, the report will include additional information on diversity initiatives. March Timetable/Spring Trackwork Programs The Committee will be advised of plans to adjust schedules. MARCH 2022 Annual Elevator/Escalator Report Annual report to the Committee on system-wide availability for elevators and escalators throughout the system. Spring Trackwork Programs The Committee will be advised of Agency plans to adjust schedules to support construction projects during the Spring of 2022.
APRIL 2022
Final Review of 2021 Operating Results A review of the prior year’s budget results and their implications for current and future budget performance will be presented to the Committee.
Master Page # 33 of 245 - Joint Metro-North and Long Island Committees Meeting 10/18/2021________________________________________________________________________________
2021 Annual Ridership Report A report will be presented to the Committee on Agency ridership trends during 2019 based on monthly ticket sales data and the results of train ridership counts conducted by the Agency. Spring Trackwork Programs The Committee will be advised of Agency plans to adjust schedules to support construction projects during the Spring of 2022. MAY 2022 June Timetable Change & Trackwork Programs The Committee will be advised of Agency plans to adjust schedules to support construction projects during the summer of 2022.
Diversity & EEO Report– 1st Quarter 2022 Quarterly report to the Committee providing data on key EEO and Human Resources indicators relating to LIRR's Equal Employment Opportunity and Diversity efforts, such as composition of the agency’s workforce, new hires, and discrimination complaints. In alternating quarters, the report will include additional information on diversity initiatives
PTC Status Report A monthly status report will be provided that highlights the accomplishments, schedule, challenges and risk associated with the PTC implementation.
JUNE 2022 Summer Track Work Programs This is to inform the Long Island Committee of the MTA Long Island Rail Road’s plans to adjust schedules to support various trackwork programs, Main Line Second Track construction and East Side Access Readiness projects JULY 2022 Summer Trackwork Programs & Summer Service The Committee will be advised of Agency plans to adjust schedules to support construction projects during the fall of 2022. SEPTEMBER 2022 2022 Preliminary Budget Public comment will be accepted on the 2020 Budget. 2022 Mid-Year Forecast The agency will provide the 2022 Mid-Year Forecast financial information for revenue and expense by month. Diversity & EEO Report– 2nd Quarter 2022 Quarterly report to the Committee providing data on key EEO and Human Resources indicators relating to LIRR's Equal Employment Opportunity and Diversity efforts, such as composition of the agency’s workforce, new hires, and discrimination complaints. In alternating quarters, the report will include additional information on diversity initiatives.
Master Page # 34 of 245 - Joint Metro-North and Long Island Committees Meeting 10/18/2021________________________________________________________________________________
Clyde Armstrong Vice President Office of System Safety
Master Page # 35 of 245 - Joint Metro-North and Long Island Committees Meeting 10/18/2021________________________________________________________________________________
Safety Highlights: Metro-North Railroad (MNR) continues to make every effort to keep our customers and employees safe during the ongoing COVID-19 pandemic. Since the beginning of the pandemic, MNR has implemented the following initiatives:
• Promote social distancing and good hygiene • Require anyone traveling on MNR trains to wear a face covering • Provide enhanced cleaning at Metro-North stations, on trains and in employee
facilities • Distributed personal protective equipment to employees (masks/face coverings,
face shields, gloves, personal thermometers, hand sanitizer, etc.) • Offer free onsite Polymerase Chain Reaction (PCR) COVID-19 testing to
employees • All MNR employees are being offered the opportunity to receive the COVID-19
vaccination under Phase 1b of distribution.
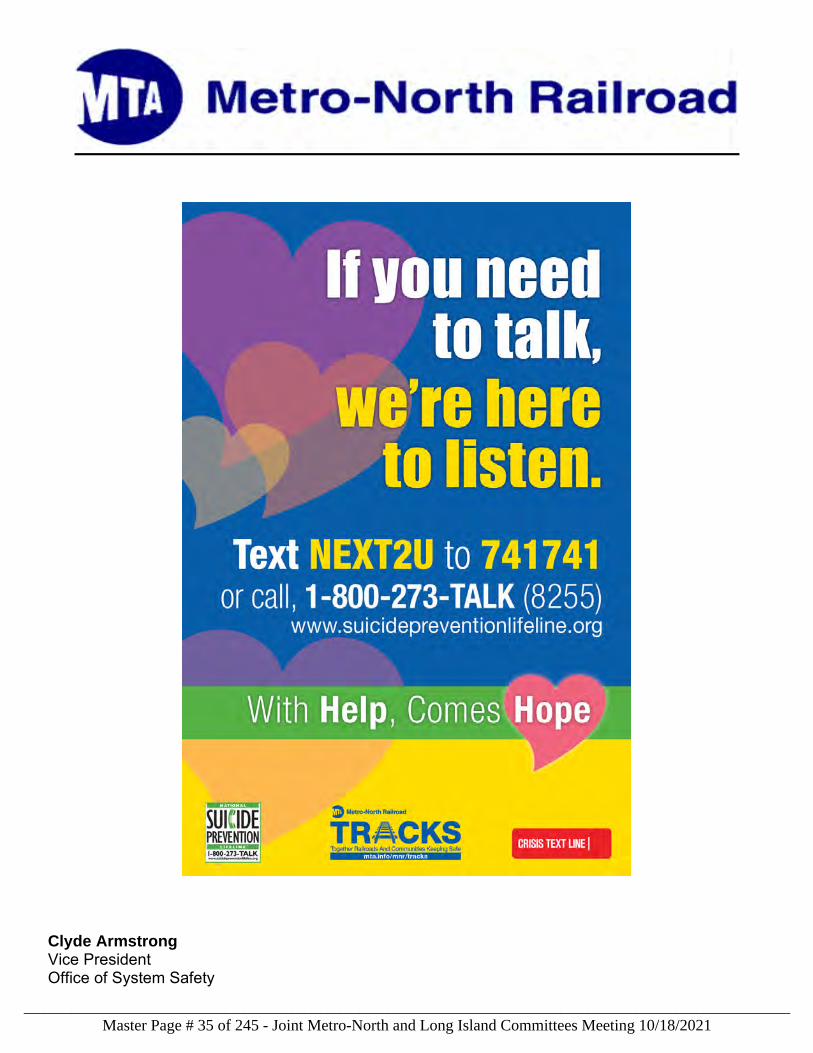
MNR’s Office of System Safety continues to promote suicide prevention and mental health awareness by partnering with the Crisis Text Line and National Suicide Prevention Lifeline to provide resources to those in need. This awareness program provides a direct hotline and mobile text option to immediately connect those in need with a trained counselor.
For the current 12-month period (September 2020 – August 2021) versus the previous 12-month period (September 2019 – August 2020), employee lost time injuries per 200,000 working hours decreased by 4.0%.
The customer reportable injury rate (per one million customers) increased by 74.5 % from September 2021 - August 2020 compared to previous 12-month period (September 2020 - August 2019). This increase is attributed to the decrease in the number of passenger rides during the COVID-19 pandemic.
Clyde Armstrong Vice President Office of System Safety
Master Page # 36 of 245 - Joint Metro-North and Long Island Committees Meeting 10/18/2021________________________________________________________________________________
September 2018 -August 2019
September 2019 -August 2020
September 2020 -August 2021
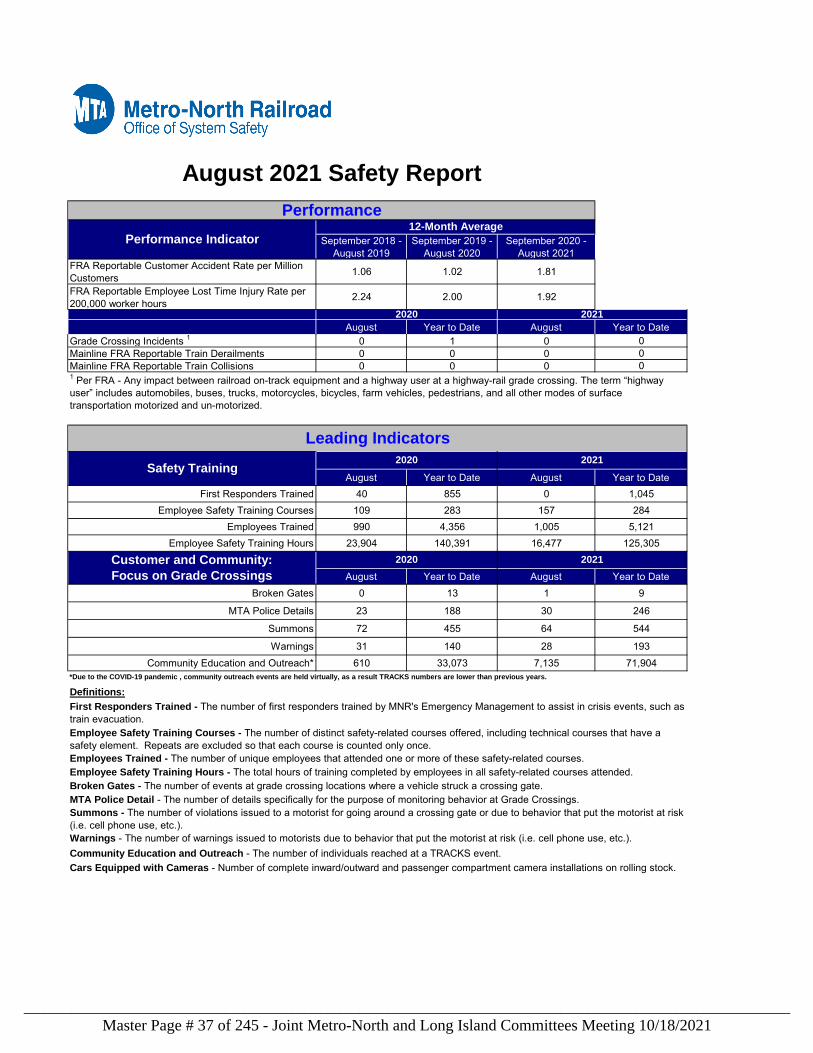
FRA Reportable Customer Accident Rate per Million Customers 1.06 1.02 1.81
FRA Reportable Employee Lost Time Injury Rate per 200,000 worker hours 2.24 2.00 1.92
August Year to Date August Year to DateGrade Crossing Incidents 1 0 1 0 0Mainline FRA Reportable Train Derailments 0 0 0 0Mainline FRA Reportable Train Collisions 0 0 0 0
August Year to Date August Year to DateFirst Responders Trained 40 855 0 1,045
Employee Safety Training Courses 109 283 157 284Employees Trained 990 4,356 1,005 5,121
Employee Safety Training Hours 23,904 140,391 16,477 125,305
August Year to Date August Year to DateBroken Gates 0 13 1 9
MTA Police Details 23 188 30 246
Summons 72 455 64 544
Warnings 31 140 28 193Community Education and Outreach* 610 33,073 7,135 71,904
Definitions:
August 2021 Safety ReportPerformance
Performance Indicator12-Month Average
1 Per FRA - Any impact between railroad on-track equipment and a highway user at a highway-rail grade crossing. The term “highway user” includes automobiles, buses, trucks, motorcycles, bicycles, farm vehicles, pedestrians, and all other modes of surface transportation motorized and un-motorized.
2020 2021
*Due to the COVID-19 pandemic , community outreach events are held virtually, as a result TRACKS numbers are lower than previous years.
20212020
Leading Indicators
Customer and Community:Focus on Grade Crossings
20212020Safety Training
Cars Equipped with Cameras - Number of complete inward/outward and passenger compartment camera installations on rolling stock.
MTA Police Detail - The number of details specifically for the purpose of monitoring behavior at Grade Crossings.
First Responders Trained - The number of first responders trained by MNR's Emergency Management to assist in crisis events, such as train evacuation.Employee Safety Training Courses - The number of distinct safety-related courses offered, including technical courses that have a safety element. Repeats are excluded so that each course is counted only once.
Summons - The number of violations issued to a motorist for going around a crossing gate or due to behavior that put the motorist at risk (i.e. cell phone use, etc.).Warnings - The number of warnings issued to motorists due to behavior that put the motorist at risk (i.e. cell phone use, etc.).Community Education and Outreach - The number of individuals reached at a TRACKS event.
Employees Trained - The number of unique employees that attended one or more of these safety-related courses. Employee Safety Training Hours - The total hours of training completed by employees in all safety-related courses attended. Broken Gates - The number of events at grade crossing locations where a vehicle struck a crossing gate.
Master Page # 37 of 245 - Joint Metro-North and Long Island Committees Meeting 10/18/2021________________________________________________________________________________
Safety Report Highlights
Master Page # 38 of 245 - Joint Metro-North and Long Island Committees Meeting 10/18/2021________________________________________________________________________________
On September 29th, an email was sent to over 2,900 contacts in Suffolk, Nassau and New York City public and private schools inviting students to enter our new Super Hero Contest. October 15th is the official contest start for submission of names, drawings, and slogans or lyrics for the first ever LIRR Safety Super Hero. In our fifth year, the contest theme continues to emphasize Safety Along the Tracks. Throughout the month of September, TRACKS customer and community engagement activities focused not only on the hazards of grade crossings, tracks, and third rail but also the importance of adhering to federal law which requires the wearing of masks or face coverings on board trains and indoors in stations and on platforms. Welcoming workers back to their offices and students back to school, LIRR Stations, Transportation, and Corporate Safety team members in partnership with MTA Police, MTA Police Explorers, the Federal Railroad Administration, and NYS Department of Transportation Public Transportation Safety Board distributed over 4,500 masks and hand sanitizers. This distribution continued during Rail Safety Week. To date, the TRACKS program partnership between LIRR Corporate Safety and the MTA Police has reached over nineteen thousand participants. The program offers both in person and virtual classes customizable to the needs of the audience. Program offerings include training for special needs populations on how to travel safely using our system and new drivers/driver’s education programs. Our community relations specialist can be reached via email at [email protected] or via phone at (718) 558 3028 to learn more about the program and this year’s contest. The LIRR’s third quarter safety FOCUS Day was conducted September 30th. The two main topics for employee engagement were sprains and strains and the vaccine or test mandate. In addition to understanding how employees are experiencing safety at the LIRR, managers and supervisors focused on how to prevent strains and sprains in the field, shop, and office environment. The conversations also focused on resources to get the facts about vaccinations; learning how to upload vaccination cards; and information regarding the mandate to undergo weekly COVID testing starting October 4th. For the reporting period ending August 2021, the average Reportable Customer Injury Rate was 3.34 injuries per million customers as compared to 4.61 injuries per million customers over the same period last year. This is a twenty-eight percent decrease. The actual number of injuries is down thirty-five percent. Penn Station continues to be the location with the largest number of customer injuries. We meet monthly with our partners at Amtrak and New Jersey Transit to discuss incidents at Penn Station and how we can collaborate to reduce injuries. Slips, trips, and falls result in the most injuries. The type of injury most customers sustain are bruises and contusions followed closely by lacerations and abrasions. During this reporting period, the average Reportable Employee Lost Time Injury Rate was 3.79 injuries per 200,000 hours worked as compared to 3.06 injuries per 200,000 hours worked. Soft tissue injuries are the greatest type of injury sustained averaging approximately forty-five percent of employee injuries annually. Lori Ebbighausen Vice President Corporate Safety
Master Page # 39 of 245 - Joint Metro-North and Long Island Committees Meeting 10/18/2021________________________________________________________________________________
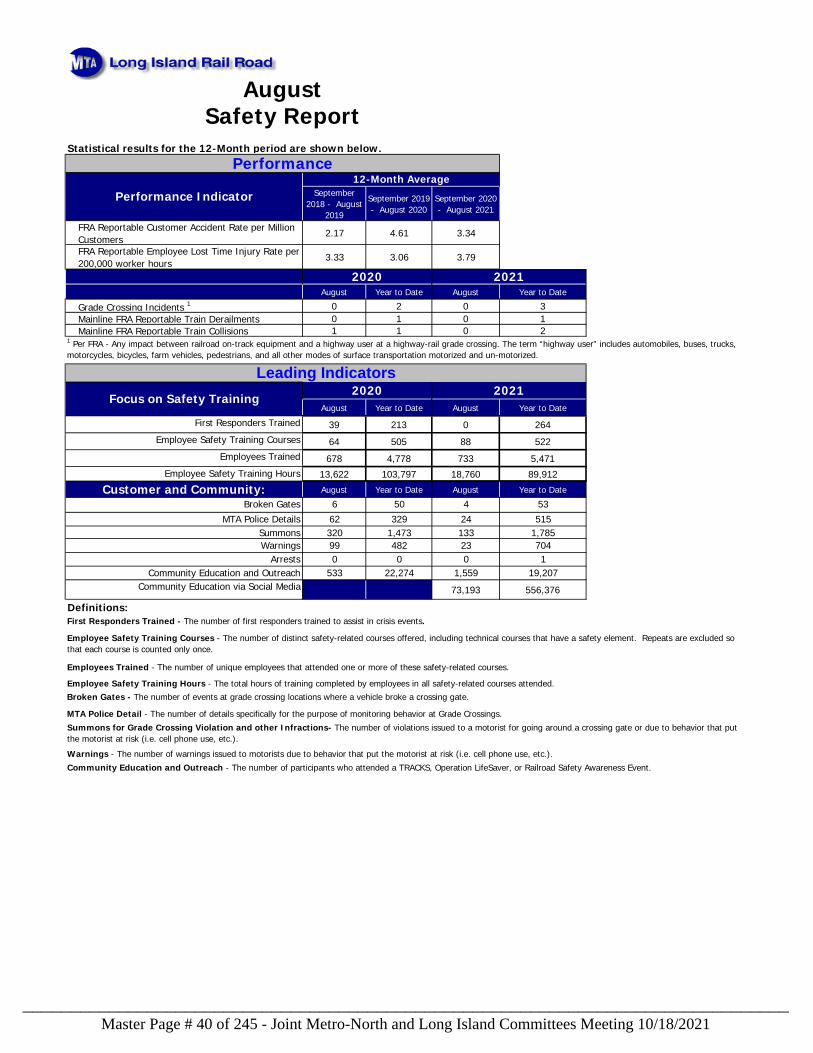
Statistical results for the 12-Month period are shown below.
September 2018 - August
2019
September 2019 - August 2020
September 2020 - August 2021
FRA Reportable Customer Accident Rate per Million Customers 2.17 4.61 3.34
FRA Reportable Employee Lost Time Injury Rate per 200,000 worker hours 3.33 3.06 3.79
August Year to Date August Year to DateGrade Crossing Incidents 1 0 2 0 3Mainline FRA Reportable Train Derailments 0 1 0 1Mainline FRA Reportable Train Collisions 1 1 0 2
August Year to Date August Year to DateFirst Responders Trained 39 213 0 264
Employee Safety Training Courses 64 505 88 522Employees Trained 678 4,778 733 5,471
Employee Safety Training Hours 13,622 103,797 18,760 89,912Customer and Community:
August Year to Date August Year to Date
Broken Gates 6 50 4 53MTA Police Details 62 329 24 515
Summons 320 1,473 133 1,785Warnings 99 482 23 704
Arrests 0 0 0 1Community Education and Outreach 533 22,274 1,559 19,207
Community Education via Social Media 73,193 556,376
Definitions:
Employees Trained - The number of unique employees that attended one or more of these safety-related courses.
Employee Safety Training Hours - The total hours of training completed by employees in all safety-related courses attended.
MTA Police Detail - The number of details specifically for the purpose of monitoring behavior at Grade Crossings.
First Responders Trained - The number of first responders trained to assist in crisis events.
Employee Safety Training Courses - The number of distinct safety-related courses offered, including technical courses that have a safety element. Repeats are excluded so that each course is counted only once.
Broken Gates - The number of events at grade crossing locations where a vehicle broke a crossing gate.
Summons for Grade Crossing Violation and other Infractions- The number of violations issued to a motorist for going around a crossing gate or due to behavior that put the motorist at risk (i.e. cell phone use, etc.).Warnings - The number of warnings issued to motorists due to behavior that put the motorist at risk (i.e. cell phone use, etc.).Community Education and Outreach - The number of participants who attended a TRACKS, Operation LifeSaver, or Railroad Safety Awareness Event.
August
Leading Indicators
Safety Report
Performance
Performance Indicator12-Month Average
2020 2021
1 Per FRA - Any impact between railroad on-track equipment and a highway user at a highway-rail grade crossing. The term “highway user” includes automobiles, buses, trucks, motorcycles, bicycles, farm vehicles, pedestrians, and all other modes of surface transportation motorized and un-motorized.
Focus on Safety Training 2020 2021
Master Page # 40 of 245 - Joint Metro-North and Long Island Committees Meeting 10/18/2021________________________________________________________________________________
Police Report
Master Page # 41 of 245 - Joint Metro-North and Long Island Committees Meeting 10/18/2021________________________________________________________________________________
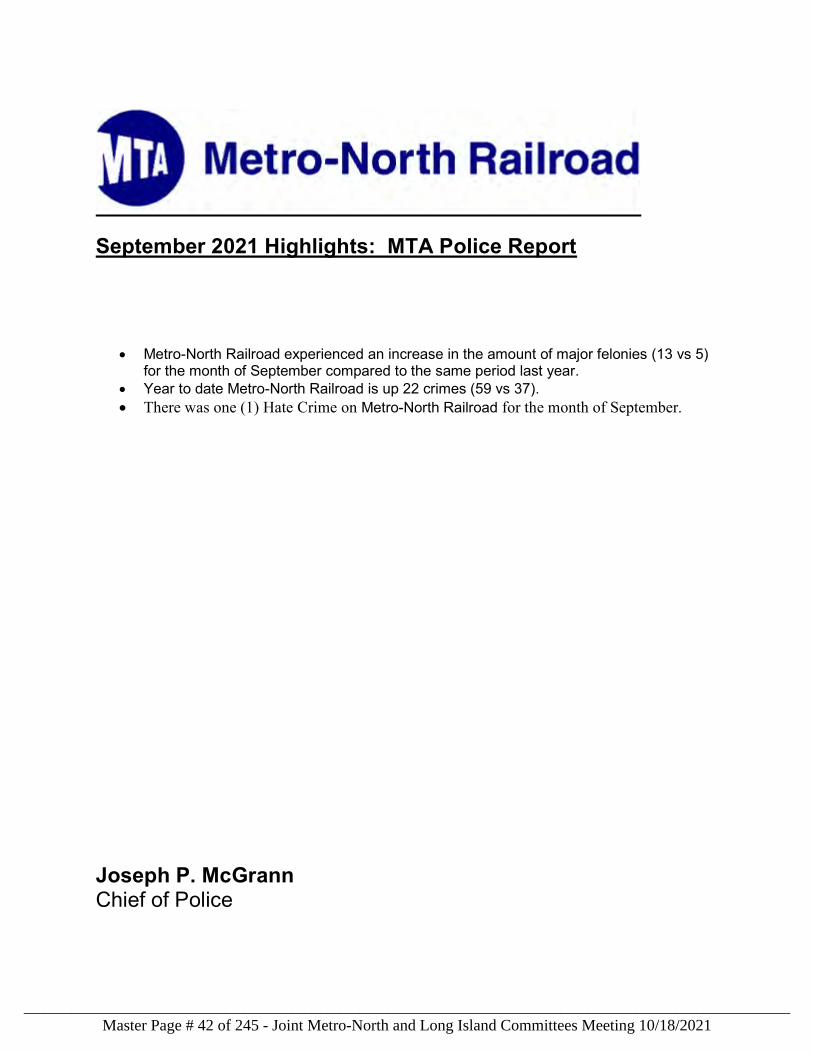
September 2021 Highlights: MTA Police Report
Metro-North Railroad experienced an increase in the amount of major felonies (13 vs 5) for the month of September compared to the same period last year.
Year to date Metro-North Railroad is up 22 crimes (59 vs 37). There was one (1) Hate Crime on Metro-North Railroad for the month of September.
Joseph P. McGrann Chief of Police
Master Page # 42 of 245 - Joint Metro-North and Long Island Committees Meeting 10/18/2021________________________________________________________________________________
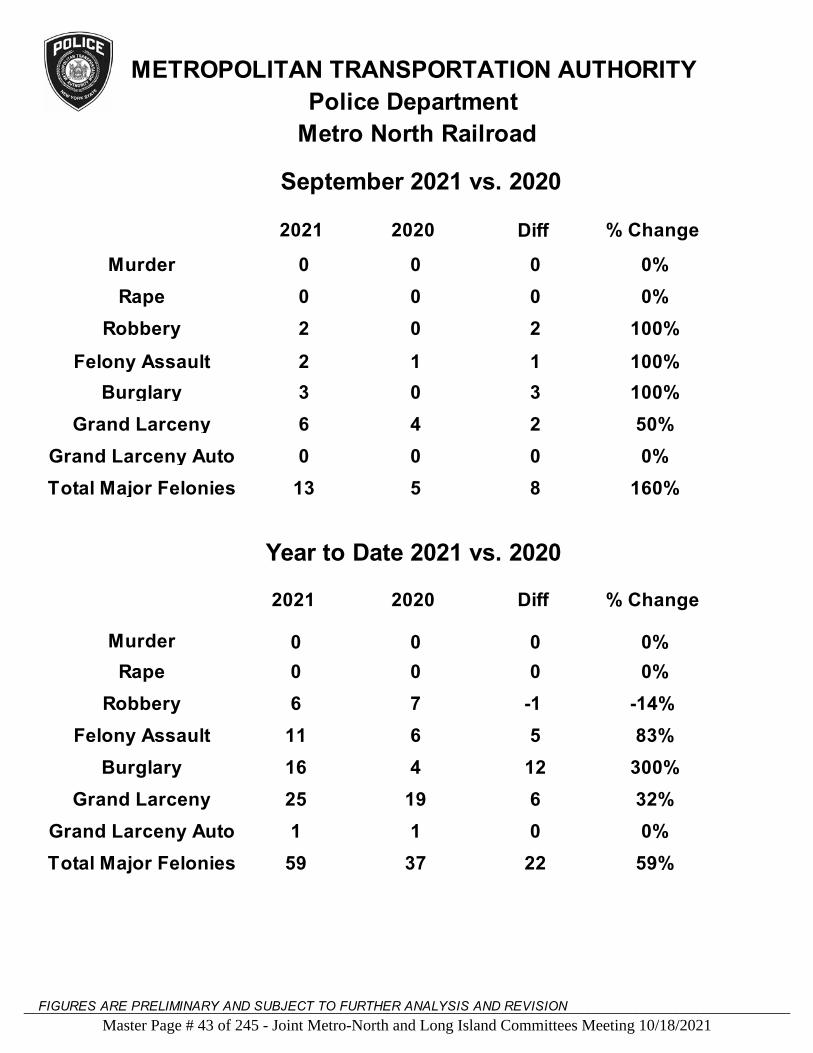
METROPOLITAN TRANSPORTATION AUTHORITY
Police Department
Murder
Rape
Robbery
Felony Assault
Burglary
Grand Larceny
Grand Larceny Auto
Total Major Felonies
0
0
2
2
3
6
0
13
0
0
0
1
0
0
4
5
2
0
0
2
1
3
0
8
50%
Murder
Rape
Robbery
Felony Assault
Burglary
Grand Larceny
Grand Larceny Auto
Total Major Felonies
25 19
1
16
11
6
0
0
59 37
1
4
6
7
0
0
6
0
12
5
-1
0
0
22
0%
0%
100%
100%
100%
0%
160%
0%
0%
-14%
83%
300%
32%
0%
59%
2021 2020 Diff % Change
September 2021 vs. 2020
Metro North Railroad
FIGURES ARE PRELIMINARY AND SUBJECT TO FURTHER ANALYSIS AND REVISION
2021 2020 Diff % Change
Year to Date 2021 vs. 2020
Master Page # 43 of 245 - Joint Metro-North and Long Island Committees Meeting 10/18/2021________________________________________________________________________________
September 2021 Highlights: MTA Police Report
Long Island Rail Road experienced a decrease in the amount of major felonies (6 vs 9) for the month of September compared to the same period last year.
Year to date Long Island Rail Road is up 2 crimes (51 vs 49). There were two (2) Hate Crimes on Long Island Rail Road for the month of September.
Joseph P. McGrann Chief of Police
Master Page # 44 of 245 - Joint Metro-North and Long Island Committees Meeting 10/18/2021________________________________________________________________________________

METROPOLITAN TRANSPORTATION AUTHORITY
Police Department
Murder
Rape
Robbery
Felony Assault
Burglary
Grand Larceny
Grand Larceny Auto
Total Major Felonies
0
0
3
1
0
2
0
6
0
0
2
3
1
0
3
9
-1
0
0
1
-2
-1
0
-3
-33%
Murder
Rape
Robbery
Felony Assault
Burglary
Grand Larceny
Grand Larceny Auto
Total Major Felonies
18 21
1
6
17
9
0
0
51 49
0
4
8
16
0
0
-3
1
2
9
-7
0
0
2
0%
0%
50%
-67%
-100%
0%
-33%
0%
0%
-44%
113%
50%
-14%
100%
4%
2021 2020 Diff % Change
September 2021 vs. 2020
Long Island Rail Road
FIGURES ARE PRELIMINARY AND SUBJECT TO FURTHER ANALYSIS AND REVISION
2021 2020 Diff % Change
Year to Date 2021 vs. 2020
Master Page # 45 of 245 - Joint Metro-North and Long Island Committees Meeting 10/18/2021________________________________________________________________________________
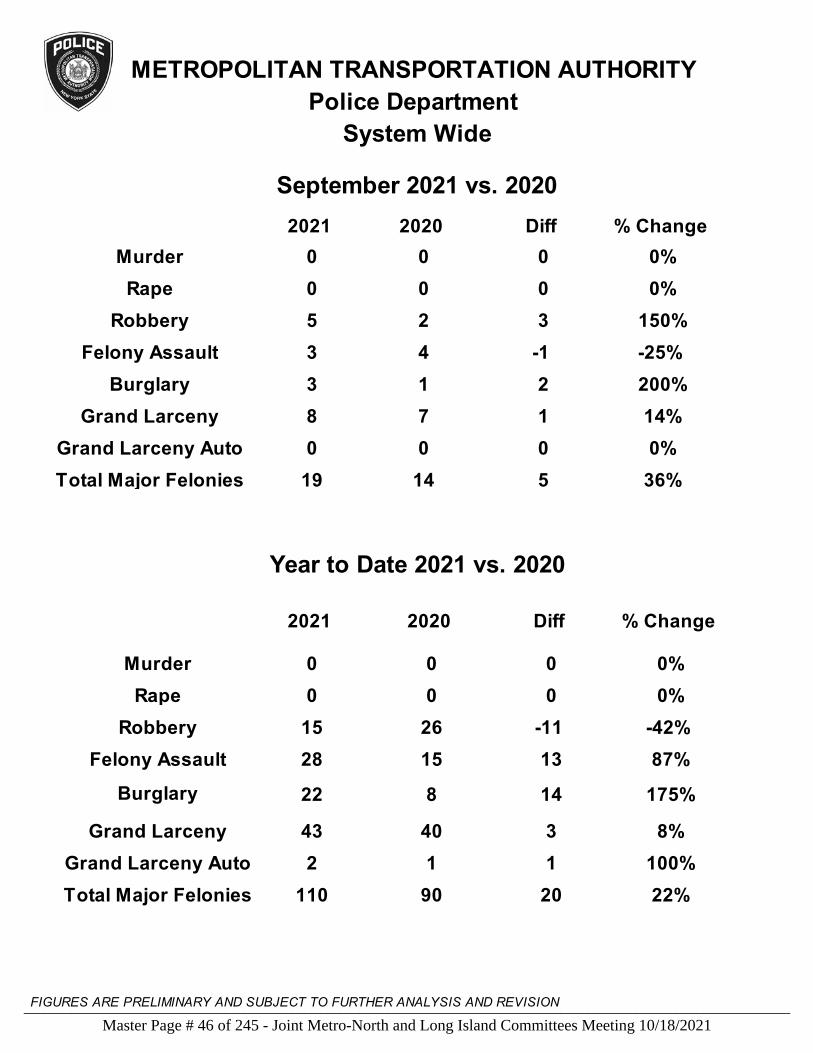
METROPOLITAN TRANSPORTATION AUTHORITY
Police Department
September 2021 vs. 2020
System Wide
2021
Murder
Rape
Robbery
Felony Assault
Burglary
Grand Larceny
Grand Larceny Auto
Total Major Felonies
0
0
5
3
3
8
0
19
0
0
2
4
1
0
7
14
1
0
0
3
-1
2
0
5
14%
Murder
Rape
Robbery
Felony Assault
Burglary
Grand Larceny
Grand Larceny Auto
Total Major Felonies
Year to Date 2021 vs. 2020
43 40
2
22
28
15
0
0
110 90
1
8
15
26
0
0
3
1
14
13
-11
0
0
20
2020 Diff % Change
0%
0%
150%
-25%
200%
0%
36%
0%
0%
-42%
87%
175%
8%
100%
22%
2021 2020 Diff % Change
FIGURES ARE PRELIMINARY AND SUBJECT TO FURTHER ANALYSIS AND REVISION
Master Page # 46 of 245 - Joint Metro-North and Long Island Committees Meeting 10/18/2021________________________________________________________________________________
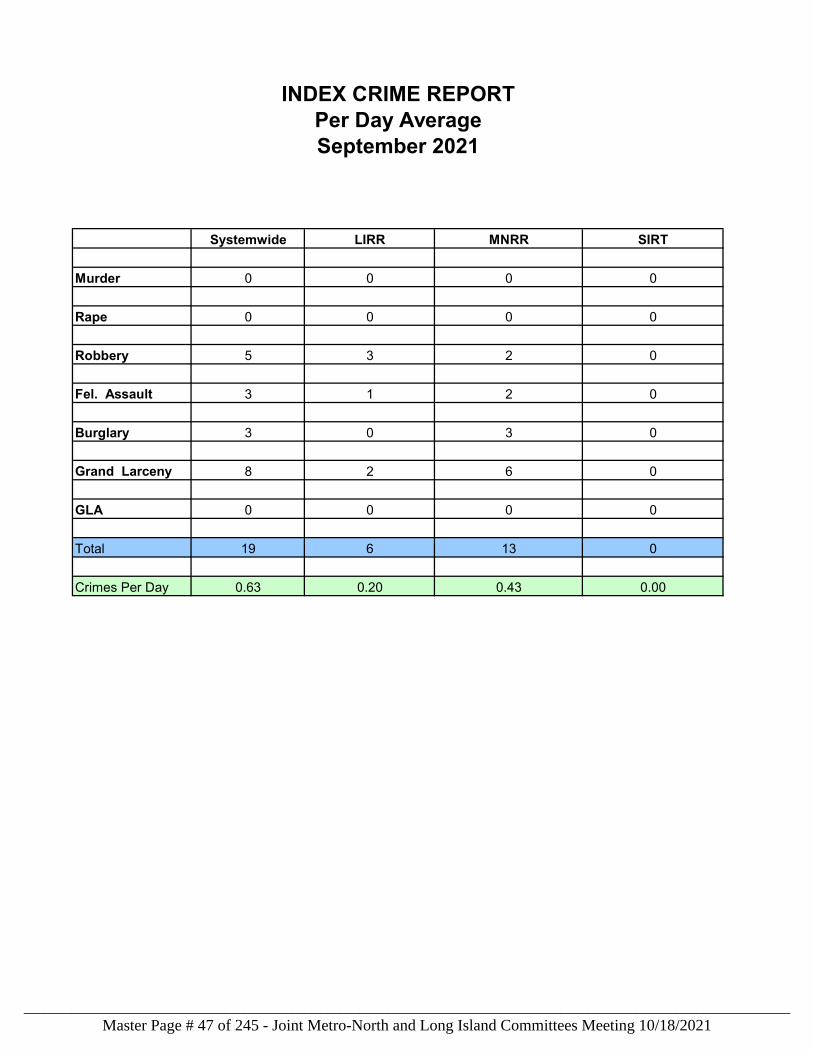
Systemwide LIRR MNRR SIRT
Murder 0 0 0 0
Rape 0 0 0 0
Robbery 5 3 2 0
Fel. Assault 3 1 2 0
Burglary 3 0 3 0
Grand Larceny 8 2 6 0
GLA 0 0 0 0
Total 19 6 13 0
Crimes Per Day 0.63 0.20 0.43 0.00
INDEX CRIME REPORTPer Day AverageSeptember 2021
Master Page # 47 of 245 - Joint Metro-North and Long Island Committees Meeting 10/18/2021________________________________________________________________________________
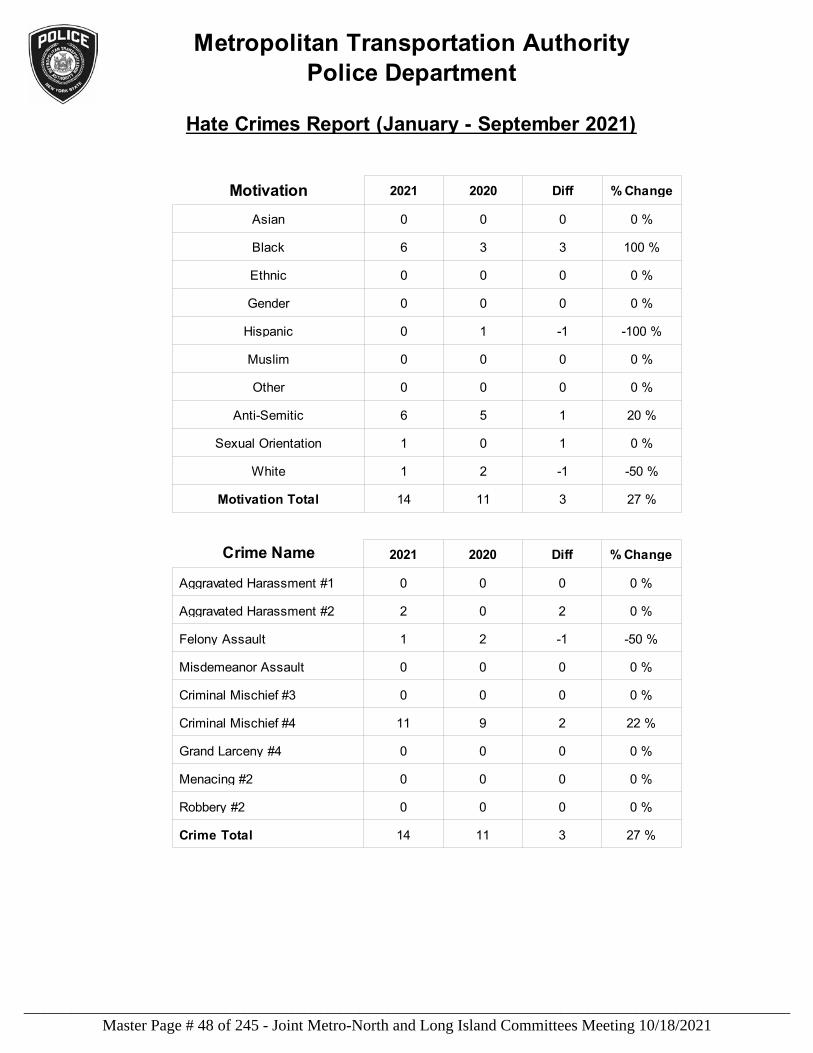
Hate Crimes Report (January - September 2021)
Metropolitan Transportation AuthorityPolice Department
Motivation 2021 2020 Diff % Change
Asian 0 0 0 0 %
Black 6 3 3 100 %
Ethnic 0 0 0 0 %
Gender 0 0 0 0 %
Hispanic 0 1 -1 -100 %
Muslim 0 0 0 0 %
Other 0 0 0 0 %
Anti-Semitic 6 5 1 20 %
Sexual Orientation 1 0 1 0 %
White 1 2 -1 -50 %
Motivation Total 14 11 3 27 %
Crime Name 2021 2020 Diff % Change
Aggravated Harassment #1 0 0 0 0 %
Aggravated Harassment #2 2 0 2 0 %
Felony Assault 1 2 -1 -50 %
Misdemeanor Assault 0 0 0 0 %
Criminal Mischief #3 0 0 0 0 %
Criminal Mischief #4 11 9 2 22 %
Grand Larceny #4 0 0 0 0 %
Menacing #2 0 0 0 0 %
Robbery #2 0 0 0 0 %
Crime Total 14 11 3 27 %
Master Page # 48 of 245 - Joint Metro-North and Long Island Committees Meeting 10/18/2021________________________________________________________________________________
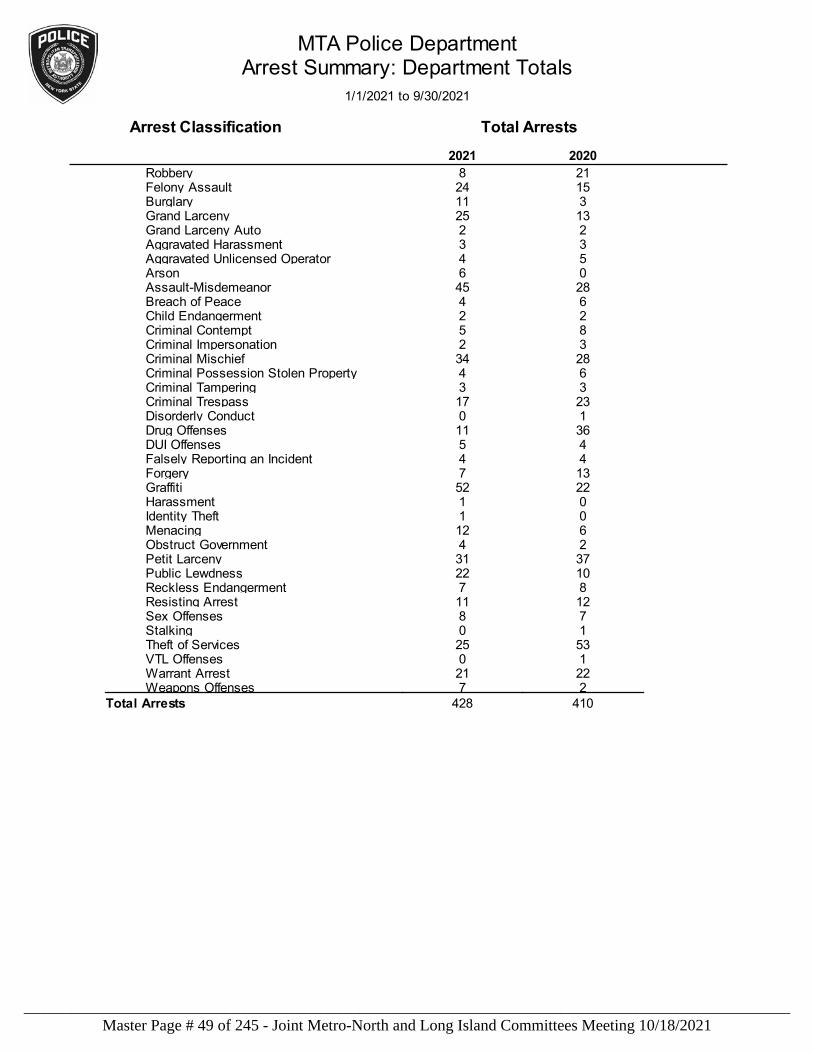
MTA Police Department
1/1/2021 to 9/30/2021
Arrest Classification Total Arrests
Arrest Summary: Department Totals
2021 2020
Robbery 8 21Felony Assault 24 15Burglary 11 3Grand Larceny 25 13Grand Larceny Auto 2 2Aggravated Harassment 3 3Aggravated Unlicensed Operator 4 5Arson 6 0Assault-Misdemeanor 45 28Breach of Peace 4 6Child Endangerment 2 2Criminal Contempt 5 8Criminal Impersonation 2 3Criminal Mischief 34 28Criminal Possession Stolen Property 4 6Criminal Tampering 3 3Criminal Trespass 17 23Disorderly Conduct 0 1Drug Offenses 11 36DUI Offenses 5 4Falsely Reporting an Incident 4 4Forgery 7 13Graffiti 52 22Harassment 1 0Identity Theft 1 0Menacing 12 6Obstruct Government 4 2Petit Larceny 31 37Public Lewdness 22 10Reckless Endangerment 7 8Resisting Arrest 11 12Sex Offenses 8 7Stalking 0 1Theft of Services 25 53VTL Offenses 0 1Warrant Arrest 21 22Weapons Offenses 7 2
Total Arrests 428 410
Master Page # 49 of 245 - Joint Metro-North and Long Island Committees Meeting 10/18/2021________________________________________________________________________________
JOINT INFORMATION ITEMS
Master Page # 50 of 245 - Joint Metro-North and Long Island Committees Meeting 10/18/2021________________________________________________________________________________
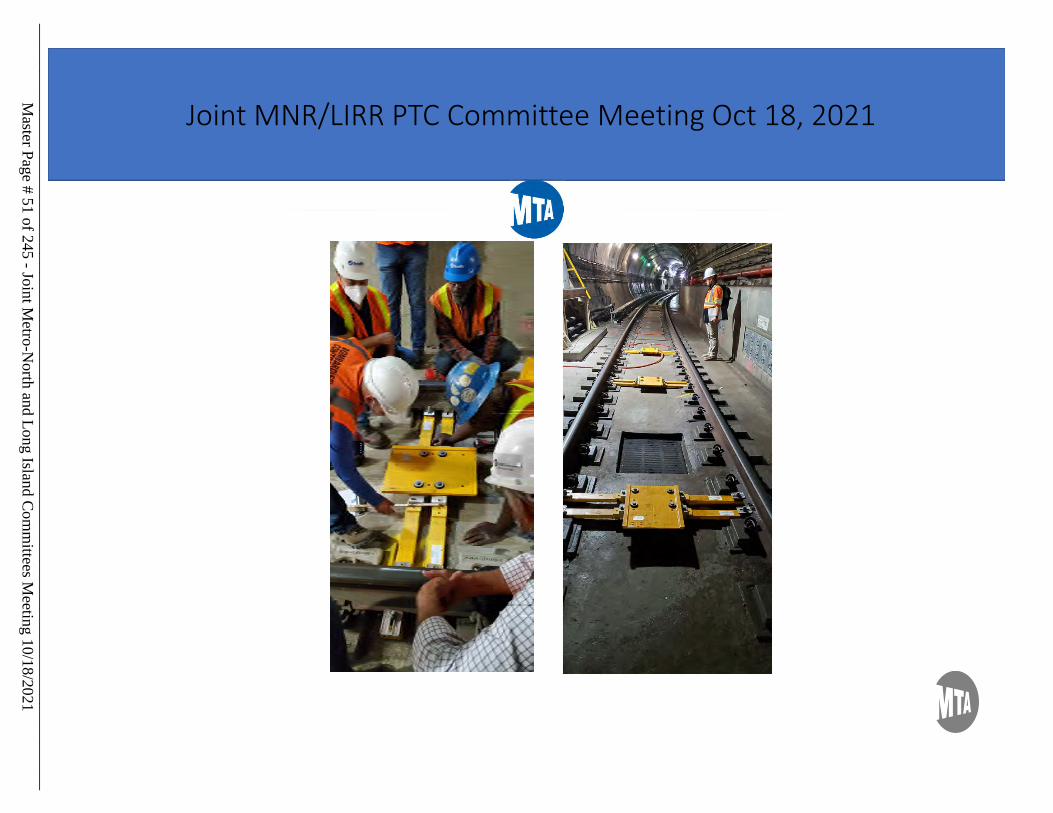
Joint MNR/LIRR PTC Committee Meeting Oct 18, 2021
Master Page # 51 of 245 - Joint M
etro-North and Long Island C
omm
ittees Meeting 10/18/2021
________________________________________________________________________________
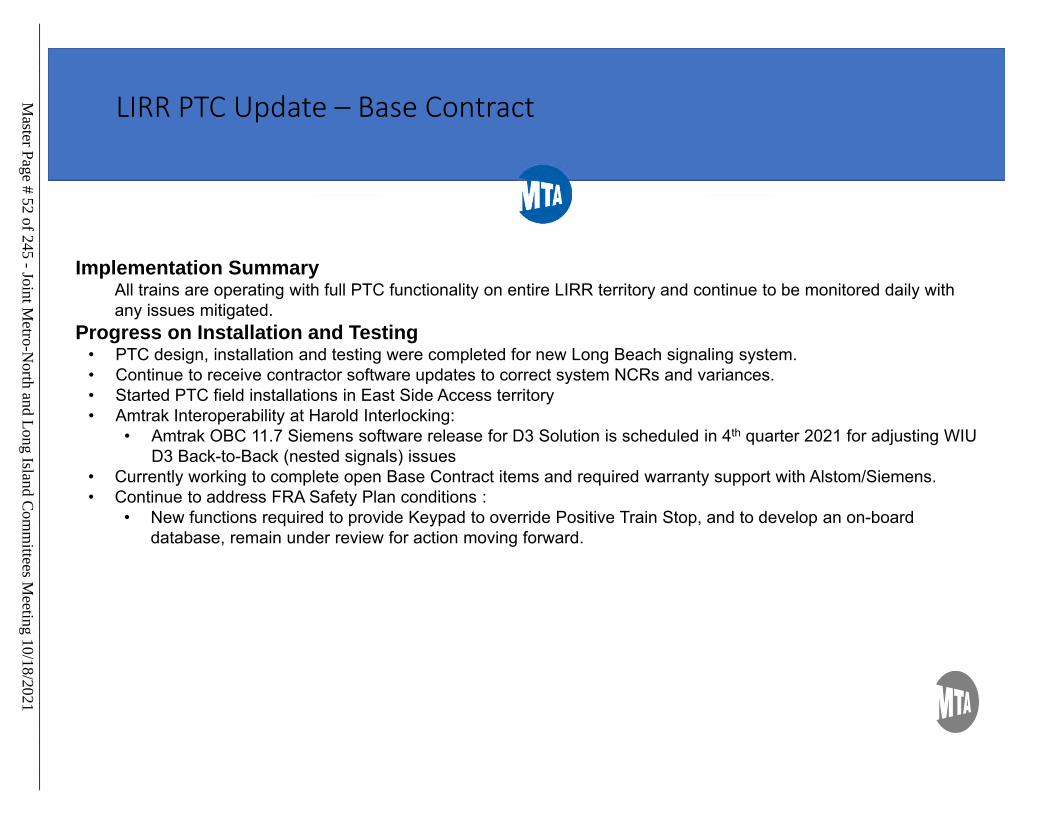
LIRR PTC Update – Base Contract
2
Implementation Summary• All trains are operating with full PTC functionality on entire LIRR territory and continue to be monitored daily with
any issues mitigated. Progress on Installation and Testing
• PTC design, installation and testing were completed for new Long Beach signaling system. • Continue to receive contractor software updates to correct system NCRs and variances.• Started PTC field installations in East Side Access territory• Amtrak Interoperability at Harold Interlocking:
• Amtrak OBC 11.7 Siemens software release for D3 Solution is scheduled in 4th quarter 2021 for adjusting WIU D3 Back-to-Back (nested signals) issues
• Currently working to complete open Base Contract items and required warranty support with Alstom/Siemens.• Continue to address FRA Safety Plan conditions :
• New functions required to provide Keypad to override Positive Train Stop, and to develop an on-board database, remain under review for action moving forward.
Master Page # 52 of 245 - Joint M
etro-North and Long Island C
omm
ittees Meeting 10/18/2021
________________________________________________________________________________
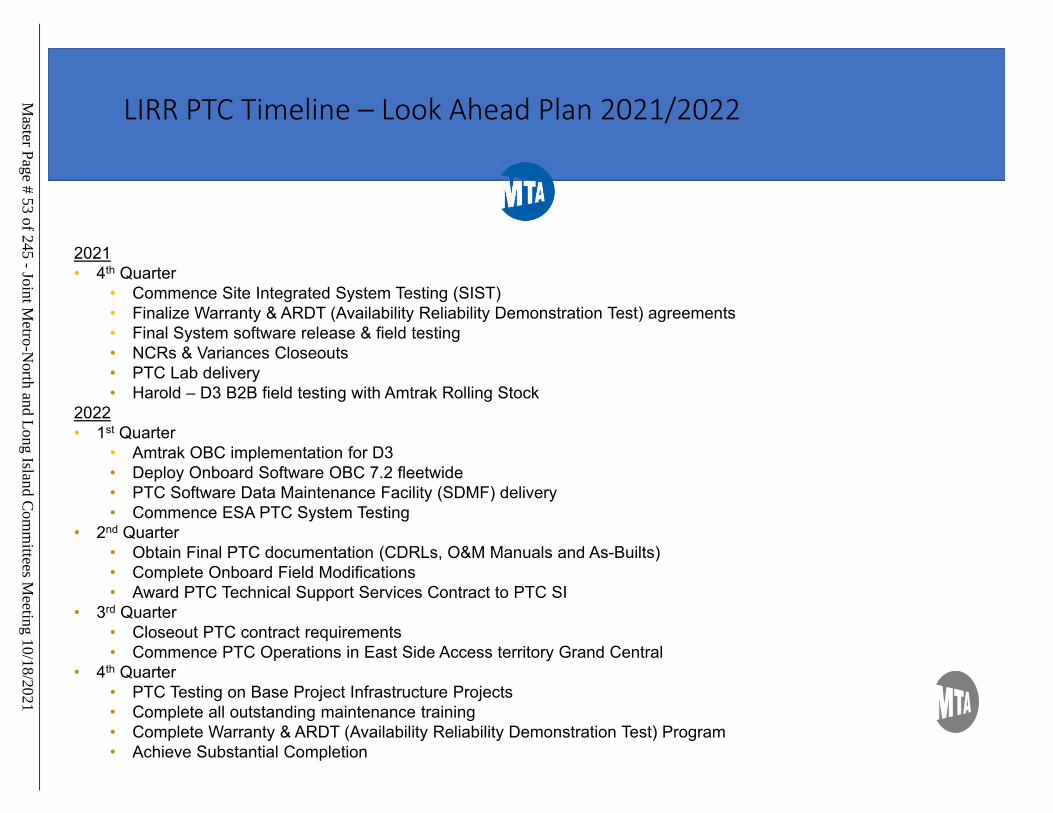
LIRR PTC Timeline – Look Ahead Plan 2021/2022
3
2021• 4th Quarter
• Commence Site Integrated System Testing (SIST)• Finalize Warranty & ARDT (Availability Reliability Demonstration Test) agreements• Final System software release & field testing• NCRs & Variances Closeouts• PTC Lab delivery• Harold – D3 B2B field testing with Amtrak Rolling Stock
2022• 1st Quarter
• Amtrak OBC implementation for D3• Deploy Onboard Software OBC 7.2 fleetwide • PTC Software Data Maintenance Facility (SDMF) delivery• Commence ESA PTC System Testing
• 2nd Quarter • Obtain Final PTC documentation (CDRLs, O&M Manuals and As-Builts) • Complete Onboard Field Modifications• Award PTC Technical Support Services Contract to PTC SI
• 3rd Quarter• Closeout PTC contract requirements• Commence PTC Operations in East Side Access territory Grand Central
• 4th Quarter • PTC Testing on Base Project Infrastructure Projects• Complete all outstanding maintenance training• Complete Warranty & ARDT (Availability Reliability Demonstration Test) Program • Achieve Substantial Completion
Master Page # 53 of 245 - Joint M
etro-North and Long Island C
omm
ittees Meeting 10/18/2021
________________________________________________________________________________
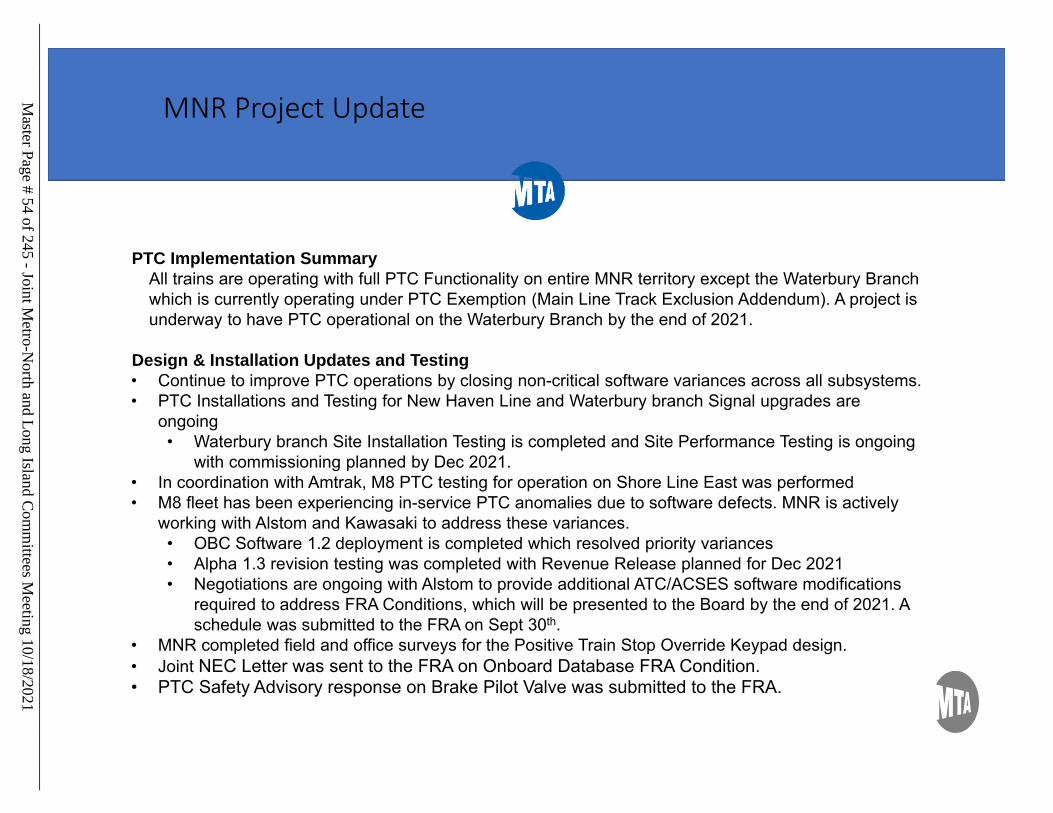
MNR Project Update
4
PTC Implementation SummaryAll trains are operating with full PTC Functionality on entire MNR territory except the Waterbury Branch which is currently operating under PTC Exemption (Main Line Track Exclusion Addendum). A project is underway to have PTC operational on the Waterbury Branch by the end of 2021.
Design & Installation Updates and Testing• Continue to improve PTC operations by closing non-critical software variances across all subsystems. • PTC Installations and Testing for New Haven Line and Waterbury branch Signal upgrades are
ongoing• Waterbury branch Site Installation Testing is completed and Site Performance Testing is ongoing
with commissioning planned by Dec 2021.• In coordination with Amtrak, M8 PTC testing for operation on Shore Line East was performed • M8 fleet has been experiencing in-service PTC anomalies due to software defects. MNR is actively
working with Alstom and Kawasaki to address these variances.• OBC Software 1.2 deployment is completed which resolved priority variances • Alpha 1.3 revision testing was completed with Revenue Release planned for Dec 2021• Negotiations are ongoing with Alstom to provide additional ATC/ACSES software modifications
required to address FRA Conditions, which will be presented to the Board by the end of 2021. A schedule was submitted to the FRA on Sept 30th.
• MNR completed field and office surveys for the Positive Train Stop Override Keypad design.• Joint NEC Letter was sent to the FRA on Onboard Database FRA Condition. • PTC Safety Advisory response on Brake Pilot Valve was submitted to the FRA.
Master Page # 54 of 245 - Joint M
etro-North and Long Island C
omm
ittees Meeting 10/18/2021
________________________________________________________________________________
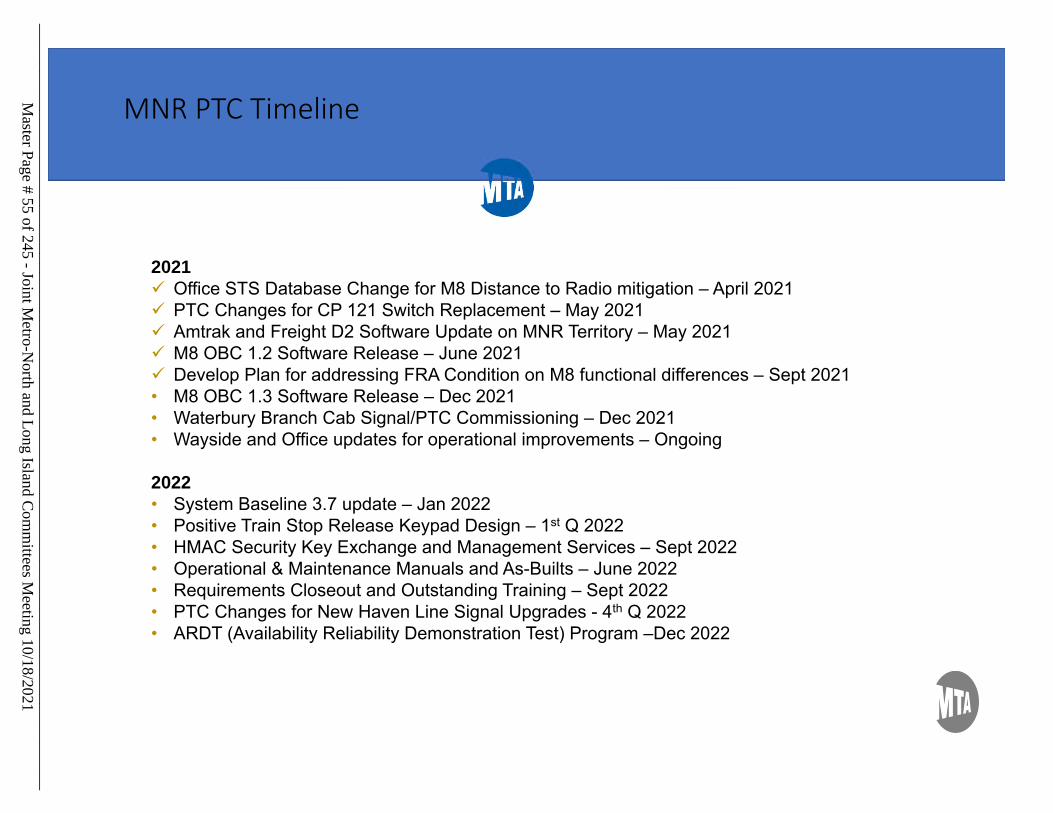
MNR PTC Timeline
5
2021 Office STS Database Change for M8 Distance to Radio mitigation – April 2021 PTC Changes for CP 121 Switch Replacement – May 2021 Amtrak and Freight D2 Software Update on MNR Territory – May 2021 M8 OBC 1.2 Software Release – June 2021 Develop Plan for addressing FRA Condition on M8 functional differences – Sept 2021• M8 OBC 1.3 Software Release – Dec 2021• Waterbury Branch Cab Signal/PTC Commissioning – Dec 2021• Wayside and Office updates for operational improvements – Ongoing
2022• System Baseline 3.7 update – Jan 2022• Positive Train Stop Release Keypad Design – 1st Q 2022• HMAC Security Key Exchange and Management Services – Sept 2022• Operational & Maintenance Manuals and As-Builts – June 2022• Requirements Closeout and Outstanding Training – Sept 2022• PTC Changes for New Haven Line Signal Upgrades - 4th Q 2022• ARDT (Availability Reliability Demonstration Test) Program –Dec 2022
Master Page # 55 of 245 - Joint M
etro-North and Long Island C
omm
ittees Meeting 10/18/2021
________________________________________________________________________________
Information Items
Master Page # 56 of 245 - Joint Metro-North and Long Island Committees Meeting 10/18/2021________________________________________________________________________________
2021 3rd QuarterMaintenance of Way Division
Track, Structures, Stations and FacilitiesMetro-North Railroad
Master Page # 57 of 245 - Joint M
etro-North and Long Island C
omm
ittees Meeting 10/18/2021
________________________________________________________________________________
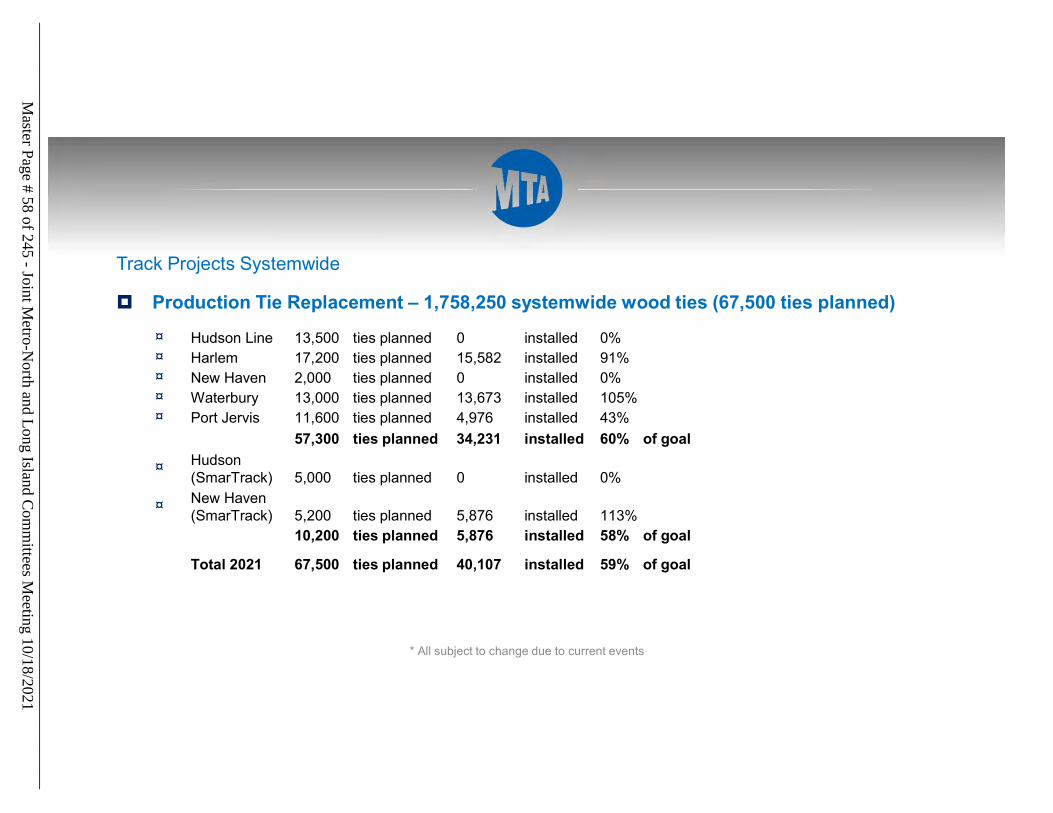
Track Projects Systemwide
Production Tie Replacement – 1,758,250 systemwide wood ties (67,500 ties planned)
* All subject to change due to current events
¤ Hudson Line 13,500 ties planned 0 installed 0%¤ Harlem 17,200 ties planned 15,582 installed 91%¤ New Haven 2,000 ties planned 0 installed 0%¤ Waterbury 13,000 ties planned 13,673 installed 105%¤ Port Jervis 11,600 ties planned 4,976 installed 43%
57,300 ties planned 34,231 installed 60% of goal
¤ Hudson (SmarTrack) 5,000 ties planned 0 installed 0%
¤ New Haven (SmarTrack) 5,200 ties planned 5,876 installed 113%
10,200 ties planned 5,876 installed 58% of goal
Total 2021 67,500 ties planned 40,107 installed 59% of goal
Master Page # 58 of 245 - Joint M
etro-North and Long Island C
omm
ittees Meeting 10/18/2021
________________________________________________________________________________
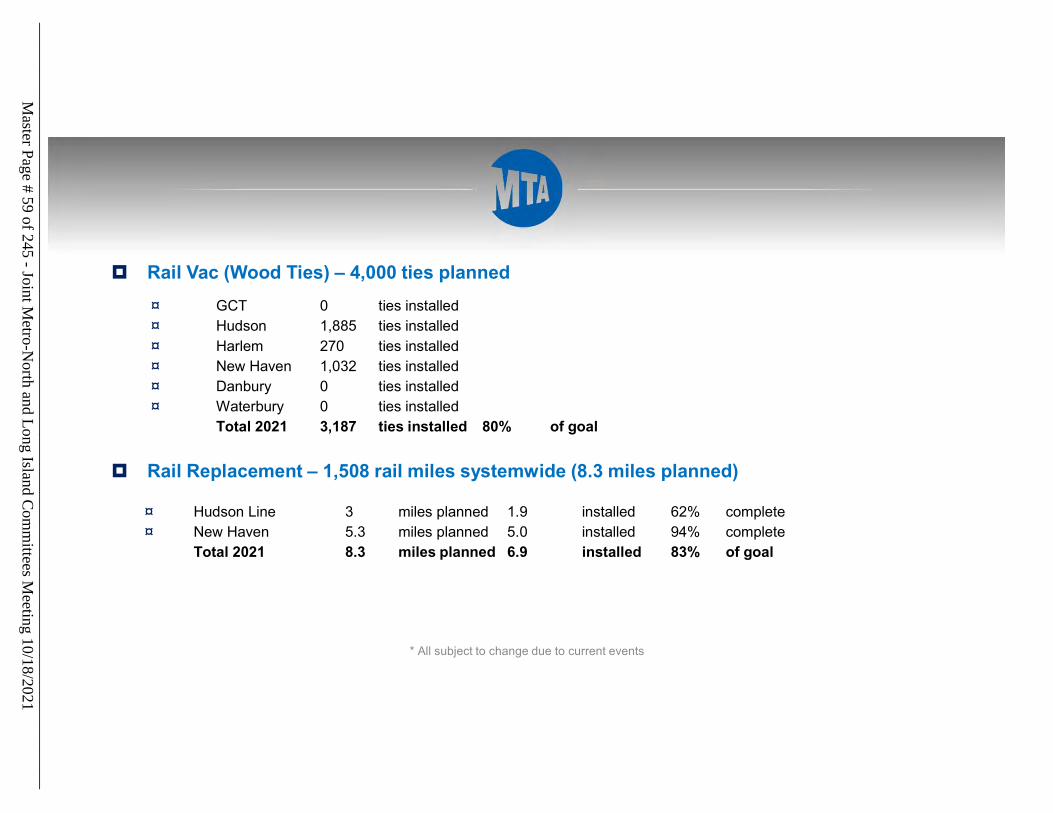
Rail Vac (Wood Ties) – 4,000 ties planned
Rail Replacement – 1,508 rail miles systemwide (8.3 miles planned)
* All subject to change due to current events
¤ GCT 0 ties installed
¤ Hudson 1,885 ties installed
¤ Harlem 270 ties installed
¤ New Haven 1,032 ties installed
¤ Danbury 0 ties installed
¤ Waterbury 0 ties installedTotal 2021 3,187 ties installed 80% of goal
¤ Hudson Line 3 miles planned 1.9 installed 62% complete
¤ New Haven 5.3 miles planned 5.0 installed 94% completeTotal 2021 8.3 miles planned 6.9 installed 83% of goal
Master Page # 59 of 245 - Joint M
etro-North and Long Island C
omm
ittees Meeting 10/18/2021
________________________________________________________________________________
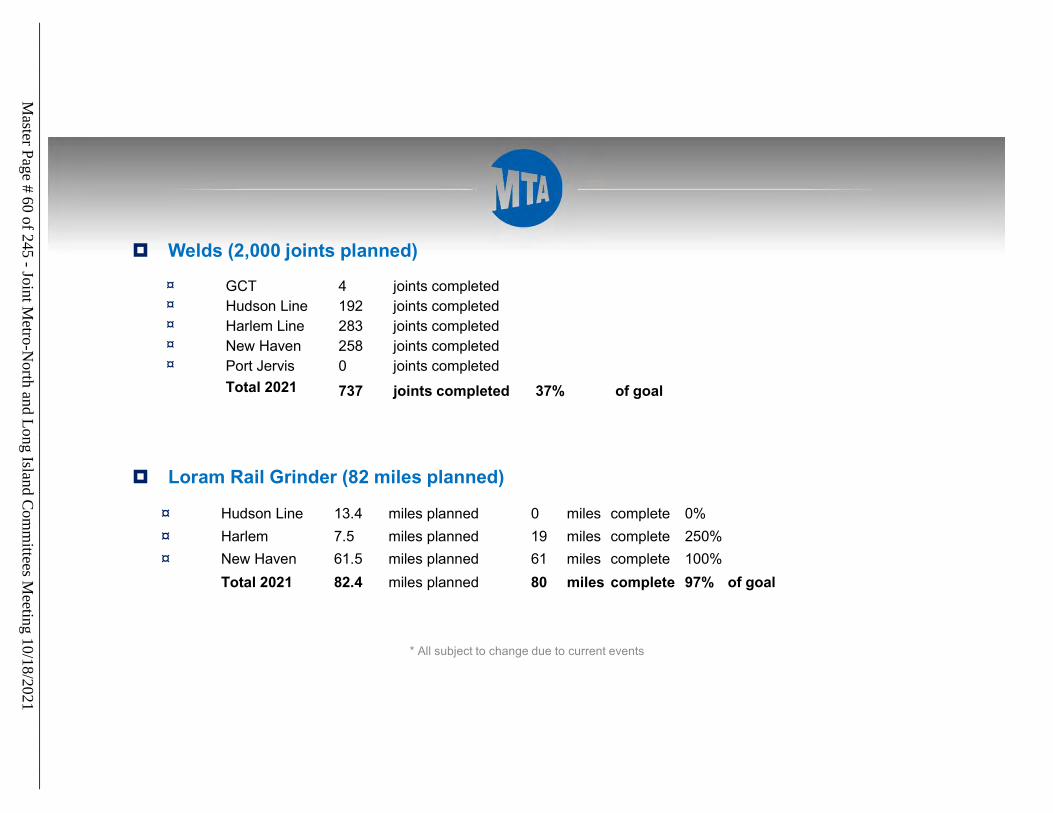
Welds (2,000 joints planned)
Loram Rail Grinder (82 miles planned)
* All subject to change due to current events
¤ GCT 4 joints completed¤ Hudson Line 192 joints completed¤ Harlem Line 283 joints completed¤ New Haven 258 joints completed¤ Port Jervis 0 joints completed
Total 2021 737 joints completed 37% of goal
¤ Hudson Line 13.4 miles planned 0 miles complete 0%
¤ Harlem 7.5 miles planned 19 miles complete 250%
¤ New Haven 61.5 miles planned 61 miles complete 100%
Total 2021 82.4 miles planned 80 miles complete 97% of goal
Master Page # 60 of 245 - Joint M
etro-North and Long Island C
omm
ittees Meeting 10/18/2021
________________________________________________________________________________
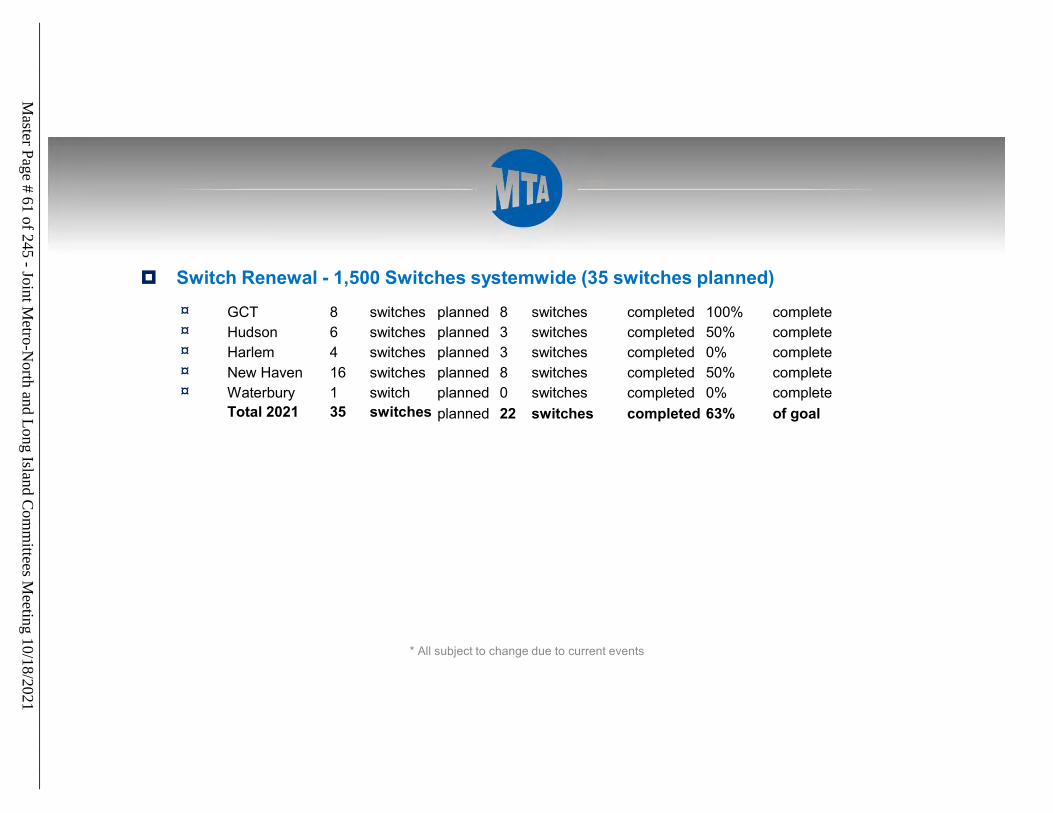
Switch Renewal - 1,500 Switches systemwide (35 switches planned)
* All subject to change due to current events
¤ GCT 8 switches planned 8 switches completed 100% complete¤ Hudson 6 switches planned 3 switches completed 50% complete¤ Harlem 4 switches planned 3 switches completed 0% complete¤ New Haven 16 switches planned 8 switches completed 50% complete¤ Waterbury 1 switch planned 0 switches completed 0% complete
Total 2021 35 switches planned 22 switches completed 63% of goal
Master Page # 61 of 245 - Joint M
etro-North and Long Island C
omm
ittees Meeting 10/18/2021
________________________________________________________________________________
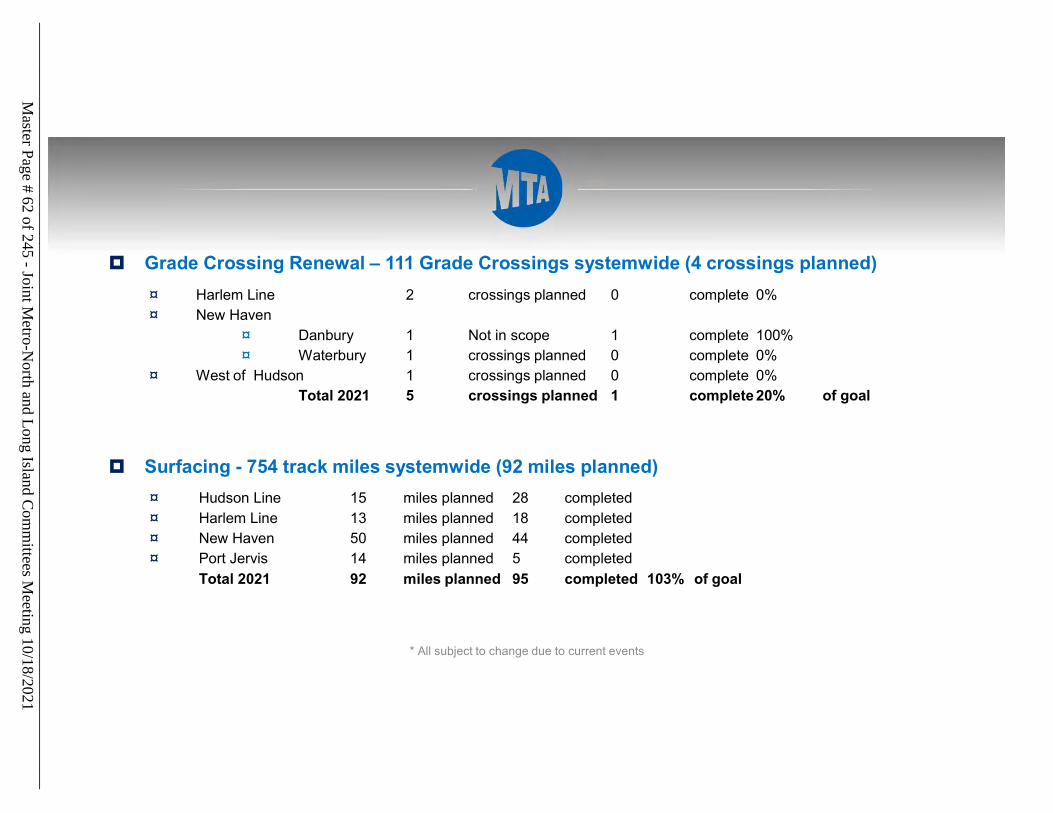
Grade Crossing Renewal – 111 Grade Crossings systemwide (4 crossings planned)
Surfacing - 754 track miles systemwide (92 miles planned)
* All subject to change due to current events
¤ Harlem Line 2 crossings planned 0 complete 0%
¤ New Haven 0 Crossings planned 0 complete 0%
¤ Danbury 1 Not in scope 1 complete 100%
¤ Waterbury 1 crossings planned 0 complete 0%
¤ West of Hudson 1 crossings planned 0 complete 0%Total 2021 5 crossings planned 1 complete 20% of goal
¤ Hudson Line 15 miles planned 28 completed 184%
¤ Harlem Line 13 miles planned 18 completed 142%
¤ New Haven 50 miles planned 44 completed 88%
¤ Port Jervis 14 miles planned 5 completed 36%
Total 2021 92 miles planned 95 completed 103% of goal
Master Page # 62 of 245 - Joint M
etro-North and Long Island C
omm
ittees Meeting 10/18/2021
________________________________________________________________________________
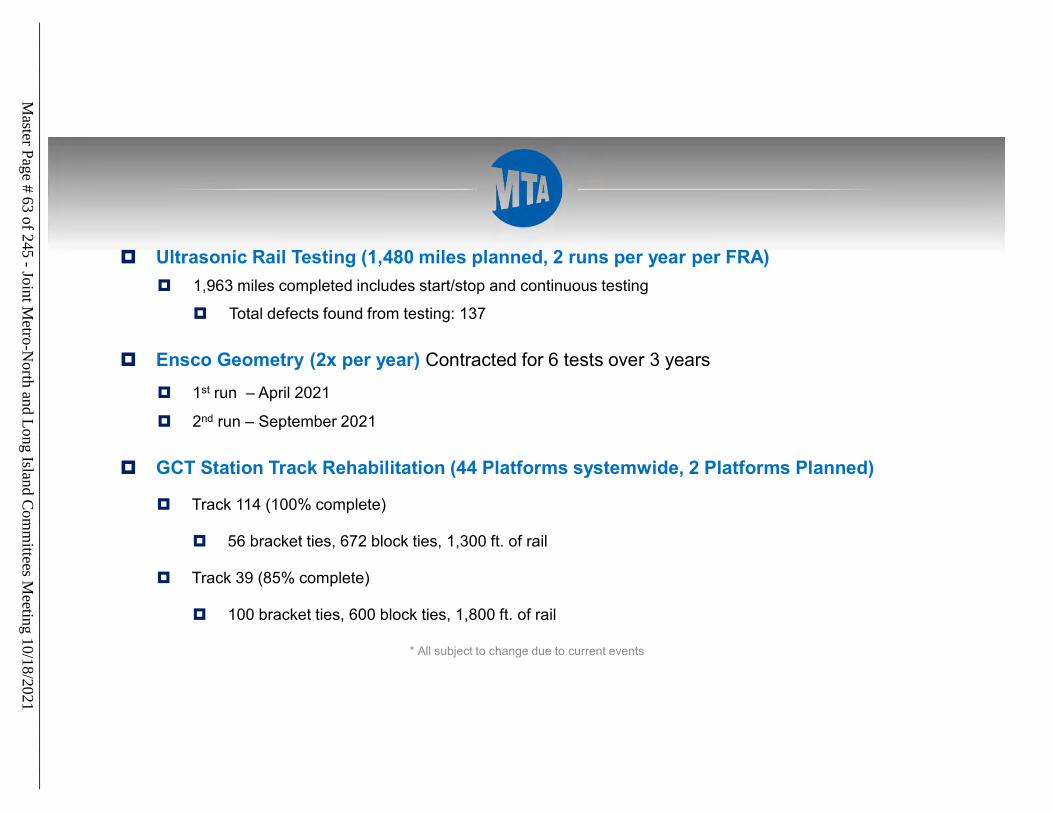
Ultrasonic Rail Testing (1,480 miles planned, 2 runs per year per FRA)
GCT Station Track Rehabilitation (44 Platforms systemwide, 2 Platforms Planned)
* All subject to change due to current events
1,963 miles completed includes start/stop and continuous testing
1st run – April 2021
2nd run – September 2021
Ensco Geometry (2x per year) Contracted for 6 tests over 3 years
Total defects found from testing: 137
Track 114 (100% complete)
56 bracket ties, 672 block ties, 1,300 ft. of rail
Track 39 (85% complete)
100 bracket ties, 600 block ties, 1,800 ft. of rail
Master Page # 63 of 245 - Joint M
etro-North and Long Island C
omm
ittees Meeting 10/18/2021
________________________________________________________________________________
Overhead Bridge Program (NY) Bridge Flag Repairs (Harlem, Hudson New Haven-NY/Port Jervis Line)
Typical repairs include replacing deteriorated members, rebuilding deteriorated bridge seats, repairing
abutment walls, repairing load bearing supports timber deck replacements.
HUD 5.19 East 144th Street - Steel Repairs (40% complete)
HUD 14.43 Ludlow Street – Flag Repairs (0% complete)
HUD 21.05 Bible Factory Truss – Flag Repairs (100% complete)
HUD 31.20 Westerly Road – Flag Repairs (100% complete)
HUD 38.90 Montrose Station Road – Flag Repairs (30% complete)
NH 12.85 South Street – flag Repairs (100% complete)
NH 16.37 Centre Ave – Flag Repair (100% complete)
NH 20.73 Hillside Ave – Flag Repairs (0% complete)
NH 20.89 North Barry – Flag Repairs (100% complete)
Master Page # 64 of 245 - Joint M
etro-North and Long Island C
omm
ittees Meeting 10/18/2021
________________________________________________________________________________
Bridge Timbers (NY only – 966 Timbers Planned)
* All subject to change due to current events
¤ HUD 64.79 Wappingers Creek 170 timbers 0% complete¤ NH 25.54 Westchester Ave Tks 2 60 timbers 100% complete¤ NH 25.68 Kings Street Tk 2 67 timbers 100% complete¤ NH 25.94 North Main Street Trk 1 115 timbers 100% complete¤ NH 25.94 North Main Street Trk 2 115 timbers 100% complete¤ PJ – JS 32.06 Ramapo River Tk 1 & 2 212 timbers 0% complete¤ PJ – JS 39.55 Stream Tk 1 21 timbers 0% complete¤ PJ – JS 55.03 Moodna Viaduct Tk 1 206 timbers 100% complete
Total 2021 966 Timbers Planned 58% complete
Master Page # 65 of 245 - Joint M
etro-North and Long Island C
omm
ittees Meeting 10/18/2021
________________________________________________________________________________
NY Undergrade Bridge Repair Program
Hudson
Grand Central Terminal (MP 1.0) – Flag Repairs (40% complete)
Park Ave Viaduct (MP 3.01) – Masonry Arch Repairs, Waterproofing (75% complete)
Park Ave Viaduct (MP 3.01) – Flag Repair (49 Flags Total, 60% complete)
Wappinger Falls (MP 64.79) – Flag Repairs (70% complete)
Port Jervis
Pond Brook (MP 33.94 JS) – Flag Repairs (100% complete)
Ramapo River (MP 42.77 JS – Flag Repairs (40% complete)
Laura Lane (MP 47.73) – Replacement (5% complete)
Woodbury Creek – (MP 50.17) – Flag Repairs (85% complete)
Moodna Creek – MP50.17 Flag Repairs (95% complete)
Shea Road (MP 63.04) – Masonry Repairs (85% complete)
Harlem
Bronx River (MP19.35) – Flag Repairs (0% complete)
Master Page # 66 of 245 - Joint M
etro-North and Long Island C
omm
ittees Meeting 10/18/2021
________________________________________________________________________________
Bridge Timbers (CT only – 700 Timbers Planned)
* All subject to change due to current events
CT Bridge Projects
¤ NH 29.68 Lukes Crossing, Trk 3 32 timbers 100% complete¤ NH 33.75 Elm St. Tks 3 & 4 106 timbers 0% complete¤ NH 34.17 East Main St. Tk 3 90 timbers 100% complete¤ NH 40.89 Franklin (Spring Street) Tks 1 & 2 86 timbers 0% complete¤ NH 41.28 Washington & Main St. Trk 2 92 timbers 100% complete¤ NH 53.84 Howard Avenue Tk 2 53 timbers 0% complete¤ NH 54.77 Warren Street Tk 2 48 timbers 100% complete¤ NH 54.84 Lafayette Street Tk 2 50 timbers 100% complete¤ NH 56.20 East Main Street Tk 3 56 timbers 0% complete¤ NH 57.46 Bishop Ave Tk 3 48 timbers 0% complete¤ NH 59.96 East Main Street Tk 3 39 timbers 100% complete
Total 2021 700 Timbers Planned 50% complete
Master Page # 67 of 245 - Joint M
etro-North and Long Island C
omm
ittees Meeting 10/18/2021
________________________________________________________________________________
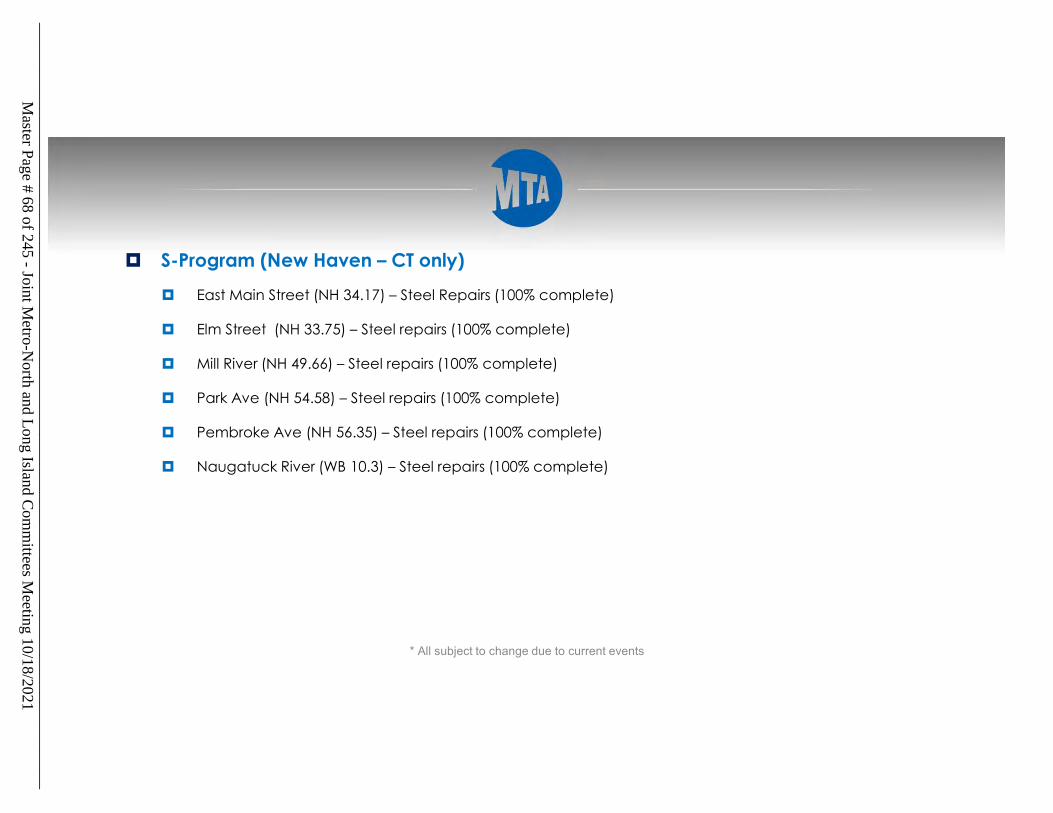
* All subject to change due to current events
East Main Street (NH 34.17) – Steel Repairs (100% complete)
Elm Street (NH 33.75) – Steel repairs (100% complete)
Mill River (NH 49.66) – Steel repairs (100% complete)
Park Ave (NH 54.58) – Steel repairs (100% complete)
Pembroke Ave (NH 56.35) – Steel repairs (100% complete)
Naugatuck River (WB 10.3) – Steel repairs (100% complete)
S-Program (New Haven – CT only)
Master Page # 68 of 245 - Joint M
etro-North and Long Island C
omm
ittees Meeting 10/18/2021
________________________________________________________________________________
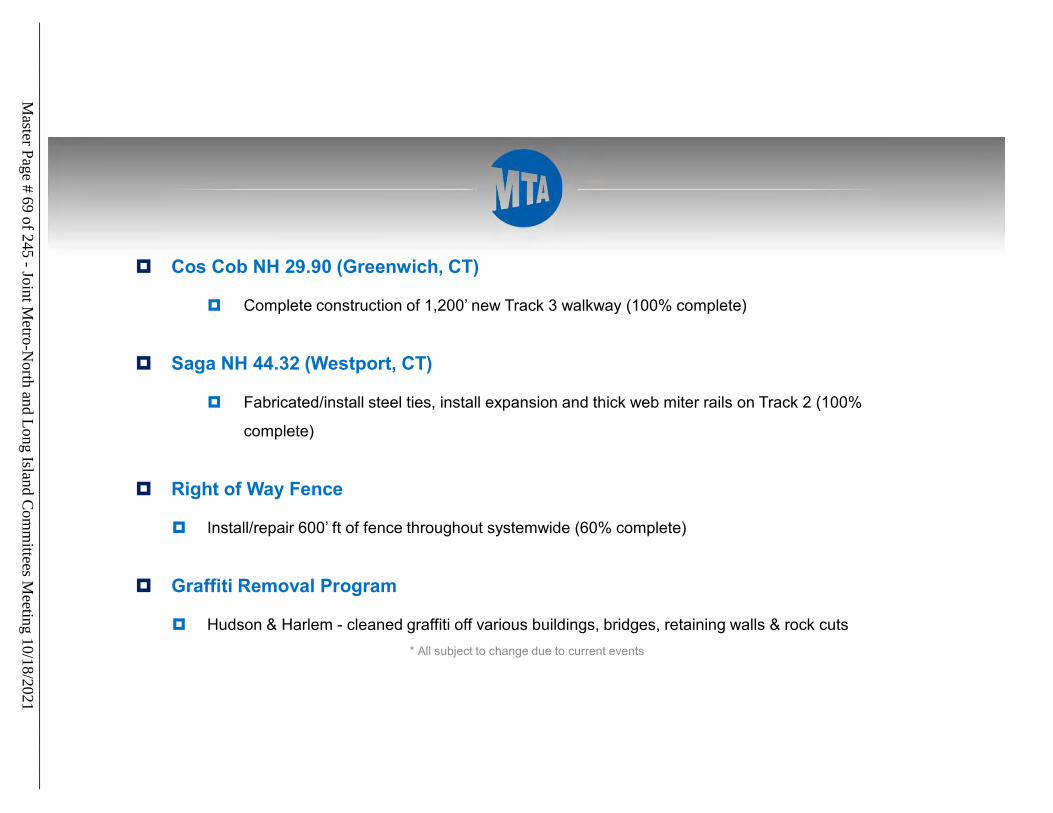
Cos Cob NH 29.90 (Greenwich, CT)
Complete construction of 1,200’ new Track 3 walkway (100% complete)
Saga NH 44.32 (Westport, CT)
Fabricated/install steel ties, install expansion and thick web miter rails on Track 2 (100%
complete)
Right of Way Fence
Install/repair 600’ ft of fence throughout systemwide (60% complete)
Graffiti Removal Program
Hudson & Harlem - cleaned graffiti off various buildings, bridges, retaining walls & rock cuts
* All subject to change due to current events
Master Page # 69 of 245 - Joint M
etro-North and Long Island C
omm
ittees Meeting 10/18/2021
________________________________________________________________________________
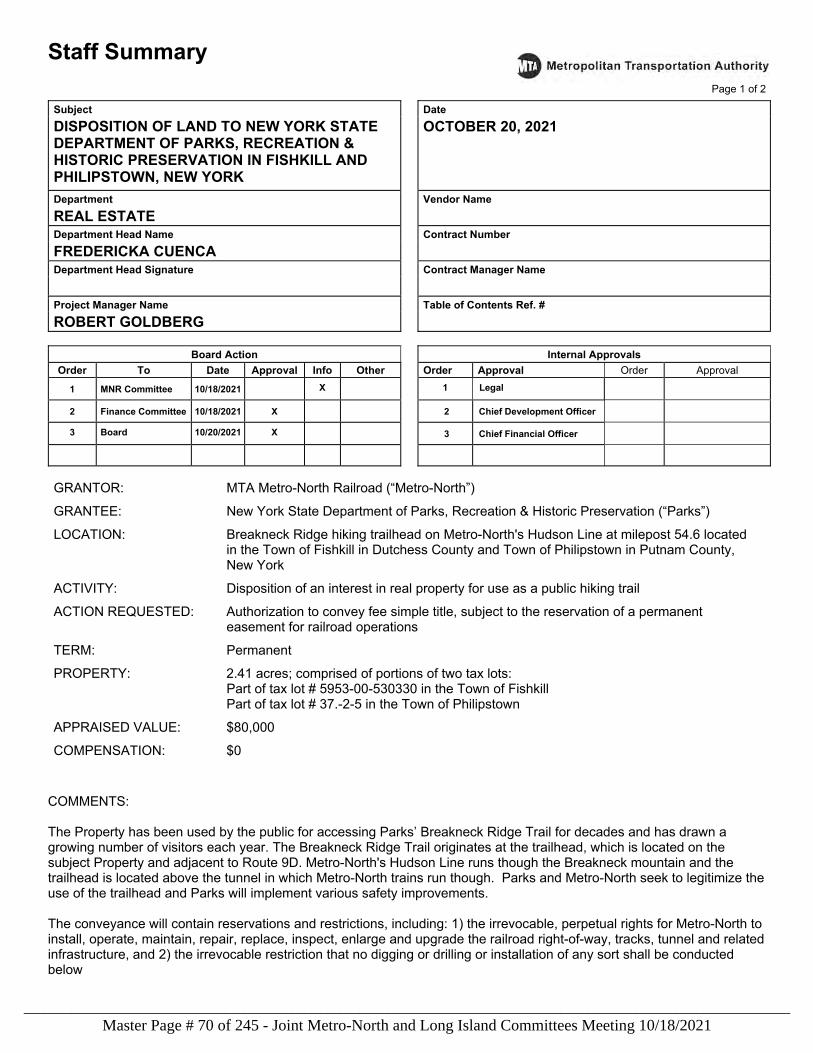
Staff Summary
Page 1 of 2
Subject Date DISPOSITION OF LAND TO NEW YORK STATE DEPARTMENT OF PARKS, RECREATION & HISTORIC PRESERVATION IN FISHKILL AND PHILIPSTOWN, NEW YORK
OCTOBER 20, 2021
Department Vendor Name
REAL ESTATE Department Head Name Contract Number
FREDERICKA CUENCA Department Head Signature Contract Manager Name
Project Manager Name Table of Contents Ref. #
ROBERT GOLDBERG
Board Action Internal Approvals Order To Date Approval Info Other Order Approval Order Approval
1 MNR Committee 10/18/2021 X 1 Legal
2 Finance Committee 10/18/2021 X 2 Chief Development Officer
3 Board 10/20/2021 X 3 Chief Financial Officer
GRANTOR:
GRANTEE:
LOCATION:
ACTIVITY:
ACTION REQUESTED:
TERM:
PROPERTY:
APPRAISED VALUE:
COMPENSATION:
MTA Metro-North Railroad (“Metro-North”)
New York State Department of Parks, Recreation & Historic Preservation (“Parks”)
Breakneck Ridge hiking trailhead on Metro-North's Hudson Line at milepost 54.6 located in the Town of Fishkill in Dutchess County and Town of Philipstown in Putnam County, New York
Disposition of an interest in real property for use as a public hiking trail
Authorization to convey fee simple title, subject to the reservation of a permanent easement for railroad operations
Permanent
2.41 acres; comprised of portions of two tax lots: Part of tax lot # 5953-00-530330 in the Town of Fishkill Part of tax lot # 37.-2-5 in the Town of Philipstown
$80,000
$0
COMMENTS:
The Property has been used by the public for accessing Parks’ Breakneck Ridge Trail for decades and has drawn a growing number of visitors each year. The Breakneck Ridge Trail originates at the trailhead, which is located on the subject Property and adjacent to Route 9D. Metro-North's Hudson Line runs though the Breakneck mountain and the trailhead is located above the tunnel in which Metro-North trains run though. Parks and Metro-North seek to legitimize the use of the trailhead and Parks will implement various safety improvements.
The conveyance will contain reservations and restrictions, including: 1) the irrevocable, perpetual rights for Metro-North to install, operate, maintain, repair, replace, inspect, enlarge and upgrade the railroad right-of-way, tracks, tunnel and related infrastructure, and 2) the irrevocable restriction that no digging or drilling or installation of any sort shall be conducted below
Master Page # 70 of 245 - Joint Metro-North and Long Island Committees Meeting 10/18/2021________________________________________________________________________________
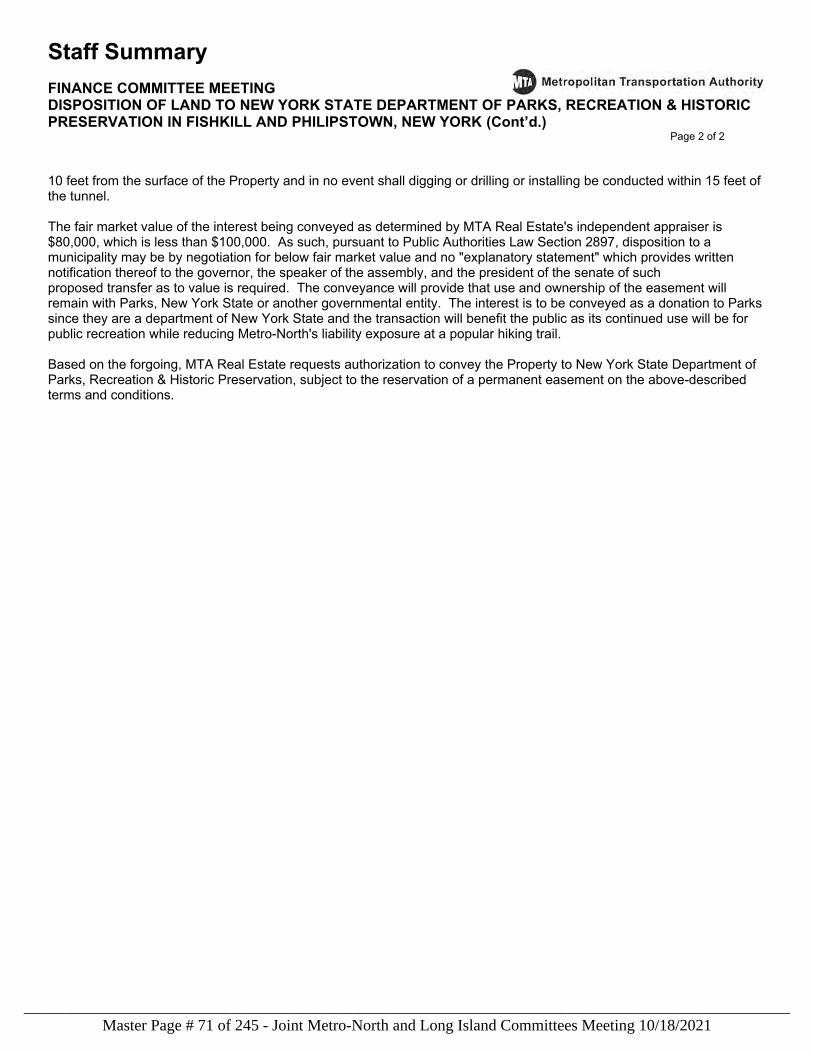
Staff Summary FINANCE COMMITTEE MEETING DISPOSITION OF LAND TO NEW YORK STATE DEPARTMENT OF PARKS, RECREATION & HISTORIC PRESERVATION IN FISHKILL AND PHILIPSTOWN, NEW YORK (Cont’d.) Page 2 of 2 10 feet from the surface of the Property and in no event shall digging or drilling or installing be conducted within 15 feet of the tunnel. The fair market value of the interest being conveyed as determined by MTA Real Estate's independent appraiser is $80,000, which is less than $100,000. As such, pursuant to Public Authorities Law Section 2897, disposition to a municipality may be by negotiation for below fair market value and no "explanatory statement" which provides written notification thereof to the governor, the speaker of the assembly, and the president of the senate of such proposed transfer as to value is required. The conveyance will provide that use and ownership of the easement will remain with Parks, New York State or another governmental entity. The interest is to be conveyed as a donation to Parks since they are a department of New York State and the transaction will benefit the public as its continued use will be for public recreation while reducing Metro-North's liability exposure at a popular hiking trail. Based on the forgoing, MTA Real Estate requests authorization to convey the Property to New York State Department of Parks, Recreation & Historic Preservation, subject to the reservation of a permanent easement on the above-described terms and conditions.
Master Page # 71 of 245 - Joint Metro-North and Long Island Committees Meeting 10/18/2021________________________________________________________________________________
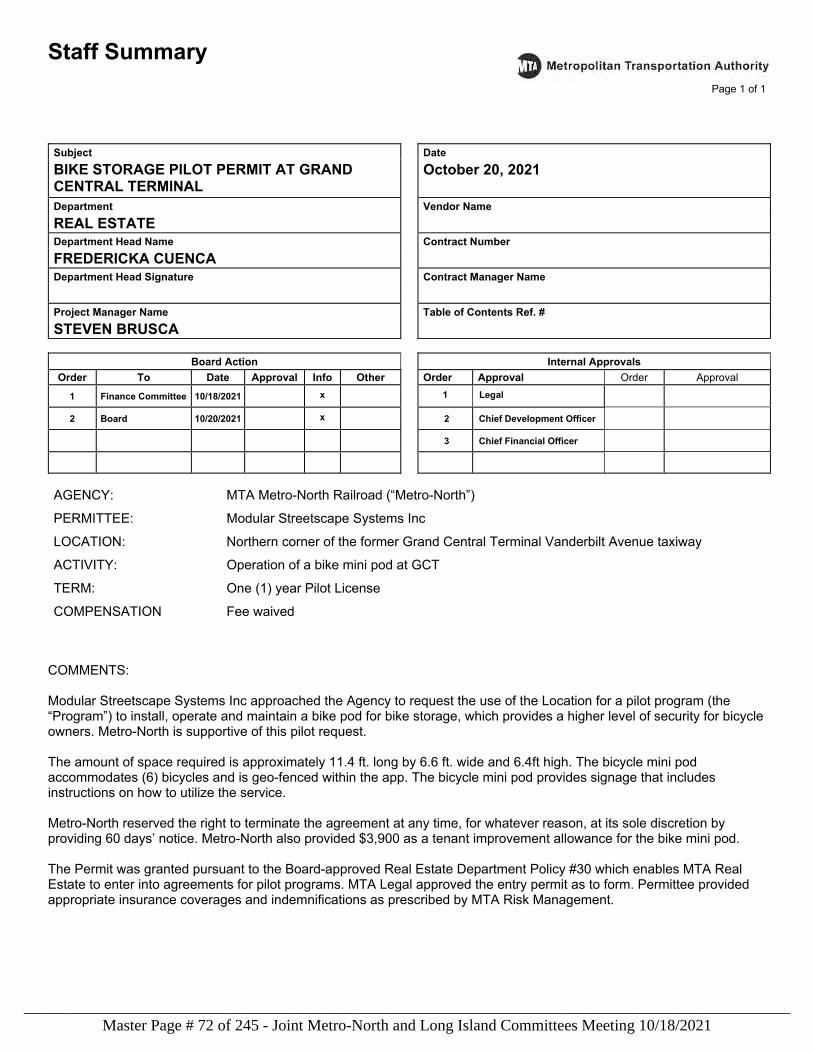
Staff Summary
Page 1 of 1
Subject Date BIKE STORAGE PILOT PERMIT AT GRAND CENTRAL TERMINAL
October 20, 2021
Department Vendor Name
REAL ESTATE Department Head Name Contract Number
FREDERICKA CUENCA Department Head Signature Contract Manager Name
Project Manager Name Table of Contents Ref. #
STEVEN BRUSCA
Board Action Internal Approvals
Order To Date Approval Info Other Order Approval Order Approval
1 Finance Committee 10/18/2021 x 1 Legal
2 Board 10/20/2021 x 2 Chief Development Officer
3 Chief Financial Officer
AGENCY: MTA Metro-North Railroad (“Metro-North”)
PERMITTEE: Modular Streetscape Systems Inc
LOCATION: Northern corner of the former Grand Central Terminal Vanderbilt Avenue taxiway
ACTIVITY: Operation of a bike mini pod at GCT
TERM: One (1) year Pilot License
COMPENSATION Fee waived
COMMENTS: Modular Streetscape Systems Inc approached the Agency to request the use of the Location for a pilot program (the “Program”) to install, operate and maintain a bike pod for bike storage, which provides a higher level of security for bicycle owners. Metro-North is supportive of this pilot request. The amount of space required is approximately 11.4 ft. long by 6.6 ft. wide and 6.4ft high. The bicycle mini pod accommodates (6) bicycles and is geo-fenced within the app. The bicycle mini pod provides signage that includes instructions on how to utilize the service. Metro-North reserved the right to terminate the agreement at any time, for whatever reason, at its sole discretion by providing 60 days’ notice. Metro-North also provided $3,900 as a tenant improvement allowance for the bike mini pod. The Permit was granted pursuant to the Board-approved Real Estate Department Policy #30 which enables MTA Real Estate to enter into agreements for pilot programs. MTA Legal approved the entry permit as to form. Permittee provided appropriate insurance coverages and indemnifications as prescribed by MTA Risk Management.
Master Page # 72 of 245 - Joint Metro-North and Long Island Committees Meeting 10/18/2021________________________________________________________________________________
INFORMATION
ITEMS
Master Page # 73 of 245 - Joint Metro-North and Long Island Committees Meeting 10/18/2021________________________________________________________________________________
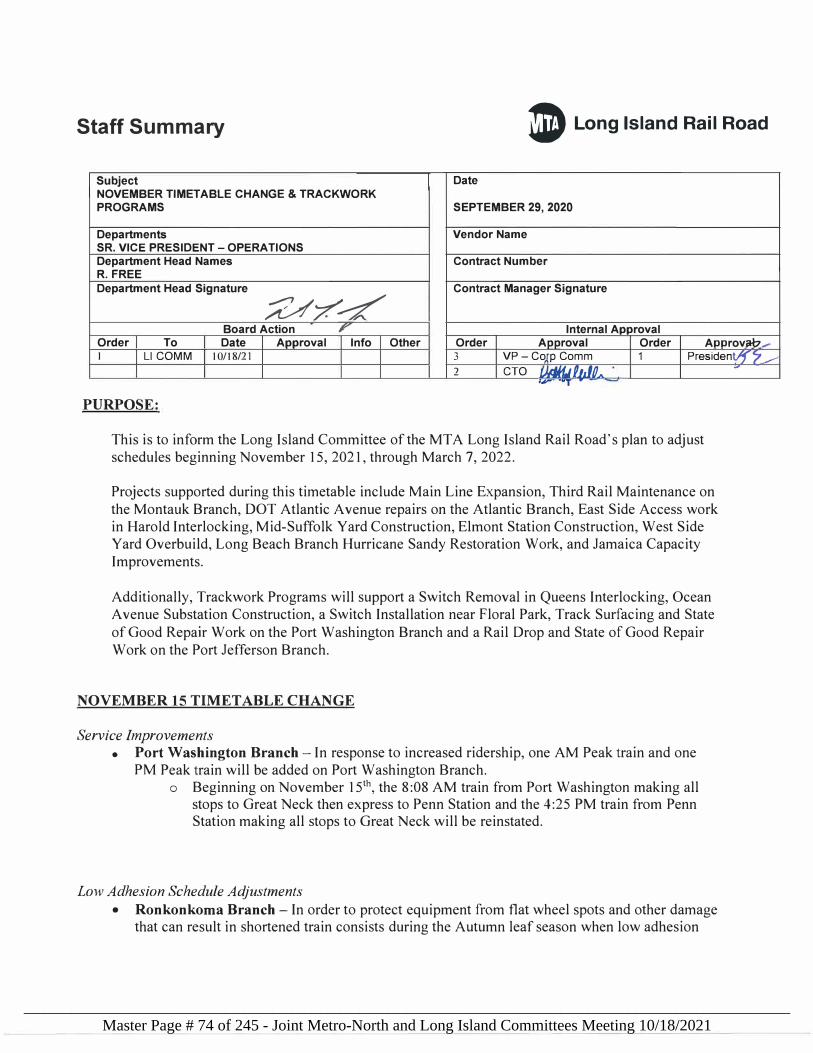
Staff Summary I) Long Island Rail Road
Subject Date NOVEMBER TIMETABLE CHANGE & TRACKWORK PROGRAMS SEPTEMBER 29, 2020
Departments Vendor Name SR. VICE PRESIDENT- OPERATIONS Department Head Names Contract Number R. FREEDepartment Head Signature
V-;;r-/ Contract Manager Signature
Board Action , Internal Aooroval Order To Date Aooroval Info Other Order Approval Order Aoorovab-I LI COMM I 0/18/21 3 VP - CoJp Comm 1 President/f 7 __.--
2 CTO {)/:/J/f ,J V lII O A ,,.,-- 1 ..
PURPOSE:
This is to inform the Long Island Committee of the MTA Long Island Rail Road's plan to adjust schedules beginning November 15, 2021, through March 7, 2022.
Projects supported during this timetable include Main Line Expansion, Third Rail Maintenance on the Montauk Branch, DOT Atlantic Avenue repairs on the Atlantic Branch, East Side Access work in Harold Interlocking, Mid-Suffolk Yard Construction, Elmont Station Construction, West Side Yard Overbuild, Long Beach Branch Hurricane Sandy Restoration Work, and Jamaica Capacity Improvements.
Additionally, Trackwork Programs will support a Switch Removal in Queens Interlocking, Ocean A venue Substation Construction, a Switch Installation near Floral Park, Track Surfacing and State of Good Repair Work on the Port Washington Branch and a Rail Drop and State of Good Repair Work on the Port Jefferson Branch.
NOVEMBER 15 TIMETABLE CHANGE
Service Improvements • Port Washington Branch - In response to increased ridership, one AM Peak train and one
PM Peak train will be added on Port Washington Branch.o Beginning on November 1511
\ the 8:08 AM train from Port Washington making all stops to Great Neck then express to Penn Station and the 4:25 PM train from Penn Station making all stops to Great Neck will be reinstated.
Low Adhesion Schedule Adjustments • Ronkonkoma Branch - In order to protect equipment from flat wheel spots and other damage
that can result in shortened train consists during the Autumn leaf season when low adhesion
-
Master Page # 74 of 245 - Joint Metro-North and Long Island Committees Meeting 10/18/2021________________________________________________________________________________
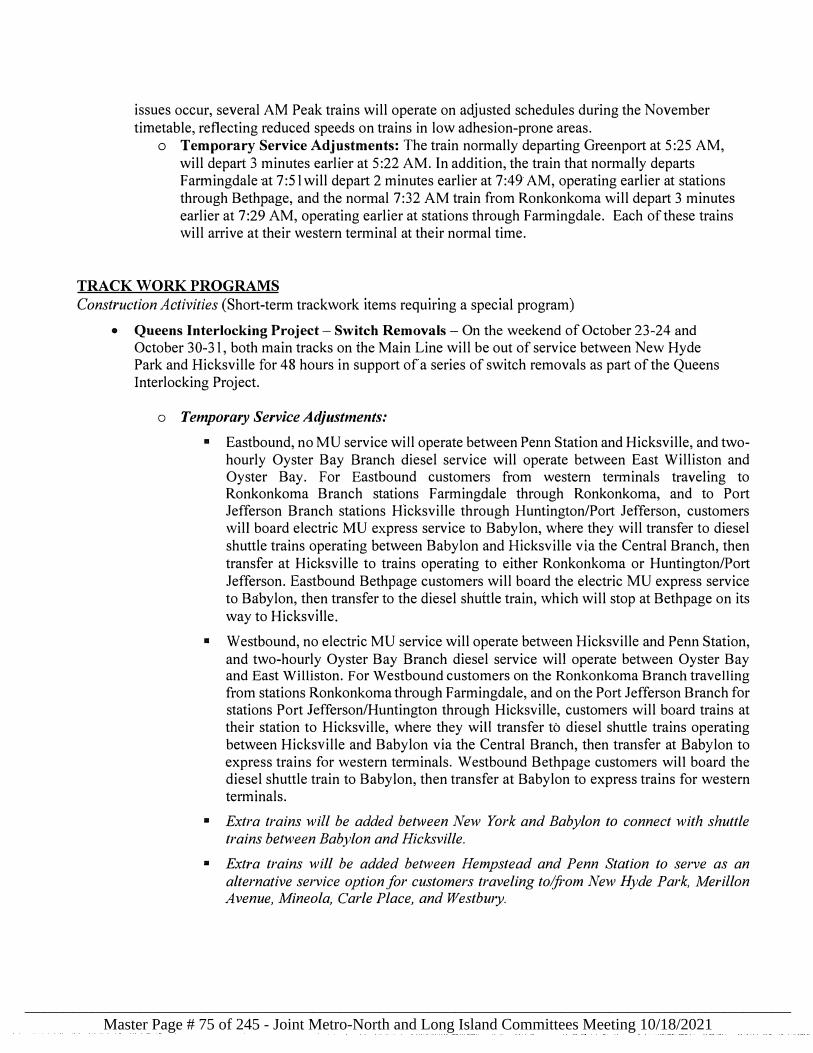
issues occur, several AM Peak trains will operate on adjusted schedules during the November timetable, reflecting reduced speeds on trains in low adhesion-prone areas.
o Temporary Service Adjustments: The train normally departing Greenport at 5:25 AM, will depart 3 minutes earlier at 5 :22 AM. In addition, the train that normally departs Farmingdale at 7 :51 will depart 2 minutes earlier at 7 :49 AM, operating earlier at stations through Bethpage, and the normal 7:32 AM train from Ronkonkoma will depart 3 minutes earlier at 7:29 AM, operating earlier at stations through Farmingdale. Each of these trains will arrive at their western terminal at their normal time.
TRACK WORK PROGRAMS
Construction Activities (Short-term trackwork items requiring a special program)
• Queens Interlocking Project - Switch Removals - On the weekend of October 23-24 and October 30-31, both main tracks on the Main Line will be out of service between New Hyde Park and Hicksville for 48 hours in support of a series of switch removals as part of the Queens Interlocking Project.
o Temporary Service Adjustments:
"' Eastbound, no MU service will operate between Penn Station and Hicksville, and twohourly Oyster Bay Branch diesel service will operate between East Williston and Oyster Bay. For Eastbound customers from western tenninals traveling to Ronkonkoma Branch stations Farmingdale through Ronkonkoma, and to Port Jefferson Branch stations Hicksville through Huntington/Port Jefferson, customers will board electric MU express service to Babylon, where they will transfer to diesel shuttle trains operating between Babylon and Hicksville via the Central Branch, then transfer at Hicksville to trains operating to either Ronkonkoma or Huntington/Port Jefferson. Eastbound Bethpage customers will board the electric MU express service to Babylon, then transfer to the diesel shuttle train, which will stop at Bethpage on its way to Hicksville.
"' Westbound, no electric MU service will operate between Hicksville and Penn Station, and two-hourly Oyster Bay Branch diesel service will operate between Oyster Bay and East Williston. For Westbound customers on the Ronkonkoma Branch travelling from stations Ronkonkoma through Farmingdale, and on the Port Jefferson Branch for stations Port Jefferson/Huntington through Hicksville, customers will board trains at their station to Hicksville, where they will transfer to diesel shuttle trains operating between Hicksville and Babylon via the Central Branch, then transfer at Babylon to express trains for western terminals. Westbound Bethpage customers will board the diesel shuttle train to Babylon, then transfer at Babylon to express trains for western terminals.
"' Extra trains will be added between New York and Babylon to connect with shuttle trains between Babylon and Hicksville.
"' Extra trains will be added between Hempstead and Penn Station to serve as an alternative service option for customers traveling to/from New Hyde Park, Merillon Avenue, Mineola, Carle Place, and Westbury.
Master Page # 75 of 245 - Joint Metro-North and Long Island Committees Meeting 10/18/2021________________________________________________________________________________
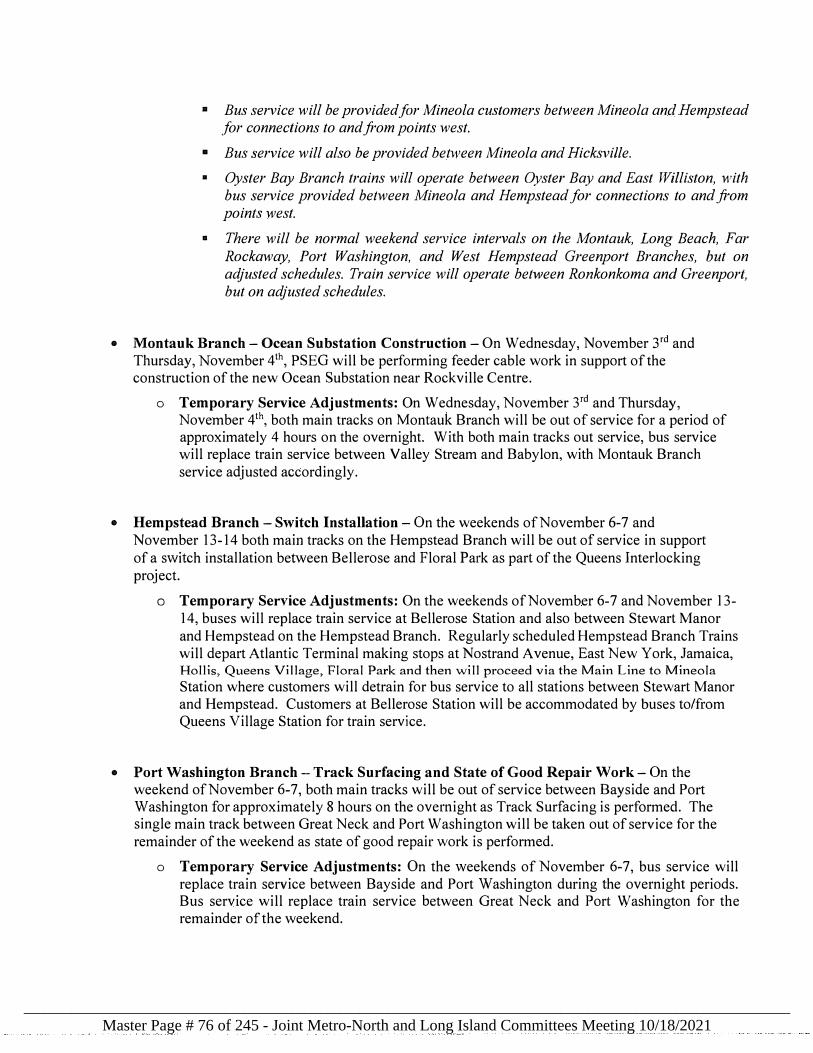
DI Bus service will be provided for Mineola customers between Mineola and Hempstead for connections to andfrom points west.
DI Bus service will also be provided between Mineola and Hicksville.
■ Oyster Bay Branch trains will operate between Oyster Bay and East Williston, with bus service provided between Mineola and Hempstead for connections to and from points west.
• There will be normal weekend service intervals on the Montauk, Long Beach, Far Rockaway, Port Washington, and West Hempstead Greenport Branches, but on adjusted schedules. Train service will operate between Ronkonkoma and Greenport, but on adjusted schedules.
• Montauk Branch - Ocean Substation Construction - On Wednesday, November 3rd and Thursday, November 4th, PSEG will be performing feeder cable work in support of the construction of the new Ocean Substation near Rockville Centre.
o Temporary Service Adjustments: On Wednesday, November 3rd and Thursday, November 4th, both main tracks on Montauk Branch will be out of service for a period of approximately 4 hours on the overnight. With both main tracks out service, bus service will replace train service between Valley Stream and Babylon, with Montauk Branch service adjusted accordingly.
• Hempstead Branch - Switch Installation - On the weekends of November 6-7 and November 13-14 both main tracks on the Hempstead Branch will be out of service in support of a switch installation between Bellerose and Floral Park as part of the Queens Interlocking project.
o Temporary Service Adjustments: On the weekends of November 6-7 and November 13-14, buses will replace train service at Bellerose Station and also between Stewart Manor and Hempstead on the Hempstead Branch. Regularly scheduled Hempstead Branch Trains will depart Atlantic Terminal making stops at Nostrand A venue, East New York, Jamaica, Hollis, Queens Village, Floral Park and then will proceed via the Main Line to Mineola
Station where customers will detrain for bus service to all stations between Stewart Manor and Hempstead. Customers at Bellerose Station will be accommodated by buses to/from Queens Village Station for train service.
• Port Washington Branch -Track Surfacing and State of Good Repair Work- On the weekend of November 6-7, both main tracks will be out of service between Bayside and Port Washington for approximately 8 hours on the overnight as Track Surfacing is performed. The single main track between Great Neck and Port Washington will be taken out of service for the remainder of the weekend as state of good repair work is performed.
o Temporary Service Adjustments: On the weekends of November 6-7, bus service will replace train service between Bayside and Port Washington during the overnight periods. Bus service will replace train service between Great Neck and Port Washington for the remainder of the weekend.
Master Page # 76 of 245 - Joint Metro-North and Long Island Committees Meeting 10/18/2021________________________________________________________________________________
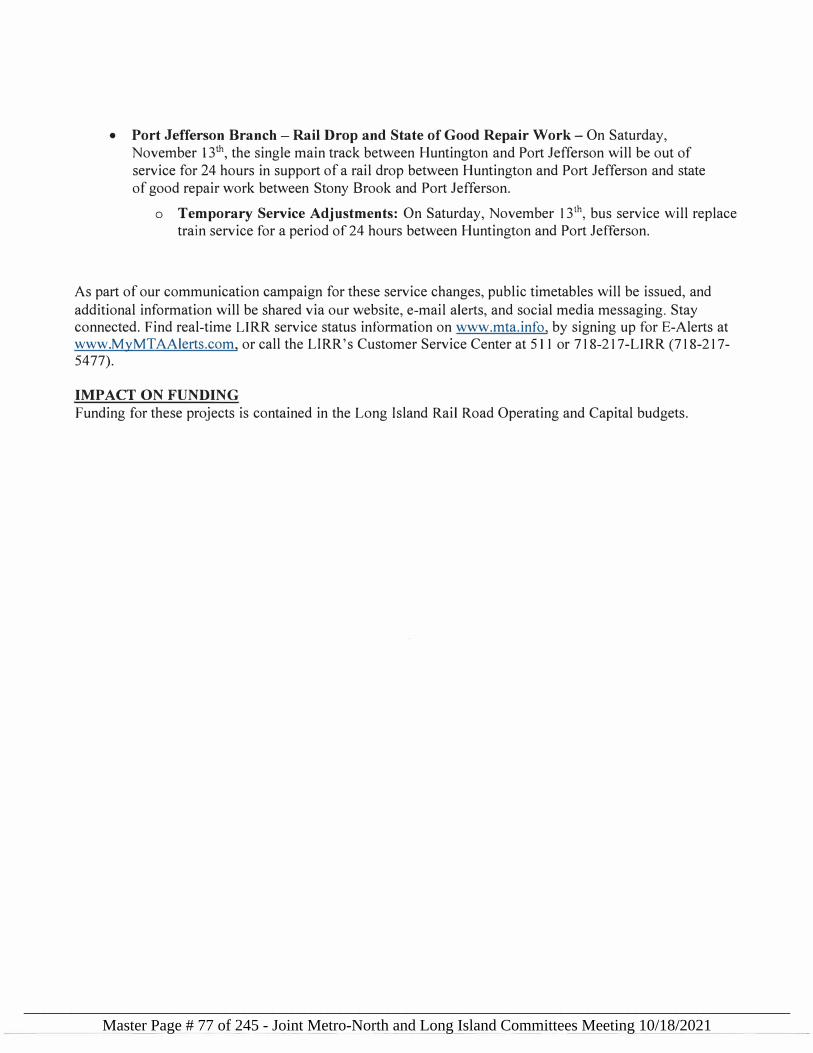
• Port Jefferson Branch - Rail Drop and State of Good Repair Work - On Saturday, November 13th, the single main track between Huntington and Port Jefferson will be out of service for 24 hours in support of a rail drop between Huntington and Port Jefferson and state of good repair work between Stony Brook and Port Jefferson.
o Temporary Service Adjustments: On Saturday, November 13th, bus service will replace train service for a period of 24 hours between Huntington and Port Jefferson.
As part of our communication campaign for these service changes, public timetables will be issued, and
additional information will be shared via our website, e-mail alerts, and social media messaging. Stay connected. Find real-time LIRR service status information on www.mta.info, by signing up for E-Alerts at www.MyMTAAlerts.com, or call the LIRR's Customer Service Center at 511 or 718-217-LIRR (718-217-5477).
IMPACT ON FUNDING Funding for these projects is contained in the Long Island Rail Road Operating and Capital budgets.
Master Page # 77 of 245 - Joint Metro-North and Long Island Committees Meeting 10/18/2021________________________________________________________________________________
Procurements
Master Page # 78 of 245 - Joint Metro-North and Long Island Committees Meeting 10/18/2021________________________________________________________________________________
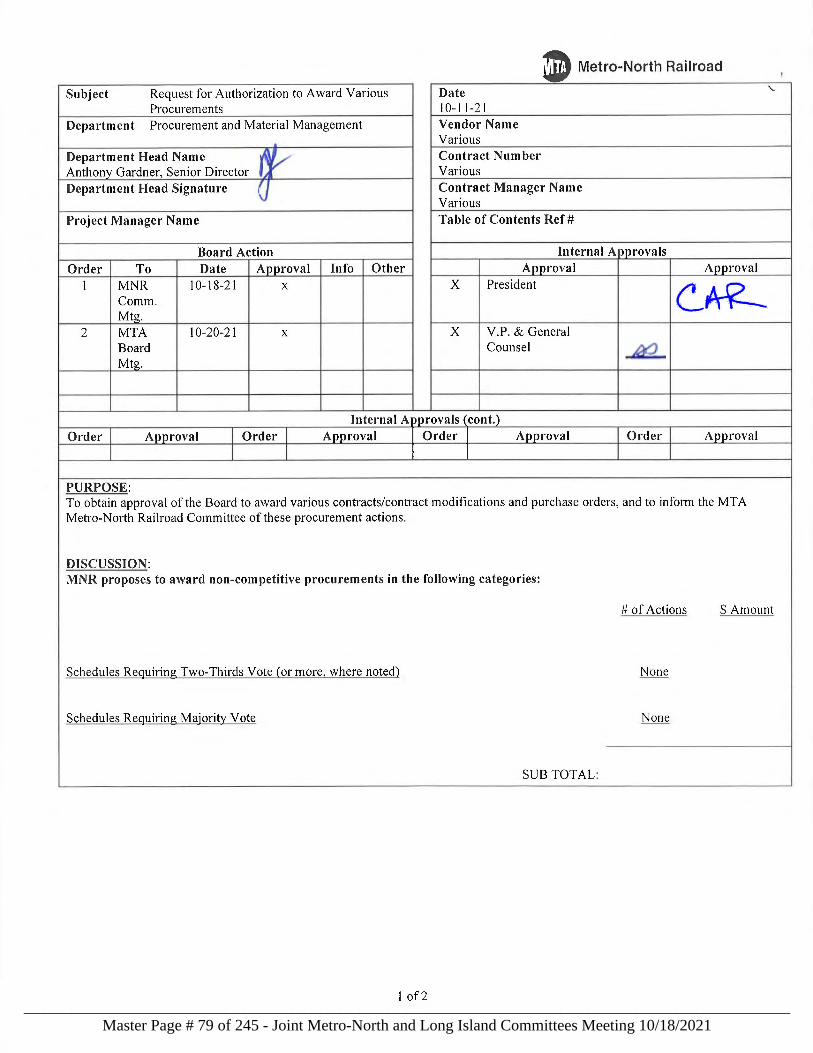
Master Page # 79 of 245 - Joint Metro-North and Long Island Committees Meeting 10/18/2021________________________________________________________________________________
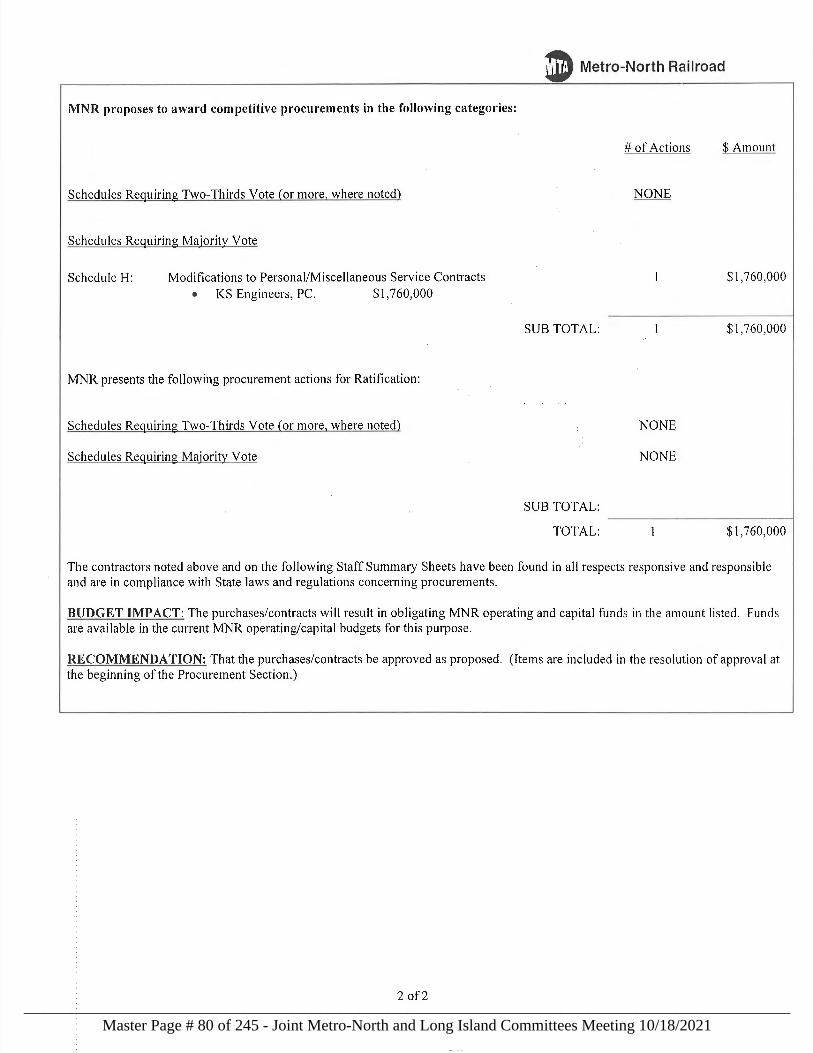
Master Page # 80 of 245 - Joint Metro-North and Long Island Committees Meeting 10/18/2021________________________________________________________________________________
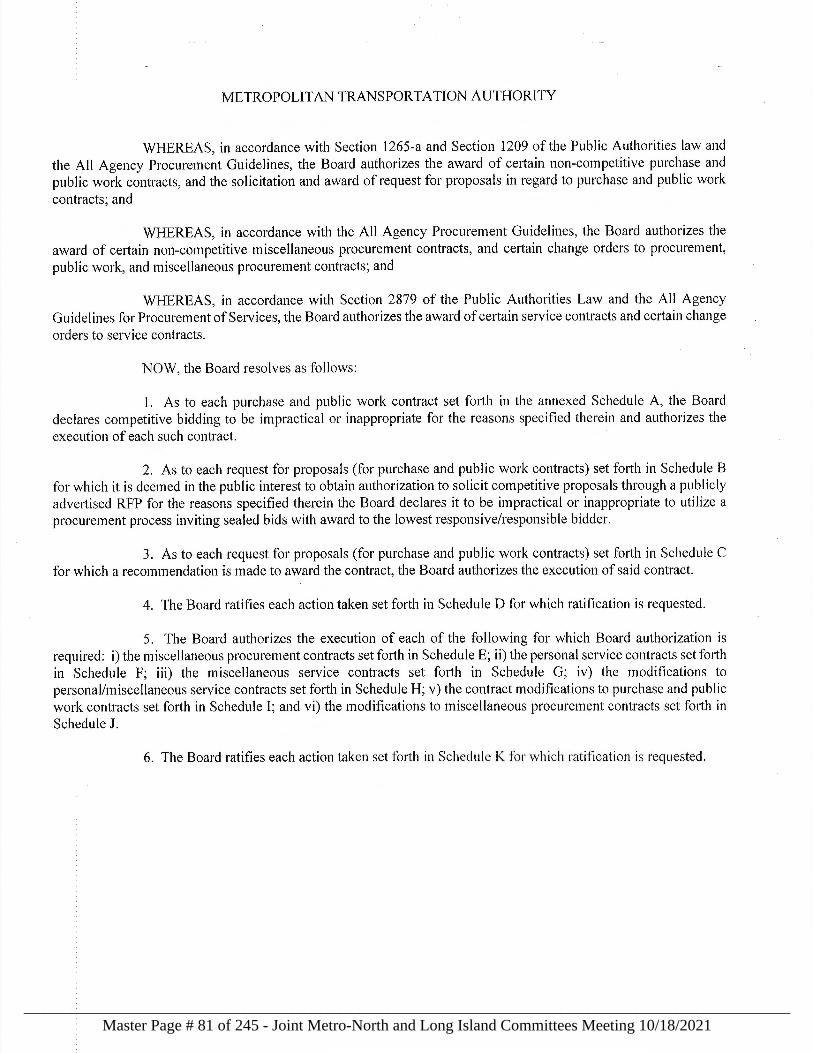
Master Page # 81 of 245 - Joint Metro-North and Long Island Committees Meeting 10/18/2021________________________________________________________________________________
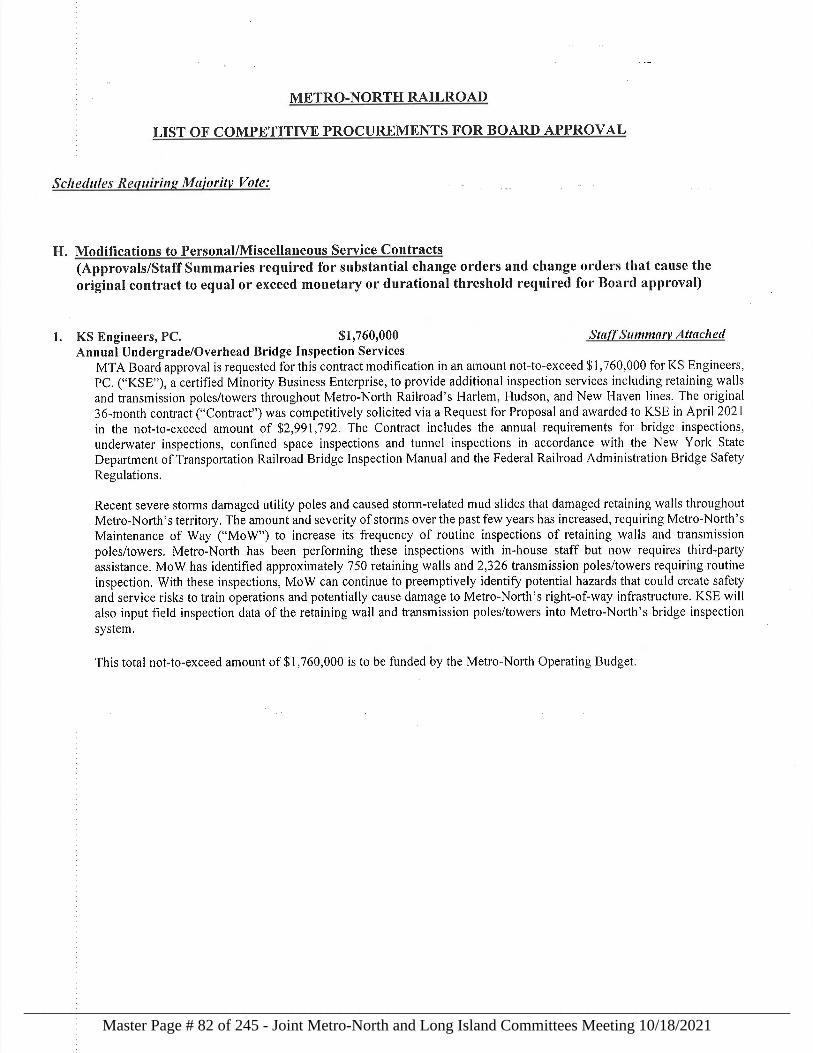
Master Page # 82 of 245 - Joint Metro-North and Long Island Committees Meeting 10/18/2021________________________________________________________________________________
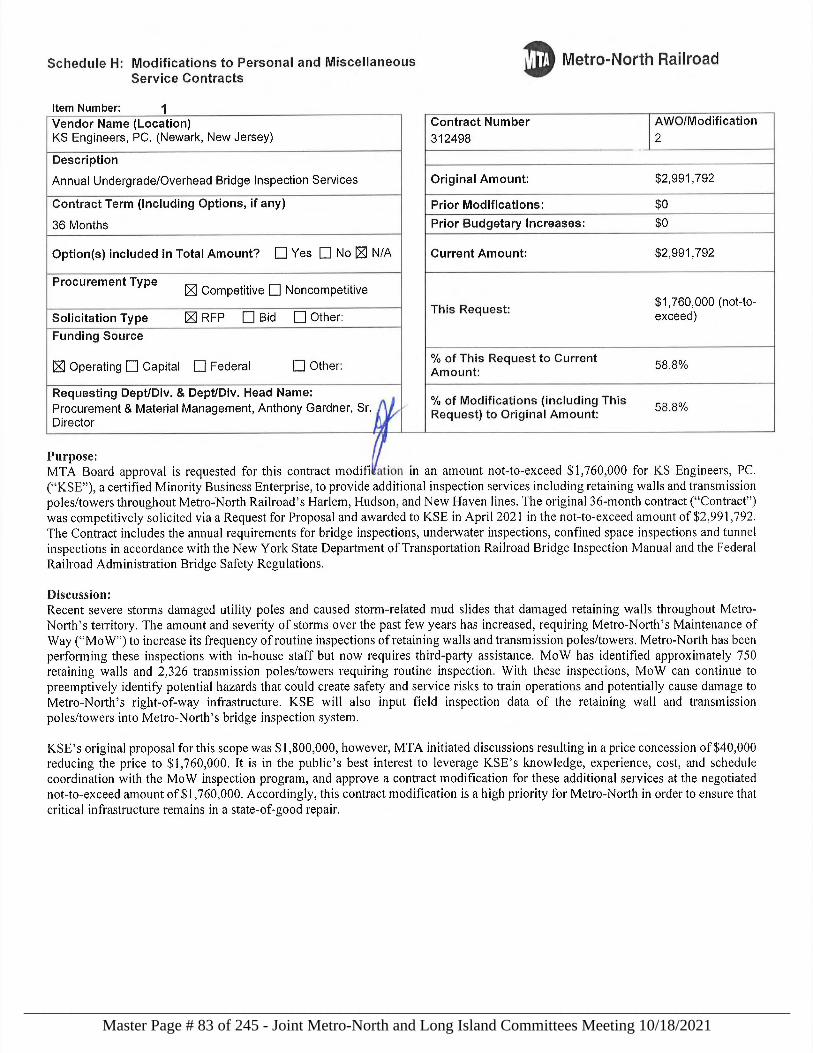
Master Page # 83 of 245 - Joint Metro-North and Long Island Committees Meeting 10/18/2021________________________________________________________________________________
Master Page # 84 of 245 - Joint Metro-North and Long Island Committees Meeting 10/18/2021________________________________________________________________________________
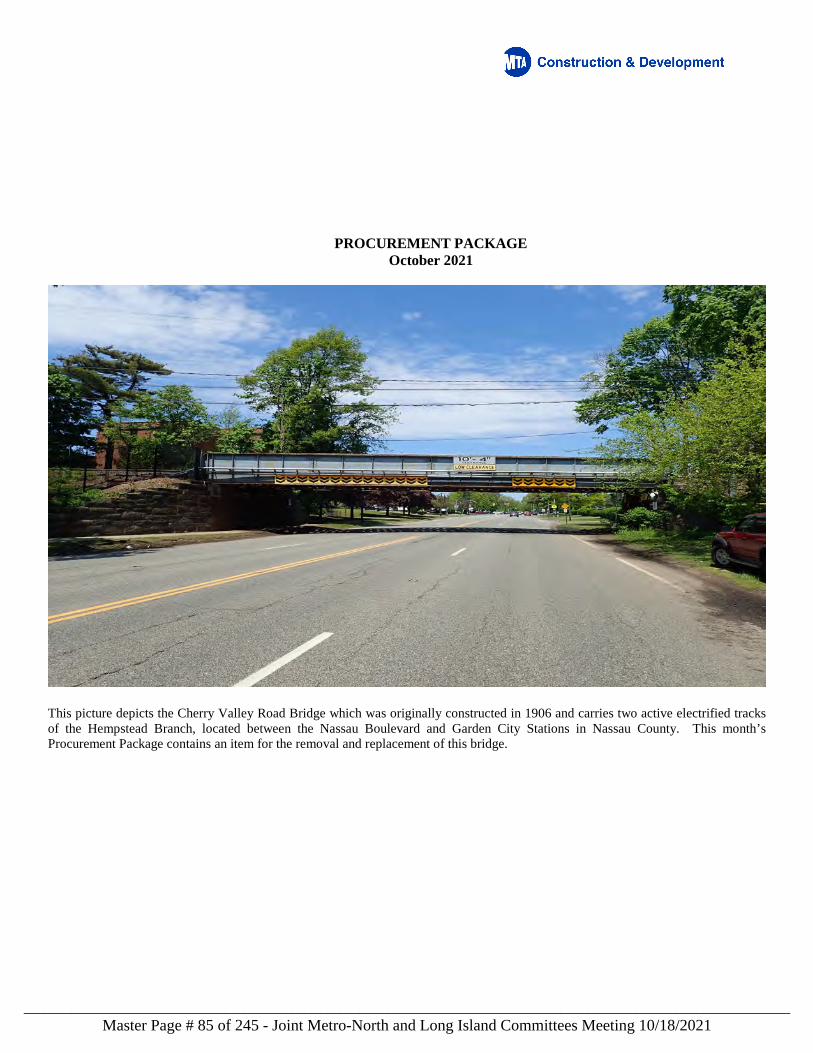
PROCUREMENT PACKAGE October 2021
This picture depicts the Cherry Valley Road Bridge which was originally constructed in 1906 and carries two active electrified tracks of the Hempstead Branch, located between the Nassau Boulevard and Garden City Stations in Nassau County. This month’s Procurement Package contains an item for the removal and replacement of this bridge.
Master Page # 85 of 245 - Joint Metro-North and Long Island Committees Meeting 10/18/2021________________________________________________________________________________
PROCUREMENTS The Procurement Agenda this month includes one procurement action for a proposed expenditure of $16.7M
Master Page # 86 of 245 - Joint Metro-North and Long Island Committees Meeting 10/18/2021________________________________________________________________________________
Staff Summary D Construction & Development
Subject Request for Authorization to Award a Procurement Action
Department Contracts
Department Head Name & Title David K. Cannon, Vice President
D�:
ment Head �-nature
,,,,/ 1,1 �-,.,, A,.
Board Action Order To Date Aooroval Info Other
MNR& LIRR 1 Joint Committee 10/18/21 X
2 Board 10/20/21 X
PURPOSE
Date: October 14, 2021
Tim
Mulligan
.....,., ... b)'TomMllligan °""'11121.lQ.14 1�17DHM'IIO'
Deputy Chief Development Officer, Delivery
Deputy Chief Development Officer, Develo ment
roval
ice resident &
General Counsel
To obtain the approval of the Board to award a procurement action and, to inform the Metro-North and Long Island Rail Road Committees of the procurement action.
DISCUSSION
MT A Construction & Development proposes to award a Competitive Procurement in the following category:
Schedules Requiring Two-Thirds Vote
C. Competitive Requests for Proposals (Award of Purchase/Public Work Contracts) TOTAL
Budget Impact:
# of Actions $ Amount
$16,663,538.40 $16,663,538.40
The approval of this procurement action will obligate the capital funds in the amount listed. Funds are available in the capital budget for this purpose.
Recommendation:
The procurement action be approved as proposed. (The item is included in the resolution of approval at the beginning of the Procurement Section.)
Master Page # 87 of 245 - Joint Metro-North and Long Island Committees Meeting 10/18/2021________________________________________________________________________________
MTA Construction & Development
BOARD RESOLUTION
WHEREAS, in accordance with Sections 1265-a of the Public Authorities Law and the All Agency Procurement Guidelines, the Board authorizes the award of certain non-competitive purchase and public works contracts, and the solicitation and award of request for proposals in regard to purchase and public work contracts; and WHEREAS, in accordance with the All Agency Procurement Guidelines, the Board authorizes the award of certain non-competitive miscellaneous service and miscellaneous procurement contracts, certain change orders to purchase, public work, and miscellaneous service and miscellaneous procurement contracts; WHEREAS, in accordance with Section 2879 of the Public Authorities Law and the All-Agency Guidelines for Procurement of Services, the Board authorizes the award of certain service contracts and certain change orders to service contracts. NOW, the Board resolves as follows: 1. As to each purchase and public work contract set forth in annexed Schedule A, the Board declares competitive bidding to be impractical or inappropriate for the reasons specified therein and authorizes the execution of each such contract. 2. As to each request for proposals (for purchase and public work contracts) set forth in Schedule B for which authorization to solicit proposals is requested, for the reasons specified therein, the Board declares competitive bidding to be impractical or inappropriate, declares it is in the public interest to solicit competitive request for proposals and authorizes the solicitation of such proposals. 3. As to each request for proposals (for purchase and public work contracts set forth in Schedule C for which a recommendation is made to award the contract), the Board authorizes the execution of said contract. 4. As to each action set forth in Schedule D, the Board declares competitive bidding impractical or inappropriate for the reasons specified therein, and ratifies each action for which ratification is requested. 5. The Board authorizes the execution of each of the following for which Board authorization is required: i) the miscellaneous procurement contracts set forth in Schedule E; ii) the personal service contracts set forth in Schedule F; iii) the miscellaneous service contracts set forth in Schedule G; iv) the modifications to personal/miscellaneous service contracts set forth in Schedule H; v) the contract modifications to purchase and public work contracts set forth in Schedule I; vi) the modifications to miscellaneous procurement contracts set forth in Schedule J. 6. The Board ratifies each action taken set forth in Schedule K for which ratification is requested.
Master Page # 88 of 245 - Joint Metro-North and Long Island Committees Meeting 10/18/2021________________________________________________________________________________
OCTOBER 2021
LIST OF COMPETITIVE PROCUREMENTS FOR BOARD APPROVAL
Procurements Requiring Two-Thirds Vote: Schedule C. Competitive Requests for Proposals (Award of Purchase/Public Work Contracts)
(Staff Summaries required for all items greater than $1M)
1. Railroad Construction Company, Inc. $16,663,538.40 Staff Summary Attached Contract No. 6375 720 days
MTA Construction and Development requests Board approval to award a competitively solicited and negotiated design-build contract for the removal and replacement of the Cherry Valley Avenue Bridge located in Garden City on the Long Island Railroad’s Hempstead Branch.
Master Page # 89 of 245 - Joint Metro-North and Long Island Committees Meeting 10/18/2021________________________________________________________________________________
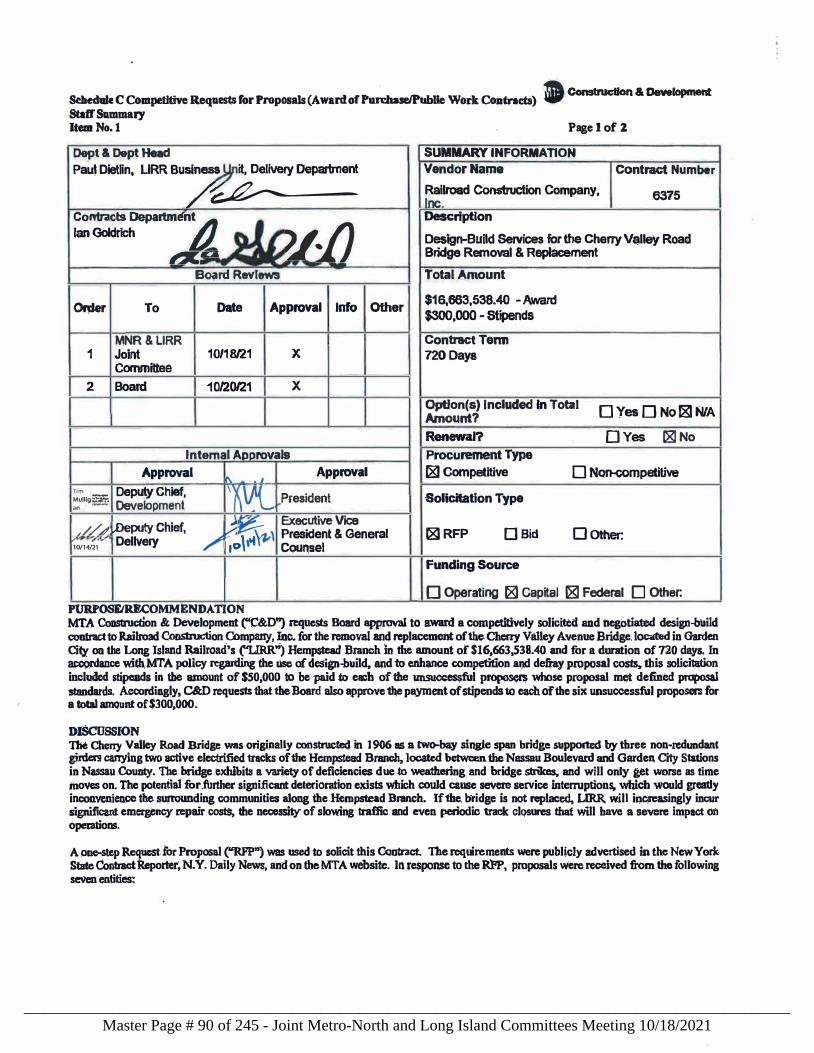
. • - Construcllon & Development Sebedale C Competitive Requests for Proposals (Award of Pun:hase/Publie Work Coatnc:ts) V
Staff Summary Item No.1 Page 1 of 2
Dept & Dept Head SUMMARY INFORMATION
Paut Dietlin, LIRR Business it, Delivery Department Vendor Na01e Contract Number
/� Railroad Construction Company, 6375 Inc
Contracts Departmr!n�
u.JJ Description
Ian Goldrich Design-Buftd Services for the Cherry Vqlley Road ,z.-- Bridge Removal & Replacement
Board Reviews Total Amount
� To Date Approval Info Other $16,663,538.40 -Award $300,000 - Stipends
MNR&LIRR Contract Tenn 1 Joint 10/18fl1 X 720Days
Committee
2 Board 10/20/21 X Option(s) Included l_n Total
0 )'es O No 181 NIA A,moqnt? Renewal? □ Yes 1'8J No
Internal Anoroval9 Procurement Type Approval
!'le • I AppfOval 181 Competitive D Non-competitive
Tim Deputy Chief, 'Y�L President ·Solicitation Type Mulllg��
an -- Development
,//� !Deputy Chief, v�, Executive Vice ,_ Dellveiy / "",o\ ,-t President & General 181 RFP □ Bid □ Other:
10/14/21 CQUr,sel
Funding Source
0 Operating t8I Capital 181 Federal O Other: PURPOSEIRECOMMENDATION MTA Comtn1ction & Development ("C&D") requests Board approval to award a compedtively solicited and tiegotiated design-build contract to Railroad Construction Chmpany, Inc. for the removal and replacement of the Cheny Valley Avenue Bridge. I� in Garden City on the Long Island Railroad's ("LIRR") Hempstead Branch in the amount of $16,663,538.40 and for a duration of 720 days. In acco.nlance with.MT A policy rcgmding the lise of design-build, and to enhance competition 81ld defray proposal co$1Ss. this solicilation included stipends in the amount of $S0,000 to be paid to each of the UBSUCCCS$ful pro� whose proposal met defined proposal slandards. A.ec:ordingly, C&D requests that the-Board also approve� payment of stipends to each of the six unsuccessful proposers for a total amount of$300,000.
D.lSCUSSION
The Cherry Valley Road Bridge was originally constructed in 1906 as a two-bay single span bridge supported by thre e non-redundant girders carrying two active electrified tracks of the Hempstead Branch. located between the Nassau Boulevatd and GQrden City Stations in Nassau County. The bridge cxlu"bits a variety of deficiencies due .to weathering and bridge strikes, and will only get worse as time moves on. The potential fur .further significant deterioration exists which couJd cause severe service interruptions, which would greatly inconvenience the sunvunding communities along the Hempstead Branch. If the. bridge is not replaced, LIRR. wlll in�ingl y incur significant emergency [Cpair costs, the necessity of slowing traffic and even periodic track clQSures that will have a severe impact Oil opetatiom.
A .one-step Request for Proposal ("RFP") was used to solicit this Contract. The requirements were publicly advertised in the New York State Contract Reporter� N.Y. Daily News, and on the MT A website. ln response to the RPP, proposals were received trom tho following seven entities:
Master Page # 90 of 245 - Joint Metro-North and Long Island Committees Meeting 10/18/2021________________________________________________________________________________
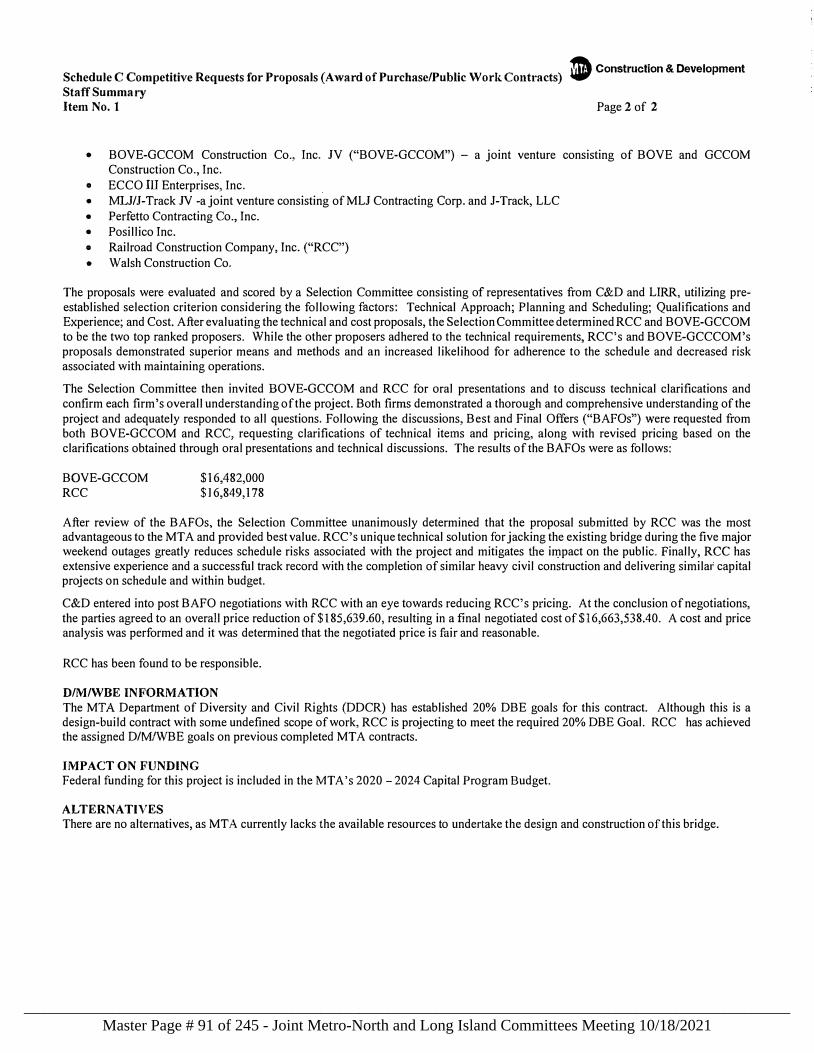
- Construction & Development Schedule C Competitive Requests for Proposals (Award of Purchase/Public Work Contracts) V Staff Summary Item No. 1 Page 2 of 2
• BOVE-GCCOM Construction Co., Inc. JV ("BOVE-GCCOM") - a joint venture consisting of BOVE and GCCOM Construction Co., Inc.
• ECCO III Enterprises, Inc. • MLJ/J-Track JV -a joint venture consisting ofMLJ Contracting Corp. and I-Track, LLC • Perfetto Contracting Co., Inc. • Posillico Inc. • Railroad Construction Company, Inc. ("RCC") • Walsh Construction Co.
The proposals were evaluated and scored by a Selection Committee consisting of representatives from C&D and LIRR, utilizing preestablished selection criterion considering the following factors: Technical Approach; Planning and Scheduling; Qualifications and Experience; and Cost. After evaluating the technical and cost proposals, the Selection Committee determined RCC and BOVE-GCCOM to be the two top ranked proposers. While the other proposers adhered to the technical requirements, RCC's and BOVE-GCCCOM's proposals demonstrated superior means and methods and an increased likelihood for adherence to the schedule and decreased risk associated with maintaining operations.
The Selection Committee then invited BOVE-GCCOM and RCC for oral presentations and to discuss technical clarifications and confirm each firm's overall understanding of the project. Both firms demonstrated a thorough and comprehensive understanding of the project and adequately responded to all questions. Following the discussions, Best and Final Offers ("BAFOs") were requested from both BOVE-GCCOM and RCC, requesting clarifications of technical items and pricing, along with revised pricing based on the clarifications obtained through oral presentations and technical discussions. The results of the BAFOs were as follows:
BOVE-GCCOM RCC
$16,482,000 $16,849,178
After review of the BAFOs, the Selection Committee unanimously determined that the proposal submitted by RCC was the most advantageous to the MTA and provided best value. RCC's unique technical solution for jacking the existing bridge during the five major weekend outages greatly reduces schedule risks associated with the project and mitigates the impact on the public. Finally, RCC has extensive experience and a successful track record with the completion of similar heavy civil construction and delivering similar capital projects on schedule and within budget.
C&D entered into post BAFO negotiations with RCC with an eye towards reducing RCC's pricing. At the conclusion of negotiations, the parties agreed to an overall price reduction of$l85,639.60, resulting in a final negotiated cost of$16,663,538.40. A cost and price analysis was performed and it was determined that the negotiated price is fair and reasonable.
RCC has been found to be responsible.
D/M/WBE INFORMATION The MTA Department of Diversity and Civil Rights (DDCR) has established 20% DBE goals for this contract. Although this is a design-build contract with some undefined scope of work, RCC is projecting to meet the required 20% DBE Goal. RCC has achieved the assigned D/M/WBE goals on previous completed MT A contracts.
IMP ACT ON FUNDING Federal funding for this project is included in the MT A's 2020 2024 Capital Program Budget.
ALTERNATIVES There are no alternatives, as MTA currently lacks the available resources to undertake the design and construction of this bridge.
Master Page # 91 of 245 - Joint Metro-North and Long Island Committees Meeting 10/18/2021________________________________________________________________________________
Operations Report Justin R. Vonashek Senior Vice President, Operations
M7 EMU M8 EMU
Comet 5 Cab Car
Master Page # 92 of 245 - Joint Metro-North and Long Island Committees Meeting 10/18/2021________________________________________________________________________________
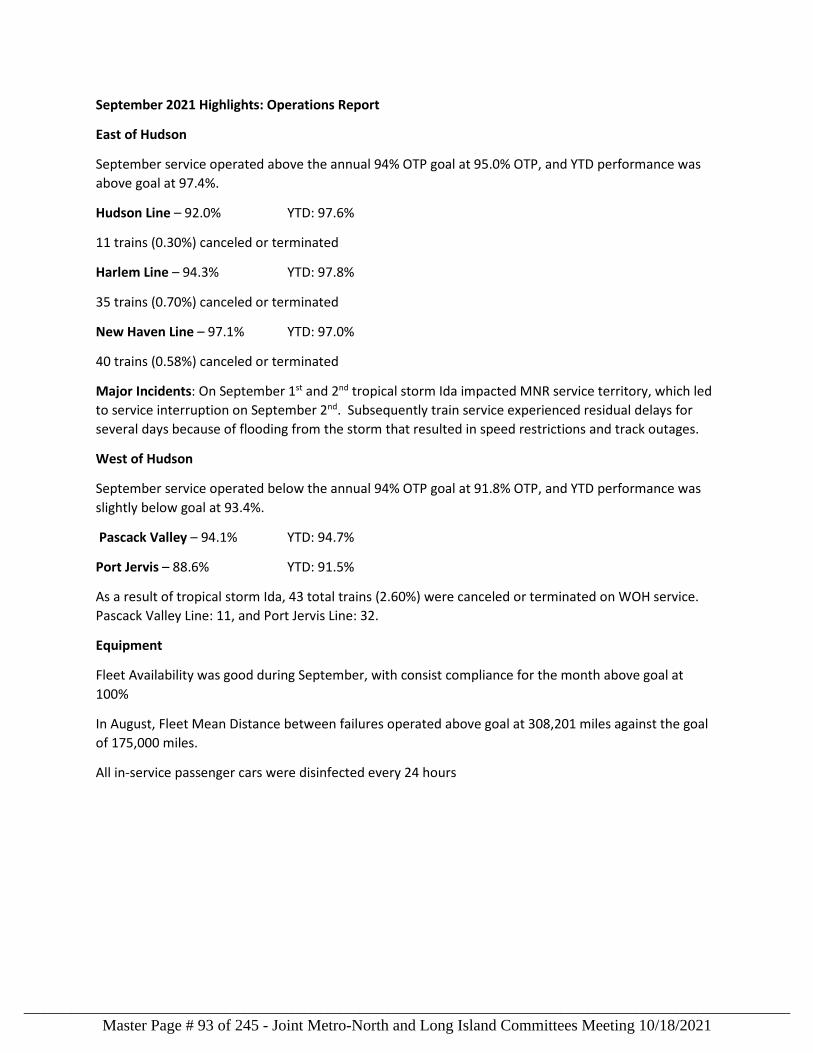
September 2021 Highlights: Operations Report
East of Hudson
September service operated above the annual 94% OTP goal at 95.0% OTP, and YTD performance was above goal at 97.4%.
Hudson Line – 92.0% YTD: 97.6%
11 trains (0.30%) canceled or terminated
Harlem Line – 94.3% YTD: 97.8%
35 trains (0.70%) canceled or terminated
New Haven Line – 97.1% YTD: 97.0%
40 trains (0.58%) canceled or terminated
Major Incidents: On September 1st and 2nd tropical storm Ida impacted MNR service territory, which led to service interruption on September 2nd. Subsequently train service experienced residual delays for several days because of flooding from the storm that resulted in speed restrictions and track outages.
West of Hudson
September service operated below the annual 94% OTP goal at 91.8% OTP, and YTD performance was slightly below goal at 93.4%.
Pascack Valley – 94.1% YTD: 94.7%
Port Jervis – 88.6% YTD: 91.5%
As a result of tropical storm Ida, 43 total trains (2.60%) were canceled or terminated on WOH service. Pascack Valley Line: 11, and Port Jervis Line: 32.
Equipment
Fleet Availability was good during September, with consist compliance for the month above goal at 100%
In August, Fleet Mean Distance between failures operated above goal at 308,201 miles against the goal of 175,000 miles.
All in-service passenger cars were disinfected every 24 hours
Master Page # 93 of 245 - Joint Metro-North and Long Island Committees Meeting 10/18/2021________________________________________________________________________________
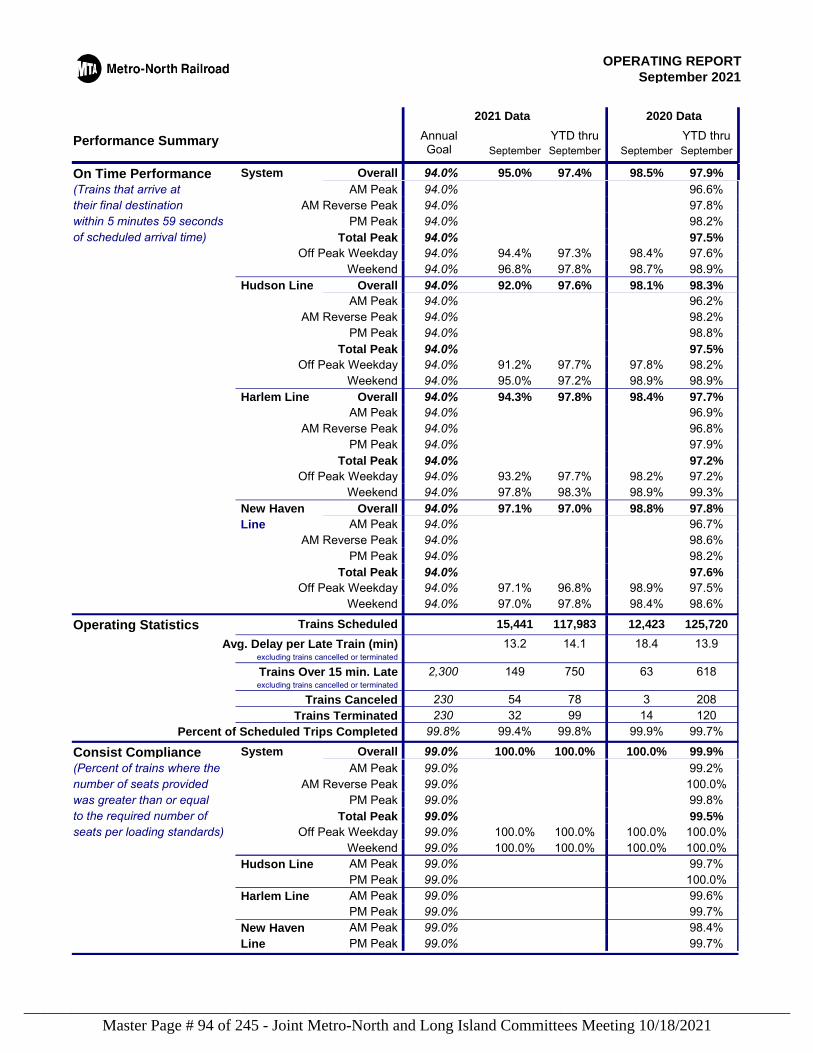
September 2021OPERATING REPORT
Performance Summary
2021 Data 2020 DataAnnualGoal September SeptemberSeptember September
YTD thru YTD thru
OverallSystem 97.9%98.5%97.4%95.0%94.0%On Time PerformanceAM Peak 96.6%94.0%(Trains that arrive at
AM Reverse Peak 97.8%94.0%their final destinationPM Peak 98.2%94.0%within 5 minutes 59 seconds
Total Peak 97.5%94.0%of scheduled arrival time)Off Peak Weekday 97.6%98.4%97.3%94.4%94.0%
Weekend 98.9%98.7%97.8%96.8%94.0%OverallHudson Line 98.3%98.1%97.6%92.0%94.0%
AM Peak 96.2%94.0%AM Reverse Peak 98.2%94.0%
PM Peak 98.8%94.0%Total Peak 97.5%94.0%
Off Peak Weekday 98.2%97.8%97.7%91.2%94.0%Weekend 98.9%98.9%97.2%95.0%94.0%
OverallHarlem Line 97.7%98.4%97.8%94.3%94.0%AM Peak 96.9%94.0%
AM Reverse Peak 96.8%94.0%PM Peak 97.9%94.0%
Total Peak 97.2%94.0%Off Peak Weekday 97.2%98.2%97.7%93.2%94.0%
Weekend 99.3%98.9%98.3%97.8%94.0%OverallNew Haven 97.8%98.8%97.0%97.1%94.0%
AM Peak 96.7%94.0%LineAM Reverse Peak 98.6%94.0%
PM Peak 98.2%94.0%Total Peak 97.6%94.0%
Off Peak Weekday 97.5%98.9%96.8%97.1%94.0%Weekend 98.6%98.4%97.8%97.0%94.0%
125,72012,423117,983Operating Statistics 15,441Trains Scheduled13.918.414.113.2Avg. Delay per Late Train (min)
excluding trains cancelled or terminated
61863750149Trains Over 15 min. Lateexcluding trains cancelled or terminated
2,300
20837854Trains Canceled 230120149932Trains Terminated 230
99.7%99.9%99.8%99.4%Percent of Scheduled Trips Completed 99.8%
OverallSystem 99.9%100.0%100.0%100.0%99.0%Consist ComplianceAM Peak 99.2%99.0%(Percent of trains where the
AM Reverse Peak 100.0%99.0%number of seats providedPM Peak 99.8%99.0%was greater than or equal
Total Peak 99.5%99.0%to the required number ofOff Peak Weekday 100.0%100.0%100.0%100.0%99.0%seats per loading standards)
Weekend 100.0%100.0%100.0%100.0%99.0%AM PeakHudson Line 99.7%99.0%PM Peak 100.0%99.0%AM PeakHarlem Line 99.6%99.0%PM Peak 99.7%99.0%AM PeakNew Haven 98.4%99.0%PM Peak 99.7%99.0%Line
Master Page # 94 of 245 - Joint Metro-North and Long Island Committees Meeting 10/18/2021________________________________________________________________________________
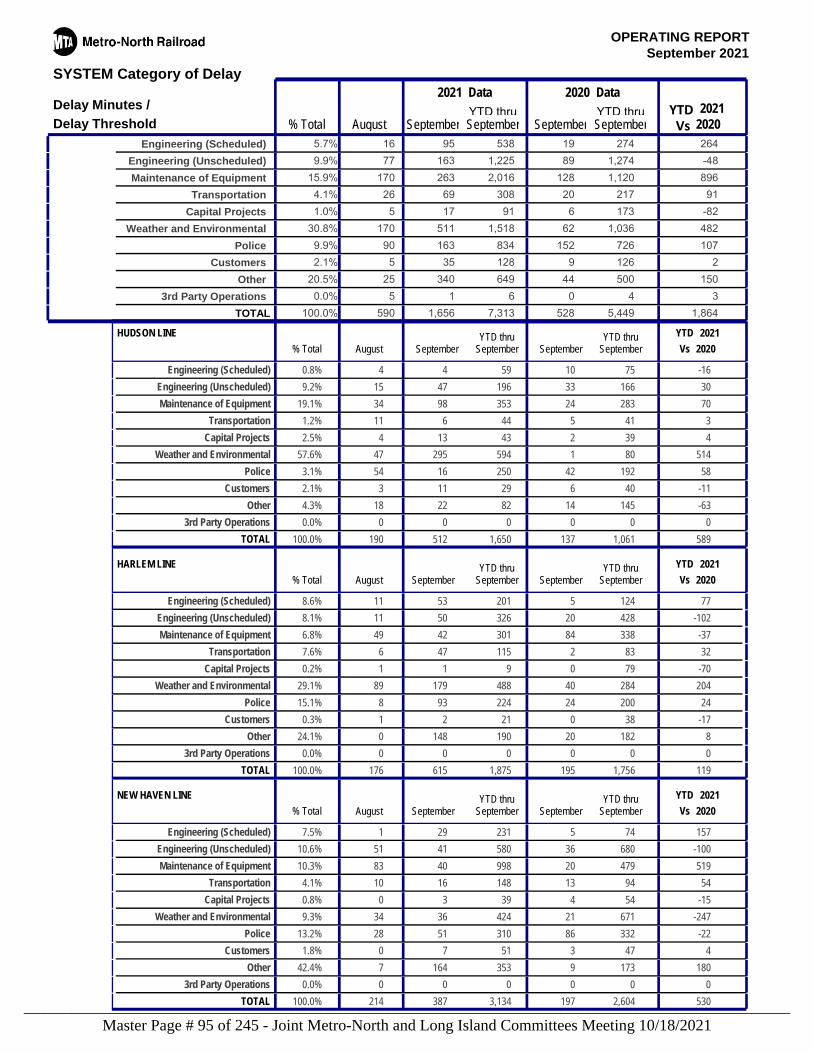
September 2021OPERATING REPORT
SYSTEM Category of Delay
YTD thru YTD thru% Total August September September September September
2021 Data 2020 Data
20202021YTD
Vs
Delay Minutes /Delay Threshold
Engineering (Scheduled) 16 95 538 19 2745.7% 264Engineering (Unscheduled) 77 163 1,225 89 1,2749.9% -48Maintenance of Equipment 170 263 2,016 128 1,12015.9% 896
Transportation 26 69 308 20 2174.1% 91Capital Projects 5 17 91 6 1731.0% -82
Weather and Environmental 170 511 1,518 62 1,03630.8% 482Police 90 163 834 152 7269.9% 107
Customers 5 35 128 9 1262.1% 2Other 25 340 649 44 50020.5% 150
3rd Party Operations 5 1 6 0 40.0% 31,656590 7,313 528 5,449 1,864100.0%TOTAL
HUDSON LINE YTD thru YTD thru% Total August September September September September 2020
2021YTDVs
Engineering (Scheduled) 4 4 59 10 750.8% -16
Engineering (Unscheduled) 15 47 196 33 1669.2% 30
Maintenance of Equipment 34 98 353 24 28319.1% 70
Transportation 11 6 44 5 411.2% 3
Capital Projects 4 13 43 2 392.5% 4
Weather and Environmental 47 295 594 1 8057.6% 514
Police 54 16 250 42 1923.1% 58
Customers 3 11 29 6 402.1% -11
Other 18 22 82 14 1454.3% -63
3rd Party Operations 0 0 0 0 00.0% 0
512190 1,650 137 1,061 589100.0%TOTAL
HARLEM LINE YTD thru YTD thru% Total August September September September September 2020
2021YTDVs
Engineering (Scheduled) 11 53 201 5 1248.6% 77
Engineering (Unscheduled) 11 50 326 20 4288.1% -102
Maintenance of Equipment 49 42 301 84 3386.8% -37
Transportation 6 47 115 2 837.6% 32
Capital Projects 1 1 9 0 790.2% -70
Weather and Environmental 89 179 488 40 28429.1% 204
Police 8 93 224 24 20015.1% 24
Customers 1 2 21 0 380.3% -17
Other 0 148 190 20 18224.1% 8
3rd Party Operations 0 0 0 0 00.0% 0
615176 1,875 195 1,756 119100.0%TOTAL
NEW HAVEN LINE YTD thru YTD thru% Total August September September September September 2020
2021YTDVs
Engineering (Scheduled) 1 29 231 5 747.5% 157
Engineering (Unscheduled) 51 41 580 36 68010.6% -100
Maintenance of Equipment 83 40 998 20 47910.3% 519
Transportation 10 16 148 13 944.1% 54
Capital Projects 0 3 39 4 540.8% -15
Weather and Environmental 34 36 424 21 6719.3% -247
Police 28 51 310 86 33213.2% -22
Customers 0 7 51 3 471.8% 4
Other 7 164 353 9 17342.4% 180
3rd Party Operations 0 0 0 0 00.0% 0
387214 3,134 197 2,604 530100.0%TOTAL
Master Page # 95 of 245 - Joint Metro-North and Long Island Committees Meeting 10/18/2021________________________________________________________________________________
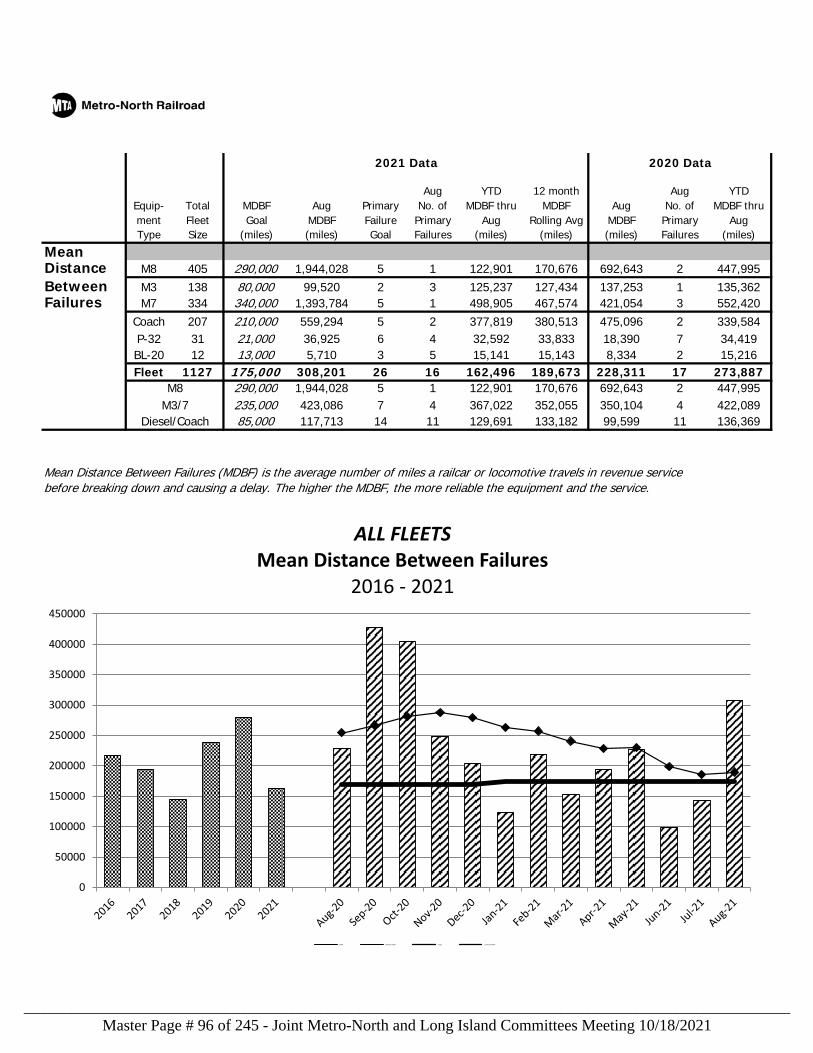
Aug YTD 12 month Aug YTDEquip- Total MDBF Aug Primary No. of MDBF thru MDBF Aug No. of MDBF thrument Fleet Goal MDBF Failure Primary Aug Rolling Avg MDBF Primary AugType Size (miles) (miles) Goal Failures (miles) (miles) (miles) Failures (miles)
MeanDistance M8 405 290,000 1,944,028 5 1 122,901 170,676 692,643 2 447,995Between M3 138 80,000 99,520 2 3 125,237 127,434 137,253 1 135,362Failures M7 334 340,000 1,393,784 5 1 498,905 467,574 421,054 3 552,420
Coach 207 210,000 559,294 5 2 377,819 380,513 475,096 2 339,584P-32 31 21,000 36,925 6 4 32,592 33,833 18,390 7 34,419BL-20 12 13,000 5,710 3 5 15,141 15,143 8,334 2 15,216Fleet 1127 175,000 308,201 26 16 162,496 189,673 228,311 17 273,887
290,000 1,944,028 5 1 122,901 170,676 692,643 2 447,995235,000 423,086 7 4 367,022 352,055 350,104 4 422,08985,000 117,713 14 11 129,691 133,182 99,599 11 136,369
Mean Distance Between Failures (MDBF) is the average number of miles a railcar or locomotive travels in revenue servicebefore breaking down and causing a delay. The higher the MDBF, the more reliable the equipment and the service.
Diesel/Coach
2021 Data 2020 Data
M3/7M8
0
50000
100000
150000
200000
250000
300000
350000
400000
450000
ALL FLEETSMean Distance Between Failures
2016 ‐ 2021
MDBF Monthly MDBF Target 12 Month MDBF
Master Page # 96 of 245 - Joint Metro-North and Long Island Committees Meeting 10/18/2021________________________________________________________________________________
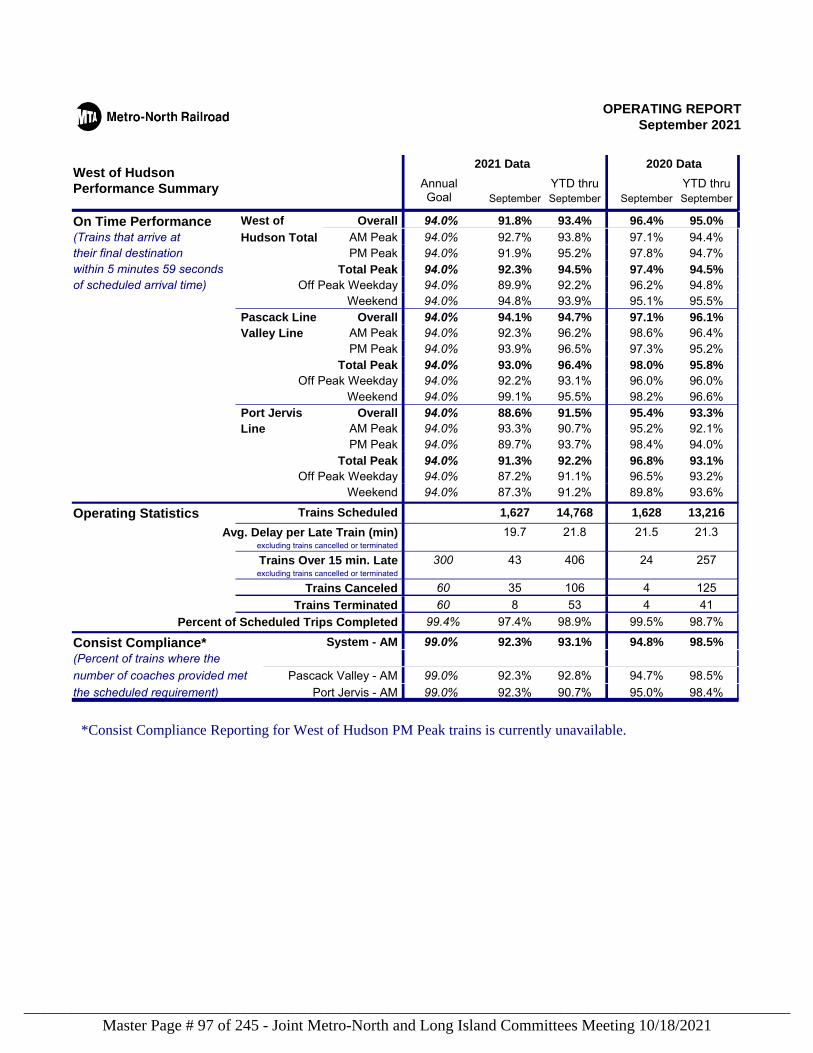
September 2021OPERATING REPORT
Performance Summary
2021 Data 2020 DataAnnualGoal September SeptemberSeptember September
YTD thru YTD thruWest of Hudson
Overall 95.0%96.4%93.4%91.8%94.0%On Time Performance West of
*Consist Compliance Reporting for West of Hudson PM Peak trains is currently unavailable.
PM Peak 94.7%97.8%95.2%91.9%94.0%their final destinationTotal Peak 94.5%97.4%94.5%92.3%94.0%within 5 minutes 59 seconds
Off Peak Weekday 94.8%96.2%92.2%89.9%94.0%of scheduled arrival time)Weekend 95.5%95.1%93.9%94.8%94.0%
OverallPascack Line 96.1%97.1%94.7%94.1%94.0%AM Peak 96.4%98.6%96.2%92.3%94.0%Valley LinePM Peak 95.2%97.3%96.5%93.9%94.0%
Total Peak 95.8%98.0%96.4%93.0%94.0%Off Peak Weekday 96.0%96.0%93.1%92.2%94.0%
Weekend 96.6%98.2%95.5%99.1%94.0%
AM Peak 94.4%97.1%93.8%92.7%94.0%(Trains that arrive at Hudson Total
OverallPort Jervis 93.3%95.4%91.5%88.6%94.0%AM Peak 92.1%95.2%90.7%93.3%94.0%LinePM Peak 94.0%98.4%93.7%89.7%94.0%
Total Peak 93.1%96.8%92.2%91.3%94.0%Off Peak Weekday 93.2%96.5%91.1%87.2%94.0%
Weekend 93.6%89.8%91.2%87.3%94.0%
13,2161,62814,768Operating Statistics 1,627Trains Scheduled21.321.521.819.7Avg. Delay per Late Train (min)
excluding trains cancelled or terminated
2572440643Trains Over 15 min. Lateexcluding trains cancelled or terminated
300
125410635Trains Canceled 60414538Trains Terminated 60
98.7%99.5%98.9%97.4%Percent of Scheduled Trips Completed 99.4%
System - AM 98.5%94.8%93.1%92.3%99.0%Consist Compliance*(Percent of trains where the
Pascack Valley - AM 98.5%94.7%92.8%92.3%99.0%number of coaches provided metPort Jervis - AM 98.4%95.0%90.7%92.3%99.0%the scheduled requirement)
Master Page # 97 of 245 - Joint Metro-North and Long Island Committees Meeting 10/18/2021________________________________________________________________________________
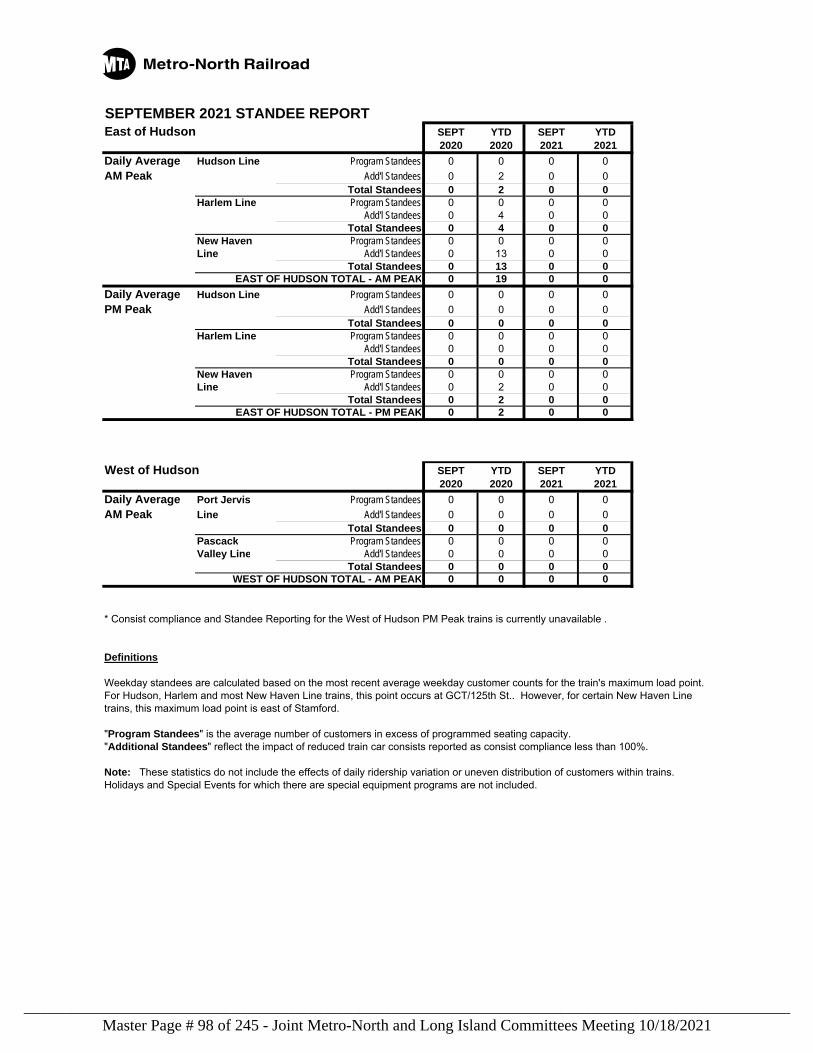
SEPTEMBER 2021 STANDEE REPORTEast of Hudson SEPT YTD SEPT YTD
2020 2020 2021 2021Daily Average Hudson Line Program Standees 0 0 0 0AM Peak Add'l Standees 0 2 0 0
Total Standees 0 2 0 0Harlem Line Program Standees 0 0 0 0
Add'l Standees 0 4 0 0Total Standees 0 4 0 0
New Haven Program Standees 0 0 0 0 Line Add'l Standees 0 13 0 0 Total Standees 0 13 0 0
EAST OF HUDSON TOTAL - AM PEAK 0 19 0 0Daily Average Hudson Line Program Standees 0 0 0 0PM Peak Add'l Standees 0 0 0 0
Total Standees 0 0 0 0Harlem Line Program Standees 0 0 0 0
Add'l Standees 0 0 0 0Total Standees 0 0 0 0
New Haven Program Standees 0 0 0 0 Line Add'l Standees 0 2 0 0 Total Standees 0 2 0 0
EAST OF HUDSON TOTAL - PM PEAK 0 2 0 0
West of Hudson SEPT YTD SEPT YTD2020 2020 2021 2021
Daily Average Port Jervis Program Standees 0 0 0 0AM Peak Line Add'l Standees 0 0 0 0
Total Standees 0 0 0 0Pascack Program Standees 0 0 0 0Valley Line Add'l Standees 0 0 0 0
Total Standees 0 0 0 0WEST OF HUDSON TOTAL - AM PEAK 0 0 0 0
* Consist compliance and Standee Reporting for the West of Hudson PM Peak trains is currently unavailable .
Definitions
Weekday standees are calculated based on the most recent average weekday customer counts for the train's maximum load point. For Hudson, Harlem and most New Haven Line trains, this point occurs at GCT/125th St.. However, for certain New Haven Line trains, this maximum load point is east of Stamford.
"Program Standees" is the average number of customers in excess of programmed seating capacity."Additional Standees" reflect the impact of reduced train car consists reported as consist compliance less than 100%.
Note: These statistics do not include the effects of daily ridership variation or uneven distribution of customers within trains. Holidays and Special Events for which there are special equipment programs are not included.
Master Page # 98 of 245 - Joint Metro-North and Long Island Committees Meeting 10/18/2021________________________________________________________________________________
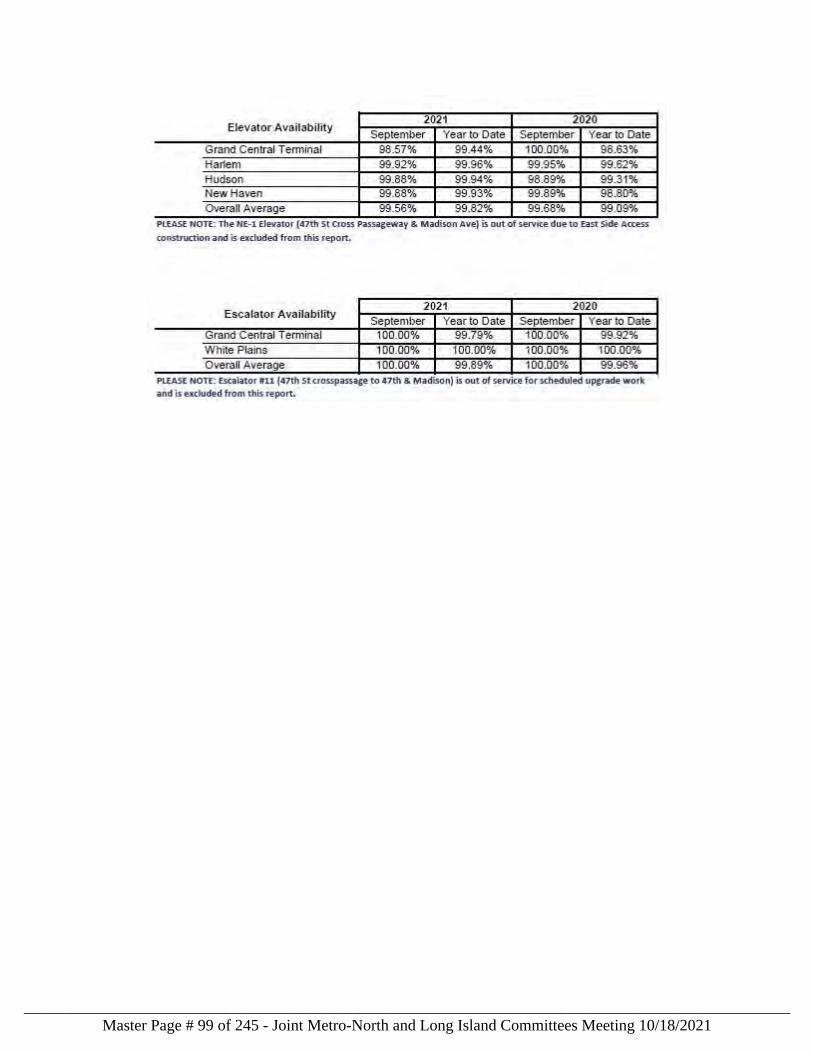
Master Page # 99 of 245 - Joint Metro-North and Long Island Committees Meeting 10/18/2021________________________________________________________________________________
Performance Metrics Report
Master Page # 100 of 245 - Joint Metro-North and Long Island Committees Meeting 10/18/2021________________________________________________________________________________
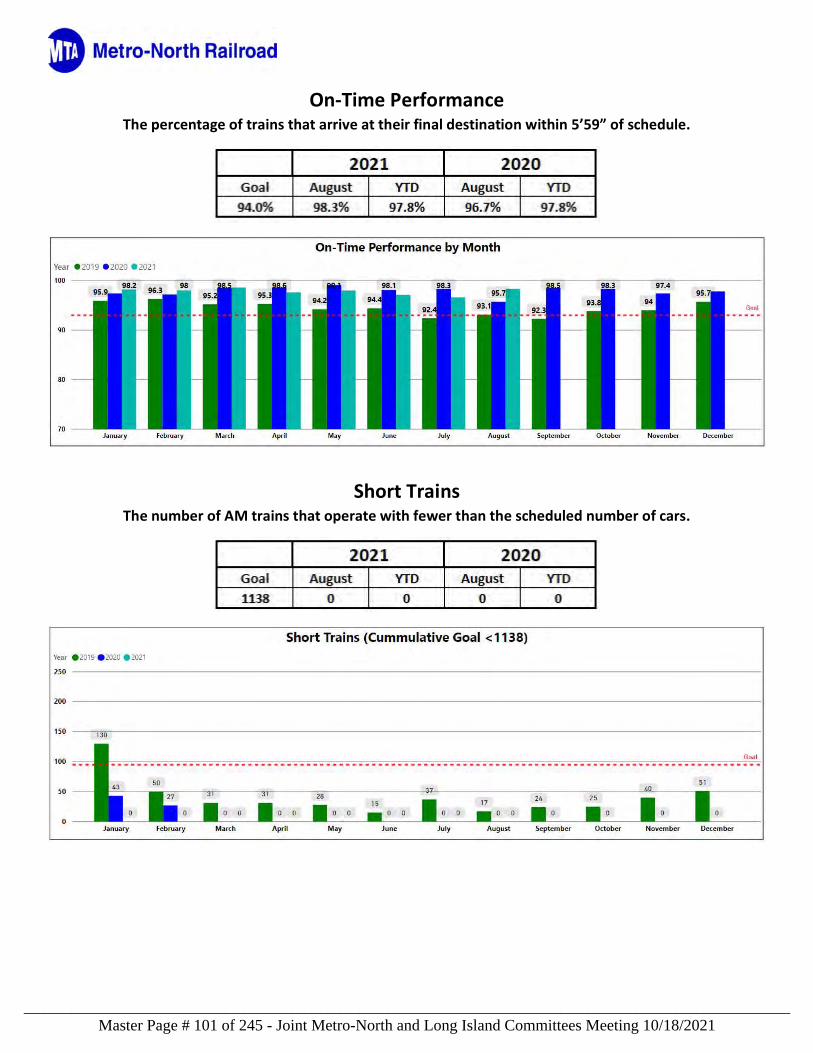
On-Time Performance The percentage of trains that arrive at their final destination within 5’59” of schedule.
Short Trains The number of AM trains that operate with fewer than the scheduled number of cars.
Master Page # 101 of 245 - Joint Metro-North and Long Island Committees Meeting 10/18/2021________________________________________________________________________________
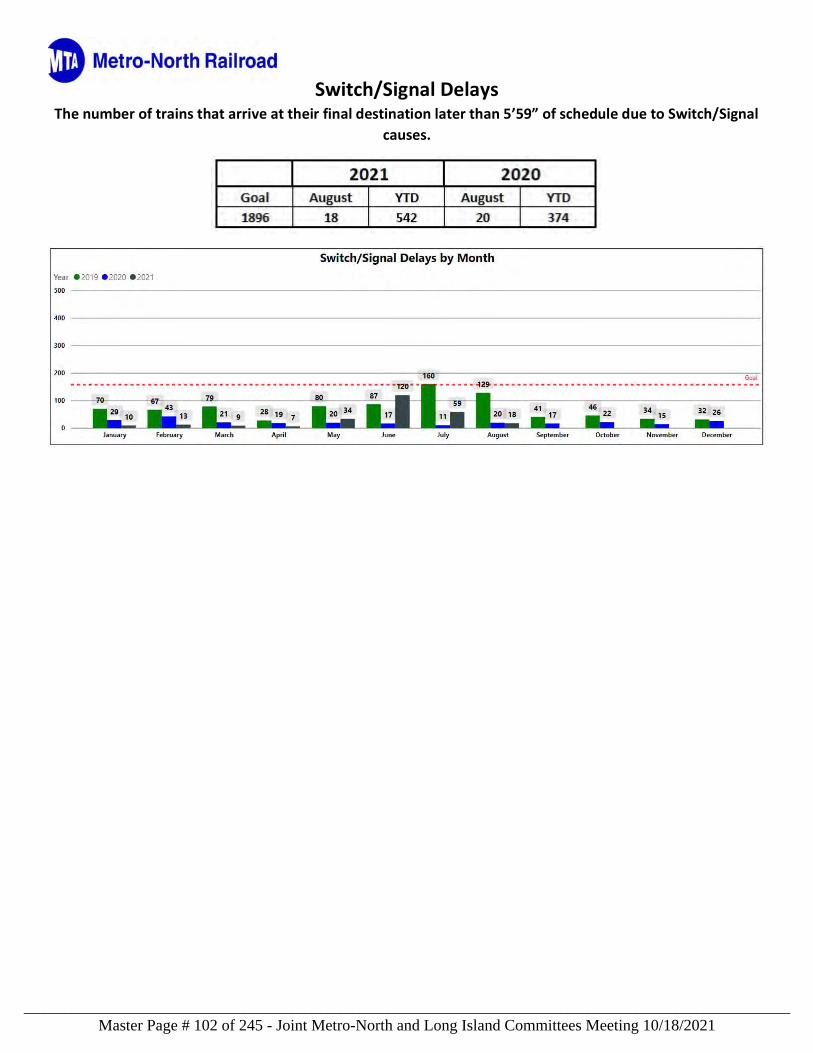
Switch/Signal Delays
The number of trains that arrive at their final destination later than 5’59” of schedule due to Switch/Signal causes.
Master Page # 102 of 245 - Joint Metro-North and Long Island Committees Meeting 10/18/2021________________________________________________________________________________
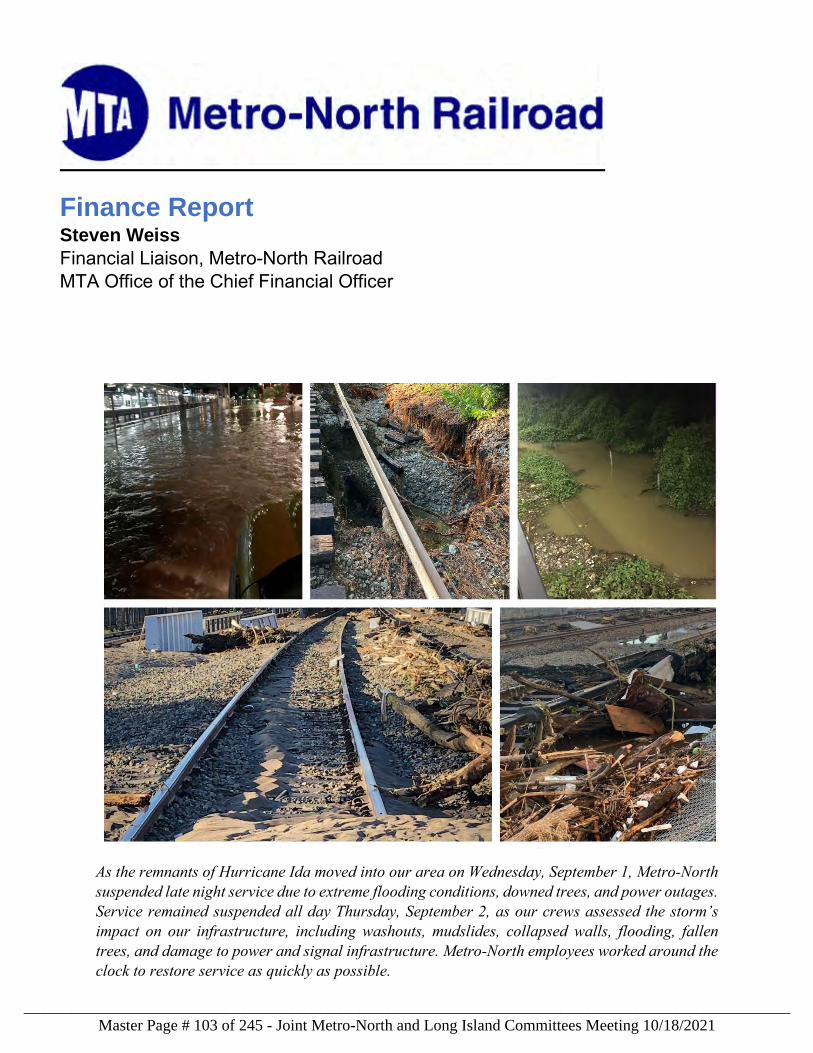
Finance Report Steven Weiss Financial Liaison, Metro-North Railroad MTA Office of the Chief Financial Officer
As the remnants of Hurricane Ida moved into our area on Wednesday, September 1, Metro-North suspended late night service due to extreme flooding conditions, downed trees, and power outages. Service remained suspended all day Thursday, September 2, as our crews assessed the storm’s impact on our infrastructure, including washouts, mudslides, collapsed walls, flooding, fallen trees, and damage to power and signal infrastructure. Metro-North employees worked around the clock to restore service as quickly as possible.
Master Page # 103 of 245 - Joint Metro-North and Long Island Committees Meeting 10/18/2021________________________________________________________________________________
September 2021 Highlights: Financial Report The Metro-North Railroad’s Monthly Financial Report provides year-to-date fiscal information comparing actual revenues, expenses and staffing levels to the Mid-Year Forecast (Forecast) and key financial performance indicators.
Summary of Non-Reimbursable Year-to-Date (YTD) September 2021 Financial Results
Ridership and accrual results, versus the Forecast, are summarized as follows:
• Ridership of 20.2 million was 7.6% unfavorable vs. 2020 and 68.7% unfavorable vs. 2019 pre-COVID levels. Ridership was 5.3% favorable vs. Forecast primarily due to higher non-commutation ridership. Consequently, farebox revenue of $170.9 million was $6.4 million higher than Forecast.
• Total revenue of $186.6 million was $0.5 million or 0.3% higher vs. Forecast primarily due to higher farebox revenue partially offset by lower advertising, GCT retail, and parking revenue.
• Total expenses of $966.1 million were $10.1 million or 1.0% favorable vs. Forecast primarily due to the timing of expenses for maintenance and engineering services.
Financial results for Year-to-Date (YTD) September 2021 are presented in the table below and compared to the Mid-Year Forecast.
Steven Weiss Financial Liaison, Metro-North Railroad MTA Office of the Chief Financial Officer
MidyearForecast Actual $ Var % Var
Total Revenue $186.1 $186.6 $0.5 0.3%
Total Expenses before Non-Cash Liability Adjs. 976.2 966.1 10.1 1.0%
Operating Surplus/(Deficit) (790.1) (779.5) 10.6 1.3%
Other Non-Cash Liabilities 218.5 208.7 9.9 4.5%
Net Surplus/(Deficit) after Non-Cash Liability Adjs. (1,008.7) (988.1) 20.5 2.0%
Cash Adjustments 158.5 201.8 43.2 27.3%
Net Cash Surplus/(Deficit) ($850.1) ($786.4) $63.8 7.5%
September 2021 Year-to-Date Results($ in Millions)
Fav/(Unfav) Variance
MTA Metro-North Railroad
Master Page # 104 of 245 - Joint Metro-North and Long Island Committees Meeting 10/18/2021________________________________________________________________________________
NON-REIMBURSABLE and REIMBURSABLE SUMMARY
September 2021 YTD Net Deficit (Non-Reimbursable and Reimbursable) of $988.1 million was $20.5 million or 2.0% favorable vs. the Forecast.
Major drivers of the September 2021 YTD favorable result of $20.5 million include lower Non-Reimbursable Expenses of $20.0 million primarily due to timing of maintenance and engineering services and lower non-cash liability adjustments. Non-Reimbursable Revenues were favorable by $0.5 million, primarily due to higher farebox farebox revenue partially offset by lower advertising, GCT retail, and parking revenue.
September 2021 YTD Reimbursable Expenses of $181.6 million were $33.0 million favorable vs. the Forecast primarily due to the timing of several projects including the Signal Replacement from Greenwich to South Norwalk, Connecticut Track Program, Positive Train Control, Bridge Timbers Installation and other various projects.
REVENUE/RIDERSHIP
• Farebox Revenue – YTD results were $6.4 million higher vs. the Forecast primarily due to higher East of Hudson non-commutation ridership.
YTD Ridership of 20.2 million was 5.3% favorable vs. the Forecast, 7.6% unfavorable vs 2020 and 68.7% unfavorable vs pre-COVID 2019 levels.
• Other Operating Revenue – YTD was $5.8 million unfavorable vs. the Forecast primarily due to lower advertising, GCT retail, and parking revenue.
• Capital and Other Reimbursements – YTD was $33.0 million or 15.4% unfavorable vs. the Forecast primarily due to scheduling and timing changes noted above.
TOTAL EXPENSES (Non-Reimbursable and Reimbursable)
Total Expenses – YTD expenses of $1,356.4 million were $53.0 million or 3.8% favorable vs. the Forecast.
Labor Expenses (including fringes and overhead recoveries) of $840.2 million YTD were $19.5 million favorable vs. the Forecast.
• Payroll – YTD was $10.0 million favorable vs. the Forecast primarily due to lower train and engine crew payments as well timing of hiring of vacant positions and higher attrition due to retirements and resignations.
• Overtime – YTD was $6.7 million favorable vs. the Forecast primarily due to revised crew needs in Transportation.
Non–Labor Expenses of $307.5 million YTD were $23.5 million favorable vs. the Forecast.
• Electric Power – YTD results were $3.4 million unfavorable vs. the Forecast primarily due to higher rates partially offset by lower usage.
• Fuel – YTD expenses were $0.4 million favorable vs. the Forecast primarily due to lower usage partially offset by higher rates.
• Maintenance & Other Operating Contracts – YTD was $11.7 million favorable vs. the Forecast due to the timing of Reimbursable project activity as well as Non-Reimbursable expenses for BL-20 locomotive overhauls, infrastructure maintenance, and miscellaneous maintenance and operating contracts, and a mid-year true-up for MTA Police Allocations partially offset by the timing of COVID-19 cleaning invoices.
• Professional Services – YTD was $18.4 million favorable vs. the Forecast due to the timing of Reimbursable project activity and Non-Reimbursable expenses for consulting and engineering services.
Master Page # 105 of 245 - Joint Metro-North and Long Island Committees Meeting 10/18/2021________________________________________________________________________________
• Materials & Supplies – YTD was $0.6 million unfavorable vs. the Forecast due to higher Reimbursable project activity partially offset by the timing of rolling stock maintenance events as well as lower rolling stock material usage.
• Other Business Expenses – YTD was $2.4 million unfavorable vs. the Forecast primarily due to higher subsidy payments to New Jersey Transit and higher credit card processing fees.
Depreciation and Other Non-Cash Liability Adjustments – YTD were $9.9 million favorable vs. Forecast.
CASH DEFICIT SUMMARY
September YTD Net Cash Deficit of $786.4 million was $63.8 million or 7.5% favorable to the Forecast primarily due to the timing of expenditures for several categories.
FINANCIAL PERFORMANCE MEASURES
• Adjusted Farebox Operating Ratio of 20.6% was 0.6 percentage points favorable vs. the Forecast.
• Adjusted Cost per Passenger of $46.01 was $3.65 favorable vs. the Forecast. • Revenue per Passenger of $8.45 was $0.12 unfavorable vs. the Forecast.
Master Page # 106 of 245 - Joint Metro-North and Long Island Committees Meeting 10/18/2021________________________________________________________________________________
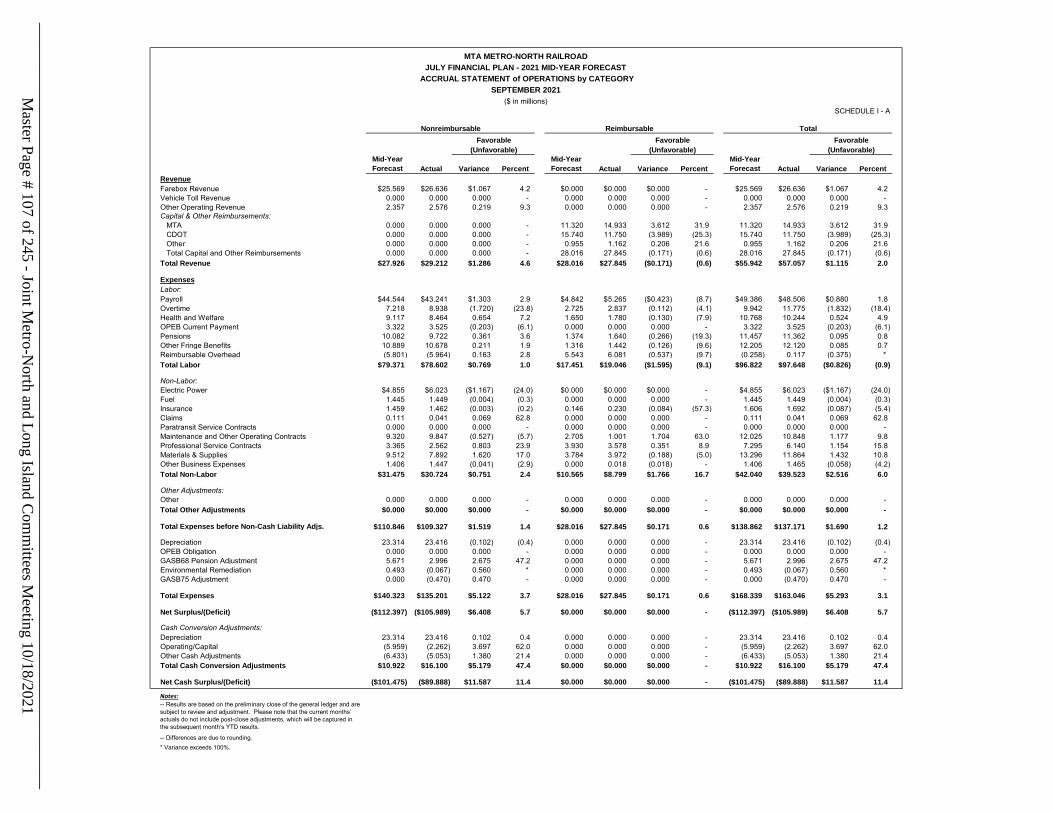
Mid-Year Forecast Actual Variance Percent
Mid-Year Forecast Actual Variance Percent
Mid-Year Forecast Actual Variance Percent
RevenueFarebox Revenue $25.569 $26.636 $1.067 4.2 $0.000 $0.000 $0.000 - $25.569 $26.636 $1.067 4.2Vehicle Toll Revenue 0.000 0.000 0.000 - 0.000 0.000 0.000 - 0.000 0.000 0.000 - Other Operating Revenue 2.357 2.576 0.219 9.3 0.000 0.000 0.000 - 2.357 2.576 0.219 9.3Capital & Other Reimbursements: MTA 0.000 0.000 0.000 - 11.320 14.933 3.612 31.9 11.320 14.933 3.612 31.9 CDOT 0.000 0.000 0.000 - 15.740 11.750 (3.989) (25.3) 15.740 11.750 (3.989) (25.3) Other 0.000 0.000 0.000 - 0.955 1.162 0.206 21.6 0.955 1.162 0.206 21.6 Total Capital and Other Reimbursements 0.000 0.000 0.000 - 28.016 27.845 (0.171) (0.6) 28.016 27.845 (0.171) (0.6)Total Revenue $27.926 $29.212 $1.286 4.6 $28.016 $27.845 ($0.171) (0.6) $55.942 $57.057 $1.115 2.0
ExpensesLabor:Payroll $44.544 $43.241 $1.303 2.9 $4.842 $5.265 ($0.423) (8.7) $49.386 $48.506 $0.880 1.8Overtime 7.218 8.938 (1.720) (23.8) 2.725 2.837 (0.112) (4.1) 9.942 11.775 (1.832) (18.4)Health and Welfare 9.117 8.464 0.654 7.2 1.650 1.780 (0.130) (7.9) 10.768 10.244 0.524 4.9OPEB Current Payment 3.322 3.525 (0.203) (6.1) 0.000 0.000 0.000 - 3.322 3.525 (0.203) (6.1)Pensions 10.082 9.722 0.361 3.6 1.374 1.640 (0.266) (19.3) 11.457 11.362 0.095 0.8Other Fringe Benefits 10.889 10.678 0.211 1.9 1.316 1.442 (0.126) (9.6) 12.205 12.120 0.085 0.7Reimbursable Overhead (5.801) (5.964) 0.163 2.8 5.543 6.081 (0.537) (9.7) (0.258) 0.117 (0.375) * Total Labor $79.371 $78.602 $0.769 1.0 $17.451 $19.046 ($1.595) (9.1) $96.822 $97.648 ($0.826) (0.9)
Non-Labor:Electric Power $4.855 $6.023 ($1.167) (24.0) $0.000 $0.000 $0.000 - $4.855 $6.023 ($1.167) (24.0)Fuel 1.445 1.449 (0.004) (0.3) 0.000 0.000 0.000 - 1.445 1.449 (0.004) (0.3)Insurance 1.459 1.462 (0.003) (0.2) 0.146 0.230 (0.084) (57.3) 1.606 1.692 (0.087) (5.4)Claims 0.111 0.041 0.069 62.8 0.000 0.000 0.000 - 0.111 0.041 0.069 62.8Paratransit Service Contracts 0.000 0.000 0.000 - 0.000 0.000 0.000 - 0.000 0.000 0.000 - Maintenance and Other Operating Contracts 9.320 9.847 (0.527) (5.7) 2.705 1.001 1.704 63.0 12.025 10.848 1.177 9.8Professional Service Contracts 3.365 2.562 0.803 23.9 3.930 3.578 0.351 8.9 7.295 6.140 1.154 15.8Materials & Supplies 9.512 7.892 1.620 17.0 3.784 3.972 (0.188) (5.0) 13.296 11.864 1.432 10.8Other Business Expenses 1.406 1.447 (0.041) (2.9) 0.000 0.018 (0.018) - 1.406 1.465 (0.058) (4.2)Total Non-Labor $31.475 $30.724 $0.751 2.4 $10.565 $8.799 $1.766 16.7 $42.040 $39.523 $2.516 6.0
Other Adjustments:Other 0.000 0.000 0.000 - 0.000 0.000 0.000 - 0.000 0.000 0.000 - Total Other Adjustments $0.000 $0.000 $0.000 - $0.000 $0.000 $0.000 - $0.000 $0.000 $0.000 -
Total Expenses before Non-Cash Liability Adjs. $110.846 $109.327 $1.519 1.4 $28.016 $27.845 $0.171 0.6 $138.862 $137.171 $1.690 1.2
Depreciation 23.314 23.416 (0.102) (0.4) 0.000 0.000 0.000 - 23.314 23.416 (0.102) (0.4)OPEB Obligation 0.000 0.000 0.000 - 0.000 0.000 0.000 - 0.000 0.000 0.000 - GASB68 Pension Adjustment 5.671 2.996 2.675 47.2 0.000 0.000 0.000 - 5.671 2.996 2.675 47.2Environmental Remediation 0.493 (0.067) 0.560 * 0.000 0.000 0.000 - 0.493 (0.067) 0.560 * GASB75 Adjustment 0.000 (0.470) 0.470 - 0.000 0.000 0.000 - 0.000 (0.470) 0.470 -
Total Expenses $140.323 $135.201 $5.122 3.7 $28.016 $27.845 $0.171 0.6 $168.339 $163.046 $5.293 3.1
Net Surplus/(Deficit) ($112.397) ($105.989) $6.408 5.7 $0.000 $0.000 $0.000 - ($112.397) ($105.989) $6.408 5.7
Cash Conversion Adjustments:Depreciation 23.314 23.416 0.102 0.4 0.000 0.000 0.000 - 23.314 23.416 0.102 0.4Operating/Capital (5.959) (2.262) 3.697 62.0 0.000 0.000 0.000 - (5.959) (2.262) 3.697 62.0Other Cash Adjustments (6.433) (5.053) 1.380 21.4 0.000 0.000 0.000 - (6.433) (5.053) 1.380 21.4Total Cash Conversion Adjustments $10.922 $16.100 $5.179 47.4 $0.000 $0.000 $0.000 - $10.922 $16.100 $5.179 47.4
Net Cash Surplus/(Deficit) ($101.475) ($89.888) $11.587 11.4 $0.000 $0.000 $0.000 - ($101.475) ($89.888) $11.587 11.4
Notes:-- Results are based on the preliminary close of the general ledger and are subject to review and adjustment. Please note that the current months’ actuals do not include post-close adjustments, which will be captured in the subsequent month’s YTD results.
-- Differences are due to rounding.* Variance exceeds 100%.
SCHEDULE I - A
ACCRUAL STATEMENT of OPERATIONS by CATEGORY
MTA METRO-NORTH RAILROADJULY FINANCIAL PLAN - 2021 MID-YEAR FORECAST
SEPTEMBER 2021($ in millions)
Favorable(Unfavorable)
TotalNonreimbursableFavorable
(Unfavorable)
ReimbursableFavorable
(Unfavorable)
Master Page # 107 of 245 - Joint M
etro-North and Long Island C
omm
ittees Meeting 10/18/2021
________________________________________________________________________________
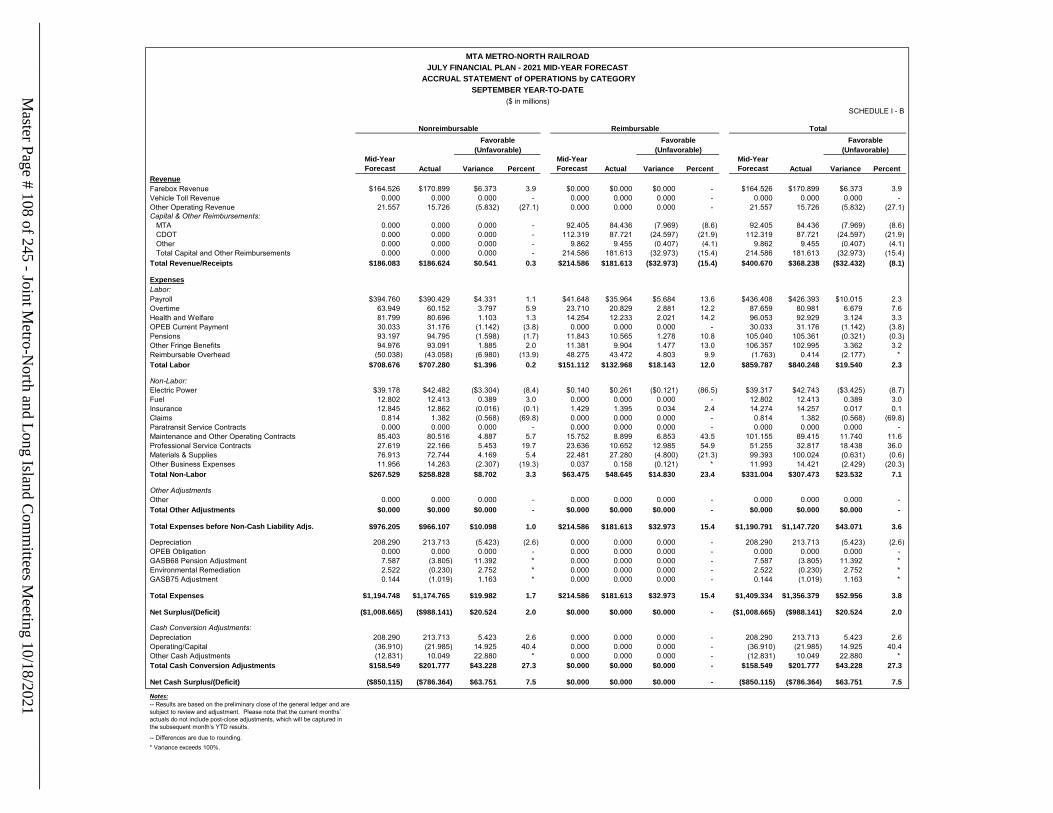
Mid-Year Forecast Actual Variance Percent
Mid-Year Forecast Actual Variance Percent
Mid-Year Forecast Actual Variance Percent
RevenueFarebox Revenue $164.526 $170.899 $6.373 3.9 $0.000 $0.000 $0.000 - $164.526 $170.899 $6.373 3.9Vehicle Toll Revenue 0.000 0.000 0.000 - 0.000 0.000 0.000 - 0.000 0.000 0.000 - Other Operating Revenue 21.557 15.726 (5.832) (27.1) 0.000 0.000 0.000 - 21.557 15.726 (5.832) (27.1)Capital & Other Reimbursements: MTA 0.000 0.000 0.000 - 92.405 84.436 (7.969) (8.6) 92.405 84.436 (7.969) (8.6) CDOT 0.000 0.000 0.000 - 112.319 87.721 (24.597) (21.9) 112.319 87.721 (24.597) (21.9) Other 0.000 0.000 0.000 - 9.862 9.455 (0.407) (4.1) 9.862 9.455 (0.407) (4.1) Total Capital and Other Reimbursements 0.000 0.000 0.000 - 214.586 181.613 (32.973) (15.4) 214.586 181.613 (32.973) (15.4)Total Revenue/Receipts $186.083 $186.624 $0.541 0.3 $214.586 $181.613 ($32.973) (15.4) $400.670 $368.238 ($32.432) (8.1)
ExpensesLabor:Payroll $394.760 $390.429 $4.331 1.1 $41.648 $35.964 $5.684 13.6 $436.408 $426.393 $10.015 2.3Overtime 63.949 60.152 3.797 5.9 23.710 20.829 2.881 12.2 87.659 80.981 6.679 7.6Health and Welfare 81.799 80.696 1.103 1.3 14.254 12.233 2.021 14.2 96.053 92.929 3.124 3.3OPEB Current Payment 30.033 31.176 (1.142) (3.8) 0.000 0.000 0.000 - 30.033 31.176 (1.142) (3.8)Pensions 93.197 94.795 (1.598) (1.7) 11.843 10.565 1.278 10.8 105.040 105.361 (0.321) (0.3)Other Fringe Benefits 94.976 93.091 1.885 2.0 11.381 9.904 1.477 13.0 106.357 102.995 3.362 3.2Reimbursable Overhead (50.038) (43.058) (6.980) (13.9) 48.275 43.472 4.803 9.9 (1.763) 0.414 (2.177) * Total Labor $708.676 $707.280 $1.396 0.2 $151.112 $132.968 $18.143 12.0 $859.787 $840.248 $19.540 2.3
Non-Labor:Electric Power $39.178 $42.482 ($3.304) (8.4) $0.140 $0.261 ($0.121) (86.5) $39.317 $42.743 ($3.425) (8.7)Fuel 12.802 12.413 0.389 3.0 0.000 0.000 0.000 - 12.802 12.413 0.389 3.0Insurance 12.845 12.862 (0.016) (0.1) 1.429 1.395 0.034 2.4 14.274 14.257 0.017 0.1Claims 0.814 1.382 (0.568) (69.8) 0.000 0.000 0.000 - 0.814 1.382 (0.568) (69.8)Paratransit Service Contracts 0.000 0.000 0.000 - 0.000 0.000 0.000 - 0.000 0.000 0.000 - Maintenance and Other Operating Contracts 85.403 80.516 4.887 5.7 15.752 8.899 6.853 43.5 101.155 89.415 11.740 11.6Professional Service Contracts 27.619 22.166 5.453 19.7 23.636 10.652 12.985 54.9 51.255 32.817 18.438 36.0Materials & Supplies 76.913 72.744 4.169 5.4 22.481 27.280 (4.800) (21.3) 99.393 100.024 (0.631) (0.6)Other Business Expenses 11.956 14.263 (2.307) (19.3) 0.037 0.158 (0.121) * 11.993 14.421 (2.429) (20.3)Total Non-Labor $267.529 $258.828 $8.702 3.3 $63.475 $48.645 $14.830 23.4 $331.004 $307.473 $23.532 7.1
Other AdjustmentsOther 0.000 0.000 0.000 - 0.000 0.000 0.000 - 0.000 0.000 0.000 - Total Other Adjustments $0.000 $0.000 $0.000 - $0.000 $0.000 $0.000 - $0.000 $0.000 $0.000 -
Total Expenses before Non-Cash Liability Adjs. $976.205 $966.107 $10.098 1.0 $214.586 $181.613 $32.973 15.4 $1,190.791 $1,147.720 $43.071 3.6
Depreciation 208.290 213.713 (5.423) (2.6) 0.000 0.000 0.000 - 208.290 213.713 (5.423) (2.6)OPEB Obligation 0.000 0.000 0.000 - 0.000 0.000 0.000 - 0.000 0.000 0.000 - GASB68 Pension Adjustment 7.587 (3.805) 11.392 * 0.000 0.000 0.000 - 7.587 (3.805) 11.392 * Environmental Remediation 2.522 (0.230) 2.752 * 0.000 0.000 0.000 - 2.522 (0.230) 2.752 * GASB75 Adjustment 0.144 (1.019) 1.163 * 0.000 0.000 0.000 - 0.144 (1.019) 1.163 *
Total Expenses $1,194.748 $1,174.765 $19.982 1.7 $214.586 $181.613 $32.973 15.4 $1,409.334 $1,356.379 $52.956 3.8
Net Surplus/(Deficit) ($1,008.665) ($988.141) $20.524 2.0 $0.000 $0.000 $0.000 - ($1,008.665) ($988.141) $20.524 2.0
Cash Conversion Adjustments:Depreciation 208.290 213.713 5.423 2.6 0.000 0.000 0.000 - 208.290 213.713 5.423 2.6Operating/Capital (36.910) (21.985) 14.925 40.4 0.000 0.000 0.000 - (36.910) (21.985) 14.925 40.4Other Cash Adjustments (12.831) 10.049 22.880 * 0.000 0.000 0.000 - (12.831) 10.049 22.880 * Total Cash Conversion Adjustments $158.549 $201.777 $43.228 27.3 $0.000 $0.000 $0.000 - $158.549 $201.777 $43.228 27.3
Net Cash Surplus/(Deficit) ($850.115) ($786.364) $63.751 7.5 $0.000 $0.000 $0.000 - ($850.115) ($786.364) $63.751 7.5
Notes:-- Results are based on the preliminary close of the general ledger and are subject to review and adjustment. Please note that the current months’ actuals do not include post-close adjustments, which will be captured in the subsequent month’s YTD results.
-- Differences are due to rounding.* Variance exceeds 100%.
Favorable Favorable Favorable(Unfavorable) (Unfavorable) (Unfavorable)
ACCRUAL STATEMENT of OPERATIONS by CATEGORY
($ in millions)
Nonreimbursable Reimbursable Total
MTA METRO-NORTH RAILROADJULY FINANCIAL PLAN - 2021 MID-YEAR FORECAST
SEPTEMBER YEAR-TO-DATE
SCHEDULE I - B
Master Page # 108 of 245 - Joint M
etro-North and Long Island C
omm
ittees Meeting 10/18/2021
________________________________________________________________________________
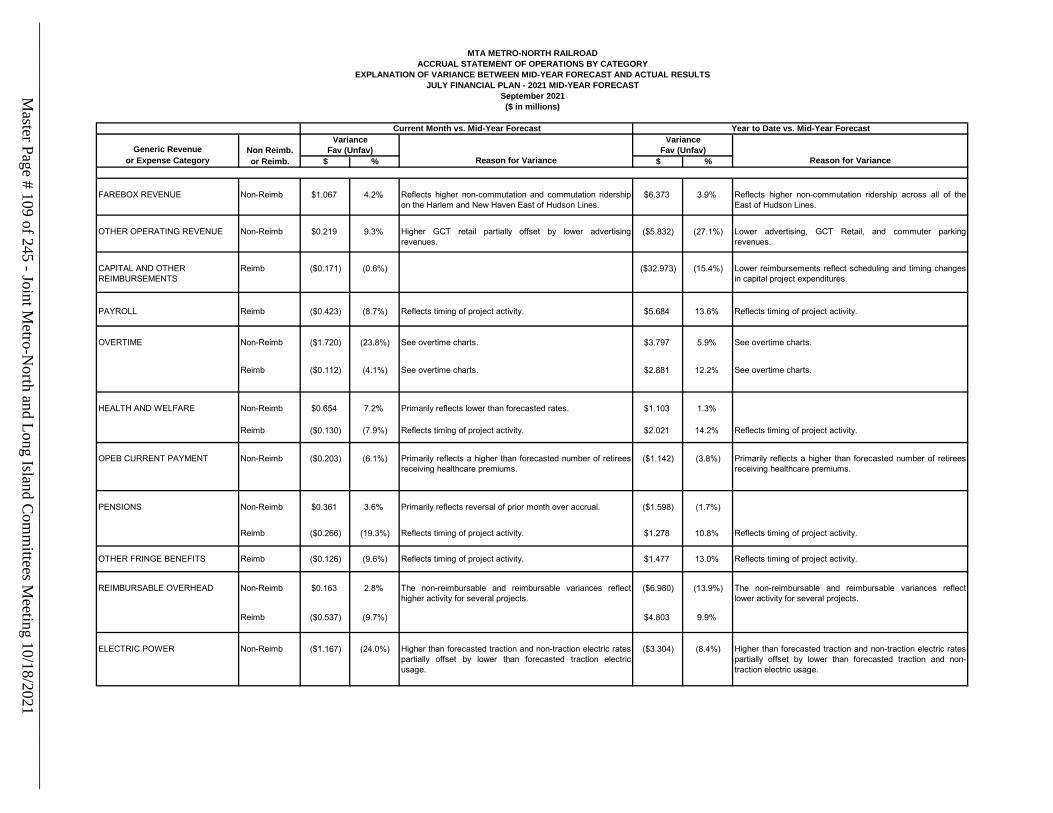
Generic Revenue Non Reimb.or Expense Category or Reimb. $ % Reason for Variance $ % Reason for Variance
FAREBOX REVENUE Non-Reimb $1.067 4.2% Reflects higher non-commutation and commutation ridershipon the Harlem and New Haven East of Hudson Lines.
$6.373 3.9% Reflects higher non-commutation ridership across all of theEast of Hudson Lines.
OTHER OPERATING REVENUE Non-Reimb $0.219 9.3% Higher GCT retail partially offset by lower advertisingrevenues.
($5.832) (27.1%) Lower advertising, GCT Retail, and commuter parkingrevenues.
CAPITAL AND OTHER REIMBURSEMENTS
Reimb ($0.171) (0.6%) ($32.973) (15.4%) Lower reimbursements reflect scheduling and timing changesin capital project expenditures.
PAYROLL Reimb ($0.423) (8.7%) Reflects timing of project activity. $5.684 13.6% Reflects timing of project activity.
OVERTIME Non-Reimb ($1.720) (23.8%) See overtime charts. $3.797 5.9% See overtime charts.
Reimb ($0.112) (4.1%) See overtime charts. $2.881 12.2% See overtime charts.
HEALTH AND WELFARE Non-Reimb $0.654 7.2% Primarily reflects lower than forecasted rates. $1.103 1.3%
Reimb ($0.130) (7.9%) Reflects timing of project activity. $2.021 14.2% Reflects timing of project activity.
OPEB CURRENT PAYMENT Non-Reimb ($0.203) (6.1%) Primarily reflects a higher than forecasted number of retireesreceiving healthcare premiums.
($1.142) (3.8%) Primarily reflects a higher than forecasted number of retireesreceiving healthcare premiums.
PENSIONS Non-Reimb $0.361 3.6% Primarily reflects reversal of prior month over accrual. ($1.598) (1.7%)
Reimb ($0.266) (19.3%) Reflects timing of project activity. $1.278 10.8% Reflects timing of project activity.
OTHER FRINGE BENEFITS Reimb ($0.126) (9.6%) Reflects timing of project activity. $1.477 13.0% Reflects timing of project activity.
REIMBURSABLE OVERHEAD Non-Reimb $0.163 2.8% The non-reimbursable and reimbursable variances reflecthigher activity for several projects.
($6.980) (13.9%) The non-reimbursable and reimbursable variances reflectlower activity for several projects.
Reimb ($0.537) (9.7%) $4.803 9.9%
ELECTRIC POWER Non-Reimb ($1.167) (24.0%) Higher than forecasted traction and non-traction electric ratespartially offset by lower than forecasted traction electricusage.
($3.304) (8.4%) Higher than forecasted traction and non-traction electric ratespartially offset by lower than forecasted traction and non-traction electric usage.
Current Month vs. Mid-Year Forecast Year to Date vs. Mid-Year ForecastVariance Variance
Fav (Unfav) Fav (Unfav)
($ in millions)
MTA METRO-NORTH RAILROADACCRUAL STATEMENT OF OPERATIONS BY CATEGORY
EXPLANATION OF VARIANCE BETWEEN MID-YEAR FORECAST AND ACTUAL RESULTSJULY FINANCIAL PLAN - 2021 MID-YEAR FORECAST
September 2021Master Page # 109 of 245 - Joint M
etro-North and Long Island C
omm
ittees Meeting 10/18/2021
________________________________________________________________________________
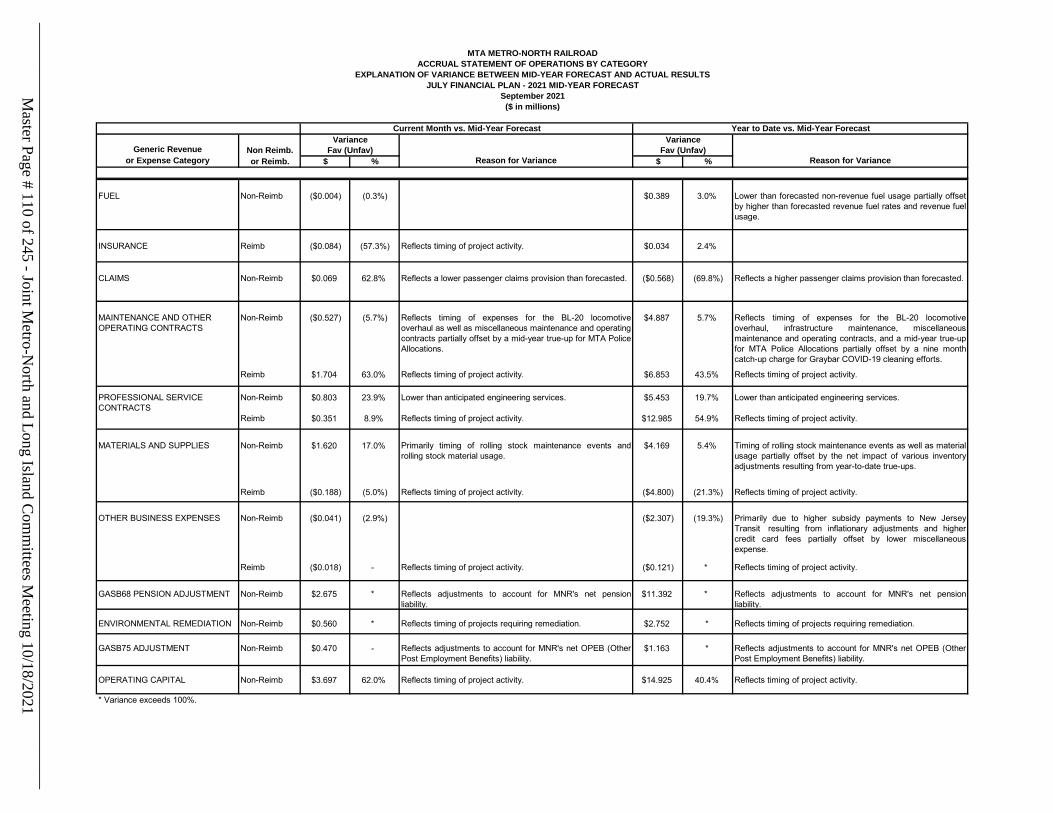
Generic Revenue Non Reimb.or Expense Category or Reimb. $ % Reason for Variance $ % Reason for Variance
Current Month vs. Mid-Year Forecast Year to Date vs. Mid-Year ForecastVariance Variance
Fav (Unfav) Fav (Unfav)
($ in millions)
MTA METRO-NORTH RAILROADACCRUAL STATEMENT OF OPERATIONS BY CATEGORY
EXPLANATION OF VARIANCE BETWEEN MID-YEAR FORECAST AND ACTUAL RESULTSJULY FINANCIAL PLAN - 2021 MID-YEAR FORECAST
September 2021
FUEL Non-Reimb ($0.004) (0.3%) $0.389 3.0% Lower than forecasted non-revenue fuel usage partially offsetby higher than forecasted revenue fuel rates and revenue fuelusage.
INSURANCE Reimb ($0.084) (57.3%) Reflects timing of project activity. $0.034 2.4%
CLAIMS Non-Reimb $0.069 62.8% Reflects a lower passenger claims provision than forecasted. ($0.568) (69.8%) Reflects a higher passenger claims provision than forecasted.
MAINTENANCE AND OTHER OPERATING CONTRACTS
Non-Reimb ($0.527) (5.7%) Reflects timing of expenses for the BL-20 locomotiveoverhaul as well as miscellaneous maintenance and operatingcontracts partially offset by a mid-year true-up for MTA PoliceAllocations.
$4.887 5.7% Reflects timing of expenses for the BL-20 locomotiveoverhaul, infrastructure maintenance, miscellaneousmaintenance and operating contracts, and a mid-year true-upfor MTA Police Allocations partially offset by a nine monthcatch-up charge for Graybar COVID-19 cleaning efforts.
Reimb $1.704 63.0% Reflects timing of project activity. $6.853 43.5% Reflects timing of project activity.
PROFESSIONAL SERVICE CONTRACTS
Non-Reimb $0.803 23.9% Lower than anticipated engineering services. $5.453 19.7% Lower than anticipated engineering services.
Reimb $0.351 8.9% Reflects timing of project activity. $12.985 54.9% Reflects timing of project activity.
MATERIALS AND SUPPLIES Non-Reimb $1.620 17.0% Primarily timing of rolling stock maintenance events androlling stock material usage.
$4.169 5.4% Timing of rolling stock maintenance events as well as materialusage partially offset by the net impact of various inventoryadjustments resulting from year-to-date true-ups.
Reimb ($0.188) (5.0%) Reflects timing of project activity. ($4.800) (21.3%) Reflects timing of project activity.
OTHER BUSINESS EXPENSES Non-Reimb ($0.041) (2.9%) ($2.307) (19.3%) Primarily due to higher subsidy payments to New JerseyTransit resulting from inflationary adjustments and highercredit card fees partially offset by lower miscellaneousexpense.
Reimb ($0.018) - Reflects timing of project activity. ($0.121) * Reflects timing of project activity.
GASB68 PENSION ADJUSTMENT Non-Reimb $2.675 * Reflects adjustments to account for MNR's net pensionliability.
$11.392 * Reflects adjustments to account for MNR's net pensionliability.
ENVIRONMENTAL REMEDIATION Non-Reimb $0.560 * Reflects timing of projects requiring remediation. $2.752 * Reflects timing of projects requiring remediation.
GASB75 ADJUSTMENT Non-Reimb $0.470 - Reflects adjustments to account for MNR's net OPEB (OtherPost Employment Benefits) liability.
$1.163 * Reflects adjustments to account for MNR's net OPEB (OtherPost Employment Benefits) liability.
OPERATING CAPITAL Non-Reimb $3.697 62.0% Reflects timing of project activity. $14.925 40.4% Reflects timing of project activity.
* Variance exceeds 100%.
Master Page # 110 of 245 - Joint M
etro-North and Long Island C
omm
ittees Meeting 10/18/2021
________________________________________________________________________________
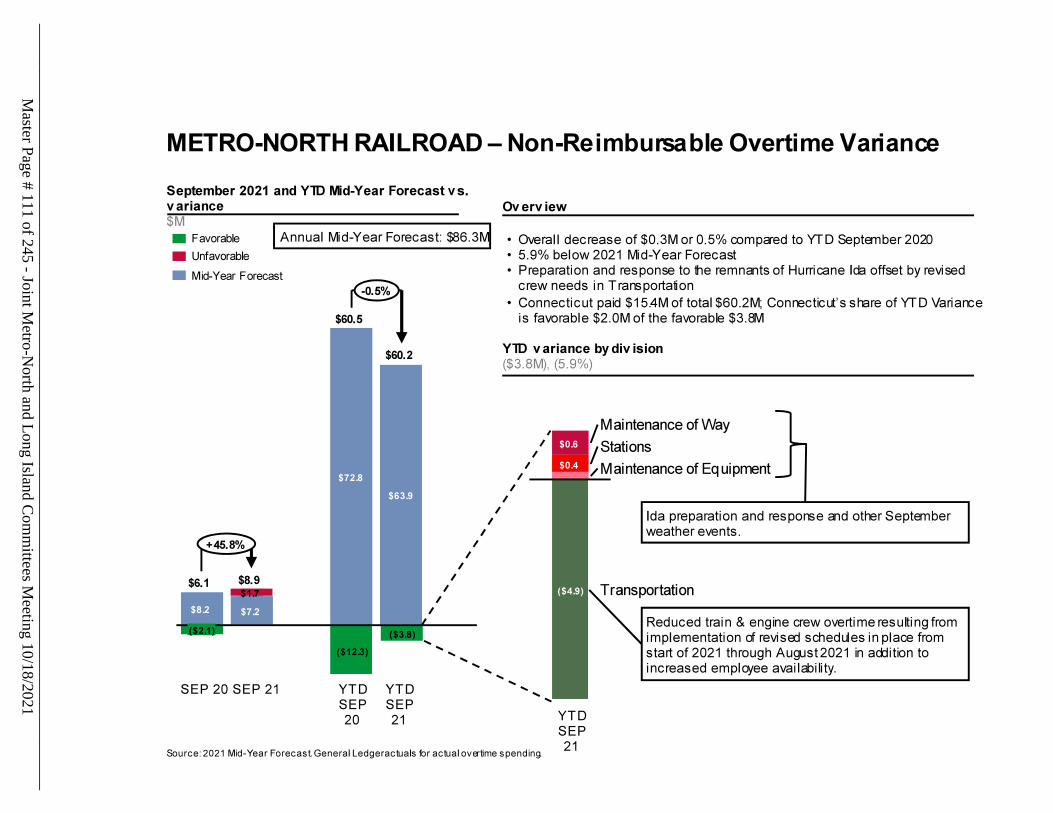
Master Page # 111 of 245 - Joint M
etro-North and Long Island C
omm
ittees Meeting 10/18/2021
________________________________________________________________________________
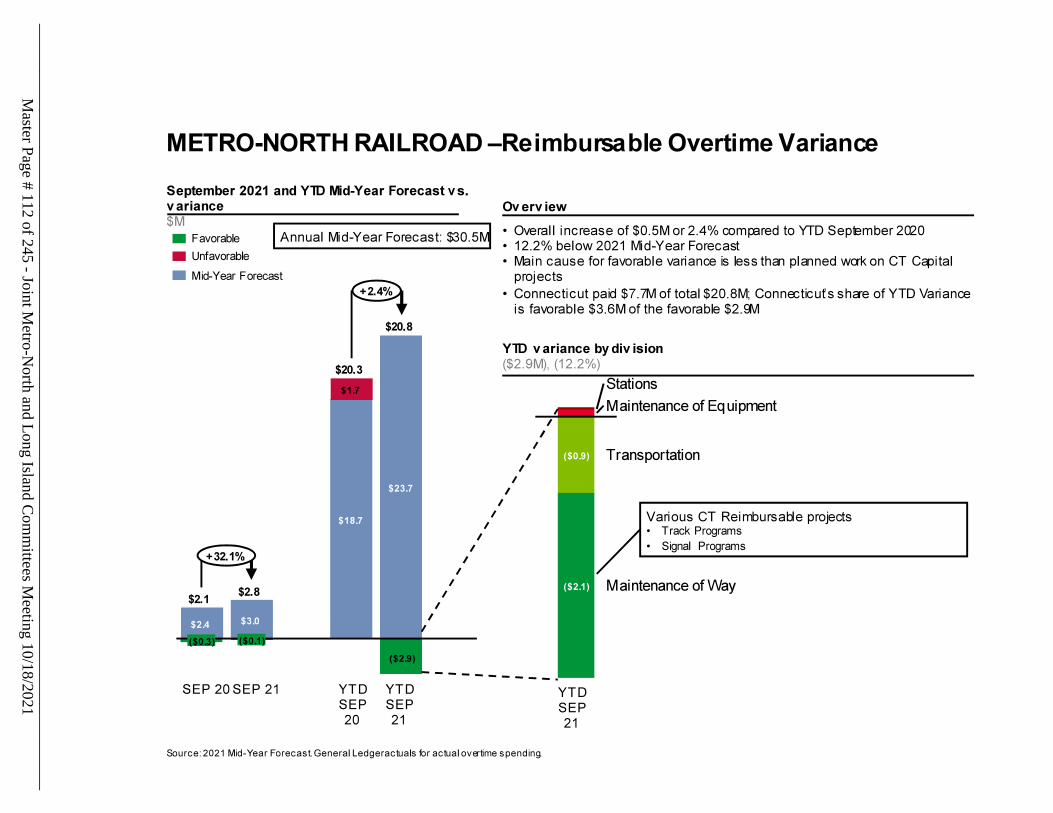
2
Master Page # 112 of 245 - Joint M
etro-North and Long Island C
omm
ittees Meeting 10/18/2021
________________________________________________________________________________
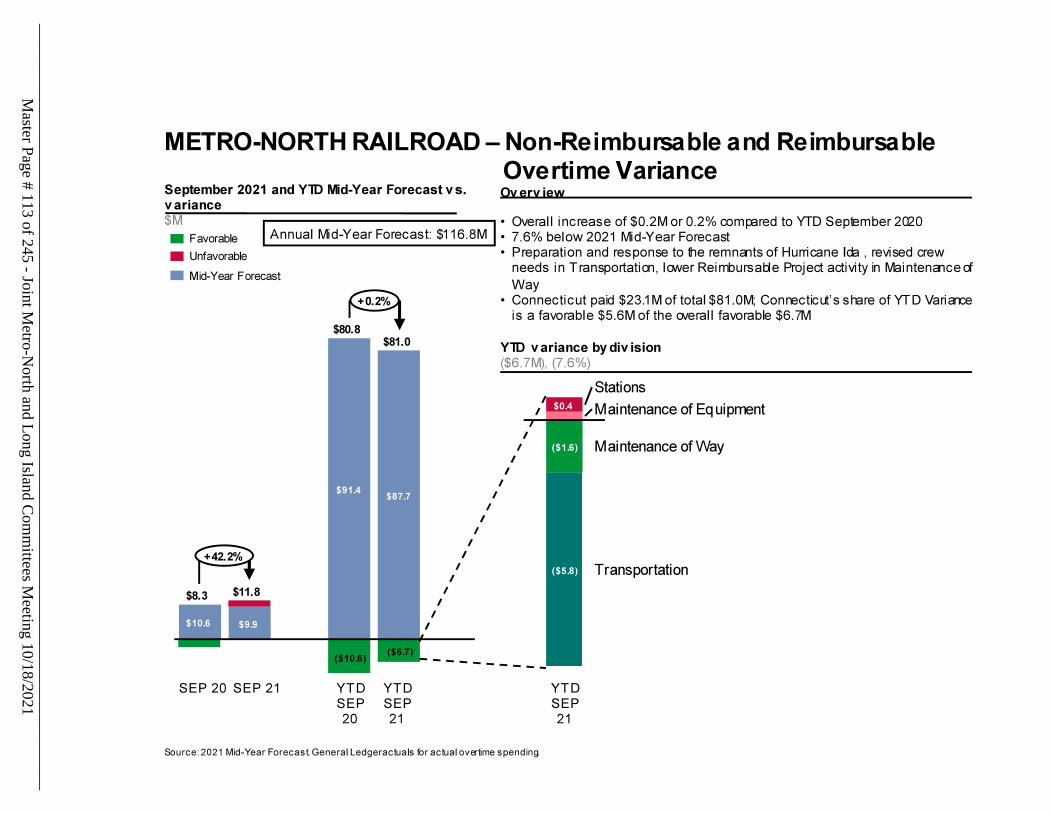
3
Master Page # 113 of 245 - Joint M
etro-North and Long Island C
omm
ittees Meeting 10/18/2021
________________________________________________________________________________
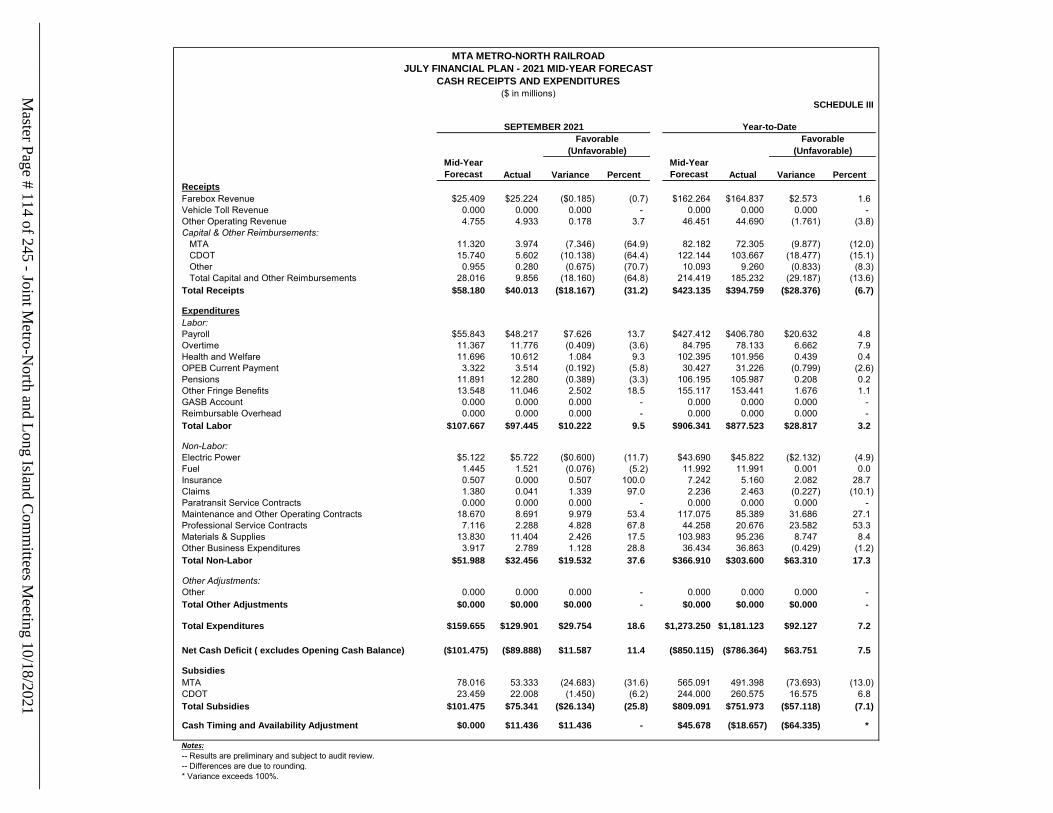
Mid-Year Forecast Actual Variance Percent
Mid-Year Forecast Actual Variance Percent
ReceiptsFarebox Revenue $25.409 $25.224 ($0.185) (0.7) $162.264 $164.837 $2.573 1.6Vehicle Toll Revenue 0.000 0.000 0.000 - 0.000 0.000 0.000 - Other Operating Revenue 4.755 4.933 0.178 3.7 46.451 44.690 (1.761) (3.8)Capital & Other Reimbursements: MTA 11.320 3.974 (7.346) (64.9) 82.182 72.305 (9.877) (12.0) CDOT 15.740 5.602 (10.138) (64.4) 122.144 103.667 (18.477) (15.1) Other 0.955 0.280 (0.675) (70.7) 10.093 9.260 (0.833) (8.3) Total Capital and Other Reimbursements 28.016 9.856 (18.160) (64.8) 214.419 185.232 (29.187) (13.6)Total Receipts $58.180 $40.013 ($18.167) (31.2) $423.135 $394.759 ($28.376) (6.7)
ExpendituresLabor:Payroll $55.843 $48.217 $7.626 13.7 $427.412 $406.780 $20.632 4.8Overtime 11.367 11.776 (0.409) (3.6) 84.795 78.133 6.662 7.9Health and Welfare 11.696 10.612 1.084 9.3 102.395 101.956 0.439 0.4OPEB Current Payment 3.322 3.514 (0.192) (5.8) 30.427 31.226 (0.799) (2.6)Pensions 11.891 12.280 (0.389) (3.3) 106.195 105.987 0.208 0.2Other Fringe Benefits 13.548 11.046 2.502 18.5 155.117 153.441 1.676 1.1GASB Account 0.000 0.000 0.000 - 0.000 0.000 0.000 - Reimbursable Overhead 0.000 0.000 0.000 - 0.000 0.000 0.000 - Total Labor $107.667 $97.445 $10.222 9.5 $906.341 $877.523 $28.817 3.2
Non-Labor:Electric Power $5.122 $5.722 ($0.600) (11.7) $43.690 $45.822 ($2.132) (4.9)Fuel 1.445 1.521 (0.076) (5.2) 11.992 11.991 0.001 0.0Insurance 0.507 0.000 0.507 100.0 7.242 5.160 2.082 28.7Claims 1.380 0.041 1.339 97.0 2.236 2.463 (0.227) (10.1)Paratransit Service Contracts 0.000 0.000 0.000 - 0.000 0.000 0.000 - Maintenance and Other Operating Contracts 18.670 8.691 9.979 53.4 117.075 85.389 31.686 27.1Professional Service Contracts 7.116 2.288 4.828 67.8 44.258 20.676 23.582 53.3Materials & Supplies 13.830 11.404 2.426 17.5 103.983 95.236 8.747 8.4Other Business Expenditures 3.917 2.789 1.128 28.8 36.434 36.863 (0.429) (1.2)Total Non-Labor $51.988 $32.456 $19.532 37.6 $366.910 $303.600 $63.310 17.3
Other Adjustments:Other 0.000 0.000 0.000 - 0.000 0.000 0.000 - Total Other Adjustments $0.000 $0.000 $0.000 - $0.000 $0.000 $0.000 -
Total Expenditures $159.655 $129.901 $29.754 18.6 $1,273.250 $1,181.123 $92.127 7.2
Net Cash Deficit ( excludes Opening Cash Balance) ($101.475) ($89.888) $11.587 11.4 ($850.115) ($786.364) $63.751 7.5
SubsidiesMTA 78.016 53.333 (24.683) (31.6) 565.091 491.398 (73.693) (13.0)CDOT 23.459 22.008 (1.450) (6.2) 244.000 260.575 16.575 6.8Total Subsidies $101.475 $75.341 ($26.134) (25.8) $809.091 $751.973 ($57.118) (7.1)
Cash Timing and Availability Adjustment $0.000 $11.436 $11.436 - $45.678 ($18.657) ($64.335) *
Notes:-- Results are preliminary and subject to audit review.-- Differences are due to rounding.* Variance exceeds 100%.
SCHEDULE III
CASH RECEIPTS AND EXPENDITURESJULY FINANCIAL PLAN - 2021 MID-YEAR FORECAST
MTA METRO-NORTH RAILROAD
(Unfavorable) (Unfavorable)
SEPTEMBER 2021 Year-to-DateFavorable Favorable
($ in millions)Master Page # 114 of 245 - Joint M
etro-North and Long Island C
omm
ittees Meeting 10/18/2021
________________________________________________________________________________
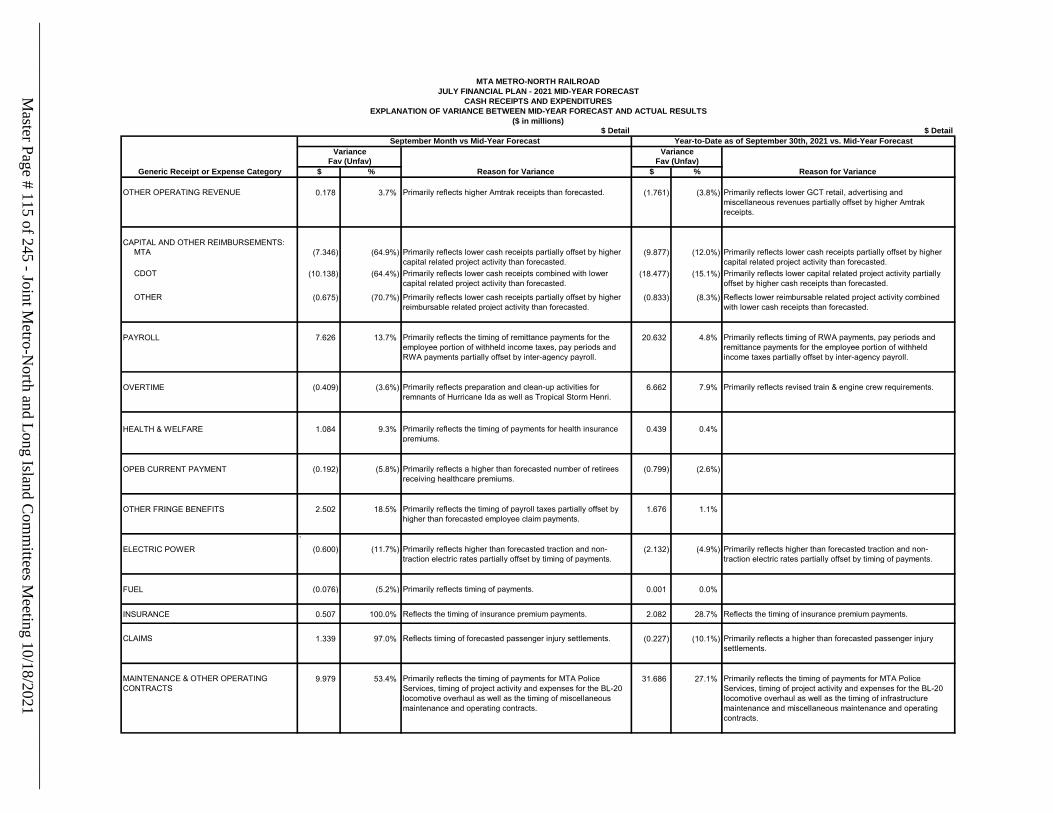
$ Detail $ Detail
Generic Receipt or Expense Category $ % Reason for Variance $ % Reason for Variance
OTHER OPERATING REVENUE 0.178 3.7% Primarily reflects higher Amtrak receipts than forecasted. (1.761) (3.8%) Primarily reflects lower GCT retail, advertising and miscellaneous revenues partially offset by higher Amtrak receipts.
CAPITAL AND OTHER REIMBURSEMENTS: MTA (7.346) (64.9%) Primarily reflects lower cash receipts partially offset by higher
capital related project activity than forecasted.(9.877) (12.0%) Primarily reflects lower cash receipts partially offset by higher
capital related project activity than forecasted. CDOT (10.138) (64.4%) Primarily reflects lower cash receipts combined with lower
capital related project activity than forecasted.(18.477) (15.1%) Primarily reflects lower capital related project activity partially
offset by higher cash receipts than forecasted.
OTHER (0.675) (70.7%) Primarily reflects lower cash receipts partially offset by higher reimbursable related project activity than forecasted.
(0.833) (8.3%) Reflects lower reimbursable related project activity combined with lower cash receipts than forecasted.
PAYROLL 7.626 13.7% Primarily reflects the timing of remittance payments for the employee portion of withheld income taxes, pay periods and RWA payments partially offset by inter-agency payroll.
20.632 4.8% Primarily reflects timing of RWA payments, pay periods and remittance payments for the employee portion of withheld income taxes partially offset by inter-agency payroll.
OVERTIME (0.409) (3.6%) Primarily reflects preparation and clean-up activities for remnants of Hurricane Ida as well as Tropical Storm Henri.
6.662 7.9% Primarily reflects revised train & engine crew requirements.
HEALTH & WELFARE 1.084 9.3% Primarily reflects the timing of payments for health insurance premiums.
0.439 0.4%
OPEB CURRENT PAYMENT (0.192) (5.8%) Primarily reflects a higher than forecasted number of retirees receiving healthcare premiums.
(0.799) (2.6%)
OTHER FRINGE BENEFITS 2.502 18.5% Primarily reflects the timing of payroll taxes partially offset by higher than forecasted employee claim payments.
1.676 1.1%
`ELECTRIC POWER (0.600) (11.7%) Primarily reflects higher than forecasted traction and non-
traction electric rates partially offset by timing of payments. (2.132) (4.9%) Primarily reflects higher than forecasted traction and non-
traction electric rates partially offset by timing of payments.
FUEL (0.076) (5.2%) Primarily reflects timing of payments. 0.001 0.0%
INSURANCE 0.507 100.0% Reflects the timing of insurance premium payments. 2.082 28.7% Reflects the timing of insurance premium payments.
CLAIMS 1.339 97.0% Reflects timing of forecasted passenger injury settlements. (0.227) (10.1%) Primarily reflects a higher than forecasted passenger injury settlements.
MAINTENANCE & OTHER OPERATING CONTRACTS
9.979 53.4% Primarily reflects the timing of payments for MTA Police Services, timing of project activity and expenses for the BL-20 locomotive overhaul as well as the timing of miscellaneous maintenance and operating contracts.
31.686 27.1% Primarily reflects the timing of payments for MTA Police Services, timing of project activity and expenses for the BL-20 locomotive overhaul as well as the timing of infrastructure maintenance and miscellaneous maintenance and operating contracts.
Variance VarianceFav (Unfav) Fav (Unfav)
MTA METRO-NORTH RAILROADJULY FINANCIAL PLAN - 2021 MID-YEAR FORECAST
CASH RECEIPTS AND EXPENDITURESEXPLANATION OF VARIANCE BETWEEN MID-YEAR FORECAST AND ACTUAL RESULTS
($ in millions)
September Month vs Mid-Year Forecast Year-to-Date as of September 30th, 2021 vs. Mid-Year Forecast
Master Page # 115 of 245 - Joint M
etro-North and Long Island C
omm
ittees Meeting 10/18/2021
________________________________________________________________________________
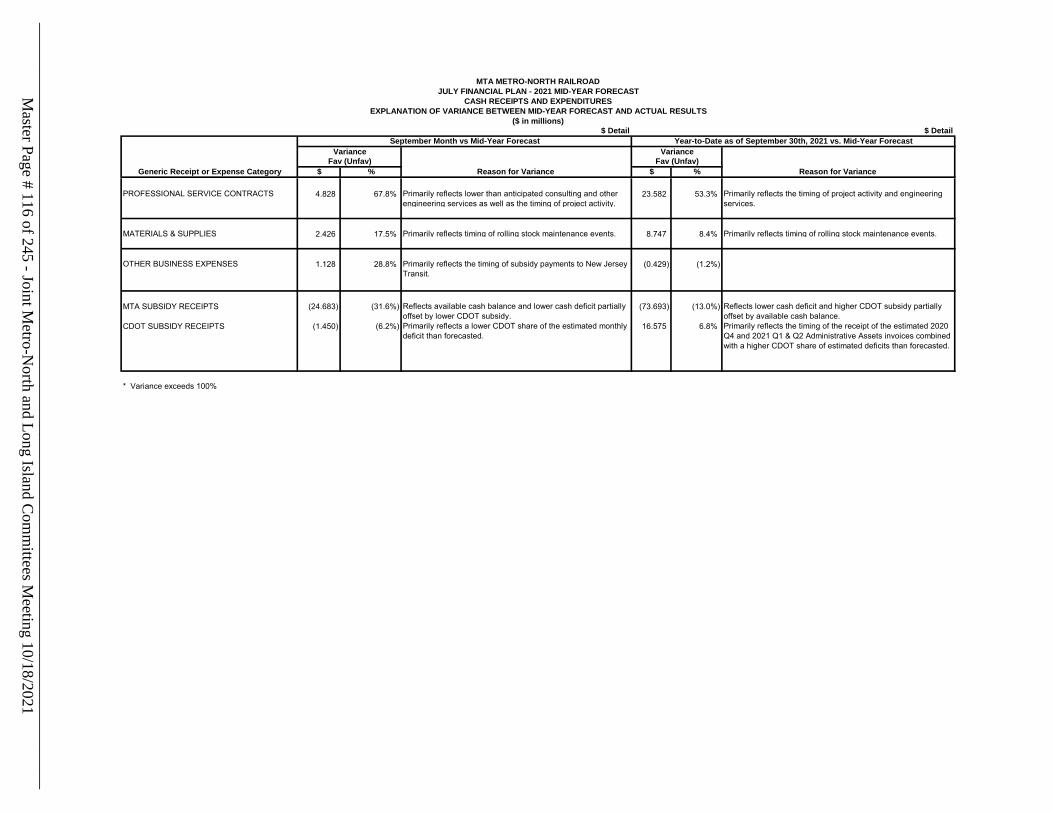
$ Detail $ Detail
Generic Receipt or Expense Category $ % Reason for Variance $ % Reason for Variance
Variance VarianceFav (Unfav) Fav (Unfav)
MTA METRO-NORTH RAILROADJULY FINANCIAL PLAN - 2021 MID-YEAR FORECAST
CASH RECEIPTS AND EXPENDITURESEXPLANATION OF VARIANCE BETWEEN MID-YEAR FORECAST AND ACTUAL RESULTS
($ in millions)
September Month vs Mid-Year Forecast Year-to-Date as of September 30th, 2021 vs. Mid-Year Forecast
PROFESSIONAL SERVICE CONTRACTS 4.828 67.8% Primarily reflects lower than anticipated consulting and other engineering services as well as the timing of project activity.
23.582 53.3% Primarily reflects the timing of project activity and engineering services.
MATERIALS & SUPPLIES 2.426 17.5% Primarily reflects timing of rolling stock maintenance events. 8.747 8.4% Primarily reflects timing of rolling stock maintenance events.
OTHER BUSINESS EXPENSES 1.128 28.8% Primarily reflects the timing of subsidy payments to New Jersey Transit.
(0.429) (1.2%)
MTA SUBSIDY RECEIPTS (24.683) (31.6%) Reflects available cash balance and lower cash deficit partially offset by lower CDOT subsidy.
(73.693) (13.0%) Reflects lower cash deficit and higher CDOT subsidy partially offset by available cash balance.
CDOT SUBSIDY RECEIPTS (1.450) (6.2%) Primarily reflects a lower CDOT share of the estimated monthly deficit than forecasted.
16.575 6.8% Primarily reflects the timing of the receipt of the estimated 2020 Q4 and 2021 Q1 & Q2 Administrative Assets invoices combined with a higher CDOT share of estimated deficits than forecasted.
* Variance exceeds 100%
Master Page # 116 of 245 - Joint M
etro-North and Long Island C
omm
ittees Meeting 10/18/2021
________________________________________________________________________________
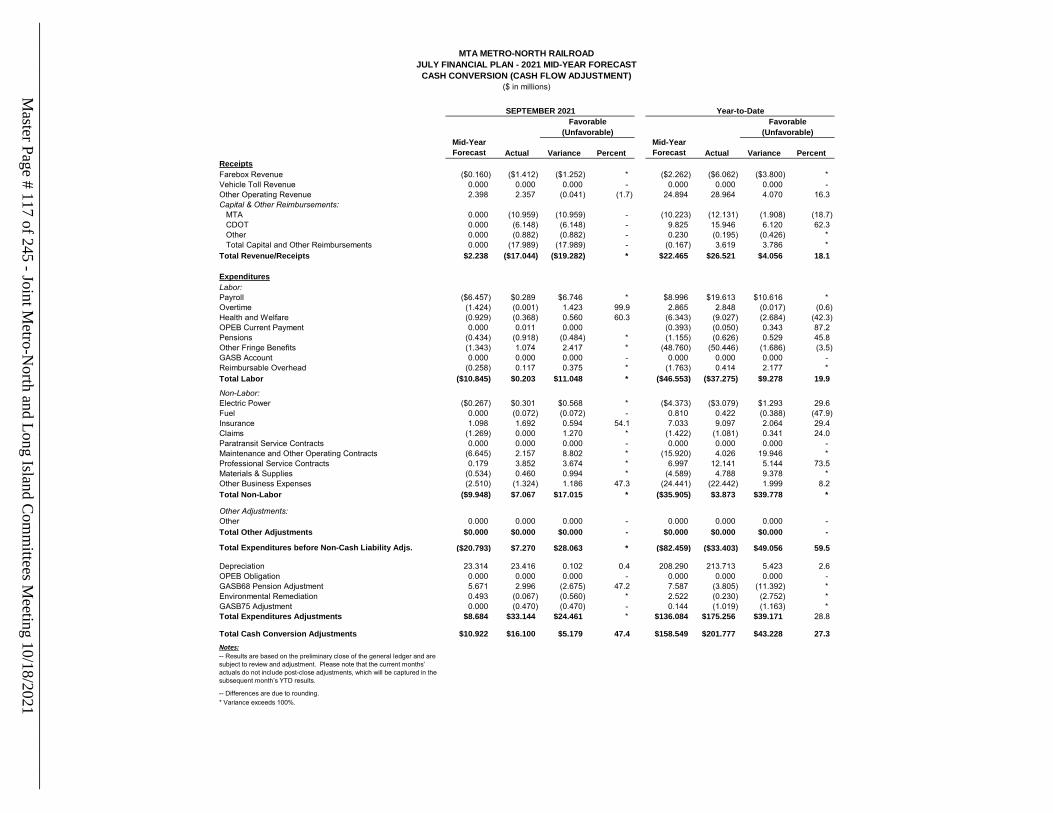
Mid-Year Forecast Actual Variance Percent
Mid-Year Forecast Actual Variance Percent
ReceiptsFarebox Revenue ($0.160) ($1.412) ($1.252) * ($2.262) ($6.062) ($3.800) * Vehicle Toll Revenue 0.000 0.000 0.000 - 0.000 0.000 0.000 - Other Operating Revenue 2.398 2.357 (0.041) (1.7) 24.894 28.964 4.070 16.3Capital & Other Reimbursements: MTA 0.000 (10.959) (10.959) - (10.223) (12.131) (1.908) (18.7) CDOT 0.000 (6.148) (6.148) - 9.825 15.946 6.120 62.3 Other 0.000 (0.882) (0.882) - 0.230 (0.195) (0.426) * Total Capital and Other Reimbursements 0.000 (17.989) (17.989) - (0.167) 3.619 3.786 * Total Revenue/Receipts $2.238 ($17.044) ($19.282) * $22.465 $26.521 $4.056 18.1
ExpendituresLabor:Payroll ($6.457) $0.289 $6.746 * $8.996 $19.613 $10.616 * Overtime (1.424) (0.001) 1.423 99.9 2.865 2.848 (0.017) (0.6)Health and Welfare (0.929) (0.368) 0.560 60.3 (6.343) (9.027) (2.684) (42.3)OPEB Current Payment 0.000 0.011 0.000 (0.393) (0.050) 0.343 87.2Pensions (0.434) (0.918) (0.484) * (1.155) (0.626) 0.529 45.8Other Fringe Benefits (1.343) 1.074 2.417 * (48.760) (50.446) (1.686) (3.5)GASB Account 0.000 0.000 0.000 - 0.000 0.000 0.000 - Reimbursable Overhead (0.258) 0.117 0.375 * (1.763) 0.414 2.177 * Total Labor ($10.845) $0.203 $11.048 * ($46.553) ($37.275) $9.278 19.9
Non-Labor:Electric Power ($0.267) $0.301 $0.568 * ($4.373) ($3.079) $1.293 29.6Fuel 0.000 (0.072) (0.072) - 0.810 0.422 (0.388) (47.9)Insurance 1.098 1.692 0.594 54.1 7.033 9.097 2.064 29.4Claims (1.269) 0.000 1.270 * (1.422) (1.081) 0.341 24.0Paratransit Service Contracts 0.000 0.000 0.000 - 0.000 0.000 0.000 - Maintenance and Other Operating Contracts (6.645) 2.157 8.802 * (15.920) 4.026 19.946 * Professional Service Contracts 0.179 3.852 3.674 * 6.997 12.141 5.144 73.5Materials & Supplies (0.534) 0.460 0.994 * (4.589) 4.788 9.378 * Other Business Expenses (2.510) (1.324) 1.186 47.3 (24.441) (22.442) 1.999 8.2Total Non-Labor ($9.948) $7.067 $17.015 * ($35.905) $3.873 $39.778 *
Other Adjustments:Other 0.000 0.000 0.000 - 0.000 0.000 0.000 - Total Other Adjustments $0.000 $0.000 $0.000 - $0.000 $0.000 $0.000 -
Total Expenditures before Non-Cash Liability Adjs. ($20.793) $7.270 $28.063 * ($82.459) ($33.403) $49.056 59.5
Depreciation 23.314 23.416 0.102 0.4 208.290 213.713 5.423 2.6OPEB Obligation 0.000 0.000 0.000 - 0.000 0.000 0.000 - GASB68 Pension Adjustment 5.671 2.996 (2.675) 47.2 7.587 (3.805) (11.392) * Environmental Remediation 0.493 (0.067) (0.560) * 2.522 (0.230) (2.752) * GASB75 Adjustment 0.000 (0.470) (0.470) - 0.144 (1.019) (1.163) * Total Expenditures Adjustments $8.684 $33.144 $24.461 * $136.084 $175.256 $39.171 28.8
Total Cash Conversion Adjustments $10.922 $16.100 $5.179 47.4 $158.549 $201.777 $43.228 27.3Notes:-- Results are based on the preliminary close of the general ledger and are subject to review and adjustment. Please note that the current months’ actuals do not include post-close adjustments, which will be captured in the subsequent month’s YTD results.
-- Differences are due to rounding.* Variance exceeds 100%.
CASH CONVERSION (CASH FLOW ADJUSTMENT)JULY FINANCIAL PLAN - 2021 MID-YEAR FORECAST
MTA METRO-NORTH RAILROAD
(Unfavorable) (Unfavorable)
SEPTEMBER 2021 Year-to-DateFavorable Favorable
($ in millions)Master Page # 117 of 245 - Joint M
etro-North and Long Island C
omm
ittees Meeting 10/18/2021
________________________________________________________________________________
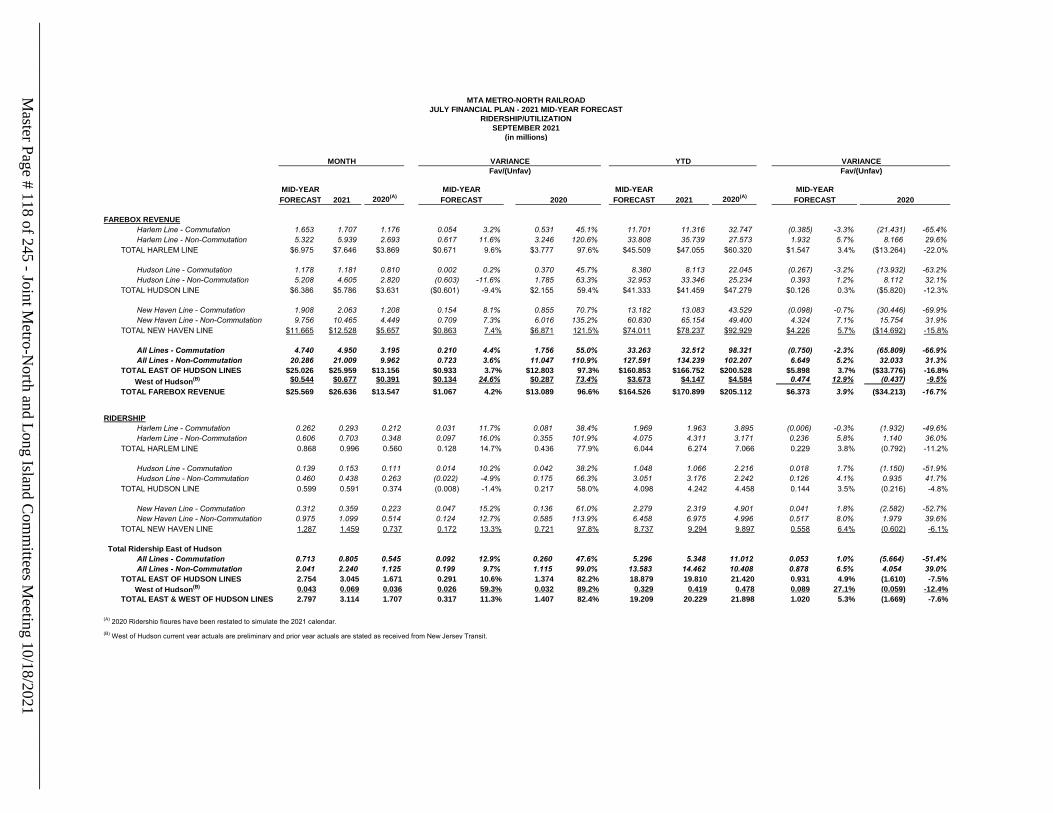
2021 2020(A) 2021 2020(A)
FAREBOX REVENUEHarlem Line - Commutation 1.653 1.707 1.176 0.054 3.2% 0.531 45.1% 11.701 11.316 32.747 (0.385) -3.3% (21.431) -65.4%Harlem Line - Non-Commutation 5.322 5.939 2.693 0.617 11.6% 3.246 120.6% 33.808 35.739 27.573 1.932 5.7% 8.166 29.6%
TOTAL HARLEM LINE $6.975 $7.646 $3.869 $0.671 9.6% $3.777 97.6% $45.509 $47.055 $60.320 $1.547 3.4% ($13.264) -22.0%
Hudson Line - Commutation 1.178 1.181 0.810 0.002 0.2% 0.370 45.7% 8.380 8.113 22.045 (0.267) -3.2% (13.932) -63.2%Hudson Line - Non-Commutation 5.208 4.605 2.820 (0.603) -11.6% 1.785 63.3% 32.953 33.346 25.234 0.393 1.2% 8.112 32.1%
TOTAL HUDSON LINE $6.386 $5.786 $3.631 ($0.601) -9.4% $2.155 59.4% $41.333 $41.459 $47.279 $0.126 0.3% ($5.820) -12.3%
New Haven Line - Commutation 1.908 2.063 1.208 0.154 8.1% 0.855 70.7% 13.182 13.083 43.529 (0.098) -0.7% (30.446) -69.9%New Haven Line - Non-Commutation 9.756 10.465 4.449 0.709 7.3% 6.016 135.2% 60.830 65.154 49.400 4.324 7.1% 15.754 31.9%
TOTAL NEW HAVEN LINE $11.665 $12.528 $5.657 $0.863 7.4% $6.871 121.5% $74.011 $78.237 $92.929 $4.226 5.7% ($14.692) -15.8%
All Lines - Commutation 4.740 4.950 3.195 0.210 4.4% 1.756 55.0% 33.263 32.512 98.321 (0.750) -2.3% (65.809) -66.9%All Lines - Non-Commutation 20.286 21.009 9.962 0.723 3.6% 11.047 110.9% 127.591 134.239 102.207 6.649 5.2% 32.033 31.3%
TOTAL EAST OF HUDSON LINES $25.026 $25.959 $13.156 $0.933 3.7% $12.803 97.3% $160.853 $166.752 $200.528 $5.898 3.7% ($33.776) -16.8% West of Hudson(B) $0.544 $0.677 $0.391 $0.134 24.6% $0.287 73.4% $3.673 $4.147 $4.584 0.474 12.9% (0.437) -9.5%
TOTAL FAREBOX REVENUE $25.569 $26.636 $13.547 $1.067 4.2% $13.089 96.6% $164.526 $170.899 $205.112 $6.373 3.9% ($34.213) -16.7%
RIDERSHIPHarlem Line - Commutation 0.262 0.293 0.212 0.031 11.7% 0.081 38.4% 1.969 1.963 3.895 (0.006) -0.3% (1.932) -49.6%Harlem Line - Non-Commutation 0.606 0.703 0.348 0.097 16.0% 0.355 101.9% 4.075 4.311 3.171 0.236 5.8% 1.140 36.0%
TOTAL HARLEM LINE 0.868 0.996 0.560 0.128 14.7% 0.436 77.9% 6.044 6.274 7.066 0.229 3.8% (0.792) -11.2%
Hudson Line - Commutation 0.139 0.153 0.111 0.014 10.2% 0.042 38.2% 1.048 1.066 2.216 0.018 1.7% (1.150) -51.9%Hudson Line - Non-Commutation 0.460 0.438 0.263 (0.022) -4.9% 0.175 66.3% 3.051 3.176 2.242 0.126 4.1% 0.935 41.7%
TOTAL HUDSON LINE 0.599 0.591 0.374 (0.008) -1.4% 0.217 58.0% 4.098 4.242 4.458 0.144 3.5% (0.216) -4.8%
New Haven Line - Commutation 0.312 0.359 0.223 0.047 15.2% 0.136 61.0% 2.279 2.319 4.901 0.041 1.8% (2.582) -52.7%New Haven Line - Non-Commutation 0.975 1.099 0.514 0.124 12.7% 0.585 113.9% 6.458 6.975 4.996 0.517 8.0% 1.979 39.6%
TOTAL NEW HAVEN LINE 1.287 1.459 0.737 0.172 13.3% 0.721 97.8% 8.737 9.294 9.897 0.558 6.4% (0.602) -6.1%
Total Ridership East of HudsonAll Lines - Commutation 0.713 0.805 0.545 0.092 12.9% 0.260 47.6% 5.296 5.348 11.012 0.053 1.0% (5.664) -51.4%All Lines - Non-Commutation 2.041 2.240 1.125 0.199 9.7% 1.115 99.0% 13.583 14.462 10.408 0.878 6.5% 4.054 39.0%
TOTAL EAST OF HUDSON LINES 2.754 3.045 1.671 0.291 10.6% 1.374 82.2% 18.879 19.810 21.420 0.931 4.9% (1.610) -7.5% West of Hudson(B) 0.043 0.069 0.036 0.026 59.3% 0.032 89.2% 0.329 0.419 0.478 0.089 27.1% (0.059) -12.4%
TOTAL EAST & WEST OF HUDSON LINES 2.797 3.114 1.707 0.317 11.3% 1.407 82.4% 19.209 20.229 21.898 1.020 5.3% (1.669) -7.6%
(A) 2020 Ridership figures have been restated to simulate the 2021 calendar.(B) West of Hudson current year actuals are preliminary and prior year actuals are stated as received from New Jersey Transit.
2020FORECAST FORECAST 2020 FORECAST FORECAST
Fav/(Unfav) Fav/(Unfav)
MID-YEAR MID-YEAR MID-YEAR MID-YEAR
MONTH VARIANCE YTD VARIANCE
MTA METRO-NORTH RAILROADJULY FINANCIAL PLAN - 2021 MID-YEAR FORECAST
RIDERSHIP/UTILIZATIONSEPTEMBER 2021
(in millions)
Master Page # 118 of 245 - Joint M
etro-North and Long Island C
omm
ittees Meeting 10/18/2021
________________________________________________________________________________
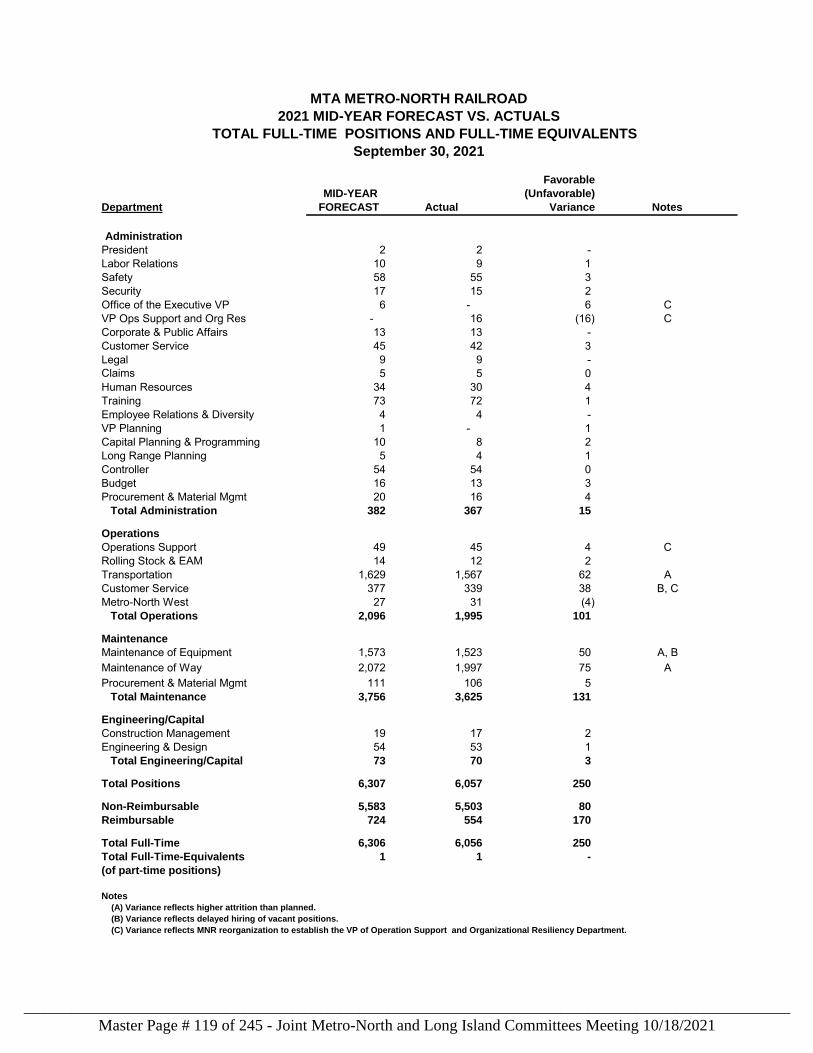
Department MID-YEAR FORECAST Actual
Favorable(Unfavorable)
Variance Notes
AdministrationPresident 2 2 - Labor Relations 10 9 1Safety 58 55 3 Security 17 15 2Office of the Executive VP 6 - 6 CVP Ops Support and Org Res - 16 (16) CCorporate & Public Affairs 13 13 - Customer Service 45 42 3 Legal 9 9 - Claims 5 5 0Human Resources 34 30 4Training 73 72 1 Employee Relations & Diversity 4 4 - VP Planning 1 - 1 Capital Planning & Programming 10 8 2 Long Range Planning 5 4 1 Controller 54 54 0 Budget 16 13 3 Procurement & Material Mgmt 20 16 4 Total Administration 382 367 15
OperationsOperations Support 49 45 4 CRolling Stock & EAM 14 12 2 Transportation 1,629 1,567 62 ACustomer Service 377 339 38 B, CMetro-North West 27 31 (4) Total Operations 2,096 1,995 101
MaintenanceMaintenance of Equipment 1,573 1,523 50 A, BMaintenance of Way 2,072 1,997 75 AProcurement & Material Mgmt 111 106 5 Total Maintenance 3,756 3,625 131
Engineering/CapitalConstruction Management 19 17 2 Engineering & Design 54 53 1 Total Engineering/Capital 73 70 3
Total Positions 6,307 6,057 250
Non-Reimbursable 5,583 5,503 80 Reimbursable 724 554 170
Total Full-Time 6,306 6,056 250Total Full-Time-Equivalents 1 1 - (of part-time positions)
(B) Variance reflects delayed hiring of vacant positions.(C) Variance reflects MNR reorganization to establish the VP of Operation Support and Organizational Resiliency Department.
(A) Variance reflects higher attrition than planned.
MTA METRO-NORTH RAILROAD2021 MID-YEAR FORECAST VS. ACTUALS
TOTAL FULL-TIME POSITIONS AND FULL-TIME EQUIVALENTS September 30, 2021
Notes
Master Page # 119 of 245 - Joint Metro-North and Long Island Committees Meeting 10/18/2021________________________________________________________________________________
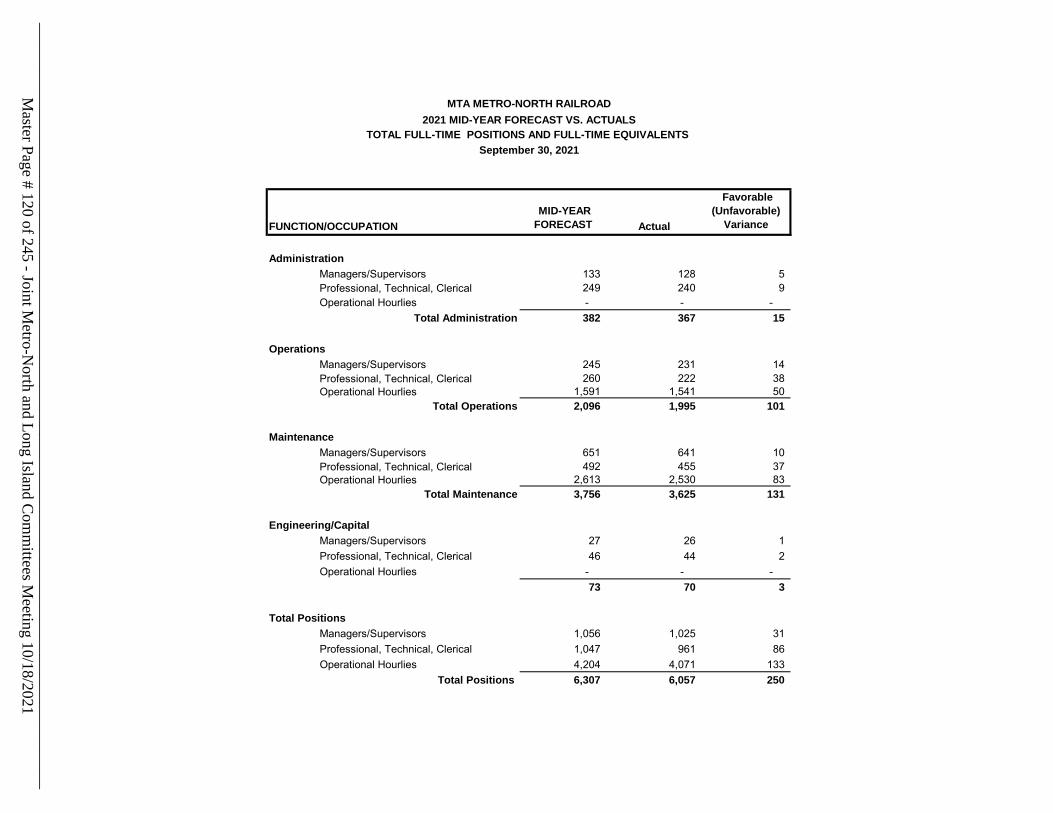
FUNCTION/OCCUPATION MID-YEAR FORECAST Actual
Favorable(Unfavorable)
Variance
Administration Managers/Supervisors 133 128 5 Professional, Technical, Clerical 249 240 9 Operational Hourlies - - -
Total Administration 382 367 15
Operations Managers/Supervisors 245 231 14 Professional, Technical, Clerical 260 222 38 Operational Hourlies 1,591 1,541 50
Total Operations 2,096 1,995 101
Maintenance Managers/Supervisors 651 641 10 Professional, Technical, Clerical 492 455 37 Operational Hourlies 2,613 2,530 83
Total Maintenance 3,756 3,625 131
Engineering/Capital Managers/Supervisors 27 26 1 Professional, Technical, Clerical 46 44 2 Operational Hourlies - - -
73 70 3
Total Positions Managers/Supervisors 1,056 1,025 31 Professional, Technical, Clerical 1,047 961 86 Operational Hourlies 4,204 4,071 133
Total Positions 6,307 6,057 250
MTA METRO-NORTH RAILROAD2021 MID-YEAR FORECAST VS. ACTUALS
TOTAL FULL-TIME POSITIONS AND FULL-TIME EQUIVALENTS September 30, 2021
Master Page # 120 of 245 - Joint M
etro-North and Long Island C
omm
ittees Meeting 10/18/2021
________________________________________________________________________________
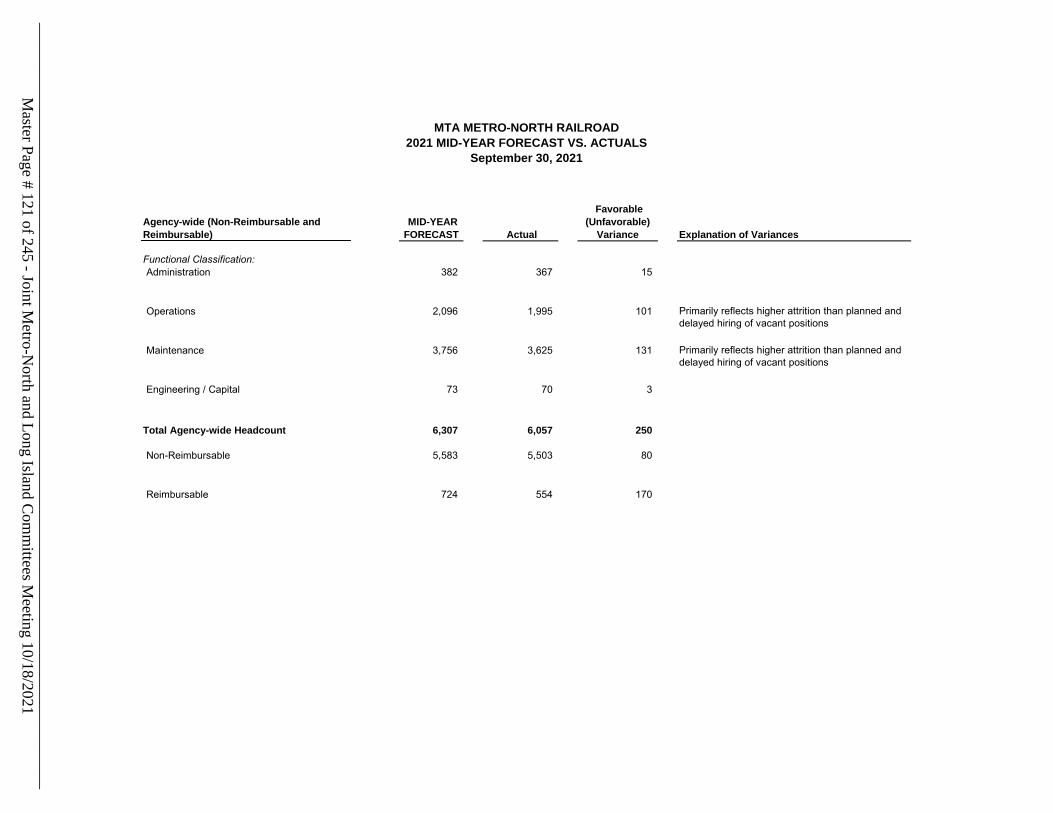
Agency-wide (Non-Reimbursable and Reimbursable)
MID-YEAR FORECAST Actual
Favorable(Unfavorable)
Variance Explanation of Variances
Functional Classification:Administration 382 367 15
Operations 2,096 1,995 101 Primarily reflects higher attrition than planned and delayed hiring of vacant positions
Maintenance 3,756 3,625 131 Primarily reflects higher attrition than planned and delayed hiring of vacant positions
Engineering / Capital 73 70 3
Total Agency-wide Headcount 6,307 6,057 250
Non-Reimbursable 5,583 5,503 80
Reimbursable 724 554 170
MTA METRO-NORTH RAILROAD2021 MID-YEAR FORECAST VS. ACTUALS
September 30, 2021
Master Page # 121 of 245 - Joint M
etro-North and Long Island C
omm
ittees Meeting 10/18/2021
________________________________________________________________________________
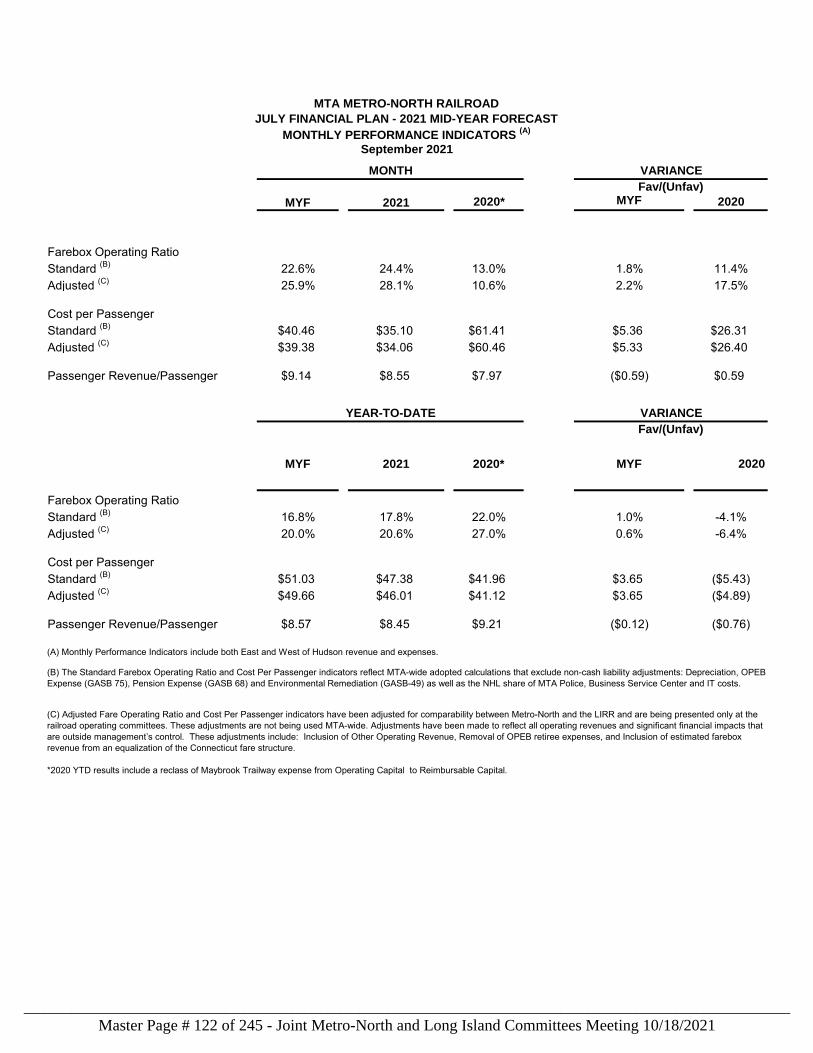
VARIANCE
MYF 2021 2020* MYF 2020
Farebox Operating Ratio Standard (B) 22.6% 24.4% 13.0% 1.8% 11.4%Adjusted (C) 25.9% 28.1% 10.6% 2.2% 17.5%
Cost per Passenger Standard (B) $40.46 $35.10 $61.41 $5.36 $26.31Adjusted (C) $39.38 $34.06 $60.46 $5.33 $26.40
Passenger Revenue/Passenger $9.14 $8.55 $7.97 ($0.59) $0.59
VARIANCE
MYF 2021 2020* MYF 2020
Farebox Operating Ratio Standard (B) 16.8% 17.8% 22.0% 1.0% -4.1%Adjusted (C) 20.0% 20.6% 27.0% 0.6% -6.4%
Cost per Passenger Standard (B) $51.03 $47.38 $41.96 $3.65 ($5.43)Adjusted (C) $49.66 $46.01 $41.12 $3.65 ($4.89)
Passenger Revenue/Passenger $8.57 $8.45 $9.21 ($0.12) ($0.76)
*2020 YTD results include a reclass of Maybrook Trailway expense from Operating Capital to Reimbursable Capital.
YEAR-TO-DATEFav/(Unfav)
(A) Monthly Performance Indicators include both East and West of Hudson revenue and expenses.
(B) The Standard Farebox Operating Ratio and Cost Per Passenger indicators reflect MTA-wide adopted calculations that exclude non-cash liability adjustments: Depreciation, OPEB Expense (GASB 75), Pension Expense (GASB 68) and Environmental Remediation (GASB-49) as well as the NHL share of MTA Police, Business Service Center and IT costs.
(C) Adjusted Fare Operating Ratio and Cost Per Passenger indicators have been adjusted for comparability between Metro-North and the LIRR and are being presented only at the railroad operating committees. These adjustments are not being used MTA-wide. Adjustments have been made to reflect all operating revenues and significant financial impacts that are outside management’s control. These adjustments include: Inclusion of Other Operating Revenue, Removal of OPEB retiree expenses, and Inclusion of estimated farebox revenue from an equalization of the Connecticut fare structure.
Fav/(Unfav)
MTA METRO-NORTH RAILROADJULY FINANCIAL PLAN - 2021 MID-YEAR FORECAST
MONTHLY PERFORMANCE INDICATORS (A)
September 2021MONTH
Master Page # 122 of 245 - Joint Metro-North and Long Island Committees Meeting 10/18/2021________________________________________________________________________________
Finance Report Steven Weiss Financial Liaison, Metro-North Railroad MTA Office of the Chief Financial Officer
Over the course of a month the Electricians at Grand Central Terminal cleaned each of the 56 “starlights”in the Terminal ceiling. This is performed once per year. In the future, the team will be adding longer lights in different parts of the ceiling so the "stars" can be seen a little brighter. They will range in size from 3 and a half inches to 6 inches.
Master Page # 123 of 245 - Joint Metro-North and Long Island Committees Meeting 10/18/2021________________________________________________________________________________
August 2021 Highlights: Financial Report The Metro-North Railroad’s Monthly Financial Report provides year-to-date fiscal information comparing actual revenues, expenses and staffing levels to the Mid-Year Forecast (Forecast) and key financial performance indicators.
Summary of Non-Reimbursable Year-to-Date (YTD) August 2021 Financial Results
Ridership and accrual results, versus the Forecast, are summarized as follows:
• Ridership of 17.1 million was 15.2% unfavorable vs. 2020 and 70.1% unfavorable vs. 2019 pre-COVID levels. Ridership was 4.3% favorable vs. Forecast primarily due to higher non-commutation ridership. Consequently, farebox revenue of $144.3 million was $5.3 million higher than Forecast.
• Total revenue of $157.4 million was $0.7 million or 0.5% lower vs. Forecast primarily due to lower advertising, GCT retail, and parking revenue partially offset by higher farebox revenue.
• Total expenses of $856.8 million were $8.6 million or 1.0% favorable vs. Forecast primarily due to the timing of contractual costs and consulting and engineering services.
Financial results for Year-to-Date (YTD) August 2021 are presented in the table below and compared to the Mid-Year Forecast.
Steven Weiss Financial Liaison, Metro-North Railroad MTA Office of the Chief Financial Officer
MidyearForecast Actual $ Var % Var
Total Revenue $158.2 $157.4 ($0.7) -0.5%
Total Expenses before Non-Cash Liability Adjs. 865.4 856.8 8.6 1.0%
Operating Surplus/(Deficit) (707.2) (699.4) 7.8 1.1%
Other Non-Cash Liabilities 189.1 182.8 6.3 3.3%
Net Surplus/(Deficit) after Non-Cash Liability Adjs. (896.3) (882.2) 14.1 1.6%
Cash Adjustments 147.6 185.7 38.0 25.8%
Net Cash Surplus/(Deficit) ($748.6) ($696.5) $52.2 7.0%
August 2021 Year-to-Date Results($ in Millions)
Fav/(Unfav) Variance
MTA Metro-North Railroad
Master Page # 124 of 245 - Joint Metro-North and Long Island Committees Meeting 10/18/2021________________________________________________________________________________
NON-REIMBURSABLE and REIMBURSABLE SUMMARY
August 2021 YTD Net Deficit (Non-Reimbursable and Reimbursable) of $882.2 million was $14.1 million or 1.6% favorable vs. the Forecast.
Major drivers of the August 2021 YTD favorable result of $14.1 million include lower Non-Reimbursable Expenses of $14.9 million primarily due to lower contractual costs, consulting and engineering services and lower non-cash liability adjustments. Non-Reimbursable Revenues were unfavorable by $0.7 million, primarily driven by lower advertising, GCT retail, and parking revenue partially offset by higher farebox revenue.
August 2021 YTD Reimbursable Expenses of $153.8 million were $32.8 million favorable vs. the Forecast primarily due to the timing of several projects including the Connecticut Track Program, Signal Replacement from Greenwich to South Norwalk, Positive Train Control, Bridge Timbers Installation and other various projects.
REVENUE/RIDERSHIP
• Farebox Revenue – YTD results were $5.3 million higher vs. the Forecast primarily due to higher East of Hudson non-commutation ridership.
▪ YTD Ridership of 17.1 million was 4.3% favorable vs. the Forecast, 15.2% unfavorable vs 2020 and 70.1% unfavorable vs pre-COVID 2019 levels.
• Other Operating Revenue – YTD was $6.1 million unfavorable vs. the Forecast primarily due to lower advertising, GCT retail, and parking revenue.
• Capital and Other Reimbursements – YTD was $32.8 million or 17.6% unfavorable vs. the Forecast primarily due to scheduling and timing changes noted above.
TOTAL EXPENSES (Non-Reimbursable and Reimbursable)
Total Expenses – YTD expenses of $1,193.3 million were $47.7 million or 3.8% favorable vs. the Forecast.
Labor Expenses (including fringes and overhead recoveries) of $742.6 million YTD were $20.4 million favorable vs. the Forecast.
• Payroll – YTD was $9.1 million favorable vs. the Forecast primarily due to lower train and engine crew payments as well timing of hiring of vacant positions and higher attrition due to retirements and resignations partially offset by the timing of retiree payouts.
• Overtime – YTD was $8.5 million favorable vs. the Forecast primarily due to revised crew needs in Transportation.
Non–Labor Expenses of $267.9 million YTD were $21.0 million favorable vs. the Forecast.
• Electric Power – YTD results were $2.3 million unfavorable vs. the Forecast primarily due to higher rates partially offset by lower usage.
• Fuel – YTD expenses were $0.4 million favorable vs. the Forecast primarily due to lower usage partially offset by higher rates.
• Maintenance & Other Operating Contracts – YTD was $10.6 million favorable vs. the Forecast due to the timing of Non-Reimbursable expenses for BL-20 locomotive overhauls, infrastructure maintenance and miscellaneous maintenance and operating contracts partially offset by the timing of COVID-19 cleaning invoices and Reimbursable project activity primarily for the Signal Replacement from Greenwich to South Norwalk and the Waterbury Branch Cab Signal projects.
• Professional Services – YTD was $17.3 million favorable vs. the Forecast due to the timing of Reimbursable project activity primarily related to the Connecticut Positive Train Control, Oil
Master Page # 125 of 245 - Joint Metro-North and Long Island Committees Meeting 10/18/2021________________________________________________________________________________
Circuit Breaker Replacement, and Sasco Creek Power Supply Station projects and the timing of Non-Reimbursable expenses for consulting and engineering services.
• Materials & Supplies – YTD was $2.1 million unfavorable vs. the Forecast due to the timing of Reimbursable project activity primarily for the Connecticut Positive Train Control project partially offset by the timing of rolling stock maintenance events and material usage and miscellaneous inventory adjustments.
• Other Business Expenses – YTD was $2.4 million unfavorable vs. the Forecast primarily due to higher subsidy payments to New Jersey Transit and higher credit card processing fees.
Depreciation and Other Non-Cash Liability Adjustments – YTD were $6.3 million favorable vs. Forecast.
CASH DEFICIT SUMMARY
August YTD Net Cash Deficit of $696.5 million was $52.2 million or 7.0% favorable to the Forecast primarily due to the timing of payments for several categories.
FINANCIAL PERFORMANCE MEASURES
• Adjusted Farebox Operating Ratio of 19.6% was 0.4 percentage points favorable vs. the Forecast.
• Adjusted Cost per Passenger of $48.19 was $3.23 favorable vs. the Forecast. • Revenue per Passenger of $8.43 was $0.04 unfavorable vs. the Forecast.
Master Page # 126 of 245 - Joint Metro-North and Long Island Committees Meeting 10/18/2021________________________________________________________________________________
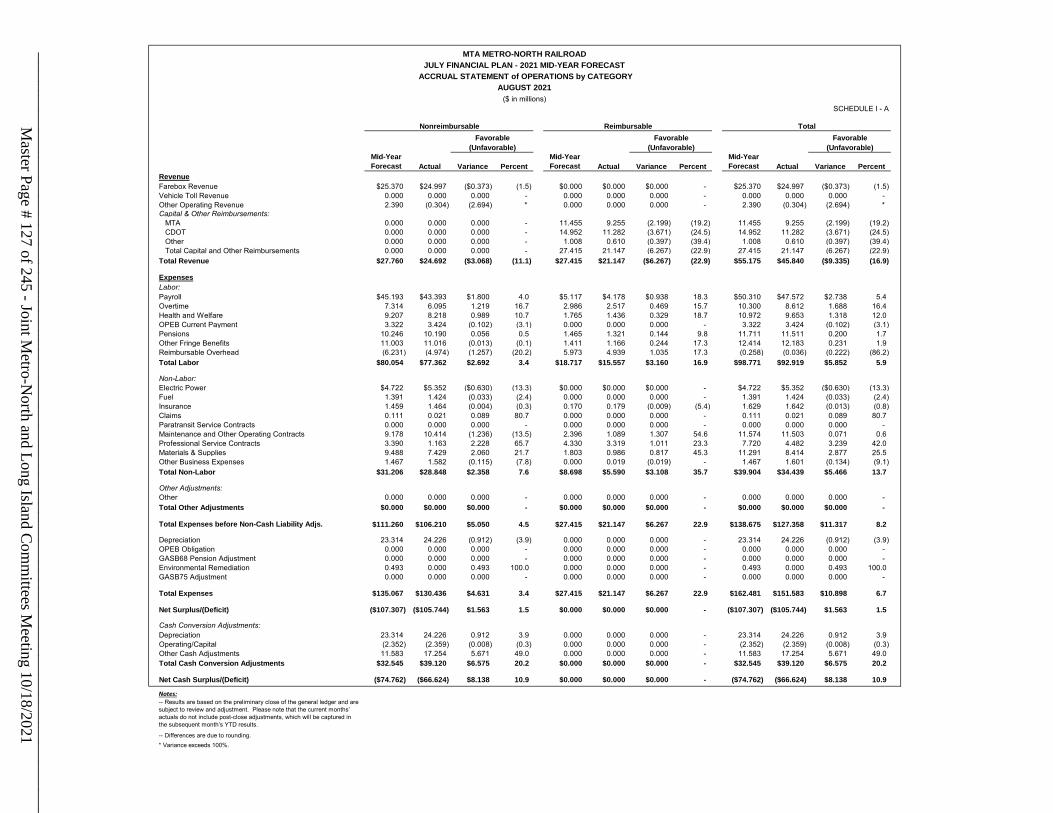
Mid-Year Forecast Actual Variance Percent
Mid-Year Forecast Actual Variance Percent
Mid-Year Forecast Actual Variance Percent
RevenueFarebox Revenue $25.370 $24.997 ($0.373) (1.5) $0.000 $0.000 $0.000 - $25.370 $24.997 ($0.373) (1.5)Vehicle Toll Revenue 0.000 0.000 0.000 - 0.000 0.000 0.000 - 0.000 0.000 0.000 - Other Operating Revenue 2.390 (0.304) (2.694) * 0.000 0.000 0.000 - 2.390 (0.304) (2.694) * Capital & Other Reimbursements: MTA 0.000 0.000 0.000 - 11.455 9.255 (2.199) (19.2) 11.455 9.255 (2.199) (19.2) CDOT 0.000 0.000 0.000 - 14.952 11.282 (3.671) (24.5) 14.952 11.282 (3.671) (24.5) Other 0.000 0.000 0.000 - 1.008 0.610 (0.397) (39.4) 1.008 0.610 (0.397) (39.4) Total Capital and Other Reimbursements 0.000 0.000 0.000 - 27.415 21.147 (6.267) (22.9) 27.415 21.147 (6.267) (22.9)Total Revenue $27.760 $24.692 ($3.068) (11.1) $27.415 $21.147 ($6.267) (22.9) $55.175 $45.840 ($9.335) (16.9)
ExpensesLabor:Payroll $45.193 $43.393 $1.800 4.0 $5.117 $4.178 $0.938 18.3 $50.310 $47.572 $2.738 5.4Overtime 7.314 6.095 1.219 16.7 2.986 2.517 0.469 15.7 10.300 8.612 1.688 16.4Health and Welfare 9.207 8.218 0.989 10.7 1.765 1.436 0.329 18.7 10.972 9.653 1.318 12.0OPEB Current Payment 3.322 3.424 (0.102) (3.1) 0.000 0.000 0.000 - 3.322 3.424 (0.102) (3.1)Pensions 10.246 10.190 0.056 0.5 1.465 1.321 0.144 9.8 11.711 11.511 0.200 1.7Other Fringe Benefits 11.003 11.016 (0.013) (0.1) 1.411 1.166 0.244 17.3 12.414 12.183 0.231 1.9Reimbursable Overhead (6.231) (4.974) (1.257) (20.2) 5.973 4.939 1.035 17.3 (0.258) (0.036) (0.222) (86.2)Total Labor $80.054 $77.362 $2.692 3.4 $18.717 $15.557 $3.160 16.9 $98.771 $92.919 $5.852 5.9
Non-Labor:Electric Power $4.722 $5.352 ($0.630) (13.3) $0.000 $0.000 $0.000 - $4.722 $5.352 ($0.630) (13.3)Fuel 1.391 1.424 (0.033) (2.4) 0.000 0.000 0.000 - 1.391 1.424 (0.033) (2.4)Insurance 1.459 1.464 (0.004) (0.3) 0.170 0.179 (0.009) (5.4) 1.629 1.642 (0.013) (0.8)Claims 0.111 0.021 0.089 80.7 0.000 0.000 0.000 - 0.111 0.021 0.089 80.7Paratransit Service Contracts 0.000 0.000 0.000 - 0.000 0.000 0.000 - 0.000 0.000 0.000 - Maintenance and Other Operating Contracts 9.178 10.414 (1.236) (13.5) 2.396 1.089 1.307 54.6 11.574 11.503 0.071 0.6Professional Service Contracts 3.390 1.163 2.228 65.7 4.330 3.319 1.011 23.3 7.720 4.482 3.239 42.0Materials & Supplies 9.488 7.429 2.060 21.7 1.803 0.986 0.817 45.3 11.291 8.414 2.877 25.5Other Business Expenses 1.467 1.582 (0.115) (7.8) 0.000 0.019 (0.019) - 1.467 1.601 (0.134) (9.1)Total Non-Labor $31.206 $28.848 $2.358 7.6 $8.698 $5.590 $3.108 35.7 $39.904 $34.439 $5.466 13.7
Other Adjustments:Other 0.000 0.000 0.000 - 0.000 0.000 0.000 - 0.000 0.000 0.000 - Total Other Adjustments $0.000 $0.000 $0.000 - $0.000 $0.000 $0.000 - $0.000 $0.000 $0.000 -
Total Expenses before Non-Cash Liability Adjs. $111.260 $106.210 $5.050 4.5 $27.415 $21.147 $6.267 22.9 $138.675 $127.358 $11.317 8.2
Depreciation 23.314 24.226 (0.912) (3.9) 0.000 0.000 0.000 - 23.314 24.226 (0.912) (3.9)OPEB Obligation 0.000 0.000 0.000 - 0.000 0.000 0.000 - 0.000 0.000 0.000 - GASB68 Pension Adjustment 0.000 0.000 0.000 - 0.000 0.000 0.000 - 0.000 0.000 0.000 - Environmental Remediation 0.493 0.000 0.493 100.0 0.000 0.000 0.000 - 0.493 0.000 0.493 100.0GASB75 Adjustment 0.000 0.000 0.000 - 0.000 0.000 0.000 - 0.000 0.000 0.000 -
Total Expenses $135.067 $130.436 $4.631 3.4 $27.415 $21.147 $6.267 22.9 $162.481 $151.583 $10.898 6.7
Net Surplus/(Deficit) ($107.307) ($105.744) $1.563 1.5 $0.000 $0.000 $0.000 - ($107.307) ($105.744) $1.563 1.5
Cash Conversion Adjustments:Depreciation 23.314 24.226 0.912 3.9 0.000 0.000 0.000 - 23.314 24.226 0.912 3.9Operating/Capital (2.352) (2.359) (0.008) (0.3) 0.000 0.000 0.000 - (2.352) (2.359) (0.008) (0.3)Other Cash Adjustments 11.583 17.254 5.671 49.0 0.000 0.000 0.000 - 11.583 17.254 5.671 49.0Total Cash Conversion Adjustments $32.545 $39.120 $6.575 20.2 $0.000 $0.000 $0.000 - $32.545 $39.120 $6.575 20.2
Net Cash Surplus/(Deficit) ($74.762) ($66.624) $8.138 10.9 $0.000 $0.000 $0.000 - ($74.762) ($66.624) $8.138 10.9
Notes:-- Results are based on the preliminary close of the general ledger and are subject to review and adjustment. Please note that the current months’ actuals do not include post-close adjustments, which will be captured in the subsequent month’s YTD results.
-- Differences are due to rounding.* Variance exceeds 100%.
SCHEDULE I - A
ACCRUAL STATEMENT of OPERATIONS by CATEGORY
MTA METRO-NORTH RAILROADJULY FINANCIAL PLAN - 2021 MID-YEAR FORECAST
AUGUST 2021($ in millions)
Favorable(Unfavorable)
TotalNonreimbursableFavorable
(Unfavorable)
ReimbursableFavorable
(Unfavorable)
Master Page # 127 of 245 - Joint M
etro-North and Long Island C
omm
ittees Meeting 10/18/2021
________________________________________________________________________________
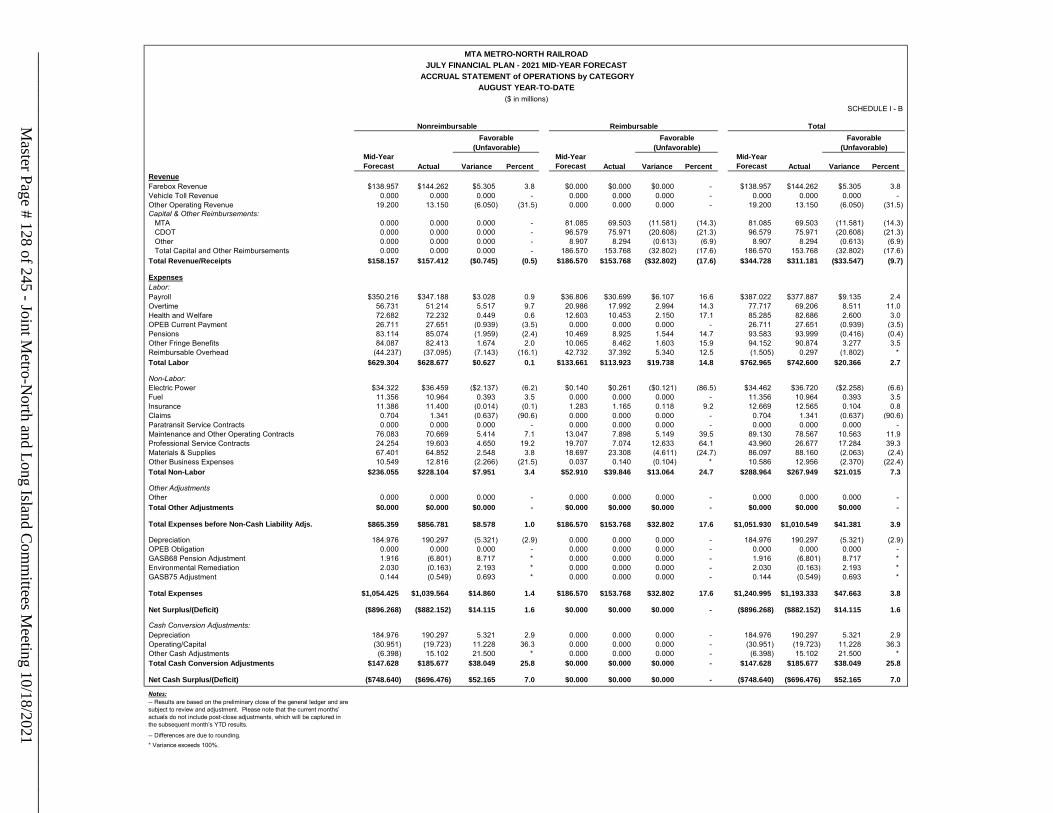
Mid-Year Forecast Actual Variance Percent
Mid-Year Forecast Actual Variance Percent
Mid-Year Forecast Actual Variance Percent
RevenueFarebox Revenue $138.957 $144.262 $5.305 3.8 $0.000 $0.000 $0.000 - $138.957 $144.262 $5.305 3.8Vehicle Toll Revenue 0.000 0.000 0.000 - 0.000 0.000 0.000 - 0.000 0.000 0.000 - Other Operating Revenue 19.200 13.150 (6.050) (31.5) 0.000 0.000 0.000 - 19.200 13.150 (6.050) (31.5)Capital & Other Reimbursements: MTA 0.000 0.000 0.000 - 81.085 69.503 (11.581) (14.3) 81.085 69.503 (11.581) (14.3) CDOT 0.000 0.000 0.000 - 96.579 75.971 (20.608) (21.3) 96.579 75.971 (20.608) (21.3) Other 0.000 0.000 0.000 - 8.907 8.294 (0.613) (6.9) 8.907 8.294 (0.613) (6.9) Total Capital and Other Reimbursements 0.000 0.000 0.000 - 186.570 153.768 (32.802) (17.6) 186.570 153.768 (32.802) (17.6)Total Revenue/Receipts $158.157 $157.412 ($0.745) (0.5) $186.570 $153.768 ($32.802) (17.6) $344.728 $311.181 ($33.547) (9.7)
ExpensesLabor:Payroll $350.216 $347.188 $3.028 0.9 $36.806 $30.699 $6.107 16.6 $387.022 $377.887 $9.135 2.4Overtime 56.731 51.214 5.517 9.7 20.986 17.992 2.994 14.3 77.717 69.206 8.511 11.0Health and Welfare 72.682 72.232 0.449 0.6 12.603 10.453 2.150 17.1 85.285 82.686 2.600 3.0OPEB Current Payment 26.711 27.651 (0.939) (3.5) 0.000 0.000 0.000 - 26.711 27.651 (0.939) (3.5)Pensions 83.114 85.074 (1.959) (2.4) 10.469 8.925 1.544 14.7 93.583 93.999 (0.416) (0.4)Other Fringe Benefits 84.087 82.413 1.674 2.0 10.065 8.462 1.603 15.9 94.152 90.874 3.277 3.5Reimbursable Overhead (44.237) (37.095) (7.143) (16.1) 42.732 37.392 5.340 12.5 (1.505) 0.297 (1.802) * Total Labor $629.304 $628.677 $0.627 0.1 $133.661 $113.923 $19.738 14.8 $762.965 $742.600 $20.366 2.7
Non-Labor:Electric Power $34.322 $36.459 ($2.137) (6.2) $0.140 $0.261 ($0.121) (86.5) $34.462 $36.720 ($2.258) (6.6)Fuel 11.356 10.964 0.393 3.5 0.000 0.000 0.000 - 11.356 10.964 0.393 3.5Insurance 11.386 11.400 (0.014) (0.1) 1.283 1.165 0.118 9.2 12.669 12.565 0.104 0.8Claims 0.704 1.341 (0.637) (90.6) 0.000 0.000 0.000 - 0.704 1.341 (0.637) (90.6)Paratransit Service Contracts 0.000 0.000 0.000 - 0.000 0.000 0.000 - 0.000 0.000 0.000 - Maintenance and Other Operating Contracts 76.083 70.669 5.414 7.1 13.047 7.898 5.149 39.5 89.130 78.567 10.563 11.9Professional Service Contracts 24.254 19.603 4.650 19.2 19.707 7.074 12.633 64.1 43.960 26.677 17.284 39.3Materials & Supplies 67.401 64.852 2.548 3.8 18.697 23.308 (4.611) (24.7) 86.097 88.160 (2.063) (2.4)Other Business Expenses 10.549 12.816 (2.266) (21.5) 0.037 0.140 (0.104) * 10.586 12.956 (2.370) (22.4)Total Non-Labor $236.055 $228.104 $7.951 3.4 $52.910 $39.846 $13.064 24.7 $288.964 $267.949 $21.015 7.3
Other AdjustmentsOther 0.000 0.000 0.000 - 0.000 0.000 0.000 - 0.000 0.000 0.000 - Total Other Adjustments $0.000 $0.000 $0.000 - $0.000 $0.000 $0.000 - $0.000 $0.000 $0.000 -
Total Expenses before Non-Cash Liability Adjs. $865.359 $856.781 $8.578 1.0 $186.570 $153.768 $32.802 17.6 $1,051.930 $1,010.549 $41.381 3.9
Depreciation 184.976 190.297 (5.321) (2.9) 0.000 0.000 0.000 - 184.976 190.297 (5.321) (2.9)OPEB Obligation 0.000 0.000 0.000 - 0.000 0.000 0.000 - 0.000 0.000 0.000 - GASB68 Pension Adjustment 1.916 (6.801) 8.717 * 0.000 0.000 0.000 - 1.916 (6.801) 8.717 * Environmental Remediation 2.030 (0.163) 2.193 * 0.000 0.000 0.000 - 2.030 (0.163) 2.193 * GASB75 Adjustment 0.144 (0.549) 0.693 * 0.000 0.000 0.000 - 0.144 (0.549) 0.693 *
Total Expenses $1,054.425 $1,039.564 $14.860 1.4 $186.570 $153.768 $32.802 17.6 $1,240.995 $1,193.333 $47.663 3.8
Net Surplus/(Deficit) ($896.268) ($882.152) $14.115 1.6 $0.000 $0.000 $0.000 - ($896.268) ($882.152) $14.115 1.6
Cash Conversion Adjustments:Depreciation 184.976 190.297 5.321 2.9 0.000 0.000 0.000 - 184.976 190.297 5.321 2.9Operating/Capital (30.951) (19.723) 11.228 36.3 0.000 0.000 0.000 - (30.951) (19.723) 11.228 36.3Other Cash Adjustments (6.398) 15.102 21.500 * 0.000 0.000 0.000 - (6.398) 15.102 21.500 * Total Cash Conversion Adjustments $147.628 $185.677 $38.049 25.8 $0.000 $0.000 $0.000 - $147.628 $185.677 $38.049 25.8
Net Cash Surplus/(Deficit) ($748.640) ($696.476) $52.165 7.0 $0.000 $0.000 $0.000 - ($748.640) ($696.476) $52.165 7.0
Notes:-- Results are based on the preliminary close of the general ledger and are subject to review and adjustment. Please note that the current months’ actuals do not include post-close adjustments, which will be captured in the subsequent month’s YTD results.
-- Differences are due to rounding.* Variance exceeds 100%.
Favorable Favorable Favorable(Unfavorable) (Unfavorable) (Unfavorable)
ACCRUAL STATEMENT of OPERATIONS by CATEGORY
($ in millions)
Nonreimbursable Reimbursable Total
MTA METRO-NORTH RAILROADJULY FINANCIAL PLAN - 2021 MID-YEAR FORECAST
AUGUST YEAR-TO-DATE
SCHEDULE I - B
Master Page # 128 of 245 - Joint M
etro-North and Long Island C
omm
ittees Meeting 10/18/2021
________________________________________________________________________________
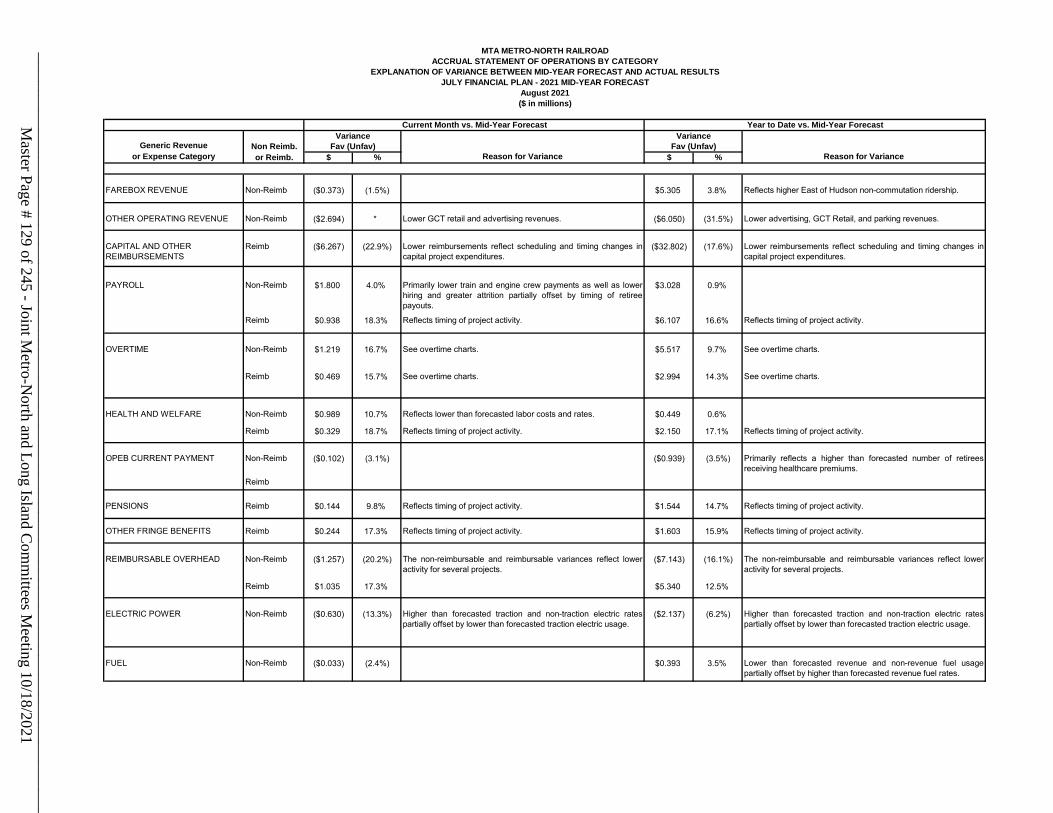
Generic Revenue Non Reimb.or Expense Category or Reimb. $ % Reason for Variance $ % Reason for Variance
FAREBOX REVENUE Non-Reimb ($0.373) (1.5%) $5.305 3.8% Reflects higher East of Hudson non-commutation ridership.
OTHER OPERATING REVENUE Non-Reimb ($2.694) * Lower GCT retail and advertising revenues. ($6.050) (31.5%) Lower advertising, GCT Retail, and parking revenues.
CAPITAL AND OTHER REIMBURSEMENTS
Reimb ($6.267) (22.9%) Lower reimbursements reflect scheduling and timing changes incapital project expenditures.
($32.802) (17.6%) Lower reimbursements reflect scheduling and timing changes incapital project expenditures.
PAYROLL Non-Reimb $1.800 4.0% Primarily lower train and engine crew payments as well as lowerhiring and greater attrition partially offset by timing of retireepayouts.
$3.028 0.9%
Reimb $0.938 18.3% Reflects timing of project activity. $6.107 16.6% Reflects timing of project activity.
OVERTIME Non-Reimb $1.219 16.7% See overtime charts. $5.517 9.7% See overtime charts.
Reimb $0.469 15.7% See overtime charts. $2.994 14.3% See overtime charts.
HEALTH AND WELFARE Non-Reimb $0.989 10.7% Reflects lower than forecasted labor costs and rates. $0.449 0.6%
Reimb $0.329 18.7% Reflects timing of project activity. $2.150 17.1% Reflects timing of project activity.
OPEB CURRENT PAYMENT Non-Reimb ($0.102) (3.1%) ($0.939) (3.5%) Primarily reflects a higher than forecasted number of retireesreceiving healthcare premiums.
Reimb
PENSIONS Reimb $0.144 9.8% Reflects timing of project activity. $1.544 14.7% Reflects timing of project activity.
OTHER FRINGE BENEFITS Reimb $0.244 17.3% Reflects timing of project activity. $1.603 15.9% Reflects timing of project activity.
REIMBURSABLE OVERHEAD Non-Reimb ($1.257) (20.2%) The non-reimbursable and reimbursable variances reflect loweractivity for several projects.
($7.143) (16.1%) The non-reimbursable and reimbursable variances reflect loweractivity for several projects.
Reimb $1.035 17.3% $5.340 12.5%
ELECTRIC POWER Non-Reimb ($0.630) (13.3%) Higher than forecasted traction and non-traction electric ratespartially offset by lower than forecasted traction electric usage.
($2.137) (6.2%) Higher than forecasted traction and non-traction electric ratespartially offset by lower than forecasted traction electric usage.
FUEL Non-Reimb ($0.033) (2.4%) $0.393 3.5% Lower than forecasted revenue and non-revenue fuel usagepartially offset by higher than forecasted revenue fuel rates.
Current Month vs. Mid-Year Forecast Year to Date vs. Mid-Year ForecastVariance Variance
Fav (Unfav) Fav (Unfav)
($ in millions)
MTA METRO-NORTH RAILROADACCRUAL STATEMENT OF OPERATIONS BY CATEGORY
EXPLANATION OF VARIANCE BETWEEN MID-YEAR FORECAST AND ACTUAL RESULTSJULY FINANCIAL PLAN - 2021 MID-YEAR FORECAST
August 2021
Master Page # 129 of 245 - Joint M
etro-North and Long Island C
omm
ittees Meeting 10/18/2021
________________________________________________________________________________
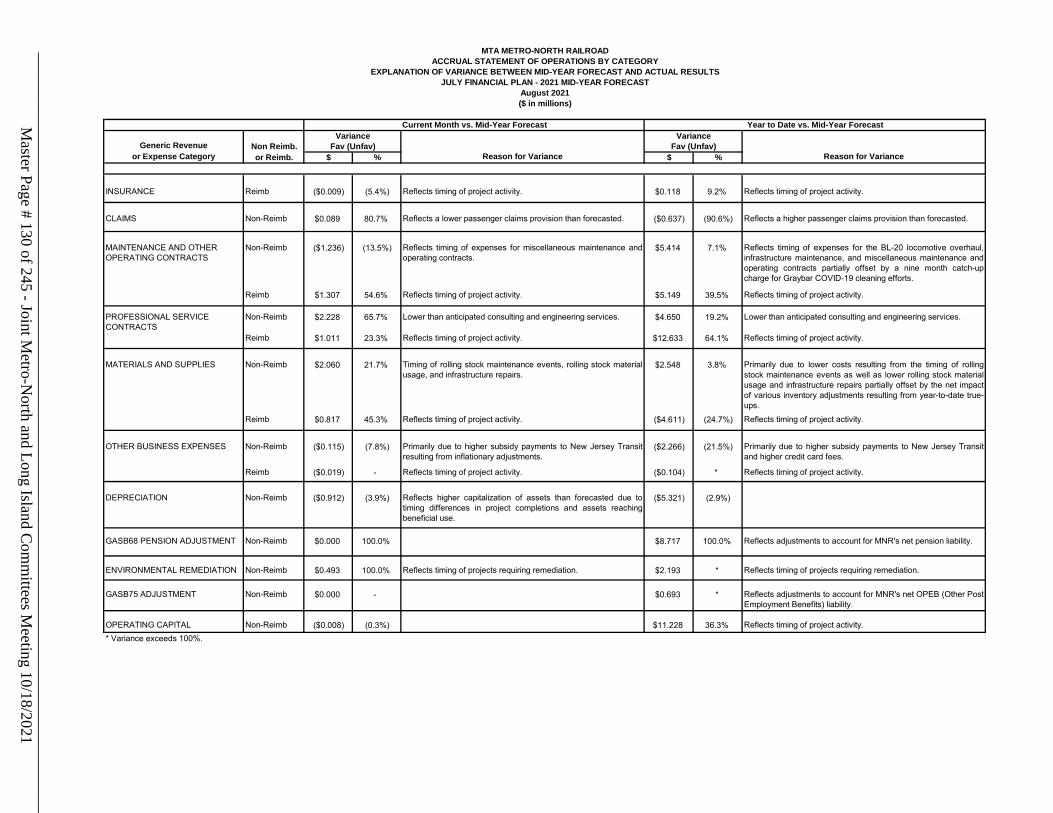
Generic Revenue Non Reimb.or Expense Category or Reimb. $ % Reason for Variance $ % Reason for Variance
Current Month vs. Mid-Year Forecast Year to Date vs. Mid-Year ForecastVariance Variance
Fav (Unfav) Fav (Unfav)
($ in millions)
MTA METRO-NORTH RAILROADACCRUAL STATEMENT OF OPERATIONS BY CATEGORY
EXPLANATION OF VARIANCE BETWEEN MID-YEAR FORECAST AND ACTUAL RESULTSJULY FINANCIAL PLAN - 2021 MID-YEAR FORECAST
August 2021
INSURANCE Reimb ($0.009) (5.4%) Reflects timing of project activity. $0.118 9.2% Reflects timing of project activity.
CLAIMS Non-Reimb $0.089 80.7% Reflects a lower passenger claims provision than forecasted. ($0.637) (90.6%) Reflects a higher passenger claims provision than forecasted.
MAINTENANCE AND OTHER OPERATING CONTRACTS
Non-Reimb ($1.236) (13.5%) Reflects timing of expenses for miscellaneous maintenance andoperating contracts.
$5.414 7.1% Reflects timing of expenses for the BL-20 locomotive overhaul,infrastructure maintenance, and miscellaneous maintenance andoperating contracts partially offset by a nine month catch-upcharge for Graybar COVID-19 cleaning efforts.
Reimb $1.307 54.6% Reflects timing of project activity. $5.149 39.5% Reflects timing of project activity.
PROFESSIONAL SERVICE CONTRACTS
Non-Reimb $2.228 65.7% Lower than anticipated consulting and engineering services. $4.650 19.2% Lower than anticipated consulting and engineering services.
Reimb $1.011 23.3% Reflects timing of project activity. $12.633 64.1% Reflects timing of project activity.
MATERIALS AND SUPPLIES Non-Reimb $2.060 21.7% Timing of rolling stock maintenance events, rolling stock materialusage, and infrastructure repairs.
$2.548 3.8% Primarily due to lower costs resulting from the timing of rollingstock maintenance events as well as lower rolling stock materialusage and infrastructure repairs partially offset by the net impactof various inventory adjustments resulting from year-to-date true-ups.
Reimb $0.817 45.3% Reflects timing of project activity. ($4.611) (24.7%) Reflects timing of project activity.
OTHER BUSINESS EXPENSES Non-Reimb ($0.115) (7.8%) Primarily due to higher subsidy payments to New Jersey Transitresulting from inflationary adjustments.
($2.266) (21.5%) Primarily due to higher subsidy payments to New Jersey Transitand higher credit card fees.
Reimb ($0.019) - Reflects timing of project activity. ($0.104) * Reflects timing of project activity.
DEPRECIATION Non-Reimb ($0.912) (3.9%) Reflects higher capitalization of assets than forecasted due totiming differences in project completions and assets reachingbeneficial use.
($5.321) (2.9%)
GASB68 PENSION ADJUSTMENT Non-Reimb $0.000 100.0% $8.717 100.0% Reflects adjustments to account for MNR's net pension liability.
ENVIRONMENTAL REMEDIATION Non-Reimb $0.493 100.0% Reflects timing of projects requiring remediation. $2.193 * Reflects timing of projects requiring remediation.
GASB75 ADJUSTMENT Non-Reimb $0.000 - $0.693 * Reflects adjustments to account for MNR's net OPEB (Other PostEmployment Benefits) liability.
OPERATING CAPITAL Non-Reimb ($0.008) (0.3%) $11.228 36.3% Reflects timing of project activity. * Variance exceeds 100%.
Master Page # 130 of 245 - Joint M
etro-North and Long Island C
omm
ittees Meeting 10/18/2021
________________________________________________________________________________
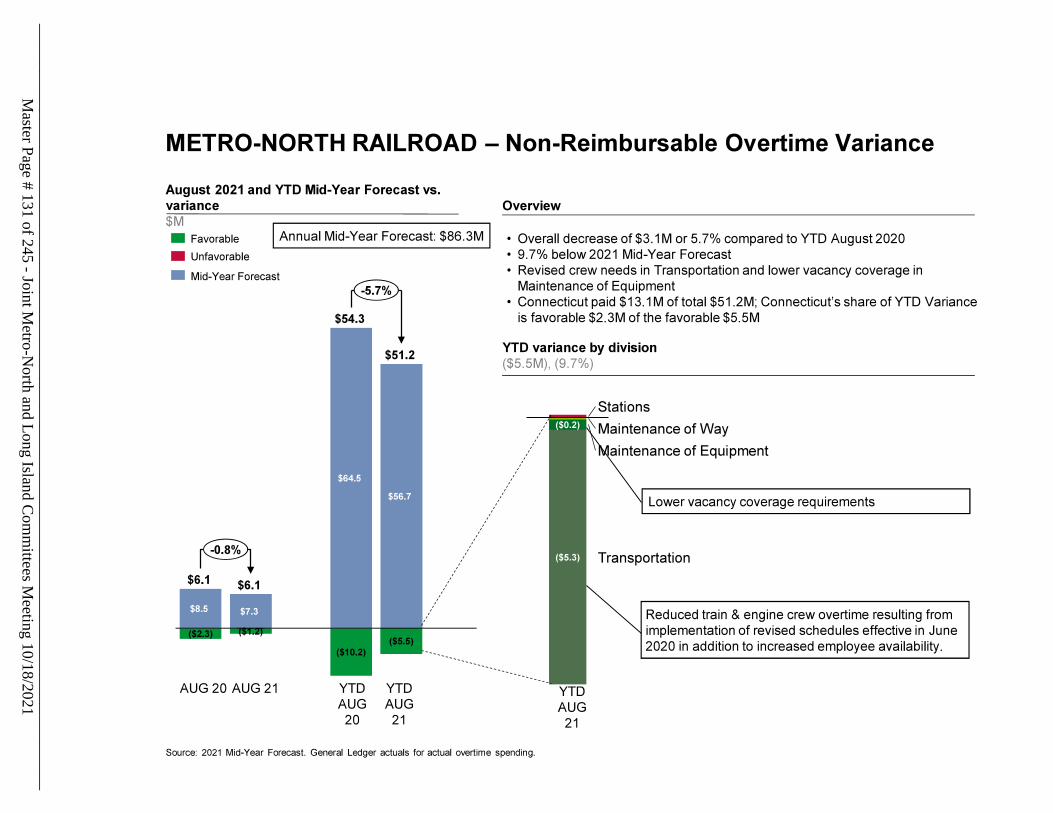
Master Page # 131 of 245 - Joint M
etro-North and Long Island C
omm
ittees Meeting 10/18/2021
________________________________________________________________________________
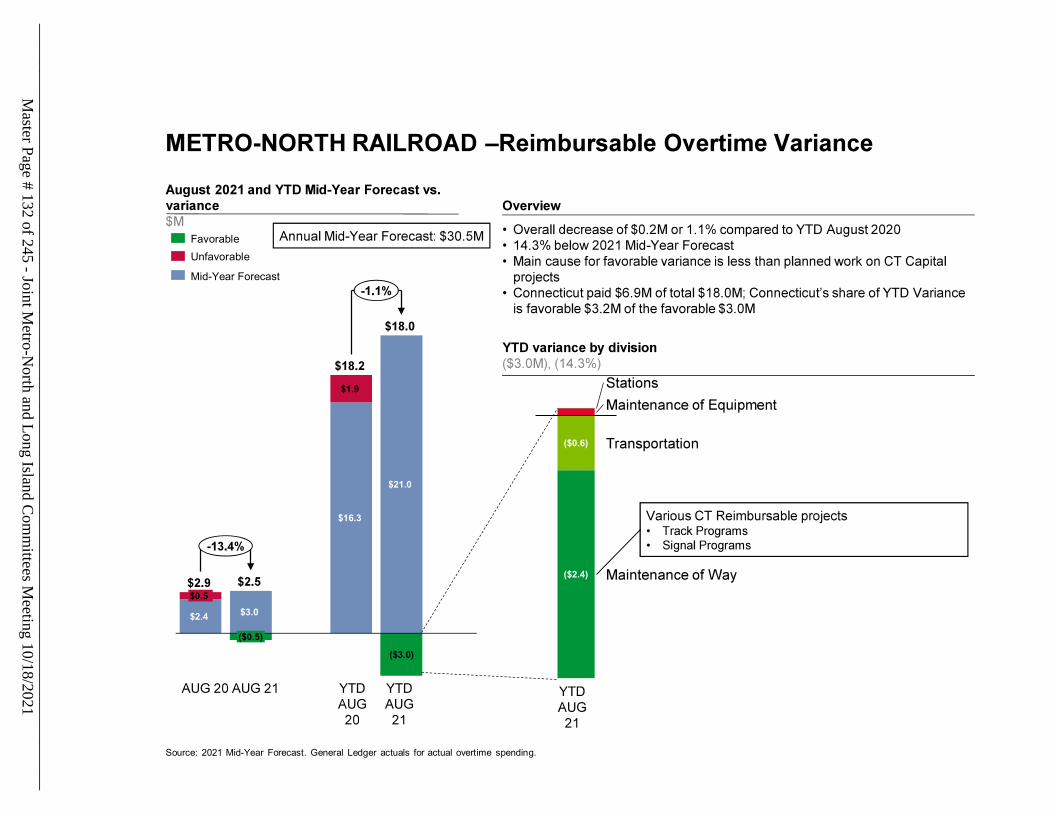
2Source: 2021 Mid-Year Forecast. General Ledger actuals for actual overtime spending.
Favorable
Unfavorable
Mid-Year Forecast
$2.4 $3.0
$16.3
$21.0
$1.9
($3.0)
$0.5
($0.5)
($0.6)
($2.4)
Master Page # 132 of 245 - Joint M
etro-North and Long Island C
omm
ittees Meeting 10/18/2021
________________________________________________________________________________
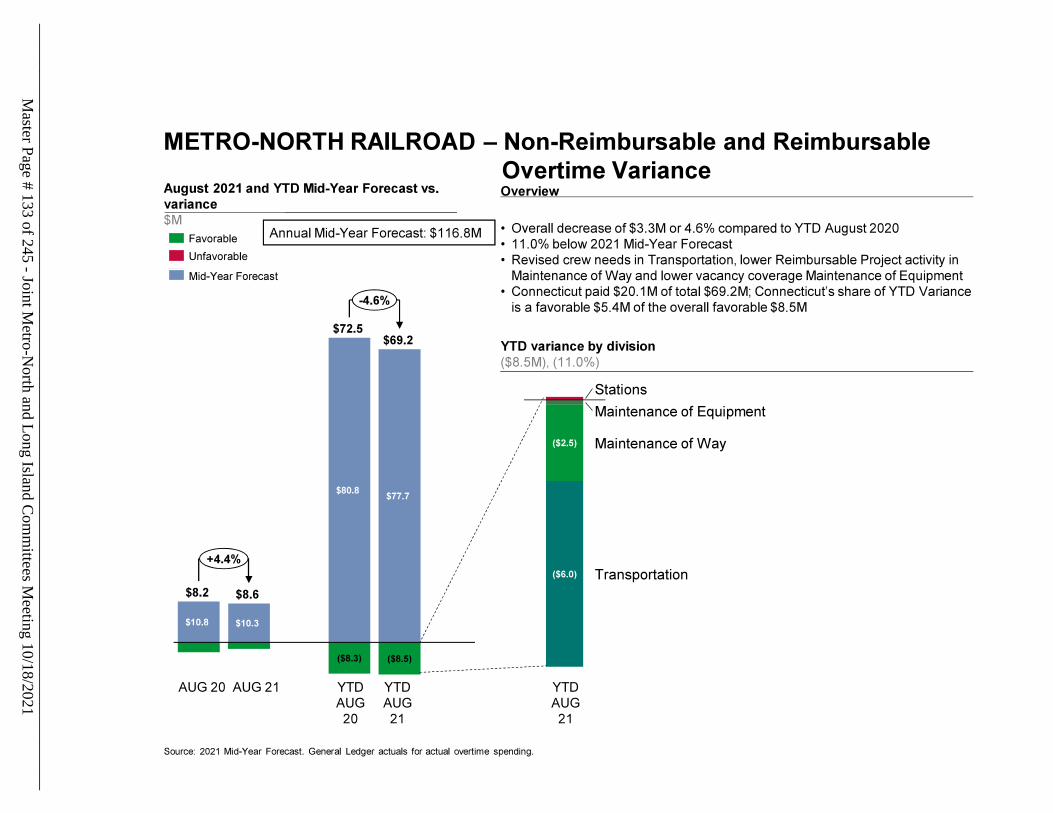
3
Master Page # 133 of 245 - Joint M
etro-North and Long Island C
omm
ittees Meeting 10/18/2021
________________________________________________________________________________
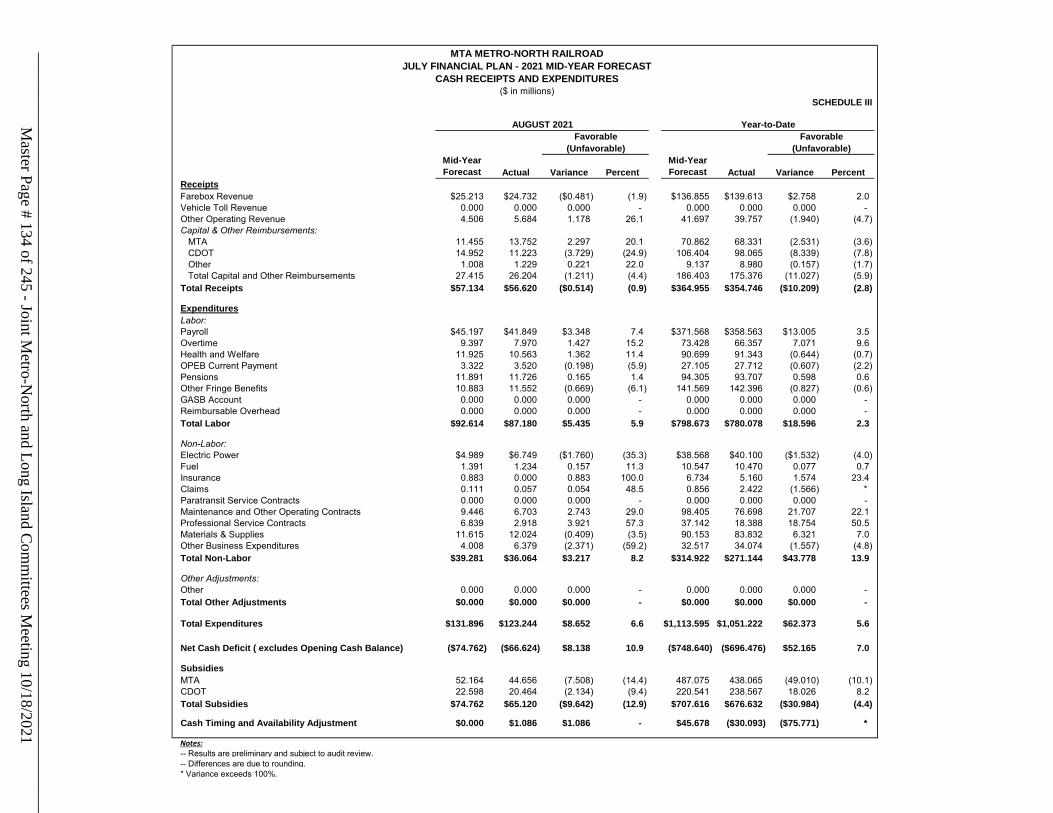
Mid-Year Forecast Actual Variance Percent
Mid-Year Forecast Actual Variance Percent
ReceiptsFarebox Revenue $25.213 $24.732 ($0.481) (1.9) $136.855 $139.613 $2.758 2.0Vehicle Toll Revenue 0.000 0.000 0.000 - 0.000 0.000 0.000 - Other Operating Revenue 4.506 5.684 1.178 26.1 41.697 39.757 (1.940) (4.7)Capital & Other Reimbursements: MTA 11.455 13.752 2.297 20.1 70.862 68.331 (2.531) (3.6) CDOT 14.952 11.223 (3.729) (24.9) 106.404 98.065 (8.339) (7.8) Other 1.008 1.229 0.221 22.0 9.137 8.980 (0.157) (1.7) Total Capital and Other Reimbursements 27.415 26.204 (1.211) (4.4) 186.403 175.376 (11.027) (5.9)Total Receipts $57.134 $56.620 ($0.514) (0.9) $364.955 $354.746 ($10.209) (2.8)
ExpendituresLabor:Payroll $45.197 $41.849 $3.348 7.4 $371.568 $358.563 $13.005 3.5Overtime 9.397 7.970 1.427 15.2 73.428 66.357 7.071 9.6Health and Welfare 11.925 10.563 1.362 11.4 90.699 91.343 (0.644) (0.7)OPEB Current Payment 3.322 3.520 (0.198) (5.9) 27.105 27.712 (0.607) (2.2)Pensions 11.891 11.726 0.165 1.4 94.305 93.707 0.598 0.6Other Fringe Benefits 10.883 11.552 (0.669) (6.1) 141.569 142.396 (0.827) (0.6)GASB Account 0.000 0.000 0.000 - 0.000 0.000 0.000 - Reimbursable Overhead 0.000 0.000 0.000 - 0.000 0.000 0.000 - Total Labor $92.614 $87.180 $5.435 5.9 $798.673 $780.078 $18.596 2.3
Non-Labor:Electric Power $4.989 $6.749 ($1.760) (35.3) $38.568 $40.100 ($1.532) (4.0)Fuel 1.391 1.234 0.157 11.3 10.547 10.470 0.077 0.7Insurance 0.883 0.000 0.883 100.0 6.734 5.160 1.574 23.4Claims 0.111 0.057 0.054 48.5 0.856 2.422 (1.566) * Paratransit Service Contracts 0.000 0.000 0.000 - 0.000 0.000 0.000 - Maintenance and Other Operating Contracts 9.446 6.703 2.743 29.0 98.405 76.698 21.707 22.1Professional Service Contracts 6.839 2.918 3.921 57.3 37.142 18.388 18.754 50.5Materials & Supplies 11.615 12.024 (0.409) (3.5) 90.153 83.832 6.321 7.0Other Business Expenditures 4.008 6.379 (2.371) (59.2) 32.517 34.074 (1.557) (4.8)Total Non-Labor $39.281 $36.064 $3.217 8.2 $314.922 $271.144 $43.778 13.9
Other Adjustments:Other 0.000 0.000 0.000 - 0.000 0.000 0.000 - Total Other Adjustments $0.000 $0.000 $0.000 - $0.000 $0.000 $0.000 -
Total Expenditures $131.896 $123.244 $8.652 6.6 $1,113.595 $1,051.222 $62.373 5.6
Net Cash Deficit ( excludes Opening Cash Balance) ($74.762) ($66.624) $8.138 10.9 ($748.640) ($696.476) $52.165 7.0
SubsidiesMTA 52.164 44.656 (7.508) (14.4) 487.075 438.065 (49.010) (10.1)CDOT 22.598 20.464 (2.134) (9.4) 220.541 238.567 18.026 8.2Total Subsidies $74.762 $65.120 ($9.642) (12.9) $707.616 $676.632 ($30.984) (4.4)
Cash Timing and Availability Adjustment $0.000 $1.086 $1.086 - $45.678 ($30.093) ($75.771) *
Notes:-- Results are preliminary and subject to audit review.-- Differences are due to rounding.* Variance exceeds 100%.
SCHEDULE III
CASH RECEIPTS AND EXPENDITURESJULY FINANCIAL PLAN - 2021 MID-YEAR FORECAST
MTA METRO-NORTH RAILROAD
(Unfavorable) (Unfavorable)
AUGUST 2021 Year-to-DateFavorable Favorable
($ in millions)
Master Page # 134 of 245 - Joint M
etro-North and Long Island C
omm
ittees Meeting 10/18/2021
________________________________________________________________________________
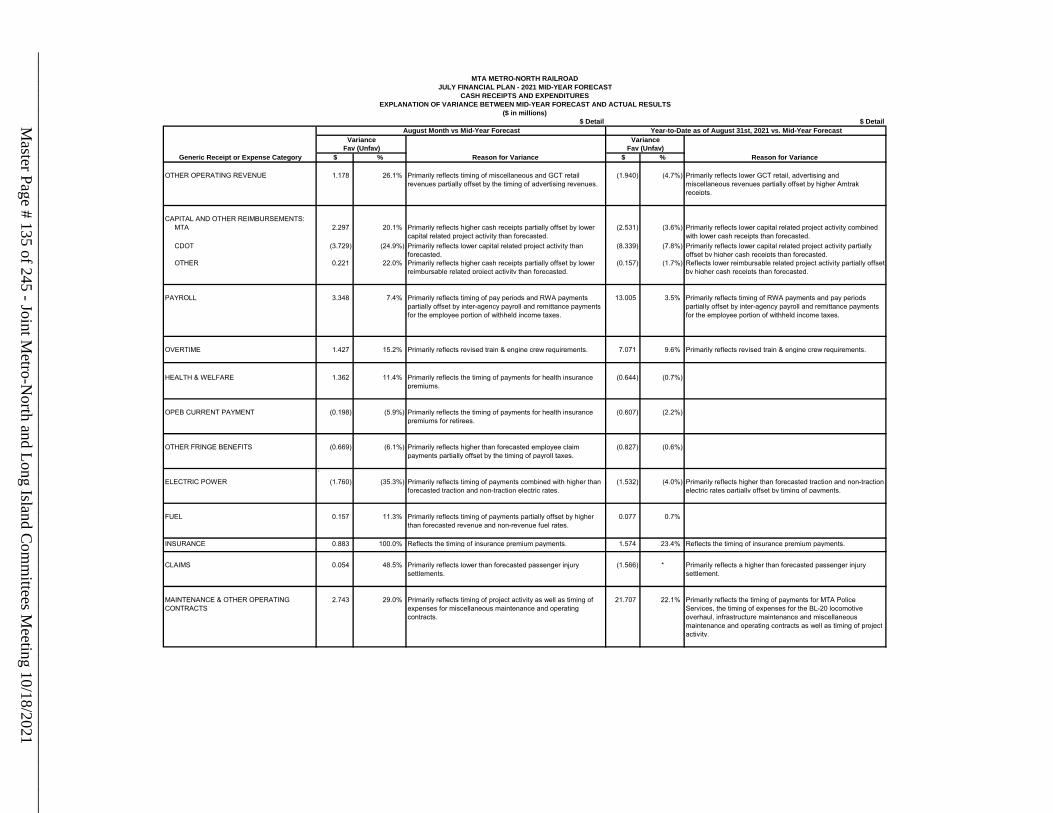
$ Detail $ Detail
Generic Receipt or Expense Category $ % Reason for Variance $ % Reason for Variance
OTHER OPERATING REVENUE 1.178 26.1% Primarily reflects timing of miscellaneous and GCT retail revenues partially offset by the timing of advertising revenues.
(1.940) (4.7%) Primarily reflects lower GCT retail, advertising and miscellaneous revenues partially offset by higher Amtrak receipts.
CAPITAL AND OTHER REIMBURSEMENTS: MTA 2.297 20.1% Primarily reflects higher cash receipts partially offset by lower
capital related project activity than forecasted.(2.531) (3.6%) Primarily reflects lower capital related project activity combined
with lower cash receipts than forecasted. CDOT (3.729) (24.9%) Primarily reflects lower capital related project activity than
forecasted.(8.339) (7.8%) Primarily reflects lower capital related project activity partially
offset by higher cash receipts than forecasted. OTHER 0.221 22.0% Primarily reflects higher cash receipts partially offset by lower
reimbursable related project activity than forecasted.(0.157) (1.7%) Reflects lower reimbursable related project activity partially offset
by higher cash receipts than forecasted.
PAYROLL 3.348 7.4% Primarily reflects timing of pay periods and RWA payments partially offset by inter-agency payroll and remittance payments for the employee portion of withheld income taxes.
13.005 3.5% Primarily reflects timing of RWA payments and pay periods partially offset by inter-agency payroll and remittance payments for the employee portion of withheld income taxes.
OVERTIME 1.427 15.2% Primarily reflects revised train & engine crew requirements. 7.071 9.6% Primarily reflects revised train & engine crew requirements.
HEALTH & WELFARE 1.362 11.4% Primarily reflects the timing of payments for health insurance premiums.
(0.644) (0.7%)
OPEB CURRENT PAYMENT (0.198) (5.9%) Primarily reflects the timing of payments for health insurance premiums for retirees.
(0.607) (2.2%)
OTHER FRINGE BENEFITS (0.669) (6.1%) Primarily reflects higher than forecasted employee claim payments partially offset by the timing of payroll taxes.
(0.827) (0.6%)
`ELECTRIC POWER (1.760) (35.3%) Primarily reflects timing of payments combined with higher than
forecasted traction and non-traction electric rates. (1.532) (4.0%) Primarily reflects higher than forecasted traction and non-traction
electric rates partially offset by timing of payments.
FUEL 0.157 11.3% Primarily reflects timing of payments partially offset by higher than forecasted revenue and non-revenue fuel rates.
0.077 0.7%
INSURANCE 0.883 100.0% Reflects the timing of insurance premium payments. 1.574 23.4% Reflects the timing of insurance premium payments.
CLAIMS 0.054 48.5% Primarily reflects lower than forecasted passenger injury settlements.
(1.566) * Primarily reflects a higher than forecasted passenger injury settlement.
MAINTENANCE & OTHER OPERATING CONTRACTS
2.743 29.0% Primarily reflects timing of project activity as well as timing of expenses for miscellaneous maintenance and operating contracts.
21.707 22.1% Primarily reflects the timing of payments for MTA Police Services, the timing of expenses for the BL-20 locomotive overhaul, infrastructure maintenance and miscellaneous maintenance and operating contracts as well as timing of project activity.
Variance VarianceFav (Unfav) Fav (Unfav)
MTA METRO-NORTH RAILROADJULY FINANCIAL PLAN - 2021 MID-YEAR FORECAST
CASH RECEIPTS AND EXPENDITURESEXPLANATION OF VARIANCE BETWEEN MID-YEAR FORECAST AND ACTUAL RESULTS
($ in millions)
August Month vs Mid-Year Forecast Year-to-Date as of August 31st, 2021 vs. Mid-Year Forecast
Master Page # 135 of 245 - Joint M
etro-North and Long Island C
omm
ittees Meeting 10/18/2021
________________________________________________________________________________
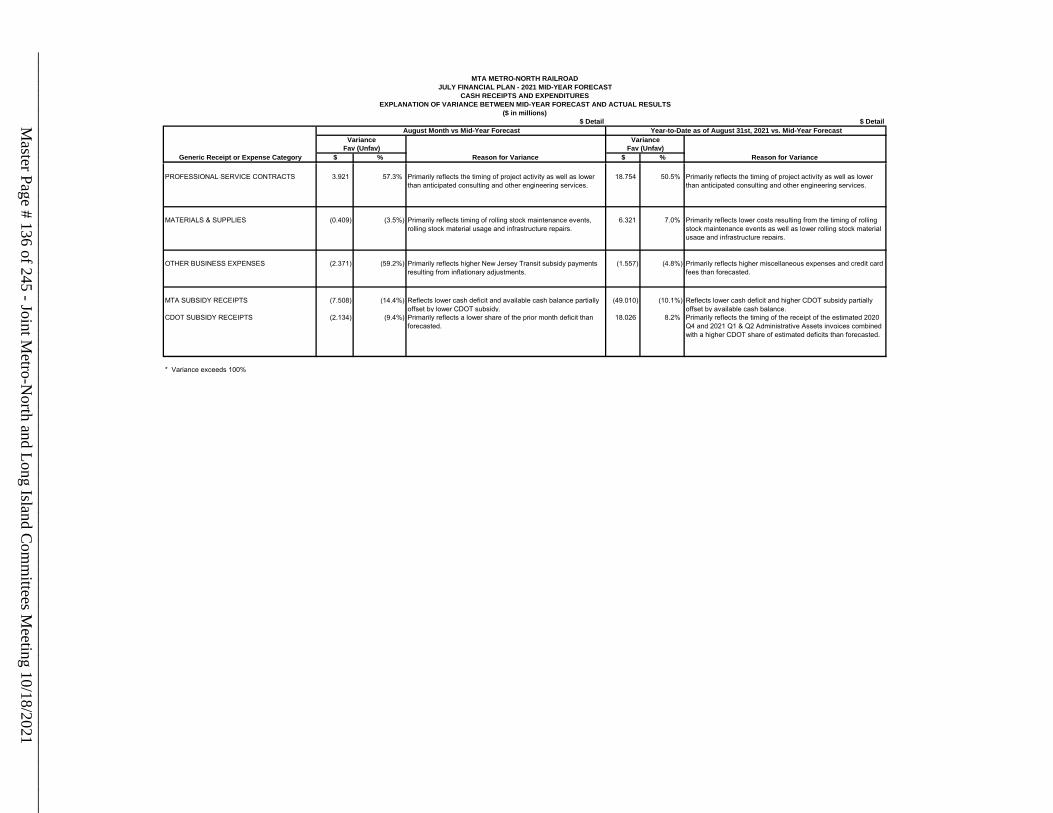
$ Detail $ Detail
Generic Receipt or Expense Category $ % Reason for Variance $ % Reason for Variance
Variance VarianceFav (Unfav) Fav (Unfav)
MTA METRO-NORTH RAILROADJULY FINANCIAL PLAN - 2021 MID-YEAR FORECAST
CASH RECEIPTS AND EXPENDITURESEXPLANATION OF VARIANCE BETWEEN MID-YEAR FORECAST AND ACTUAL RESULTS
($ in millions)
August Month vs Mid-Year Forecast Year-to-Date as of August 31st, 2021 vs. Mid-Year Forecast
PROFESSIONAL SERVICE CONTRACTS 3.921 57.3% Primarily reflects the timing of project activity as well as lower than anticipated consulting and other engineering services.
18.754 50.5% Primarily reflects the timing of project activity as well as lower than anticipated consulting and other engineering services.
MATERIALS & SUPPLIES (0.409) (3.5%) Primarily reflects timing of rolling stock maintenance events, rolling stock material usage and infrastructure repairs.
6.321 7.0% Primarily reflects lower costs resulting from the timing of rolling stock maintenance events as well as lower rolling stock material usage and infrastructure repairs.
OTHER BUSINESS EXPENSES (2.371) (59.2%) Primarily reflects higher New Jersey Transit subsidy payments resulting from inflationary adjustments.
(1.557) (4.8%) Primarily reflects higher miscellaneous expenses and credit card fees than forecasted.
MTA SUBSIDY RECEIPTS (7.508) (14.4%) Reflects lower cash deficit and available cash balance partially offset by lower CDOT subsidy.
(49.010) (10.1%) Reflects lower cash deficit and higher CDOT subsidy partially offset by available cash balance.
CDOT SUBSIDY RECEIPTS (2.134) (9.4%) Primarily reflects a lower share of the prior month deficit than forecasted.
18.026 8.2% Primarily reflects the timing of the receipt of the estimated 2020 Q4 and 2021 Q1 & Q2 Administrative Assets invoices combined with a higher CDOT share of estimated deficits than forecasted.
* Variance exceeds 100%
Master Page # 136 of 245 - Joint M
etro-North and Long Island C
omm
ittees Meeting 10/18/2021
________________________________________________________________________________
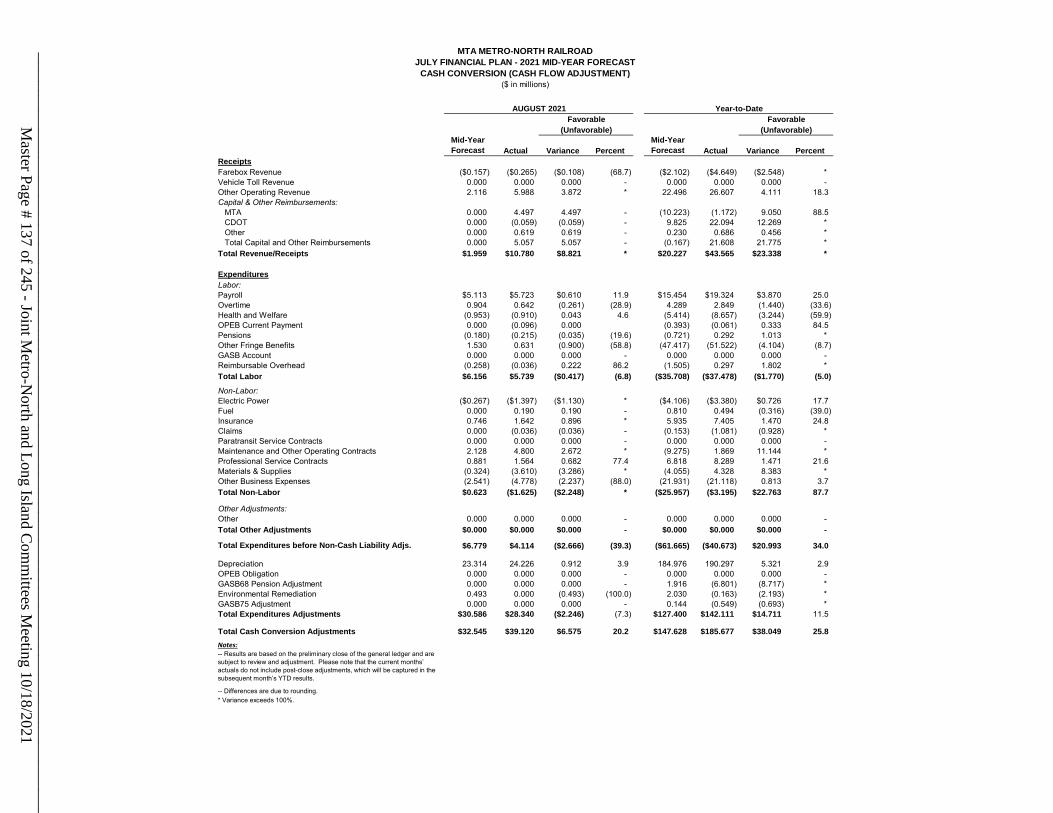
Mid-Year Forecast Actual Variance Percent
Mid-Year Forecast Actual Variance Percent
ReceiptsFarebox Revenue ($0.157) ($0.265) ($0.108) (68.7) ($2.102) ($4.649) ($2.548) * Vehicle Toll Revenue 0.000 0.000 0.000 - 0.000 0.000 0.000 - Other Operating Revenue 2.116 5.988 3.872 * 22.496 26.607 4.111 18.3Capital & Other Reimbursements: MTA 0.000 4.497 4.497 - (10.223) (1.172) 9.050 88.5 CDOT 0.000 (0.059) (0.059) - 9.825 22.094 12.269 * Other 0.000 0.619 0.619 - 0.230 0.686 0.456 * Total Capital and Other Reimbursements 0.000 5.057 5.057 - (0.167) 21.608 21.775 * Total Revenue/Receipts $1.959 $10.780 $8.821 * $20.227 $43.565 $23.338 *
ExpendituresLabor:Payroll $5.113 $5.723 $0.610 11.9 $15.454 $19.324 $3.870 25.0Overtime 0.904 0.642 (0.261) (28.9) 4.289 2.849 (1.440) (33.6)Health and Welfare (0.953) (0.910) 0.043 4.6 (5.414) (8.657) (3.244) (59.9)OPEB Current Payment 0.000 (0.096) 0.000 (0.393) (0.061) 0.333 84.5Pensions (0.180) (0.215) (0.035) (19.6) (0.721) 0.292 1.013 * Other Fringe Benefits 1.530 0.631 (0.900) (58.8) (47.417) (51.522) (4.104) (8.7)GASB Account 0.000 0.000 0.000 - 0.000 0.000 0.000 - Reimbursable Overhead (0.258) (0.036) 0.222 86.2 (1.505) 0.297 1.802 * Total Labor $6.156 $5.739 ($0.417) (6.8) ($35.708) ($37.478) ($1.770) (5.0)
Non-Labor:Electric Power ($0.267) ($1.397) ($1.130) * ($4.106) ($3.380) $0.726 17.7Fuel 0.000 0.190 0.190 - 0.810 0.494 (0.316) (39.0)Insurance 0.746 1.642 0.896 * 5.935 7.405 1.470 24.8Claims 0.000 (0.036) (0.036) - (0.153) (1.081) (0.928) * Paratransit Service Contracts 0.000 0.000 0.000 - 0.000 0.000 0.000 - Maintenance and Other Operating Contracts 2.128 4.800 2.672 * (9.275) 1.869 11.144 * Professional Service Contracts 0.881 1.564 0.682 77.4 6.818 8.289 1.471 21.6Materials & Supplies (0.324) (3.610) (3.286) * (4.055) 4.328 8.383 * Other Business Expenses (2.541) (4.778) (2.237) (88.0) (21.931) (21.118) 0.813 3.7Total Non-Labor $0.623 ($1.625) ($2.248) * ($25.957) ($3.195) $22.763 87.7
Other Adjustments:Other 0.000 0.000 0.000 - 0.000 0.000 0.000 - Total Other Adjustments $0.000 $0.000 $0.000 - $0.000 $0.000 $0.000 -
Total Expenditures before Non-Cash Liability Adjs. $6.779 $4.114 ($2.666) (39.3) ($61.665) ($40.673) $20.993 34.0
Depreciation 23.314 24.226 0.912 3.9 184.976 190.297 5.321 2.9OPEB Obligation 0.000 0.000 0.000 - 0.000 0.000 0.000 - GASB68 Pension Adjustment 0.000 0.000 0.000 - 1.916 (6.801) (8.717) * Environmental Remediation 0.493 0.000 (0.493) (100.0) 2.030 (0.163) (2.193) * GASB75 Adjustment 0.000 0.000 0.000 - 0.144 (0.549) (0.693) * Total Expenditures Adjustments $30.586 $28.340 ($2.246) (7.3) $127.400 $142.111 $14.711 11.5
Total Cash Conversion Adjustments $32.545 $39.120 $6.575 20.2 $147.628 $185.677 $38.049 25.8Notes:-- Results are based on the preliminary close of the general ledger and are subject to review and adjustment. Please note that the current months’ actuals do not include post-close adjustments, which will be captured in the subsequent month’s YTD results.
-- Differences are due to rounding.* Variance exceeds 100%.
CASH CONVERSION (CASH FLOW ADJUSTMENT)JULY FINANCIAL PLAN - 2021 MID-YEAR FORECAST
MTA METRO-NORTH RAILROAD
(Unfavorable) (Unfavorable)
AUGUST 2021 Year-to-DateFavorable Favorable
($ in millions)
Master Page # 137 of 245 - Joint M
etro-North and Long Island C
omm
ittees Meeting 10/18/2021
________________________________________________________________________________
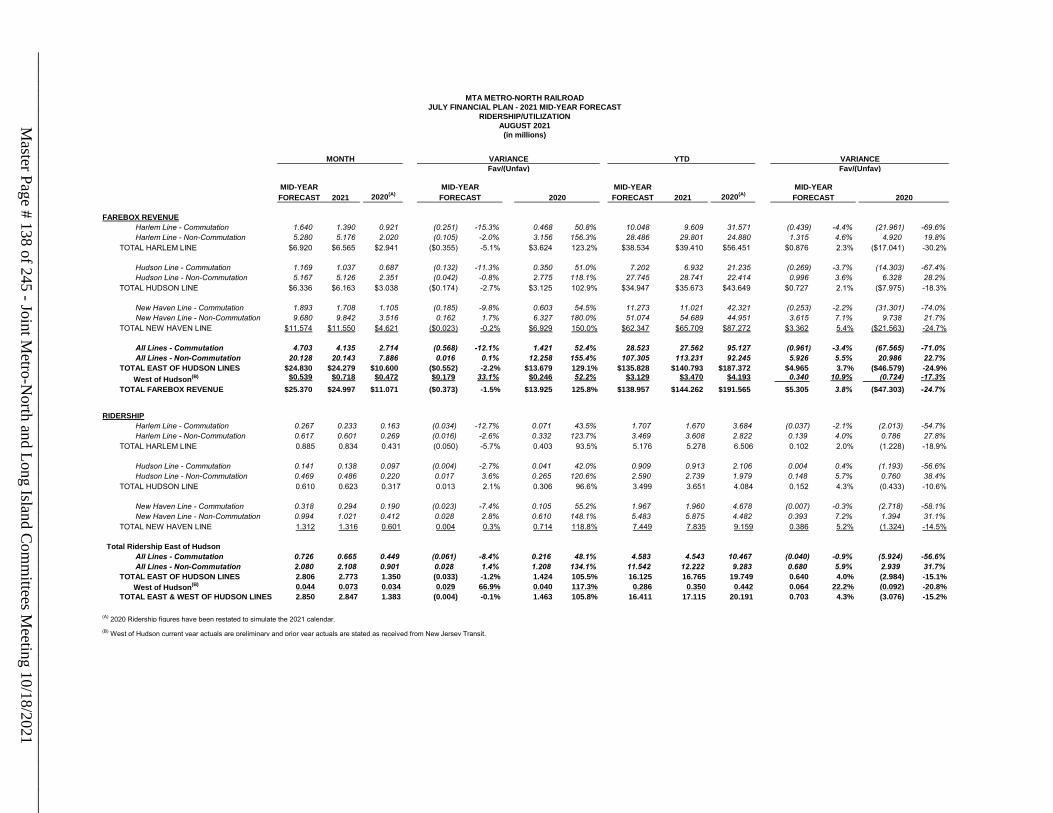
2021 2020(A) 2021 2020(A)
FAREBOX REVENUEHarlem Line - Commutation 1.640 1.390 0.921 (0.251) -15.3% 0.468 50.8% 10.048 9.609 31.571 (0.439) -4.4% (21.961) -69.6%Harlem Line - Non-Commutation 5.280 5.176 2.020 (0.105) -2.0% 3.156 156.3% 28.486 29.801 24.880 1.315 4.6% 4.920 19.8%
TOTAL HARLEM LINE $6.920 $6.565 $2.941 ($0.355) -5.1% $3.624 123.2% $38.534 $39.410 $56.451 $0.876 2.3% ($17.041) -30.2%
Hudson Line - Commutation 1.169 1.037 0.687 (0.132) -11.3% 0.350 51.0% 7.202 6.932 21.235 (0.269) -3.7% (14.303) -67.4%Hudson Line - Non-Commutation 5.167 5.126 2.351 (0.042) -0.8% 2.775 118.1% 27.745 28.741 22.414 0.996 3.6% 6.328 28.2%
TOTAL HUDSON LINE $6.336 $6.163 $3.038 ($0.174) -2.7% $3.125 102.9% $34.947 $35.673 $43.649 $0.727 2.1% ($7.975) -18.3%
New Haven Line - Commutation 1.893 1.708 1.105 (0.185) -9.8% 0.603 54.5% 11.273 11.021 42.321 (0.253) -2.2% (31.301) -74.0%New Haven Line - Non-Commutation 9.680 9.842 3.516 0.162 1.7% 6.327 180.0% 51.074 54.689 44.951 3.615 7.1% 9.738 21.7%
TOTAL NEW HAVEN LINE $11.574 $11.550 $4.621 ($0.023) -0.2% $6.929 150.0% $62.347 $65.709 $87.272 $3.362 5.4% ($21.563) -24.7%
All Lines - Commutation 4.703 4.135 2.714 (0.568) -12.1% 1.421 52.4% 28.523 27.562 95.127 (0.961) -3.4% (67.565) -71.0%All Lines - Non-Commutation 20.128 20.143 7.886 0.016 0.1% 12.258 155.4% 107.305 113.231 92.245 5.926 5.5% 20.986 22.7%
TOTAL EAST OF HUDSON LINES $24.830 $24.279 $10.600 ($0.552) -2.2% $13.679 129.1% $135.828 $140.793 $187.372 $4.965 3.7% ($46.579) -24.9% West of Hudson(B) $0.539 $0.718 $0.472 $0.179 33.1% $0.246 52.2% $3.129 $3.470 $4.193 0.340 10.9% (0.724) -17.3%
TOTAL FAREBOX REVENUE $25.370 $24.997 $11.071 ($0.373) -1.5% $13.925 125.8% $138.957 $144.262 $191.565 $5.305 3.8% ($47.303) -24.7%
RIDERSHIPHarlem Line - Commutation 0.267 0.233 0.163 (0.034) -12.7% 0.071 43.5% 1.707 1.670 3.684 (0.037) -2.1% (2.013) -54.7%Harlem Line - Non-Commutation 0.617 0.601 0.269 (0.016) -2.6% 0.332 123.7% 3.469 3.608 2.822 0.139 4.0% 0.786 27.8%
TOTAL HARLEM LINE 0.885 0.834 0.431 (0.050) -5.7% 0.403 93.5% 5.176 5.278 6.506 0.102 2.0% (1.228) -18.9%
Hudson Line - Commutation 0.141 0.138 0.097 (0.004) -2.7% 0.041 42.0% 0.909 0.913 2.106 0.004 0.4% (1.193) -56.6%Hudson Line - Non-Commutation 0.469 0.486 0.220 0.017 3.6% 0.265 120.6% 2.590 2.739 1.979 0.148 5.7% 0.760 38.4%
TOTAL HUDSON LINE 0.610 0.623 0.317 0.013 2.1% 0.306 96.6% 3.499 3.651 4.084 0.152 4.3% (0.433) -10.6%
New Haven Line - Commutation 0.318 0.294 0.190 (0.023) -7.4% 0.105 55.2% 1.967 1.960 4.678 (0.007) -0.3% (2.718) -58.1%New Haven Line - Non-Commutation 0.994 1.021 0.412 0.028 2.8% 0.610 148.1% 5.483 5.875 4.482 0.393 7.2% 1.394 31.1%
TOTAL NEW HAVEN LINE 1.312 1.316 0.601 0.004 0.3% 0.714 118.8% 7.449 7.835 9.159 0.386 5.2% (1.324) -14.5%
Total Ridership East of HudsonAll Lines - Commutation 0.726 0.665 0.449 (0.061) -8.4% 0.216 48.1% 4.583 4.543 10.467 (0.040) -0.9% (5.924) -56.6%All Lines - Non-Commutation 2.080 2.108 0.901 0.028 1.4% 1.208 134.1% 11.542 12.222 9.283 0.680 5.9% 2.939 31.7%
TOTAL EAST OF HUDSON LINES 2.806 2.773 1.350 (0.033) -1.2% 1.424 105.5% 16.125 16.765 19.749 0.640 4.0% (2.984) -15.1% West of Hudson(B) 0.044 0.073 0.034 0.029 66.9% 0.040 117.3% 0.286 0.350 0.442 0.064 22.2% (0.092) -20.8%
TOTAL EAST & WEST OF HUDSON LINES 2.850 2.847 1.383 (0.004) -0.1% 1.463 105.8% 16.411 17.115 20.191 0.703 4.3% (3.076) -15.2%
(A) 2020 Ridership figures have been restated to simulate the 2021 calendar.(B) West of Hudson current year actuals are preliminary and prior year actuals are stated as received from New Jersey Transit.
MTA METRO-NORTH RAILROADJULY FINANCIAL PLAN - 2021 MID-YEAR FORECAST
RIDERSHIP/UTILIZATIONAUGUST 2021
(in millions)
Fav/(Unfav) Fav/(Unfav)
MID-YEAR MID-YEAR MID-YEAR MID-YEAR
MONTH VARIANCE YTD VARIANCE
2020FORECAST FORECAST 2020 FORECAST FORECAST
Master Page # 138 of 245 - Joint M
etro-North and Long Island C
omm
ittees Meeting 10/18/2021
________________________________________________________________________________
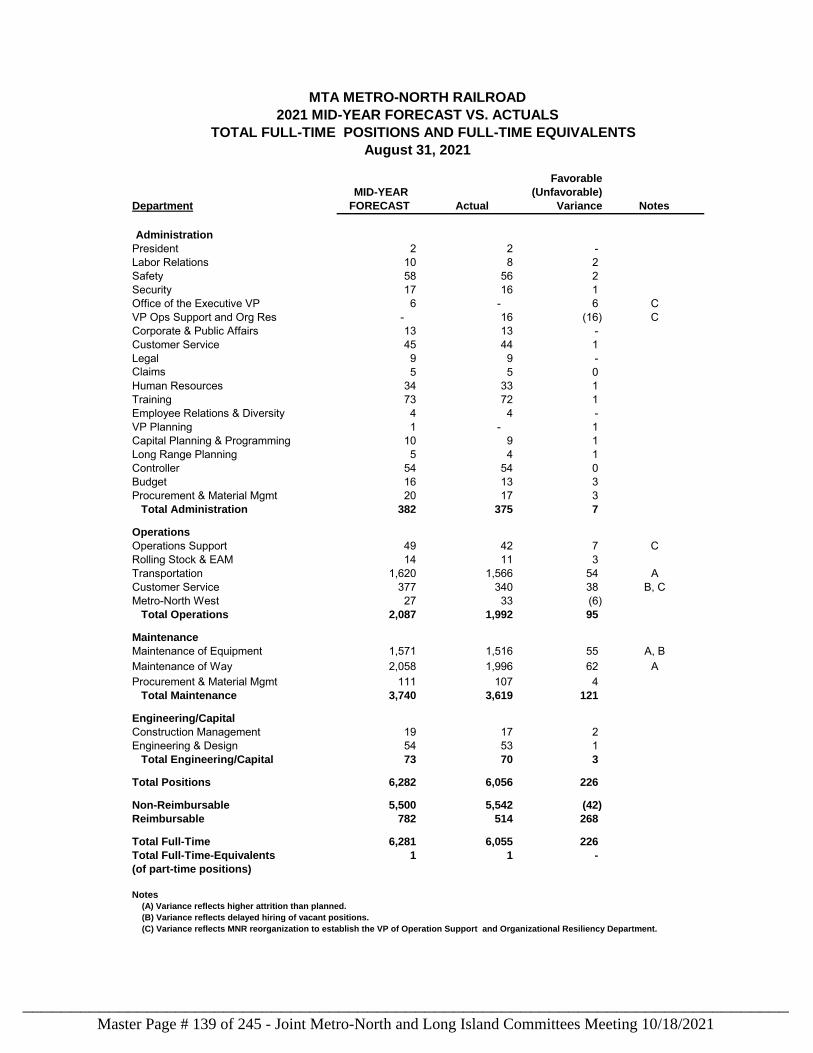
Department MID-YEAR FORECAST Actual
Favorable(Unfavorable)
Variance Notes
AdministrationPresident 2 2 - Labor Relations 10 8 2Safety 58 56 2 Security 17 16 1Office of the Executive VP 6 - 6 CVP Ops Support and Org Res - 16 (16) CCorporate & Public Affairs 13 13 - Customer Service 45 44 1 Legal 9 9 - Claims 5 5 0Human Resources 34 33 1Training 73 72 1 Employee Relations & Diversity 4 4 - VP Planning 1 - 1 Capital Planning & Programming 10 9 1 Long Range Planning 5 4 1 Controller 54 54 0 Budget 16 13 3 Procurement & Material Mgmt 20 17 3 Total Administration 382 375 7
OperationsOperations Support 49 42 7 CRolling Stock & EAM 14 11 3 Transportation 1,620 1,566 54 ACustomer Service 377 340 38 B, CMetro-North West 27 33 (6) Total Operations 2,087 1,992 95
MaintenanceMaintenance of Equipment 1,571 1,516 55 A, BMaintenance of Way 2,058 1,996 62 AProcurement & Material Mgmt 111 107 4 Total Maintenance 3,740 3,619 121
Engineering/CapitalConstruction Management 19 17 2 Engineering & Design 54 53 1 Total Engineering/Capital 73 70 3
Total Positions 6,282 6,056 226
Non-Reimbursable 5,500 5,542 (42) Reimbursable 782 514 268
Total Full-Time 6,281 6,055 226Total Full-Time-Equivalents 1 1 - (of part-time positions)
(A) Variance reflects higher attrition than planned.
MTA METRO-NORTH RAILROAD2021 MID-YEAR FORECAST VS. ACTUALS
TOTAL FULL-TIME POSITIONS AND FULL-TIME EQUIVALENTS August 31, 2021
Notes
(B) Variance reflects delayed hiring of vacant positions.(C) Variance reflects MNR reorganization to establish the VP of Operation Support and Organizational Resiliency Department.
Master Page # 139 of 245 - Joint Metro-North and Long Island Committees Meeting 10/18/2021________________________________________________________________________________
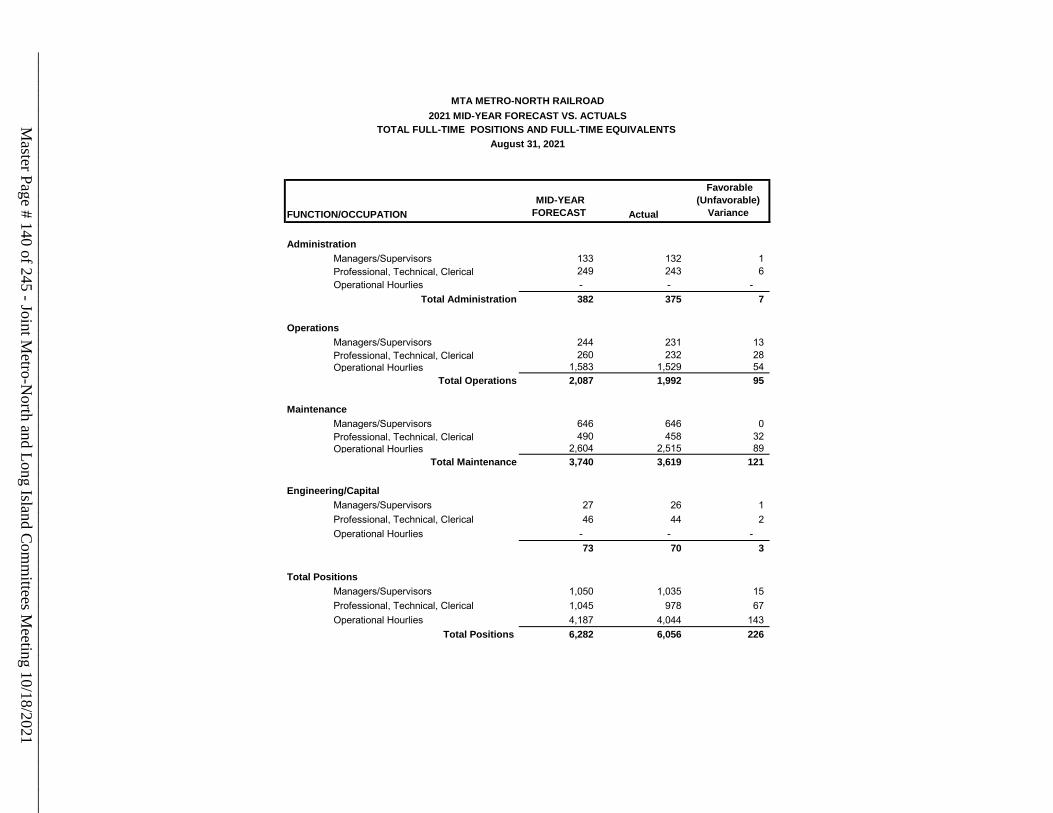
FUNCTION/OCCUPATION MID-YEAR FORECAST Actual
Favorable(Unfavorable)
Variance
Administration Managers/Supervisors 133 132 1 Professional, Technical, Clerical 249 243 6 Operational Hourlies - - -
Total Administration 382 375 7
Operations Managers/Supervisors 244 231 13 Professional, Technical, Clerical 260 232 28 Operational Hourlies 1,583 1,529 54
Total Operations 2,087 1,992 95
Maintenance Managers/Supervisors 646 646 0 Professional, Technical, Clerical 490 458 32 Operational Hourlies 2,604 2,515 89
Total Maintenance 3,740 3,619 121
Engineering/Capital Managers/Supervisors 27 26 1 Professional, Technical, Clerical 46 44 2 Operational Hourlies - - -
73 70 3
Total Positions Managers/Supervisors 1,050 1,035 15 Professional, Technical, Clerical 1,045 978 67 Operational Hourlies 4,187 4,044 143
Total Positions 6,282 6,056 226
MTA METRO-NORTH RAILROAD2021 MID-YEAR FORECAST VS. ACTUALS
TOTAL FULL-TIME POSITIONS AND FULL-TIME EQUIVALENTS August 31, 2021
Master Page # 140 of 245 - Joint M
etro-North and Long Island C
omm
ittees Meeting 10/18/2021
________________________________________________________________________________
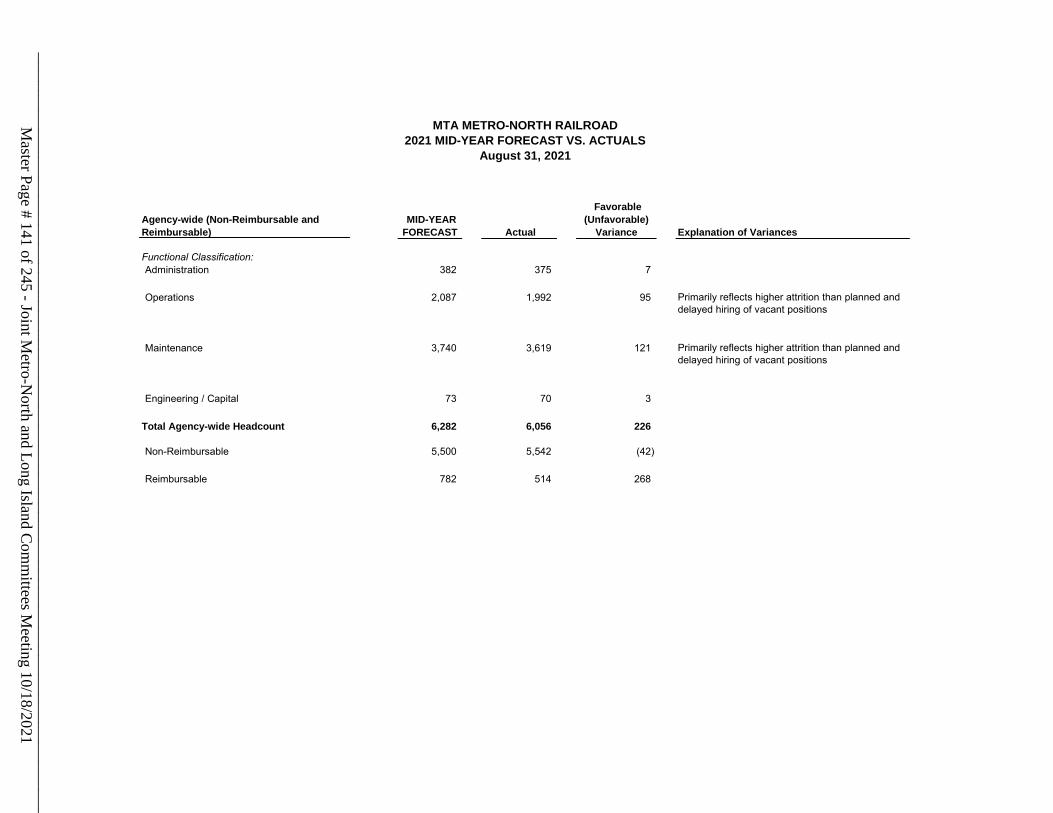
Agency-wide (Non-Reimbursable and Reimbursable)
MID-YEAR FORECAST Actual
Favorable(Unfavorable)
Variance Explanation of Variances
Functional Classification:Administration 382 375 7
Operations 2,087 1,992 95 Primarily reflects higher attrition than planned and delayed hiring of vacant positions
Maintenance 3,740 3,619 121 Primarily reflects higher attrition than planned and delayed hiring of vacant positions
Engineering / Capital 73 70 3
Total Agency-wide Headcount 6,282 6,056 226
Non-Reimbursable 5,500 5,542 (42)
Reimbursable 782 514 268
MTA METRO-NORTH RAILROAD2021 MID-YEAR FORECAST VS. ACTUALS
August 31, 2021
Master Page # 141 of 245 - Joint M
etro-North and Long Island C
omm
ittees Meeting 10/18/2021
________________________________________________________________________________
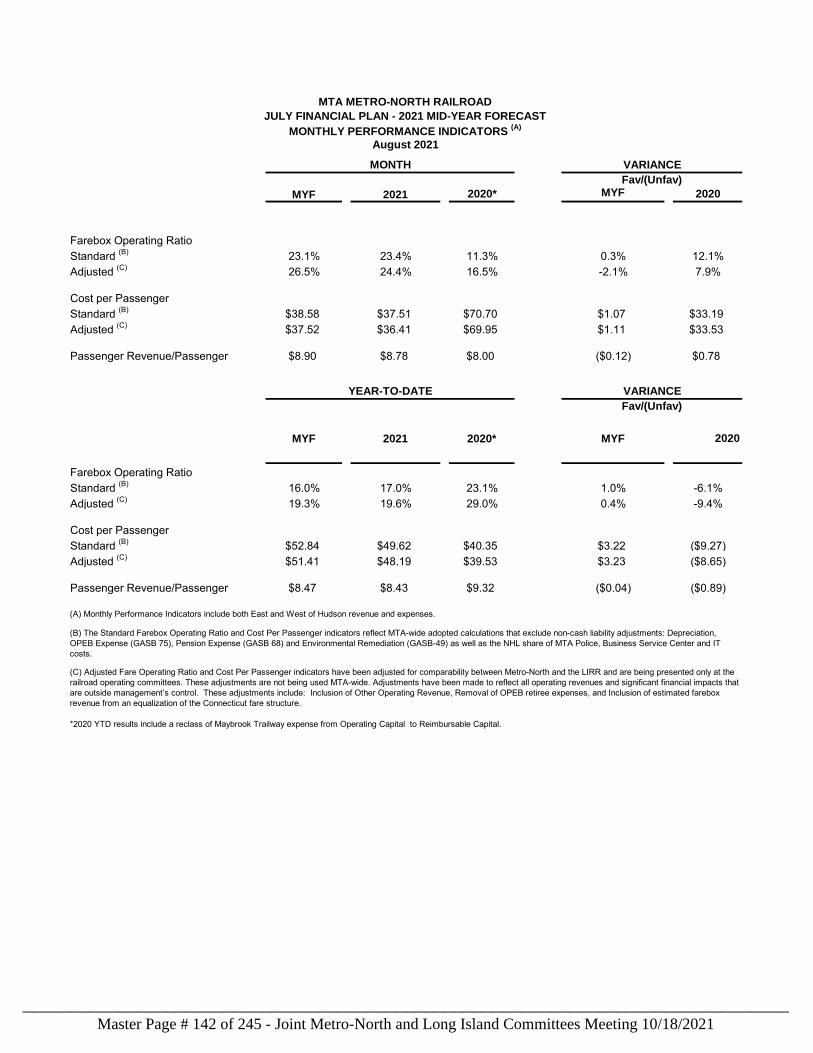
VARIANCE
MYF 2021 2020* MYF 2020
Farebox Operating Ratio Standard (B) 23.1% 23.4% 11.3% 0.3% 12.1%Adjusted (C) 26.5% 24.4% 16.5% -2.1% 7.9%
Cost per Passenger Standard (B) $38.58 $37.51 $70.70 $1.07 $33.19Adjusted (C) $37.52 $36.41 $69.95 $1.11 $33.53
Passenger Revenue/Passenger $8.90 $8.78 $8.00 ($0.12) $0.78
VARIANCE
MYF 2021 2020* MYF 2020
Farebox Operating Ratio Standard (B) 16.0% 17.0% 23.1% 1.0% -6.1%Adjusted (C) 19.3% 19.6% 29.0% 0.4% -9.4%
Cost per Passenger Standard (B) $52.84 $49.62 $40.35 $3.22 ($9.27)Adjusted (C) $51.41 $48.19 $39.53 $3.23 ($8.65)
Passenger Revenue/Passenger $8.47 $8.43 $9.32 ($0.04) ($0.89)
Fav/(Unfav)
MTA METRO-NORTH RAILROADJULY FINANCIAL PLAN - 2021 MID-YEAR FORECAST
MONTHLY PERFORMANCE INDICATORS (A)
August 2021
MONTH
*2020 YTD results include a reclass of Maybrook Trailway expense from Operating Capital to Reimbursable Capital.
YEAR-TO-DATEFav/(Unfav)
(A) Monthly Performance Indicators include both East and West of Hudson revenue and expenses.
(B) The Standard Farebox Operating Ratio and Cost Per Passenger indicators reflect MTA-wide adopted calculations that exclude non-cash liability adjustments: Depreciation, OPEB Expense (GASB 75), Pension Expense (GASB 68) and Environmental Remediation (GASB-49) as well as the NHL share of MTA Police, Business Service Center and IT costs.
(C) Adjusted Fare Operating Ratio and Cost Per Passenger indicators have been adjusted for comparability between Metro-North and the LIRR and are being presented only at the railroad operating committees. These adjustments are not being used MTA-wide. Adjustments have been made to reflect all operating revenues and significant financial impacts that are outside management’s control. These adjustments include: Inclusion of Other Operating Revenue, Removal of OPEB retiree expenses, and Inclusion of estimated farebox revenue from an equalization of the Connecticut fare structure.
Master Page # 142 of 245 - Joint Metro-North and Long Island Committees Meeting 10/18/2021________________________________________________________________________________
Monthly Ridership Report Ben Cornelius Director – Operations Planning & Analysis
September 2021 North White Plains Station Photo provided by Luis Rodriguez
Master Page # 143 of 245 - Joint Metro-North and Long Island Committees Meeting 10/18/2021________________________________________________________________________________

September 2021 Highlights: Ridership Report
(Note: September West of Hudson ridership is preliminary) September 2021 vs. 2020
The substantial ridership increase in September 2021 compared to September 2020 is attributed to the impact of return-to-work policies and school reopenings, vaccinations, and testing regimes facilitating the gradual return of normal commutation patterns and discretionary travel, as compared to conditions before these strategies were implemented.
East of Hudson ridership increased 82.2% vs. September 2020 and was 10.57% above the forecast. • East of Hudson Commutation ridership increased by 47.6%. • East of Hudson Non-Commutation ridership increased by 99.0%.
East of Hudson Ridership by Line:
• Hudson Line Ridership increased by 58.0%. • Harlem Line Ridership increased by 77.9%. • New Haven Line Ridership increased by 97.8%.
West of Hudson Ridership by Line:
• Port Jervis Line Ridership increased by 69.7%. • Pascack Valley Line Ridership increased by 126%.
September 2021 vs. 2019
Total Rail Ridership decreased by -59.0%. • East of Hudson ridership decreased by -56.6%. • West of Hudson ridership decreased by -55.1%.
Note: September ridership Includes Mail & Ride returned and unused refund adjustments.
Ben Cornelius Director Operations Planning & Analysis
Master Page # 144 of 245 - Joint Metro-North and Long Island Committees Meeting 10/18/2021________________________________________________________________________________
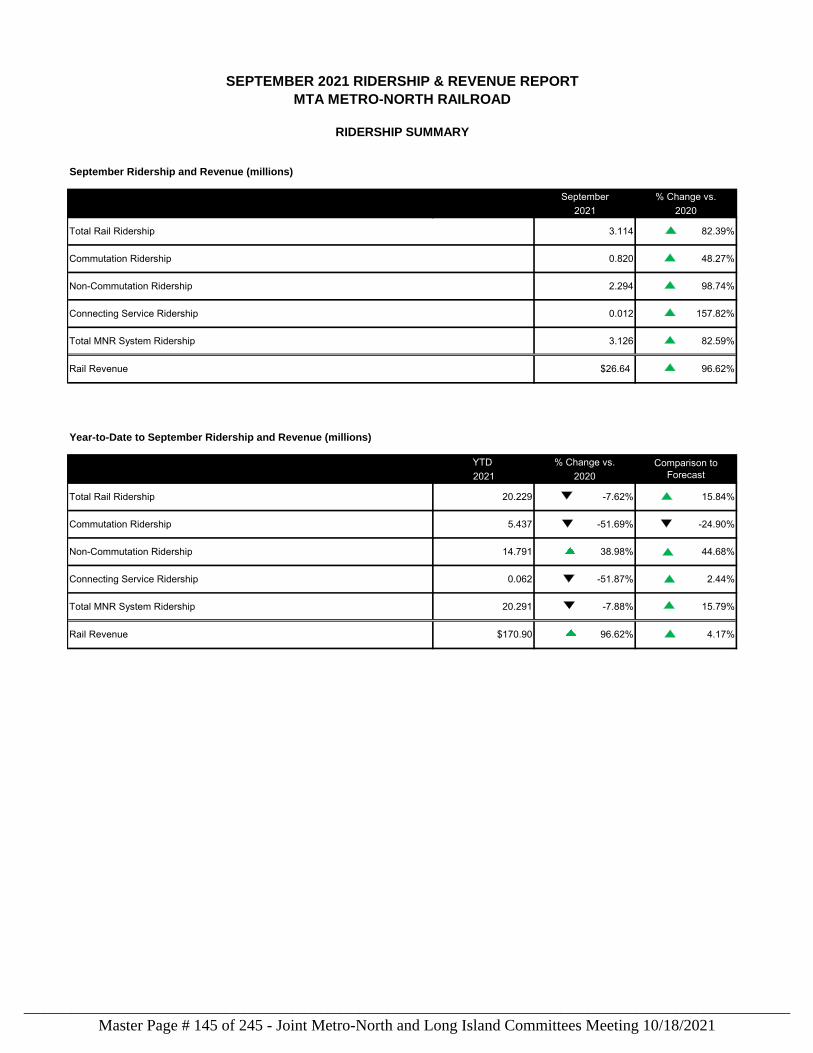
September Ridership and Revenue (millions)
September % Change vs.2021 2020
Year-to-Date to September Ridership and Revenue (millions)
YTD % Change vs.2021 2020
Total MNR System Ridership 20.291 -7.88% 15.79%
Rail Revenue $170.90 96.62% 4.17%
Non-Commutation Ridership 14.791 38.98% 44.68%
Connecting Service Ridership 0.062 -51.87% 2.44%
Total Rail Ridership 20.229 -7.62% 15.84%
Commutation Ridership 5.437 -51.69% -24.90%
Rail Revenue $26.64 96.62%
Comparison to Forecast
Connecting Service Ridership 0.012 157.82%
Total MNR System Ridership 3.126 82.59%
Commutation Ridership 0.820 48.27%
Non-Commutation Ridership 2.294 98.74%
SEPTEMBER 2021 RIDERSHIP & REVENUE REPORTMTA METRO-NORTH RAILROAD
RIDERSHIP SUMMARY
Total Rail Ridership 3.114 82.39%
`
`
`
`
`
`
`
`
`
`
Master Page # 145 of 245 - Joint Metro-North and Long Island Committees Meeting 10/18/2021________________________________________________________________________________
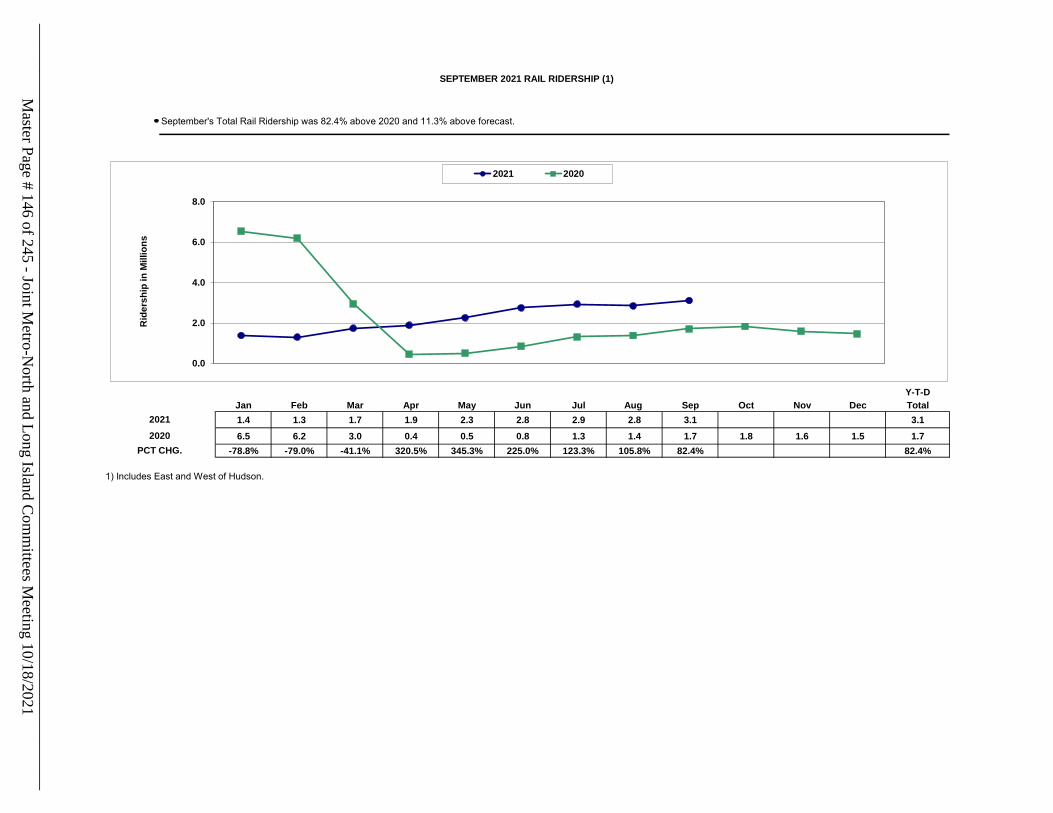
September's Total Rail Ridership was 82.4% above 2020 and 11.3% above forecast.
Y-T-DJan Feb Mar Apr May Jun Jul Aug Sep Oct Nov Dec Total1.4 1.3 1.7 1.9 2.3 2.8 2.9 2.8 3.1 3.16.5 6.2 3.0 0.4 0.5 0.8 1.3 1.4 1.7 1.8 1.6 1.5 1.7
-78.8% -79.0% -41.1% 320.5% 345.3% 225.0% 123.3% 105.8% 82.4% 82.4%
1) Includes East and West of Hudson.
SEPTEMBER 2021 RAIL RIDERSHIP (1)
20212020
PCT CHG.
0.0
2.0
4.0
6.0
8.0
Rid
ersh
ip in
Mill
ions
.
2021 2020
Master Page # 146 of 245 - Joint M
etro-North and Long Island C
omm
ittees Meeting 10/18/2021
________________________________________________________________________________
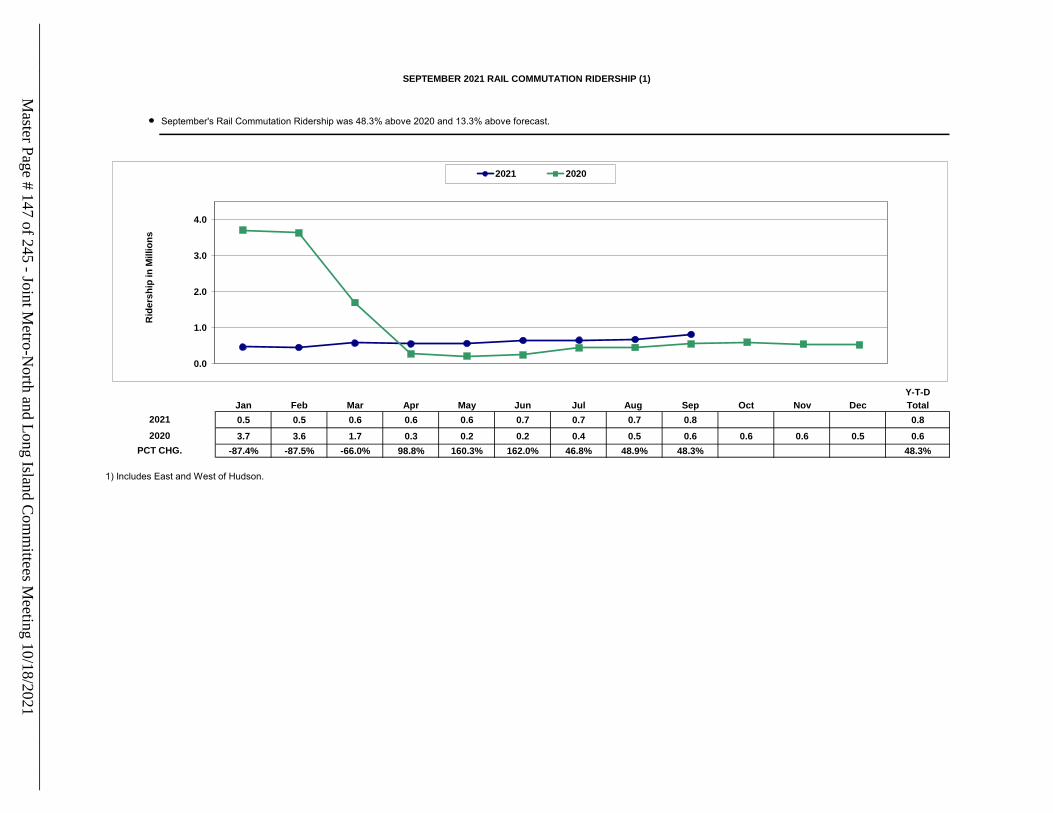
September's Rail Commutation Ridership was 48.3% above 2020 and 13.3% above forecast.
Y-T-DJan Feb Mar Apr May Jun Jul Aug Sep Oct Nov Dec Total0.5 0.5 0.6 0.6 0.6 0.7 0.7 0.7 0.8 0.83.7 3.6 1.7 0.3 0.2 0.2 0.4 0.5 0.6 0.6 0.6 0.5 0.6
-87.4% -87.5% -66.0% 98.8% 160.3% 162.0% 46.8% 48.9% 48.3% 48.3%
1) Includes East and West of Hudson.
SEPTEMBER 2021 RAIL COMMUTATION RIDERSHIP (1)
20212020
PCT CHG.
0.0
1.0
2.0
3.0
4.0
Rid
ersh
ip in
Mill
ions
.
2021 2020
Master Page # 147 of 245 - Joint M
etro-North and Long Island C
omm
ittees Meeting 10/18/2021
________________________________________________________________________________
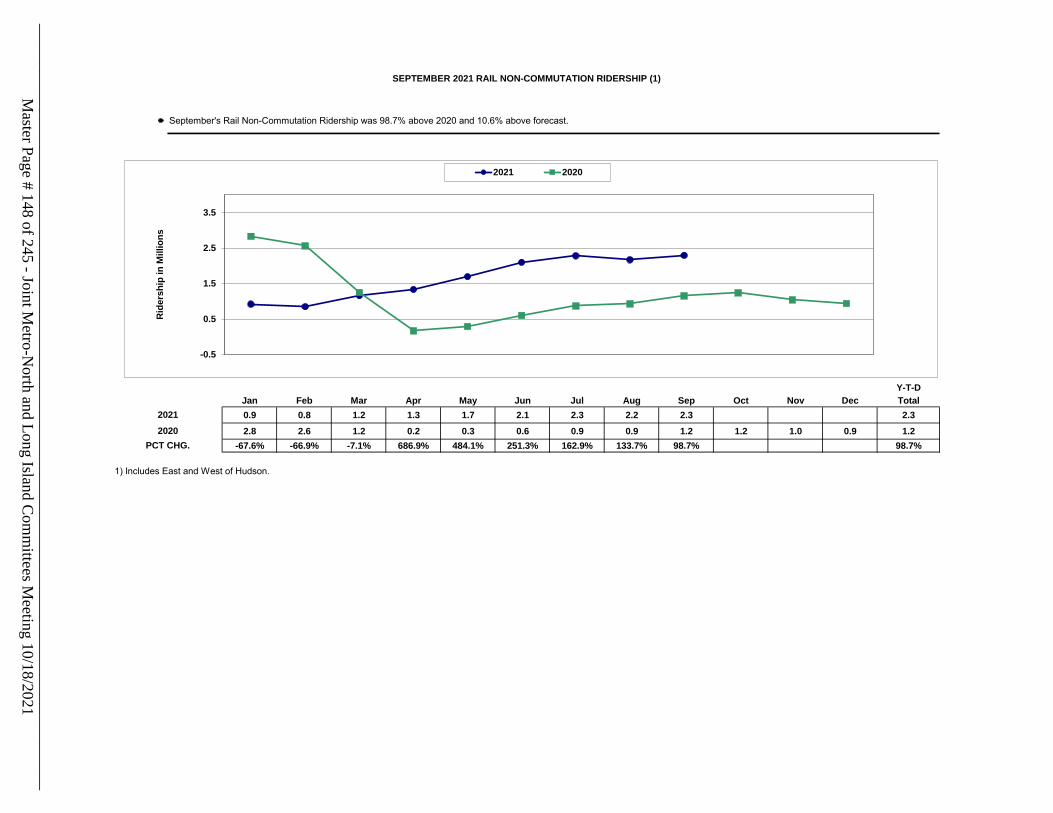
September's Rail Non-Commutation Ridership was 98.7% above 2020 and 10.6% above forecast.
Y-T-DJan Feb Mar Apr May Jun Jul Aug Sep Oct Nov Dec Total0.9 0.8 1.2 1.3 1.7 2.1 2.3 2.2 2.3 2.32.8 2.6 1.2 0.2 0.3 0.6 0.9 0.9 1.2 1.2 1.0 0.9 1.2
-67.6% -66.9% -7.1% 686.9% 484.1% 251.3% 162.9% 133.7% 98.7% 98.7%
1) Includes East and West of Hudson.
SEPTEMBER 2021 RAIL NON-COMMUTATION RIDERSHIP (1)
20212020
PCT CHG.
-0.5
0.5
1.5
2.5
3.5
Rid
ersh
ip in
Mill
ions
.2021 2020
Master Page # 148 of 245 - Joint M
etro-North and Long Island C
omm
ittees Meeting 10/18/2021
________________________________________________________________________________
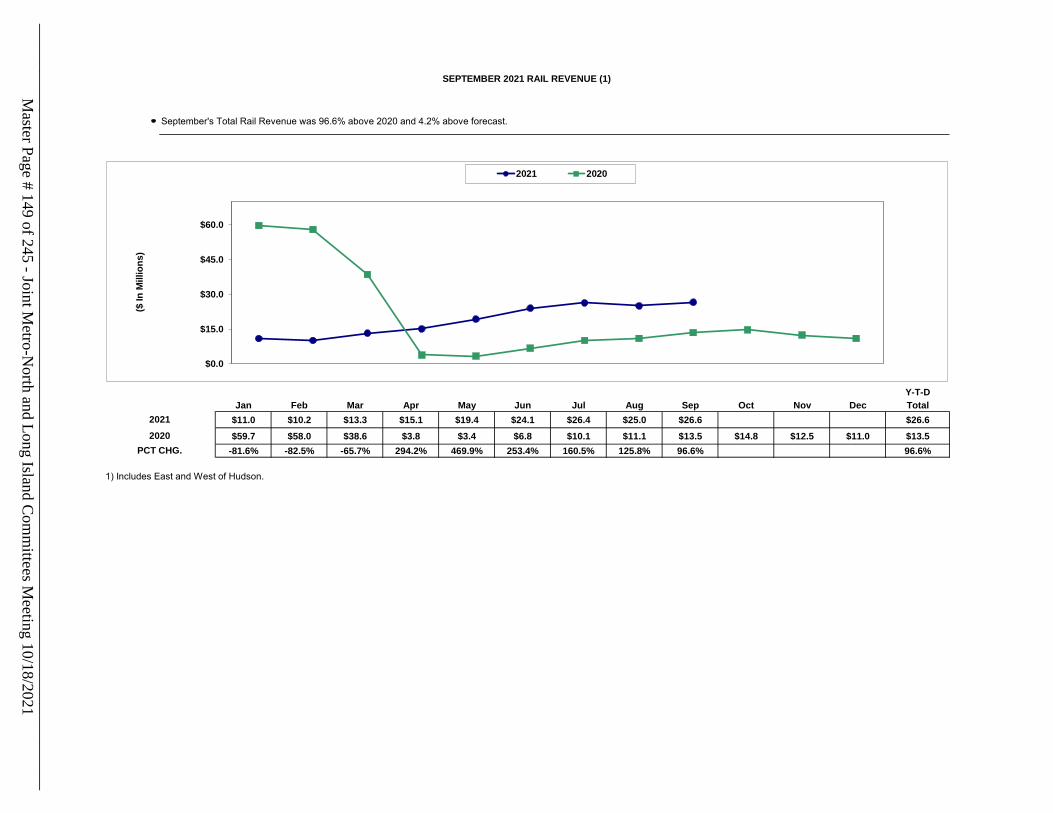
September's Total Rail Revenue was 96.6% above 2020 and 4.2% above forecast.
Y-T-DJan Feb Mar Apr May Jun Jul Aug Sep Oct Nov Dec Total
$11.0 $10.2 $13.3 $15.1 $19.4 $24.1 $26.4 $25.0 $26.6 $26.6$59.7 $58.0 $38.6 $3.8 $3.4 $6.8 $10.1 $11.1 $13.5 $14.8 $12.5 $11.0 $13.5
-81.6% -82.5% -65.7% 294.2% 469.9% 253.4% 160.5% 125.8% 96.6% 96.6%
1) Includes East and West of Hudson.
SEPTEMBER 2021 RAIL REVENUE (1)
20212020
PCT CHG.
$0.0
$15.0
$30.0
$45.0
$60.0
($ In
Mill
ions
).
2021 2020
Master Page # 149 of 245 - Joint M
etro-North and Long Island C
omm
ittees Meeting 10/18/2021
________________________________________________________________________________

TICKET TYPE/SERVICE AMOUNT PERCENT AMOUNT PERCENT
RAIL COMMUTATION RIDERSHIP East of Hudson 805,067 712,857 92,210 12.9% 545,454 259,613 47.6%West of Hudson 14,791 10,542 4,249 40.3% 7,478 7,313 97.8%Total Rail Commutation Ridership 819,858 723,399 96,459 13.3% 552,932 266,926 48.3%
RAIL NON-COMMUTATION RIDERSHIPEast of Hudson 2,239,914 2,041,098 198,816 9.7% 1,125,369 1,114,545 99.0%West of Hudson 54,034 32,667 21,367 65.4% 28,901 25,133 87.0%Total Rail Non-Commutation Ridership 2,293,948 2,073,766 220,182 10.6% 1,154,270 1,139,678 98.7%
TOTAL RAIL RIDERSHIPEast of Hudson 3,044,981 2,753,955 291,026 10.57% 1,670,823 1,374,158 82.2%West of Hudson (2) 68,825 43,210 25,615 59.3% 36,379 32,446 89.2%TOTAL RAIL RIDERSHIP 3,113,806 2,797,165 316,641 11.3% 1,707,202 1,406,604 82.4%
CONNECTING SERVICES RIDERSHIP 11,710 13,009 (1,299) -10.0% 4,542 7,168 157.8%
TOTAL MNR SYSTEM RIDERSHIP 3,125,516 2,810,174 315,342 11.2% 1,711,744 1,413,772 82.6%
Notes:1) 2020 ridership figures have been restated to eliminate calendar impacts on ridership.2) West of Hudson ridership figures are preliminary.
ACTUAL FORECAST RESTATED (1)
MTA METRO-NORTH RAILROADRIDERSHIP SUMMARY
SEPTEMBER 2021
SEPTEMBER SEPTEMBER VARIANCE VS. SEPTEMBER
2021 2021 FORECAST 2020 CHANGE FROM 2020
Master Page # 150 of 245 - Joint M
etro-North and Long Island C
omm
ittees Meeting 10/18/2021
________________________________________________________________________________
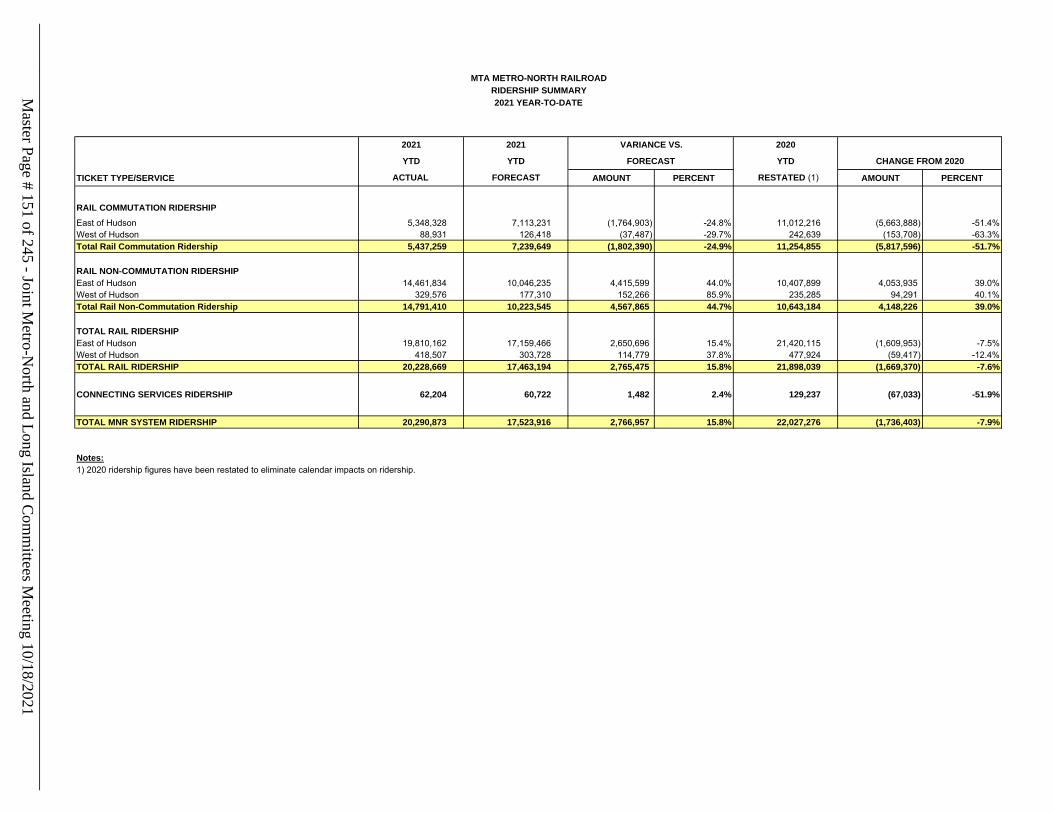
TICKET TYPE/SERVICE AMOUNT PERCENT AMOUNT PERCENT
RAIL COMMUTATION RIDERSHIP East of Hudson 5,348,328 7,113,231 (1,764,903) -24.8% 11,012,216 (5,663,888) -51.4%West of Hudson 88,931 126,418 (37,487) -29.7% 242,639 (153,708) -63.3%Total Rail Commutation Ridership 5,437,259 7,239,649 (1,802,390) -24.9% 11,254,855 (5,817,596) -51.7%
RAIL NON-COMMUTATION RIDERSHIPEast of Hudson 14,461,834 10,046,235 4,415,599 44.0% 10,407,899 4,053,935 39.0%West of Hudson 329,576 177,310 152,266 85.9% 235,285 94,291 40.1%Total Rail Non-Commutation Ridership 14,791,410 10,223,545 4,567,865 44.7% 10,643,184 4,148,226 39.0%
TOTAL RAIL RIDERSHIPEast of Hudson 19,810,162 17,159,466 2,650,696 15.4% 21,420,115 (1,609,953) -7.5%West of Hudson 418,507 303,728 114,779 37.8% 477,924 (59,417) -12.4%TOTAL RAIL RIDERSHIP 20,228,669 17,463,194 2,765,475 15.8% 21,898,039 (1,669,370) -7.6%
CONNECTING SERVICES RIDERSHIP 62,204 60,722 1,482 2.4% 129,237 (67,033) -51.9%
TOTAL MNR SYSTEM RIDERSHIP 20,290,873 17,523,916 2,766,957 15.8% 22,027,276 (1,736,403) -7.9%
Notes:1) 2020 ridership figures have been restated to eliminate calendar impacts on ridership.
YTD YTD FORECAST YTD CHANGE FROM 2020
ACTUAL FORECAST RESTATED (1)
MTA METRO-NORTH RAILROADRIDERSHIP SUMMARY2021 YEAR-TO-DATE
2021 2021 VARIANCE VS. 2020
Master Page # 151 of 245 - Joint M
etro-North and Long Island C
omm
ittees Meeting 10/18/2021
________________________________________________________________________________
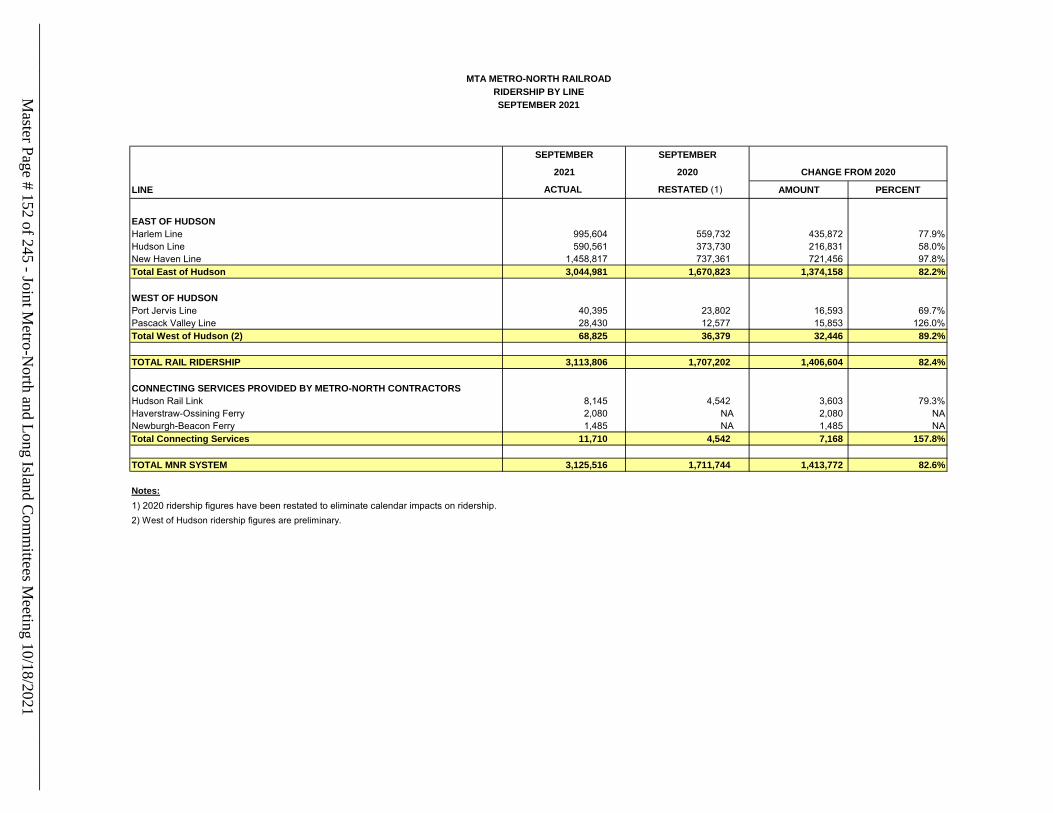
LINE AMOUNT PERCENT
EAST OF HUDSONHarlem Line 995,604 559,732 435,872 77.9%Hudson Line 590,561 373,730 216,831 58.0%New Haven Line 1,458,817 737,361 721,456 97.8%Total East of Hudson 3,044,981 1,670,823 1,374,158 82.2%
WEST OF HUDSONPort Jervis Line 40,395 23,802 16,593 69.7%Pascack Valley Line 28,430 12,577 15,853 126.0%Total West of Hudson (2) 68,825 36,379 32,446 89.2%
TOTAL RAIL RIDERSHIP 3,113,806 1,707,202 1,406,604 82.4%
CONNECTING SERVICES PROVIDED BY METRO-NORTH CONTRACTORSHudson Rail Link 8,145 4,542 3,603 79.3%Haverstraw-Ossining Ferry 2,080 NA 2,080 NANewburgh-Beacon Ferry 1,485 NA 1,485 NATotal Connecting Services 11,710 4,542 7,168 157.8%
TOTAL MNR SYSTEM 3,125,516 1,711,744 1,413,772 82.6%
Notes:1) 2020 ridership figures have been restated to eliminate calendar impacts on ridership.
MTA METRO-NORTH RAILROADRIDERSHIP BY LINESEPTEMBER 2021
SEPTEMBER SEPTEMBER
2021 2020 CHANGE FROM 2020
ACTUAL RESTATED (1)
2) West of Hudson ridership figures are preliminary.
Master Page # 152 of 245 - Joint M
etro-North and Long Island C
omm
ittees Meeting 10/18/2021
________________________________________________________________________________
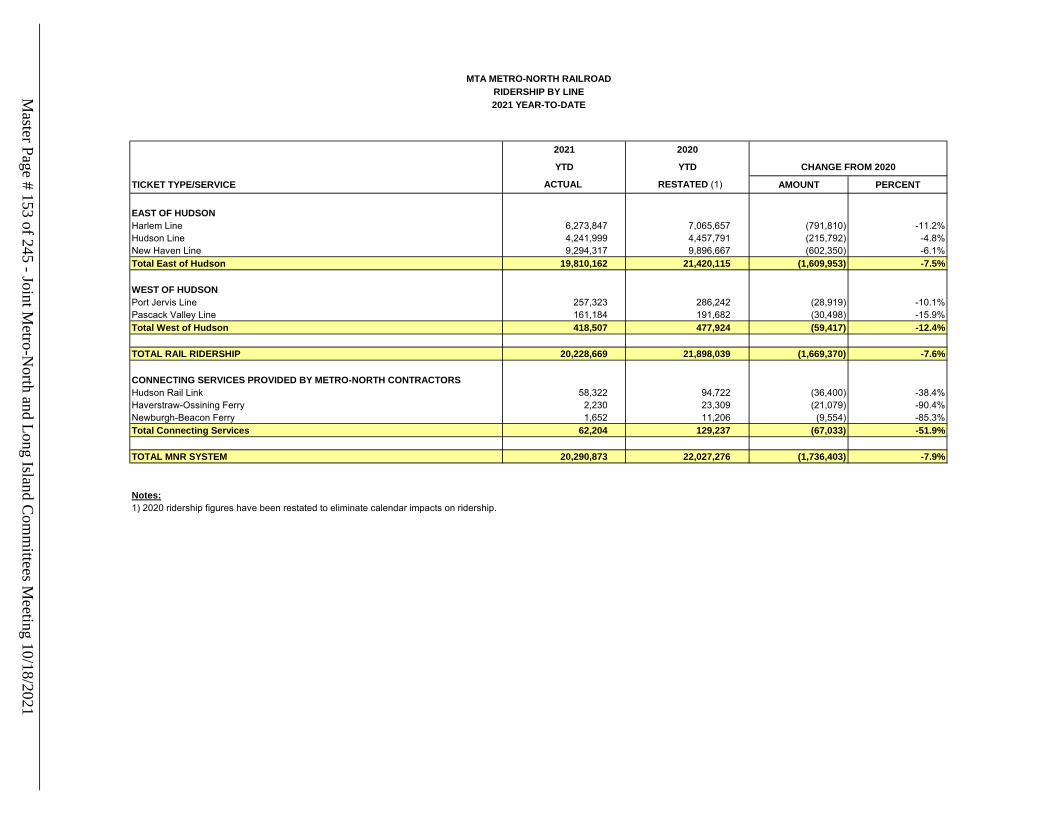
TICKET TYPE/SERVICE AMOUNT PERCENT
EAST OF HUDSONHarlem Line 6,273,847 7,065,657 (791,810) -11.2%Hudson Line 4,241,999 4,457,791 (215,792) -4.8%New Haven Line 9,294,317 9,896,667 (602,350) -6.1%Total East of Hudson 19,810,162 21,420,115 (1,609,953) -7.5%
WEST OF HUDSONPort Jervis Line 257,323 286,242 (28,919) -10.1%Pascack Valley Line 161,184 191,682 (30,498) -15.9%Total West of Hudson 418,507 477,924 (59,417) -12.4%
TOTAL RAIL RIDERSHIP 20,228,669 21,898,039 (1,669,370) -7.6%
CONNECTING SERVICES PROVIDED BY METRO-NORTH CONTRACTORSHudson Rail Link 58,322 94,722 (36,400) -38.4%Haverstraw-Ossining Ferry 2,230 23,309 (21,079) -90.4%Newburgh-Beacon Ferry 1,652 11,206 (9,554) -85.3%Total Connecting Services 62,204 129,237 (67,033) -51.9%
TOTAL MNR SYSTEM 20,290,873 22,027,276 (1,736,403) -7.9%
Notes:1) 2020 ridership figures have been restated to eliminate calendar impacts on ridership.
2021 2020
YTD YTD CHANGE FROM 2020
ACTUAL RESTATED (1)
2021 YEAR-TO-DATE
MTA METRO-NORTH RAILROADRIDERSHIP BY LINEM
aster Page # 153 of 245 - Joint Metro-N
orth and Long Island Com
mittees M
eeting 10/18/2021________________________________________________________________________________
Monthly Ridership Report Ben Cornelius Director – Operations Planning & Analysis
August 2021 Grand Central Terminal Photo provided by Luis Rodriguez
Master Page # 154 of 245 - Joint Metro-North and Long Island Committees Meeting 10/18/2021________________________________________________________________________________
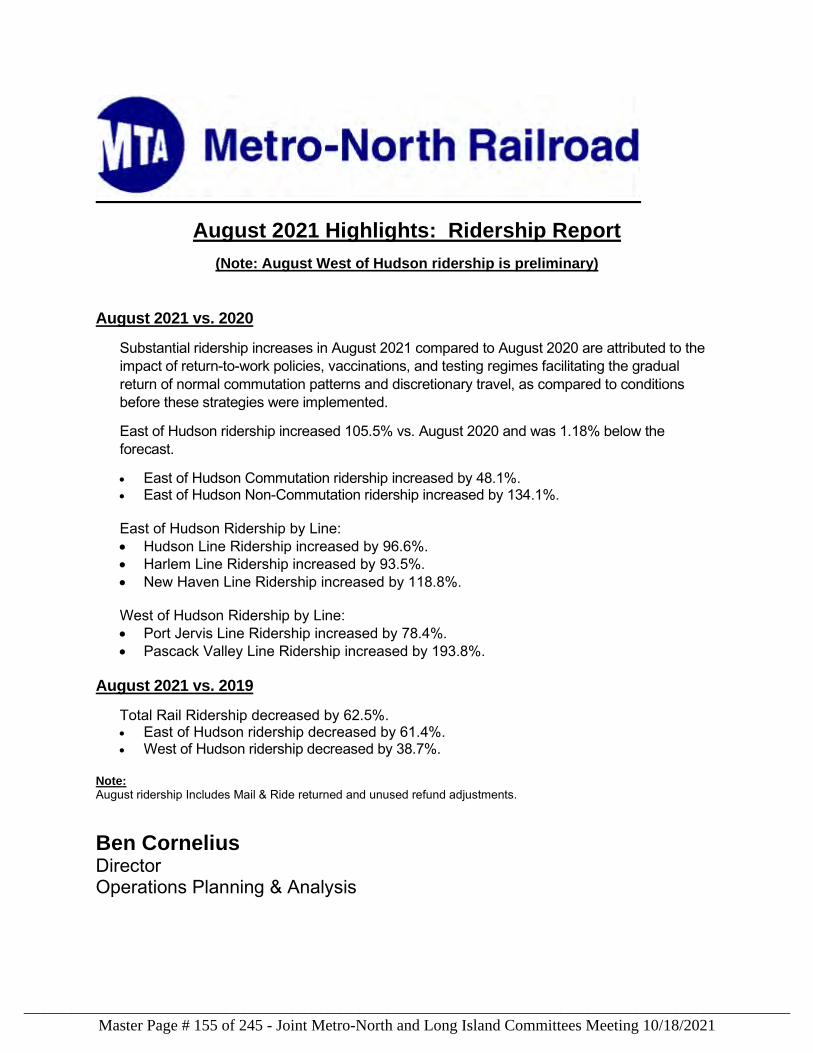
August 2021 Highlights: Ridership Report
(Note: August West of Hudson ridership is preliminary) August 2021 vs. 2020
Substantial ridership increases in August 2021 compared to August 2020 are attributed to the impact of return-to-work policies, vaccinations, and testing regimes facilitating the gradual return of normal commutation patterns and discretionary travel, as compared to conditions before these strategies were implemented.
East of Hudson ridership increased 105.5% vs. August 2020 and was 1.18% below the forecast.
• East of Hudson Commutation ridership increased by 48.1%. • East of Hudson Non-Commutation ridership increased by 134.1%.
East of Hudson Ridership by Line:
• Hudson Line Ridership increased by 96.6%. • Harlem Line Ridership increased by 93.5%. • New Haven Line Ridership increased by 118.8%.
West of Hudson Ridership by Line:
• Port Jervis Line Ridership increased by 78.4%. • Pascack Valley Line Ridership increased by 193.8%.
August 2021 vs. 2019
Total Rail Ridership decreased by 62.5%. • East of Hudson ridership decreased by 61.4%. • West of Hudson ridership decreased by 38.7%.
Note: August ridership Includes Mail & Ride returned and unused refund adjustments.
Ben Cornelius Director Operations Planning & Analysis
Master Page # 155 of 245 - Joint Metro-North and Long Island Committees Meeting 10/18/2021________________________________________________________________________________
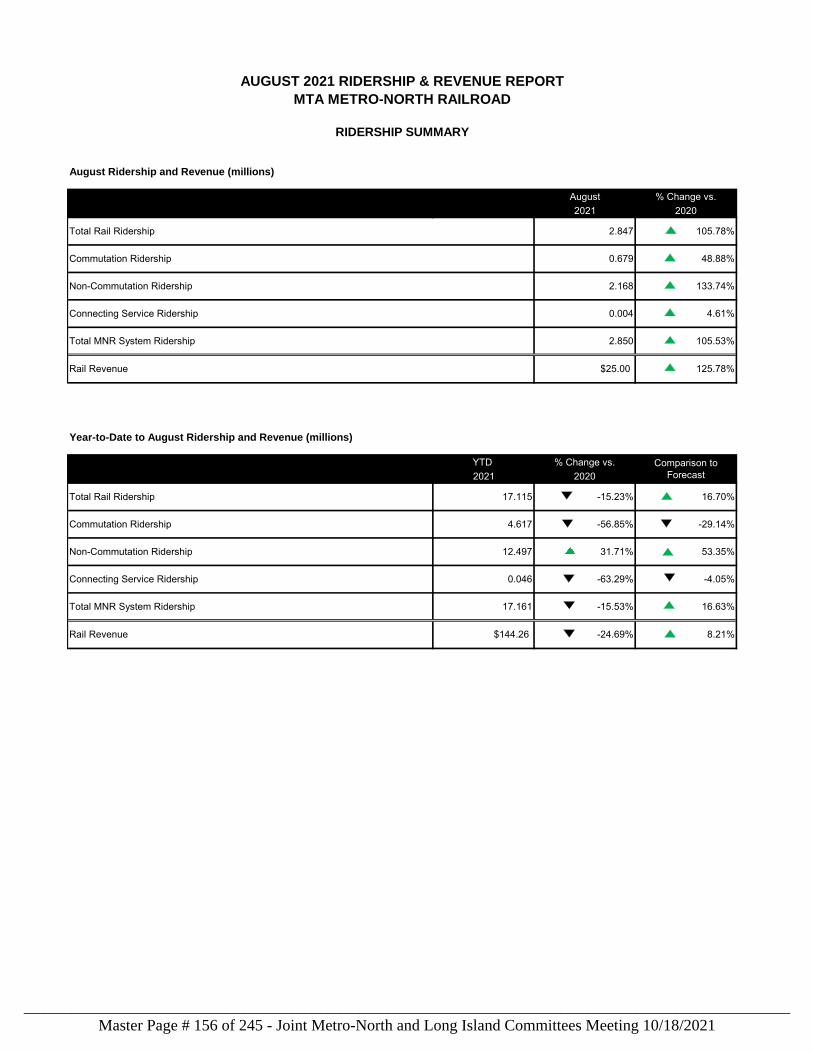
August Ridership and Revenue (millions)
August % Change vs.2021 2020
Year-to-Date to August Ridership and Revenue (millions)
YTD % Change vs.2021 2020
Non-Commutation Ridership 2.168
Connecting Service Ridership 0.004
Total MNR System Ridership 2.850
Rail Revenue $25.00
Connecting Service Ridership 0.046 -63.29% -4.05%
Commutation Ridership 4.617 -56.85% -29.14%
Non-Commutation Ridership 12.497 31.71% 53.35%
Comparison to Forecast
Total Rail Ridership
AUGUST 2021 RIDERSHIP & REVENUE REPORTMTA METRO-NORTH RAILROAD
RIDERSHIP SUMMARY
Total Rail Ridership 2.847
Commutation Ridership 0.679
125.78%
17.115 -15.23%
Rail Revenue $144.26 -24.69% 8.21%
Total MNR System Ridership 17.161 -15.53% 16.63%
16.70%
105.78%
48.88%
133.74%
4.61%
105.53%
`
`
`
`
`
`
`
`
`
`
`
`
`
`
Master Page # 156 of 245 - Joint Metro-North and Long Island Committees Meeting 10/18/2021________________________________________________________________________________
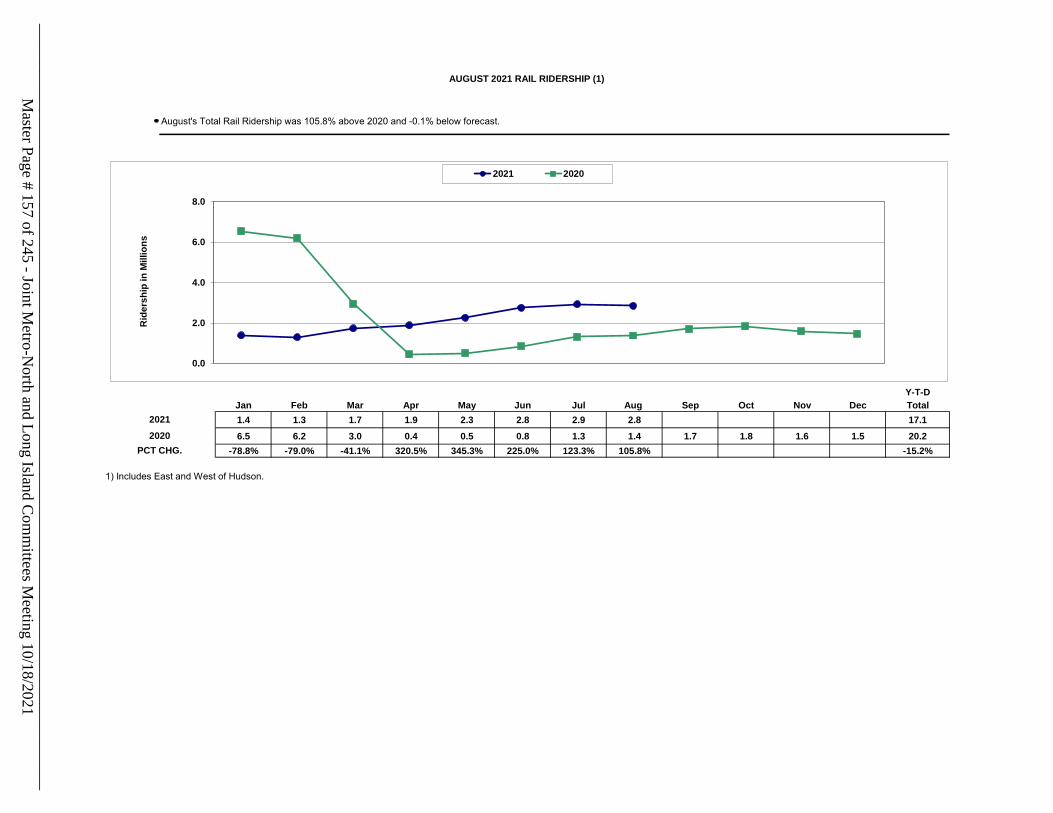
August's Total Rail Ridership was 105.8% above 2020 and -0.1% below forecast.
Y-T-DJan Feb Mar Apr May Jun Jul Aug Sep Oct Nov Dec Total1.4 1.3 1.7 1.9 2.3 2.8 2.9 2.8 17.16.5 6.2 3.0 0.4 0.5 0.8 1.3 1.4 1.7 1.8 1.6 1.5 20.2
-78.8% -79.0% -41.1% 320.5% 345.3% 225.0% 123.3% 105.8% -15.2%
1) Includes East and West of Hudson.
AUGUST 2021 RAIL RIDERSHIP (1)
20212020
PCT CHG.
0.0
2.0
4.0
6.0
8.0
Rid
ersh
ip in
Mill
ions
.
2021 2020
Master Page # 157 of 245 - Joint M
etro-North and Long Island C
omm
ittees Meeting 10/18/2021
________________________________________________________________________________
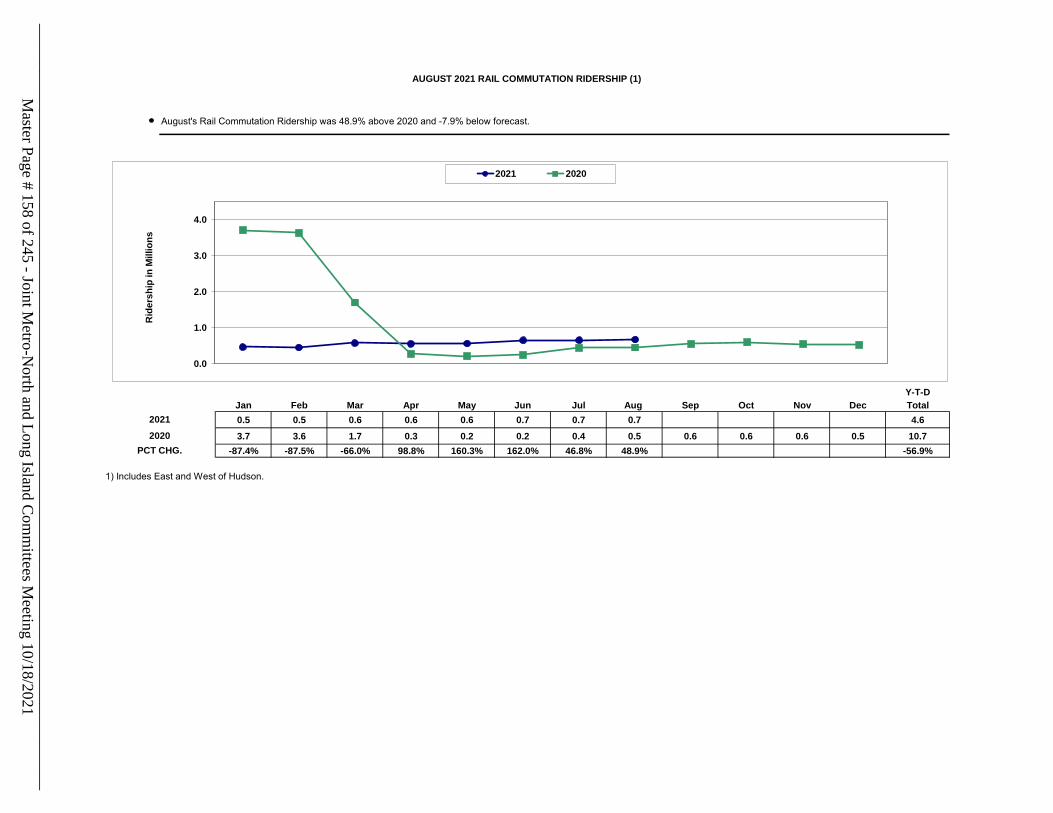
August's Rail Commutation Ridership was 48.9% above 2020 and -7.9% below forecast.
Y-T-DJan Feb Mar Apr May Jun Jul Aug Sep Oct Nov Dec Total0.5 0.5 0.6 0.6 0.6 0.7 0.7 0.7 4.63.7 3.6 1.7 0.3 0.2 0.2 0.4 0.5 0.6 0.6 0.6 0.5 10.7
-87.4% -87.5% -66.0% 98.8% 160.3% 162.0% 46.8% 48.9% -56.9%
1) Includes East and West of Hudson.
AUGUST 2021 RAIL COMMUTATION RIDERSHIP (1)
20212020
PCT CHG.
0.0
1.0
2.0
3.0
4.0
Rid
ersh
ip in
Mill
ions
.
2021 2020
Master Page # 158 of 245 - Joint M
etro-North and Long Island C
omm
ittees Meeting 10/18/2021
________________________________________________________________________________
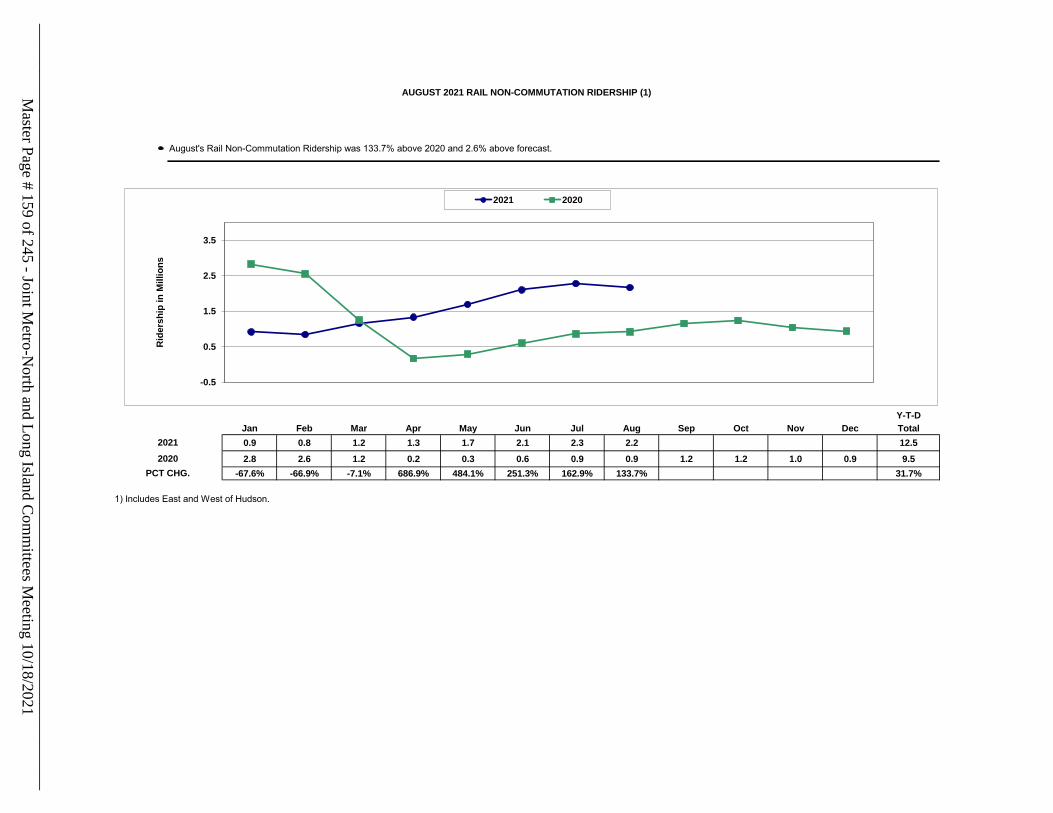
August's Rail Non-Commutation Ridership was 133.7% above 2020 and 2.6% above forecast.
Y-T-DJan Feb Mar Apr May Jun Jul Aug Sep Oct Nov Dec Total0.9 0.8 1.2 1.3 1.7 2.1 2.3 2.2 12.52.8 2.6 1.2 0.2 0.3 0.6 0.9 0.9 1.2 1.2 1.0 0.9 9.5
-67.6% -66.9% -7.1% 686.9% 484.1% 251.3% 162.9% 133.7% 31.7%
1) Includes East and West of Hudson.
AUGUST 2021 RAIL NON-COMMUTATION RIDERSHIP (1)
20212020
PCT CHG.
-0.5
0.5
1.5
2.5
3.5
Rid
ersh
ip in
Mill
ions
.
2021 2020
Master Page # 159 of 245 - Joint M
etro-North and Long Island C
omm
ittees Meeting 10/18/2021
________________________________________________________________________________
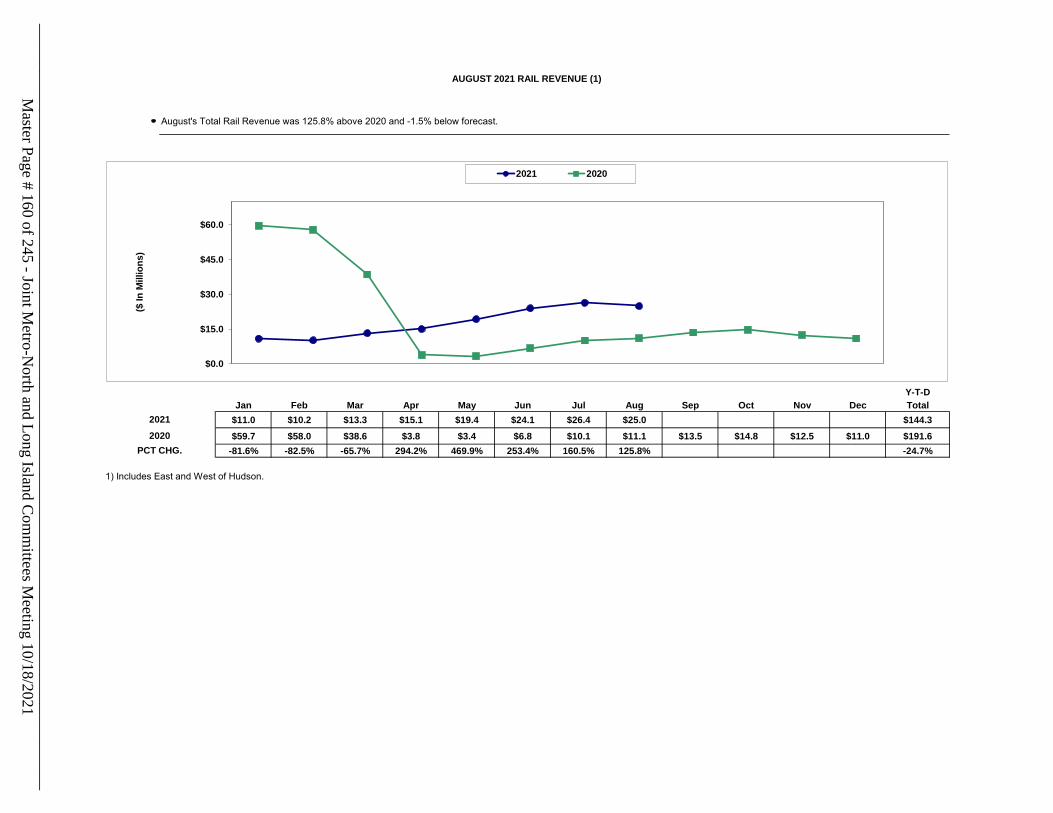
August's Total Rail Revenue was 125.8% above 2020 and -1.5% below forecast.
Y-T-DJan Feb Mar Apr May Jun Jul Aug Sep Oct Nov Dec Total
$11.0 $10.2 $13.3 $15.1 $19.4 $24.1 $26.4 $25.0 $144.3$59.7 $58.0 $38.6 $3.8 $3.4 $6.8 $10.1 $11.1 $13.5 $14.8 $12.5 $11.0 $191.6
-81.6% -82.5% -65.7% 294.2% 469.9% 253.4% 160.5% 125.8% -24.7%
1) Includes East and West of Hudson.
AUGUST 2021 RAIL REVENUE (1)
20212020
PCT CHG.
$0.0
$15.0
$30.0
$45.0
$60.0
($ In
Mill
ions
).
2021 2020
Master Page # 160 of 245 - Joint M
etro-North and Long Island C
omm
ittees Meeting 10/18/2021
________________________________________________________________________________
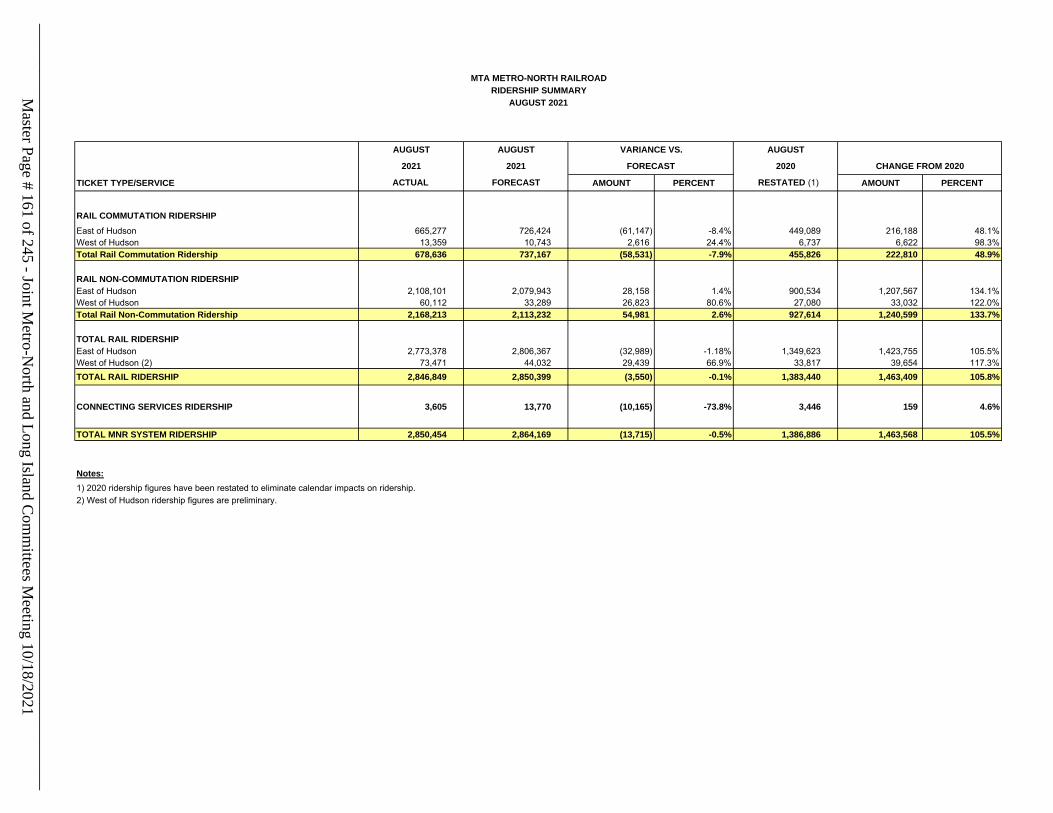
TICKET TYPE/SERVICE AMOUNT PERCENT AMOUNT PERCENT
RAIL COMMUTATION RIDERSHIP East of Hudson 665,277 726,424 (61,147) -8.4% 449,089 216,188 48.1%West of Hudson 13,359 10,743 2,616 24.4% 6,737 6,622 98.3%Total Rail Commutation Ridership 678,636 737,167 (58,531) -7.9% 455,826 222,810 48.9%
RAIL NON-COMMUTATION RIDERSHIPEast of Hudson 2,108,101 2,079,943 28,158 1.4% 900,534 1,207,567 134.1%West of Hudson 60,112 33,289 26,823 80.6% 27,080 33,032 122.0%Total Rail Non-Commutation Ridership 2,168,213 2,113,232 54,981 2.6% 927,614 1,240,599 133.7%
TOTAL RAIL RIDERSHIPEast of Hudson 2,773,378 2,806,367 (32,989) -1.18% 1,349,623 1,423,755 105.5%West of Hudson (2) 73,471 44,032 29,439 66.9% 33,817 39,654 117.3%TOTAL RAIL RIDERSHIP 2,846,849 2,850,399 (3,550) -0.1% 1,383,440 1,463,409 105.8%
CONNECTING SERVICES RIDERSHIP 3,605 13,770 (10,165) -73.8% 3,446 159 4.6%
TOTAL MNR SYSTEM RIDERSHIP 2,850,454 2,864,169 (13,715) -0.5% 1,386,886 1,463,568 105.5%
Notes:1) 2020 ridership figures have been restated to eliminate calendar impacts on ridership.2) West of Hudson ridership figures are preliminary.
RESTATED (1)ACTUAL FORECAST
MTA METRO-NORTH RAILROADRIDERSHIP SUMMARY
AUGUST 2021
AUGUST AUGUSTVARIANCE VS.AUGUST
2021 2021 FORECAST 2020 CHANGE FROM 2020
Master Page # 161 of 245 - Joint M
etro-North and Long Island C
omm
ittees Meeting 10/18/2021
________________________________________________________________________________
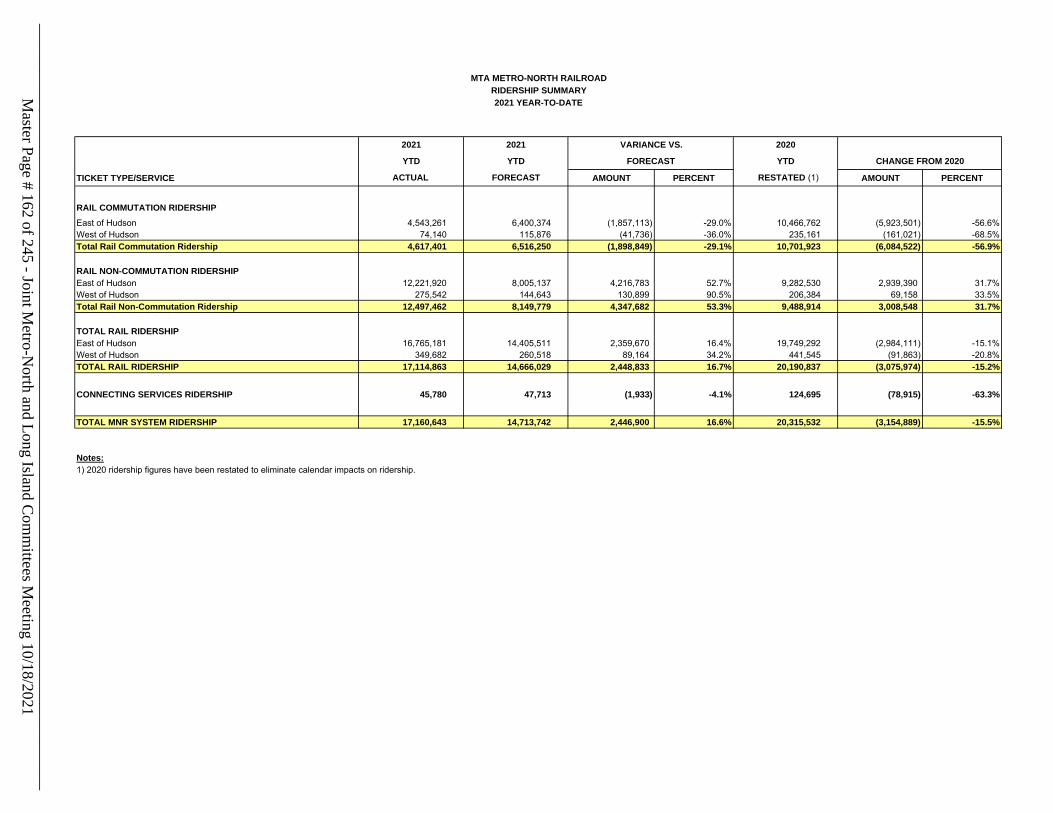
TICKET TYPE/SERVICE AMOUNT PERCENT AMOUNT PERCENT
RAIL COMMUTATION RIDERSHIP East of Hudson 4,543,261 6,400,374 (1,857,113) -29.0% 10,466,762 (5,923,501) -56.6%West of Hudson 74,140 115,876 (41,736) -36.0% 235,161 (161,021) -68.5%Total Rail Commutation Ridership 4,617,401 6,516,250 (1,898,849) -29.1% 10,701,923 (6,084,522) -56.9%
RAIL NON-COMMUTATION RIDERSHIPEast of Hudson 12,221,920 8,005,137 4,216,783 52.7% 9,282,530 2,939,390 31.7%West of Hudson 275,542 144,643 130,899 90.5% 206,384 69,158 33.5%Total Rail Non-Commutation Ridership 12,497,462 8,149,779 4,347,682 53.3% 9,488,914 3,008,548 31.7%
TOTAL RAIL RIDERSHIPEast of Hudson 16,765,181 14,405,511 2,359,670 16.4% 19,749,292 (2,984,111) -15.1%West of Hudson 349,682 260,518 89,164 34.2% 441,545 (91,863) -20.8%TOTAL RAIL RIDERSHIP 17,114,863 14,666,029 2,448,833 16.7% 20,190,837 (3,075,974) -15.2%
CONNECTING SERVICES RIDERSHIP 45,780 47,713 (1,933) -4.1% 124,695 (78,915) -63.3%
TOTAL MNR SYSTEM RIDERSHIP 17,160,643 14,713,742 2,446,900 16.6% 20,315,532 (3,154,889) -15.5%
Notes:1) 2020 ridership figures have been restated to eliminate calendar impacts on ridership.
RIDERSHIP SUMMARY2021 YEAR-TO-DATE
2021 2020
YTD FORECAST YTD CHANGE FROM 2020
FORECAST
MTA METRO-NORTH RAILROAD
ACTUAL RESTATED (1)
2021 VARIANCE VS.
YTD
Master Page # 162 of 245 - Joint M
etro-North and Long Island C
omm
ittees Meeting 10/18/2021
________________________________________________________________________________

LINE AMOUNT PERCENT
EAST OF HUDSONHarlem Line 834,378 431,274 403,104 93.5%Hudson Line 623,154 316,997 306,157 96.6%New Haven Line 1,315,845 601,352 714,493 118.8%Total East of Hudson 2,773,378 1,349,623 1,423,755 105.5%
WEST OF HUDSONPort Jervis Line 40,004 22,425 17,579 78.4%Pascack Valley Line 33,467 11,392 22,075 193.8%Total West of Hudson (2) 73,471 33,817 39,654 117.3%
TOTAL RAIL RIDERSHIP 2,846,849 1,383,440 1,463,409 105.8%
CONNECTING SERVICES PROVIDED BY METRO-NORTH CONTRACTORSHudson Rail Link 3,288 3,446 (158) -4.6%Haverstraw-Ossining Ferry 150 NA NA NANewburgh-Beacon Ferry 167 NA NA NATotal Connecting Services 3,605 3,446 (158) 4.6%
TOTAL MNR SYSTEM 2,850,454 1,386,886 1,463,251 105.5%
Notes:1) 2020 ridership figures have been restated to eliminate calendar impacts on ridership.2) West of Hudson ridership figures are preliminary.
CHANGE FROM 2020
ACTUAL RESTATED (1)
2021 2020
MTA METRO-NORTH RAILROADRIDERSHIP BY LINE
AUGUST 2021
AUGUST AUGUST
Master Page # 163 of 245 - Joint M
etro-North and Long Island C
omm
ittees Meeting 10/18/2021
________________________________________________________________________________
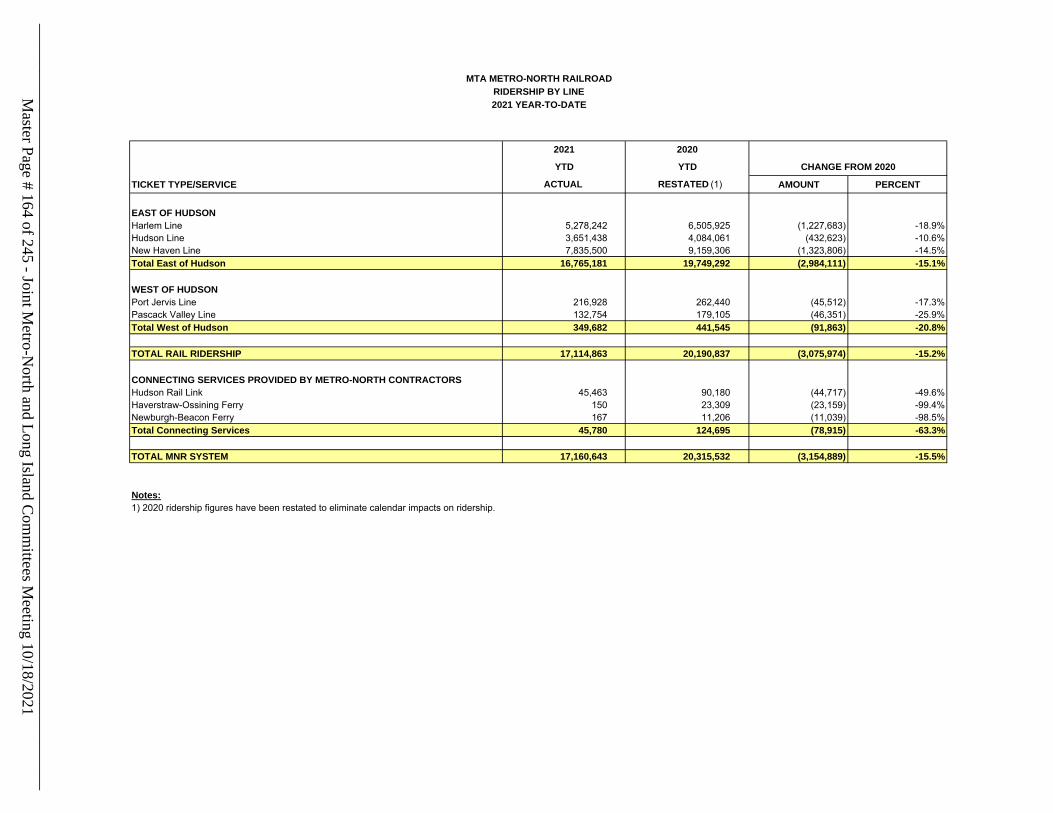
TICKET TYPE/SERVICE AMOUNT PERCENT
EAST OF HUDSONHarlem Line 5,278,242 6,505,925 (1,227,683) -18.9%Hudson Line 3,651,438 4,084,061 (432,623) -10.6%New Haven Line 7,835,500 9,159,306 (1,323,806) -14.5%Total East of Hudson 16,765,181 19,749,292 (2,984,111) -15.1%
WEST OF HUDSONPort Jervis Line 216,928 262,440 (45,512) -17.3%Pascack Valley Line 132,754 179,105 (46,351) -25.9%Total West of Hudson 349,682 441,545 (91,863) -20.8%
TOTAL RAIL RIDERSHIP 17,114,863 20,190,837 (3,075,974) -15.2%
CONNECTING SERVICES PROVIDED BY METRO-NORTH CONTRACTORSHudson Rail Link 45,463 90,180 (44,717) -49.6%Haverstraw-Ossining Ferry 150 23,309 (23,159) -99.4%Newburgh-Beacon Ferry 167 11,206 (11,039) -98.5%Total Connecting Services 45,780 124,695 (78,915) -63.3%
TOTAL MNR SYSTEM 17,160,643 20,315,532 (3,154,889) -15.5%
Notes:1) 2020 ridership figures have been restated to eliminate calendar impacts on ridership.
ACTUAL RESTATED (1)
YTD
2021 YEAR-TO-DATE
2021 2020
CHANGE FROM 2020YTD
MTA METRO-NORTH RAILROADRIDERSHIP BY LINEM
aster Page # 164 of 245 - Joint Metro-N
orth and Long Island Com
mittees M
eeting 10/18/2021________________________________________________________________________________
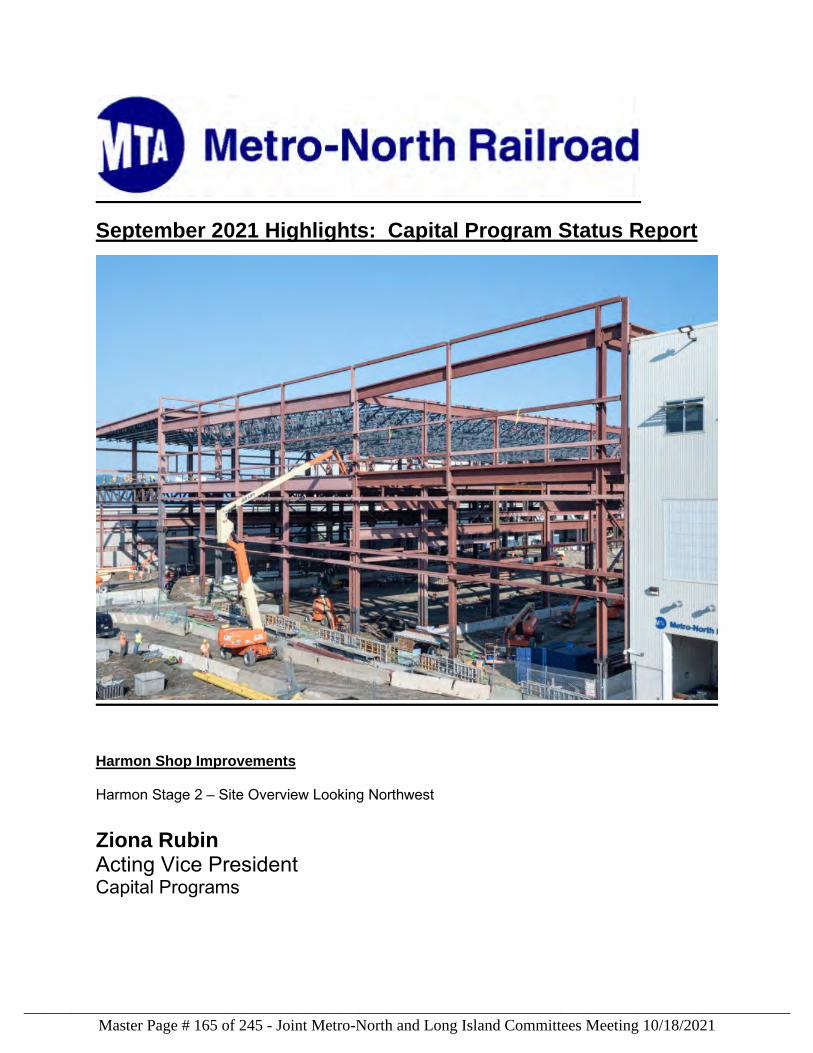
September 2021 Highlights: Capital Program Status Report
Harmon Shop Improvements Harmon Stage 2 – Site Overview Looking Northwest Ziona Rubin Acting Vice President Capital Programs
Master Page # 165 of 245 - Joint Metro-North and Long Island Committees Meeting 10/18/2021________________________________________________________________________________
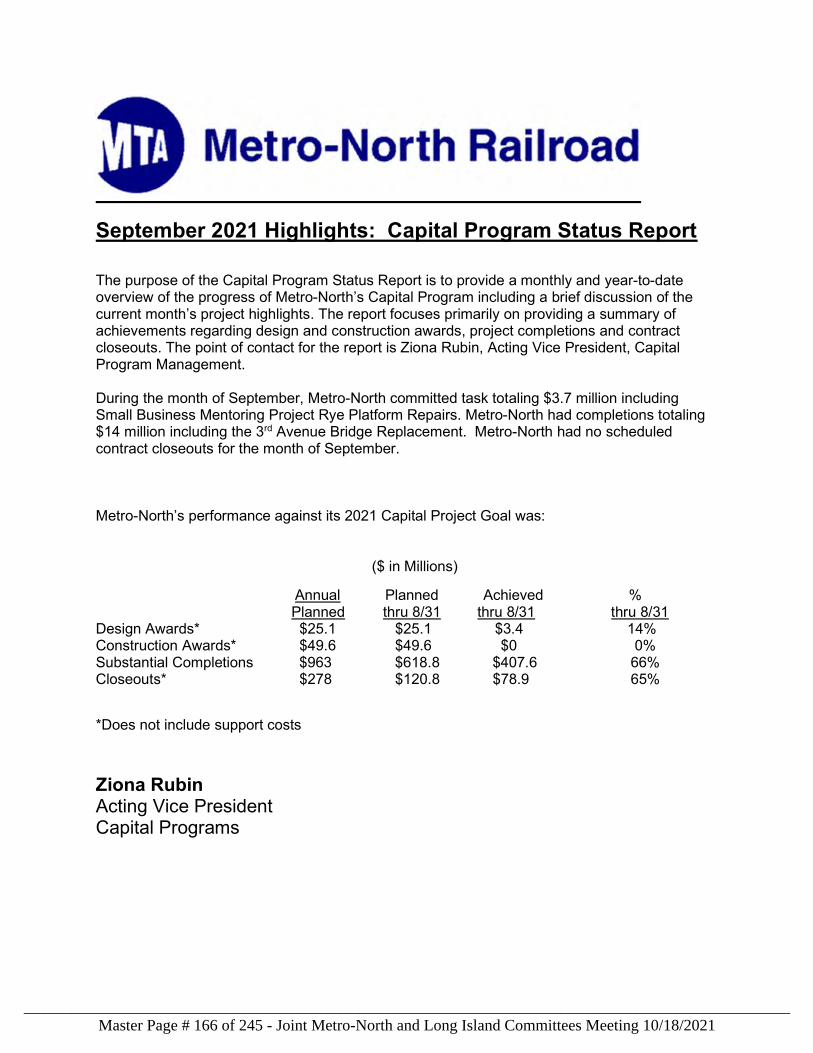
September 2021 Highlights: Capital Program Status Report
The purpose of the Capital Program Status Report is to provide a monthly and year-to-date overview of the progress of Metro-North’s Capital Program including a brief discussion of the current month’s project highlights. The report focuses primarily on providing a summary of achievements regarding design and construction awards, project completions and contract closeouts. The point of contact for the report is Ziona Rubin, Acting Vice President, Capital Program Management. During the month of September, Metro-North committed task totaling $3.7 million including Small Business Mentoring Project Rye Platform Repairs. Metro-North had completions totaling $14 million including the 3rd Avenue Bridge Replacement. Metro-North had no scheduled contract closeouts for the month of September. Metro-North’s performance against its 2021 Capital Project Goal was: ($ in Millions)
Annual Planned Achieved % Planned thru 8/31 thru 8/31 thru 8/31 Design Awards* $25.1 $25.1 $3.4 14% Construction Awards* $49.6 $49.6 $0 0% Substantial Completions $963 $618.8 $407.6 66% Closeouts* $278 $120.8 $78.9 65%
*Does not include support costs
Ziona Rubin Acting Vice President Capital Programs
Master Page # 166 of 245 - Joint Metro-North and Long Island Committees Meeting 10/18/2021________________________________________________________________________________
CAPITAL PROGRAM HIGHLIGHTS
September 2021
CONTRACT AWARDS: M7020209 SBMP Rye Platform Repairs Milestone: Contract Award $1,098,851
This contract was awarded in September 2021 for a small business mentoring contractor to perform the Rye Station priority repairs. PROJECT COMPLETIONS:
M7030201 3rd Ave. Bridge Replacement Milestone: Substantial Completion Project Budget: $ 14,428,026 This project replaced the 3rd Avenue bridge located in Mount Vernon, New York.
Master Page # 167 of 245 - Joint Metro-North and Long Island Committees Meeting 10/18/2021________________________________________________________________________________
MAJOR ON-GOING PROJECT STATUS:
EM050206/EM040205 Power, C&S Infrastructure Restoration – Sandy
The purpose of this project is to replace and restore to a state of good repair through a design-build contract the power and communication and signal (C&S) equipment and infrastructure that were destroyed, damaged and/or compromised by Superstorm Sandy on over 30 miles of railroad along the Hudson Line from CP 5 (Bronx) to CP 35 (Croton-Harmon).
• CP19 to CP35 (Phase 1) - Achieved substantial completion in May 2019.
• CP5 to CP19 (Phase 2) - Continued conduit installation for C&S; signal power; positive and negative feeders; trough installation and manhole construction and track lateral/crossings at different areas terminating and pulling control cables. Continued performing grounding work; jumper work; fencing at new platforms; commissioning and testing of power system; and punch list work.
Overall project substantial completion is anticipated after successful cutover and system commissioning is completed in the third quarter 2022. EM050208 Power Infrastructure Restoration – Substations – Sandy
• Tarrytown – Continued demolishing the existing substation and salvaging equipment.
Disconnection of temporary feeder from the existing substation is upcoming. This substation is online and currently running revenue service.
• Croton-Harmon – Completed programing the transformer’s relay. Started splicing of the
15kV feeder cables for the new Substation. Substation energization and short circuit testing are pending the completion of the feeder cables splicing. as well as the completion of energization and system cut-over of Brewster Substation. This substation is scheduled to complete required various manhole cable splices by MNR Power, including substation cutover & commissioning, by February 2022.
• Riverdale – All work is completed. This substation in online and currently running revenue
service.
• The Brewster Substation (under Project M6050103) – Completed programing the transformer’s relay. short circuit testing and disconnection of the temporary feeder from the substation are upcoming. This substation is scheduled for substantial completion after achieving a successful cutover during testing and commissioning in December 2021.
Master Page # 168 of 245 - Joint Metro-North and Long Island Committees Meeting 10/18/2021________________________________________________________________________________
M7060101 Harmon Shop Improvements Phase V, Stage II Design-Build - The scope of this work includes the demolition of the remainder of Building 6 Maintenance Shop, the associated Building 5 storeroom and the construction of the balance of the Phase V Electric Car Shop and Support Shop facilities.
• 100% design of the Running Repair Support Shop is complete.
• Completed energization for all site transformers and continued demolition and removal of
old cable/poles. Completed installation of ties, running rail, turnouts, line and grading for west tracks. Continued installation of grade crossings, snow melter/jumper cable installations and terminating potheads at the west of RRSS and commenced installation of EMU overpass. Completed installation of Oil water separator and continued installation of cable tags, seals, megger testing, site lighting, cathodic protection, underdrains and ductbanks in the north yard. Continued installation of tracks 84, 86 and 88 and installation of ballast, track crossings, negative cable, third rail jumper conduits and third rail in the north yard. Continued installation of building foundations, beams and structural steel along the G, J’, J, L, M and H lines, reinforcement, MEP and conduit in 2nd floor. Completed car hoist installations along tracks 45 and 46 and continued car hoist pits and caissons along track 47, and elevator pits and under slab utilities in the Running Repair and Support Shop area. Completed installation of M line footings and continued installation of grade beams, metal panels, track 50 footing, plumbing, bug & stinger ductbanks and structural steel in the blow shed area.
Master Page # 169 of 245 - Joint Metro-North and Long Island Committees Meeting 10/18/2021________________________________________________________________________________
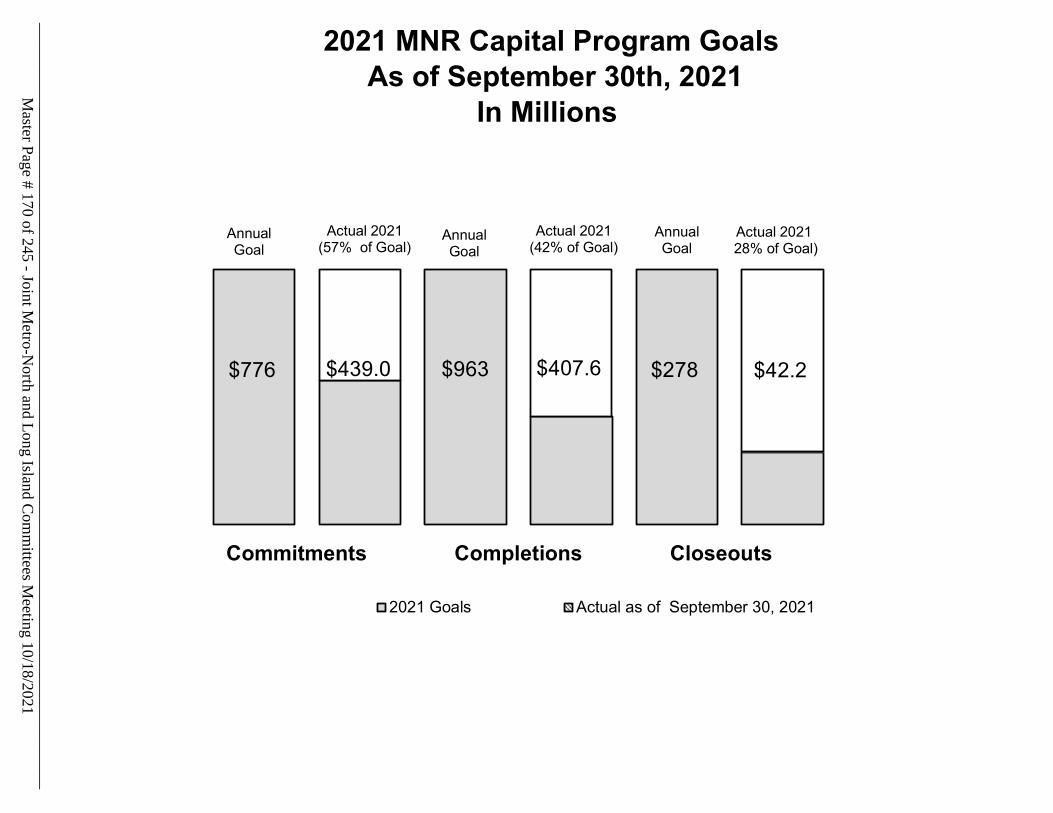
2021 MNR Capital Program Goals As of September 30th, 2021
In Millions
$776 $439.0 $963 $278 $42.2$407.6
Commitments Completions Closeouts
2021 Goals Actual as of September 30, 2021
AnnualGoal
AnnualGoal
Actual 2021(57% of Goal)
Actual 2021(42% of Goal)
AnnualGoal
Actual 202128% of Goal)
Master Page # 170 of 245 - Joint M
etro-North and Long Island C
omm
ittees Meeting 10/18/2021
________________________________________________________________________________
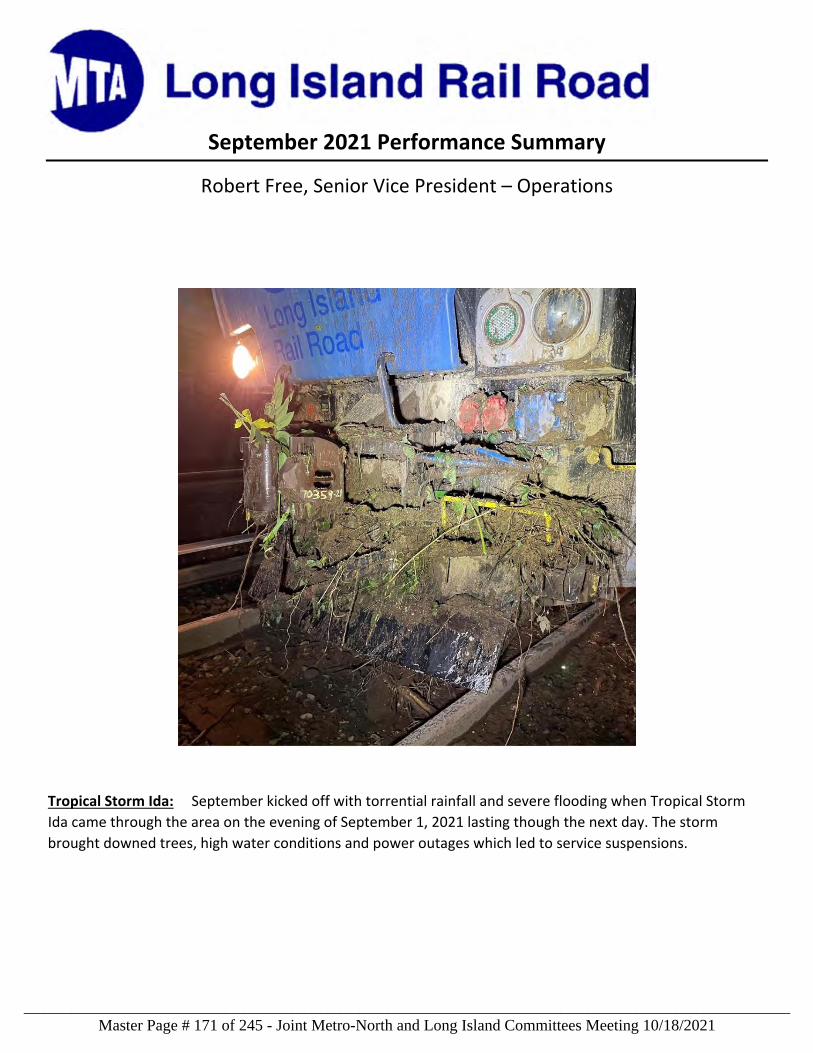
September 2021 Performance Summary
Robert Free, Senior Vice President – Operations
Tropical Storm Ida: September kicked off with torrential rainfall and severe flooding when Tropical Storm
Ida came through the area on the evening of September 1, 2021 lasting though the next day. The storm
brought downed trees, high water conditions and power outages which led to service suspensions.
Master Page # 171 of 245 - Joint Metro-North and Long Island Committees Meeting 10/18/2021________________________________________________________________________________
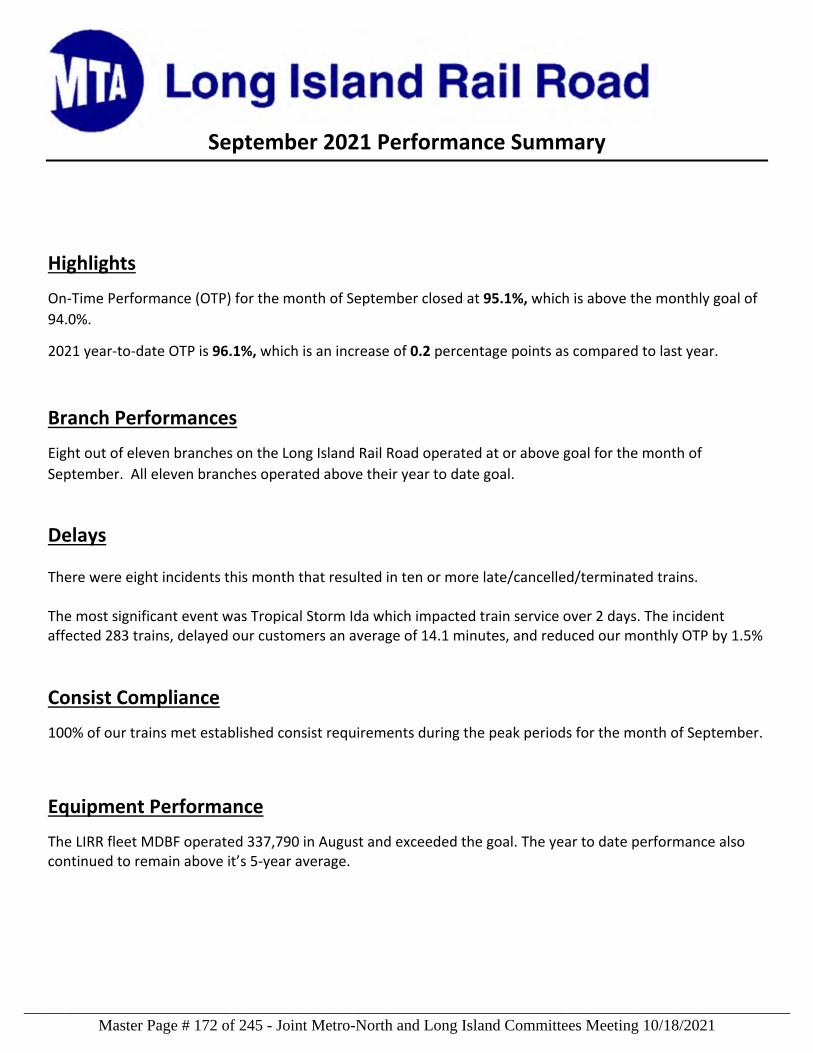
September 2021 Performance Summary
Highlights
On‐Time Performance (OTP) for the month of September closed at 95.1%, which is above the monthly goal of
94.0%.
2021 year‐to‐date OTP is 96.1%, which is an increase of 0.2 percentage points as compared to last year.
Branch Performances
Eight out of eleven branches on the Long Island Rail Road operated at or above goal for the month of
September. All eleven branches operated above their year to date goal.
Delays There were eight incidents this month that resulted in ten or more late/cancelled/terminated trains. The most significant event was Tropical Storm Ida which impacted train service over 2 days. The incident affected 283 trains, delayed our customers an average of 14.1 minutes, and reduced our monthly OTP by 1.5%
Consist Compliance
100% of our trains met established consist requirements during the peak periods for the month of September.
Equipment Performance
The LIRR fleet MDBF operated 337,790 in August and exceeded the goal. The year to date performance also continued to remain above it’s 5‐year average.
Master Page # 172 of 245 - Joint Metro-North and Long Island Committees Meeting 10/18/2021________________________________________________________________________________
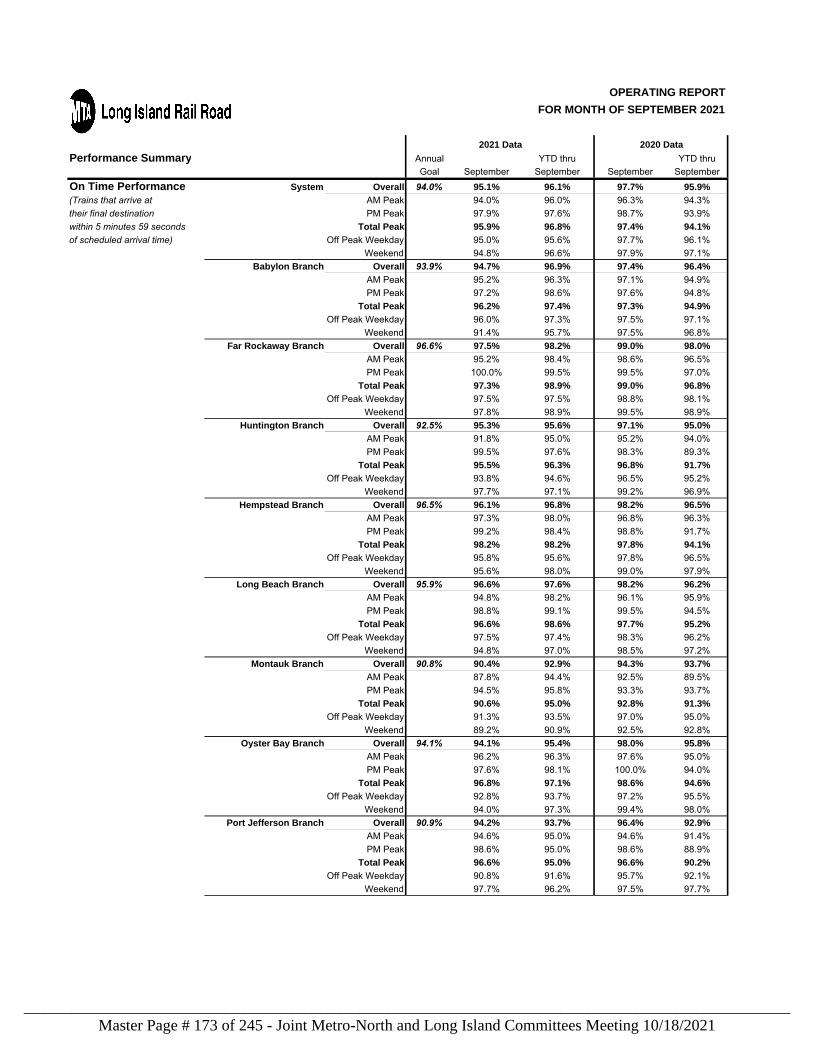
OPERATING REPORTFOR MONTH OF SEPTEMBER 2021
Performance Summary Annual YTD thru YTD thruGoal September September September September
On Time Performance System Overall 94.0% 95.1% 96.1% 97.7% 95.9%(Trains that arrive at AM Peak 94.0% 96.0% 96.3% 94.3%their final destination PM Peak 97.9% 97.6% 98.7% 93.9%within 5 minutes 59 seconds Total Peak 95.9% 96.8% 97.4% 94.1%of scheduled arrival time) Off Peak Weekday 95.0% 95.6% 97.7% 96.1%
Weekend 94.8% 96.6% 97.9% 97.1%Babylon Branch Overall 93.9% 94.7% 96.9% 97.4% 96.4%
AM Peak 95.2% 96.3% 97.1% 94.9%PM Peak 97.2% 98.6% 97.6% 94.8%
Total Peak 96.2% 97.4% 97.3% 94.9%Off Peak Weekday 96.0% 97.3% 97.5% 97.1%
Weekend 91.4% 95.7% 97.5% 96.8%Far Rockaway Branch Overall 96.6% 97.5% 98.2% 99.0% 98.0%
AM Peak 95.2% 98.4% 98.6% 96.5%PM Peak 100.0% 99.5% 99.5% 97.0%
Total Peak 97.3% 98.9% 99.0% 96.8%Off Peak Weekday 97.5% 97.5% 98.8% 98.1%
Weekend 97.8% 98.9% 99.5% 98.9%Huntington Branch Overall 92.5% 95.3% 95.6% 97.1% 95.0%
AM Peak 91.8% 95.0% 95.2% 94.0%PM Peak 99.5% 97.6% 98.3% 89.3%
Total Peak 95.5% 96.3% 96.8% 91.7%Off Peak Weekday 93.8% 94.6% 96.5% 95.2%
Weekend 97.7% 97.1% 99.2% 96.9%Hempstead Branch Overall 96.5% 96.1% 96.8% 98.2% 96.5%
AM Peak 97.3% 98.0% 96.8% 96.3%PM Peak 99.2% 98.4% 98.8% 91.7%
Total Peak 98.2% 98.2% 97.8% 94.1%Off Peak Weekday 95.8% 95.6% 97.8% 96.5%
Weekend 95.6% 98.0% 99.0% 97.9%Long Beach Branch Overall 95.9% 96.6% 97.6% 98.2% 96.2%
AM Peak 94.8% 98.2% 96.1% 95.9%PM Peak 98.8% 99.1% 99.5% 94.5%
Total Peak 96.6% 98.6% 97.7% 95.2%Off Peak Weekday 97.5% 97.4% 98.3% 96.2%
Weekend 94.8% 97.0% 98.5% 97.2%Montauk Branch Overall 90.8% 90.4% 92.9% 94.3% 93.7%
AM Peak 87.8% 94.4% 92.5% 89.5%PM Peak 94.5% 95.8% 93.3% 93.7%
Total Peak 90.6% 95.0% 92.8% 91.3%Off Peak Weekday 91.3% 93.5% 97.0% 95.0%
Weekend 89.2% 90.9% 92.5% 92.8% Oyster Bay Branch Overall 94.1% 94.1% 95.4% 98.0% 95.8%
AM Peak 96.2% 96.3% 97.6% 95.0%PM Peak 97.6% 98.1% 100.0% 94.0%
Total Peak 96.8% 97.1% 98.6% 94.6%Off Peak Weekday 92.8% 93.7% 97.2% 95.5%
Weekend 94.0% 97.3% 99.4% 98.0%Port Jefferson Branch Overall 90.9% 94.2% 93.7% 96.4% 92.9%
AM Peak 94.6% 95.0% 94.6% 91.4%PM Peak 98.6% 95.0% 98.6% 88.9%
Total Peak 96.6% 95.0% 96.6% 90.2%Off Peak Weekday 90.8% 91.6% 95.7% 92.1%
Weekend 97.7% 96.2% 97.5% 97.7%
2021 Data 2020 Data
Master Page # 173 of 245 - Joint Metro-North and Long Island Committees Meeting 10/18/2021________________________________________________________________________________
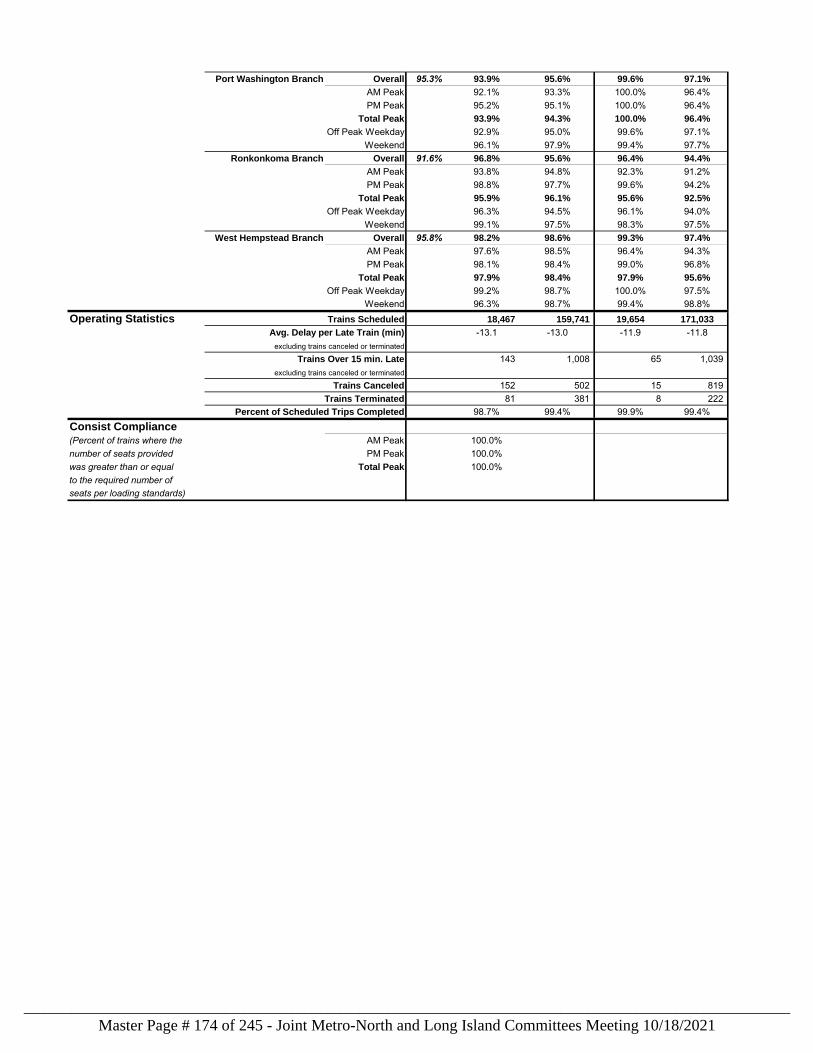
Port Washington Branch Overall 95.3% 93.9% 95.6% 99.6% 97.1%AM Peak 92.1% 93.3% 100.0% 96.4%PM Peak 95.2% 95.1% 100.0% 96.4%
Total Peak 93.9% 94.3% 100.0% 96.4%Off Peak Weekday 92.9% 95.0% 99.6% 97.1%
Weekend 96.1% 97.9% 99.4% 97.7%Ronkonkoma Branch Overall 91.6% 96.8% 95.6% 96.4% 94.4%
AM Peak 93.8% 94.8% 92.3% 91.2%PM Peak 98.8% 97.7% 99.6% 94.2%
Total Peak 95.9% 96.1% 95.6% 92.5%Off Peak Weekday 96.3% 94.5% 96.1% 94.0%
Weekend 99.1% 97.5% 98.3% 97.5%West Hempstead Branch Overall 95.8% 98.2% 98.6% 99.3% 97.4%
AM Peak 97.6% 98.5% 96.4% 94.3%PM Peak 98.1% 98.4% 99.0% 96.8%
Total Peak 97.9% 98.4% 97.9% 95.6%Off Peak Weekday 99.2% 98.7% 100.0% 97.5%
Weekend 96.3% 98.7% 99.4% 98.8%Operating Statistics Trains Scheduled 18,467 159,741 19,654 171,033
Avg. Delay per Late Train (min) -13.1 -13.0 -11.9 -11.8 excluding trains canceled or terminated
Trains Over 15 min. Late 143 1,008 65 1,039 excluding trains canceled or terminated
Trains Canceled 152 502 15 819 Trains Terminated 81 381 8 222
Percent of Scheduled Trips Completed 98.7% 99.4% 99.9% 99.4%Consist Compliance System Overall(Percent of trains where the AM Peak 100.0%number of seats provided PM Peak 100.0%was greater than or equal Total Peak 100.0%to the required number of Off Peakseats per loading standards) Weekend
Master Page # 174 of 245 - Joint Metro-North and Long Island Committees Meeting 10/18/2021________________________________________________________________________________
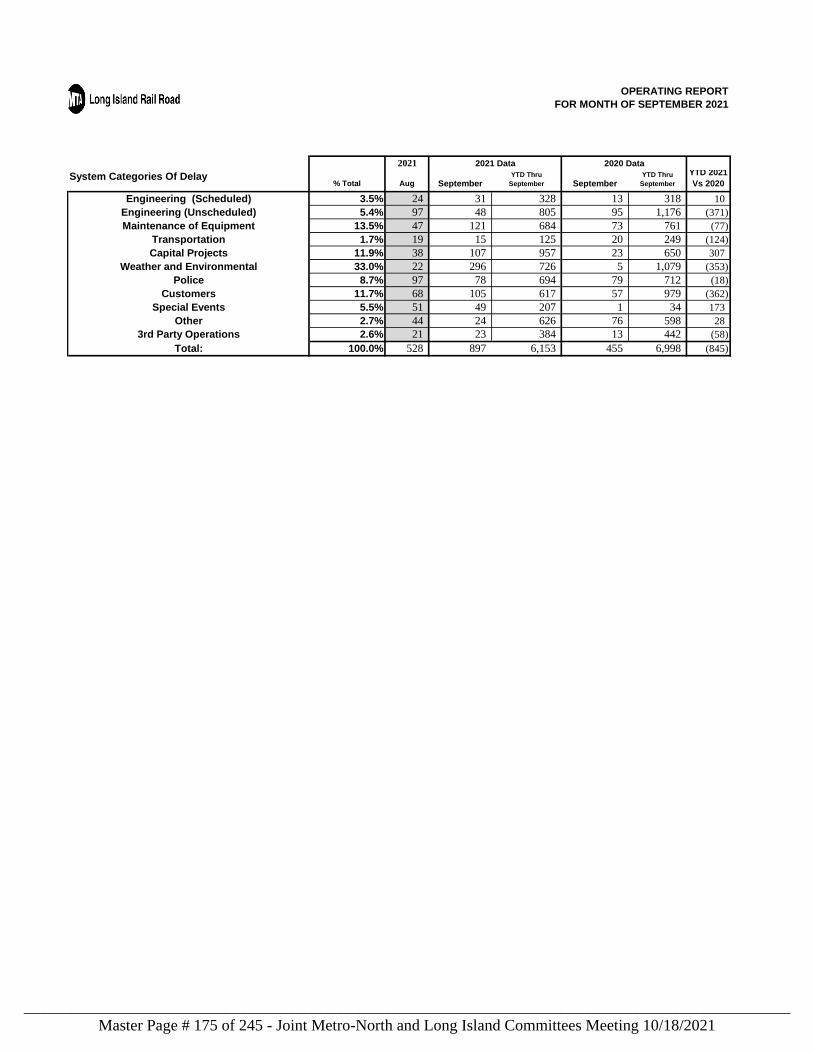
OPERATING REPORTFOR MONTH OF SEPTEMBER 2021
2021
System Categories Of Delay% Total Aug September
YTD Thru September September
YTD Thru September
YTD 2021 Vs 2020
3.5% 24 31 328 13 318 10 5.4% 97 48 805 95 1,176 (371)
13.5% 47 121 684 73 761 (77) 1.7% 19 15 125 20 249 (124)
11.9% 38 107 957 23 650 307 33.0% 22 296 726 5 1,079 (353) 8.7% 97 78 694 79 712 (18)
11.7% 68 105 617 57 979 (362) 5.5% 51 49 207 1 34 173 2.7% 44 24 626 76 598 28 2.6% 21 23 384 13 442 (58)
100.0% 528 897 6,153 455 6,998 (845) Total:
PoliceCustomers
Special EventsOther
3rd Party Operations
Weather and Environmental
2021 Data 2020 Data
Engineering (Scheduled)Engineering (Unscheduled)Maintenance of Equipment
TransportationCapital Projects
Master Page # 175 of 245 - Joint Metro-North and Long Island Committees Meeting 10/18/2021________________________________________________________________________________
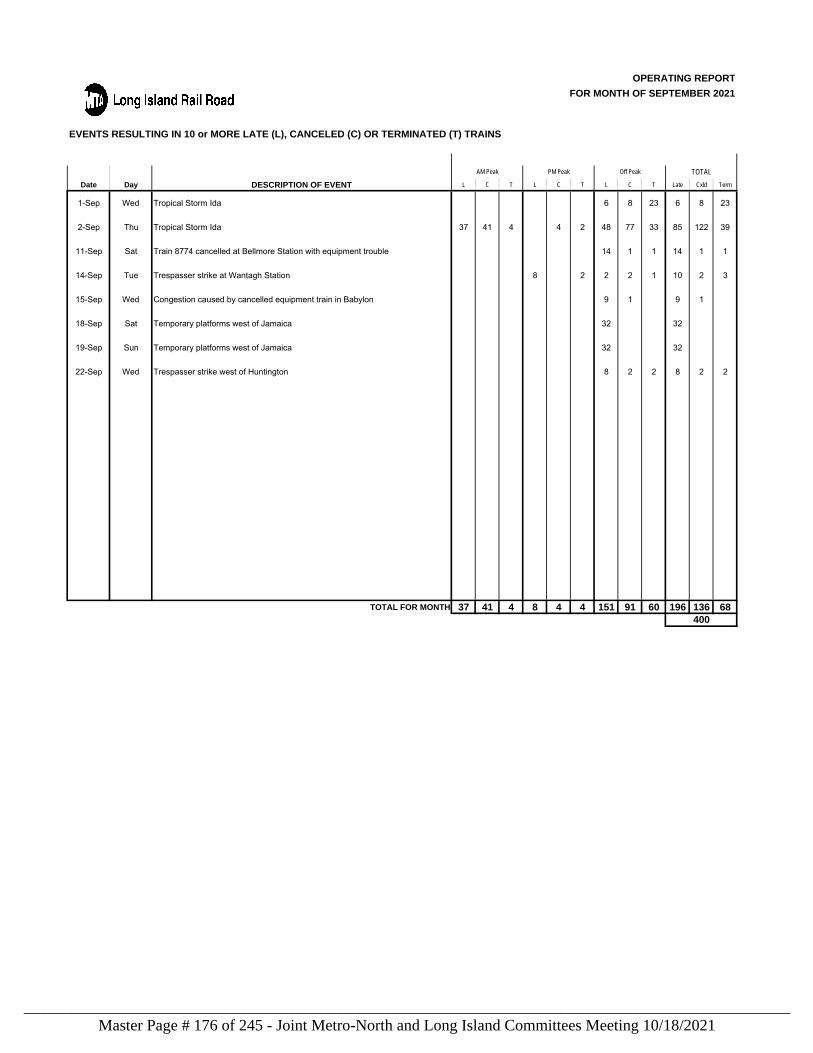
OPERATING REPORTFOR MONTH OF SEPTEMBER 2021
EVENTS RESULTING IN 10 or MORE LATE (L), CANCELED (C) OR TERMINATED (T) TRAINS
Date Day DESCRIPTION OF EVENT L C T L C T L C T Late Cxld Term
1-Sep Wed Tropical Storm Ida 6 8 23 6 8 23
2-Sep Thu Tropical Storm Ida 37 41 4 4 2 48 77 33 85 122 39
11-Sep Sat Train 8774 cancelled at Bellmore Station with equipment trouble 14 1 1 14 1 1
14-Sep Tue Trespasser strike at Wantagh Station 8 2 2 2 1 10 2 3
15-Sep Wed Congestion caused by cancelled equipment train in Babylon 9 1 9 1 0
18-Sep Sat Temporary platforms west of Jamaica 32 32 0 0
19-Sep Sun Temporary platforms west of Jamaica 32 32 0 0
22-Sep Wed Trespasser strike west of Huntington 8 2 2 8 2 2
TOTAL FOR MONTH 37 41 4 8 4 4 151 91 60 196 136 68
AM Peak PM Peak Off Peak TOTAL
400
Master Page # 176 of 245 - Joint Metro-North and Long Island Committees Meeting 10/18/2021________________________________________________________________________________
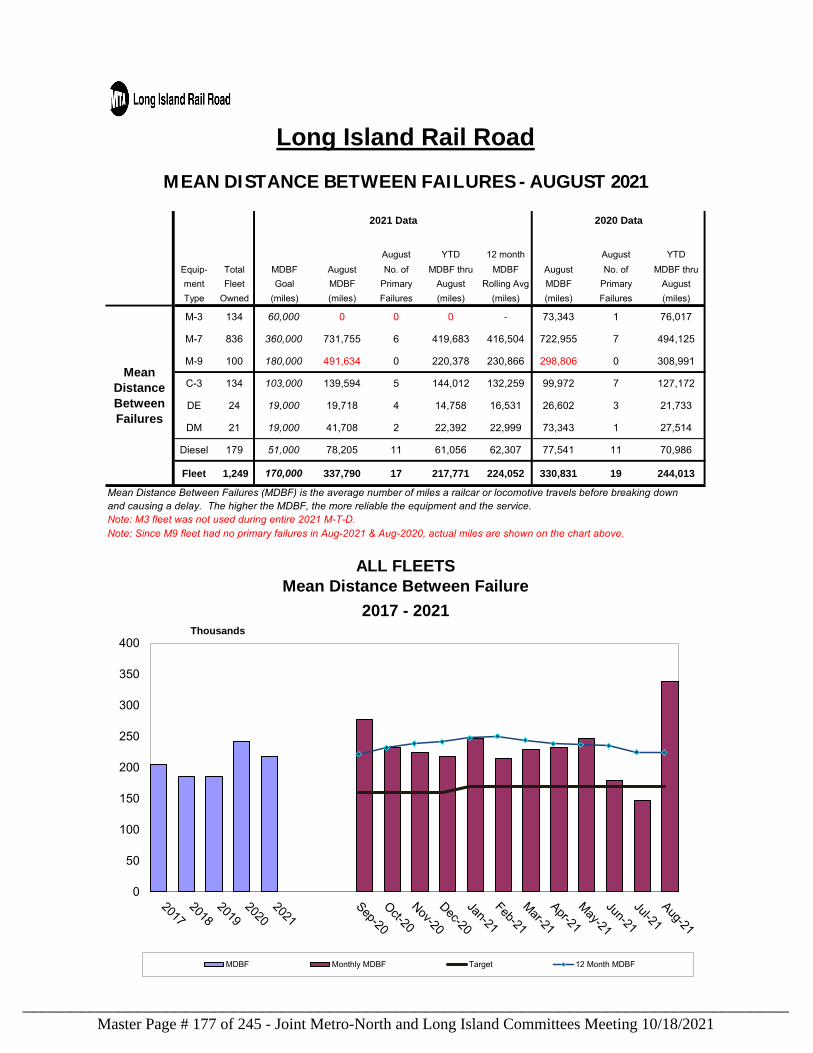
August YTD 12 month August YTDEquip- Total MDBF August No. of MDBF thru MDBF August No. of MDBF thrument Fleet Goal MDBF Primary August Rolling Avg MDBF Primary AugustType Owned (miles) (miles) Failures (miles) (miles) (miles) Failures (miles)
M-3 134 60,000 0 0 0 - 73,343 1 76,017
M-7 836 360,000 731,755 6 419,683 416,504 722,955 7 494,125
M-9 100 180,000 491,634 0 220,378 230,866 298,806 0 308,991
C-3 134 103,000 139,594 5 144,012 132,259 99,972 7 127,172
DE 24 19,000 19,718 4 14,758 16,531 26,602 3 21,733
DM 21 19,000 41,708 2 22,392 22,999 73,343 1 27,514
Diesel 179 51,000 78,205 11 61,056 62,307 77,541 11 70,986
Fleet 1,249 170,000 337,790 17 217,771 224,052 330,831 19 244,013
Mean Distance Between Failures (MDBF) is the average number of miles a railcar or locomotive travels before breaking downand causing a delay. The higher the MDBF, the more reliable the equipment and the service.Note: M3 fleet was not used during entire 2021 M-T-D.Note: Since M9 fleet had no primary failures in Aug-2021 & Aug-2020, actual miles are shown on the chart above.
ALL FLEETSMean Distance Between Failure
MEAN DISTANCE BETWEEN FAILURES - AUGUST 2021
Long Island Rail Road
2021 Data 2020 Data
2017 - 2021
Mean Distance Between Failures
-
50
100
150
200
250 Thousands
0
50
100
150
200
250Thousands
0
50
100
150
200
250
300
350
400Thousands
MDBF Monthly MDBF Target 12 Month MDBF
Master Page # 177 of 245 - Joint Metro-North and Long Island Committees Meeting 10/18/2021________________________________________________________________________________

OPERATING REPORTFOR MONTH OF SEPTEMBER 2021
Standee Report2021 Data
East Of Jamaica SeptemberAM Peak PM Peak
Daily Average Babylon Branch Program Standees 0 0
Add'l Standees 0 0
Total Standees 0 0Far Rockaway Branch Program Standees 0 0
Add'l Standees 0 0
Total Standees 0 0Huntington Branch Program Standees 0 0
Add'l Standees 0 0
Total Standees 0 0Hempstead Branch Program Standees 0 0
Add'l Standees 0 0
Total Standees 0 0Long Beach Branch Program Standees 0 0
Add'l Standees 0 0
Total Standees 0 0Montauk Branch Program Standees 0 0
Add'l Standees 0 0
Total Standees 0 0Oyster Bay Branch Program Standees 0 0
Add'l Standees 0 0
Total Standees 0 0Port Jefferson Branch Program Standees 0 0
Add'l Standees 0 0
Total Standees 0 0Port Washington Branch Program Standees 0 0
Add'l Standees 0 0
Total Standees 0 0Ronkonkoma Branch Program Standees 0 0
Add'l Standees 0 0Total Standees 0 0
West Hempstead Branch Program Standees 0 0
Add'l Standees 0 0
Total Standees 0 0System Wide PEAK 0 0
DefinitionsWeekday standees are calculated based on the most recent average weekday customer counts
"Program Standees" is the average number of customers in excess of programmed seating capacity.
"Additional Standees" reflect the impact of reduced train car consists (as reported in the weekday equipment reports).
Note: These statistics do not include the effects of daily ridership variation or uneven distribution of customers within trains.
Holidays and Special Events for which there are special equipment programs are not included.
Master Page # 178 of 245 - Joint Metro-North and Long Island Committees Meeting 10/18/2021________________________________________________________________________________
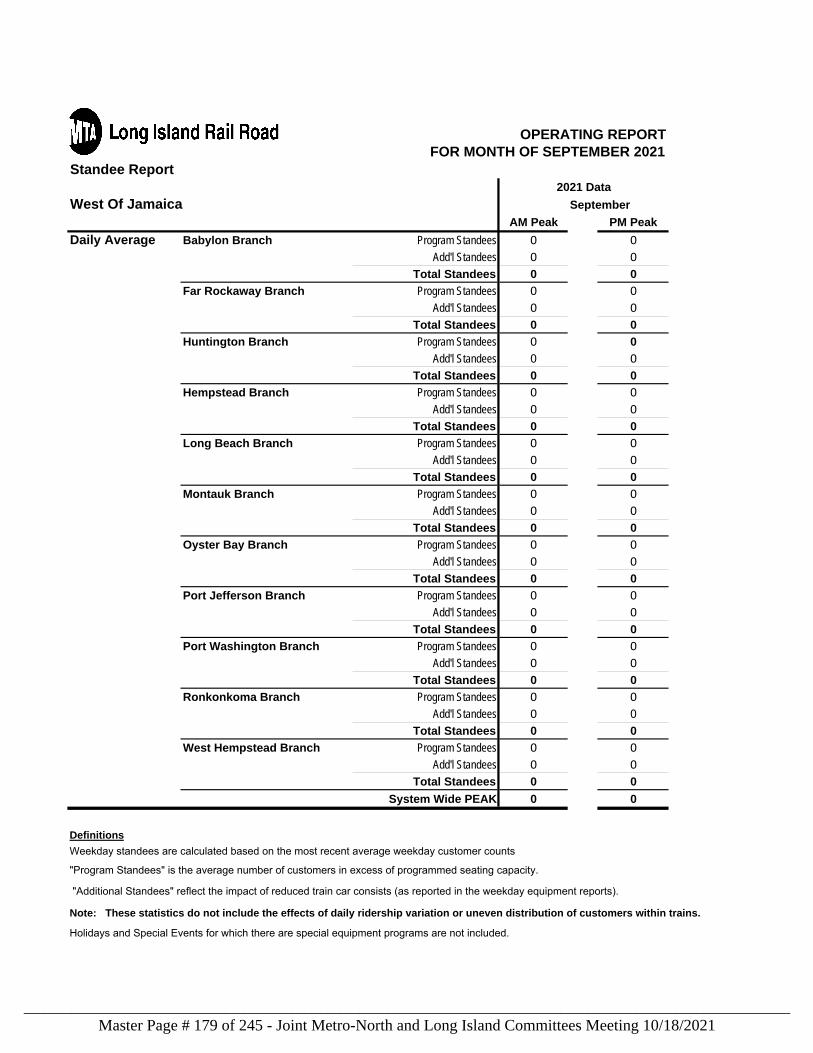
OPERATING REPORTFOR MONTH OF SEPTEMBER 2021
Standee Report2021 Data
West Of Jamaica SeptemberAM Peak PM Peak
Daily Average Babylon Branch Program Standees 0 0
Add'l Standees 0 0
Total Standees 0 0Far Rockaway Branch Program Standees 0 0
Add'l Standees 0 0
Total Standees 0 0Huntington Branch Program Standees 0 0
Add'l Standees 0 0
Total Standees 0 0Hempstead Branch Program Standees 0 0
Add'l Standees 0 0
Total Standees 0 0Long Beach Branch Program Standees 0 0
Add'l Standees 0 0
Total Standees 0 0Montauk Branch Program Standees 0 0
Add'l Standees 0 0
Total Standees 0 0Oyster Bay Branch Program Standees 0 0
Add'l Standees 0 0
Total Standees 0 0Port Jefferson Branch Program Standees 0 0
Add'l Standees 0 0
Total Standees 0 0Port Washington Branch Program Standees 0 0
Add'l Standees 0 0
Total Standees 0 0Ronkonkoma Branch Program Standees 0 0
Add'l Standees 0 0Total Standees 0 0
West Hempstead Branch Program Standees 0 0
Add'l Standees 0 0
Total Standees 0 0System Wide PEAK 0 0
DefinitionsWeekday standees are calculated based on the most recent average weekday customer counts
"Program Standees" is the average number of customers in excess of programmed seating capacity.
"Additional Standees" reflect the impact of reduced train car consists (as reported in the weekday equipment reports).
Note: These statistics do not include the effects of daily ridership variation or uneven distribution of customers within trains.
Holidays and Special Events for which there are special equipment programs are not included.
Master Page # 179 of 245 - Joint Metro-North and Long Island Committees Meeting 10/18/2021________________________________________________________________________________
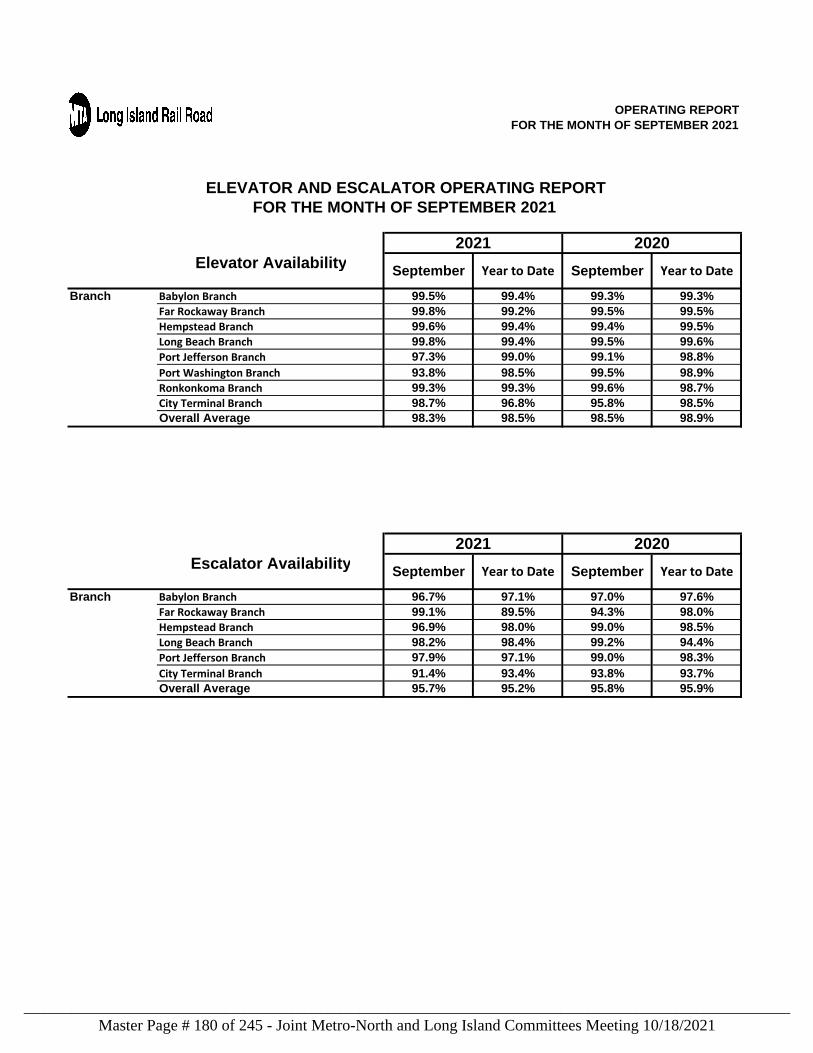
OPERATING REPORTFOR THE MONTH OF SEPTEMBER 2021
Elevator Availability
Branch Babylon Branch 99.5% 99.4% 99.3% 99.3%Far Rockaway Branch 99.8% 99.2% 99.5% 99.5%Hempstead Branch 99.6% 99.4% 99.4% 99.5%
Long Beach Branch 99.8% 99.4% 99.5% 99.6% Port Jefferson Branch 97.3% 99.0% 99.1% 98.8%
Port Washington Branch 93.8% 98.5% 99.5% 98.9%Ronkonkoma Branch 99.3% 99.3% 99.6% 98.7%City Terminal Branch 98.7% 96.8% 95.8% 98.5%Overall Average 98.3% 98.5% 98.5% 98.9%
Escalator Availability
Branch Babylon Branch 96.7% 97.1% 97.0% 97.6%Far Rockaway Branch 99.1% 89.5% 94.3% 98.0%Hempstead Branch 96.9% 98.0% 99.0% 98.5%
Long Beach Branch 98.2% 98.4% 99.2% 94.4% Port Jefferson Branch 97.9% 97.1% 99.0% 98.3%
City Terminal Branch 91.4% 93.4% 93.8% 93.7%Overall Average 95.7% 95.2% 95.8% 95.9%
2021 2020September Year to Date September Year to Date
ELEVATOR AND ESCALATOR OPERATING REPORTFOR THE MONTH OF SEPTEMBER 2021
2021 2020September Year to Date September Year to Date
Master Page # 180 of 245 - Joint Metro-North and Long Island Committees Meeting 10/18/2021________________________________________________________________________________
Long Island Rail Road Performance Metrics Report
Master Page # 181 of 245 - Joint Metro-North and Long Island Committees Meeting 10/18/2021________________________________________________________________________________
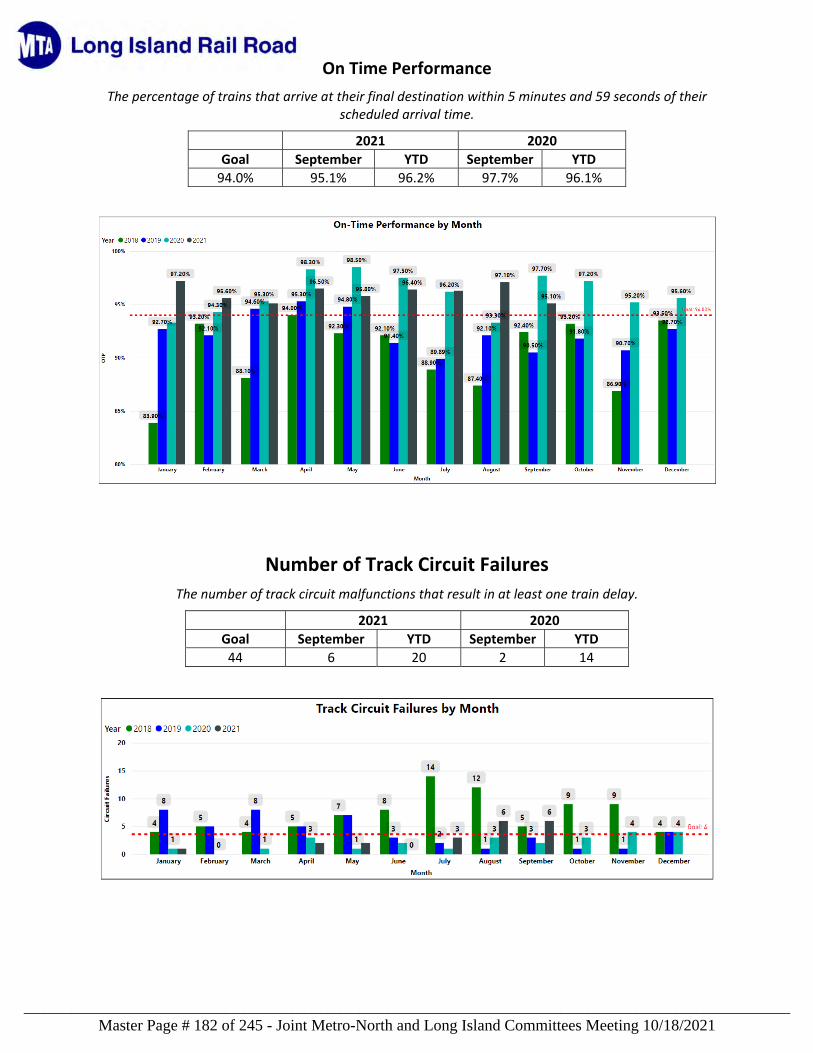
On Time Performance
The percentage of trains that arrive at their final destination within 5 minutes and 59 seconds of their scheduled arrival time.
2021 2020
Goal September YTD September YTD
94.0% 95.1% 96.2% 97.7% 96.1%
Number of Track Circuit Failures
The number of track circuit malfunctions that result in at least one train delay.
2021 2020
Goal September YTD September YTD
44 6 20 2 14
Master Page # 182 of 245 - Joint Metro-North and Long Island Committees Meeting 10/18/2021________________________________________________________________________________
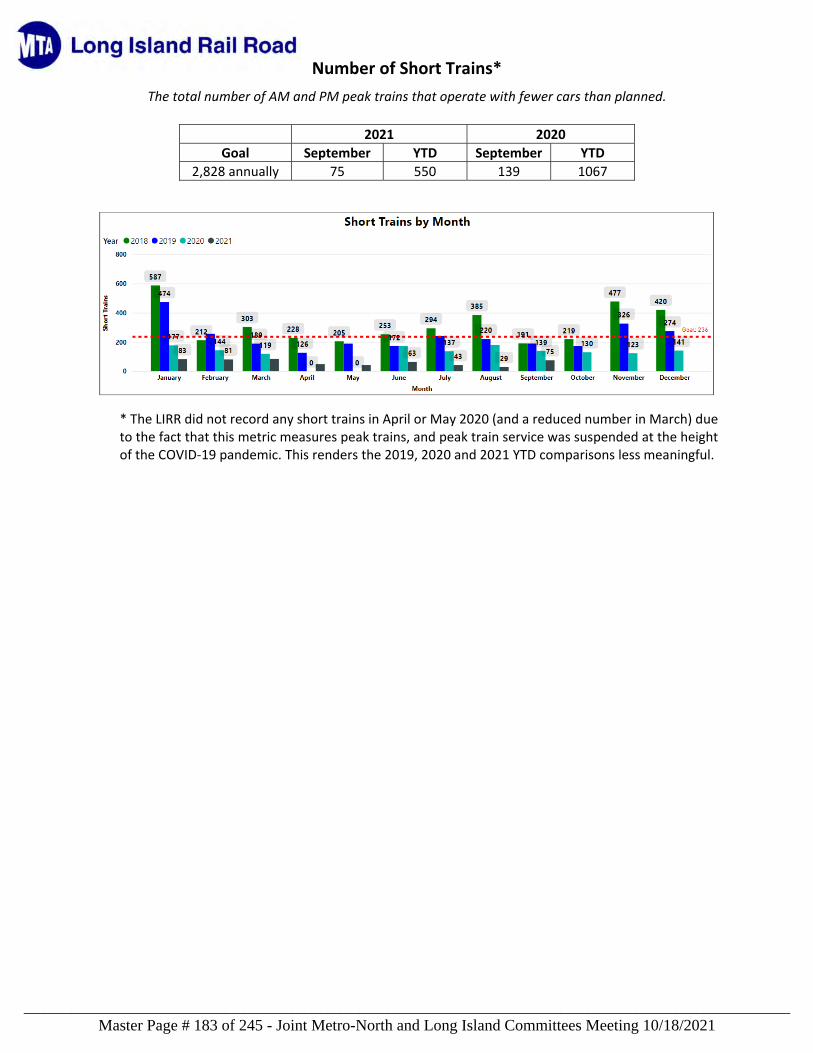
Number of Short Trains*
The total number of AM and PM peak trains that operate with fewer cars than planned.
2021 2020
Goal September YTD September YTD
2,828 annually 75 550 139 1067
* The LIRR did not record any short trains in April or May 2020 (and a reduced number in March) due to the fact that this metric measures peak trains, and peak train service was suspended at the height of the COVID‐19 pandemic. This renders the 2019, 2020 and 2021 YTD comparisons less meaningful.
Master Page # 183 of 245 - Joint Metro-North and Long Island Committees Meeting 10/18/2021________________________________________________________________________________
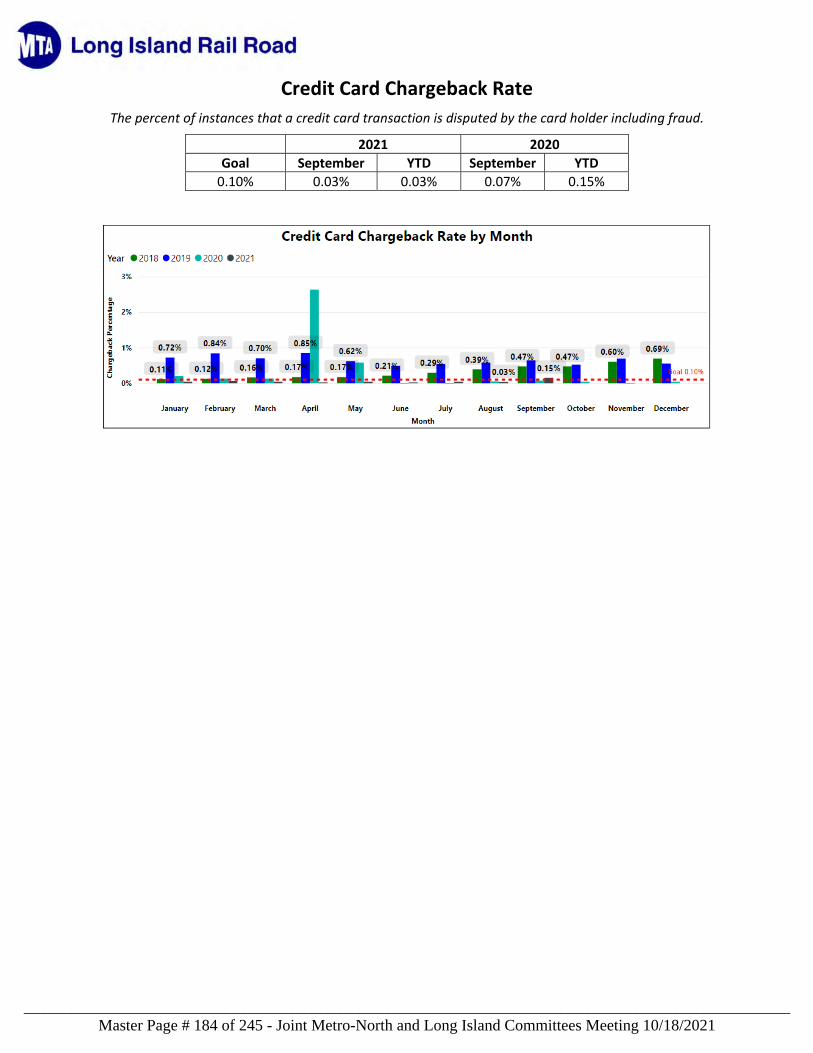
Credit Card Chargeback Rate
The percent of instances that a credit card transaction is disputed by the card holder including fraud.
2021 2020
Goal September YTD September YTD
0.10% 0.03% 0.03% 0.07% 0.15%
Master Page # 184 of 245 - Joint Metro-North and Long Island Committees Meeting 10/18/2021________________________________________________________________________________
Financial Report Highlights
September 2021
Francis Landers Financial Liaison Long Island Rail Road MTA Office of the Chief Financial Officer
Master Page # 185 of 245 - Joint Metro-North and Long Island Committees Meeting 10/18/2021________________________________________________________________________________
Financial Report Highlights The Long Island Rail Road’s Monthly Financial Report provides year-to-date fiscal information comparing actual revenues, expenses and staffing levels to the Mid-Year Forecast and key financial performance indicators.
September 2021 Highlights
Total revenue of $554.1 million was $19.0 million higher than the forecast. This was primarily due to higher capital and other reimbursements and higher farebox revenue.
Through September 2021 ridership was 23.5 million, which was (2.4)% below 2020 and (65.6)% below 2019 pre-COVID levels (adjusted for the same number of work days), and 3.4% above the forecast. Commutation ridership of 6.5 million was (45.7)% below 2020 and (34.4)% below the forecast. Non-Commutation ridership of 17.0 million was 40.6% above 2020 and 32.7% above the forecast. Consequently, farebox revenue of $199.2 million was $6.9 million higher than the forecast.
Total expenses before non-cash liability adjustments of $1,426.4 million were $113.7 million or 7.4% favorable to the forecast. The primary drivers of this favorable variance are vacant positions and associated fringe costs, lower overtime, the timing of expenses for material usage, OPEB current, electric and insurance expenses.
Financial results for Year-to-Date (YTD) September 2021 are presented in the table below and compared to the forecast.
Category ($ in Millions) Forecast Actual Variance
Total Revenue $535.0 $554.1 $19.0
Total Expenses Before Non-Cash Liabilities 1,540.1
1,426.4 113.7 Net Surplus/(Deficit) Before Non-Cash Liabilities ($1,005.1) ($872.3) $132.8 Other Non-Cash Liabilities 331.0 345.1 (14.1) Net Surplus/(Deficit) After Non-Cash Liabilities
($1,336.1) ($1,217.5)
$118.6
Cash Adjustments 218.8 285.3 66.6 Net Cash Surplus/(Deficit) ($1,117.3) ($932.1) $185.1
Master Page # 186 of 245 - Joint Metro-North and Long Island Committees Meeting 10/18/2021________________________________________________________________________________
Financial Report Highlights NON-REIMBURSABLE SUMMARY
September YTD operating results were favorable by $118.6 million or 8.9% lower than the forecast.
Non-Reimbursable revenues through September were $6.2 million favorable to the forecast. Farebox Revenue was favorable as a result of higher ridership and yield per passenger. Other Operating Revenues were unfavorable to forecast due to lower advertising revenue and the timing of rental revenue, partially offset by timing of miscellaneous and freight revenue. Total Non-Reimbursable expenses were $112.4 million favorable due to vacant positions and associated fringe costs, accrual reversal for retroactive wages that was partially billed to reimbursable projects, the timing of materials, professional and maintenance services, and lower OPEB current, overtime and electric power, partially offset by higher depreciation and bad debt expenses.
YTD capital and other reimbursable expenditures (and reimbursements) were $12.8 higher than the forecast due to retroactive wages billed to reimbursable projects that were previously accrued to operating and the timing of capital and other reimbursements.
REVENUE/RIDERSHIP
Year-to-Date Total Revenues (including Capital and Other Reimbursements) of $554.1 were $19.0 or 3.6% favorable to the forecast.
Y-T-D Farebox Revenues were $6.9 favorable to the forecast due to higher ridership and yield per passenger. Ridership through September was 23.5 million. This was (2.4)% lower than 2020 (adjusted for the same number of calendar work days) and 3.4% higher than the forecast.
Y-T-D Other Operating Revenues were $(0.7) unfavorable to the forecast due to lower advertising and timing of rental revenue, partially offset by timing of miscellaneous and freight revenue.
Y-T-D Capital and Other Reimbursements were $12.8 favorable due retroactive wages previously accrued as operating that were billed to reimbursable projects in the month of September and the timing of capital activity and interagency reimbursements.
EXPENSES
Year-to Date Total Expenses (including depreciation and other) of $1,771.5 were favorable to the forecast by $99.6 or 5.3%.
Labor Expenses, $84.4 favorable Y-T-D.
Payroll, $27.6 favorable Y-T-D (primarily vacant positions). Overtime, $27.2 favorable Y-T-D (primarily lower programmatic/routine maintenance,
vacancy/absentee coverage, capital project activity and scheduled/unscheduled service). Health & Welfare, $6.6 favorable Y-T-D (vacant positions). OPEB Current Payment, $8.8 favorable Y-T-D (fewer retirees/beneficiaries than projected). Pension, $3.8 favorable Y-T-D (timing). Other Fringe, $10.3 favorable Y-T-D (primarily lower Railroad Retirement Taxes due to vacant
positions).
Non-Labor Expenses, $29.2 favorable Y-T-D.
Electric Power, $4.7 favorable Y-T-D (lower usage, partially offset by higher rates).
Master Page # 187 of 245 - Joint Metro-North and Long Island Committees Meeting 10/18/2021________________________________________________________________________________
Financial Report Highlights
Fuel, $(0.5) unfavorable Y-T-D (higher rates and timing of accruals, partially offset by lower consumption).
Insurance, $1.1 favorable Y-T-D (primarily force account insurance). Claims, $0.9 favorable Y-T-D (decrease in corporate reserves). Maintenance and Other Operating Contracts, $3.6 favorable Y-T-D (Primarily due to the timing
of security service and maintenance invoices, Moynihan Train Hall one-time start-up costs, uniform invoices, delayed vehicle purchases and maintenance and repair services, and lower equipment rental and real estate rental costs, partially offset by higher joint facility maintenance).
Professional Services, $1.0 favorable Y-T-D (primarily due to the timing of rolling stock decommissioning, MTA Chargeback services, IT hardware and software costs for new facilities and rail inspections, partially offset by higher capital project activity).
Materials and Supplies, $19.9 favorable Y-T-D (primarily timing of fleet maintenance and modifications and right of way initiatives, partially offset by higher capital project activity).
Other Business Expenses, $(1.5) unfavorable Y-T-D (primarily due to higher bad debt reserves and credit/debit card processing fees, partially offset by lower office supplies, travel and other miscellaneous expenses).
Depreciation and Other, $(14.1) unfavorable Y-T-D (Primarily depreciation).
CASH DEFICIT SUMMARY
The Cash Deficit through September of $(932.1) was $185.1 favorable to the forecast due to higher farebox revenue, capital and other reimbursements and the timing of and lower expenditures.
FINANCIAL PERFORMANCE MEASURES
The year-to-date September Farebox Operating Ratio was 18.2%, 2.5 percentage points above the forecast resulting from higher farebox revenue and lower expenses.
The year-to-date September Adjusted Farebox Operating Ratio was 21.9%, which is above the forecast due to higher farebox revenue and lower expenses.
The year-to-date September Adjusted Cost per Passenger was $42.87, which is lower than the forecast due to higher ridership and lower expenses.
The year-to-date September Revenue per Passenger was $8.49, which was slightly above the forecast.
Master Page # 188 of 245 - Joint Metro-North and Long Island Committees Meeting 10/18/2021________________________________________________________________________________
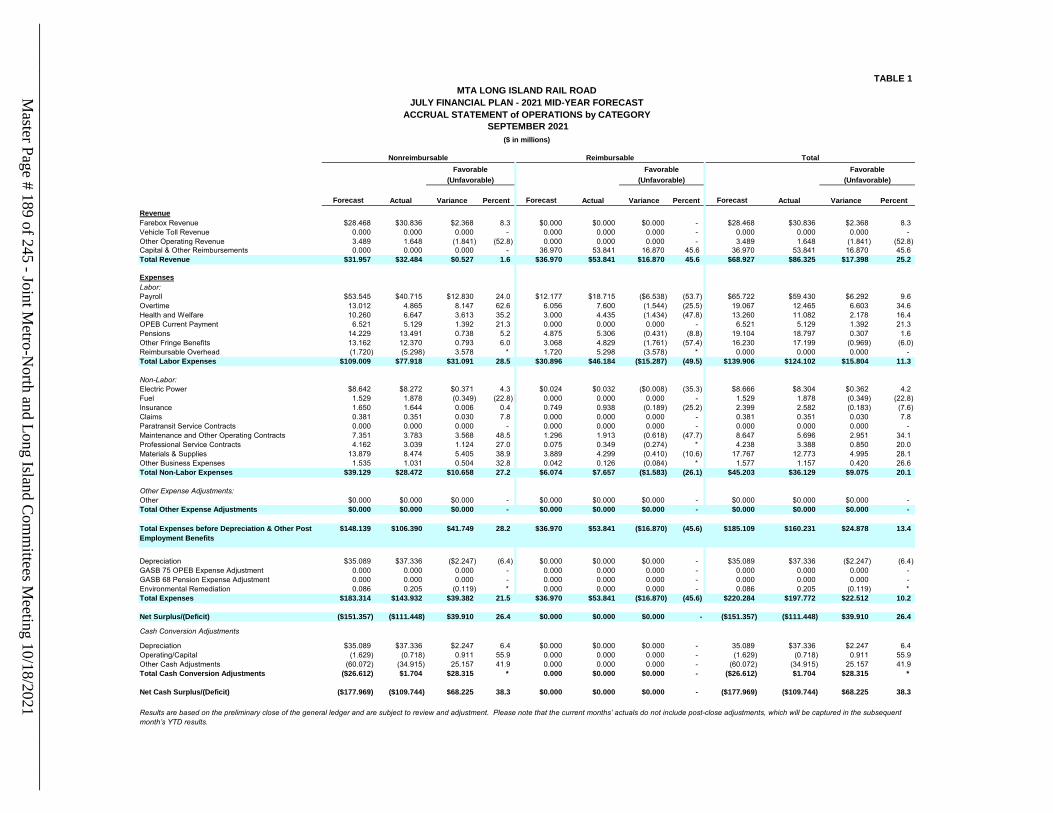
TABLE 1
Need to update Actuals
Forecast Actual Variance Percent Forecast Actual Variance Percent Forecast Actual Variance PercentRevenueFarebox Revenue $28.468 $30.836 $2.368 8.3 $0.000 $0.000 $0.000 - $28.468 $30.836 $2.368 8.3Vehicle Toll Revenue 0.000 0.000 0.000 - 0.000 0.000 0.000 - 0.000 0.000 0.000 - Other Operating Revenue 3.489 1.648 (1.841) (52.8) 0.000 0.000 0.000 - 3.489 1.648 (1.841) (52.8)Capital & Other Reimbursements 0.000 0.000 0.000 - 36.970 53.841 16.870 45.6 36.970 53.841 16.870 45.6Total Revenue $31.957 $32.484 $0.527 1.6 $36.970 $53.841 $16.870 45.6 $68.927 $86.325 $17.398 25.2
ExpensesLabor:Payroll $53.545 $40.715 $12.830 24.0 $12.177 $18.715 ($6.538) (53.7) $65.722 $59.430 $6.292 9.6Overtime 13.012 4.865 8.147 62.6 6.056 7.600 (1.544) (25.5) 19.067 12.465 6.603 34.6Health and Welfare 10.260 6.647 3.613 35.2 3.000 4.435 (1.434) (47.8) 13.260 11.082 2.178 16.4OPEB Current Payment 6.521 5.129 1.392 21.3 0.000 0.000 0.000 - 6.521 5.129 1.392 21.3Pensions 14.229 13.491 0.738 5.2 4.875 5.306 (0.431) (8.8) 19.104 18.797 0.307 1.6Other Fringe Benefits 13.162 12.370 0.793 6.0 3.068 4.829 (1.761) (57.4) 16.230 17.199 (0.969) (6.0)Reimbursable Overhead (1.720) (5.298) 3.578 * 1.720 5.298 (3.578) * 0.000 0.000 0.000 - Total Labor Expenses $109.009 $77.918 $31.091 28.5 $30.896 $46.184 ($15.287) (49.5) $139.906 $124.102 $15.804 11.3
Non-Labor:Electric Power $8.642 $8.272 $0.371 4.3 $0.024 $0.032 ($0.008) (35.3) $8.666 $8.304 $0.362 4.2Fuel 1.529 1.878 (0.349) (22.8) 0.000 0.000 0.000 - 1.529 1.878 (0.349) (22.8)Insurance 1.650 1.644 0.006 0.4 0.749 0.938 (0.189) (25.2) 2.399 2.582 (0.183) (7.6)Claims 0.381 0.351 0.030 7.8 0.000 0.000 0.000 - 0.381 0.351 0.030 7.8Paratransit Service Contracts 0.000 0.000 0.000 - 0.000 0.000 0.000 - 0.000 0.000 0.000 - Maintenance and Other Operating Contracts 7.351 3.783 3.568 48.5 1.296 1.913 (0.618) (47.7) 8.647 5.696 2.951 34.1Professional Service Contracts 4.162 3.039 1.124 27.0 0.075 0.349 (0.274) * 4.238 3.388 0.850 20.0Materials & Supplies 13.879 8.474 5.405 38.9 3.889 4.299 (0.410) (10.6) 17.767 12.773 4.995 28.1Other Business Expenses 1.535 1.031 0.504 32.8 0.042 0.126 (0.084) * 1.577 1.157 0.420 26.6Total Non-Labor Expenses $39.129 $28.472 $10.658 27.2 $6.074 $7.657 ($1.583) (26.1) $45.203 $36.129 $9.075 20.1
Other Expense Adjustments:Other $0.000 $0.000 $0.000 - $0.000 $0.000 $0.000 - $0.000 $0.000 $0.000 - Total Other Expense Adjustments $0.000 $0.000 $0.000 - $0.000 $0.000 $0.000 - $0.000 $0.000 $0.000 -
Total Expenses before Depreciation & Other Post Employment Benefits
$148.139 $106.390 $41.749 28.2 $36.970 $53.841 ($16.870) (45.6) $185.109 $160.231 $24.878 13.4
Depreciation $35.089 $37.336 ($2.247) (6.4) $0.000 $0.000 $0.000 - $35.089 $37.336 ($2.247) (6.4)GASB 75 OPEB Expense Adjustment 0.000 0.000 0.000 - 0.000 0.000 0.000 - 0.000 0.000 0.000 - GASB 68 Pension Expense Adjustment 0.000 0.000 0.000 - 0.000 0.000 0.000 - 0.000 0.000 0.000 - Environmental Remediation 0.086 0.205 (0.119) * 0.000 0.000 0.000 - 0.086 0.205 (0.119) * Total Expenses $183.314 $143.932 $39.382 21.5 $36.970 $53.841 ($16.870) (45.6) $220.284 $197.772 $22.512 10.2
Net Surplus/(Deficit) ($151.357) ($111.448) $39.910 26.4 $0.000 $0.000 $0.000 - ($151.357) ($111.448) $39.910 26.4
Cash Conversion Adjustments
Depreciation $35.089 $37.336 $2.247 6.4 $0.000 $0.000 $0.000 - 35.089 $37.336 $2.247 6.4Operating/Capital (1.629) (0.718) 0.911 55.9 0.000 0.000 0.000 - (1.629) (0.718) 0.911 55.9Other Cash Adjustments (60.072) (34.915) 25.157 41.9 0.000 0.000 0.000 - (60.072) (34.915) 25.157 41.9Total Cash Conversion Adjustments ($26.612) $1.704 $28.315 * 0.000 $0.000 $0.000 - ($26.612) $1.704 $28.315 *
Net Cash Surplus/(Deficit) ($177.969) ($109.744) $68.225 38.3 $0.000 $0.000 $0.000 - ($177.969) ($109.744) $68.225 38.3
Results are based on the preliminary close of the general ledger and are subject to review and adjustment. Please note that the current months’ actuals do not include post-close adjustments, which will be captured in the subsequent month’s YTD results.
(Unfavorable) (Unfavorable) (Unfavorable)
SEPTEMBER 2021($ in millions)
Nonreimbursable Reimbursable TotalFavorable Favorable Favorable
MTA LONG ISLAND RAIL ROADJULY FINANCIAL PLAN - 2021 MID-YEAR FORECAST
ACCRUAL STATEMENT of OPERATIONS by CATEGORY
Master Page # 189 of 245 - Joint M
etro-North and Long Island C
omm
ittees Meeting 10/18/2021
________________________________________________________________________________
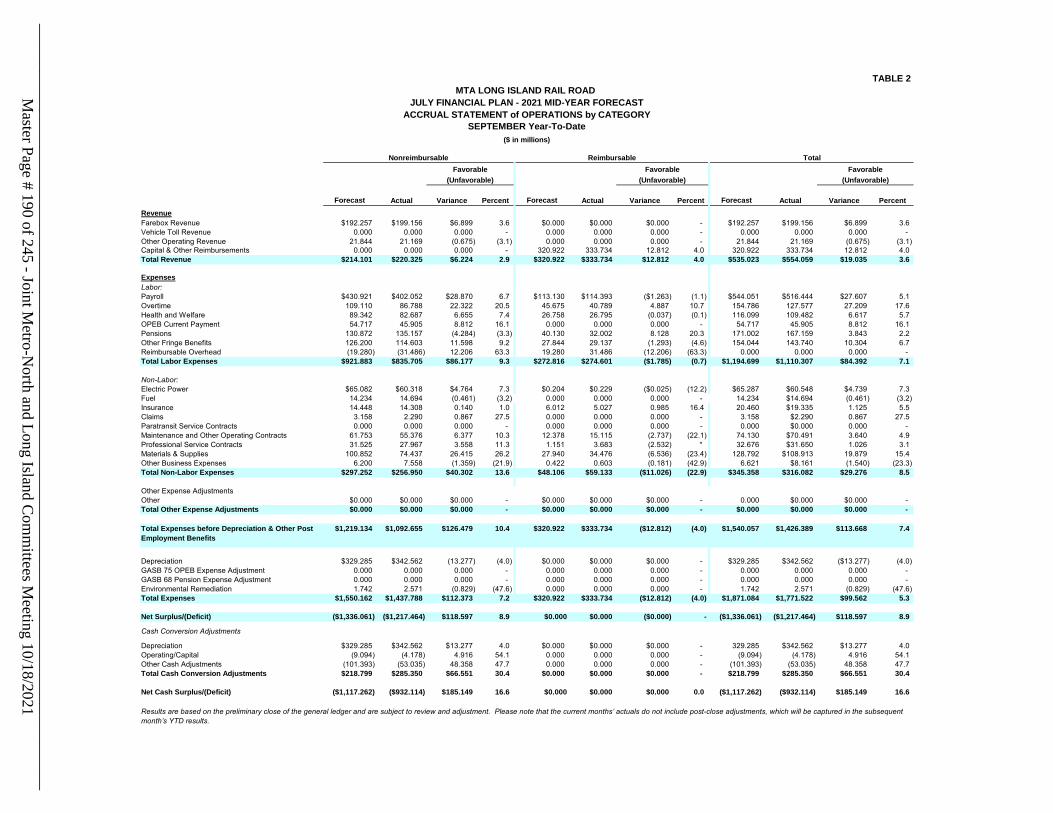
TABLE 2
Forecast Actual Variance Percent Forecast Actual Variance Percent Forecast Actual Variance PercentRevenueFarebox Revenue $192.257 $199.156 $6.899 3.6 $0.000 $0.000 $0.000 - $192.257 $199.156 $6.899 3.6Vehicle Toll Revenue 0.000 0.000 0.000 - 0.000 0.000 0.000 - 0.000 0.000 0.000 - Other Operating Revenue 21.844 21.169 (0.675) (3.1) 0.000 0.000 0.000 - 21.844 21.169 (0.675) (3.1)Capital & Other Reimbursements 0.000 0.000 0.000 - 320.922 333.734 12.812 4.0 320.922 333.734 12.812 4.0Total Revenue $214.101 $220.325 $6.224 2.9 $320.922 $333.734 $12.812 4.0 $535.023 $554.059 $19.035 3.6
ExpensesLabor:Payroll $430.921 $402.052 $28.870 6.7 $113.130 $114.393 ($1.263) (1.1) $544.051 $516.444 $27.607 5.1Overtime 109.110 86.788 22.322 20.5 45.675 40.789 4.887 10.7 154.786 127.577 27.209 17.6Health and Welfare 89.342 82.687 6.655 7.4 26.758 26.795 (0.037) (0.1) 116.099 109.482 6.617 5.7OPEB Current Payment 54.717 45.905 8.812 16.1 0.000 0.000 0.000 - 54.717 45.905 8.812 16.1Pensions 130.872 135.157 (4.284) (3.3) 40.130 32.002 8.128 20.3 171.002 167.159 3.843 2.2Other Fringe Benefits 126.200 114.603 11.598 9.2 27.844 29.137 (1.293) (4.6) 154.044 143.740 10.304 6.7Reimbursable Overhead (19.280) (31.486) 12.206 63.3 19.280 31.486 (12.206) (63.3) 0.000 0.000 0.000 - Total Labor Expenses $921.883 $835.705 $86.177 9.3 $272.816 $274.601 ($1.785) (0.7) $1,194.699 $1,110.307 $84.392 7.1
Non-Labor:Electric Power $65.082 $60.318 $4.764 7.3 $0.204 $0.229 ($0.025) (12.2) $65.287 $60.548 $4.739 7.3Fuel 14.234 14.694 (0.461) (3.2) 0.000 0.000 0.000 - 14.234 $14.694 (0.461) (3.2)Insurance 14.448 14.308 0.140 1.0 6.012 5.027 0.985 16.4 20.460 $19.335 1.125 5.5Claims 3.158 2.290 0.867 27.5 0.000 0.000 0.000 - 3.158 $2.290 0.867 27.5Paratransit Service Contracts 0.000 0.000 0.000 - 0.000 0.000 0.000 - 0.000 $0.000 0.000 - Maintenance and Other Operating Contracts 61.753 55.376 6.377 10.3 12.378 15.115 (2.737) (22.1) 74.130 $70.491 3.640 4.9Professional Service Contracts 31.525 27.967 3.558 11.3 1.151 3.683 (2.532) * 32.676 $31.650 1.026 3.1Materials & Supplies 100.852 74.437 26.415 26.2 27.940 34.476 (6.536) (23.4) 128.792 $108.913 19.879 15.4Other Business Expenses 6.200 7.558 (1.359) (21.9) 0.422 0.603 (0.181) (42.9) 6.621 $8.161 (1.540) (23.3)Total Non-Labor Expenses $297.252 $256.950 $40.302 13.6 $48.106 $59.133 ($11.026) (22.9) $345.358 $316.082 $29.276 8.5
Other Expense AdjustmentsOther $0.000 $0.000 $0.000 - $0.000 $0.000 $0.000 - 0.000 $0.000 $0.000 - Total Other Expense Adjustments $0.000 $0.000 $0.000 - $0.000 $0.000 $0.000 - $0.000 $0.000 $0.000 -
Total Expenses before Depreciation & Other Post Employment Benefits
$1,219.134 $1,092.655 $126.479 10.4 $320.922 $333.734 ($12.812) (4.0) $1,540.057 $1,426.389 $113.668 7.4
Depreciation $329.285 $342.562 (13.277) (4.0) $0.000 $0.000 $0.000 - $329.285 $342.562 ($13.277) (4.0)GASB 75 OPEB Expense Adjustment 0.000 0.000 0.000 - 0.000 0.000 0.000 - 0.000 0.000 0.000 - GASB 68 Pension Expense Adjustment 0.000 0.000 0.000 - 0.000 0.000 0.000 - 0.000 0.000 0.000 - Environmental Remediation 1.742 2.571 (0.829) (47.6) 0.000 0.000 0.000 - 1.742 2.571 (0.829) (47.6)Total Expenses $1,550.162 $1,437.788 $112.373 7.2 $320.922 $333.734 ($12.812) (4.0) $1,871.084 $1,771.522 $99.562 5.3
Net Surplus/(Deficit) ($1,336.061) ($1,217.464) $118.597 8.9 $0.000 $0.000 ($0.000) - ($1,336.061) ($1,217.464) $118.597 8.9
Cash Conversion Adjustments
Depreciation $329.285 $342.562 $13.277 4.0 $0.000 $0.000 $0.000 - 329.285 $342.562 $13.277 4.0Operating/Capital (9.094) (4.178) 4.916 54.1 0.000 0.000 0.000 - (9.094) (4.178) 4.916 54.1Other Cash Adjustments (101.393) (53.035) 48.358 47.7 0.000 0.000 0.000 - (101.393) (53.035) 48.358 47.7Total Cash Conversion Adjustments $218.799 $285.350 $66.551 30.4 $0.000 $0.000 $0.000 - $218.799 $285.350 $66.551 30.4
Net Cash Surplus/(Deficit) ($1,117.262) ($932.114) $185.149 16.6 $0.000 $0.000 $0.000 0.0 ($1,117.262) ($932.114) $185.149 16.6
Results are based on the preliminary close of the general ledger and are subject to review and adjustment. Please note that the current months’ actuals do not include post-close adjustments, which will be captured in the subsequent month’s YTD results.
(Unfavorable) (Unfavorable) (Unfavorable)Favorable
SEPTEMBER Year-To-Date($ in millions)
Nonreimbursable Reimbursable TotalFavorable Favorable
MTA LONG ISLAND RAIL ROAD JULY FINANCIAL PLAN - 2021 MID-YEAR FORECAST
ACCRUAL STATEMENT of OPERATIONS by CATEGORY
Master Page # 190 of 245 - Joint M
etro-North and Long Island C
omm
ittees Meeting 10/18/2021
________________________________________________________________________________
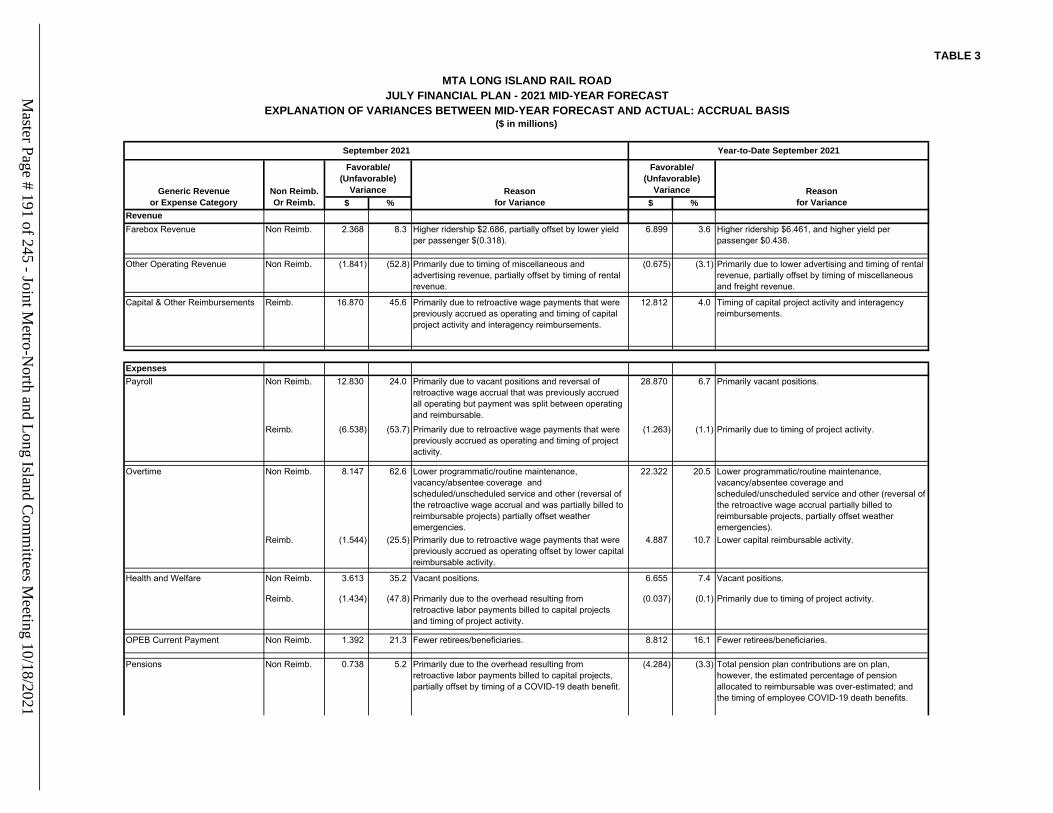
TABLE 3
$ % $ %RevenueFarebox Revenue Non Reimb. 2.368 8.3 Higher ridership $2.686, partially offset by lower yield
per passenger $(0.318).6.899 3.6 Higher ridership $6.461, and higher yield per
passenger $0.438.
Other Operating Revenue Non Reimb. (1.841) (52.8) Primarily due to timing of miscellaneous and advertising revenue, partially offset by timing of rental revenue.
(0.675) (3.1) Primarily due to lower advertising and timing of rental revenue, partially offset by timing of miscellaneous and freight revenue.
Capital & Other Reimbursements Reimb. 16.870 45.6 Primarily due to retroactive wage payments that were previously accrued as operating and timing of capital project activity and interagency reimbursements.
12.812 4.0 Timing of capital project activity and interagency reimbursements.
Expenses Payroll Non Reimb. 12.830 24.0 Primarily due to vacant positions and reversal of
retroactive wage accrual that was previously accrued all operating but payment was split between operating and reimbursable.
28.870 6.7 Primarily vacant positions.
Reimb. (6.538) (53.7) Primarily due to retroactive wage payments that were previously accrued as operating and timing of project activity.
(1.263) (1.1) Primarily due to timing of project activity.
Overtime Non Reimb. 8.147 62.6 Lower programmatic/routine maintenance, vacancy/absentee coverage and scheduled/unscheduled service and other (reversal of the retroactive wage accrual and was partially billed to reimbursable projects) partially offset weather emergencies.
22.322 20.5 Lower programmatic/routine maintenance, vacancy/absentee coverage and scheduled/unscheduled service and other (reversal of the retroactive wage accrual partially billed to reimbursable projects, partially offset weather emergencies).
Reimb. (1.544) (25.5) Primarily due to retroactive wage payments that were previously accrued as operating offset by lower capital reimbursable activity.
4.887 10.7 Lower capital reimbursable activity.
Health and Welfare Non Reimb. 3.613 35.2 Vacant positions. 6.655 7.4 Vacant positions.
Reimb. (1.434) (47.8) Primarily due to the overhead resulting from retroactive labor payments billed to capital projects and timing of project activity.
(0.037) (0.1) Primarily due to timing of project activity.
OPEB Current Payment Non Reimb. 1.392 21.3 Fewer retirees/beneficiaries. 8.812 16.1 Fewer retirees/beneficiaries.
Pensions Non Reimb. 0.738 5.2 Primarily due to the overhead resulting from retroactive labor payments billed to capital projects, partially offset by timing of a COVID-19 death benefit.
(4.284) (3.3) Total pension plan contributions are on plan, however, the estimated percentage of pension allocated to reimbursable was over-estimated; and the timing of employee COVID-19 death benefits.
Non Reimb.Or Reimb.
Favorable/(Unfavorable)
Variance Reasonfor Variance
Favorable/(Unfavorable)
Variance
MTA LONG ISLAND RAIL ROADJULY FINANCIAL PLAN - 2021 MID-YEAR FORECAST
EXPLANATION OF VARIANCES BETWEEN MID-YEAR FORECAST AND ACTUAL: ACCRUAL BASIS
September 2021 Year-to-Date September 2021
Reasonfor Variance
Generic Revenueor Expense Category
($ in millions)
Master Page # 191 of 245 - Joint M
etro-North and Long Island C
omm
ittees Meeting 10/18/2021
________________________________________________________________________________
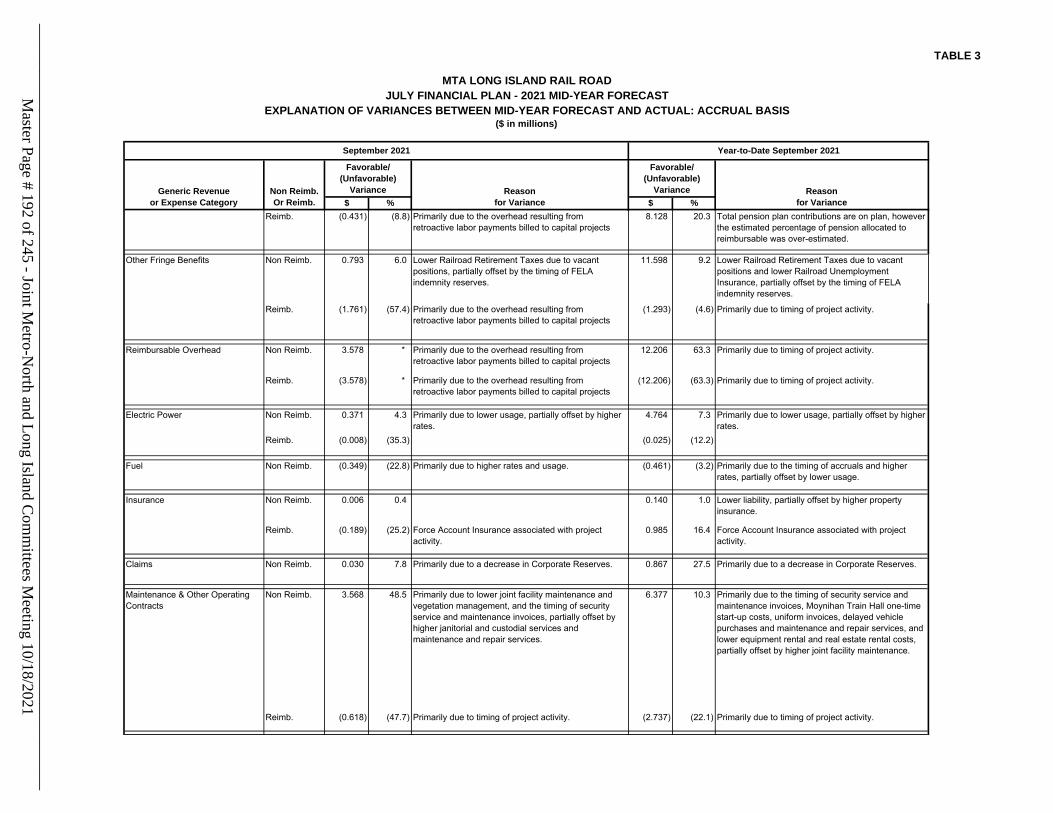
TABLE 3
$ % $ %Non Reimb.Or Reimb.
Favorable/(Unfavorable)
Variance Reasonfor Variance
Favorable/(Unfavorable)
Variance
MTA LONG ISLAND RAIL ROADJULY FINANCIAL PLAN - 2021 MID-YEAR FORECAST
EXPLANATION OF VARIANCES BETWEEN MID-YEAR FORECAST AND ACTUAL: ACCRUAL BASIS
September 2021 Year-to-Date September 2021
Reasonfor Variance
Generic Revenueor Expense Category
($ in millions)
Reimb. (0.431) (8.8) Primarily due to the overhead resulting from retroactive labor payments billed to capital projects
8.128 20.3 Total pension plan contributions are on plan, however the estimated percentage of pension allocated to reimbursable was over-estimated.
Other Fringe Benefits Non Reimb. 0.793 6.0 Lower Railroad Retirement Taxes due to vacant positions, partially offset by the timing of FELA indemnity reserves.
11.598 9.2 Lower Railroad Retirement Taxes due to vacant positions and lower Railroad Unemployment Insurance, partially offset by the timing of FELA indemnity reserves.
Reimb. (1.761) (57.4) Primarily due to the overhead resulting from retroactive labor payments billed to capital projects
(1.293) (4.6) Primarily due to timing of project activity.
Reimbursable Overhead Non Reimb. 3.578 * Primarily due to the overhead resulting from retroactive labor payments billed to capital projects
12.206 63.3 Primarily due to timing of project activity.
Reimb. (3.578) * Primarily due to the overhead resulting from retroactive labor payments billed to capital projects
(12.206) (63.3) Primarily due to timing of project activity.
Electric Power Non Reimb. 0.371 4.3 Primarily due to lower usage, partially offset by higher rates.
4.764 7.3 Primarily due to lower usage, partially offset by higher rates.
Reimb. (0.008) (35.3) (0.025) (12.2)
Fuel Non Reimb. (0.349) (22.8) Primarily due to higher rates and usage. (0.461) (3.2) Primarily due to the timing of accruals and higher rates, partially offset by lower usage.
Insurance Non Reimb. 0.006 0.4 0.140 1.0 Lower liability, partially offset by higher property insurance.
Reimb. (0.189) (25.2) Force Account Insurance associated with project activity.
0.985 16.4 Force Account Insurance associated with project activity.
Claims Non Reimb. 0.030 7.8 Primarily due to a decrease in Corporate Reserves. 0.867 27.5 Primarily due to a decrease in Corporate Reserves.
Maintenance & Other Operating Contracts
Non Reimb. 3.568 48.5 Primarily due to lower joint facility maintenance and vegetation management, and the timing of security service and maintenance invoices, partially offset by higher janitorial and custodial services and maintenance and repair services.
6.377 10.3 Primarily due to the timing of security service and maintenance invoices, Moynihan Train Hall one-time start-up costs, uniform invoices, delayed vehicle purchases and maintenance and repair services, and lower equipment rental and real estate rental costs, partially offset by higher joint facility maintenance.
Reimb. (0.618) (47.7) Primarily due to timing of project activity. (2.737) (22.1) Primarily due to timing of project activity.
Master Page # 192 of 245 - Joint M
etro-North and Long Island C
omm
ittees Meeting 10/18/2021
________________________________________________________________________________
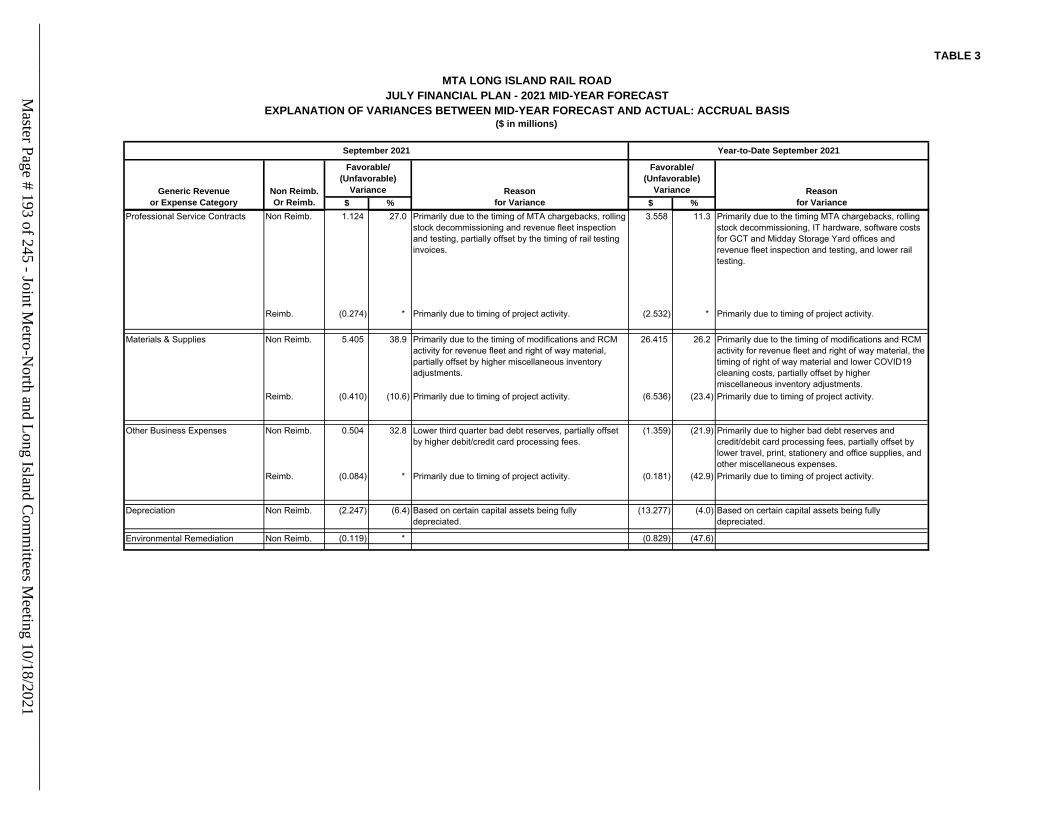
TABLE 3
$ % $ %Non Reimb.Or Reimb.
Favorable/(Unfavorable)
Variance Reasonfor Variance
Favorable/(Unfavorable)
Variance
MTA LONG ISLAND RAIL ROADJULY FINANCIAL PLAN - 2021 MID-YEAR FORECAST
EXPLANATION OF VARIANCES BETWEEN MID-YEAR FORECAST AND ACTUAL: ACCRUAL BASIS
September 2021 Year-to-Date September 2021
Reasonfor Variance
Generic Revenueor Expense Category
($ in millions)
Professional Service Contracts Non Reimb. 1.124 27.0 Primarily due to the timing of MTA chargebacks, rolling stock decommissioning and revenue fleet inspection and testing, partially offset by the timing of rail testing invoices.
3.558 11.3 Primarily due to the timing MTA chargebacks, rolling stock decommissioning, IT hardware, software costs for GCT and Midday Storage Yard offices and revenue fleet inspection and testing, and lower rail testing.
Reimb. (0.274) * Primarily due to timing of project activity. (2.532) * Primarily due to timing of project activity.
Materials & Supplies Non Reimb. 5.405 38.9 Primarily due to the timing of modifications and RCM activity for revenue fleet and right of way material, partially offset by higher miscellaneous inventory adjustments.
26.415 26.2 Primarily due to the timing of modifications and RCM activity for revenue fleet and right of way material, the timing of right of way material and lower COVID19 cleaning costs, partially offset by higher miscellaneous inventory adjustments.
Reimb. (0.410) (10.6) Primarily due to timing of project activity. (6.536) (23.4) Primarily due to timing of project activity.
Other Business Expenses Non Reimb. 0.504 32.8 Lower third quarter bad debt reserves, partially offset by higher debit/credit card processing fees.
(1.359) (21.9) Primarily due to higher bad debt reserves and credit/debit card processing fees, partially offset by lower travel, print, stationery and office supplies, and other miscellaneous expenses.
Reimb. (0.084) * Primarily due to timing of project activity. (0.181) (42.9) Primarily due to timing of project activity.
Depreciation Non Reimb. (2.247) (6.4) Based on certain capital assets being fully depreciated.
(13.277) (4.0) Based on certain capital assets being fully depreciated.
Environmental Remediation Non Reimb. (0.119) * (0.829) (47.6)
Master Page # 193 of 245 - Joint M
etro-North and Long Island C
omm
ittees Meeting 10/18/2021
________________________________________________________________________________
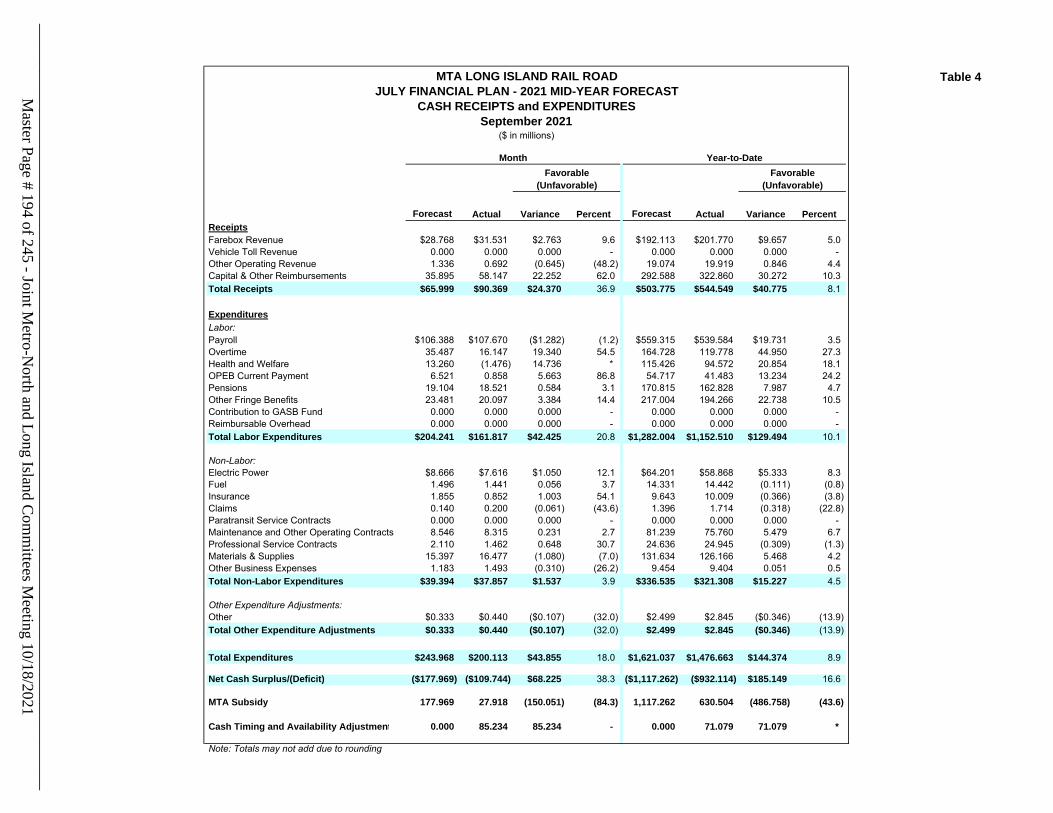
Table 4
Forecast Actual Variance Percent Forecast Actual Variance PercentReceiptsFarebox Revenue $28.768 $31.531 $2.763 9.6 $192.113 $201.770 $9.657 5.0Vehicle Toll Revenue 0.000 0.000 0.000 - 0.000 0.000 0.000 - Other Operating Revenue 1.336 0.692 (0.645) (48.2) 19.074 19.919 0.846 4.4Capital & Other Reimbursements 35.895 58.147 22.252 62.0 292.588 322.860 30.272 10.3Total Receipts $65.999 $90.369 $24.370 36.9 $503.775 $544.549 $40.775 8.1
ExpendituresLabor:Payroll $106.388 $107.670 ($1.282) (1.2) $559.315 $539.584 $19.731 3.5Overtime 35.487 16.147 19.340 54.5 164.728 119.778 44.950 27.3Health and Welfare 13.260 (1.476) 14.736 * 115.426 94.572 20.854 18.1OPEB Current Payment 6.521 0.858 5.663 86.8 54.717 41.483 13.234 24.2Pensions 19.104 18.521 0.584 3.1 170.815 162.828 7.987 4.7Other Fringe Benefits 23.481 20.097 3.384 14.4 217.004 194.266 22.738 10.5Contribution to GASB Fund 0.000 0.000 0.000 - 0.000 0.000 0.000 - Reimbursable Overhead 0.000 0.000 0.000 - 0.000 0.000 0.000 - Total Labor Expenditures $204.241 $161.817 $42.425 20.8 $1,282.004 $1,152.510 $129.494 10.1
Non-Labor:Electric Power $8.666 $7.616 $1.050 12.1 $64.201 $58.868 $5.333 8.3Fuel 1.496 1.441 0.056 3.7 14.331 14.442 (0.111) (0.8)Insurance 1.855 0.852 1.003 54.1 9.643 10.009 (0.366) (3.8)Claims 0.140 0.200 (0.061) (43.6) 1.396 1.714 (0.318) (22.8)Paratransit Service Contracts 0.000 0.000 0.000 - 0.000 0.000 0.000 - Maintenance and Other Operating Contracts 8.546 8.315 0.231 2.7 81.239 75.760 5.479 6.7Professional Service Contracts 2.110 1.462 0.648 30.7 24.636 24.945 (0.309) (1.3)Materials & Supplies 15.397 16.477 (1.080) (7.0) 131.634 126.166 5.468 4.2Other Business Expenses 1.183 1.493 (0.310) (26.2) 9.454 9.404 0.051 0.5Total Non-Labor Expenditures $39.394 $37.857 $1.537 3.9 $336.535 $321.308 $15.227 4.5
Other Expenditure Adjustments:Other $0.333 $0.440 ($0.107) (32.0) $2.499 $2.845 ($0.346) (13.9)Total Other Expenditure Adjustments $0.333 $0.440 ($0.107) (32.0) $2.499 $2.845 ($0.346) (13.9)
Total Expenditures $243.968 $200.113 $43.855 18.0 $1,621.037 $1,476.663 $144.374 8.9
Net Cash Surplus/(Deficit) ($177.969) ($109.744) $68.225 38.3 ($1,117.262) ($932.114) $185.149 16.6
MTA Subsidy 177.969 27.918 (150.051) (84.3) 1,117.262 630.504 (486.758) (43.6)
Cash Timing and Availability Adjustment 0.000 85.234 85.234 - 0.000 71.079 71.079 *
Note: Totals may not add due to rounding
Month Year-to-DateFavorable Favorable
(Unfavorable) (Unfavorable)
MTA LONG ISLAND RAIL ROADJULY FINANCIAL PLAN - 2021 MID-YEAR FORECAST
CASH RECEIPTS and EXPENDITURESSeptember 2021
($ in millions)
Master Page # 194 of 245 - Joint M
etro-North and Long Island C
omm
ittees Meeting 10/18/2021
________________________________________________________________________________
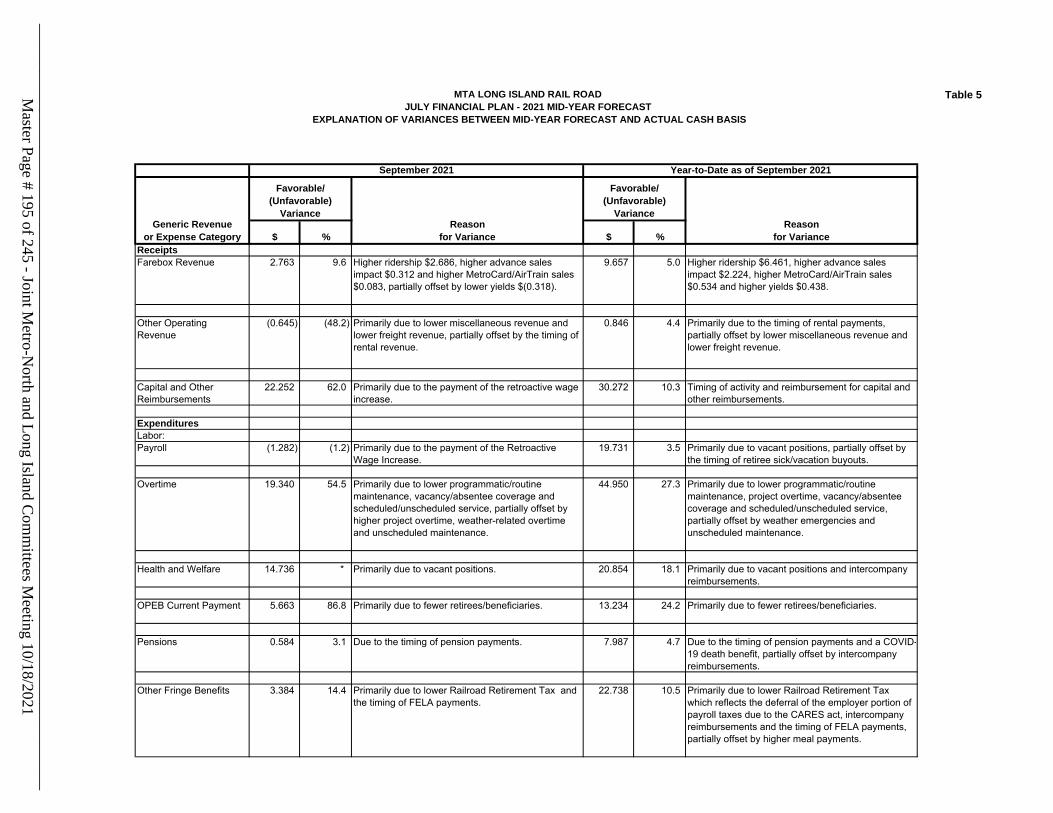
MTA LONG ISLAND RAIL ROADJULY FINANCIAL PLAN - 2021 MID-YEAR FORECAST
EXPLANATION OF VARIANCES BETWEEN MID-YEAR FORECAST AND ACTUAL CASH BASIS
Table 5
$ % $ %ReceiptsFarebox Revenue 2.763 9.6 Higher ridership $2.686, higher advance sales
impact $0.312 and higher MetroCard/AirTrain sales $0.083, partially offset by lower yields $(0.318).
9.657 5.0 Higher ridership $6.461, higher advance sales impact $2.224, higher MetroCard/AirTrain sales $0.534 and higher yields $0.438.
Other Operating Revenue
(0.645) (48.2) Primarily due to lower miscellaneous revenue and lower freight revenue, partially offset by the timing of rental revenue.
0.846 4.4 Primarily due to the timing of rental payments, partially offset by lower miscellaneous revenue and lower freight revenue.
Capital and Other Reimbursements
22.252 62.0 Primarily due to the payment of the retroactive wage increase.
30.272 10.3 Timing of activity and reimbursement for capital and other reimbursements.
ExpendituresLabor:Payroll (1.282) (1.2) Primarily due to the payment of the Retroactive
Wage Increase. 19.731 3.5 Primarily due to vacant positions, partially offset by
the timing of retiree sick/vacation buyouts.
Overtime 19.340 54.5 Primarily due to lower programmatic/routine maintenance, vacancy/absentee coverage and scheduled/unscheduled service, partially offset by higher project overtime, weather-related overtime and unscheduled maintenance.
44.950 27.3 Primarily due to lower programmatic/routine maintenance, project overtime, vacancy/absentee coverage and scheduled/unscheduled service, partially offset by weather emergencies and unscheduled maintenance.
Health and Welfare 14.736 * Primarily due to vacant positions. 20.854 18.1 Primarily due to vacant positions and intercompany reimbursements.
OPEB Current Payment 5.663 86.8 Primarily due to fewer retirees/beneficiaries. 13.234 24.2 Primarily due to fewer retirees/beneficiaries.
Pensions 0.584 3.1 Due to the timing of pension payments. 7.987 4.7 Due to the timing of pension payments and a COVID-19 death benefit, partially offset by intercompany reimbursements.
Other Fringe Benefits 3.384 14.4 Primarily due to lower Railroad Retirement Tax and the timing of FELA payments.
22.738 10.5 Primarily due to lower Railroad Retirement Tax which reflects the deferral of the employer portion of payroll taxes due to the CARES act, intercompany reimbursements and the timing of FELA payments, partially offset by higher meal payments.
Generic Revenueor Expense Category
Favorable/(Unfavorable)
VarianceReason
for Variance
Favorable/(Unfavorable)
VarianceReason
for Variance
September 2021 Year-to-Date as of September 2021
Master Page # 195 of 245 - Joint M
etro-North and Long Island C
omm
ittees Meeting 10/18/2021
________________________________________________________________________________
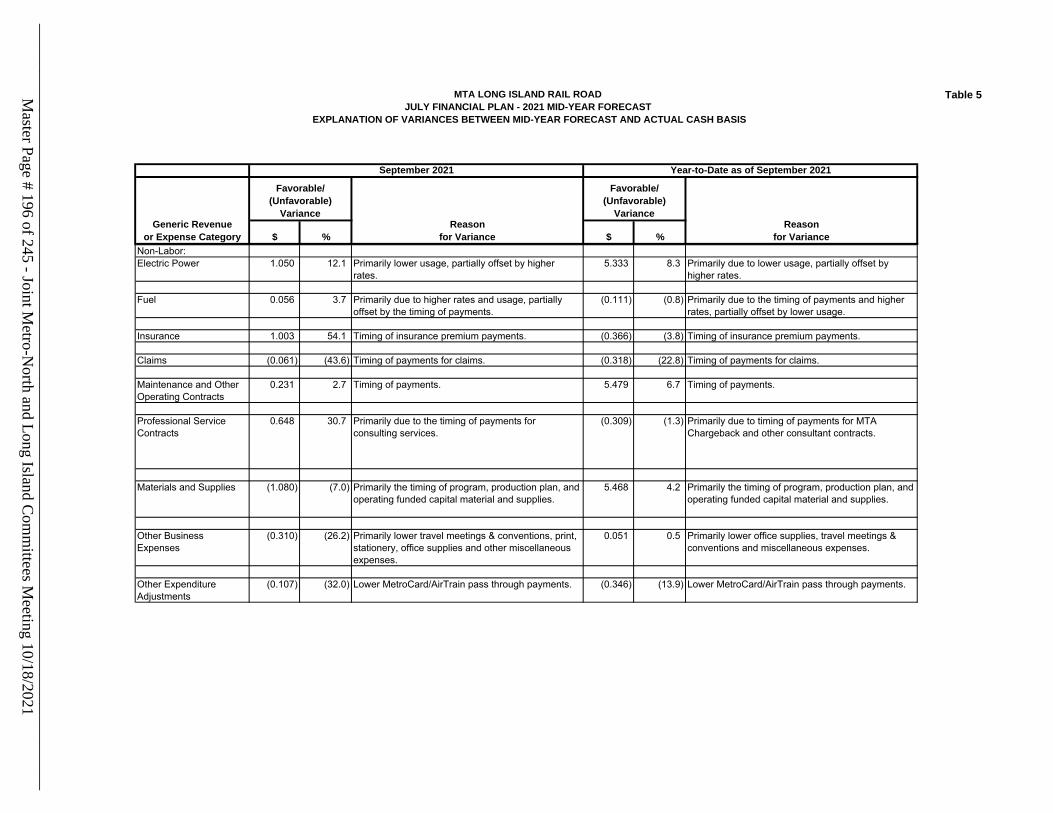
MTA LONG ISLAND RAIL ROADJULY FINANCIAL PLAN - 2021 MID-YEAR FORECAST
EXPLANATION OF VARIANCES BETWEEN MID-YEAR FORECAST AND ACTUAL CASH BASIS
Table 5
$ % $ %Generic Revenue
or Expense Category
Favorable/(Unfavorable)
VarianceReason
for Variance
Favorable/(Unfavorable)
VarianceReason
for Variance
September 2021 Year-to-Date as of September 2021
Non-Labor:Electric Power 1.050 12.1 Primarily lower usage, partially offset by higher
rates.5.333 8.3 Primarily due to lower usage, partially offset by
higher rates.
Fuel 0.056 3.7 Primarily due to higher rates and usage, partially offset by the timing of payments.
(0.111) (0.8) Primarily due to the timing of payments and higher rates, partially offset by lower usage.
Insurance 1.003 54.1 Timing of insurance premium payments. (0.366) (3.8) Timing of insurance premium payments.
Claims (0.061) (43.6) Timing of payments for claims. (0.318) (22.8) Timing of payments for claims.
Maintenance and Other Operating Contracts
0.231 2.7 Timing of payments. 5.479 6.7 Timing of payments.
Professional Service Contracts
0.648 30.7 Primarily due to the timing of payments for consulting services.
(0.309) (1.3) Primarily due to timing of payments for MTA Chargeback and other consultant contracts.
Materials and Supplies (1.080) (7.0) Primarily the timing of program, production plan, and
operating funded capital material and supplies. 5.468 4.2 Primarily the timing of program, production plan, and
operating funded capital material and supplies.
Other Business Expenses
(0.310) (26.2) Primarily lower travel meetings & conventions, print, stationery, office supplies and other miscellaneous expenses.
0.051 0.5 Primarily lower office supplies, travel meetings & conventions and miscellaneous expenses.
Other Expenditure Adjustments
(0.107) (32.0) Lower MetroCard/AirTrain pass through payments. (0.346) (13.9) Lower MetroCard/AirTrain pass through payments.
Master Page # 196 of 245 - Joint M
etro-North and Long Island C
omm
ittees Meeting 10/18/2021
________________________________________________________________________________
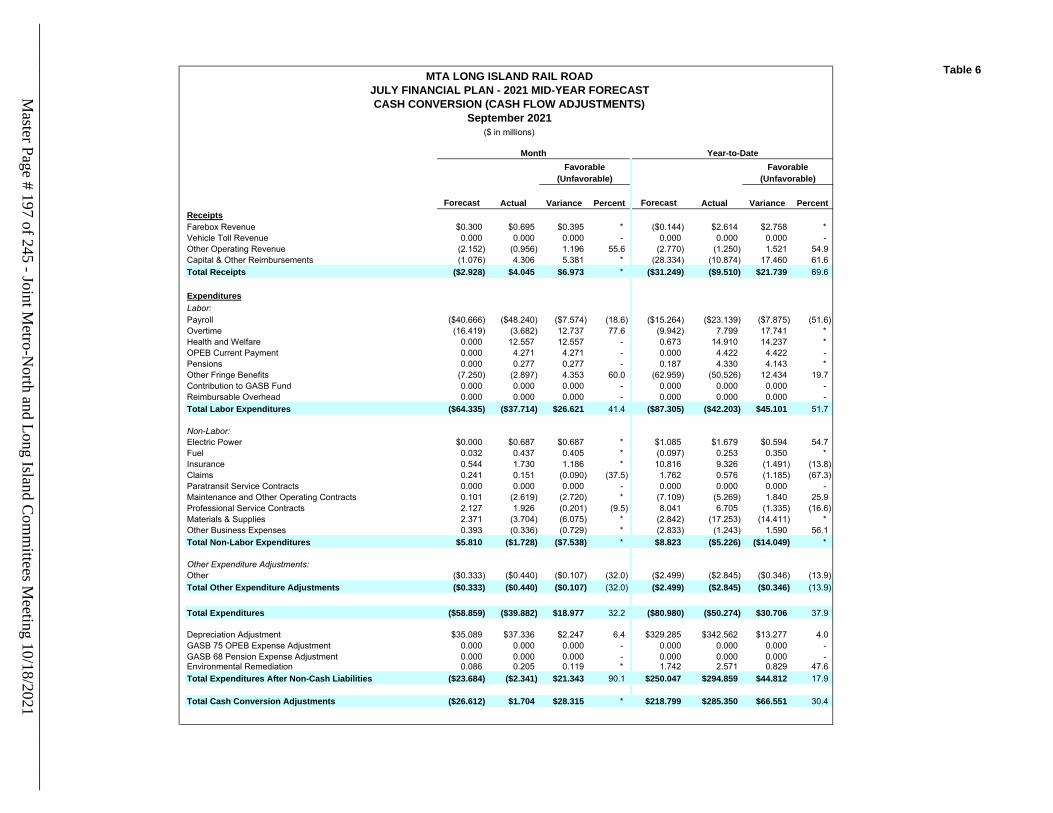
Table 6
Forecast Actual Variance Percent Forecast Actual Variance PercentReceiptsFarebox Revenue $0.300 $0.695 $0.395 * ($0.144) $2.614 $2.758 * Vehicle Toll Revenue 0.000 0.000 0.000 - 0.000 0.000 0.000 - Other Operating Revenue (2.152) (0.956) 1.196 55.6 (2.770) (1.250) 1.521 54.9Capital & Other Reimbursements (1.076) 4.306 5.381 * (28.334) (10.874) 17.460 61.6Total Receipts ($2.928) $4.045 $6.973 * ($31.249) ($9.510) $21.739 69.6
ExpendituresLabor:Payroll ($40.666) ($48.240) ($7.574) (18.6) ($15.264) ($23.139) ($7.875) (51.6)Overtime (16.419) (3.682) 12.737 77.6 (9.942) 7.799 17.741 * Health and Welfare 0.000 12.557 12.557 - 0.673 14.910 14.237 * OPEB Current Payment 0.000 4.271 4.271 - 0.000 4.422 4.422 - Pensions 0.000 0.277 0.277 - 0.187 4.330 4.143 * Other Fringe Benefits (7.250) (2.897) 4.353 60.0 (62.959) (50.526) 12.434 19.7Contribution to GASB Fund 0.000 0.000 0.000 - 0.000 0.000 0.000 - Reimbursable Overhead 0.000 0.000 0.000 - 0.000 0.000 0.000 - Total Labor Expenditures ($64.335) ($37.714) $26.621 41.4 ($87.305) ($42.203) $45.101 51.7
Non-Labor:Electric Power $0.000 $0.687 $0.687 * $1.085 $1.679 $0.594 54.7Fuel 0.032 0.437 0.405 * (0.097) 0.253 0.350 * Insurance 0.544 1.730 1.186 * 10.816 9.326 (1.491) (13.8)Claims 0.241 0.151 (0.090) (37.5) 1.762 0.576 (1.185) (67.3)Paratransit Service Contracts 0.000 0.000 0.000 - 0.000 0.000 0.000 - Maintenance and Other Operating Contracts 0.101 (2.619) (2.720) * (7.109) (5.269) 1.840 25.9Professional Service Contracts 2.127 1.926 (0.201) (9.5) 8.041 6.705 (1.335) (16.6)Materials & Supplies 2.371 (3.704) (6.075) * (2.842) (17.253) (14.411) * Other Business Expenses 0.393 (0.336) (0.729) * (2.833) (1.243) 1.590 56.1Total Non-Labor Expenditures $5.810 ($1.728) ($7.538) * $8.823 ($5.226) ($14.049) *
Other Expenditure Adjustments:Other ($0.333) ($0.440) ($0.107) (32.0) ($2.499) ($2.845) ($0.346) (13.9)Total Other Expenditure Adjustments ($0.333) ($0.440) ($0.107) (32.0) ($2.499) ($2.845) ($0.346) (13.9)
Total Expenditures ($58.859) ($39.882) $18.977 32.2 ($80.980) ($50.274) $30.706 37.9
Depreciation Adjustment $35.089 $37.336 $2.247 6.4 $329.285 $342.562 $13.277 4.0GASB 75 OPEB Expense Adjustment 0.000 0.000 0.000 - 0.000 0.000 0.000 - GASB 68 Pension Expense Adjustment 0.000 0.000 0.000 - 0.000 0.000 0.000 - Environmental Remediation 0.086 0.205 0.119 * 1.742 2.571 0.829 47.6Total Expenditures After Non-Cash Liabilities ($23.684) ($2.341) $21.343 90.1 $250.047 $294.859 $44.812 17.9
Total Cash Conversion Adjustments ($26.612) $1.704 $28.315 * $218.799 $285.350 $66.551 30.4
MTA LONG ISLAND RAIL ROADJULY FINANCIAL PLAN - 2021 MID-YEAR FORECASTCASH CONVERSION (CASH FLOW ADJUSTMENTS)
September 2021($ in millions)
Month Year-to-DateFavorable Favorable
(Unfavorable) (Unfavorable)
Master Page # 197 of 245 - Joint M
etro-North and Long Island C
omm
ittees Meeting 10/18/2021
________________________________________________________________________________
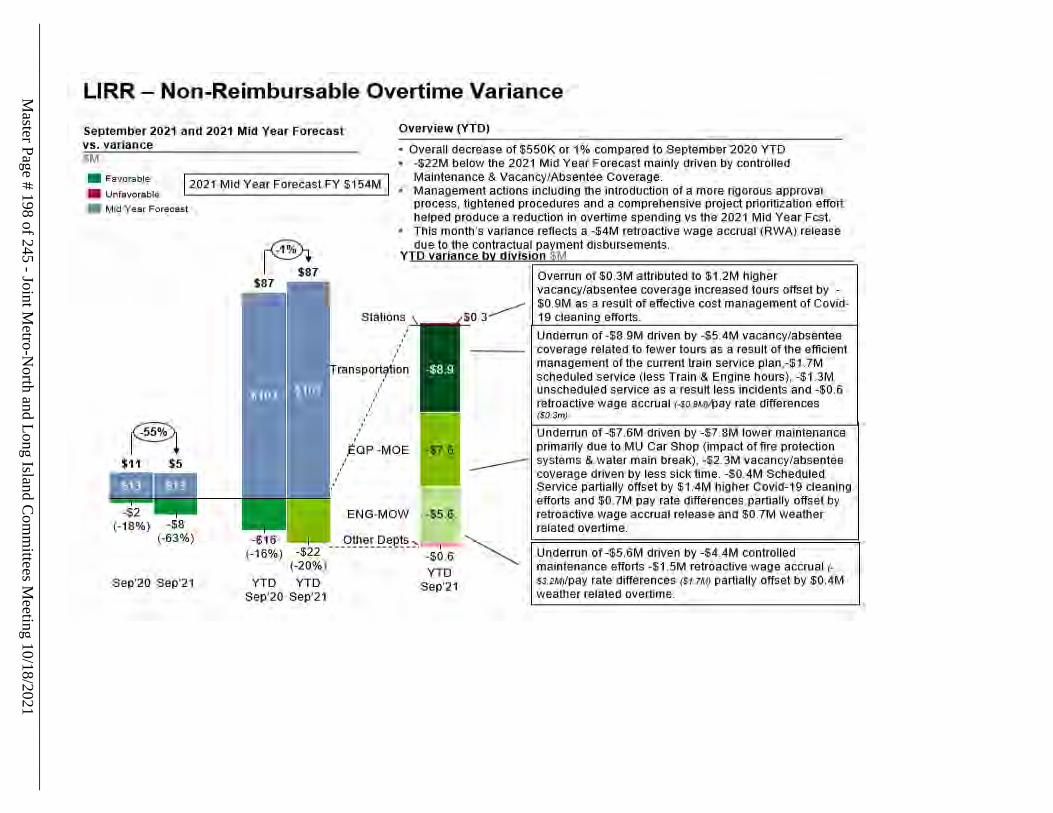
Master Page # 198 of 245 - Joint M
etro-North and Long Island C
omm
ittees Meeting 10/18/2021
________________________________________________________________________________
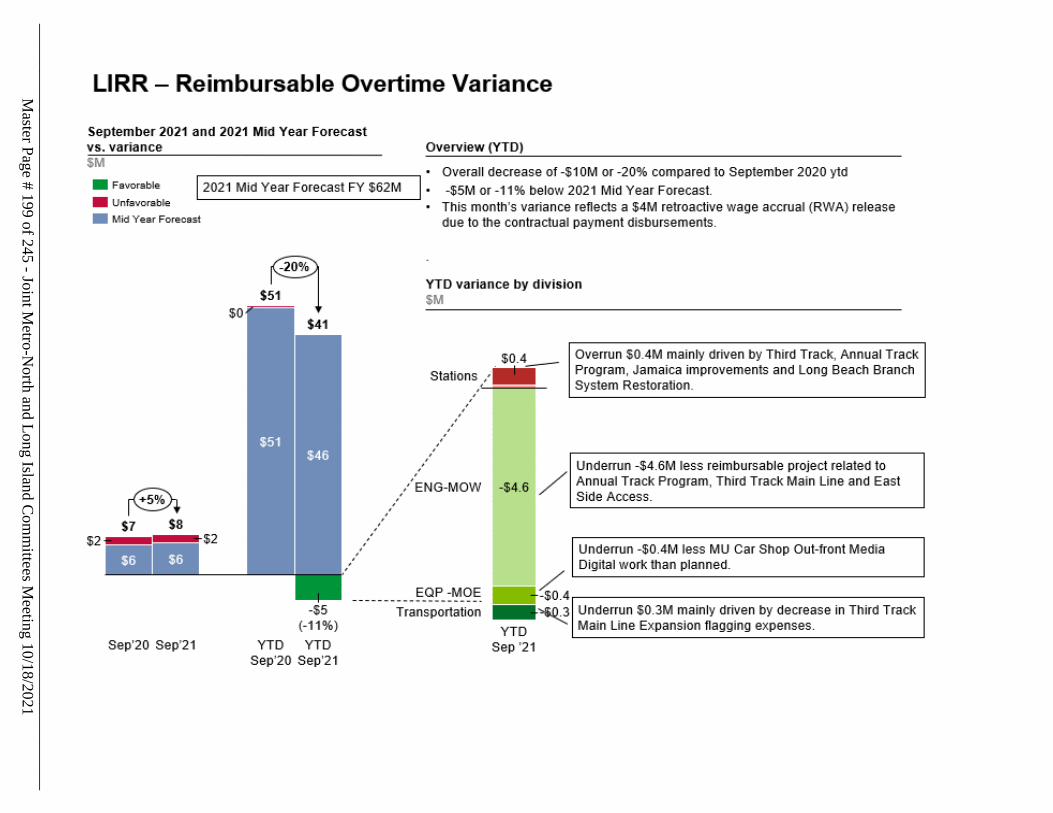
Master Page # 199 of 245 - Joint M
etro-North and Long Island C
omm
ittees Meeting 10/18/2021
________________________________________________________________________________
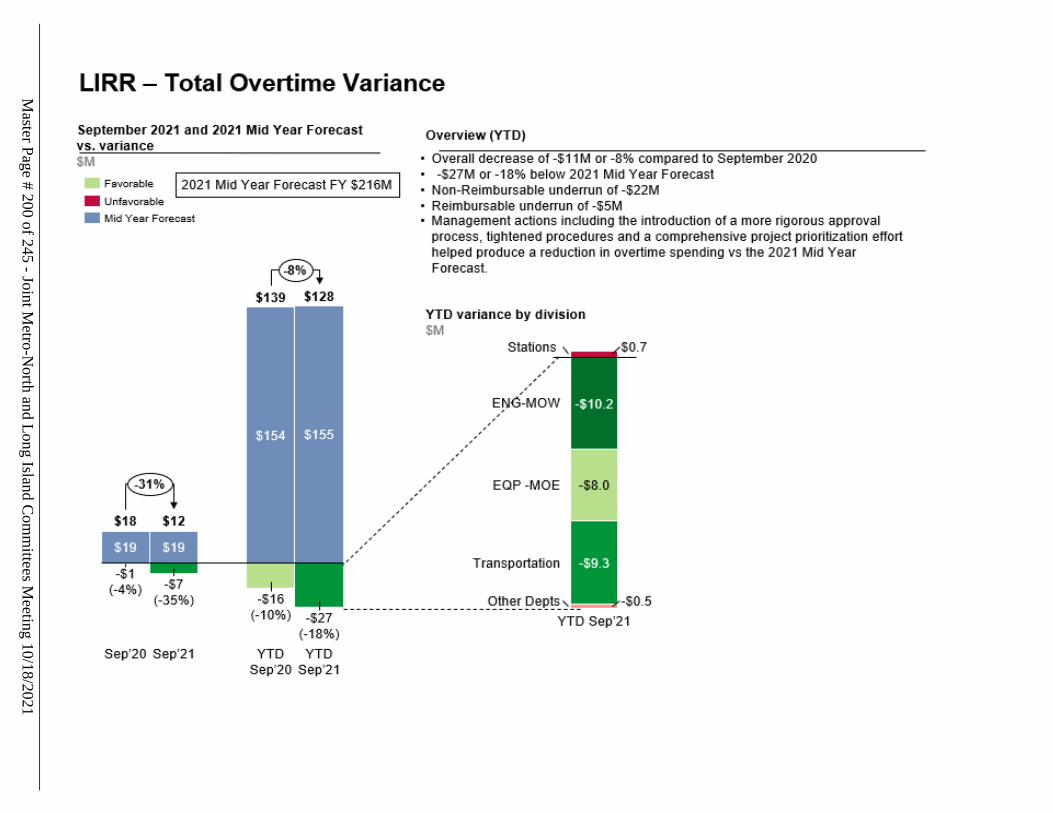
Master Page # 200 of 245 - Joint M
etro-North and Long Island C
omm
ittees Meeting 10/18/2021
________________________________________________________________________________

Favorable/(Unfavorable)
Forecast Actual VarianceAdministrationExecutive VP 0 - 0Enterprise Asset Management 6 5 1Sr. Vice President - Engineering 2 1 1Labor Relations 14 11 3Procurement & Logistics (excl. Stores) 56 45 11Human Resources 35 34 1Sr VP Administration 2 2 0Strategic Investments 12 11 1President 8 5 3VP & CFO 2 2 0Controller 42 39 3Management & Budget 16 13 3BPM, Controls & Compliance 4 4 0Market Dev. & Public Affairs 65 64 1Gen. Counsel & Secretary 29 25 4Diversity Management 3 1 2Security 15 12 3System Safety 46 42 4Training 68 63 5Service Planning 28 26 2Rolling Stock Programs 17 9 8Sr Vice President - Operations 4 2 2
Total Administration 474 416 58
OperationsTransportation Services - Train Operations 2,345 2,251 94Customer Services 393 328 65
Total Operations 2,738 2,579 159
MaintenanceEngineering 1,980 1,901 79 Equipment 2,113 2,029 84Procurement (Stores) 95 93 2
Total Maintenance 4,188 4,023 165
Engineering/CapitalDepartment of Program Management 144 112 32Special Projects/East Side Access 59 46 13Positive Train Control 14 13 1
Total Engineering/Capital 217 171 46
Baseline Total Positions 7,616 7,189 427
Non-Reimbursable 6,270 6,022 248Reimbursable 1,346 1,167 179
Total Full-Time 7,616 7,189 427 Total Full-Time-Equivalents
Note: Totals may not add due to rounding
MTA LONG ISLAND RAIL ROADJULY FINANCIAL PLAN - 2021 MID-YEAR FORECAST
END-of-MONTH SEPTEMBER 2021
TOTAL POSITIONS BY FUNCTION AND DEPARTMENTNON-REIMBURSABLE/REIMBURSABLE AND FULL-TIME/FULL-TIME EQUIVALENTSM
aster Page # 201 of 245 - Joint Metro-N
orth and Long Island Com
mittees M
eeting 10/18/2021________________________________________________________________________________
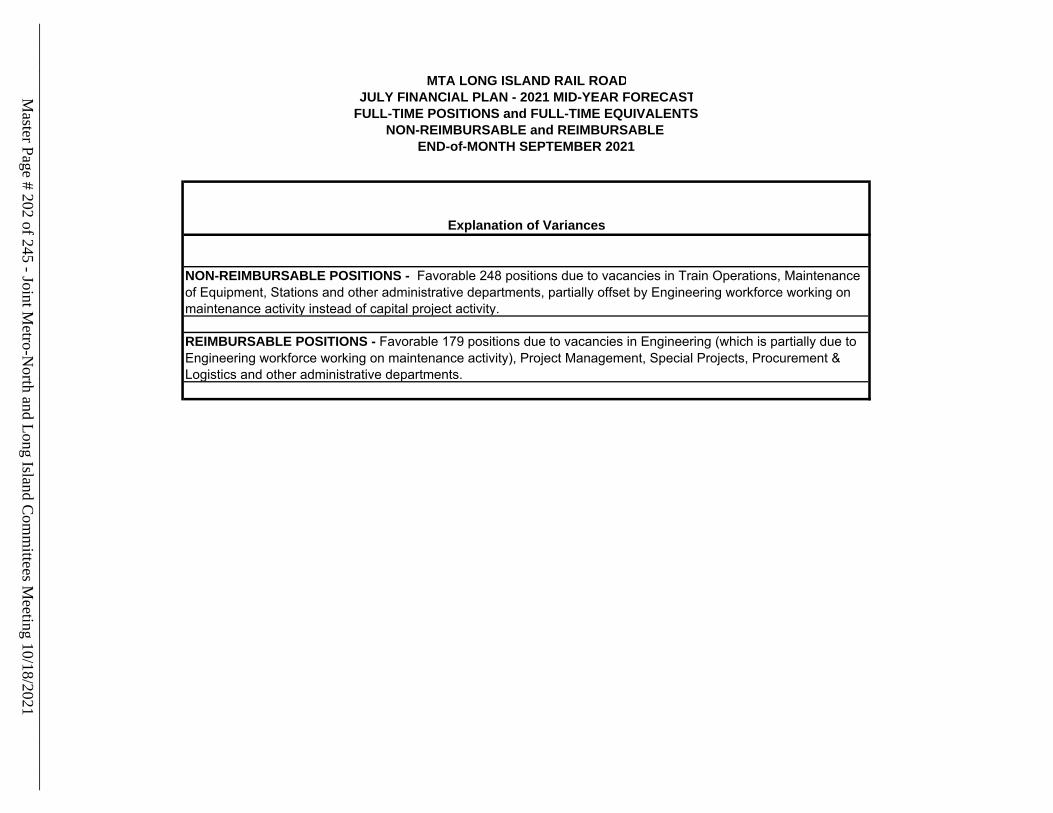
MTA LONG ISLAND RAIL ROADJULY FINANCIAL PLAN - 2021 MID-YEAR FORECAST
FULL-TIME POSITIONS and FULL-TIME EQUIVALENTSNON-REIMBURSABLE and REIMBURSABLE
END-of-MONTH SEPTEMBER 2021
Explanation of Variances
NON-REIMBURSABLE POSITIONS - Favorable 248 positions due to vacancies in Train Operations, Maintenance of Equipment, Stations and other administrative departments, partially offset by Engineering workforce working on maintenance activity instead of capital project activity.
REIMBURSABLE POSITIONS - Favorable 179 positions due to vacancies in Engineering (which is partially due to Engineering workforce working on maintenance activity), Project Management, Special Projects, Procurement & Logistics and other administrative departments.
Master Page # 202 of 245 - Joint M
etro-North and Long Island C
omm
ittees Meeting 10/18/2021
________________________________________________________________________________
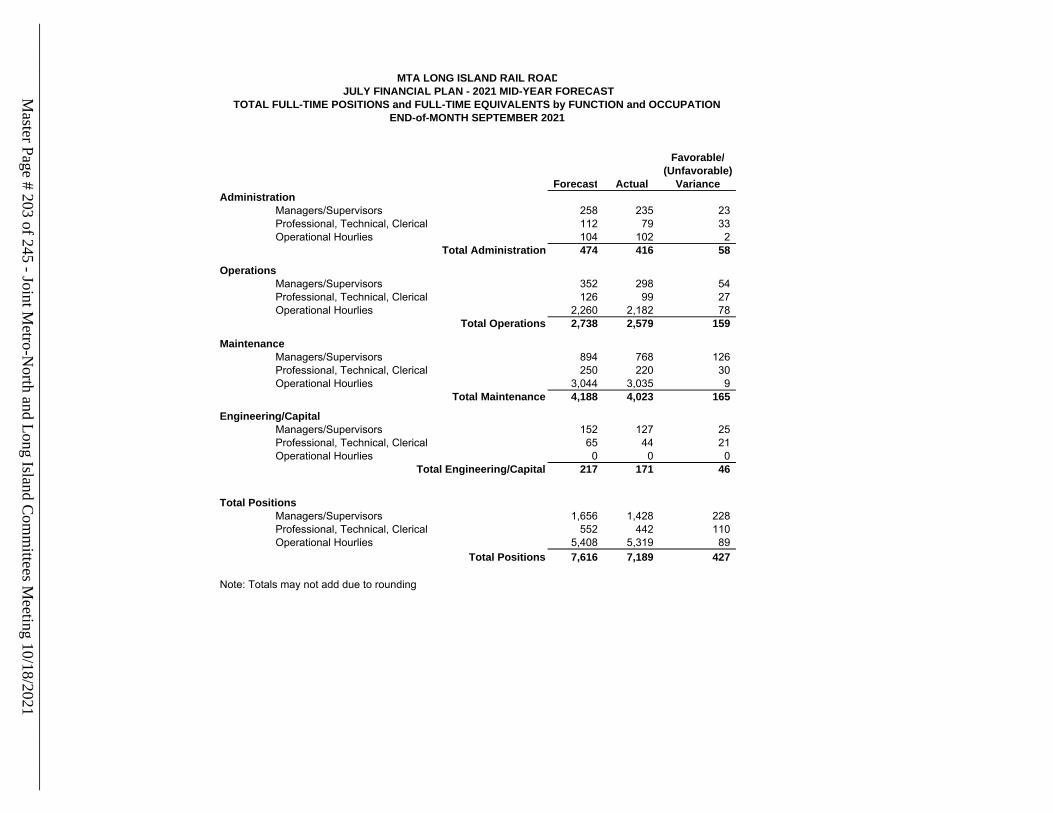
Favorable/(Unfavorable)
Forecast Actual VarianceAdministration
Managers/Supervisors 258 235 23 Professional, Technical, Clerical 112 79 33 Operational Hourlies 104 102 2
Total Administration 474 416 58
Operations Managers/Supervisors 352 298 54 Professional, Technical, Clerical 126 99 27 Operational Hourlies 2,260 2,182 78
Total Operations 2,738 2,579 159
Maintenance Managers/Supervisors 894 768 126 Professional, Technical, Clerical 250 220 30 Operational Hourlies 3,044 3,035 9
Total Maintenance 4,188 4,023 165
Engineering/Capital Managers/Supervisors 152 127 25 Professional, Technical, Clerical 65 44 21 Operational Hourlies 0 0 0
Total Engineering/Capital 217 171 46
Total Positions Managers/Supervisors 1,656 1,428 228 Professional, Technical, Clerical 552 442 110 Operational Hourlies 5,408 5,319 89
Total Positions 7,616 7,189 427
Note: Totals may not add due to rounding
MTA LONG ISLAND RAIL ROADJULY FINANCIAL PLAN - 2021 MID-YEAR FORECAST
TOTAL FULL-TIME POSITIONS and FULL-TIME EQUIVALENTS by FUNCTION and OCCUPATION END-of-MONTH SEPTEMBER 2021
Master Page # 203 of 245 - Joint M
etro-North and Long Island C
omm
ittees Meeting 10/18/2021
________________________________________________________________________________

MTA LONG ISLAND RAIL ROADJULY FINANCIAL PLAN - 2021 MID YEAR
RIDERSHIP(In Millions)
Actual Adjusted* Actual Adjusted*Mid Year 2021 2020 2021 2020
RIDERSHIP # % # % # % # %Monthly 1.719 0.858 0.594 (0.860) -50.1% 0.264 44.4% 9.330 6.081 11.278 (3.249) -34.8% (5.197) -46.1%
Weekly 0.094 0.062 0.050 (0.032) -33.9% 0.012 23.2% 0.591 0.423 0.695 (0.168) -28.5% (0.272) -39.1%
Total Commutation 1.812 0.920 0.645 (0.892) -49.2% 0.276 42.8% 9.921 6.504 11.973 (3.417) -34.4% (5.469) -45.7%
One-Way Full Fare 0.374 0.246 0.174 (0.128) -34.3% 0.072 41.2% 2.190 1.651 2.579 (0.540) -24.6% (0.928) -36.0%
One-Way Off-Peak 0.701 1.458 0.749 0.757 108.0% 0.710 94.8% 6.358 9.187 5.875 2.828 44.5% 3.312 56.4%
All Other 0.430 1.006 0.475 0.576 134.0% 0.532 112.0% 4.230 6.121 3.611 1.891 44.7% 2.510 69.5%
Total Non-Commutation 1.505 2.710 1.397 1.205 80.1% 1.313 94.0% 12.778 16.958 12.065 4.180 32.7% 4.893 40.6%Total 3.317 3.630 2.042 0.313 9.4% 1.589 77.8% 22.699 23.462 24.038 0.763 3.4% (0.575) -2.4%
*Prior year adjusted to reflect current year calendar.Please note: For monthly reporting purposes only, the 12-month allocation reflects the utilization impact of an adjustment to farebox and toll revenue projections captured in Volume 1 of the 2020 July Financial Plan.
Mid Year 2020
SEPTEMBER 2021Month Variance
Adjusted*Mid Year 2020
SEPTEMBER YEAR TO DATE 2021YTD Variance
Adjusted*Mid Year
Master Page # 204 of 245 - Joint M
etro-North and Long Island C
omm
ittees Meeting 10/18/2021
________________________________________________________________________________

MONTH VARIANCEActual Forecast Actual vs. vs.2021 2021 2020 Forecast 2020
Farebox Operating RatioStandard (1)(1) 28.8% 19.0% 14.4% 9.8% 14.4%
Adjusted (2) 33.3% 23.1% 18.0% 10.2% 15.3%
Cost Per PassengerStandard (1)(1) $29.50 $45.15 $58.41 $15.65 $28.91Adjusted (2)(2) $26.85 $41.75 $52.96 $14.90 $26.11
Passenger Revenue/Passenger (3) $8.49 $8.58 $8.41 ($0.09) $0.08
YEAR-TO-DATE VARIANCEActual Forecast Actual vs. vs.2021 2021 2020 Forecast 2020
Farebox Operating RatioStandard (1)(1) 18.2% 15.7% 20.6% 2.5% -2.4%
Adjusted (2) 21.9% 18.9% 24.8% 3.0% -2.9%
Cost Per PassengerStandard (1)(1) $46.75 $54.11 $44.54 $7.36 ($2.21)Adjusted (2)(2) $42.87 $49.78 $41.02 $6.91 ($1.85)
Passenger Revenue/Passenger (3) $8.49 $8.47 $9.18 $0.02 ($0.69)
(3) Passenger Revenue/Passenger includes Hampton Seat Reservations.
MTA LONG ISLAND RAIL ROADJULY FINANCIAL PLAN - 2021 MID-YEAR FORECAST
MONTHLY PERFORMANCE INDICATORSSeptember 2021
(1) The Standard Farebox Operating Ratio and Cost Per Passenger indicators reflect MTA-wide adopted calculations that exclude non-cash liability adjustments: Depreciation, Other Post Employment Benefits and Environmental Remediation (GASB-49).(2) Adjusted Fare Box Operating Ratio and Cost Per Passenger indicators have been adjusted for comparability between the Long Island Rail Road and Metro-North Railroad and are being presented only at the railroad operating committees. These adjustments are not being used MTA-wide. Adjustments have been made to reflect all operating revenue and significant financial impacts that are outside management's control. These adjustments include: Inclusion of Other Operating Revenue, Removal of OPEB Current Payment expenses for retirees, and Removal of the UAAL associated with the LIRR’s closed pension plan.
Master Page # 205 of 245 - Joint M
etro-North and Long Island C
omm
ittees Meeting 10/18/2021
________________________________________________________________________________

Financial Report Highlights
August 2021
Francis Landers Financial Liaison Long Island Rail Road MTA Office of the Chief Financial Officer
Master Page # 206 of 245 - Joint Metro-North and Long Island Committees Meeting 10/18/2021________________________________________________________________________________
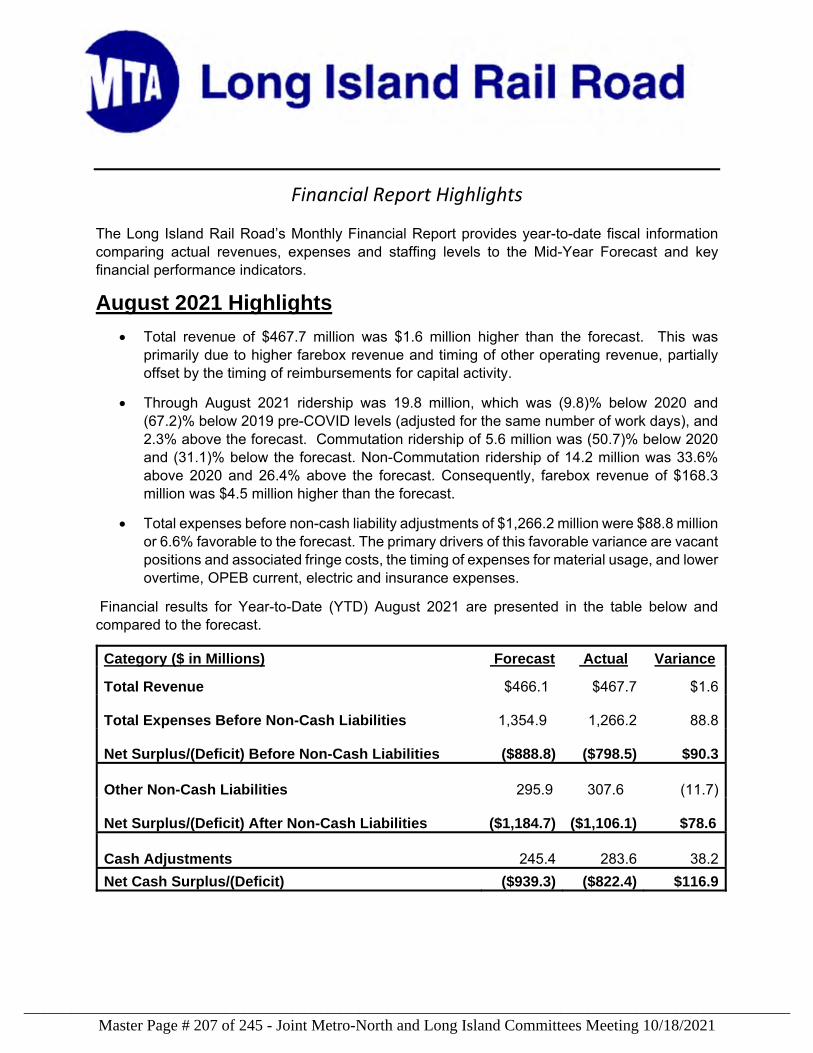
Financial Report Highlights The Long Island Rail Road’s Monthly Financial Report provides year-to-date fiscal information comparing actual revenues, expenses and staffing levels to the Mid-Year Forecast and key financial performance indicators.
August 2021 Highlights
Total revenue of $467.7 million was $1.6 million higher than the forecast. This was primarily due to higher farebox revenue and timing of other operating revenue, partially offset by the timing of reimbursements for capital activity.
Through August 2021 ridership was 19.8 million, which was (9.8)% below 2020 and (67.2)% below 2019 pre-COVID levels (adjusted for the same number of work days), and 2.3% above the forecast. Commutation ridership of 5.6 million was (50.7)% below 2020 and (31.1)% below the forecast. Non-Commutation ridership of 14.2 million was 33.6% above 2020 and 26.4% above the forecast. Consequently, farebox revenue of $168.3 million was $4.5 million higher than the forecast.
Total expenses before non-cash liability adjustments of $1,266.2 million were $88.8 million or 6.6% favorable to the forecast. The primary drivers of this favorable variance are vacant positions and associated fringe costs, the timing of expenses for material usage, and lower overtime, OPEB current, electric and insurance expenses.
Financial results for Year-to-Date (YTD) August 2021 are presented in the table below and compared to the forecast.
Category ($ in Millions) Forecast Actual Variance
Total Revenue $466.1 $467.7 $1.6
Total Expenses Before Non-Cash Liabilities 1,354.9
1,266.2 88.8 Net Surplus/(Deficit) Before Non-Cash Liabilities ($888.8) ($798.5) $90.3 Other Non-Cash Liabilities 295.9 307.6 (11.7) Net Surplus/(Deficit) After Non-Cash Liabilities
($1,184.7) ($1,106.1) $78.6
Cash Adjustments 245.4 283.6 38.2 Net Cash Surplus/(Deficit) ($939.3) ($822.4) $116.9
Master Page # 207 of 245 - Joint Metro-North and Long Island Committees Meeting 10/18/2021________________________________________________________________________________
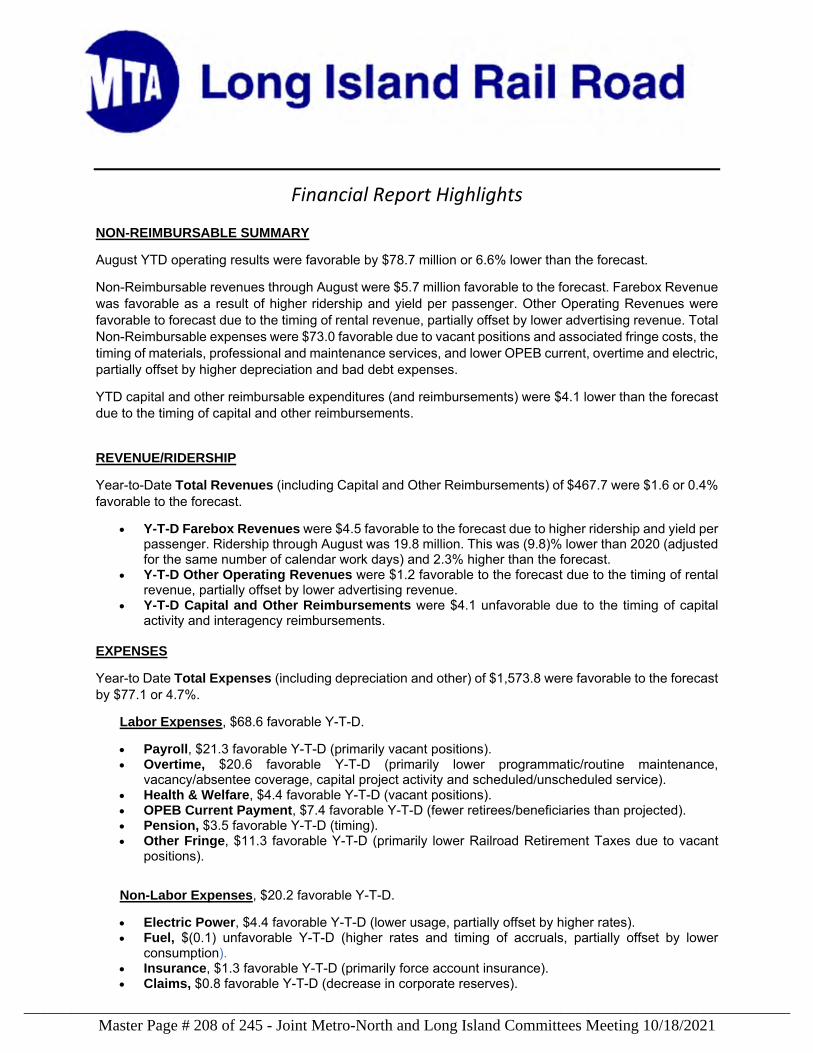
Financial Report Highlights NON-REIMBURSABLE SUMMARY
August YTD operating results were favorable by $78.7 million or 6.6% lower than the forecast.
Non-Reimbursable revenues through August were $5.7 million favorable to the forecast. Farebox Revenue was favorable as a result of higher ridership and yield per passenger. Other Operating Revenues were favorable to forecast due to the timing of rental revenue, partially offset by lower advertising revenue. Total Non-Reimbursable expenses were $73.0 favorable due to vacant positions and associated fringe costs, the timing of materials, professional and maintenance services, and lower OPEB current, overtime and electric, partially offset by higher depreciation and bad debt expenses.
YTD capital and other reimbursable expenditures (and reimbursements) were $4.1 lower than the forecast due to the timing of capital and other reimbursements.
REVENUE/RIDERSHIP
Year-to-Date Total Revenues (including Capital and Other Reimbursements) of $467.7 were $1.6 or 0.4% favorable to the forecast.
Y-T-D Farebox Revenues were $4.5 favorable to the forecast due to higher ridership and yield per passenger. Ridership through August was 19.8 million. This was (9.8)% lower than 2020 (adjusted for the same number of calendar work days) and 2.3% higher than the forecast.
Y-T-D Other Operating Revenues were $1.2 favorable to the forecast due to the timing of rental revenue, partially offset by lower advertising revenue.
Y-T-D Capital and Other Reimbursements were $4.1 unfavorable due to the timing of capital activity and interagency reimbursements.
EXPENSES
Year-to Date Total Expenses (including depreciation and other) of $1,573.8 were favorable to the forecast by $77.1 or 4.7%.
Labor Expenses, $68.6 favorable Y-T-D.
Payroll, $21.3 favorable Y-T-D (primarily vacant positions). Overtime, $20.6 favorable Y-T-D (primarily lower programmatic/routine maintenance,
vacancy/absentee coverage, capital project activity and scheduled/unscheduled service). Health & Welfare, $4.4 favorable Y-T-D (vacant positions). OPEB Current Payment, $7.4 favorable Y-T-D (fewer retirees/beneficiaries than projected). Pension, $3.5 favorable Y-T-D (timing). Other Fringe, $11.3 favorable Y-T-D (primarily lower Railroad Retirement Taxes due to vacant
positions).
Non-Labor Expenses, $20.2 favorable Y-T-D.
Electric Power, $4.4 favorable Y-T-D (lower usage, partially offset by higher rates). Fuel, $(0.1) unfavorable Y-T-D (higher rates and timing of accruals, partially offset by lower
consumption). Insurance, $1.3 favorable Y-T-D (primarily force account insurance). Claims, $0.8 favorable Y-T-D (decrease in corporate reserves).
Master Page # 208 of 245 - Joint Metro-North and Long Island Committees Meeting 10/18/2021________________________________________________________________________________
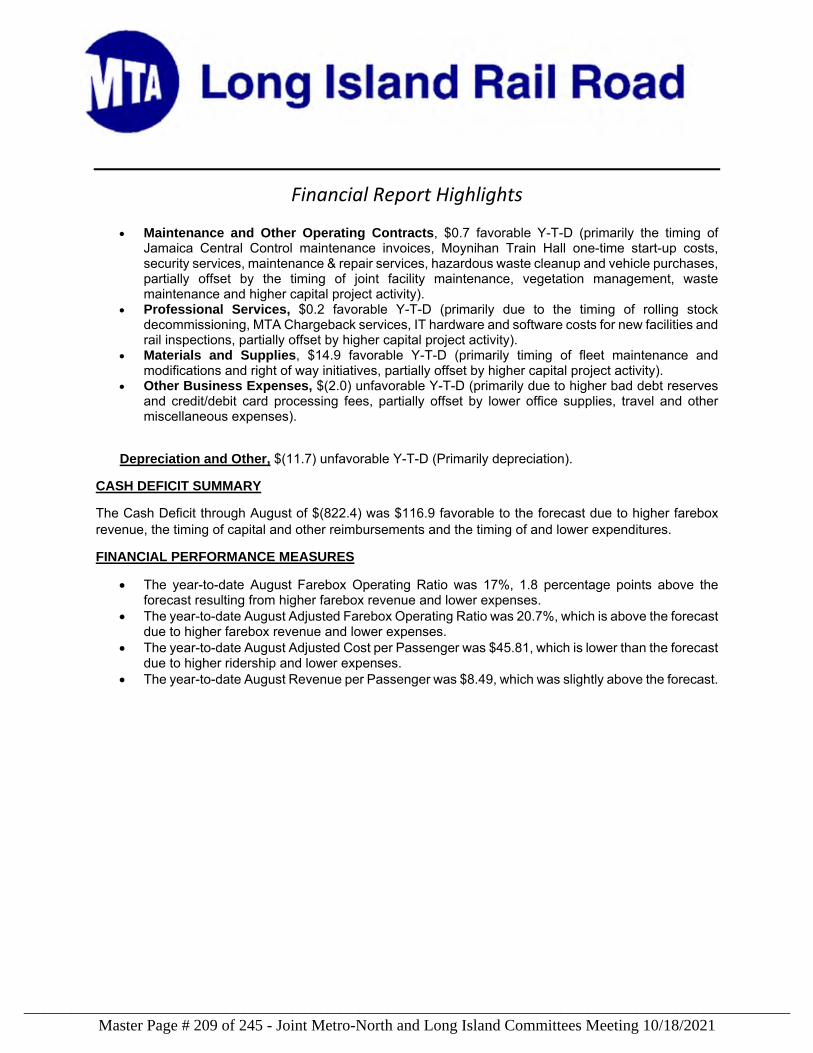
Financial Report Highlights
Maintenance and Other Operating Contracts, $0.7 favorable Y-T-D (primarily the timing of Jamaica Central Control maintenance invoices, Moynihan Train Hall one-time start-up costs, security services, maintenance & repair services, hazardous waste cleanup and vehicle purchases, partially offset by the timing of joint facility maintenance, vegetation management, waste maintenance and higher capital project activity).
Professional Services, $0.2 favorable Y-T-D (primarily due to the timing of rolling stock decommissioning, MTA Chargeback services, IT hardware and software costs for new facilities and rail inspections, partially offset by higher capital project activity).
Materials and Supplies, $14.9 favorable Y-T-D (primarily timing of fleet maintenance and modifications and right of way initiatives, partially offset by higher capital project activity).
Other Business Expenses, $(2.0) unfavorable Y-T-D (primarily due to higher bad debt reserves and credit/debit card processing fees, partially offset by lower office supplies, travel and other miscellaneous expenses).
Depreciation and Other, $(11.7) unfavorable Y-T-D (Primarily depreciation).
CASH DEFICIT SUMMARY
The Cash Deficit through August of $(822.4) was $116.9 favorable to the forecast due to higher farebox revenue, the timing of capital and other reimbursements and the timing of and lower expenditures.
FINANCIAL PERFORMANCE MEASURES
The year-to-date August Farebox Operating Ratio was 17%, 1.8 percentage points above the forecast resulting from higher farebox revenue and lower expenses.
The year-to-date August Adjusted Farebox Operating Ratio was 20.7%, which is above the forecast due to higher farebox revenue and lower expenses.
The year-to-date August Adjusted Cost per Passenger was $45.81, which is lower than the forecast due to higher ridership and lower expenses.
The year-to-date August Revenue per Passenger was $8.49, which was slightly above the forecast.
Master Page # 209 of 245 - Joint Metro-North and Long Island Committees Meeting 10/18/2021________________________________________________________________________________
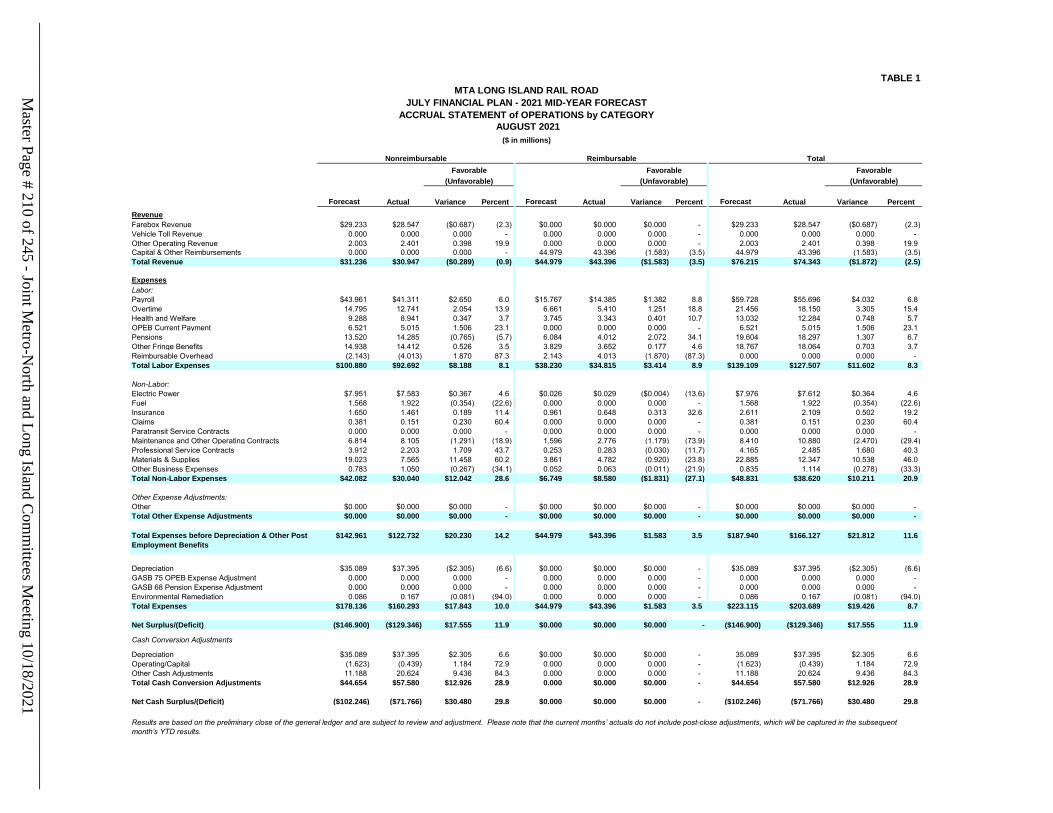
TABLE 1
Need to update Actuals
Forecast Actual Variance Percent Forecast Actual Variance Percent Forecast Actual Variance PercentRevenueFarebox Revenue $29.233 $28.547 ($0.687) (2.3) $0.000 $0.000 $0.000 - $29.233 $28.547 ($0.687) (2.3)Vehicle Toll Revenue 0.000 0.000 0.000 - 0.000 0.000 0.000 - 0.000 0.000 0.000 - Other Operating Revenue 2.003 2.401 0.398 19.9 0.000 0.000 0.000 - 2.003 2.401 0.398 19.9Capital & Other Reimbursements 0.000 0.000 0.000 - 44.979 43.396 (1.583) (3.5) 44.979 43.396 (1.583) (3.5)Total Revenue $31.236 $30.947 ($0.289) (0.9) $44.979 $43.396 ($1.583) (3.5) $76.215 $74.343 ($1.872) (2.5)
ExpensesLabor:Payroll $43.961 $41.311 $2.650 6.0 $15.767 $14.385 $1.382 8.8 $59.728 $55.696 $4.032 6.8Overtime 14.795 12.741 2.054 13.9 6.661 5.410 1.251 18.8 21.456 18.150 3.305 15.4Health and Welfare 9.288 8.941 0.347 3.7 3.745 3.343 0.401 10.7 13.032 12.284 0.748 5.7OPEB Current Payment 6.521 5.015 1.506 23.1 0.000 0.000 0.000 - 6.521 5.015 1.506 23.1Pensions 13.520 14.285 (0.765) (5.7) 6.084 4.012 2.072 34.1 19.604 18.297 1.307 6.7Other Fringe Benefits 14.938 14.412 0.526 3.5 3.829 3.652 0.177 4.6 18.767 18.064 0.703 3.7Reimbursable Overhead (2.143) (4.013) 1.870 87.3 2.143 4.013 (1.870) (87.3) 0.000 0.000 0.000 - Total Labor Expenses $100.880 $92.692 $8.188 8.1 $38.230 $34.815 $3.414 8.9 $139.109 $127.507 $11.602 8.3
Non-Labor:Electric Power $7.951 $7.583 $0.367 4.6 $0.026 $0.029 ($0.004) (13.6) $7.976 $7.612 $0.364 4.6Fuel 1.568 1.922 (0.354) (22.6) 0.000 0.000 0.000 - 1.568 1.922 (0.354) (22.6)Insurance 1.650 1.461 0.189 11.4 0.961 0.648 0.313 32.6 2.611 2.109 0.502 19.2Claims 0.381 0.151 0.230 60.4 0.000 0.000 0.000 - 0.381 0.151 0.230 60.4Paratransit Service Contracts 0.000 0.000 0.000 - 0.000 0.000 0.000 - 0.000 0.000 0.000 - Maintenance and Other Operating Contracts 6.814 8.105 (1.291) (18.9) 1.596 2.776 (1.179) (73.9) 8.410 10.880 (2.470) (29.4)Professional Service Contracts 3.912 2.203 1.709 43.7 0.253 0.283 (0.030) (11.7) 4.165 2.485 1.680 40.3Materials & Supplies 19.023 7.565 11.458 60.2 3.861 4.782 (0.920) (23.8) 22.885 12.347 10.538 46.0Other Business Expenses 0.783 1.050 (0.267) (34.1) 0.052 0.063 (0.011) (21.9) 0.835 1.114 (0.278) (33.3)Total Non-Labor Expenses $42.082 $30.040 $12.042 28.6 $6.749 $8.580 ($1.831) (27.1) $48.831 $38.620 $10.211 20.9
Other Expense Adjustments:Other $0.000 $0.000 $0.000 - $0.000 $0.000 $0.000 - $0.000 $0.000 $0.000 - Total Other Expense Adjustments $0.000 $0.000 $0.000 - $0.000 $0.000 $0.000 - $0.000 $0.000 $0.000 -
Total Expenses before Depreciation & Other Post Employment Benefits
$142.961 $122.732 $20.230 14.2 $44.979 $43.396 $1.583 3.5 $187.940 $166.127 $21.812 11.6
Depreciation $35.089 $37.395 ($2.305) (6.6) $0.000 $0.000 $0.000 - $35.089 $37.395 ($2.305) (6.6)GASB 75 OPEB Expense Adjustment 0.000 0.000 0.000 - 0.000 0.000 0.000 - 0.000 0.000 0.000 - GASB 68 Pension Expense Adjustment 0.000 0.000 0.000 - 0.000 0.000 0.000 - 0.000 0.000 0.000 - Environmental Remediation 0.086 0.167 (0.081) (94.0) 0.000 0.000 0.000 - 0.086 0.167 (0.081) (94.0)Total Expenses $178.136 $160.293 $17.843 10.0 $44.979 $43.396 $1.583 3.5 $223.115 $203.689 $19.426 8.7
Net Surplus/(Deficit) ($146.900) ($129.346) $17.555 11.9 $0.000 $0.000 $0.000 - ($146.900) ($129.346) $17.555 11.9
Cash Conversion Adjustments
Depreciation $35.089 $37.395 $2.305 6.6 $0.000 $0.000 $0.000 - 35.089 $37.395 $2.305 6.6Operating/Capital (1.623) (0.439) 1.184 72.9 0.000 0.000 0.000 - (1.623) (0.439) 1.184 72.9Other Cash Adjustments 11.188 20.624 9.436 84.3 0.000 0.000 0.000 - 11.188 20.624 9.436 84.3Total Cash Conversion Adjustments $44.654 $57.580 $12.926 28.9 0.000 $0.000 $0.000 - $44.654 $57.580 $12.926 28.9
Net Cash Surplus/(Deficit) ($102.246) ($71.766) $30.480 29.8 $0.000 $0.000 $0.000 - ($102.246) ($71.766) $30.480 29.8
MTA LONG ISLAND RAIL ROADJULY FINANCIAL PLAN - 2021 MID-YEAR FORECAST
ACCRUAL STATEMENT of OPERATIONS by CATEGORY AUGUST 2021
($ in millions)
Nonreimbursable Reimbursable TotalFavorable Favorable Favorable
Results are based on the preliminary close of the general ledger and are subject to review and adjustment. Please note that the current months’ actuals do not include post-close adjustments, which will be captured in the subsequent month’s YTD results.
(Unfavorable) (Unfavorable) (Unfavorable)
Master Page # 210 of 245 - Joint M
etro-North and Long Island C
omm
ittees Meeting 10/18/2021
________________________________________________________________________________
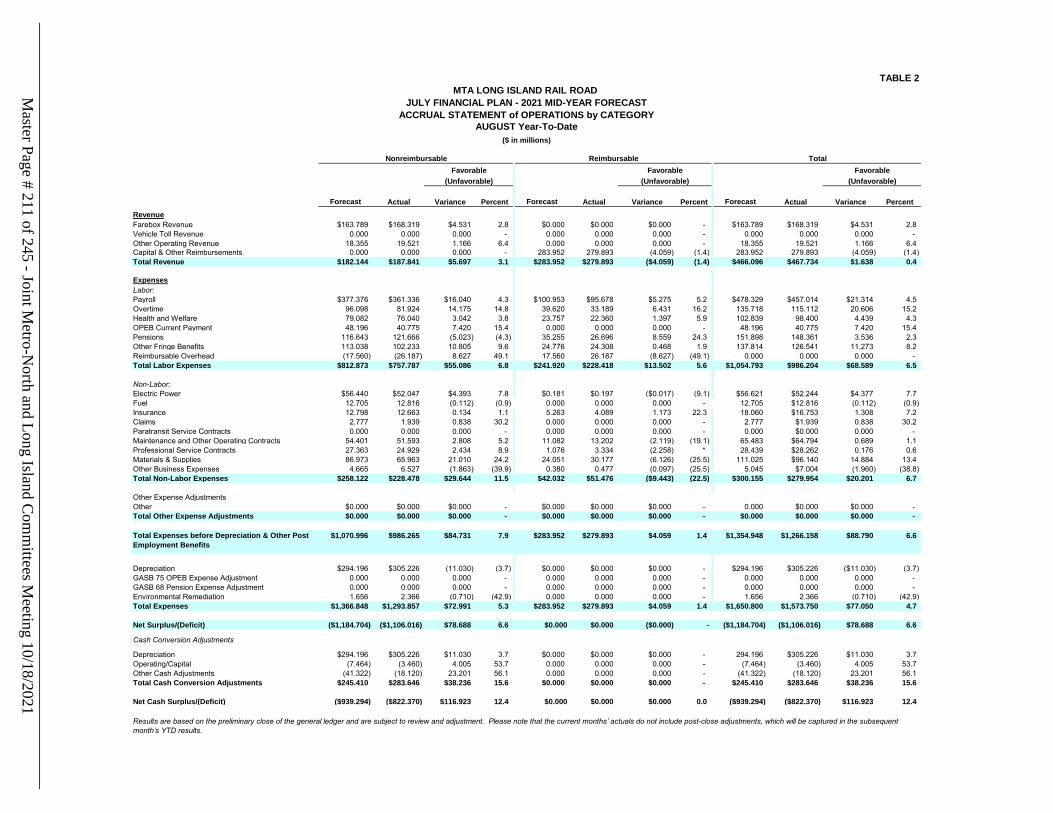
TABLE 2
Forecast Actual Variance Percent Forecast Actual Variance Percent Forecast Actual Variance PercentRevenueFarebox Revenue $163.789 $168.319 $4.531 2.8 $0.000 $0.000 $0.000 - $163.789 $168.319 $4.531 2.8Vehicle Toll Revenue 0.000 0.000 0.000 - 0.000 0.000 0.000 - 0.000 0.000 0.000 - Other Operating Revenue 18.355 19.521 1.166 6.4 0.000 0.000 0.000 - 18.355 19.521 1.166 6.4Capital & Other Reimbursements 0.000 0.000 0.000 - 283.952 279.893 (4.059) (1.4) 283.952 279.893 (4.059) (1.4)Total Revenue $182.144 $187.841 $5.697 3.1 $283.952 $279.893 ($4.059) (1.4) $466.096 $467.734 $1.638 0.4
ExpensesLabor:Payroll $377.376 $361.336 $16.040 4.3 $100.953 $95.678 $5.275 5.2 $478.329 $457.014 $21.314 4.5Overtime 96.098 81.924 14.175 14.8 39.620 33.189 6.431 16.2 135.718 115.112 20.606 15.2Health and Welfare 79.082 76.040 3.042 3.8 23.757 22.360 1.397 5.9 102.839 98.400 4.439 4.3OPEB Current Payment 48.196 40.775 7.420 15.4 0.000 0.000 0.000 - 48.196 40.775 7.420 15.4Pensions 116.643 121.666 (5.023) (4.3) 35.255 26.696 8.559 24.3 151.898 148.361 3.536 2.3Other Fringe Benefits 113.038 102.233 10.805 9.6 24.776 24.308 0.468 1.9 137.814 126.541 11.273 8.2Reimbursable Overhead (17.560) (26.187) 8.627 49.1 17.560 26.187 (8.627) (49.1) 0.000 0.000 0.000 - Total Labor Expenses $812.873 $757.787 $55.086 6.8 $241.920 $228.418 $13.502 5.6 $1,054.793 $986.204 $68.589 6.5
Non-Labor:Electric Power $56.440 $52.047 $4.393 7.8 $0.181 $0.197 ($0.017) (9.1) $56.621 $52.244 $4.377 7.7Fuel 12.705 12.816 (0.112) (0.9) 0.000 0.000 0.000 - 12.705 $12.816 (0.112) (0.9)Insurance 12.798 12.663 0.134 1.1 5.263 4.089 1.173 22.3 18.060 $16.753 1.308 7.2Claims 2.777 1.939 0.838 30.2 0.000 0.000 0.000 - 2.777 $1.939 0.838 30.2Paratransit Service Contracts 0.000 0.000 0.000 - 0.000 0.000 0.000 - 0.000 $0.000 0.000 - Maintenance and Other Operating Contracts 54.401 51.593 2.808 5.2 11.082 13.202 (2.119) (19.1) 65.483 $64.794 0.689 1.1Professional Service Contracts 27.363 24.929 2.434 8.9 1.076 3.334 (2.258) * 28.439 $28.262 0.176 0.6Materials & Supplies 86.973 65.963 21.010 24.2 24.051 30.177 (6.126) (25.5) 111.025 $96.140 14.884 13.4Other Business Expenses 4.665 6.527 (1.863) (39.9) 0.380 0.477 (0.097) (25.5) 5.045 $7.004 (1.960) (38.8)Total Non-Labor Expenses $258.122 $228.478 $29.644 11.5 $42.032 $51.476 ($9.443) (22.5) $300.155 $279.954 $20.201 6.7
Other Expense AdjustmentsOther $0.000 $0.000 $0.000 - $0.000 $0.000 $0.000 - 0.000 $0.000 $0.000 - Total Other Expense Adjustments $0.000 $0.000 $0.000 - $0.000 $0.000 $0.000 - $0.000 $0.000 $0.000 -
Total Expenses before Depreciation & Other Post Employment Benefits
$1,070.996 $986.265 $84.731 7.9 $283.952 $279.893 $4.059 1.4 $1,354.948 $1,266.158 $88.790 6.6
Depreciation $294.196 $305.226 (11.030) (3.7) $0.000 $0.000 $0.000 - $294.196 $305.226 ($11.030) (3.7)GASB 75 OPEB Expense Adjustment 0.000 0.000 0.000 - 0.000 0.000 0.000 - 0.000 0.000 0.000 - GASB 68 Pension Expense Adjustment 0.000 0.000 0.000 - 0.000 0.000 0.000 - 0.000 0.000 0.000 - Environmental Remediation 1.656 2.366 (0.710) (42.9) 0.000 0.000 0.000 - 1.656 2.366 (0.710) (42.9)Total Expenses $1,366.848 $1,293.857 $72.991 5.3 $283.952 $279.893 $4.059 1.4 $1,650.800 $1,573.750 $77.050 4.7
Net Surplus/(Deficit) ($1,184.704) ($1,106.016) $78.688 6.6 $0.000 $0.000 ($0.000) - ($1,184.704) ($1,106.016) $78.688 6.6
Cash Conversion Adjustments
Depreciation $294.196 $305.226 $11.030 3.7 $0.000 $0.000 $0.000 - 294.196 $305.226 $11.030 3.7Operating/Capital (7.464) (3.460) 4.005 53.7 0.000 0.000 0.000 - (7.464) (3.460) 4.005 53.7Other Cash Adjustments (41.322) (18.120) 23.201 56.1 0.000 0.000 0.000 - (41.322) (18.120) 23.201 56.1Total Cash Conversion Adjustments $245.410 $283.646 $38.236 15.6 $0.000 $0.000 $0.000 - $245.410 $283.646 $38.236 15.6
Net Cash Surplus/(Deficit) ($939.294) ($822.370) $116.923 12.4 $0.000 $0.000 $0.000 0.0 ($939.294) ($822.370) $116.923 12.4
MTA LONG ISLAND RAIL ROAD JULY FINANCIAL PLAN - 2021 MID-YEAR FORECAST
ACCRUAL STATEMENT of OPERATIONS by CATEGORY
Favorable
AUGUST Year-To-Date($ in millions)
Nonreimbursable Reimbursable TotalFavorable Favorable
Results are based on the preliminary close of the general ledger and are subject to review and adjustment. Please note that the current months’ actuals do not include post-close adjustments, which will be captured in the subsequent month’s YTD results.
(Unfavorable) (Unfavorable) (Unfavorable)
Master Page # 211 of 245 - Joint M
etro-North and Long Island C
omm
ittees Meeting 10/18/2021
________________________________________________________________________________
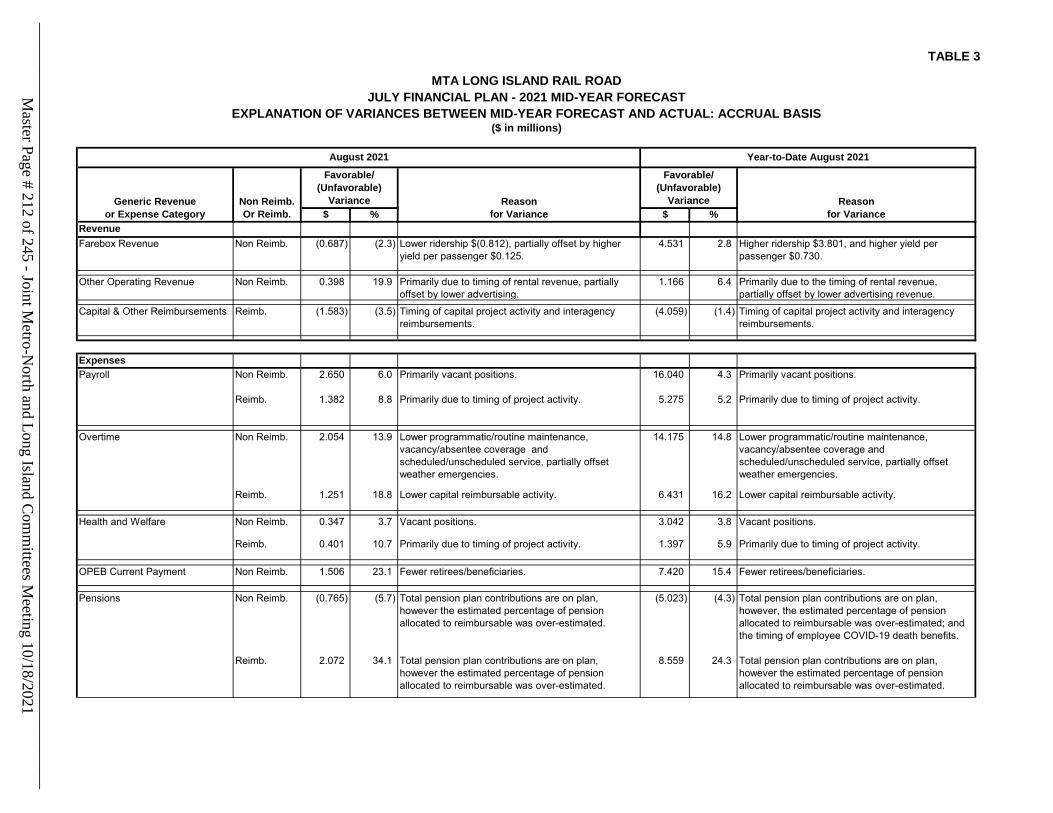
TABLE 3
$ % $ %RevenueFarebox Revenue Non Reimb. (0.687) (2.3) Lower ridership $(0.812), partially offset by higher
yield per passenger $0.125.4.531 2.8 Higher ridership $3.801, and higher yield per
passenger $0.730.
Other Operating Revenue Non Reimb. 0.398 19.9 Primarily due to timing of rental revenue, partially offset by lower advertising.
1.166 6.4 Primarily due to the timing of rental revenue, partially offset by lower advertising revenue.
Capital & Other Reimbursements Reimb. (1.583) (3.5) Timing of capital project activity and interagency reimbursements.
(4.059) (1.4) Timing of capital project activity and interagency reimbursements.
Expenses Payroll Non Reimb. 2.650 6.0 Primarily vacant positions. 16.040 4.3 Primarily vacant positions.
Reimb. 1.382 8.8 Primarily due to timing of project activity. 5.275 5.2 Primarily due to timing of project activity.
Overtime Non Reimb. 2.054 13.9 Lower programmatic/routine maintenance, vacancy/absentee coverage and scheduled/unscheduled service, partially offset weather emergencies.
14.175 14.8 Lower programmatic/routine maintenance, vacancy/absentee coverage and scheduled/unscheduled service, partially offset weather emergencies.
Reimb. 1.251 18.8 Lower capital reimbursable activity. 6.431 16.2 Lower capital reimbursable activity.
Health and Welfare Non Reimb. 0.347 3.7 Vacant positions. 3.042 3.8 Vacant positions.
Reimb. 0.401 10.7 Primarily due to timing of project activity. 1.397 5.9 Primarily due to timing of project activity.
OPEB Current Payment Non Reimb. 1.506 23.1 Fewer retirees/beneficiaries. 7.420 15.4 Fewer retirees/beneficiaries.
Pensions Non Reimb. (0.765) (5.7) Total pension plan contributions are on plan, however the estimated percentage of pension allocated to reimbursable was over-estimated.
(5.023) (4.3) Total pension plan contributions are on plan, however, the estimated percentage of pension allocated to reimbursable was over-estimated; and the timing of employee COVID-19 death benefits.
Reimb. 2.072 34.1 Total pension plan contributions are on plan, however the estimated percentage of pension allocated to reimbursable was over-estimated.
8.559 24.3 Total pension plan contributions are on plan, however the estimated percentage of pension allocated to reimbursable was over-estimated.
Non Reimb.Or Reimb.
Favorable/(Unfavorable)
Variance Reasonfor Variance
Favorable/(Unfavorable)
Variance
MTA LONG ISLAND RAIL ROADJULY FINANCIAL PLAN - 2021 MID-YEAR FORECAST
EXPLANATION OF VARIANCES BETWEEN MID-YEAR FORECAST AND ACTUAL: ACCRUAL BASIS
August 2021 Year-to-Date August 2021
Reasonfor Variance
Generic Revenueor Expense Category
($ in millions)
Master Page # 212 of 245 - Joint M
etro-North and Long Island C
omm
ittees Meeting 10/18/2021
________________________________________________________________________________
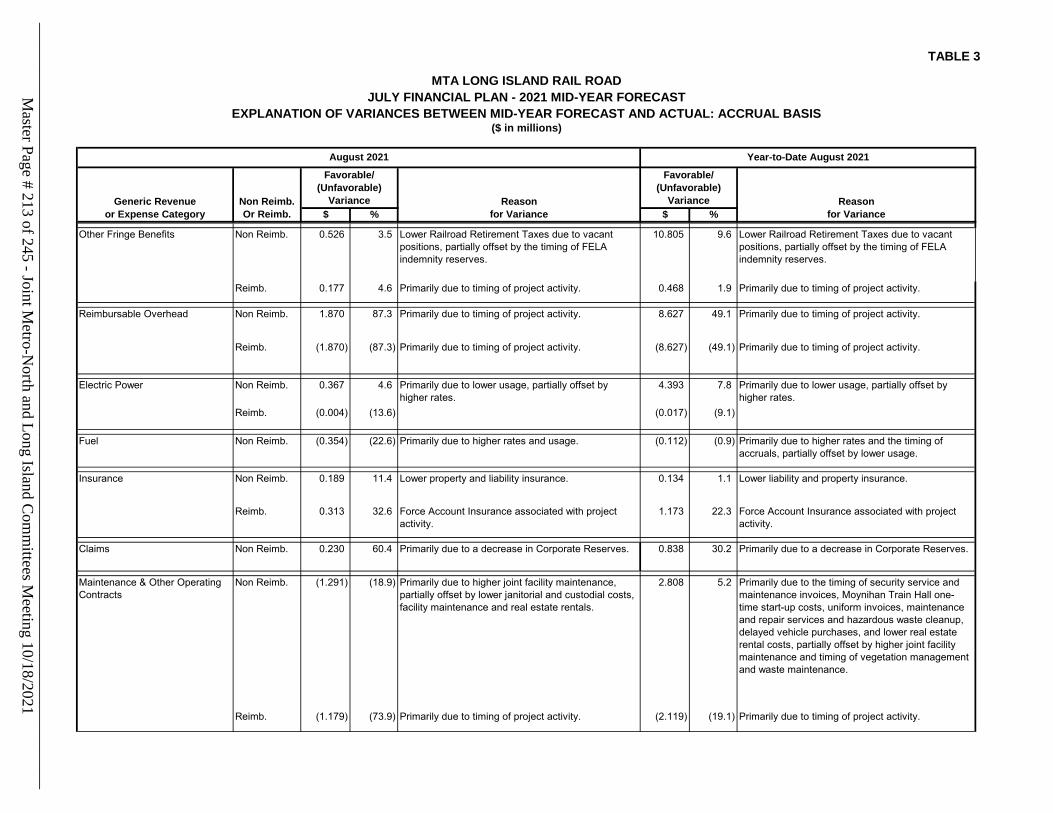
TABLE 3
$ % $ %Non Reimb.Or Reimb.
Favorable/(Unfavorable)
Variance Reasonfor Variance
Favorable/(Unfavorable)
Variance
MTA LONG ISLAND RAIL ROADJULY FINANCIAL PLAN - 2021 MID-YEAR FORECAST
EXPLANATION OF VARIANCES BETWEEN MID-YEAR FORECAST AND ACTUAL: ACCRUAL BASIS
August 2021 Year-to-Date August 2021
Reasonfor Variance
Generic Revenueor Expense Category
($ in millions)
Other Fringe Benefits Non Reimb. 0.526 3.5 Lower Railroad Retirement Taxes due to vacant positions, partially offset by the timing of FELA indemnity reserves.
10.805 9.6 Lower Railroad Retirement Taxes due to vacant positions, partially offset by the timing of FELA indemnity reserves.
Reimb. 0.177 4.6 Primarily due to timing of project activity. 0.468 1.9 Primarily due to timing of project activity.
Reimbursable Overhead Non Reimb. 1.870 87.3 Primarily due to timing of project activity. 8.627 49.1 Primarily due to timing of project activity.
Reimb. (1.870) (87.3) Primarily due to timing of project activity. (8.627) (49.1) Primarily due to timing of project activity.
Electric Power Non Reimb. 0.367 4.6 Primarily due to lower usage, partially offset by higher rates.
4.393 7.8 Primarily due to lower usage, partially offset by higher rates.
Reimb. (0.004) (13.6) (0.017) (9.1)
Fuel Non Reimb. (0.354) (22.6) Primarily due to higher rates and usage. (0.112) (0.9) Primarily due to higher rates and the timing of accruals, partially offset by lower usage.
Insurance Non Reimb. 0.189 11.4 Lower property and liability insurance. 0.134 1.1 Lower liability and property insurance.
Reimb. 0.313 32.6 Force Account Insurance associated with project activity.
1.173 22.3 Force Account Insurance associated with project activity.
Claims Non Reimb. 0.230 60.4 Primarily due to a decrease in Corporate Reserves. 0.838 30.2 Primarily due to a decrease in Corporate Reserves.
Maintenance & Other Operating Contracts
Non Reimb. (1.291) (18.9) Primarily due to higher joint facility maintenance, partially offset by lower janitorial and custodial costs, facility maintenance and real estate rentals.
2.808 5.2 Primarily due to the timing of security service and maintenance invoices, Moynihan Train Hall one-time start-up costs, uniform invoices, maintenance and repair services and hazardous waste cleanup, delayed vehicle purchases, and lower real estate rental costs, partially offset by higher joint facility maintenance and timing of vegetation management and waste maintenance.
Reimb. (1.179) (73.9) Primarily due to timing of project activity. (2.119) (19.1) Primarily due to timing of project activity.
Master Page # 213 of 245 - Joint M
etro-North and Long Island C
omm
ittees Meeting 10/18/2021
________________________________________________________________________________
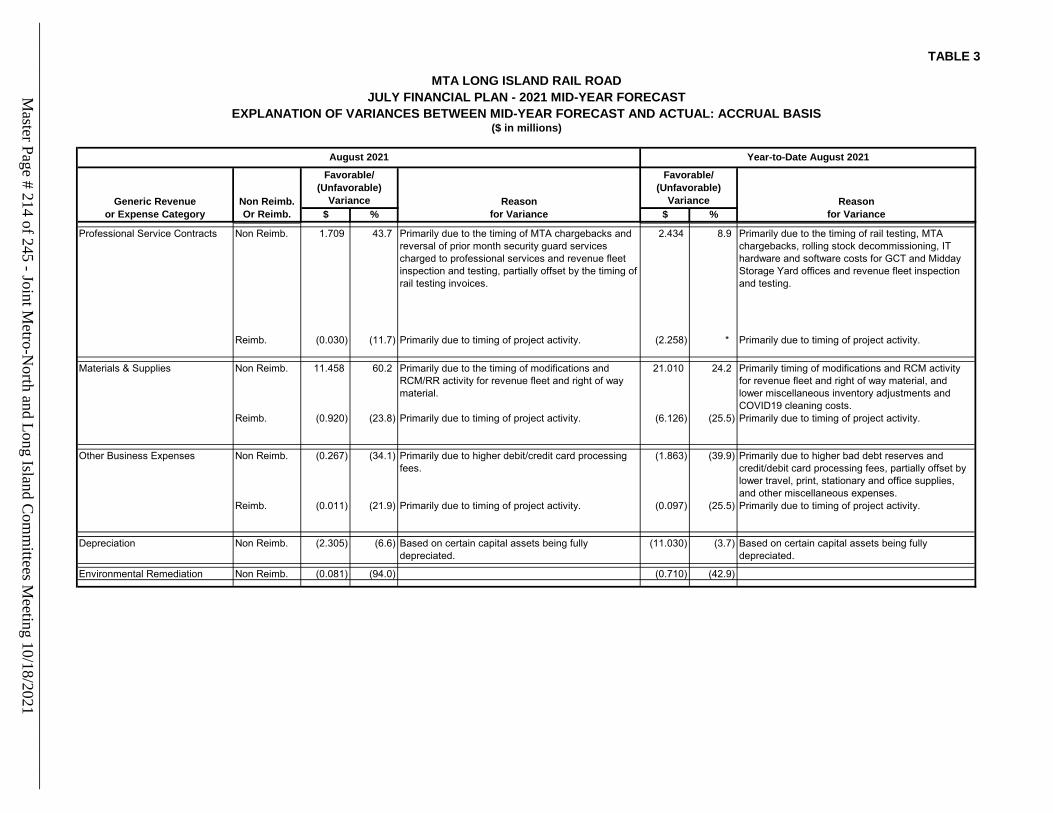
TABLE 3
$ % $ %Non Reimb.Or Reimb.
Favorable/(Unfavorable)
Variance Reasonfor Variance
Favorable/(Unfavorable)
Variance
MTA LONG ISLAND RAIL ROADJULY FINANCIAL PLAN - 2021 MID-YEAR FORECAST
EXPLANATION OF VARIANCES BETWEEN MID-YEAR FORECAST AND ACTUAL: ACCRUAL BASIS
August 2021 Year-to-Date August 2021
Reasonfor Variance
Generic Revenueor Expense Category
($ in millions)
Professional Service Contracts Non Reimb. 1.709 43.7 Primarily due to the timing of MTA chargebacks and reversal of prior month security guard services charged to professional services and revenue fleet inspection and testing, partially offset by the timing of rail testing invoices.
2.434 8.9 Primarily due to the timing of rail testing, MTA chargebacks, rolling stock decommissioning, IT hardware and software costs for GCT and Midday Storage Yard offices and revenue fleet inspection and testing.
Reimb. (0.030) (11.7) Primarily due to timing of project activity. (2.258) * Primarily due to timing of project activity.
Materials & Supplies Non Reimb. 11.458 60.2 Primarily due to the timing of modifications and RCM/RR activity for revenue fleet and right of way material.
21.010 24.2 Primarily timing of modifications and RCM activity for revenue fleet and right of way material, and lower miscellaneous inventory adjustments and COVID19 cleaning costs.
Reimb. (0.920) (23.8) Primarily due to timing of project activity. (6.126) (25.5) Primarily due to timing of project activity.
Other Business Expenses Non Reimb. (0.267) (34.1) Primarily due to higher debit/credit card processing fees.
(1.863) (39.9) Primarily due to higher bad debt reserves and credit/debit card processing fees, partially offset by lower travel, print, stationary and office supplies, and other miscellaneous expenses.
Reimb. (0.011) (21.9) Primarily due to timing of project activity. (0.097) (25.5) Primarily due to timing of project activity.
Depreciation Non Reimb. (2.305) (6.6) Based on certain capital assets being fully depreciated.
(11.030) (3.7) Based on certain capital assets being fully depreciated.
Environmental Remediation Non Reimb. (0.081) (94.0) (0.710) (42.9)
Master Page # 214 of 245 - Joint M
etro-North and Long Island C
omm
ittees Meeting 10/18/2021
________________________________________________________________________________
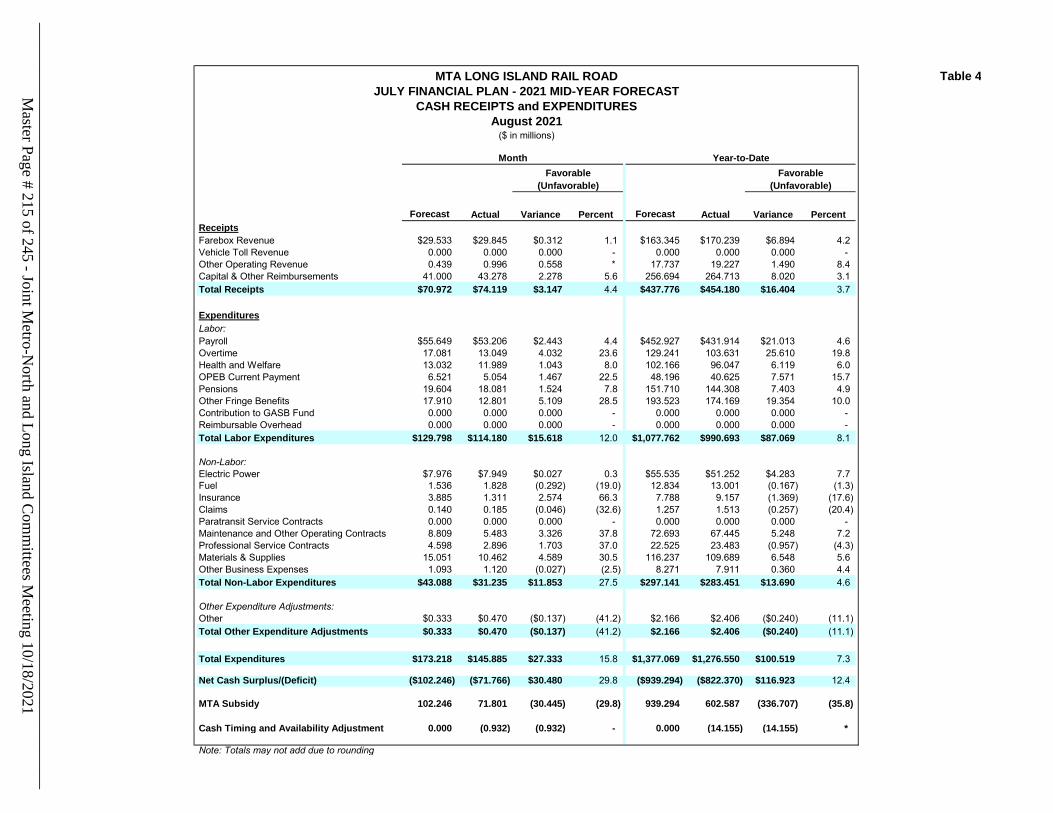
Table 4
Forecast Actual Variance Percent Forecast Actual Variance PercentReceiptsFarebox Revenue $29.533 $29.845 $0.312 1.1 $163.345 $170.239 $6.894 4.2Vehicle Toll Revenue 0.000 0.000 0.000 - 0.000 0.000 0.000 - Other Operating Revenue 0.439 0.996 0.558 * 17.737 19.227 1.490 8.4Capital & Other Reimbursements 41.000 43.278 2.278 5.6 256.694 264.713 8.020 3.1Total Receipts $70.972 $74.119 $3.147 4.4 $437.776 $454.180 $16.404 3.7
ExpendituresLabor:Payroll $55.649 $53.206 $2.443 4.4 $452.927 $431.914 $21.013 4.6Overtime 17.081 13.049 4.032 23.6 129.241 103.631 25.610 19.8Health and Welfare 13.032 11.989 1.043 8.0 102.166 96.047 6.119 6.0OPEB Current Payment 6.521 5.054 1.467 22.5 48.196 40.625 7.571 15.7Pensions 19.604 18.081 1.524 7.8 151.710 144.308 7.403 4.9Other Fringe Benefits 17.910 12.801 5.109 28.5 193.523 174.169 19.354 10.0Contribution to GASB Fund 0.000 0.000 0.000 - 0.000 0.000 0.000 - Reimbursable Overhead 0.000 0.000 0.000 - 0.000 0.000 0.000 - Total Labor Expenditures $129.798 $114.180 $15.618 12.0 $1,077.762 $990.693 $87.069 8.1
Non-Labor:Electric Power $7.976 $7.949 $0.027 0.3 $55.535 $51.252 $4.283 7.7Fuel 1.536 1.828 (0.292) (19.0) 12.834 13.001 (0.167) (1.3)Insurance 3.885 1.311 2.574 66.3 7.788 9.157 (1.369) (17.6)Claims 0.140 0.185 (0.046) (32.6) 1.257 1.513 (0.257) (20.4)Paratransit Service Contracts 0.000 0.000 0.000 - 0.000 0.000 0.000 - Maintenance and Other Operating Contracts 8.809 5.483 3.326 37.8 72.693 67.445 5.248 7.2Professional Service Contracts 4.598 2.896 1.703 37.0 22.525 23.483 (0.957) (4.3)Materials & Supplies 15.051 10.462 4.589 30.5 116.237 109.689 6.548 5.6Other Business Expenses 1.093 1.120 (0.027) (2.5) 8.271 7.911 0.360 4.4Total Non-Labor Expenditures $43.088 $31.235 $11.853 27.5 $297.141 $283.451 $13.690 4.6
Other Expenditure Adjustments:Other $0.333 $0.470 ($0.137) (41.2) $2.166 $2.406 ($0.240) (11.1)Total Other Expenditure Adjustments $0.333 $0.470 ($0.137) (41.2) $2.166 $2.406 ($0.240) (11.1)
Total Expenditures $173.218 $145.885 $27.333 15.8 $1,377.069 $1,276.550 $100.519 7.3
Net Cash Surplus/(Deficit) ($102.246) ($71.766) $30.480 29.8 ($939.294) ($822.370) $116.923 12.4
MTA Subsidy 102.246 71.801 (30.445) (29.8) 939.294 602.587 (336.707) (35.8)
Cash Timing and Availability Adjustment 0.000 (0.932) (0.932) - 0.000 (14.155) (14.155) *
Note: Totals may not add due to rounding
MTA LONG ISLAND RAIL ROADJULY FINANCIAL PLAN - 2021 MID-YEAR FORECAST
CASH RECEIPTS and EXPENDITURESAugust 2021
($ in millions)
Month Year-to-DateFavorable Favorable
(Unfavorable) (Unfavorable)
Master Page # 215 of 245 - Joint M
etro-North and Long Island C
omm
ittees Meeting 10/18/2021
________________________________________________________________________________
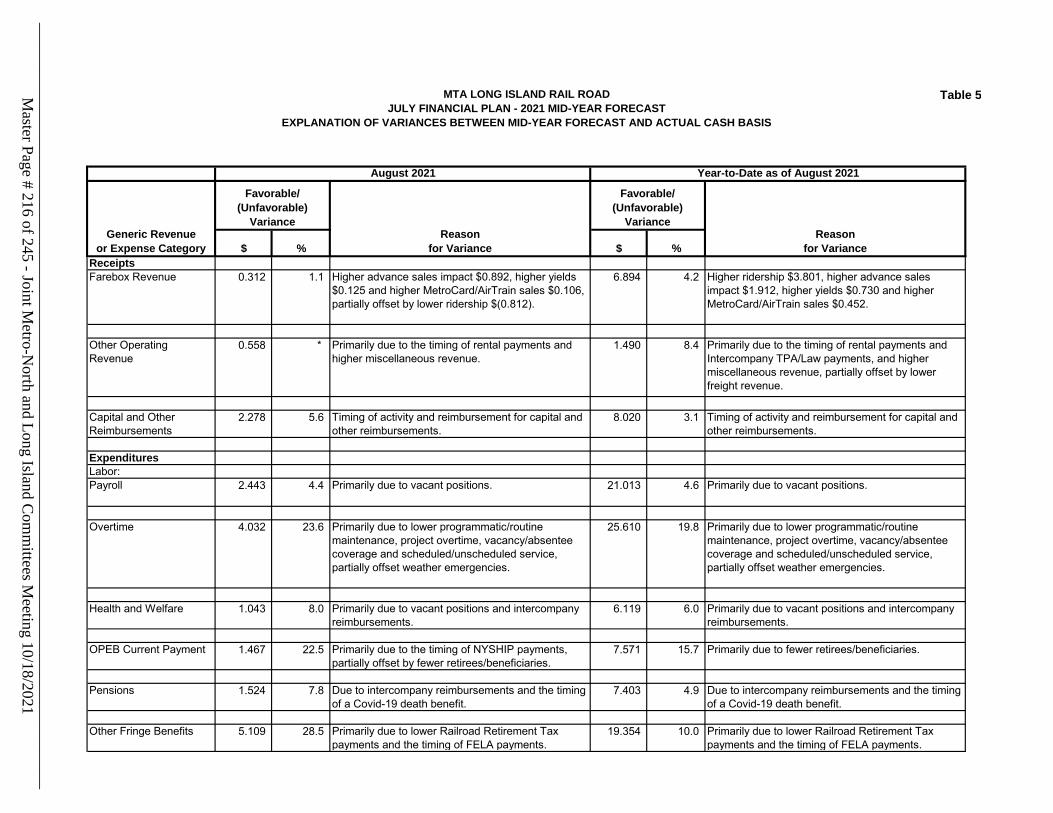
MTA LONG ISLAND RAIL ROADJULY FINANCIAL PLAN - 2021 MID-YEAR FORECAST
EXPLANATION OF VARIANCES BETWEEN MID-YEAR FORECAST AND ACTUAL CASH BASIS
Table 5
$ % $ %ReceiptsFarebox Revenue 0.312 1.1 Higher advance sales impact $0.892, higher yields
$0.125 and higher MetroCard/AirTrain sales $0.106, partially offset by lower ridership $(0.812).
6.894 4.2 Higher ridership $3.801, higher advance sales impact $1.912, higher yields $0.730 and higher MetroCard/AirTrain sales $0.452.
Other Operating Revenue
0.558 * Primarily due to the timing of rental payments and higher miscellaneous revenue.
1.490 8.4 Primarily due to the timing of rental payments and Intercompany TPA/Law payments, and higher miscellaneous revenue, partially offset by lower freight revenue.
Capital and Other Reimbursements
2.278 5.6 Timing of activity and reimbursement for capital and other reimbursements.
8.020 3.1 Timing of activity and reimbursement for capital and other reimbursements.
ExpendituresLabor:Payroll 2.443 4.4 Primarily due to vacant positions. 21.013 4.6 Primarily due to vacant positions.
Overtime 4.032 23.6 Primarily due to lower programmatic/routine maintenance, project overtime, vacancy/absentee coverage and scheduled/unscheduled service, partially offset weather emergencies.
25.610 19.8 Primarily due to lower programmatic/routine maintenance, project overtime, vacancy/absentee coverage and scheduled/unscheduled service, partially offset weather emergencies.
Health and Welfare 1.043 8.0 Primarily due to vacant positions and intercompany reimbursements.
6.119 6.0 Primarily due to vacant positions and intercompany reimbursements.
OPEB Current Payment 1.467 22.5 Primarily due to the timing of NYSHIP payments, partially offset by fewer retirees/beneficiaries.
7.571 15.7 Primarily due to fewer retirees/beneficiaries.
Pensions 1.524 7.8 Due to intercompany reimbursements and the timing of a Covid-19 death benefit.
7.403 4.9 Due to intercompany reimbursements and the timing of a Covid-19 death benefit.
Other Fringe Benefits 5.109 28.5 Primarily due to lower Railroad Retirement Tax payments and the timing of FELA payments.
19.354 10.0 Primarily due to lower Railroad Retirement Tax payments and the timing of FELA payments.
August 2021 Year-to-Date as of August 2021
Generic Revenueor Expense Category
Favorable/(Unfavorable)
VarianceReason
for Variance
Favorable/(Unfavorable)
VarianceReason
for Variance
Master Page # 216 of 245 - Joint M
etro-North and Long Island C
omm
ittees Meeting 10/18/2021
________________________________________________________________________________
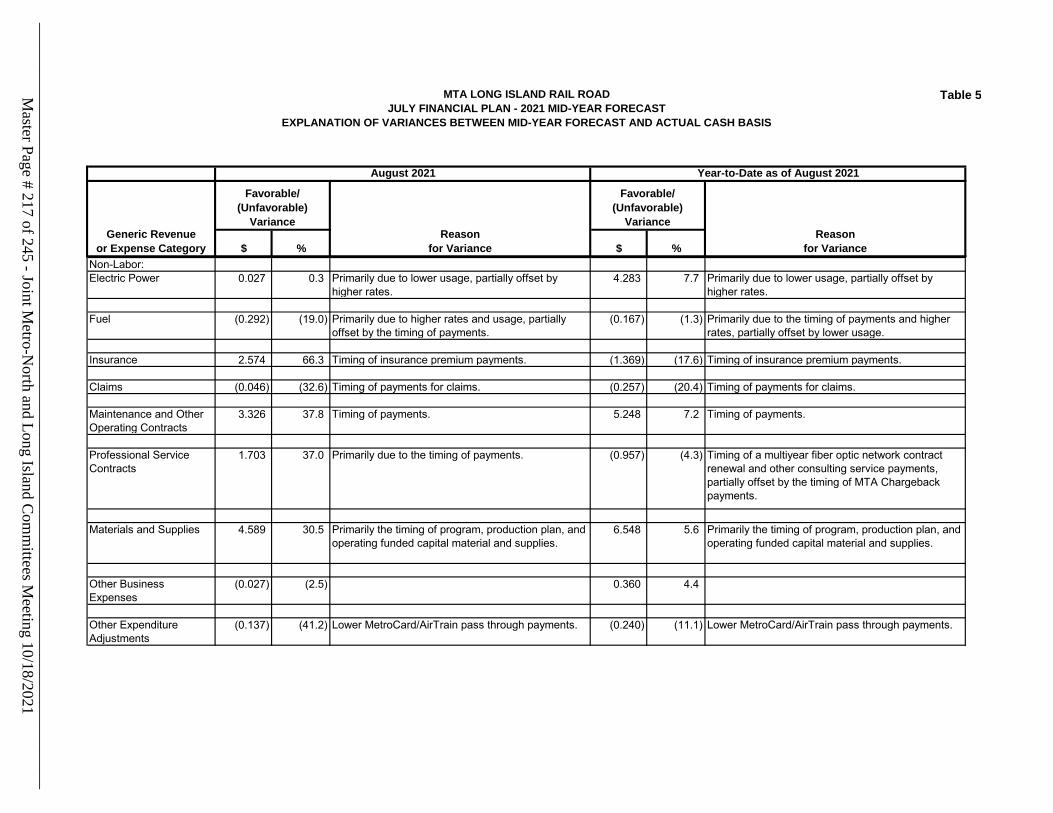
MTA LONG ISLAND RAIL ROADJULY FINANCIAL PLAN - 2021 MID-YEAR FORECAST
EXPLANATION OF VARIANCES BETWEEN MID-YEAR FORECAST AND ACTUAL CASH BASIS
Table 5
$ % $ %
August 2021 Year-to-Date as of August 2021
Generic Revenueor Expense Category
Favorable/(Unfavorable)
VarianceReason
for Variance
Favorable/(Unfavorable)
VarianceReason
for VarianceNon-Labor:Electric Power 0.027 0.3 Primarily due to lower usage, partially offset by
higher rates.4.283 7.7 Primarily due to lower usage, partially offset by
higher rates.
Fuel (0.292) (19.0) Primarily due to higher rates and usage, partially offset by the timing of payments.
(0.167) (1.3) Primarily due to the timing of payments and higher rates, partially offset by lower usage.
Insurance 2.574 66.3 Timing of insurance premium payments. (1.369) (17.6) Timing of insurance premium payments.
Claims (0.046) (32.6) Timing of payments for claims. (0.257) (20.4) Timing of payments for claims.
Maintenance and Other Operating Contracts
3.326 37.8 Timing of payments. 5.248 7.2 Timing of payments.
Professional Service Contracts
1.703 37.0 Primarily due to the timing of payments. (0.957) (4.3) Timing of a multiyear fiber optic network contract renewal and other consulting service payments, partially offset by the timing of MTA Chargeback payments.
Materials and Supplies 4.589 30.5 Primarily the timing of program, production plan, and
operating funded capital material and supplies. 6.548 5.6 Primarily the timing of program, production plan, and
operating funded capital material and supplies.
Other Business Expenses
(0.027) (2.5) 0.360 4.4
Other Expenditure Adjustments
(0.137) (41.2) Lower MetroCard/AirTrain pass through payments. (0.240) (11.1) Lower MetroCard/AirTrain pass through payments.
Master Page # 217 of 245 - Joint M
etro-North and Long Island C
omm
ittees Meeting 10/18/2021
________________________________________________________________________________
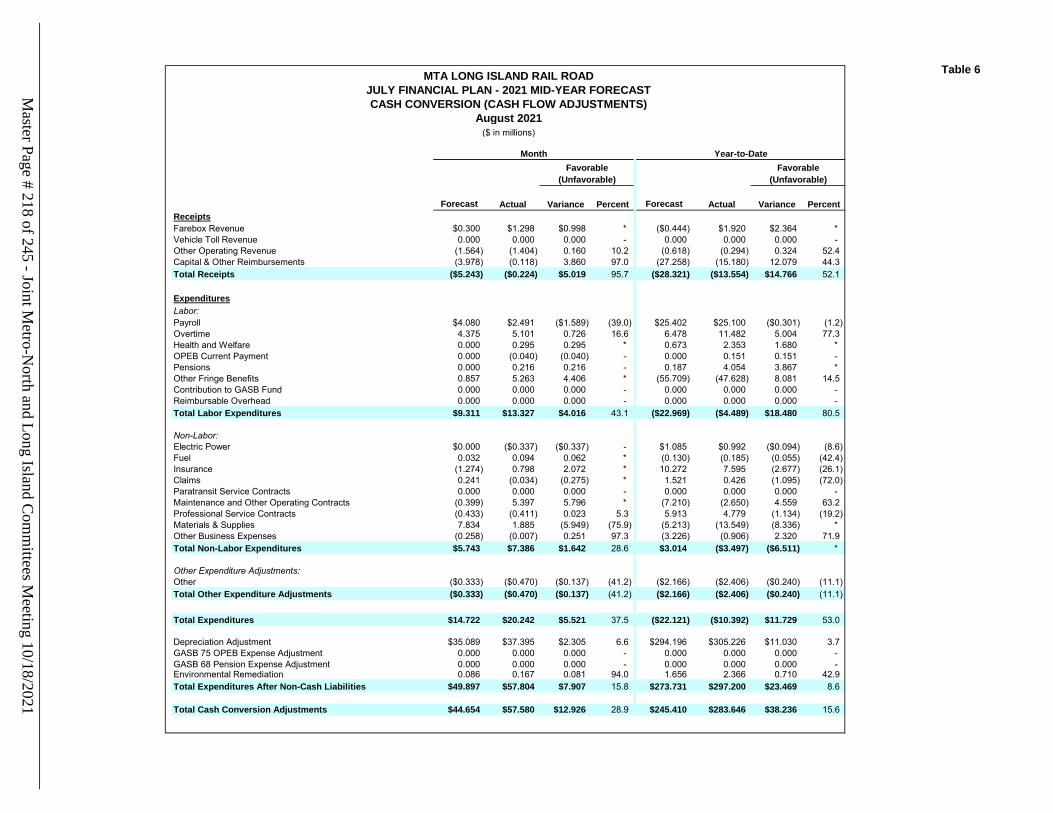
Table 6
Forecast Actual Variance Percent Forecast Actual Variance PercentReceiptsFarebox Revenue $0.300 $1.298 $0.998 * ($0.444) $1.920 $2.364 * Vehicle Toll Revenue 0.000 0.000 0.000 - 0.000 0.000 0.000 - Other Operating Revenue (1.564) (1.404) 0.160 10.2 (0.618) (0.294) 0.324 52.4Capital & Other Reimbursements (3.978) (0.118) 3.860 97.0 (27.258) (15.180) 12.079 44.3Total Receipts ($5.243) ($0.224) $5.019 95.7 ($28.321) ($13.554) $14.766 52.1
ExpendituresLabor:Payroll $4.080 $2.491 ($1.589) (39.0) $25.402 $25.100 ($0.301) (1.2)Overtime 4.375 5.101 0.726 16.6 6.478 11.482 5.004 77.3Health and Welfare 0.000 0.295 0.295 * 0.673 2.353 1.680 * OPEB Current Payment 0.000 (0.040) (0.040) - 0.000 0.151 0.151 - Pensions 0.000 0.216 0.216 - 0.187 4.054 3.867 * Other Fringe Benefits 0.857 5.263 4.406 * (55.709) (47.628) 8.081 14.5Contribution to GASB Fund 0.000 0.000 0.000 - 0.000 0.000 0.000 - Reimbursable Overhead 0.000 0.000 0.000 - 0.000 0.000 0.000 - Total Labor Expenditures $9.311 $13.327 $4.016 43.1 ($22.969) ($4.489) $18.480 80.5
Non-Labor:Electric Power $0.000 ($0.337) ($0.337) - $1.085 $0.992 ($0.094) (8.6)Fuel 0.032 0.094 0.062 * (0.130) (0.185) (0.055) (42.4)Insurance (1.274) 0.798 2.072 * 10.272 7.595 (2.677) (26.1)Claims 0.241 (0.034) (0.275) * 1.521 0.426 (1.095) (72.0)Paratransit Service Contracts 0.000 0.000 0.000 - 0.000 0.000 0.000 - Maintenance and Other Operating Contracts (0.399) 5.397 5.796 * (7.210) (2.650) 4.559 63.2Professional Service Contracts (0.433) (0.411) 0.023 5.3 5.913 4.779 (1.134) (19.2)Materials & Supplies 7.834 1.885 (5.949) (75.9) (5.213) (13.549) (8.336) * Other Business Expenses (0.258) (0.007) 0.251 97.3 (3.226) (0.906) 2.320 71.9Total Non-Labor Expenditures $5.743 $7.386 $1.642 28.6 $3.014 ($3.497) ($6.511) *
Other Expenditure Adjustments:Other ($0.333) ($0.470) ($0.137) (41.2) ($2.166) ($2.406) ($0.240) (11.1)Total Other Expenditure Adjustments ($0.333) ($0.470) ($0.137) (41.2) ($2.166) ($2.406) ($0.240) (11.1)
Total Expenditures $14.722 $20.242 $5.521 37.5 ($22.121) ($10.392) $11.729 53.0
Depreciation Adjustment $35.089 $37.395 $2.305 6.6 $294.196 $305.226 $11.030 3.7GASB 75 OPEB Expense Adjustment 0.000 0.000 0.000 - 0.000 0.000 0.000 - GASB 68 Pension Expense Adjustment 0.000 0.000 0.000 - 0.000 0.000 0.000 - Environmental Remediation 0.086 0.167 0.081 94.0 1.656 2.366 0.710 42.9Total Expenditures After Non-Cash Liabilities $49.897 $57.804 $7.907 15.8 $273.731 $297.200 $23.469 8.6
Total Cash Conversion Adjustments $44.654 $57.580 $12.926 28.9 $245.410 $283.646 $38.236 15.6
Month Year-to-DateFavorable Favorable
(Unfavorable) (Unfavorable)
MTA LONG ISLAND RAIL ROADJULY FINANCIAL PLAN - 2021 MID-YEAR FORECASTCASH CONVERSION (CASH FLOW ADJUSTMENTS)
August 2021($ in millions)
Master Page # 218 of 245 - Joint M
etro-North and Long Island C
omm
ittees Meeting 10/18/2021
________________________________________________________________________________
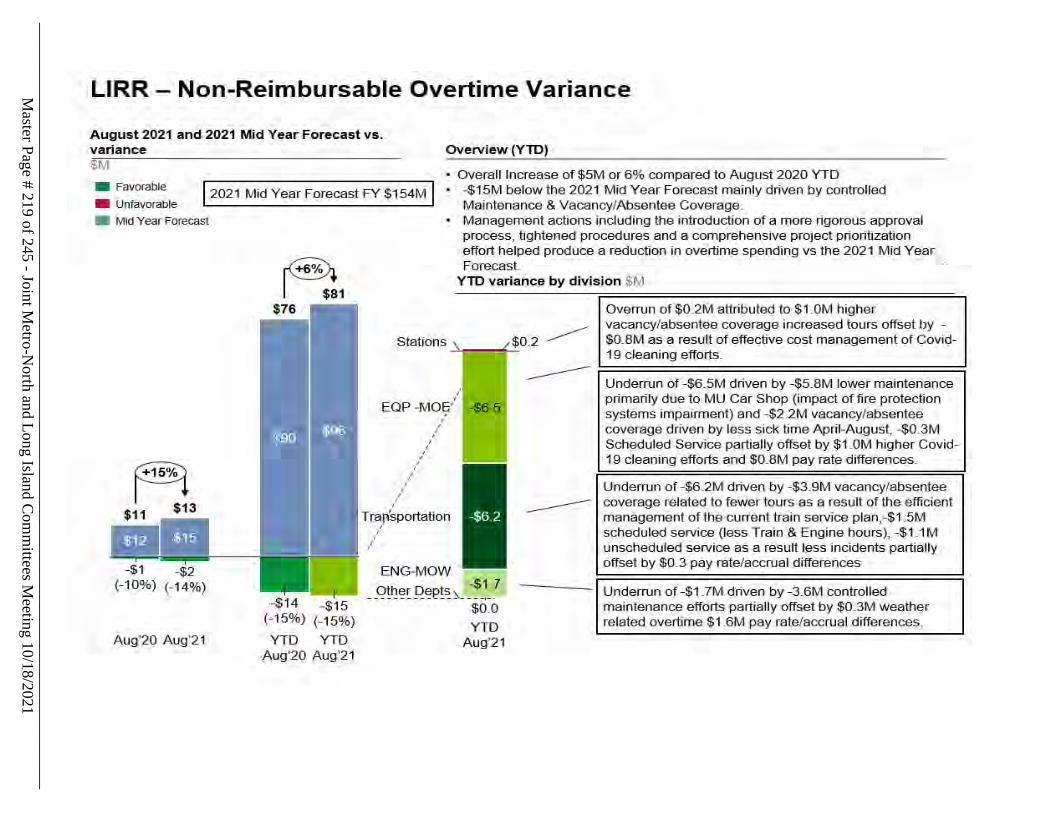
Master Page # 219 of 245 - Joint M
etro-North and Long Island C
omm
ittees Meeting 10/18/2021
________________________________________________________________________________
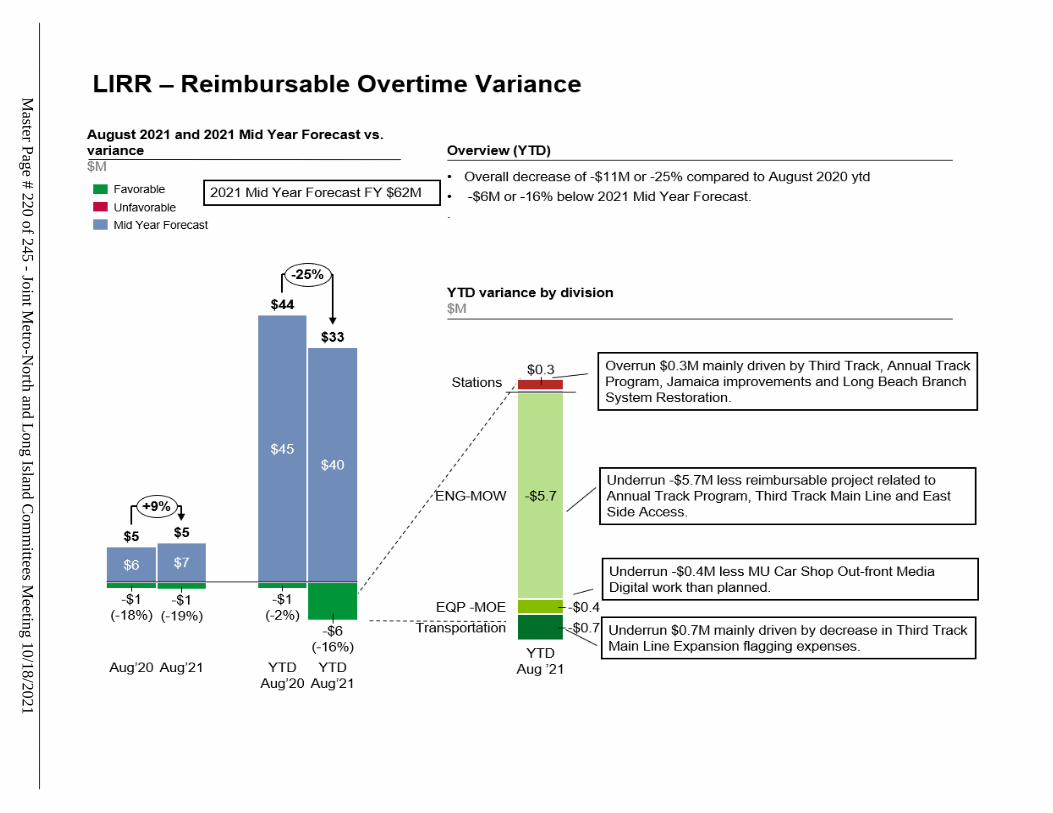
Master Page # 220 of 245 - Joint M
etro-North and Long Island C
omm
ittees Meeting 10/18/2021
________________________________________________________________________________
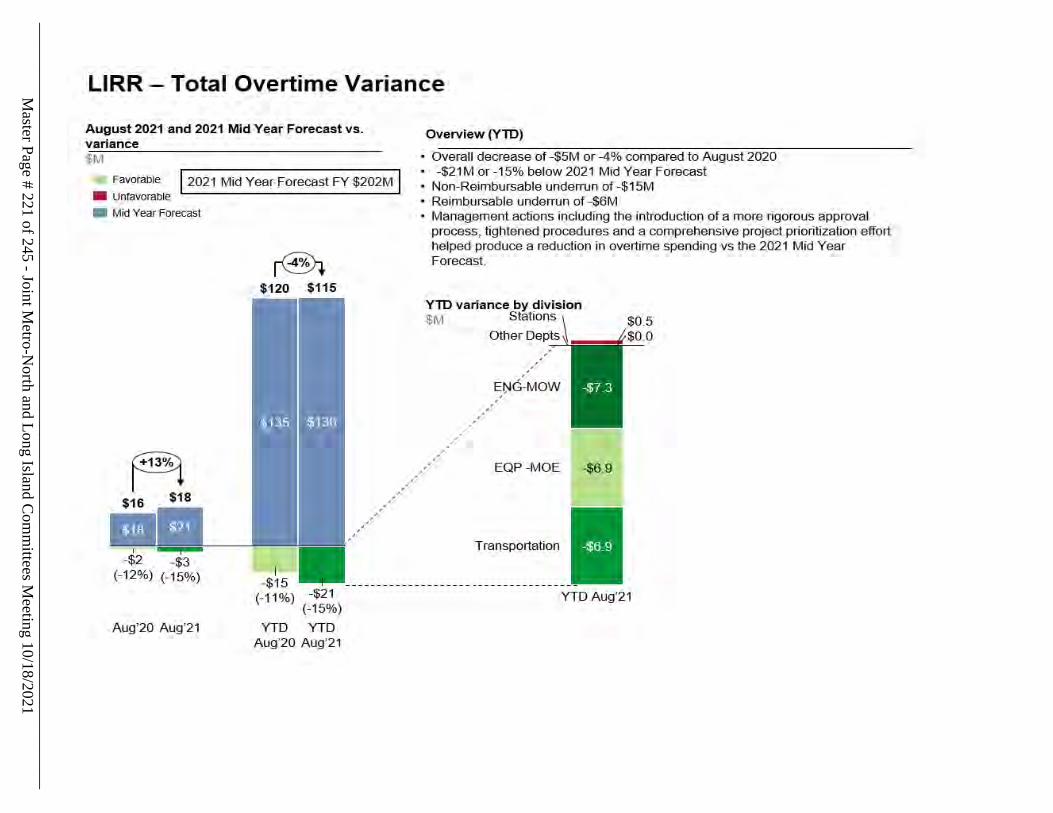
Master Page # 221 of 245 - Joint M
etro-North and Long Island C
omm
ittees Meeting 10/18/2021
________________________________________________________________________________
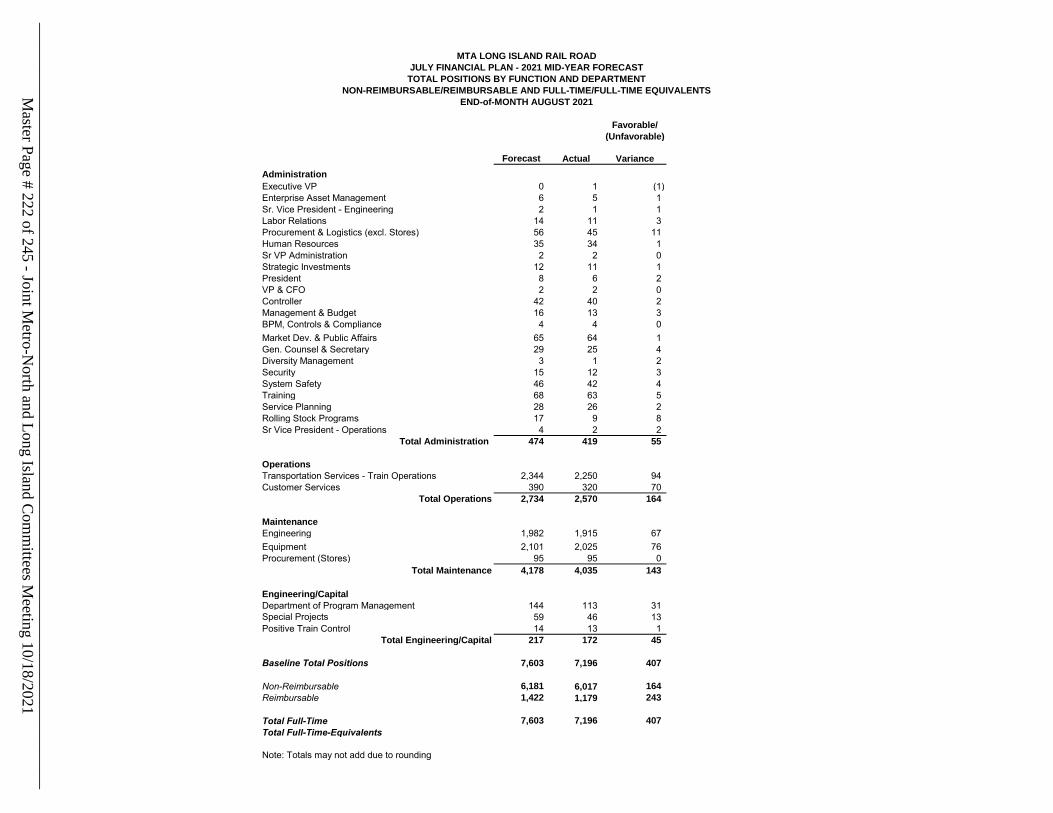
Favorable/(Unfavorable)
Forecast Actual VarianceAdministrationExecutive VP 0 1 (1)Enterprise Asset Management 6 5 1Sr. Vice President - Engineering 2 1 1Labor Relations 14 11 3Procurement & Logistics (excl. Stores) 56 45 11Human Resources 35 34 1Sr VP Administration 2 2 0Strategic Investments 12 11 1President 8 6 2VP & CFO 2 2 0Controller 42 40 2Management & Budget 16 13 3BPM, Controls & Compliance 4 4 0Market Dev. & Public Affairs 65 64 1Gen. Counsel & Secretary 29 25 4Diversity Management 3 1 2Security 15 12 3System Safety 46 42 4Training 68 63 5Service Planning 28 26 2Rolling Stock Programs 17 9 8Sr Vice President - Operations 4 2 2
Total Administration 474 419 55
OperationsTransportation Services - Train Operations 2,344 2,250 94Customer Services 390 320 70
Total Operations 2,734 2,570 164
MaintenanceEngineering 1,982 1,915 67 Equipment 2,101 2,025 76Procurement (Stores) 95 95 0
Total Maintenance 4,178 4,035 143
Engineering/CapitalDepartment of Program Management 144 113 31Special Projects/East Side Access 59 46 13Positive Train Control 14 13 1
Total Engineering/Capital 217 172 45
Baseline Total Positions 7,603 7,196 407
Non-Reimbursable 6,181 6,017 164Reimbursable 1,422 1,179 243
Total Full-Time 7,603 7,196 407 Total Full-Time-Equivalents
Note: Totals may not add due to rounding
MTA LONG ISLAND RAIL ROADJULY FINANCIAL PLAN - 2021 MID-YEAR FORECAST
END-of-MONTH AUGUST 2021
TOTAL POSITIONS BY FUNCTION AND DEPARTMENTNON-REIMBURSABLE/REIMBURSABLE AND FULL-TIME/FULL-TIME EQUIVALENTSM
aster Page # 222 of 245 - Joint Metro-N
orth and Long Island Com
mittees M
eeting 10/18/2021________________________________________________________________________________
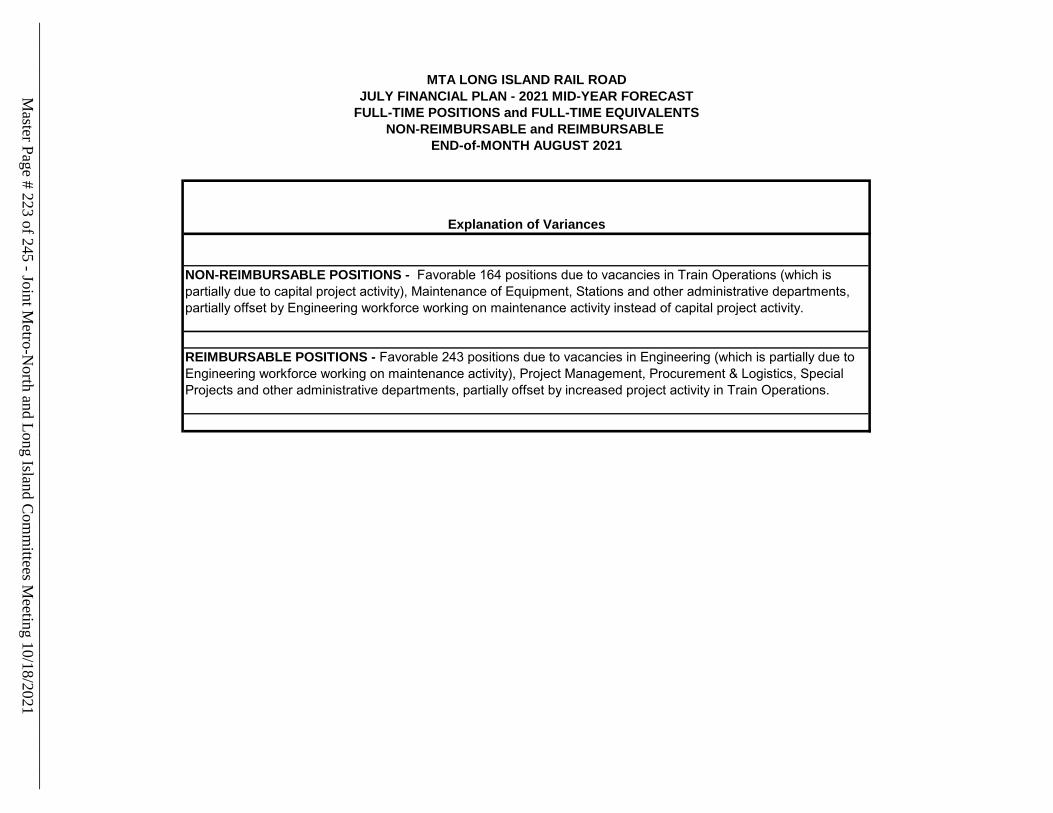
MTA LONG ISLAND RAIL ROADJULY FINANCIAL PLAN - 2021 MID-YEAR FORECAST
FULL-TIME POSITIONS and FULL-TIME EQUIVALENTSNON-REIMBURSABLE and REIMBURSABLE
END-of-MONTH AUGUST 2021
Explanation of Variances
NON-REIMBURSABLE POSITIONS - Favorable 164 positions due to vacancies in Train Operations (which is partially due to capital project activity), Maintenance of Equipment, Stations and other administrative departments, partially offset by Engineering workforce working on maintenance activity instead of capital project activity.
REIMBURSABLE POSITIONS - Favorable 243 positions due to vacancies in Engineering (which is partially due to Engineering workforce working on maintenance activity), Project Management, Procurement & Logistics, Special Projects and other administrative departments, partially offset by increased project activity in Train Operations.
Master Page # 223 of 245 - Joint M
etro-North and Long Island C
omm
ittees Meeting 10/18/2021
________________________________________________________________________________
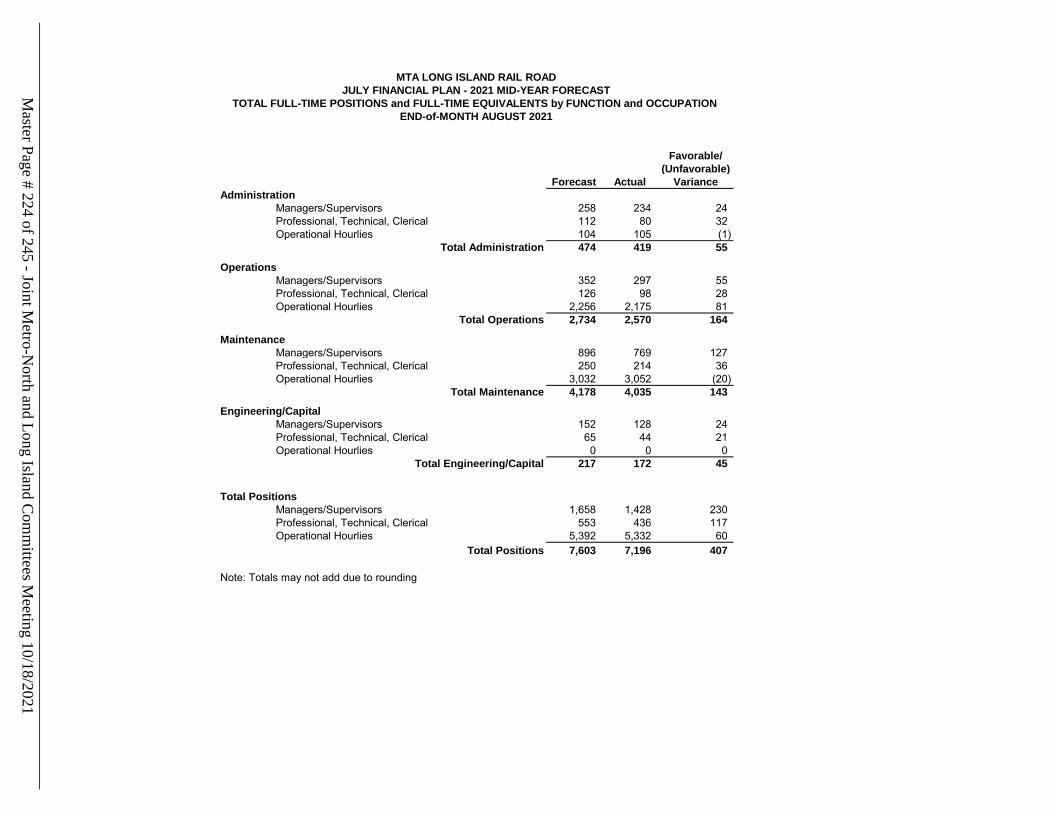
Favorable/(Unfavorable)
Forecast Actual VarianceAdministration
Managers/Supervisors 258 234 24 Professional, Technical, Clerical 112 80 32 Operational Hourlies 104 105 (1)
Total Administration 474 419 55
Operations Managers/Supervisors 352 297 55 Professional, Technical, Clerical 126 98 28 Operational Hourlies 2,256 2,175 81
Total Operations 2,734 2,570 164
Maintenance Managers/Supervisors 896 769 127 Professional, Technical, Clerical 250 214 36 Operational Hourlies 3,032 3,052 (20)
Total Maintenance 4,178 4,035 143
Engineering/Capital Managers/Supervisors 152 128 24 Professional, Technical, Clerical 65 44 21 Operational Hourlies 0 0 0
Total Engineering/Capital 217 172 45
Total Positions Managers/Supervisors 1,658 1,428 230 Professional, Technical, Clerical 553 436 117 Operational Hourlies 5,392 5,332 60
Total Positions 7,603 7,196 407
Note: Totals may not add due to rounding
MTA LONG ISLAND RAIL ROADJULY FINANCIAL PLAN - 2021 MID-YEAR FORECAST
TOTAL FULL-TIME POSITIONS and FULL-TIME EQUIVALENTS by FUNCTION and OCCUPATION END-of-MONTH AUGUST 2021
Master Page # 224 of 245 - Joint M
etro-North and Long Island C
omm
ittees Meeting 10/18/2021
________________________________________________________________________________
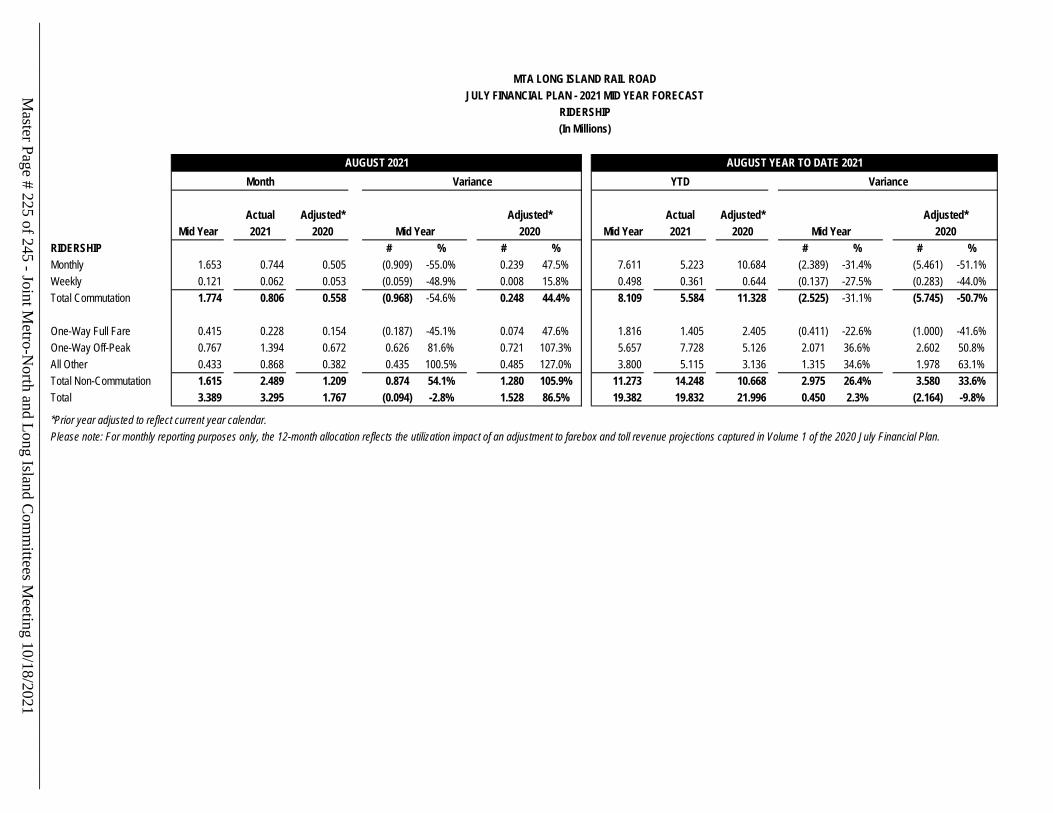
MTA LONG ISLAND RAIL ROADJULY FINANCIAL PLAN - 2021 MID YEAR FORECAST
RIDERSHIP(In Millions)
Actual Adjusted* Actual Adjusted*Mid Year 2021 2020 2021 2020
RIDERSHIP # % # % # % # %Monthly 1.653 0.744 0.505 (0.909) -55.0% 0.239 47.5% 7.611 5.223 10.684 (2.389) -31.4% (5.461) -51.1%
Weekly 0.121 0.062 0.053 (0.059) -48.9% 0.008 15.8% 0.498 0.361 0.644 (0.137) -27.5% (0.283) -44.0%
Total Commutation 1.774 0.806 0.558 (0.968) -54.6% 0.248 44.4% 8.109 5.584 11.328 (2.525) -31.1% (5.745) -50.7%
One-Way Full Fare 0.415 0.228 0.154 (0.187) -45.1% 0.074 47.6% 1.816 1.405 2.405 (0.411) -22.6% (1.000) -41.6%
One-Way Off-Peak 0.767 1.394 0.672 0.626 81.6% 0.721 107.3% 5.657 7.728 5.126 2.071 36.6% 2.602 50.8%
All Other 0.433 0.868 0.382 0.435 100.5% 0.485 127.0% 3.800 5.115 3.136 1.315 34.6% 1.978 63.1%
Total Non-Commutation 1.615 2.489 1.209 0.874 54.1% 1.280 105.9% 11.273 14.248 10.668 2.975 26.4% 3.580 33.6%Total 3.389 3.295 1.767 (0.094) -2.8% 1.528 86.5% 19.382 19.832 21.996 0.450 2.3% (2.164) -9.8%
*Prior year adjusted to reflect current year calendar.
Please note: For monthly reporting purposes only, the 12-month allocation reflects the utilization impact of an adjustment to farebox and toll revenue projections captured in Volume 1 of the 2020 July Financial Plan.
Mid Year 2020
AUGUST YEAR TO DATE 2021YTD Variance
Adjusted*Mid YearMid Year 2020
AUGUST 2021Month Variance
Adjusted*
Master Page # 225 of 245 - Joint M
etro-North and Long Island C
omm
ittees Meeting 10/18/2021
________________________________________________________________________________
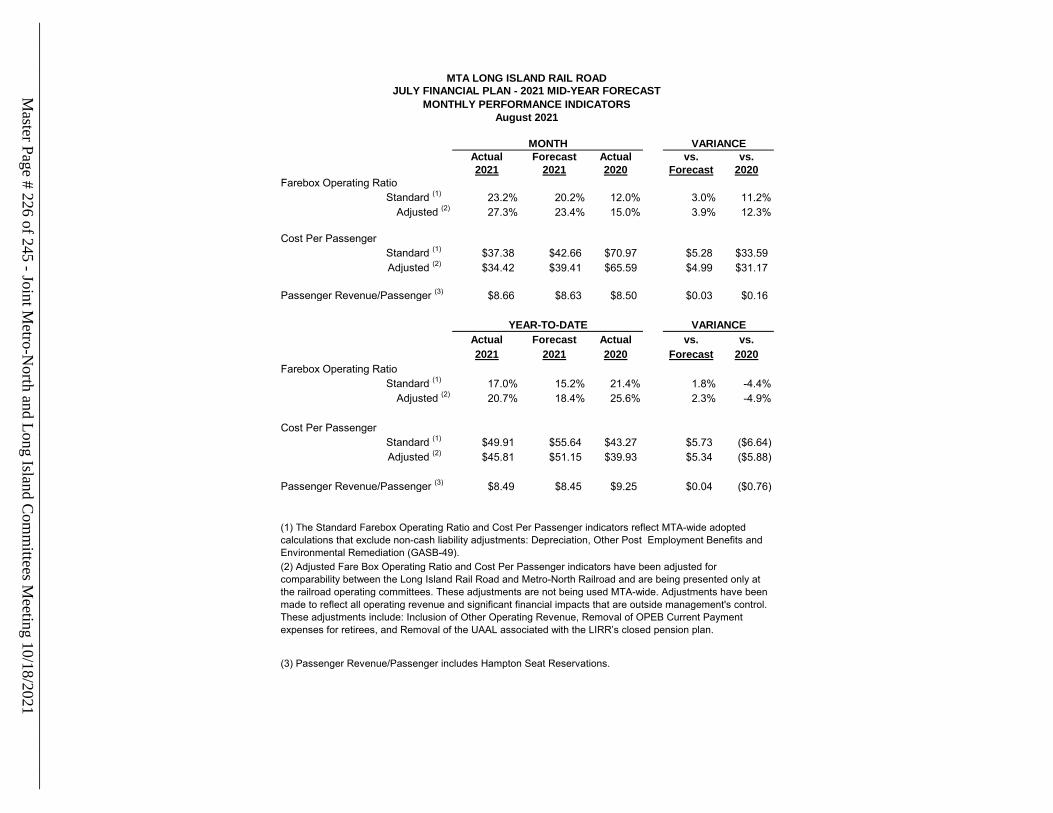
MONTH VARIANCEActual Forecast Actual vs. vs.2021 2021 2020 Forecast 2020
Farebox Operating RatioStandard (1)(1) 23.2% 20.2% 12.0% 3.0% 11.2%
Adjusted (2) 27.3% 23.4% 15.0% 3.9% 12.3%
Cost Per PassengerStandard (1)(1) $37.38 $42.66 $70.97 $5.28 $33.59Adjusted (2)(2) $34.42 $39.41 $65.59 $4.99 $31.17
Passenger Revenue/Passenger (3) $8.66 $8.63 $8.50 $0.03 $0.16
YEAR-TO-DATE VARIANCEActual Forecast Actual vs. vs.2021 2021 2020 Forecast 2020
Farebox Operating RatioStandard (1)(1) 17.0% 15.2% 21.4% 1.8% -4.4%
Adjusted (2) 20.7% 18.4% 25.6% 2.3% -4.9%
Cost Per PassengerStandard (1)(1) $49.91 $55.64 $43.27 $5.73 ($6.64)Adjusted (2)(2) $45.81 $51.15 $39.93 $5.34 ($5.88)
Passenger Revenue/Passenger (3) $8.49 $8.45 $9.25 $0.04 ($0.76)
(3) Passenger Revenue/Passenger includes Hampton Seat Reservations.
MTA LONG ISLAND RAIL ROADJULY FINANCIAL PLAN - 2021 MID-YEAR FORECAST
MONTHLY PERFORMANCE INDICATORSAugust 2021
(1) The Standard Farebox Operating Ratio and Cost Per Passenger indicators reflect MTA-wide adopted calculations that exclude non-cash liability adjustments: Depreciation, Other Post Employment Benefits and Environmental Remediation (GASB-49).(2) Adjusted Fare Box Operating Ratio and Cost Per Passenger indicators have been adjusted for comparability between the Long Island Rail Road and Metro-North Railroad and are being presented only at the railroad operating committees. These adjustments are not being used MTA-wide. Adjustments have been made to reflect all operating revenue and significant financial impacts that are outside management's control. These adjustments include: Inclusion of Other Operating Revenue, Removal of OPEB Current Payment expenses for retirees, and Removal of the UAAL associated with the LIRR’s closed pension plan.
Master Page # 226 of 245 - Joint M
etro-North and Long Island C
omm
ittees Meeting 10/18/2021
________________________________________________________________________________
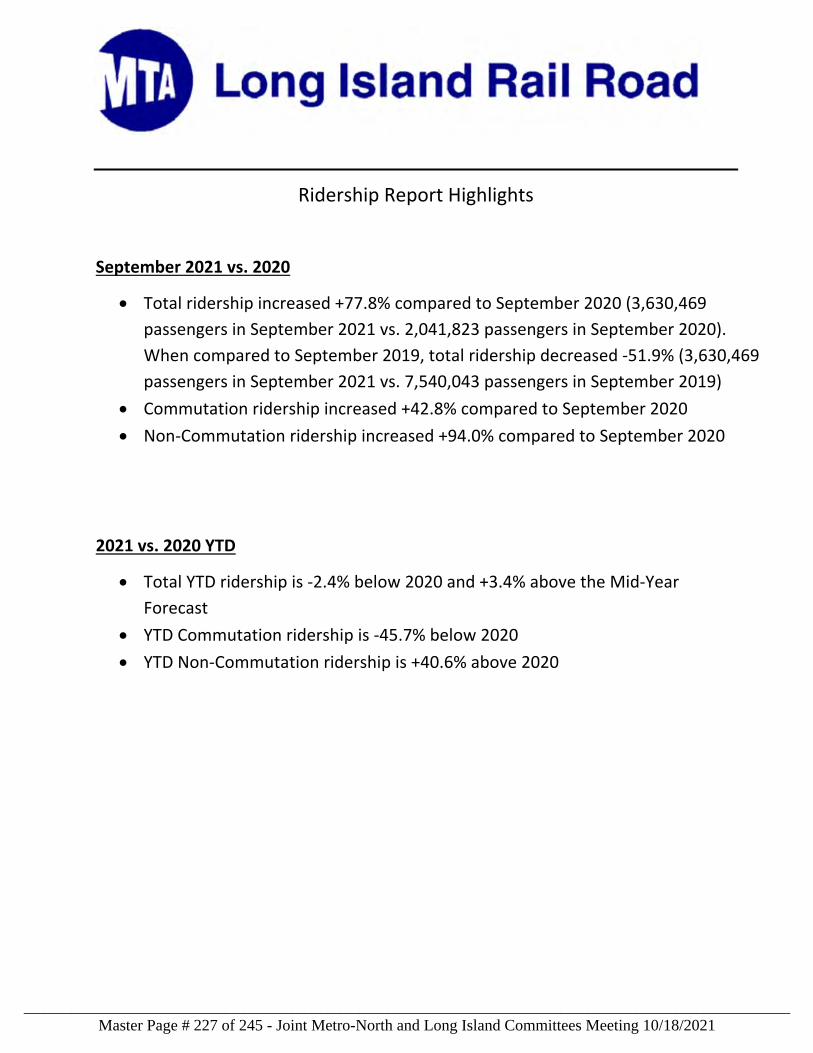
Ridership Report Highlights
September 2021 vs. 2020
Total ridership increased +77.8% compared to September 2020 (3,630,469
passengers in September 2021 vs. 2,041,823 passengers in September 2020).
When compared to September 2019, total ridership decreased ‐51.9% (3,630,469
passengers in September 2021 vs. 7,540,043 passengers in September 2019)
Commutation ridership increased +42.8% compared to September 2020
Non‐Commutation ridership increased +94.0% compared to September 2020
2021 vs. 2020 YTD
Total YTD ridership is ‐2.4% below 2020 and +3.4% above the Mid‐Year
Forecast
YTD Commutation ridership is ‐45.7% below 2020
YTD Non‐Commutation ridership is +40.6% above 2020
Master Page # 227 of 245 - Joint Metro-North and Long Island Committees Meeting 10/18/2021________________________________________________________________________________
MTA LONG ISLAND RAIL ROAD
MONTHLY RIDERSHIP REPORT
September 2021
Master Page # 228 of 245 - Joint Metro-North and Long Island Committees Meeting 10/18/2021________________________________________________________________________________
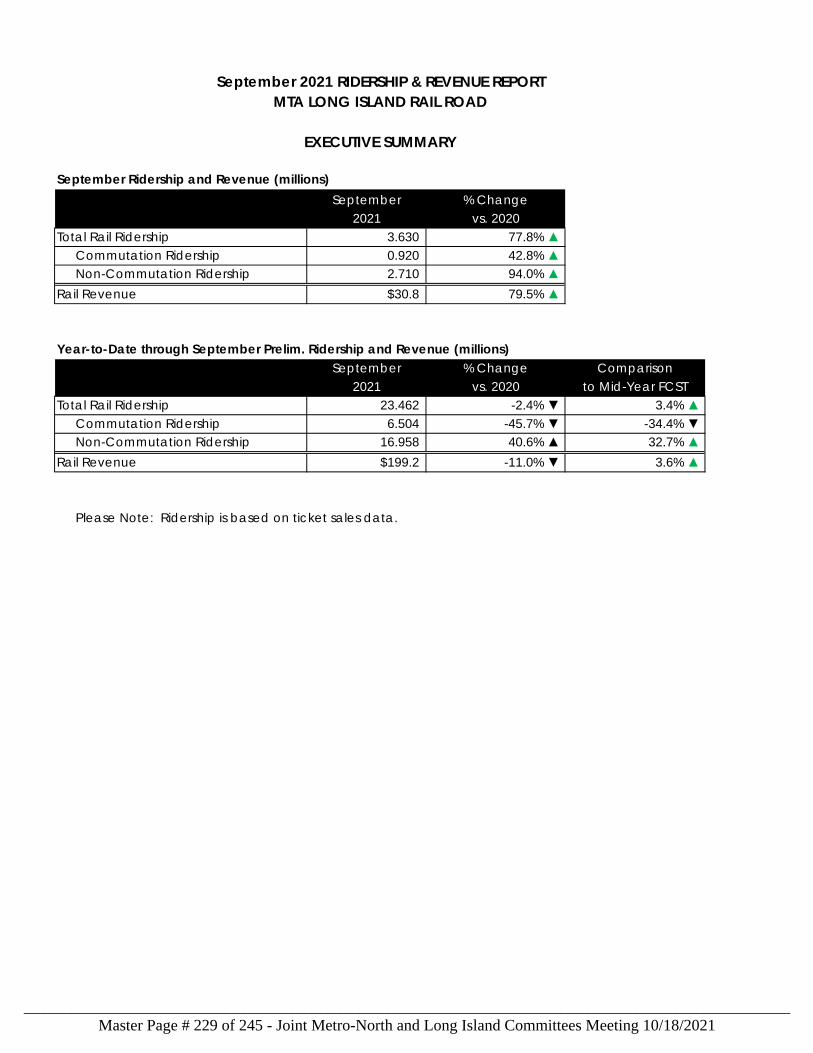
September Ridership and Revenue (millions)September
2021Total Rail Ridership 3.630 77.8% ▲
Commutation Ridership 0.920 42.8% ▲
Non-Commutation Ridership 2.710 94.0% ▲
Rail Revenue $30.8 79.5% ▲
Year-to-Date through September Prelim. Ridership and Revenue (millions)September
2021Total Rail Ridership 23.462 -2.4% ▼ 3.4% ▲
Commutation Ridership 6.504 -45.7% ▼ -34.4% ▼
Non-Commutation Ridership 16.958 40.6% ▲ 32.7% ▲
Rail Revenue $199.2 -11.0% ▼ 3.6% ▲
Please Note: Ridership is based on ticket sales data.
% Changevs. 2020
Comparisonto Mid-Year FCST
September 2021 RIDERSHIP & REVENUE REPORTMTA LONG ISLAND RAIL ROAD
% Changevs. 2020
EXECUTIVE SUMMARY
Master Page # 229 of 245 - Joint Metro-North and Long Island Committees Meeting 10/18/2021________________________________________________________________________________
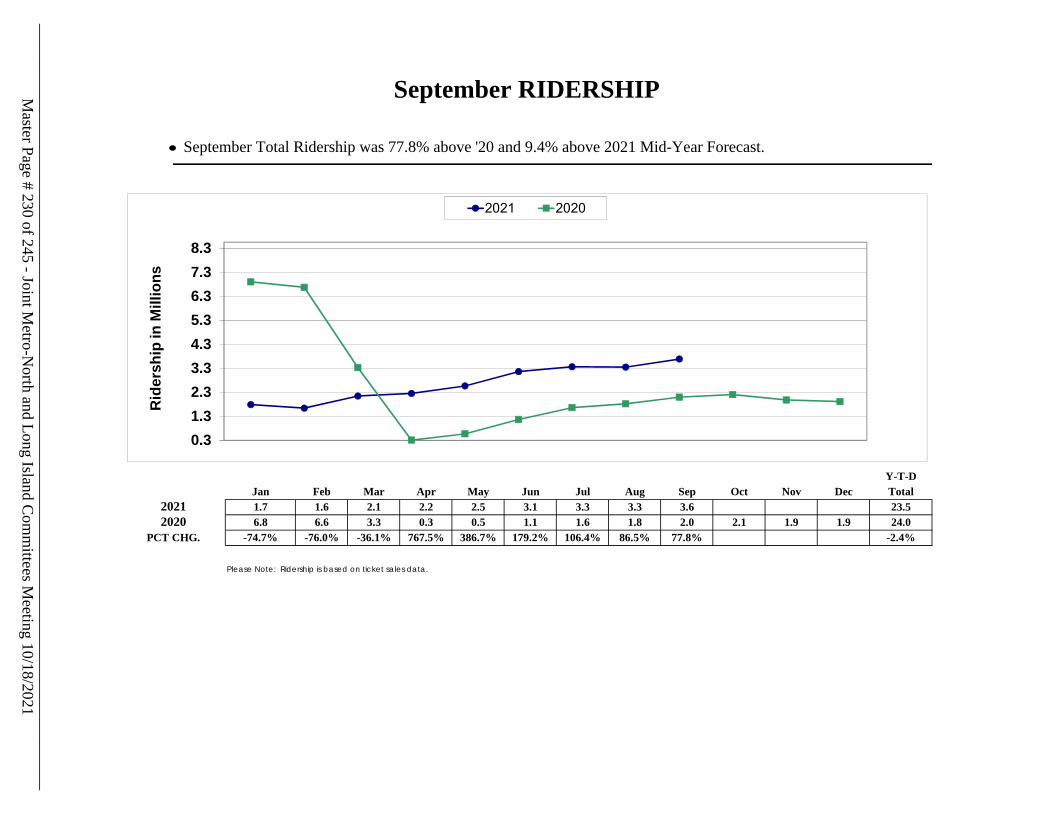
September Total Ridership was 77.8% above '20 and 9.4% above 2021 Mid-Year Forecast.
Y-T-DJan Feb Mar Apr May Jun Jul Aug Sep Oct Nov Dec Total1.7 1.6 2.1 2.2 2.5 3.1 3.3 3.3 3.6 23.56.8 6.6 3.3 0.3 0.5 1.1 1.6 1.8 2.0 2.1 1.9 1.9 24.0
-74.7% -76.0% -36.1% 767.5% 386.7% 179.2% 106.4% 86.5% 77.8% -2.4%
Please Note: Ridership is based on ticket sales data.
20212020
PCT CHG.
September RIDERSHIP
0.31.32.33.34.35.36.37.38.3
Rid
ersh
ip in
Mill
ions
2021 2020
Master Page # 230 of 245 - Joint M
etro-North and Long Island C
omm
ittees Meeting 10/18/2021
________________________________________________________________________________

September Commutation Ridership was 42.8% above '20 and -49.2% below 2021 Mid-Year Forecast.
Y-T-DJan Feb Mar Apr May Jun Jul Aug Sep Oct Nov Dec Total0.6 0.5 0.7 0.7 0.7 0.8 0.8 0.8 0.9 6.53.9 3.8 1.9 0.2 0.1 0.3 0.5 0.6 0.6 0.7 0.7 0.6 12.0
-84.8% -86.1% -63.0% 314.3% 380.9% 141.3% 55.7% 44.4% 42.8% -45.7%
Please Note: Ridership is based on ticket sales data.
20212020
PCT CHG.
September COMMUTATION RIDERSHIP
0.1
0.6
1.1
1.6
2.1
2.6
3.1
3.6
4.1
4.6
Rid
ersh
ip in
Mill
ions
2021 2020
Master Page # 231 of 245 - Joint M
etro-North and Long Island C
omm
ittees Meeting 10/18/2021
________________________________________________________________________________
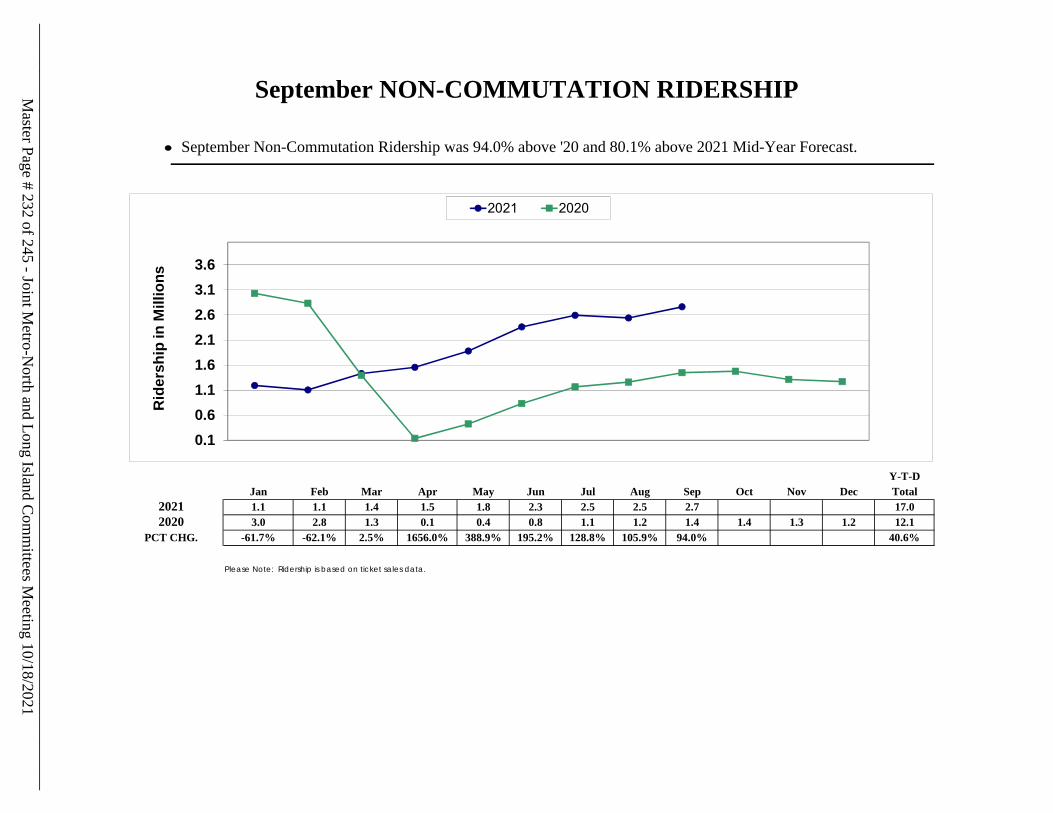
September Non-Commutation Ridership was 94.0% above '20 and 80.1% above 2021 Mid-Year Forecast.
Y-T-DJan Feb Mar Apr May Jun Jul Aug Sep Oct Nov Dec Total1.1 1.1 1.4 1.5 1.8 2.3 2.5 2.5 2.7 17.03.0 2.8 1.3 0.1 0.4 0.8 1.1 1.2 1.4 1.4 1.3 1.2 12.1
-61.7% -62.1% 2.5% 1656.0% 388.9% 195.2% 128.8% 105.9% 94.0% 40.6%
Please Note: Ridership is based on ticket sales data.
20212020
PCT CHG.
September NON-COMMUTATION RIDERSHIP
0.10.61.11.62.12.63.13.6
Rid
ersh
ip in
Mill
ions
2021 2020
Master Page # 232 of 245 - Joint M
etro-North and Long Island C
omm
ittees Meeting 10/18/2021
________________________________________________________________________________
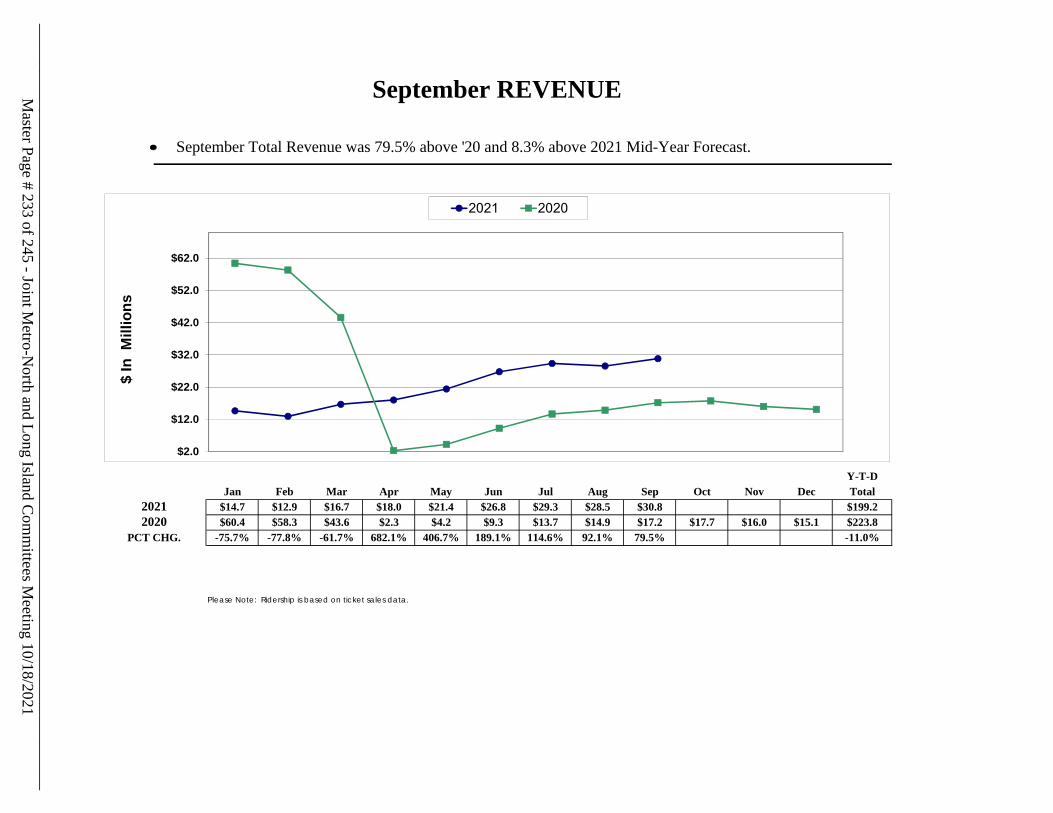
September Total Revenue was 79.5% above '20 and 8.3% above 2021 Mid-Year Forecast.
Y-T-DJan Feb Mar Apr May Jun Jul Aug Sep Oct Nov Dec Total
$14.7 $12.9 $16.7 $18.0 $21.4 $26.8 $29.3 $28.5 $30.8 $199.2$60.4 $58.3 $43.6 $2.3 $4.2 $9.3 $13.7 $14.9 $17.2 $17.7 $16.0 $15.1 $223.8
-75.7% -77.8% -61.7% 682.1% 406.7% 189.1% 114.6% 92.1% 79.5% -11.0%
Please Note: Ridership is based on ticket sales data.
20212020
PCT CHG.
September REVENUE
$2.0
$12.0
$22.0
$32.0
$42.0
$52.0
$62.0
$ In
Mill
ions
2021 2020
Master Page # 233 of 245 - Joint M
etro-North and Long Island C
omm
ittees Meeting 10/18/2021
________________________________________________________________________________
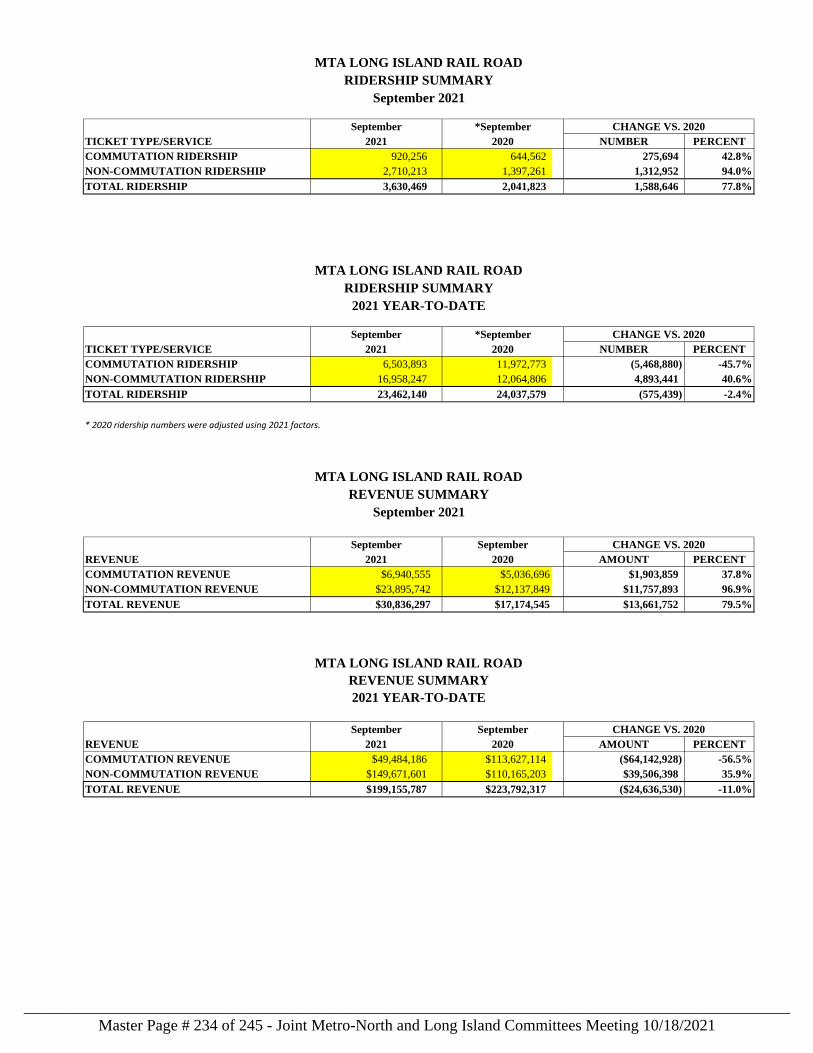
TICKET TYPE/SERVICE NUMBER PERCENTCOMMUTATION RIDERSHIP 920,256 644,562 275,694 42.8%NON-COMMUTATION RIDERSHIP 2,710,213 1,397,261 1,312,952 94.0%
TOTAL RIDERSHIP 3,630,469 2,041,823 1,588,646 77.8%
TICKET TYPE/SERVICE NUMBER PERCENTCOMMUTATION RIDERSHIP 6,503,893 11,972,773 (5,468,880) -45.7%NON-COMMUTATION RIDERSHIP 16,958,247 12,064,806 4,893,441 40.6%
TOTAL RIDERSHIP 23,462,140 24,037,579 (575,439) -2.4%
* 2020 ridership numbers were adjusted using 2021 factors.
REVENUE AMOUNT PERCENTCOMMUTATION REVENUE $6,940,555 $5,036,696 $1,903,859 37.8%NON-COMMUTATION REVENUE $23,895,742 $12,137,849 $11,757,893 96.9%
TOTAL REVENUE $30,836,297 $17,174,545 $13,661,752 79.5%
REVENUE AMOUNT PERCENTCOMMUTATION REVENUE $49,484,186 $113,627,114 ($64,142,928) -56.5%NON-COMMUTATION REVENUE $149,671,601 $110,165,203 $39,506,398 35.9%
TOTAL REVENUE $199,155,787 $223,792,317 ($24,636,530) -11.0%
MTA LONG ISLAND RAIL ROADRIDERSHIP SUMMARY
September 2021
September *September CHANGE VS. 2020
September *September CHANGE VS. 20202020
2021 2020
MTA LONG ISLAND RAIL ROADRIDERSHIP SUMMARY
2021 YEAR-TO-DATE
MTA LONG ISLAND RAIL ROADREVENUE SUMMARY
2021
2021 2020
MTA LONG ISLAND RAIL ROADREVENUE SUMMARY
September 2021
September September CHANGE VS. 2020
2021 2020
2021 YEAR-TO-DATE
September September CHANGE VS. 2020
Master Page # 234 of 245 - Joint Metro-North and Long Island Committees Meeting 10/18/2021________________________________________________________________________________
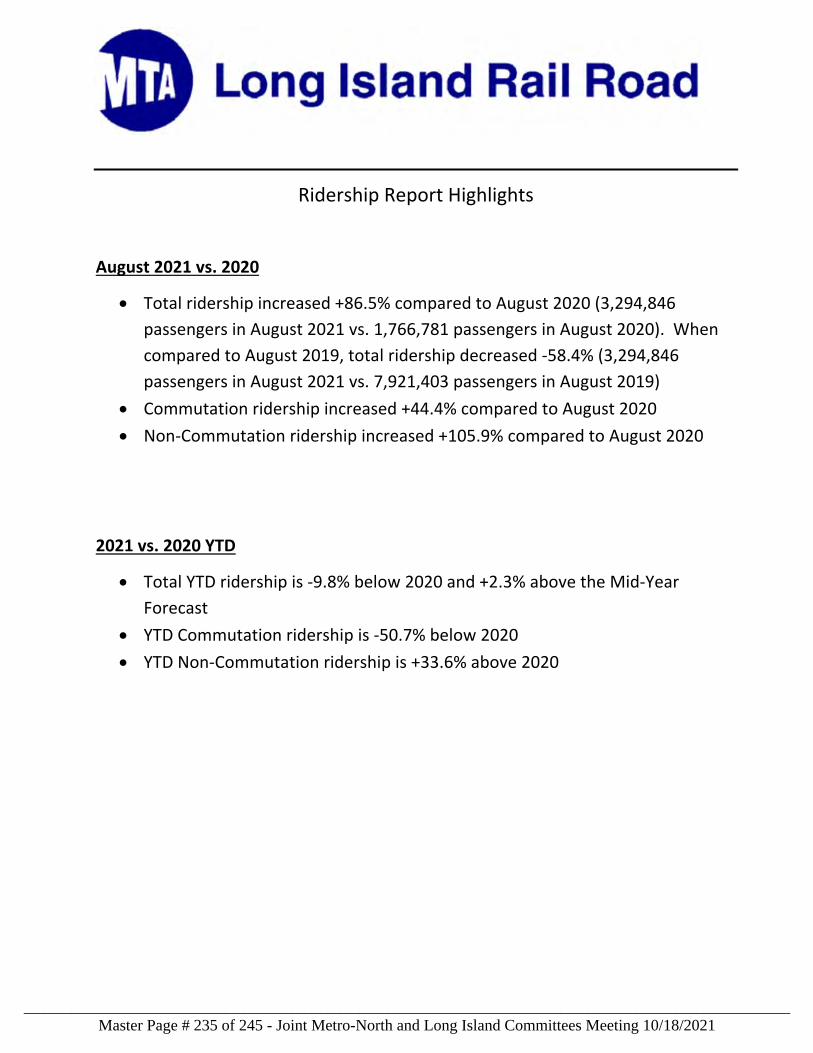
Ridership Report Highlights
August 2021 vs. 2020
Total ridership increased +86.5% compared to August 2020 (3,294,846
passengers in August 2021 vs. 1,766,781 passengers in August 2020). When
compared to August 2019, total ridership decreased ‐58.4% (3,294,846
passengers in August 2021 vs. 7,921,403 passengers in August 2019)
Commutation ridership increased +44.4% compared to August 2020
Non‐Commutation ridership increased +105.9% compared to August 2020
2021 vs. 2020 YTD
Total YTD ridership is ‐9.8% below 2020 and +2.3% above the Mid‐Year
Forecast
YTD Commutation ridership is ‐50.7% below 2020
YTD Non‐Commutation ridership is +33.6% above 2020
Master Page # 235 of 245 - Joint Metro-North and Long Island Committees Meeting 10/18/2021________________________________________________________________________________
MTA LONG ISLAND RAIL ROAD
MONTHLY RIDERSHIP REPORT
August 2021
Master Page # 236 of 245 - Joint Metro-North and Long Island Committees Meeting 10/18/2021________________________________________________________________________________

August Ridership and Revenue (millions)August
2021Total Rail Ridership 3.295 86.5% ▲
Commutation Ridership 0.806 44.4% ▲
Non-Commutation Ridership 2.489 105.9% ▲
Rail Revenue $28.5 92.1% ▲
Year-to-Date through August Prelim. Ridership and Revenue (millions)August
2021Total Rail Ridership 19.832 -9.8% ▼ 2.3% ▲
Commutation Ridership 5.584 -50.7% ▼ -31.1% ▼
Non-Commutation Ridership 14.248 33.6% ▲ 26.4% ▲
Rail Revenue $168.3 -18.5% ▼ 2.8% ▲
Please Note: Ridership is based on ticket sales data.
% Changevs. 2020
Comparisonto Mid-Year FCST
August 2021 RIDERSHIP & REVENUE REPORTMTA LONG ISLAND RAIL ROAD
% Changevs. 2020
EXECUTIVE SUMMARY
Master Page # 237 of 245 - Joint Metro-North and Long Island Committees Meeting 10/18/2021________________________________________________________________________________
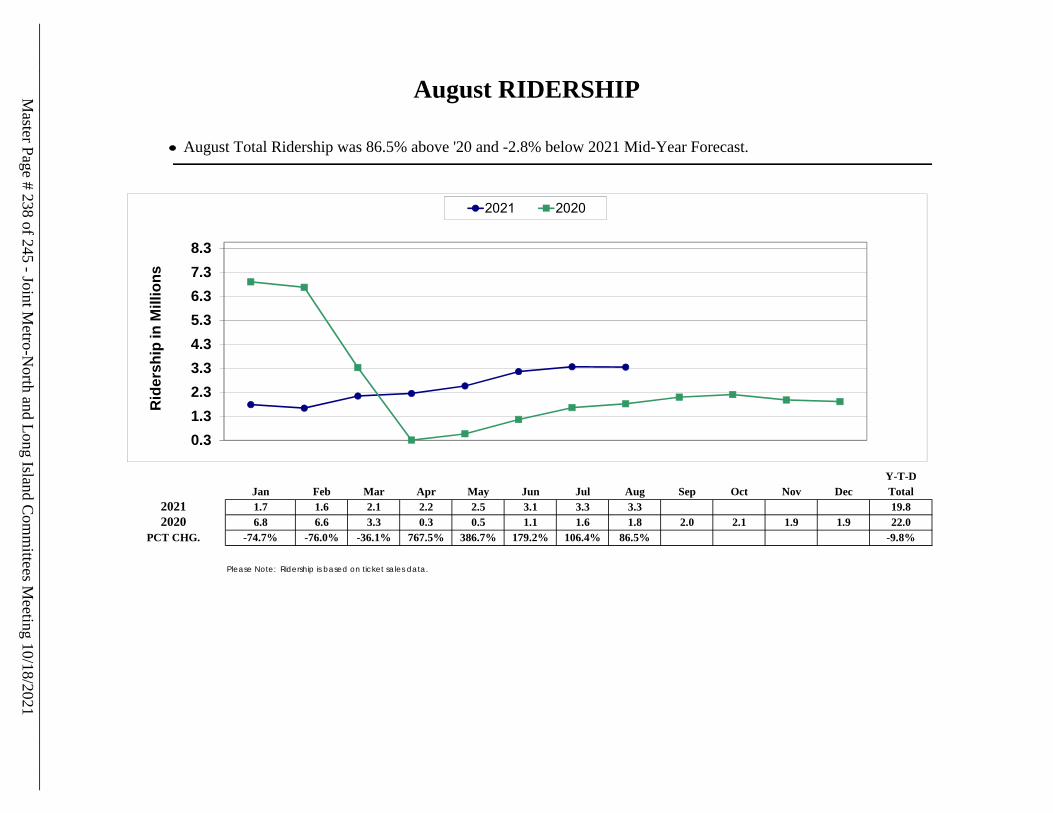
August Total Ridership was 86.5% above '20 and -2.8% below 2021 Mid-Year Forecast.
Y-T-DJan Feb Mar Apr May Jun Jul Aug Sep Oct Nov Dec Total1.7 1.6 2.1 2.2 2.5 3.1 3.3 3.3 19.86.8 6.6 3.3 0.3 0.5 1.1 1.6 1.8 2.0 2.1 1.9 1.9 22.0
-74.7% -76.0% -36.1% 767.5% 386.7% 179.2% 106.4% 86.5% -9.8%
Please Note: Ridership is based on ticket sales data.
20212020
PCT CHG.
August RIDERSHIP
0.31.32.33.34.35.36.37.38.3
Rid
ersh
ip in
Mill
ions
2021 2020
Master Page # 238 of 245 - Joint M
etro-North and Long Island C
omm
ittees Meeting 10/18/2021
________________________________________________________________________________
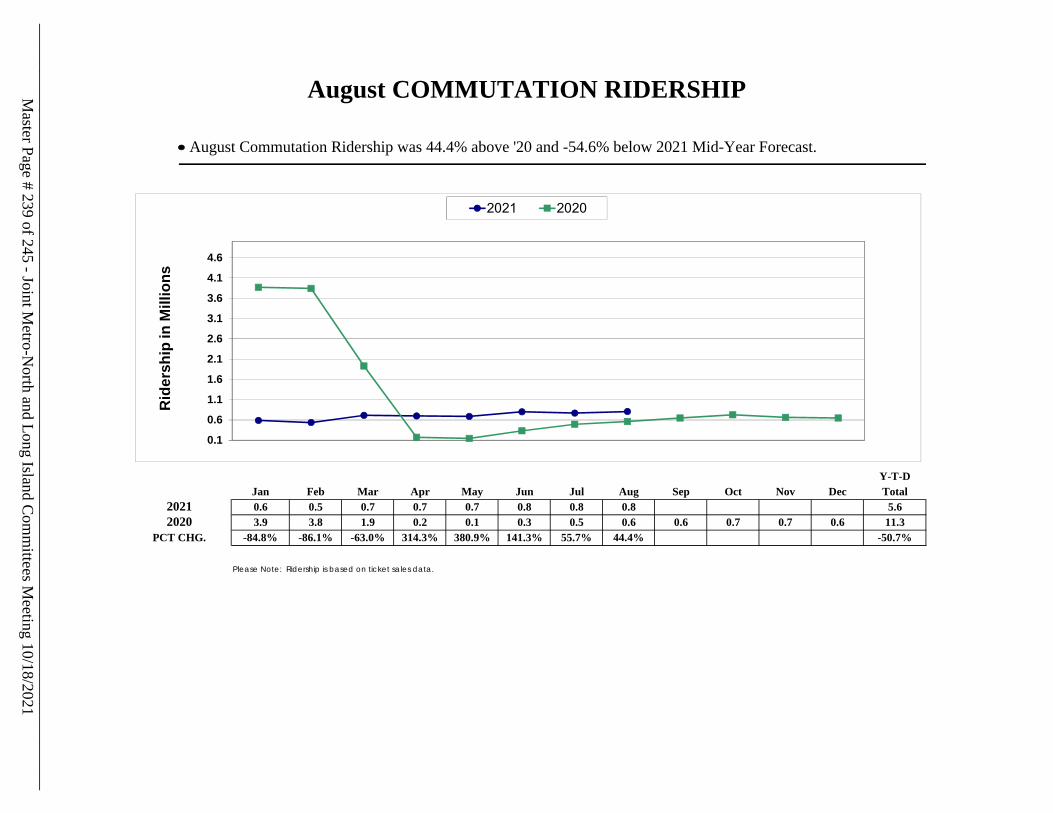
August Commutation Ridership was 44.4% above '20 and -54.6% below 2021 Mid-Year Forecast.
Y-T-DJan Feb Mar Apr May Jun Jul Aug Sep Oct Nov Dec Total0.6 0.5 0.7 0.7 0.7 0.8 0.8 0.8 5.63.9 3.8 1.9 0.2 0.1 0.3 0.5 0.6 0.6 0.7 0.7 0.6 11.3
-84.8% -86.1% -63.0% 314.3% 380.9% 141.3% 55.7% 44.4% -50.7%
Please Note: Ridership is based on ticket sales data.
20212020
PCT CHG.
August COMMUTATION RIDERSHIP
0.1
0.6
1.1
1.6
2.1
2.6
3.1
3.6
4.1
4.6
Rid
ersh
ip in
Mill
ions
2021 2020
Master Page # 239 of 245 - Joint M
etro-North and Long Island C
omm
ittees Meeting 10/18/2021
________________________________________________________________________________
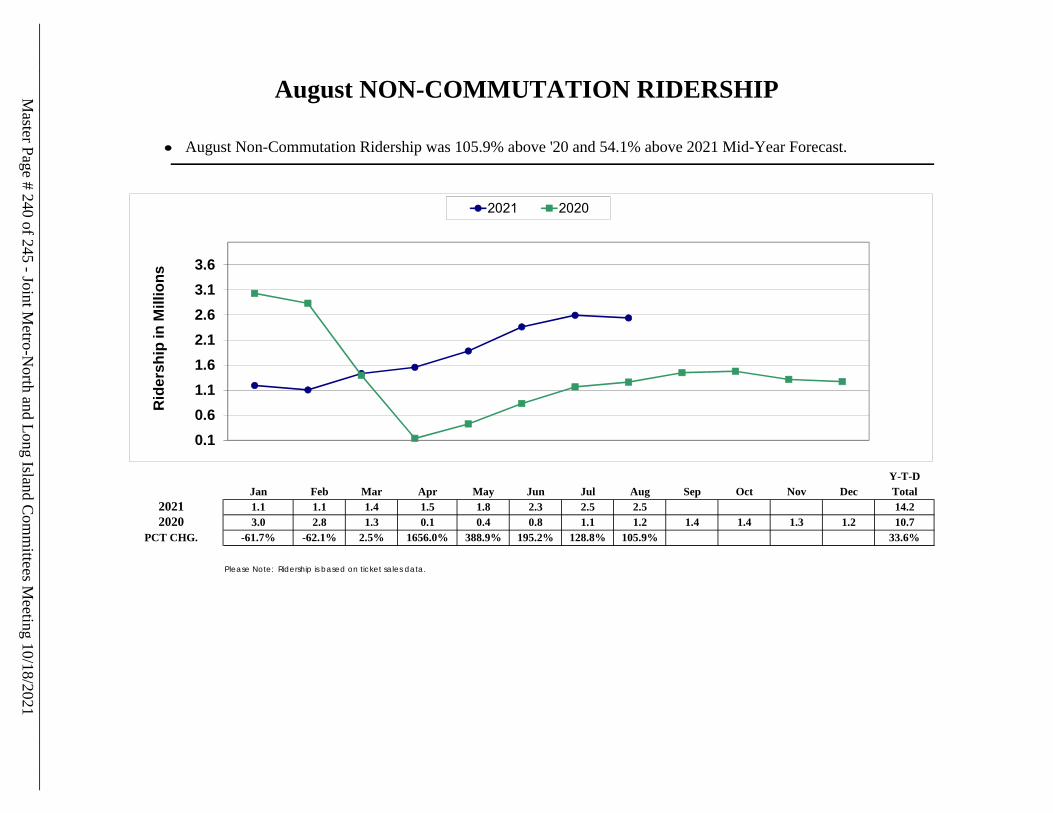
August Non-Commutation Ridership was 105.9% above '20 and 54.1% above 2021 Mid-Year Forecast.
Y-T-DJan Feb Mar Apr May Jun Jul Aug Sep Oct Nov Dec Total1.1 1.1 1.4 1.5 1.8 2.3 2.5 2.5 14.23.0 2.8 1.3 0.1 0.4 0.8 1.1 1.2 1.4 1.4 1.3 1.2 10.7
-61.7% -62.1% 2.5% 1656.0% 388.9% 195.2% 128.8% 105.9% 33.6%
Please Note: Ridership is based on ticket sales data.
20212020
PCT CHG.
August NON-COMMUTATION RIDERSHIP
0.10.61.11.62.12.63.13.6
Rid
ersh
ip in
Mill
ions
2021 2020
Master Page # 240 of 245 - Joint M
etro-North and Long Island C
omm
ittees Meeting 10/18/2021
________________________________________________________________________________
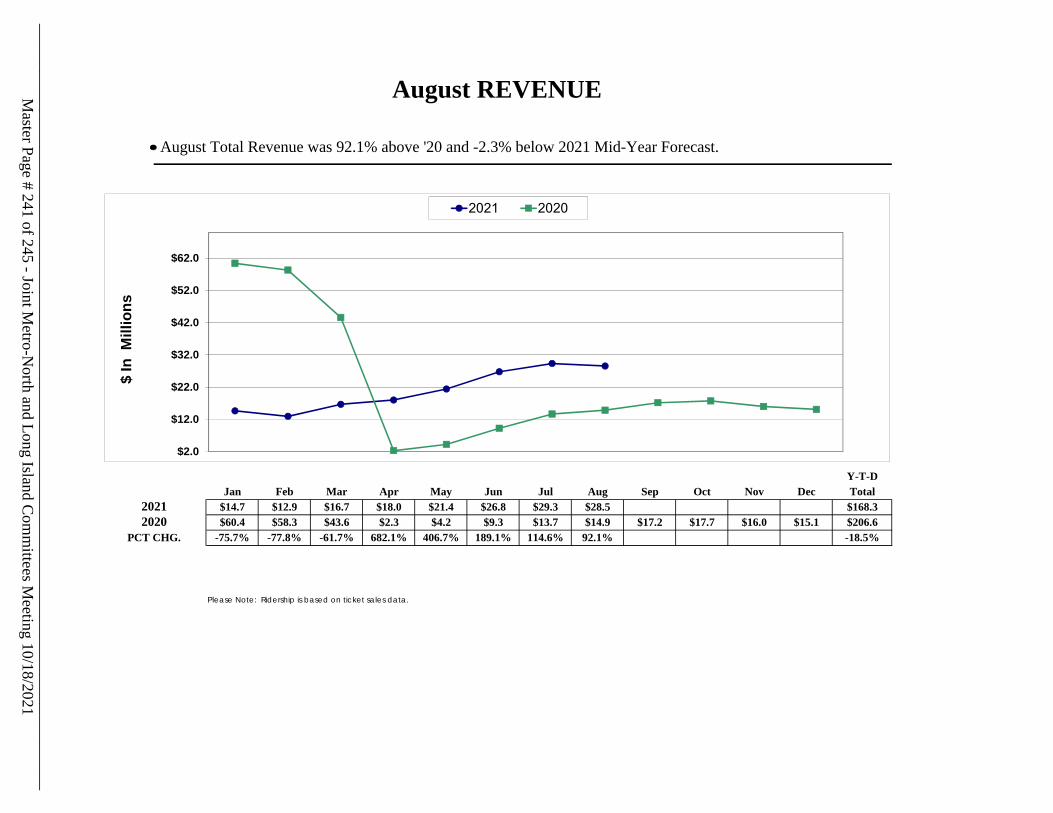
August Total Revenue was 92.1% above '20 and -2.3% below 2021 Mid-Year Forecast.
Y-T-DJan Feb Mar Apr May Jun Jul Aug Sep Oct Nov Dec Total
$14.7 $12.9 $16.7 $18.0 $21.4 $26.8 $29.3 $28.5 $168.3$60.4 $58.3 $43.6 $2.3 $4.2 $9.3 $13.7 $14.9 $17.2 $17.7 $16.0 $15.1 $206.6
-75.7% -77.8% -61.7% 682.1% 406.7% 189.1% 114.6% 92.1% -18.5%
Please Note: Ridership is based on ticket sales data.
20212020
PCT CHG.
August REVENUE
$2.0
$12.0
$22.0
$32.0
$42.0
$52.0
$62.0
$ In
Mill
ions
2021 2020
Master Page # 241 of 245 - Joint M
etro-North and Long Island C
omm
ittees Meeting 10/18/2021
________________________________________________________________________________

TICKET TYPE/SERVICE NUMBER PERCENTCOMMUTATION RIDERSHIP 805,699 557,800 247,899 44.4%NON-COMMUTATION RIDERSHIP 2,489,147 1,208,981 1,280,166 105.9%
TOTAL RIDERSHIP 3,294,846 1,766,781 1,528,065 86.5%
TICKET TYPE/SERVICE NUMBER PERCENTCOMMUTATION RIDERSHIP 5,583,637 11,328,211 (5,744,574) -50.7%NON-COMMUTATION RIDERSHIP 14,248,034 10,667,545 3,580,489 33.6%
TOTAL RIDERSHIP 19,831,671 21,995,756 (2,164,085) -9.8%
* 2020 ridership numbers were adjusted using 2021 factors.
REVENUE AMOUNT PERCENTCOMMUTATION REVENUE $5,942,315 $4,299,883 $1,642,433 38.2%NON-COMMUTATION REVENUE $22,604,230 $10,559,739 $12,044,491 114.1%
TOTAL REVENUE $28,546,545 $14,859,622 $13,686,923 92.1%
REVENUE AMOUNT PERCENTCOMMUTATION REVENUE $42,543,631 $108,590,418 ($66,046,787) -60.8%NON-COMMUTATION REVENUE $125,775,859 $98,027,353 $27,748,505 28.3%
TOTAL REVENUE $168,319,489 $206,617,771 ($38,298,282) -18.5%
2021 2020
2021 YEAR-TO-DATE
August August CHANGE VS. 2020
MTA LONG ISLAND RAIL ROADREVENUE SUMMARY
August 2021
August August CHANGE VS. 2020
MTA LONG ISLAND RAIL ROADREVENUE SUMMARY
2021
2021 2020
August *August CHANGE VS. 20202020
2021 2020
MTA LONG ISLAND RAIL ROADRIDERSHIP SUMMARY
2021 YEAR-TO-DATE
MTA LONG ISLAND RAIL ROADRIDERSHIP SUMMARY
August 2021
August *August CHANGE VS. 2020
Master Page # 242 of 245 - Joint Metro-North and Long Island Committees Meeting 10/18/2021________________________________________________________________________________
CAPITAL PROGRAM REPORT
Master Page # 243 of 245 - Joint Metro-North and Long Island Committees Meeting 10/18/2021________________________________________________________________________________
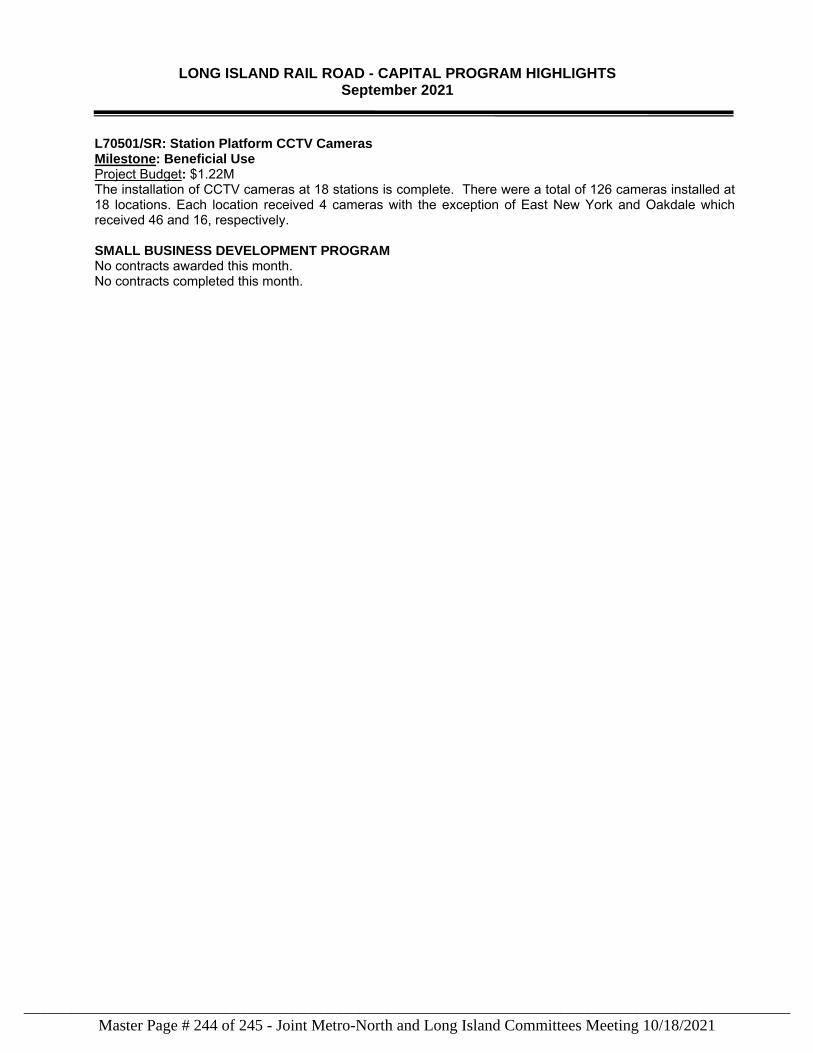
LONG ISLAND RAIL ROAD - CAPITAL PROGRAM HIGHLIGHTS
September 2021
L70501/SR: Station Platform CCTV Cameras Milestone: Beneficial Use Project Budget: $1.22M The installation of CCTV cameras at 18 stations is complete. There were a total of 126 cameras installed at 18 locations. Each location received 4 cameras with the exception of East New York and Oakdale which received 46 and 16, respectively. SMALL BUSINESS DEVELOPMENT PROGRAM No contracts awarded this month. No contracts completed this month.
Master Page # 244 of 245 - Joint Metro-North and Long Island Committees Meeting 10/18/2021________________________________________________________________________________
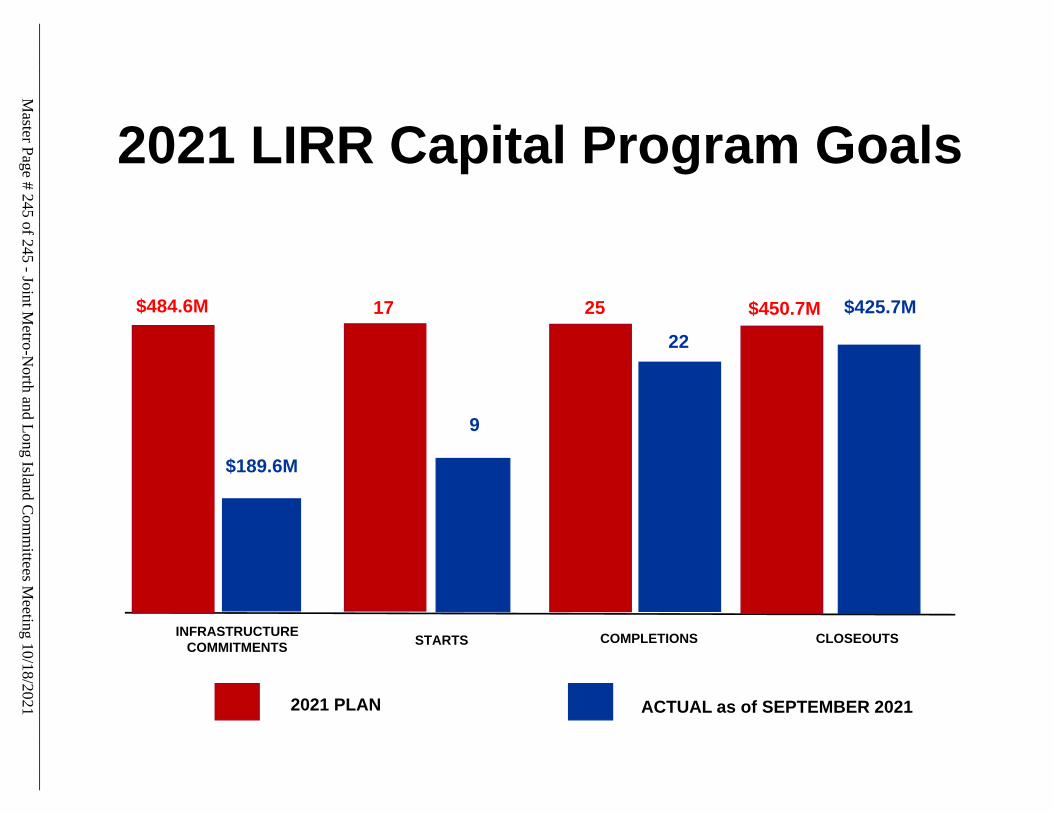
2021 LIRR Capital Program Goals
2021 PLAN
INFRASTRUCTURE COMMITMENTS STARTS CLOSEOUTSCOMPLETIONS
$484.6M
$189.6M
ACTUAL as of SEPTEMBER 2021
$450.7M2517
22
$425.7M
9
Master Page # 245 of 245 - Joint M
etro-North and Long Island C
omm
ittees Meeting 10/18/2021
________________________________________________________________________________