Embed Size (px)
Citation preview
Color gradient or Image placeholder
Research Institute
October 2019
The changing face of companies
Thought leadership from Credit Suisse and the world’s foremost experts
The CS Gender 3000 in 2019:
2
Editorial
To drive real change and increase gender diversity in business, we all need access to reliable and comprehensive data. The Credit Suisse Research Institute (CSRI) has been researching gender diversity within the governance and executive leadership teams of companies since 2012. As we revisit this topic in 2019, there are heightened expectations from clients, investors, regulators, employees and other stakeholders around Environmental, Social and Governance (ESG) factors and how we work together to achieve the United Nations Sustainable Development Goals (SDGs).
With this backdrop, we see our research as a unique and important contribution to the discus-sion on gender diversity and finding ways to make progress. Our research approach has allowed us to not only conduct a global analysis of board diversity, but also assess the roles of women in and around the C-Suite, having built out the gender mix of the executive teams of over 3,000 companies stretching across 56 countries and comprising 30,000 executive positions; the CS Gender 3000.
Now to what we found through the research. While we see increasing gender diversity in the boardroom, which has encouragingly doubled during the decade, it is a different story for senior executive positions, where progress has lagged. Barely 5% of the CS Gender 3000 companies have female CEOs and less than 15% have female CFOs. Regionally, North America and APAC reflect greater management diversity than we see in Europe. Asian economies have propor-tionally the most CEOs and CFOs.
In our view, a consideration of diversity in execu-tive management as well as the boardroom is of key importance to really assess the impact of en-hanced diversity in the workplace and its specific relevance for shareholders. Hence, we look to see if any visible correlation exists between metrics of management diversity and share-price perfor-mance. As we examine share-price performance
and the relative profitability across companies, we find that companies with more women in senior management do appear to yield superior returns.
While we isolate gender diversity as a differentiat-ing characteristic of companies in our analysis, we do not assert cause and effect. Share prices are always a function of a company’s business model and the level and variability of the returns it gener-ates. How, and if, diversity contributes to strategic decision-making to deliver these outcomes is the key rather than diversity per se.
Our 2019 edition presents new themes and analysis complementing our prior work. We focus on the business model of family businesses, which has been a rich seam of prior research from the CSRI. Here we put a spotlight on businesses founded by women or with women in senior lead-ership roles. Among our findings, we see where women are in leadership roles, there is a greater consciousness of ESG factors and the UN SDGs.
Finally, we conduct a macro and demographic assessment of the labor-market dynamics for women and the frictions at work that potentially impact career progression, particularly where managerial roles are concerned. Among the policies and practices that need addressing to enhance mobility and flexibility is the gender pay gap. We provide a global depiction of the implica-tions and drivers of the gender pay gap.
We hope that our findings prove valuable and wish you an insightful and enjoyable read.
Urs RohnerChairman of the Board of Directors Credit Suisse Group AG
Iris BohnetAlbert Pratt Professor of Business and Government, Harvard UniversityMember of the Board of DirectorsCredit Suisse Group AG
The CS Gender 3000 in 2019: The changing face of companies 3
02 Editorial
04 The Credit Suisse Gender 3000 07 The CS Gender 3000 in 2019: From boardroom to “C-Suite”
19 Running the numbers: The “quality” premium 29 Gender diversity and family-owned companies
39 Aligning career and family: A macro perspective
51 The gender pay gap and the CS Gender 3000 59 Appendices
59 Current gender quotas and disclosure requirements 62 How has the CS Gender 3000 changed over time? 65 Financial metrics for the Gender 3000
68 General disclaimer / important information
AuthorsRichard KersleyEugene KlerkAnais BoussieBahar Sezer LongworthJoelle Anamootoo NatzkoffDarshana Ramji
ContributorsAkanksha KharbandaAmit Phillips
For more information, contact:
Richard Kersley Head of Global Thematic Research, Global MarketsCredit Suisse [email protected]
Patsy Doerr Global Head Diversity & InclusionCredit Suisse Securities (USA) LLC [email protected]
Credit Suisse Research Institute [email protected] credit-suisse.com/researchinstitute
4
The Credit Suisse Gender 3000
*Note: % of companies sampled from this country/region
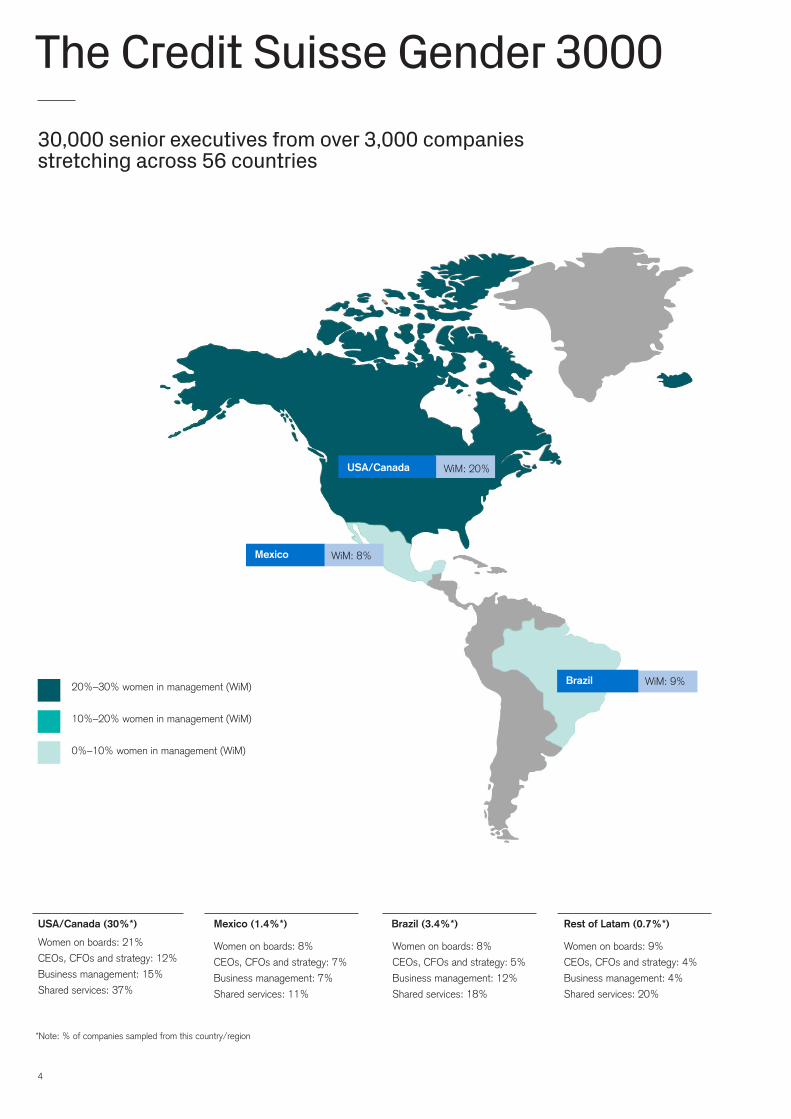
Women on boards: 21%
CEOs, CFOs and strategy: 12%
Business management: 15%
Shared services: 37%
USA/Canada (30%*)
Women on boards: 8%
CEOs, CFOs and strategy: 7%
Business management: 7%
Shared services: 11%
Mexico (1.4%*)
Women on boards: 8%
CEOs, CFOs and strategy: 5%
Business management: 12%
Shared services: 18%
Brazil (3.4%*)
Women on boards: 9%
CEOs, CFOs and strategy: 4%
Business management: 4%
Shared services: 20%
Rest of Latam (0.7%*)
10%–20% women in management (WiM)
0%–10% women in management (WiM)
20%–30% women in management (WiM)
WiM: 20% USA/Canada
WiM: 8% Mexico
WiM: 9% Brazil
30,000 senior executives from over 3,000 companies stretching across 56 countries
The CS Gender 3000 in 2019: The changing face of companies 5
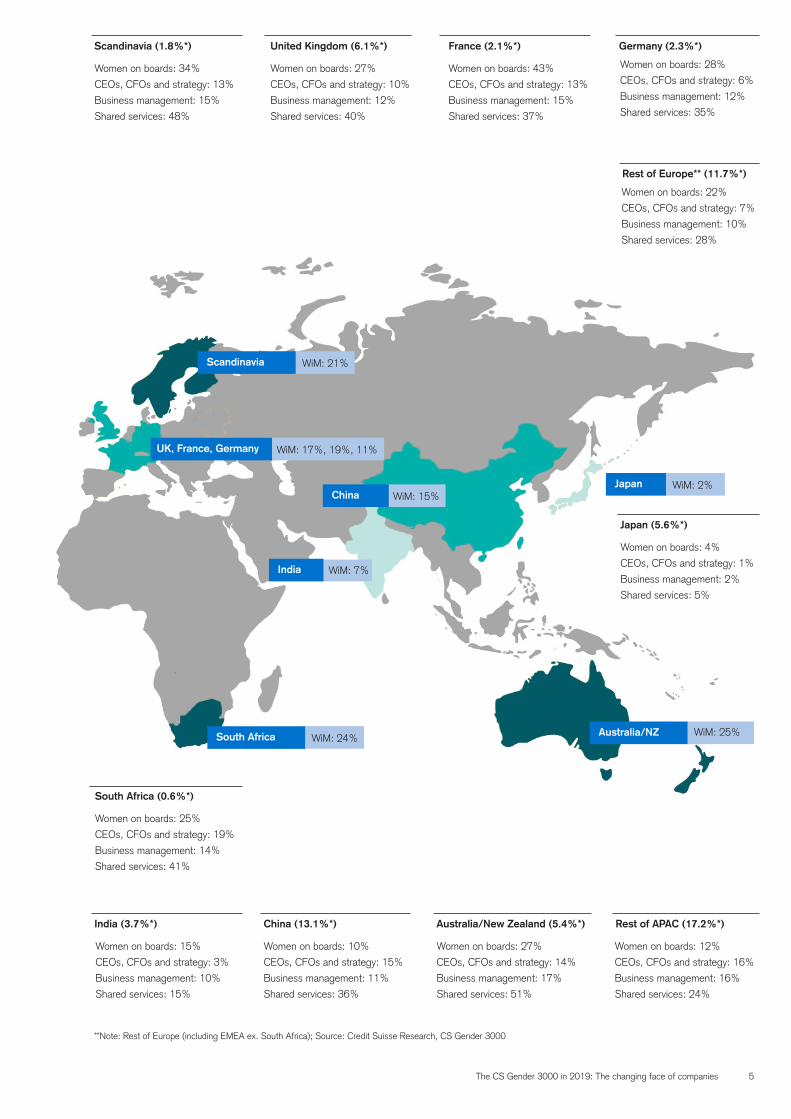
Women on boards: 27%
CEOs, CFOs and strategy: 10%
Business management: 12%
Shared services: 40%
United Kingdom (6.1%*)
Women on boards: 43%
CEOs, CFOs and strategy: 13%
Business management: 15%
Shared services: 37%
France (2.1%*)
Women on boards: 34%
CEOs, CFOs and strategy: 13%
Business management: 15%
Shared services: 48%
Scandinavia (1.8%*)
Women on boards: 28%
CEOs, CFOs and strategy: 6%
Business management: 12%
Shared services: 35%
Germany (2.3%*)
Women on boards: 22%
CEOs, CFOs and strategy: 7%
Business management: 10%
Shared services: 28%
Rest of Europe** (11.7%*)
Women on boards: 4%
CEOs, CFOs and strategy: 1%
Business management: 2%
Shared services: 5%
Japan (5.6%*)
Women on boards: 15%
CEOs, CFOs and strategy: 3%
Business management: 10%
Shared services: 15%
India (3.7%*)
Women on boards: 10%
CEOs, CFOs and strategy: 15%
Business management: 11%
Shared services: 36%
China (13.1%*)
Women on boards: 12%
CEOs, CFOs and strategy: 16%
Business management: 16%
Shared services: 24%
Rest of APAC (17.2%*)
Women on boards: 27%
CEOs, CFOs and strategy: 14%
Business management: 17%
Shared services: 51%
Australia/New Zealand (5.4%*)
**Note: Rest of Europe (including EMEA ex. South Africa); Source: Credit Suisse Research, CS Gender 3000
WiM: 24% South Africa
WiM: 21% Scandinavia
WiM: 17%, 19%, 11% UK, France, Germany
WiM: 15% China
WiM: 25% Australia/NZ
WiM: 2% Japan
WiM: 7% India
Women on boards: 25%
CEOs, CFOs and strategy: 19%
Business management: 14%
Shared services: 41%
South Africa (0.6%*)

6
The CS Gender 3000 in 2019: The changing face of companies 7
The CS Gender 3000 in 2019:From boardroom to “C-Suite”
CS Gender 3000: Women on boardsThe Gender 3000 is a global dataset built by Credit Suisse company analysts. It maps not only the gender diversity in the boardroom of our 3,100 companies, but also, and uniquely, the gender diversity of their executive management teams. The characteristics of both are clearly important, although they impact corporate perfor-mance in different ways. The former supervise, accordingly ensuring suitable governance, while the latter drive the management of the business
Richard Kersley, Bahar Sezer Longworth
and its immediate financial performance. Much of the research on this topic has focused on the make-up of the boardroom. As we show, the diversity among those with executive responsi-bilities are key for shareholders and, hence, the value in our unique study. There has been some turnover in the universe since we last published, reflecting the evolving geographic mix of our research coverage and new company listings, particularly in emerging markets. However, a core 75% of our universe is unchanged, permit-ting meaningful like-for-like comparisons. Our analysis is based on data as of August 2019.
The unique feature of Credit Suisse’s research on gender diversity has been the ability to draw off the knowledge base of our global company equity analysts to build a genuine bottom-up profile of the gender make-up of the corporate sector. It allows us to not only conduct a global analysis of board diversity but also, and crucially, the role of women in and around the “C-Suite.” In our view, an understanding of the latter is key if one wishes to really assess the impact of enhanced diversity in the workplace and its specific relevance for shareholders. In our 2019 study, we revisit this analysis with a complete refresh of our dataset.
Table 1: Regional sample distribution (1)2019 Gender 3000 universe i.e. unmatched dataset
Source: Credit Suisse Research, CS Gender 3000
2019
% sample size No. of companies
APxJ 36% 1105
Europe 23% 704
Japan 6% 175
Latam 5% 170
North America 31% 947
Table 2: Regional sample distribution (2)Constant 2019 and 2016 universe i.e. matched dataset
Source: Credit Suisse Research, CS Gender 3000
2019
% sample size No. of companies
APxJ 36% 830
Europe 24% 549
Japan 6% 129
Latam 6% 140
North America 28% 654
8
We begin with an analysis of the progress we have seen to improve the gender diversity mix in the boardroom. This remains a live issue for pol-icymakers and regulators, particularly in Europe, with an increasing number of quotas and targets of varying forms designed to address perceived imbalances. Norway introduced its quota law as far back as 2003 requiring all listed companies to have at least 40% female representation on boards. Other countries such as Spain, Finland, France, Italy and Belgium followed swiftly and introduced their own legislative and voluntary requirements to promote gender diversity. Please refer to Appendix 1 for a detailed overview of the current gender quotas for countries to see the new developments since our last Gender 3000 report.
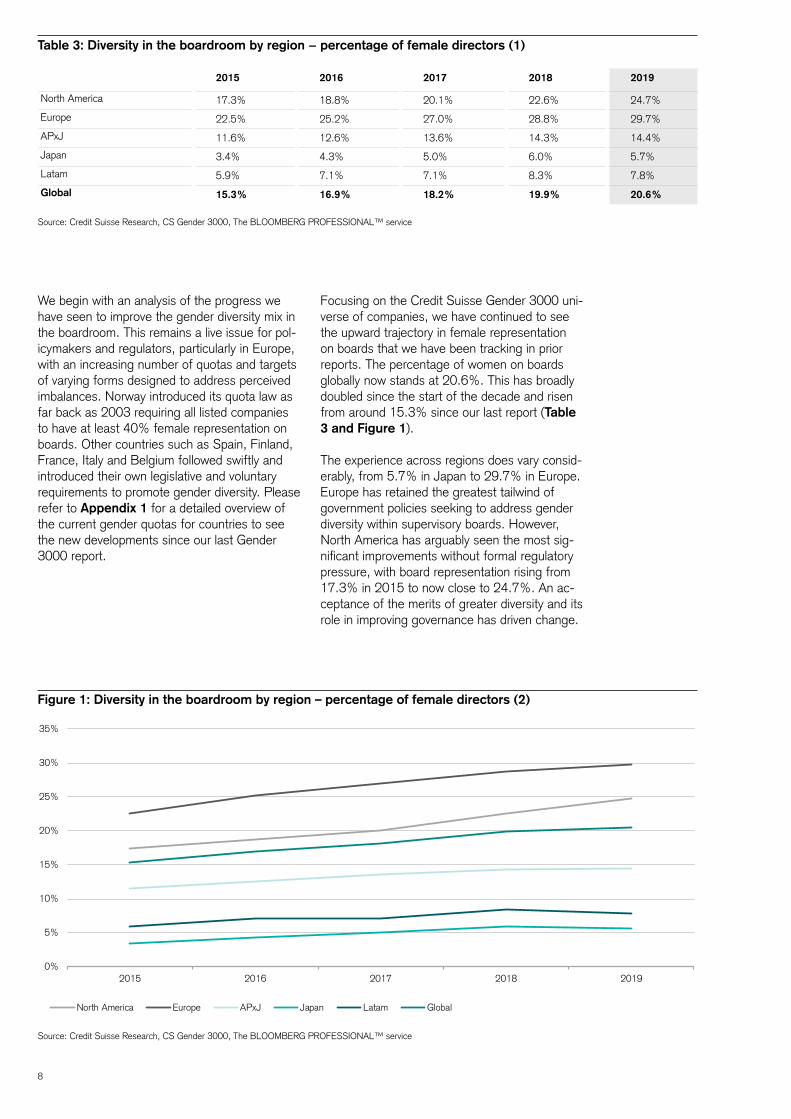
Table 3: Diversity in the boardroom by region − percentage of female directors (1)
Source: Credit Suisse Research, CS Gender 3000, The BLOOMBERG PROFESSIONAL™ service
2015 2016 2017 2018 2019
North America 17.3% 18.8% 20.1% 22.6% 24.7%
Europe 22.5% 25.2% 27.0% 28.8% 29.7%
APxJ 11.6% 12.6% 13.6% 14.3% 14.4%
Japan 3.4% 4.3% 5.0% 6.0% 5.7%
Latam 5.9% 7.1% 7.1% 8.3% 7.8%
Global 15.3% 16.9% 18.2% 19.9% 20.6%
Focusing on the Credit Suisse Gender 3000 uni-verse of companies, we have continued to see the upward trajectory in female representation on boards that we have been tracking in prior reports. The percentage of women on boards globally now stands at 20.6%. This has broadly doubled since the start of the decade and risen from around 15.3% since our last report (Table 3 and Figure 1).
The experience across regions does vary consid-erably, from 5.7% in Japan to 29.7% in Europe. Europe has retained the greatest tailwind of government policies seeking to address gender diversity within supervisory boards. However, North America has arguably seen the most sig-nificant improvements without formal regulatory pressure, with board representation rising from 17.3% in 2015 to now close to 24.7%. An ac-ceptance of the merits of greater diversity and its role in improving governance has driven change.
Figure 1: Diversity in the boardroom by region – percentage of female directors (2)
Source: Credit Suisse Research, CS Gender 3000, The BLOOMBERG PROFESSIONAL™ service
0%
5%
10%
15%
20%
25%
30%
35%
2015 2016 2017 2018 2019
North America Europe APxJ Japan Latam Global
The CS Gender 3000 in 2019: The changing face of companies 9
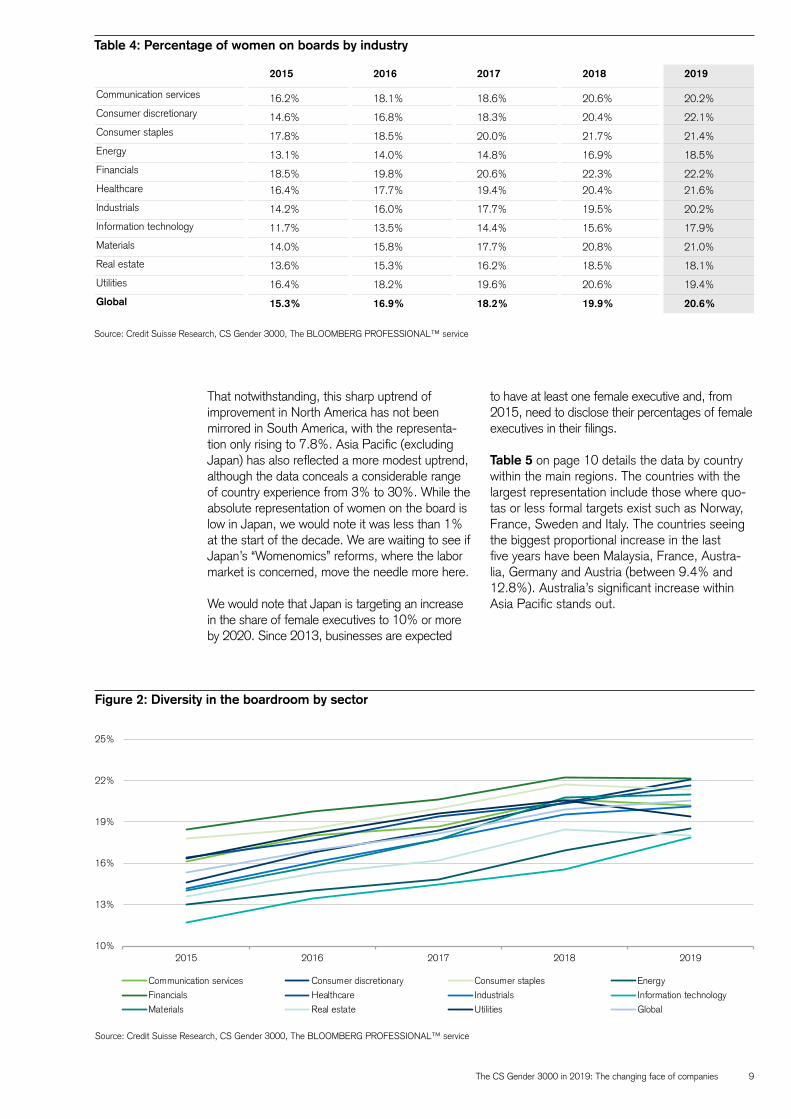
Table 4: Percentage of women on boards by industry
Source: Credit Suisse Research, CS Gender 3000, The BLOOMBERG PROFESSIONAL™ service
2015 2016 2017 2018 2019
Communication services 16.2% 18.1% 18.6% 20.6% 20.2%Consumer discretionary 14.6% 16.8% 18.3% 20.4% 22.1%Consumer staples 17.8% 18.5% 20.0% 21.7% 21.4%Energy 13.1% 14.0% 14.8% 16.9% 18.5%Financials 18.5% 19.8% 20.6% 22.3% 22.2%Healthcare 16.4% 17.7% 19.4% 20.4% 21.6%
Industrials 14.2% 16.0% 17.7% 19.5% 20.2%
Information technology 11.7% 13.5% 14.4% 15.6% 17.9%
Materials 14.0% 15.8% 17.7% 20.8% 21.0%
Real estate 13.6% 15.3% 16.2% 18.5% 18.1%
Utilities 16.4% 18.2% 19.6% 20.6% 19.4%
Global 15.3% 16.9% 18.2% 19.9% 20.6%
Figure 2: Diversity in the boardroom by sector
Source: Credit Suisse Research, CS Gender 3000, The BLOOMBERG PROFESSIONAL™ service
That notwithstanding, this sharp uptrend of improvement in North America has not been mirrored in South America, with the representa-tion only rising to 7.8%. Asia Pacific (excluding Japan) has also reflected a more modest uptrend, although the data conceals a considerable range of country experience from 3% to 30%. While the absolute representation of women on the board is low in Japan, we would note it was less than 1% at the start of the decade. We are waiting to see if Japan’s “Womenomics” reforms, where the labor market is concerned, move the needle more here.
We would note that Japan is targeting an increase in the share of female executives to 10% or more by 2020. Since 2013, businesses are expected
to have at least one female executive and, from 2015, need to disclose their percentages of female executives in their filings.
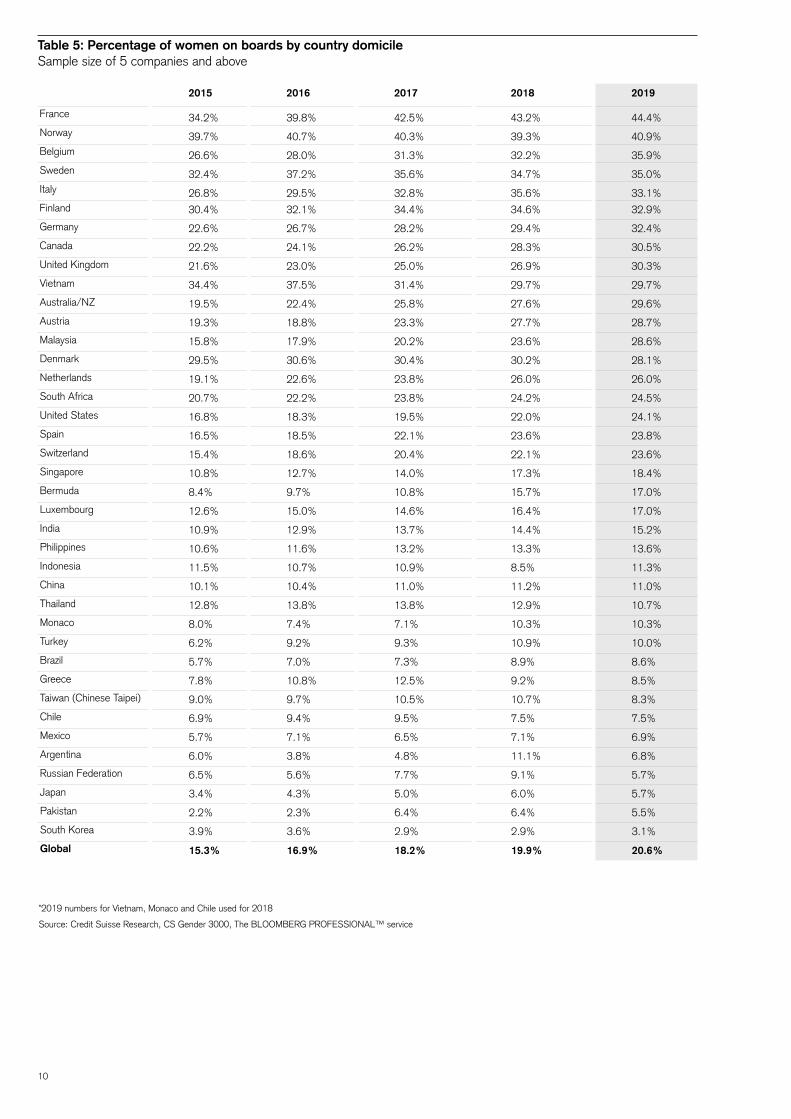
Table 5 on page 10 details the data by country within the main regions. The countries with the largest representation include those where quo-tas or less formal targets exist such as Norway, France, Sweden and Italy. The countries seeing the biggest proportional increase in the last five years have been Malaysia, France, Austra-lia, Germany and Austria (between 9.4% and 12.8%). Australia’s significant increase within Asia Pacific stands out.
10%
13%
16%
19%
22%
25%
2015 2016 2017 2018 2019
Communication services Consumer discretionary Consumer staples EnergyFinancials Healthcare Industrials Information technologyMaterials Real estate Utilities Global
10
Table 5: Percentage of women on boards by country domicileSample size of 5 companies and above
*2019 numbers for Vietnam, Monaco and Chile used for 2018
Source: Credit Suisse Research, CS Gender 3000, The BLOOMBERG PROFESSIONAL™ service
2015 2016 2017 2018 2019
France 34.2% 39.8% 42.5% 43.2% 44.4%Norway 39.7% 40.7% 40.3% 39.3% 40.9%Belgium 26.6% 28.0% 31.3% 32.2% 35.9%Sweden 32.4% 37.2% 35.6% 34.7% 35.0%Italy 26.8% 29.5% 32.8% 35.6% 33.1%Finland 30.4% 32.1% 34.4% 34.6% 32.9%
Germany 22.6% 26.7% 28.2% 29.4% 32.4%
Canada 22.2% 24.1% 26.2% 28.3% 30.5%
United Kingdom 21.6% 23.0% 25.0% 26.9% 30.3%
Vietnam 34.4% 37.5% 31.4% 29.7% 29.7%
Australia/NZ 19.5% 22.4% 25.8% 27.6% 29.6%
Austria 19.3% 18.8% 23.3% 27.7% 28.7%
Malaysia 15.8% 17.9% 20.2% 23.6% 28.6%
Denmark 29.5% 30.6% 30.4% 30.2% 28.1%
Netherlands 19.1% 22.6% 23.8% 26.0% 26.0%
South Africa 20.7% 22.2% 23.8% 24.2% 24.5%
United States 16.8% 18.3% 19.5% 22.0% 24.1%
Spain 16.5% 18.5% 22.1% 23.6% 23.8%
Switzerland 15.4% 18.6% 20.4% 22.1% 23.6%
Singapore 10.8% 12.7% 14.0% 17.3% 18.4%
Bermuda 8.4% 9.7% 10.8% 15.7% 17.0%
Luxembourg 12.6% 15.0% 14.6% 16.4% 17.0%
India 10.9% 12.9% 13.7% 14.4% 15.2%
Philippines 10.6% 11.6% 13.2% 13.3% 13.6%
Indonesia 11.5% 10.7% 10.9% 8.5% 11.3%
China 10.1% 10.4% 11.0% 11.2% 11.0%
Thailand 12.8% 13.8% 13.8% 12.9% 10.7%
Monaco 8.0% 7.4% 7.1% 10.3% 10.3%
Turkey 6.2% 9.2% 9.3% 10.9% 10.0%
Brazil 5.7% 7.0% 7.3% 8.9% 8.6%
Greece 7.8% 10.8% 12.5% 9.2% 8.5%
Taiwan (Chinese Taipei) 9.0% 9.7% 10.5% 10.7% 8.3%
Chile 6.9% 9.4% 9.5% 7.5% 7.5%
Mexico 5.7% 7.1% 6.5% 7.1% 6.9%
Argentina 6.0% 3.8% 4.8% 11.1% 6.8%
Russian Federation 6.5% 5.6% 7.7% 9.1% 5.7%
Japan 3.4% 4.3% 5.0% 6.0% 5.7%
Pakistan 2.2% 2.3% 6.4% 6.4% 5.5%
South Korea 3.9% 3.6% 2.9% 2.9% 3.1%
Global 15.3% 16.9% 18.2% 19.9% 20.6%
The CS Gender 3000 in 2019: The changing face of companies 11
Table 4 and Figure 2 break our universe down by industry group. We have recalibrated our industry classification from prior studies to reflect the new MSCI communications sector. Relative to past reports, we are seeing a significant change. Previously, we had reflected on a pattern of diversity by industry that was barely changing. While an executive pipeline influenced by tech-nical experience might hinder the development of leadership roles in management, in our view, there was less reason why a supervisory board in a given industry should lack diversity. The pattern was one of a greater representation of women within consumer, services and healthcare compa-nies, with a much lower representation among the boards of industrial, energy, materials and technology companies.
However, we now witness far less dispersion of gender representation across industry boards. The dispersion from high to low in 2015 was 6.1%. It has since shrunk to 4.3% at far higher percentage levels. Most notably, there has been a sharp increase in the representation of women on the boards of technology companies, a topic of active discussion. While it is still the lowest, the percentage representation of wom-en has increased by 6.2 percentage points. The previous low representation of women on the boards of energy companies has also risen by a similar proportion.
Contrasting levels of gender diversity still appear more a function of country, culture and regula-tion than being about industry stereotypes. The dispersion of diversity has narrowed by industry, but remains wide regionally. The reduced disper-
sion across industries is most notable in Europe where regulation has been most prominent in its influence.
How to move the needle?
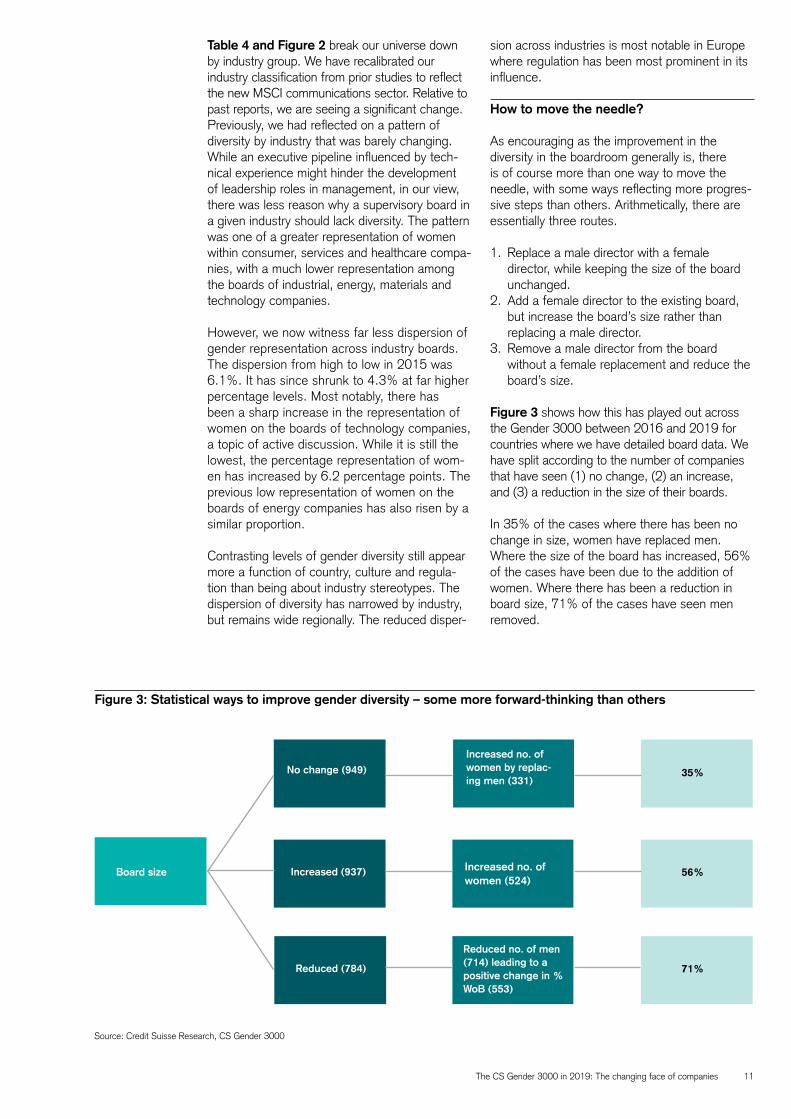
As encouraging as the improvement in the diversity in the boardroom generally is, there is of course more than one way to move the needle, with some ways reflecting more progres-sive steps than others. Arithmetically, there are essentially three routes.
1. Replace a male director with a female director, while keeping the size of the board unchanged.
2. Add a female director to the existing board, but increase the board’s size rather than replacing a male director.
3. Remove a male director from the board without a female replacement and reduce the board’s size.
Figure 3 shows how this has played out across the Gender 3000 between 2016 and 2019 for countries where we have detailed board data. We have split according to the number of companies that have seen (1) no change, (2) an increase, and (3) a reduction in the size of their boards.
In 35% of the cases where there has been no change in size, women have replaced men. Where the size of the board has increased, 56% of the cases have been due to the addition of women. Where there has been a reduction in board size, 71% of the cases have seen men removed.
Source: Credit Suisse Research, CS Gender 3000
Figure 3: Statistical ways to improve gender diversity – some more forward-thinking than others
Board size Increased (937) Increased no. of women (524)
56%
No change (949)Increased no. of women by replac-ing men (331)
35%
Reduced (784)
Reduced no. of men (714) leading to a positive change in % WoB (553)
71%
12
CS Gender 3000: Women in managementWhile an improving gender mix in the boardroom can only be viewed as positive given its associ-ated influence on governance and culture, how diversity manifests itself at the sharp end of executive decision-making is ultimately the key in our view, particularly when we consider the business model and performance of com-panies. For this reason, we established our unique Gender 3000 “women in management” dataset.
For the purpose of our analysis, we define a senior executive as someone at the highest level of management of an organization (i.e. at group level) and who is typically a member of the exec-utive management team or operating committee. These roles are distinct from the non-executive positions or the supervisory board. In total, we have mapped almost 30,000 chief executive of-ficers (CEOs), chief financial officers (CFOs) and other senior executives globally across our cov-erage universe. As referred to earlier, we have had some turnover in our sample since our 2016 report, although 75% of the coverage (around 2,300 companies) is common to both studies. Hence, we can and do make comparisons on a “matched” dataset, although the statistical results that emerge are not substantially different when making this adjustment.
We have grouped the senior executive roles into the following categories: CEO, CFO, Other Finance/Strategy, Business/Product Man-agement, IT, HR, and Other Shared Services. In our previous studies, we have termed this range of roles as representing “The Manage-ment Power Line” as it ranks the positions based on the level of influence on business strategy and direction as one moves away from
the CEO. This distinction is important when we come to analyze the mix of roles women occu-py and its skew. Not all management roles are created equal, nor is the gender distribution.
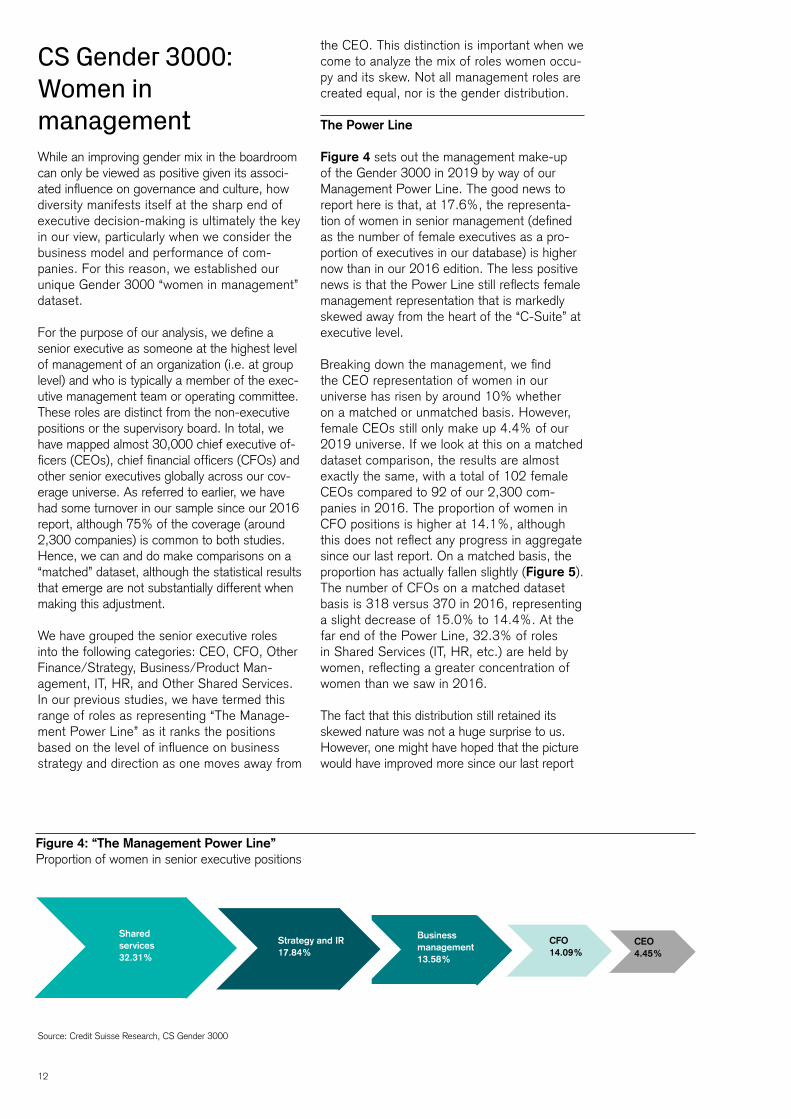
The Power Line
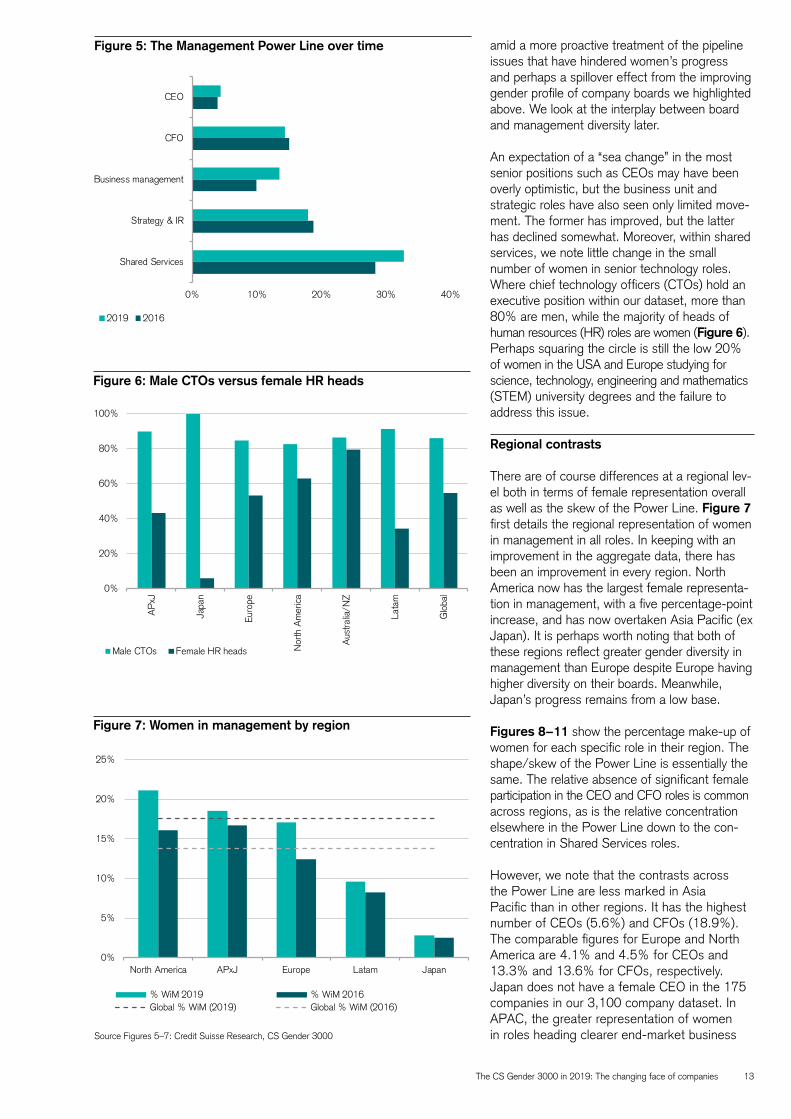
Figure 4 sets out the management make-up of the Gender 3000 in 2019 by way of our Management Power Line. The good news to report here is that, at 17.6%, the representa-tion of women in senior management (defined as the number of female executives as a pro-portion of executives in our database) is higher now than in our 2016 edition. The less positive news is that the Power Line still reflects female management representation that is markedly skewed away from the heart of the “C-Suite” at executive level.
Breaking down the management, we find the CEO representation of women in our universe has risen by around 10% whether on a matched or unmatched basis. However, female CEOs still only make up 4.4% of our 2019 universe. If we look at this on a matched dataset comparison, the results are almost exactly the same, with a total of 102 female CEOs compared to 92 of our 2,300 com-panies in 2016. The proportion of women in CFO positions is higher at 14.1%, although this does not reflect any progress in aggregate since our last report. On a matched basis, the proportion has actually fallen slightly (Figure 5). The number of CFOs on a matched dataset basis is 318 versus 370 in 2016, representing a slight decrease of 15.0% to 14.4%. At the far end of the Power Line, 32.3% of roles in Shared Services (IT, HR, etc.) are held by women, reflecting a greater concentration of women than we saw in 2016.
The fact that this distribution still retained its skewed nature was not a huge surprise to us. However, one might have hoped that the picture would have improved more since our last report
Figure 4: “The Management Power Line”Proportion of women in senior executive positions
Business management13.58%
Shared services32.31%
Strategy and IR17.84%
CFO14.09%
CEO4.45%
Source: Credit Suisse Research, CS Gender 3000
The CS Gender 3000 in 2019: The changing face of companies 13
amid a more proactive treatment of the pipeline issues that have hindered women’s progress and perhaps a spillover effect from the improving gender profile of company boards we highlighted above. We look at the interplay between board and management diversity later.
An expectation of a “sea change” in the most senior positions such as CEOs may have been overly optimistic, but the business unit and strategic roles have also seen only limited move-ment. The former has improved, but the latter has declined somewhat. Moreover, within shared services, we note little change in the small number of women in senior technology roles. Where chief technology officers (CTOs) hold an executive position within our dataset, more than 80% are men, while the majority of heads of human resources (HR) roles are women (Figure 6). Perhaps squaring the circle is still the low 20% of women in the USA and Europe studying for science, technology, engineering and mathematics (STEM) university degrees and the failure to address this issue.
Regional contrasts
There are of course differences at a regional lev-el both in terms of female representation overall as well as the skew of the Power Line. Figure 7 first details the regional representation of women in management in all roles. In keeping with an improvement in the aggregate data, there has been an improvement in every region. North America now has the largest female representa-tion in management, with a five percentage-point increase, and has now overtaken Asia Pacific (ex Japan). It is perhaps worth noting that both of these regions reflect greater gender diversity in management than Europe despite Europe having higher diversity on their boards. Meanwhile, Japan’s progress remains from a low base.
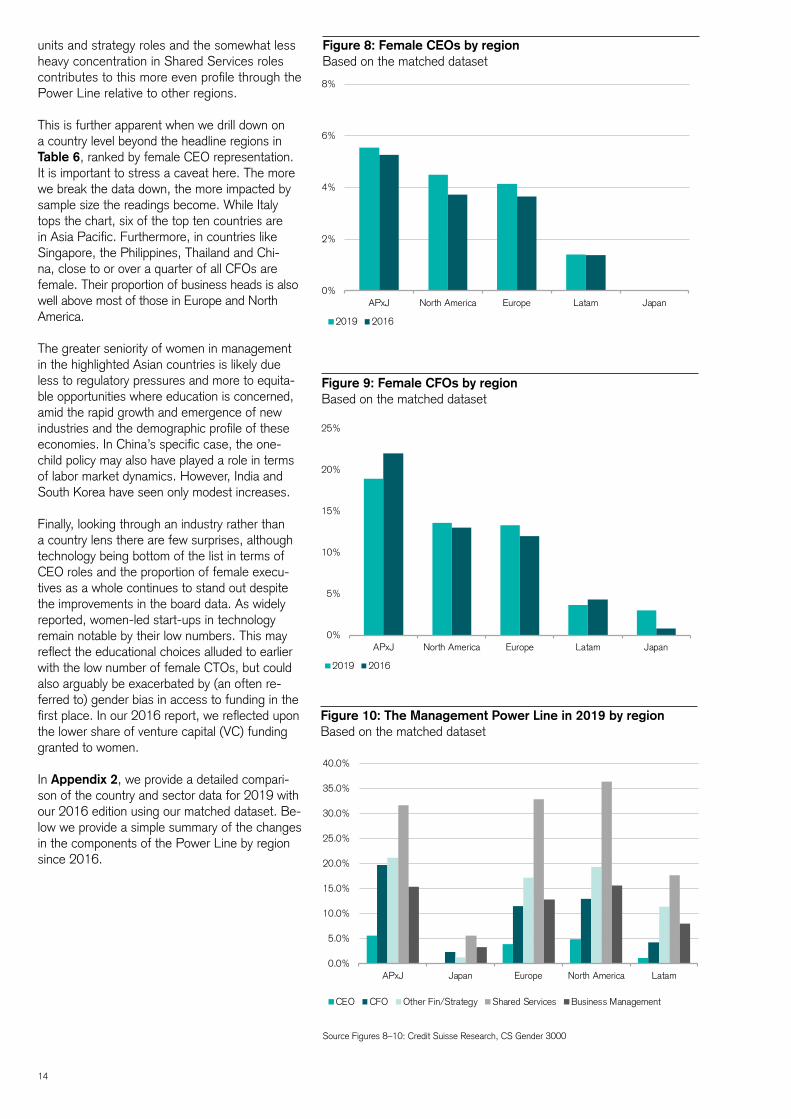
Figures 8−11 show the percentage make-up of women for each specific role in their region. The shape/skew of the Power Line is essentially the same. The relative absence of significant female participation in the CEO and CFO roles is common across regions, as is the relative concentration elsewhere in the Power Line down to the con-centration in Shared Services roles.
However, we note that the contrasts across the Power Line are less marked in Asia Pacific than in other regions. It has the highest number of CEOs (5.6%) and CFOs (18.9%). The comparable figures for Europe and North America are 4.1% and 4.5% for CEOs and 13.3% and 13.6% for CFOs, respectively. Japan does not have a female CEO in the 175 companies in our 3,100 company dataset. In APAC, the greater representation of women in roles heading clearer end-market business
Figure 5: The Management Power Line over time
Source Figures 5–7: Credit Suisse Research, CS Gender 3000
Figure 6: Male CTOs versus female HR heads
Figure 7: Women in management by region
0%
20%
40%
60%
80%
100%
AP
xJ
Japa
n
Euro
pe
Nor
th A
mer
ica
Aus
tralia
/NZ
Lata
m
Glo
bal
Male CTOs Female HR heads
0% 10% 20% 30% 40%
CEO
CFO
Business management
Strategy & IR
Shared Services
2019 2016
0%
5%
10%
15%
20%
25%
North America APxJ Europe Latam Japan
% WiM 2019 % WiM 2016Global % WiM (2019) Global % WiM (2016)
14
Figure 8: Female CEOs by regionBased on the matched dataset
Source Figures 8–10: Credit Suisse Research, CS Gender 3000
Figure 9: Female CFOs by regionBased on the matched dataset
Figure 10: The Management Power Line in 2019 by regionBased on the matched dataset
0.0%
5.0%
10.0%
15.0%
20.0%
25.0%
30.0%
35.0%
40.0%
APxJ Japan Europe North America Latam
CEO CFO Other Fin/Strategy Shared Services Business Management
units and strategy roles and the somewhat less heavy concentration in Shared Services roles contributes to this more even profile through the Power Line relative to other regions.
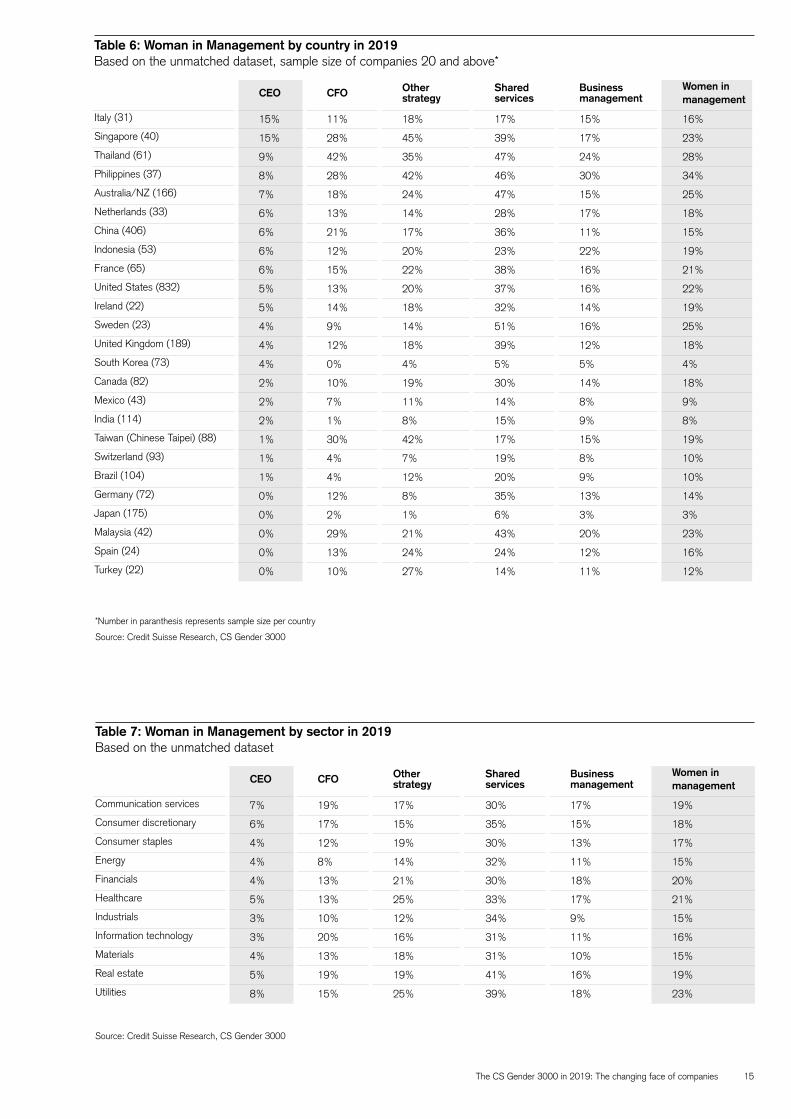
This is further apparent when we drill down on a country level beyond the headline regions in Table 6, ranked by female CEO representation. It is important to stress a caveat here. The more we break the data down, the more impacted by sample size the readings become. While Italy tops the chart, six of the top ten countries are in Asia Pacific. Furthermore, in countries like Singapore, the Philippines, Thailand and Chi-na, close to or over a quarter of all CFOs are female. Their proportion of business heads is also well above most of those in Europe and North America.
The greater seniority of women in management in the highlighted Asian countries is likely due less to regulatory pressures and more to equita-ble opportunities where education is concerned, amid the rapid growth and emergence of new industries and the demographic profile of these economies. In China’s specific case, the one-child policy may also have played a role in terms of labor market dynamics. However, India and South Korea have seen only modest increases.
Finally, looking through an industry rather than a country lens there are few surprises, although technology being bottom of the list in terms of CEO roles and the proportion of female execu-tives as a whole continues to stand out despite the improvements in the board data. As widely reported, women-led start-ups in technology remain notable by their low numbers. This may reflect the educational choices alluded to earlier with the low number of female CTOs, but could also arguably be exacerbated by (an often re-ferred to) gender bias in access to funding in the first place. In our 2016 report, we reflected upon the lower share of venture capital (VC) funding granted to women.
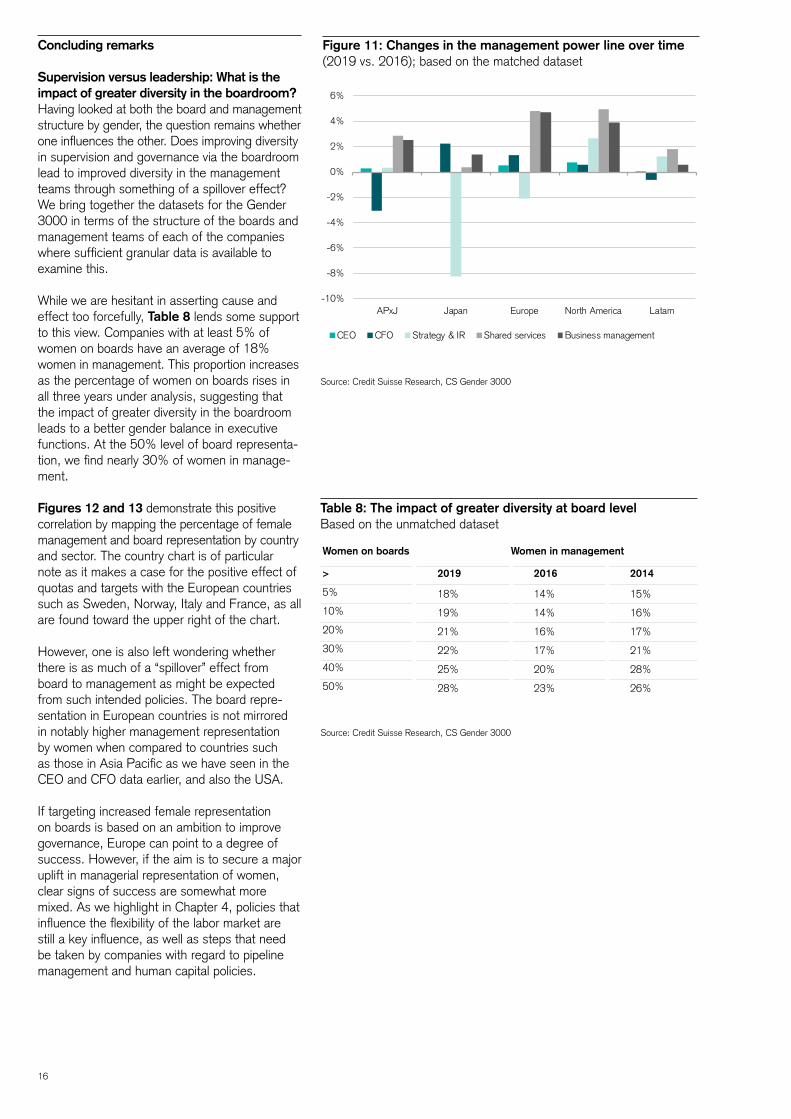
In Appendix 2, we provide a detailed compari-son of the country and sector data for 2019 with our 2016 edition using our matched dataset. Be-low we provide a simple summary of the changes in the components of the Power Line by region since 2016.
0%
2%
4%
6%
8%
APxJ North America Europe Latam Japan
2019 2016
0%
5%
10%
15%
20%
25%
APxJ North America Europe Latam Japan
2019 2016
The CS Gender 3000 in 2019: The changing face of companies 15
Table 6: Woman in Management by country in 2019Based on the unmatched dataset, sample size of companies 20 and above*
*Number in paranthesis represents sample size per country
Source: Credit Suisse Research, CS Gender 3000
CEO CFO Other strategy
Shared services
Business management
Women in management
Italy (31) 15% 11% 18% 17% 15% 16%
Singapore (40) 15% 28% 45% 39% 17% 23%
Thailand (61) 9% 42% 35% 47% 24% 28%
Philippines (37) 8% 28% 42% 46% 30% 34%
Australia/NZ (166) 7% 18% 24% 47% 15% 25%
Netherlands (33) 6% 13% 14% 28% 17% 18%
China (406) 6% 21% 17% 36% 11% 15%
Indonesia (53) 6% 12% 20% 23% 22% 19%
France (65) 6% 15% 22% 38% 16% 21%
United States (832) 5% 13% 20% 37% 16% 22%
Ireland (22) 5% 14% 18% 32% 14% 19%
Sweden (23) 4% 9% 14% 51% 16% 25%
United Kingdom (189) 4% 12% 18% 39% 12% 18%
South Korea (73) 4% 0% 4% 5% 5% 4%
Canada (82) 2% 10% 19% 30% 14% 18%
Mexico (43) 2% 7% 11% 14% 8% 9%
India (114) 2% 1% 8% 15% 9% 8%
Taiwan (Chinese Taipei) (88) 1% 30% 42% 17% 15% 19%
Switzerland (93) 1% 4% 7% 19% 8% 10%
Brazil (104) 1% 4% 12% 20% 9% 10%
Germany (72) 0% 12% 8% 35% 13% 14%
Japan (175) 0% 2% 1% 6% 3% 3%
Malaysia (42) 0% 29% 21% 43% 20% 23%
Spain (24) 0% 13% 24% 24% 12% 16%
Turkey (22) 0% 10% 27% 14% 11% 12%
Table 7: Woman in Management by sector in 2019Based on the unmatched dataset
Source: Credit Suisse Research, CS Gender 3000
CEO CFO Other strategy
Shared services
Business management
Women in management
Communication services 7% 19% 17% 30% 17% 19%
Consumer discretionary 6% 17% 15% 35% 15% 18%
Consumer staples 4% 12% 19% 30% 13% 17%
Energy 4% 8% 14% 32% 11% 15%
Financials 4% 13% 21% 30% 18% 20%
Healthcare 5% 13% 25% 33% 17% 21%
Industrials 3% 10% 12% 34% 9% 15%
Information technology 3% 20% 16% 31% 11% 16%
Materials 4% 13% 18% 31% 10% 15%
Real estate 5% 19% 19% 41% 16% 19%
Utilities 8% 15% 25% 39% 18% 23%
16
Concluding remarks
Supervision versus leadership: What is the impact of greater diversity in the boardroom? Having looked at both the board and management structure by gender, the question remains whether one influences the other. Does improving diversity in supervision and governance via the boardroom lead to improved diversity in the management teams through something of a spillover effect? We bring together the datasets for the Gender 3000 in terms of the structure of the boards and management teams of each of the companies where sufficient granular data is available to examine this.
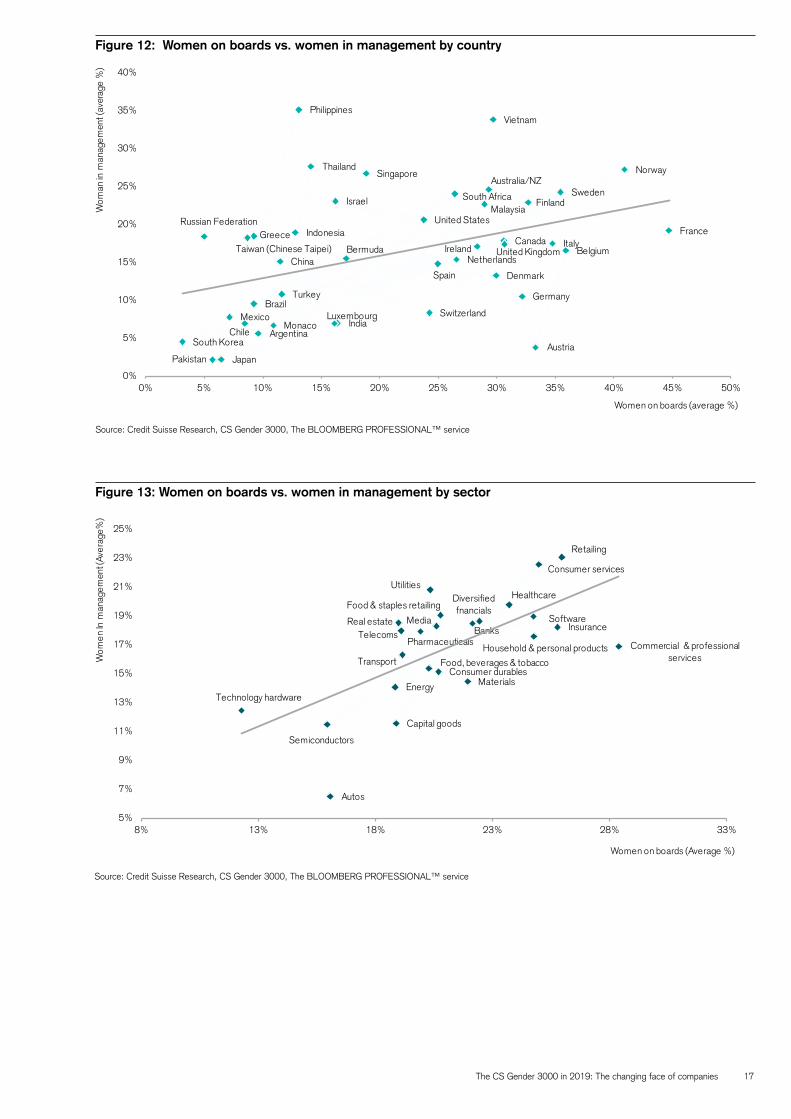
While we are hesitant in asserting cause and effect too forcefully, Table 8 lends some support to this view. Companies with at least 5% of women on boards have an average of 18% women in management. This proportion increases as the percentage of women on boards rises in all three years under analysis, suggesting that the impact of greater diversity in the boardroom leads to a better gender balance in executive functions. At the 50% level of board representa-tion, we find nearly 30% of women in manage-ment.
Figures 12 and 13 demonstrate this positive correlation by mapping the percentage of female management and board representation by country and sector. The country chart is of particular note as it makes a case for the positive effect of quotas and targets with the European countries such as Sweden, Norway, Italy and France, as all are found toward the upper right of the chart.
However, one is also left wondering whether there is as much of a “spillover” effect from board to management as might be expected from such intended policies. The board repre-sentation in European countries is not mirrored in notably higher management representation by women when compared to countries such as those in Asia Pacific as we have seen in the CEO and CFO data earlier, and also the USA.
If targeting increased female representation on boards is based on an ambition to improve governance, Europe can point to a degree of success. However, if the aim is to secure a major uplift in managerial representation of women, clear signs of success are somewhat more mixed. As we highlight in Chapter 4, policies that influence the flexibility of the labor market are still a key influence, as well as steps that need be taken by companies with regard to pipeline management and human capital policies.
Table 8: The impact of greater diversity at board levelBased on the unmatched dataset
Source: Credit Suisse Research, CS Gender 3000
Women on boards Women in management
> 2019 2016 2014
5% 18% 14% 15%
10% 19% 14% 16%
20% 21% 16% 17%
30% 22% 17% 21%
40% 25% 20% 28%
50% 28% 23% 26%
Figure 11: Changes in the management power line over time (2019 vs. 2016); based on the matched dataset
Source: Credit Suisse Research, CS Gender 3000
-10%
-8%
-6%
-4%
-2%
0%
2%
4%
6%
APxJ Japan Europe North America Latam
CEO CFO Strategy & IR Shared services Business management
The CS Gender 3000 in 2019: The changing face of companies 17
Figure 12: Women on boards vs. women in management by country
Source: Credit Suisse Research, CS Gender 3000, The BLOOMBERG PROFESSIONAL™ service
Figure 13: Women on boards vs. women in management by sector
Source: Credit Suisse Research, CS Gender 3000, The BLOOMBERG PROFESSIONAL™ service
Autos
Banks
Capital goods
Commercial & professional services
Consumer durables
Consumer services
Diversified fnancials
Energy
Food & staples retailing
Food, beverages & tobacco
Healthcare
Household & personal products
Insurance
Materials
Media
Pharmaceuticals
Real estate
Retailing
Semiconductors
Software
Technology hardware
Telecoms
Transport
Utilities
5%
7%
9%
11%
13%
15%
17%
19%
21%
23%
25%
8% 13% 18% 23% 28% 33%
Wom
en In
man
agem
ent (
Aver
age%
)
Women on boards (Average %)
Argentina
Australia/NZ
Austria
BelgiumBermuda
Brazil
Canada
Chile
ChinaDenmark
Finland
France
Germany
Greece
India
Indonesia
Ireland
Israel
Italy
Japan
Luxembourg
Malaysia
MexicoMonaco
Netherlands
Norway
Pakistan
Philippines
Russian Federation
Singapore
South Africa
South Korea
Spain
Sweden
Switzerland
Taiwan (Chinese Taipei)
Thailand
Turkey
United Kingdom
United States
Vietnam
0%
5%
10%
15%
20%
25%
30%
35%
40%
0% 5% 10% 15% 20% 25% 30% 35% 40% 45% 50%
Wom
an in
man
agem
ent (
aver
age
%)
Women on boards (average %)

18
The CS Gender 3000 in 2019: The changing face of companies 19
Running the numbers: The “quality” premium
Share-price performance and board diversity
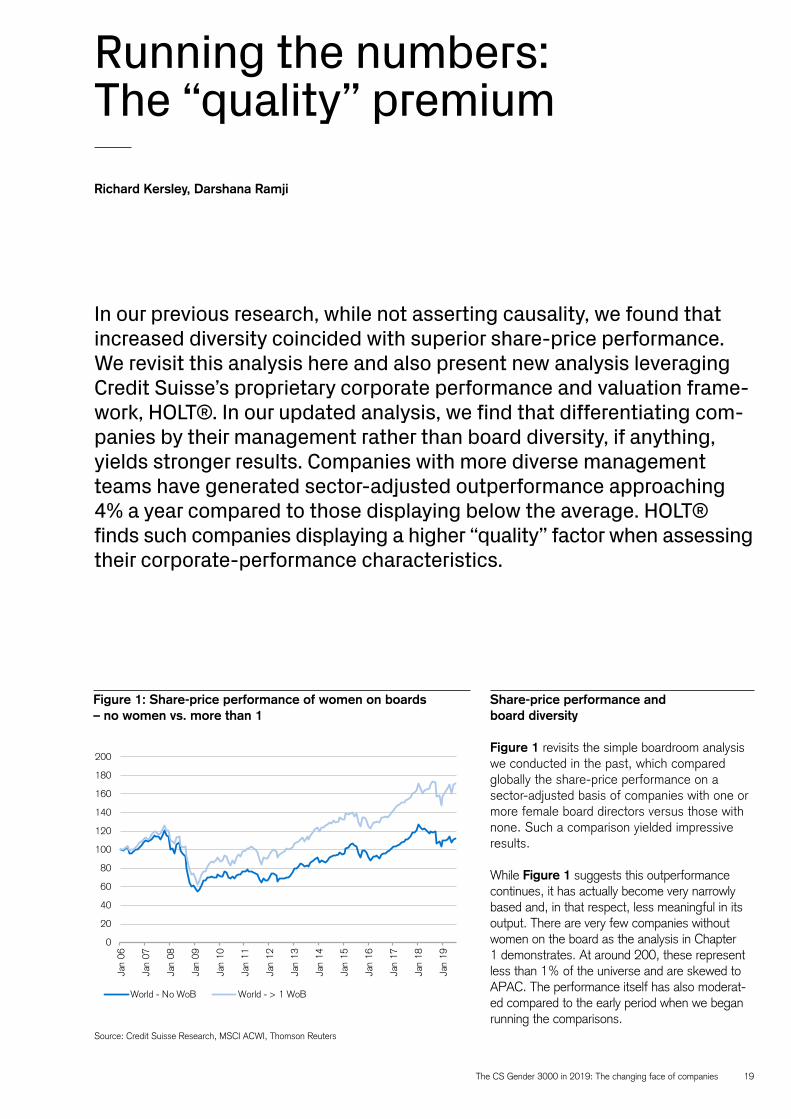
Figure 1 revisits the simple boardroom analysis we conducted in the past, which compared globally the share-price performance on a sector-adjusted basis of companies with one or more female board directors versus those with none. Such a comparison yielded impressive results.
While Figure 1 suggests this outperformance continues, it has actually become very narrowly based and, in that respect, less meaningful in its output. There are very few companies without women on the board as the analysis in Chapter 1 demonstrates. At around 200, these represent less than 1% of the universe and are skewed to APAC. The performance itself has also moderat-ed compared to the early period when we began running the comparisons.
Richard Kersley, Darshana Ramji
In our previous research, while not asserting causality, we found that increased diversity coincided with superior share-price performance. We revisit this analysis here and also present new analysis leveraging Credit Suisse’s proprietary corporate performance and valuation frame-work, HOLT®. In our updated analysis, we find that differentiating com-panies by their management rather than board diversity, if anything, yields stronger results. Companies with more diverse management teams have generated sector-adjusted outperformance approaching 4% a year compared to those displaying below the average. HOLT® finds such companies displaying a higher “quality” factor when assessing their corporate-performance characteristics.
Source: Credit Suisse Research, MSCI ACWI, Thomson Reuters
Figure 1: Share-price performance of women on boards – no women vs. more than 1
0
20
40
60
80
100
120
140
160
180
200
Jan
06
Jan
07
Jan
08
Jan
09
Jan
10
Jan
11
Jan
12
Jan
13
Jan
14
Jan
15
Jan
16
Jan
17
Jan
18
Jan
19
World - No WoB World - > 1 WoB
20
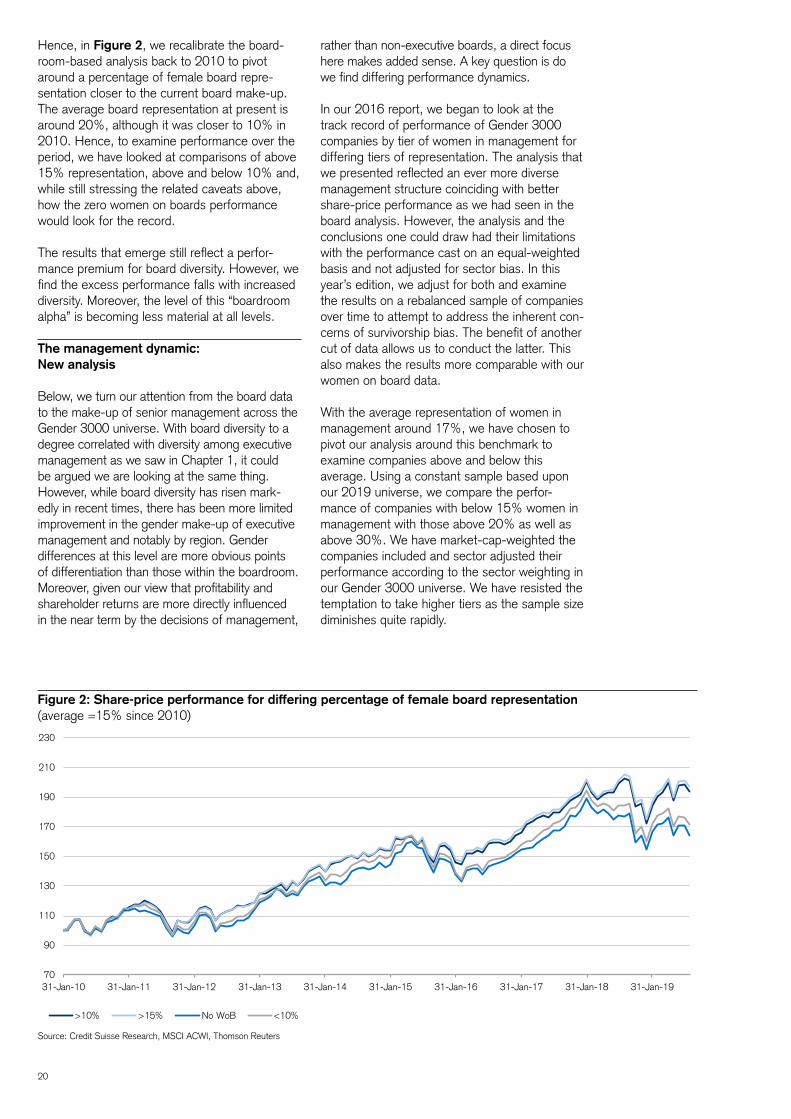
Hence, in Figure 2, we recalibrate the board-room-based analysis back to 2010 to pivot around a percentage of female board repre-sentation closer to the current board make-up. The average board representation at present is around 20%, although it was closer to 10% in 2010. Hence, to examine performance over the period, we have looked at comparisons of above 15% representation, above and below 10% and, while still stressing the related caveats above, how the zero women on boards performance would look for the record.
The results that emerge still reflect a perfor-mance premium for board diversity. However, we find the excess performance falls with increased diversity. Moreover, the level of this “boardroom alpha” is becoming less material at all levels.
The management dynamic: New analysis
Below, we turn our attention from the board data to the make-up of senior management across the Gender 3000 universe. With board diversity to a degree correlated with diversity among executive management as we saw in Chapter 1, it could be argued we are looking at the same thing. However, while board diversity has risen mark-edly in recent times, there has been more limited improvement in the gender make-up of executive management and notably by region. Gender differences at this level are more obvious points of differentiation than those within the boardroom. Moreover, given our view that profitability and shareholder returns are more directly influenced in the near term by the decisions of management,
rather than non-executive boards, a direct focus here makes added sense. A key question is do we find differing performance dynamics.
In our 2016 report, we began to look at the track record of performance of Gender 3000 companies by tier of women in management for differing tiers of representation. The analysis that we presented reflected an ever more diverse management structure coinciding with better share-price performance as we had seen in the board analysis. However, the analysis and the conclusions one could draw had their limitations with the performance cast on an equal-weighted basis and not adjusted for sector bias. In this year’s edition, we adjust for both and examine the results on a rebalanced sample of companies over time to attempt to address the inherent con-cerns of survivorship bias. The benefit of another cut of data allows us to conduct the latter. This also makes the results more comparable with our women on board data.
With the average representation of women in management around 17%, we have chosen to pivot our analysis around this benchmark to examine companies above and below this average. Using a constant sample based upon our 2019 universe, we compare the perfor-mance of companies with below 15% women in management with those above 20% as well as above 30%. We have market-cap-weighted the companies included and sector adjusted their performance according to the sector weighting in our Gender 3000 universe. We have resisted the temptation to take higher tiers as the sample size diminishes quite rapidly.
Figure 2: Share-price performance for differing percentage of female board representation (average =15% since 2010)
Source: Credit Suisse Research, MSCI ACWI, Thomson Reuters
70
90
110
130
150
170
190
210
230
31-Jan-10 31-Jan-11 31-Jan-12 31-Jan-13 31-Jan-14 31-Jan-15 31-Jan-16 31-Jan-17 31-Jan-18 31-Jan-19
>10% >15% No WoB <10%
The CS Gender 3000 in 2019: The changing face of companies 21
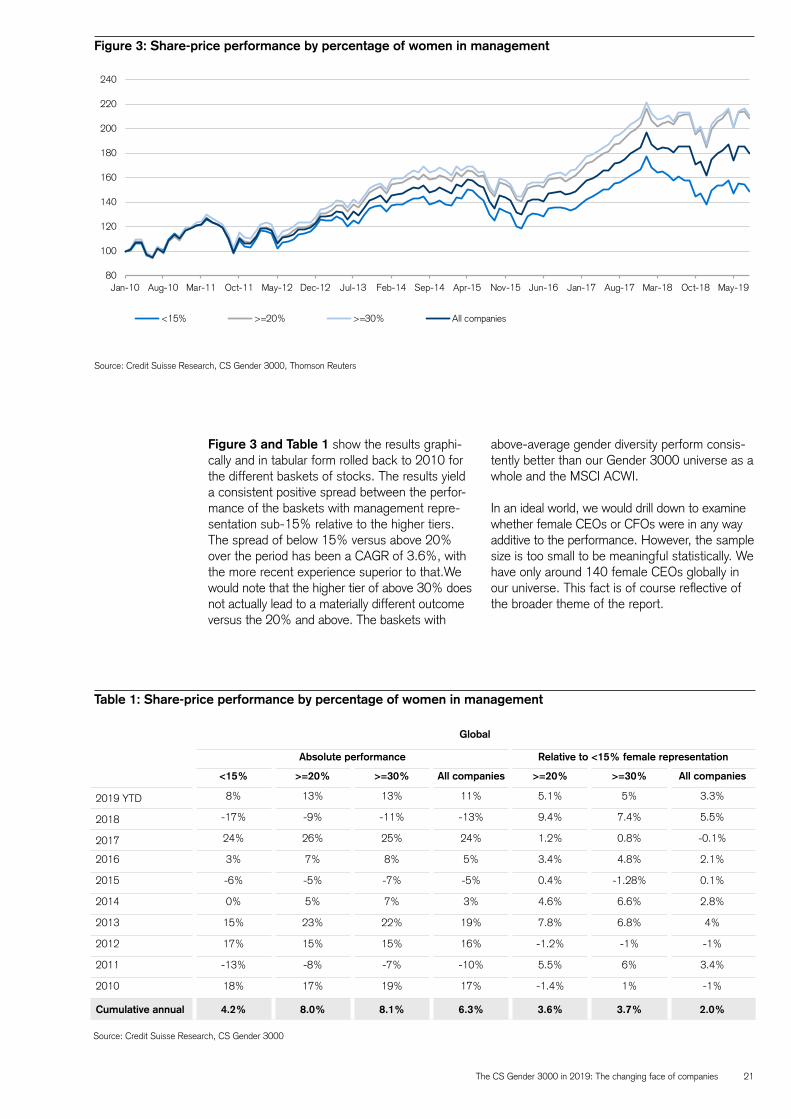
Figure 3 and Table 1 show the results graphi-cally and in tabular form rolled back to 2010 for the different baskets of stocks. The results yield a consistent positive spread between the perfor-mance of the baskets with management repre-sentation sub-15% relative to the higher tiers. The spread of below 15% versus above 20% over the period has been a CAGR of 3.6%, with the more recent experience superior to that.We would note that the higher tier of above 30% does not actually lead to a materially different outcome versus the 20% and above. The baskets with
Figure 3: Share-price performance by percentage of women in management
Table 1: Share-price performance by percentage of women in management
Source: Credit Suisse Research, CS Gender 3000
Global
Absolute performance Relative to <15% female representation
<15% >=20% >=30% All companies >=20% >=30% All companies
2019 YTD 8% 13% 13% 11% 5.1% 5% 3.3%
2018 -17% -9% -11% -13% 9.4% 7.4% 5.5%
2017 24% 26% 25% 24% 1.2% 0.8% -0.1%
2016 3% 7% 8% 5% 3.4% 4.8% 2.1%
2015 -6% -5% -7% -5% 0.4% -1.28% 0.1%
2014 0% 5% 7% 3% 4.6% 6.6% 2.8%
2013 15% 23% 22% 19% 7.8% 6.8% 4%
2012 17% 15% 15% 16% -1.2% -1% -1%
2011 -13% -8% -7% -10% 5.5% 6% 3.4%
2010 18% 17% 19% 17% -1.4% 1% -1%
Cumulative annual 4.2% 8.0% 8.1% 6.3% 3.6% 3.7% 2.0%
Source: Credit Suisse Research, CS Gender 3000, Thomson Reuters
above-average gender diversity perform consis-tently better than our Gender 3000 universe as a whole and the MSCI ACWI.
In an ideal world, we would drill down to examine whether female CEOs or CFOs were in any way additive to the performance. However, the sample size is too small to be meaningful statistically. We have only around 140 female CEOs globally in our universe. This fact is of course reflective of the broader theme of the report.
80
100
120
140
160
180
200
220
240
Jan-10 Aug-10 Mar-11 Oct-11 May-12 Dec-12 Jul-13 Feb-14 Sep-14 Apr-15 Nov-15 Jun-16 Jan-17 Aug-17 Mar-18 Oct-18 May-19
<15% >=20% >=30% All companies
22
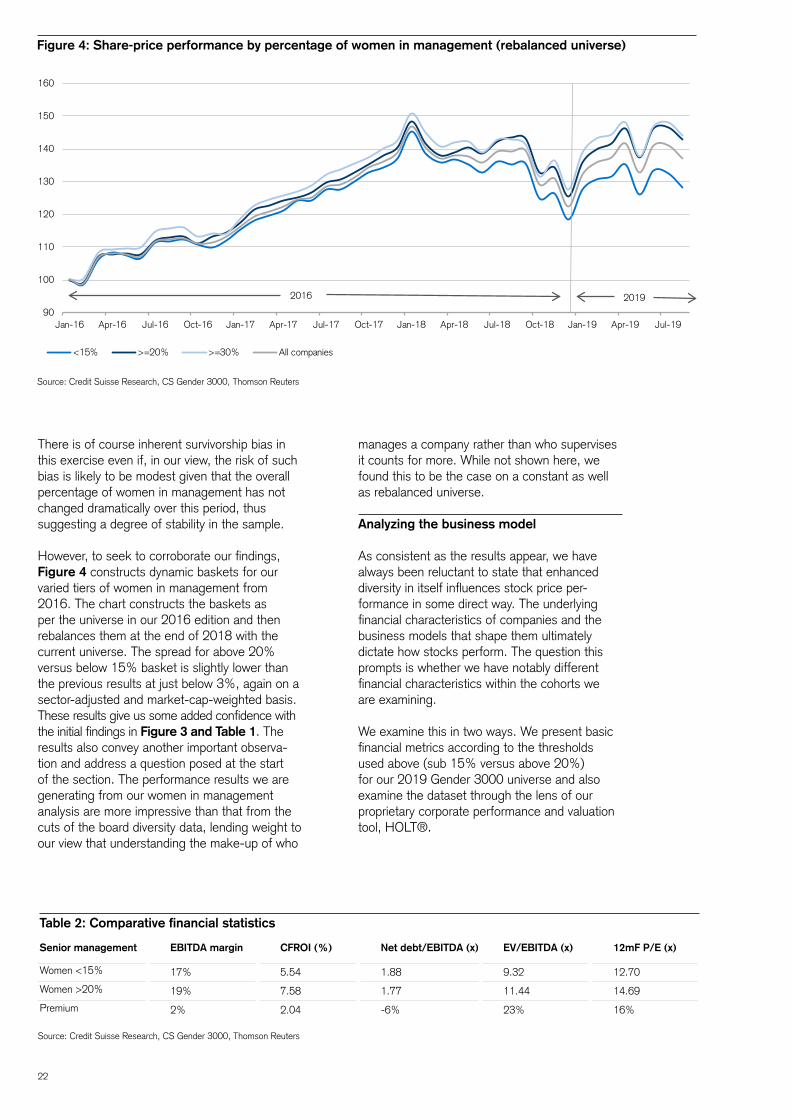
There is of course inherent survivorship bias in this exercise even if, in our view, the risk of such bias is likely to be modest given that the overall percentage of women in management has not changed dramatically over this period, thus suggesting a degree of stability in the sample.
However, to seek to corroborate our findings, Figure 4 constructs dynamic baskets for our varied tiers of women in management from 2016. The chart constructs the baskets as per the universe in our 2016 edition and then rebalances them at the end of 2018 with the current universe. The spread for above 20% versus below 15% basket is slightly lower than the previous results at just below 3%, again on a sector-adjusted and market-cap-weighted basis.These results give us some added confidence with the initial findings in Figure 3 and Table 1. The results also convey another important observa-tion and address a question posed at the start of the section. The performance results we are generating from our women in management analysis are more impressive than that from the cuts of the board diversity data, lending weight to our view that understanding the make-up of who
Figure 4: Share-price performance by percentage of women in management (rebalanced universe)
Source: Credit Suisse Research, CS Gender 3000, Thomson Reuters
Table 2: Comparative financial statistics
Source: Credit Suisse Research, CS Gender 3000, Thomson Reuters
Senior management EBITDA margin CFROI (%) Net debt/EBITDA (x) EV/EBITDA (x) 12mF P/E (x)
Women <15% 17% 5.54 1.88 9.32 12.70
Women >20% 19% 7.58 1.77 11.44 14.69
Premium 2% 2.04 -6% 23% 16%
manages a company rather than who supervises it counts for more. While not shown here, we found this to be the case on a constant as well as rebalanced universe.
Analyzing the business model
As consistent as the results appear, we have always been reluctant to state that enhanced diversity in itself influences stock price per-formance in some direct way. The underlying financial characteristics of companies and the business models that shape them ultimately dictate how stocks perform. The question this prompts is whether we have notably different financial characteristics within the cohorts we are examining.
We examine this in two ways. We present basic financial metrics according to the thresholds used above (sub 15% versus above 20%) for our 2019 Gender 3000 universe and also examine the dataset through the lens of our proprietary corporate performance and valuation tool, HOLT®.
90
100
110
120
130
140
150
160
Jan-16 Apr-16 Jul-16 Oct-16 Jan-17 Apr-17 Jul-17 Oct-17 Jan-18 Apr-18 Jul-18 Oct-18 Jan-19 Apr-19 Jul-19
<15% >=20% >=30% All companies
2016 2019
The CS Gender 3000 in 2019: The changing face of companies 23
Figure 5: Higher operating margins since 2013EBITDA margin, non-financials (sector-adj, sales-weighted)
Source Figures 5–7: Credit Suisse Research, CS Gender 3000, Thomson Reuters
Figure 6: Net debt/EBITDA over timeNet debt to EBITDA , non-financials (sector-adj, EBITDA-weighted)
Figure 7: 20% and 30% have traded at a premium to the 15% basket through the years EV by EBITDA, non-financials (sector-adj, EBITDA-weighted)
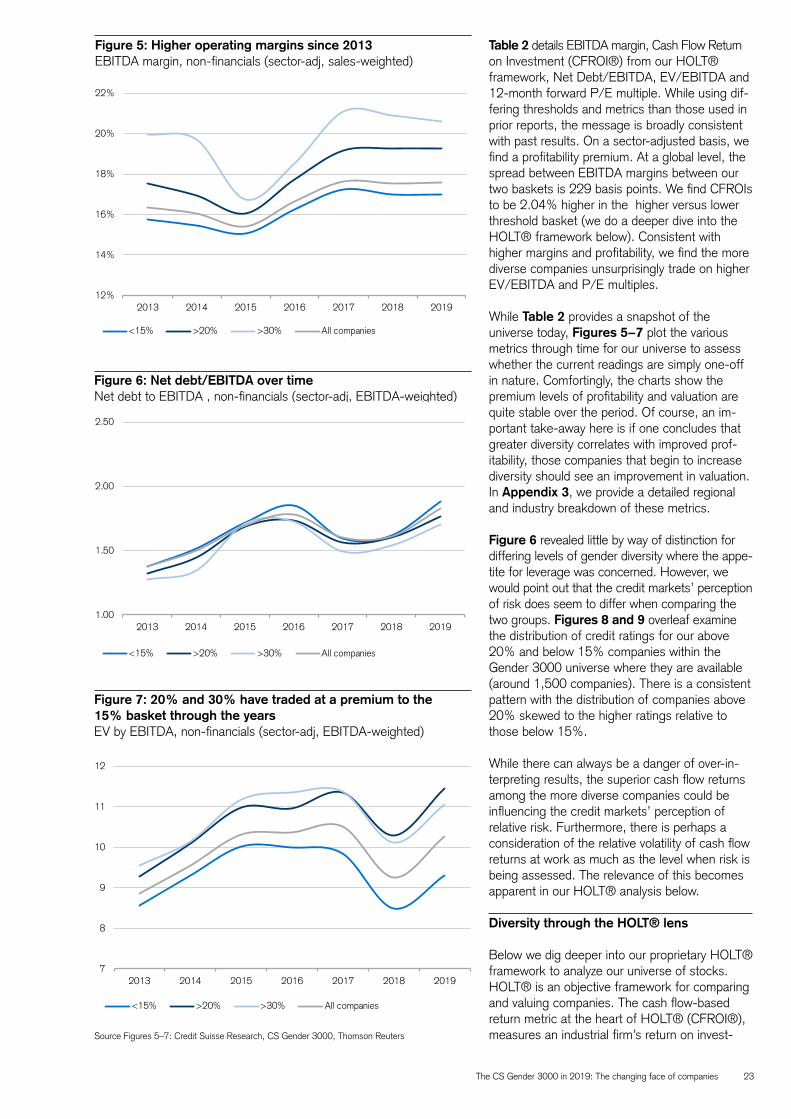
Table 2 details EBITDA margin, Cash Flow Return on Investment (CFROI®) from our HOLT® framework, Net Debt/EBITDA, EV/EBITDA and 12-month forward P/E multiple. While using dif-fering thresholds and metrics than those used in prior reports, the message is broadly consistent with past results. On a sector-adjusted basis, we find a profitability premium. At a global level, the spread between EBITDA margins between our two baskets is 229 basis points. We find CFROIs to be 2.04% higher in the higher versus lower threshold basket (we do a deeper dive into the HOLT® framework below). Consistent with higher margins and profitability, we find the more diverse companies unsurprisingly trade on higher EV/EBITDA and P/E multiples.
While Table 2 provides a snapshot of the universe today, Figures 5−7 plot the various metrics through time for our universe to assess whether the current readings are simply one-off in nature. Comfortingly, the charts show the premium levels of profitability and valuation are quite stable over the period. Of course, an im-portant take-away here is if one concludes that greater diversity correlates with improved prof-itability, those companies that begin to increase diversity should see an improvement in valuation. In Appendix 3, we provide a detailed regional and industry breakdown of these metrics.
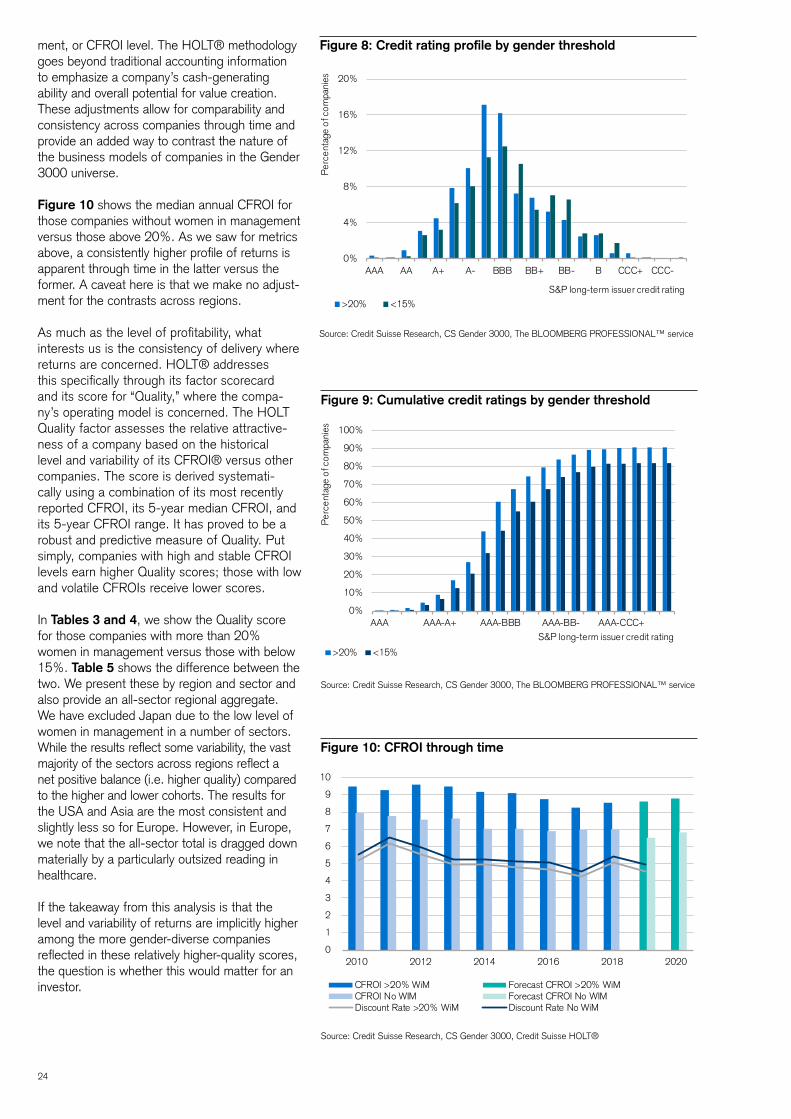
Figure 6 revealed little by way of distinction for differing levels of gender diversity where the appe-tite for leverage was concerned. However, we would point out that the credit markets’ perception of risk does seem to differ when comparing the two groups. Figures 8 and 9 overleaf examine the distribution of credit ratings for our above 20% and below 15% companies within the Gender 3000 universe where they are available (around 1,500 companies). There is a consistent pattern with the distribution of companies above 20% skewed to the higher ratings relative to those below 15%.
While there can always be a danger of over-in-terpreting results, the superior cash flow returns among the more diverse companies could be influencing the credit markets’ perception of relative risk. Furthermore, there is perhaps a consideration of the relative volatility of cash flow returns at work as much as the level when risk is being assessed. The relevance of this becomes apparent in our HOLT® analysis below.
Diversity through the HOLT® lens
Below we dig deeper into our proprietary HOLT® framework to analyze our universe of stocks. HOLT® is an objective framework for comparing and valuing companies. The cash flow-based return metric at the heart of HOLT® (CFROI®), measures an industrial firm’s return on invest-
12%
14%
16%
18%
20%
22%
2013 2014 2015 2016 2017 2018 2019
<15% >20% >30% All companies
1.00
1.50
2.00
2.50
2013 2014 2015 2016 2017 2018 2019
<15% >20% >30% All companies
7
8
9
10
11
12
2013 2014 2015 2016 2017 2018 2019
<15% >20% >30% All companies
24
Figure 8: Credit rating profile by gender threshold
Figure 9: Cumulative credit ratings by gender threshold
Figure 10: CFROI through time
Source: Credit Suisse Research, CS Gender 3000, Credit Suisse HOLT®
Source: Credit Suisse Research, CS Gender 3000, The BLOOMBERG PROFESSIONAL™ service
Source: Credit Suisse Research, CS Gender 3000, The BLOOMBERG PROFESSIONAL™ service
ment, or CFROI level. The HOLT® methodology goes beyond traditional accounting information to emphasize a company’s cash-generating ability and overall potential for value creation. These adjustments allow for comparability and consistency across companies through time and provide an added way to contrast the nature of the business models of companies in the Gender 3000 universe.
Figure 10 shows the median annual CFROI for those companies without women in management versus those above 20%. As we saw for metrics above, a consistently higher profile of returns is apparent through time in the latter versus the former. A caveat here is that we make no adjust-ment for the contrasts across regions.
As much as the level of profitability, what interests us is the consistency of delivery where returns are concerned. HOLT® addresses this specifically through its factor scorecard and its score for “Quality,” where the compa-ny’s operating model is concerned. The HOLT Quality factor assesses the relative attractive-ness of a company based on the historical level and variability of its CFROI® versus other companies. The score is derived systemati-cally using a combination of its most recently reported CFROI, its 5-year median CFROI, and its 5-year CFROI range. It has proved to be a robust and predictive measure of Quality. Put simply, companies with high and stable CFROI levels earn higher Quality scores; those with low and volatile CFROIs receive lower scores.
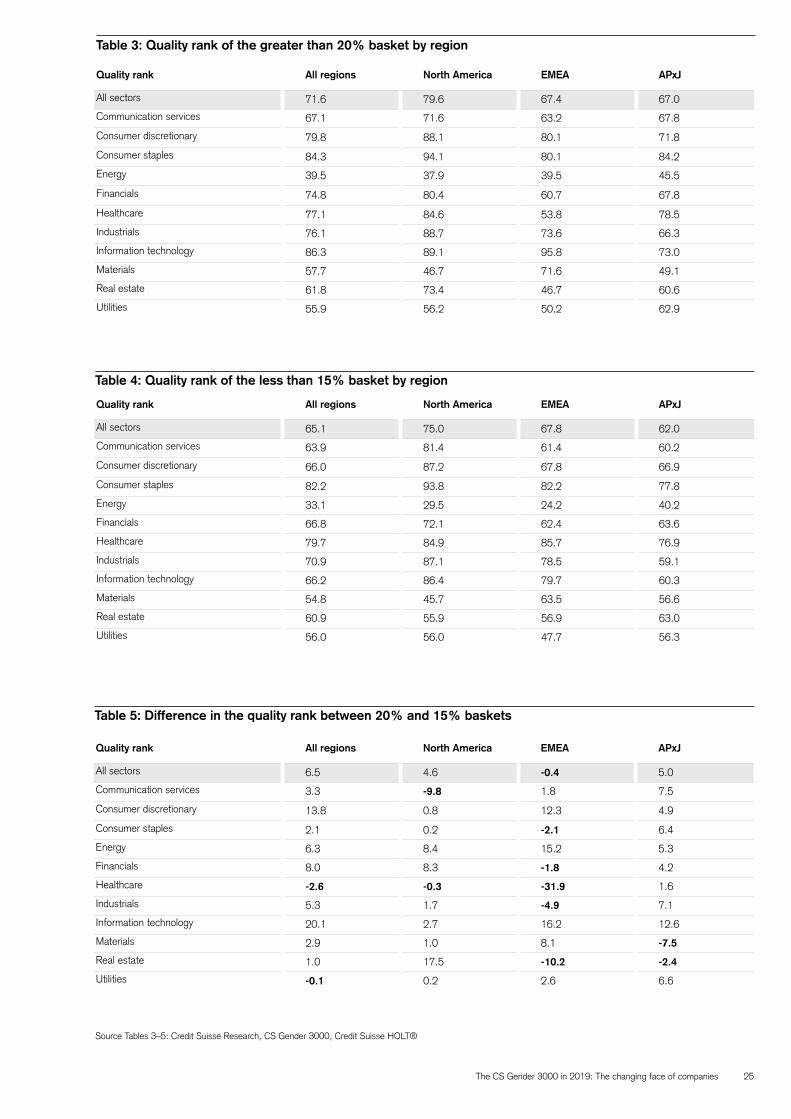
In Tables 3 and 4, we show the Quality score for those companies with more than 20% women in management versus those with below 15%. Table 5 shows the difference between the two. We present these by region and sector and also provide an all-sector regional aggregate. We have excluded Japan due to the low level of women in management in a number of sectors. While the results reflect some variability, the vast majority of the sectors across regions reflect a net positive balance (i.e. higher quality) compared to the higher and lower cohorts. The results for the USA and Asia are the most consistent and slightly less so for Europe. However, in Europe, we note that the all-sector total is dragged down materially by a particularly outsized reading in healthcare.
If the takeaway from this analysis is that the level and variability of returns are implicitly higher among the more gender-diverse companies reflected in these relatively higher-quality scores, the question is whether this would matter for an investor.
0
1
2
3
4
5
6
7
8
9
10
2010 2012 2014 2016 2018 2020
CFROI >20% WiM Forecast CFROI >20% WiMCFROI No WIM Forecast CFROI No WIMDiscount Rate >20% WiM Discount Rate No WiM
0%
10%
20%
30%
40%
50%
60%
70%
80%
90%
100%
AAA AAA-A+ AAA-BBB AAA-BB- AAA-CCC+
Per
cent
age
of c
ompa
nies
S&P long-term issuer credit rating
>20% <15%
0%
4%
8%
12%
16%
20%
AAA AA A+ A- BBB BB+ BB- B CCC+ CCC-
Per
cent
age
of c
ompa
nies
S&P long-term issuer credit rating
>20% <15%
The CS Gender 3000 in 2019: The changing face of companies 25
Table 3: Quality rank of the greater than 20% basket by region
Source Tables 3–5: Credit Suisse Research, CS Gender 3000, Credit Suisse HOLT®
Quality rank All regions North America EMEA APxJ
All sectors 71.6 79.6 67.4 67.0
Communication services 67.1 71.6 63.2 67.8
Consumer discretionary 79.8 88.1 80.1 71.8
Consumer staples 84.3 94.1 80.1 84.2
Energy 39.5 37.9 39.5 45.5
Financials 74.8 80.4 60.7 67.8
Healthcare 77.1 84.6 53.8 78.5
Industrials 76.1 88.7 73.6 66.3
Information technology 86.3 89.1 95.8 73.0
Materials 57.7 46.7 71.6 49.1
Real estate 61.8 73.4 46.7 60.6
Utilities 55.9 56.2 50.2 62.9
Table 4: Quality rank of the less than 15% basket by region
Quality rank All regions North America EMEA APxJ
All sectors 65.1 75.0 67.8 62.0
Communication services 63.9 81.4 61.4 60.2
Consumer discretionary 66.0 87.2 67.8 66.9
Consumer staples 82.2 93.8 82.2 77.8
Energy 33.1 29.5 24.2 40.2
Financials 66.8 72.1 62.4 63.6
Healthcare 79.7 84.9 85.7 76.9
Industrials 70.9 87.1 78.5 59.1
Information technology 66.2 86.4 79.7 60.3
Materials 54.8 45.7 63.5 56.6
Real estate 60.9 55.9 56.9 63.0
Utilities 56.0 56.0 47.7 56.3
Table 5: Difference in the quality rank between 20% and 15% baskets
Quality rank All regions North America EMEA APxJ
All sectors 6.5 4.6 -0.4 5.0
Communication services 3.3 -9.8 1.8 7.5
Consumer discretionary 13.8 0.8 12.3 4.9
Consumer staples 2.1 0.2 -2.1 6.4
Energy 6.3 8.4 15.2 5.3
Financials 8.0 8.3 -1.8 4.2
Healthcare -2.6 -0.3 -31.9 1.6
Industrials 5.3 1.7 -4.9 7.1
Information technology 20.1 2.7 16.2 12.6
Materials 2.9 1.0 8.1 -7.5
Real estate 1.0 17.5 -10.2 -2.4
Utilities -0.1 0.2 2.6 6.6
26
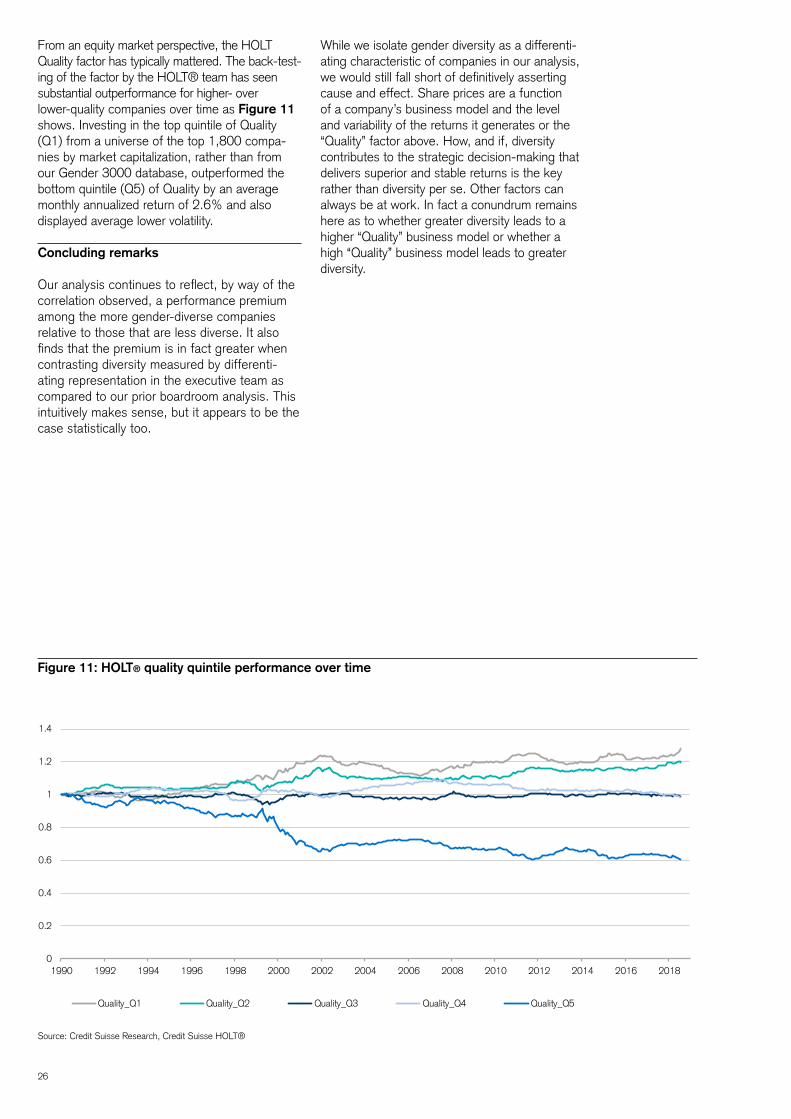
From an equity market perspective, the HOLT Quality factor has typically mattered. The back-test-ing of the factor by the HOLT® team has seen substantial outperformance for higher- over lower-quality companies over time as Figure 11 shows. Investing in the top quintile of Quality (Q1) from a universe of the top 1,800 compa-nies by market capitalization, rather than from our Gender 3000 database, outperformed the bottom quintile (Q5) of Quality by an average monthly annualized return of 2.6% and also displayed average lower volatility.
Concluding remarks
Our analysis continues to reflect, by way of the correlation observed, a performance premium among the more gender-diverse companies relative to those that are less diverse. It also finds that the premium is in fact greater when contrasting diversity measured by differenti-ating representation in the executive team as compared to our prior boardroom analysis. This intuitively makes sense, but it appears to be the case statistically too.
Figure 11: HOLT® quality quintile performance over time
Source: Credit Suisse Research, Credit Suisse HOLT®
0
0.2
0.4
0.6
0.8
1
1.2
1.4
1990 1992 1994 1996 1998 2000 2002 2004 2006 2008 2010 2012 2014 2016 2018
Quality_Q1 Quality_Q2 Quality_Q3 Quality_Q4 Quality_Q5
While we isolate gender diversity as a differenti-ating characteristic of companies in our analysis, we would still fall short of definitively asserting cause and effect. Share prices are a function of a company’s business model and the level and variability of the returns it generates or the “Quality” factor above. How, and if, diversity contributes to the strategic decision-making that delivers superior and stable returns is the key rather than diversity per se. Other factors can always be at work. In fact a conundrum remains here as to whether greater diversity leads to a higher “Quality” business model or whether a high “Quality” business model leads to greater diversity.

The CS Gender 3000 in 2019: The changing face of companies 27

28
The CS Gender 3000 in 2019: The changing face of companies 29
Gender diversity and family-owned companies
The benefit of family-owned companies
Since 2016, the Credit Suisse Research Institute has frequently published findings on the bene-fits that a group of more than 1,000 family and founder-owned companies globally provide.
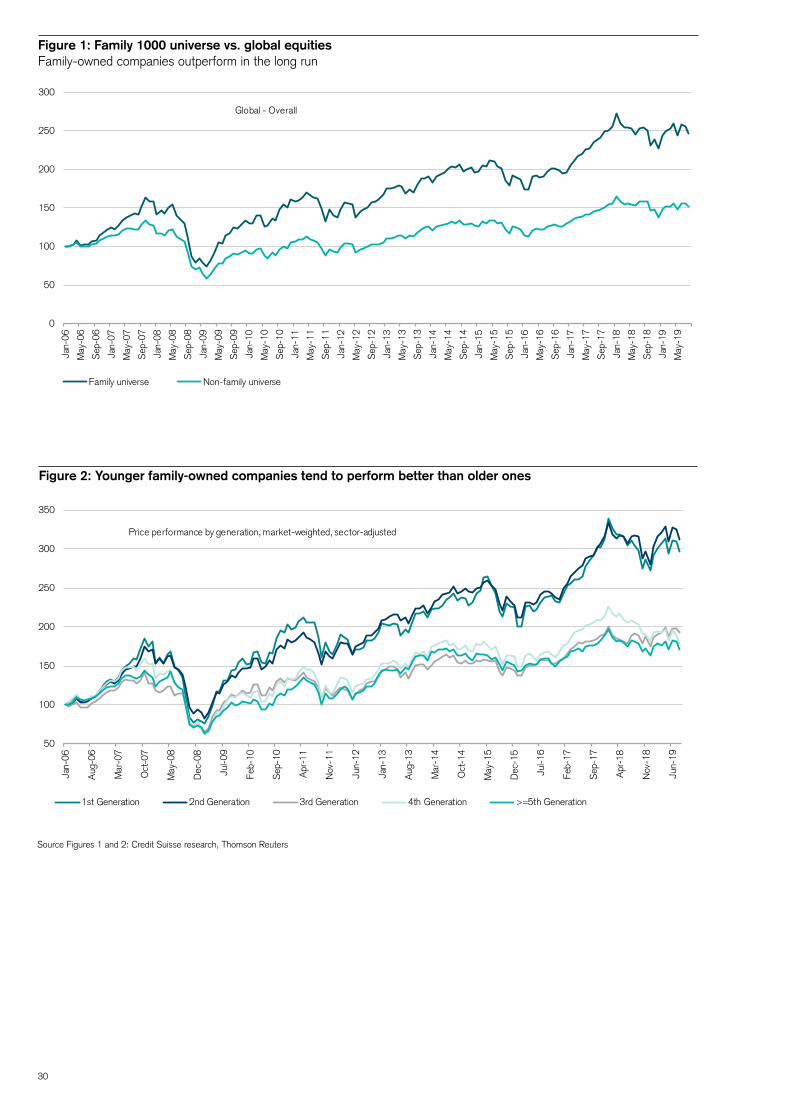
In its most recent major update on the topic (Credit Suisse Research Institute: The CS Family 1000 in 2018), the CSRI noted that family-owned companies outperformed non- family-owned companies in every region and in every sector (Figure 1). Furthermore, our anal-ysis suggested that first- and second-generation family-owned companies outperformed older generations (Figure 2). When reviewing possible reasons for the share/price outperformance of family-owned companies, we found that they tend to generate higher revenue growth and cash flow returns, and operate their businesses with lower leverage ratios while reinvesting more of their internally generated cash flows back into their businesses. In other words, family-owned companies do appear to have a longer-term business focus.
Eugène Klerk
In previous research, we have shown how family-owned companies in general tend to outperform non-family-owned peers in terms of finan-cial and share-price returns. In this report, we show that those that tend to perform best appear to have substantial female representation at the executive level. Their EBITDA margins tend to be higher, their reliance on debt tends to be lower, and cash flow returns over the past ten years have on average been more than 400 basis points higher. Based on a proprietary survey among 120 family-owned companies, we find that a greater share of female executives also correlates with a greater focus on sustainability, ESG and the UN Sustainable Development Goals.
Greater alpha: Family 1000 and Gender 3000
Our work on gender diversity as outlined in this report suggests that investors benefit from being exposed to companies with greater diversity. Given that family-owned companies also seem to outperform broader equity markets, we have analyzed whether the combination of family ownership and gender diversity enhances outper-formance further. In other words, do diverse family-owned companies outperform family- owned companies that are less diverse?
To review the potential benefits of female-founded family-owned companies, we cross-referenced our Gender 3000 database with our Family 1000 database of family- and founder-owned com-panies globally. This yielded 315 family-owned companies with at least one female executive and 161 family-owned companies with no female executive representation.
30
Figure 2: Younger family-owned companies tend to perform better than older ones
Figure 1: Family 1000 universe vs. global equities Family-owned companies outperform in the long run
0
50
100
150
200
250
300
Jan-
06
May
-06
Sep
-06
Jan-
07
May
-07
Sep
-07
Jan-
08
May
-08
Sep
-08
Jan-
09
May
-09
Sep
-09
Jan-
10
May
-10
Sep
-10
Jan-
11
May
-11
Sep
-11
Jan-
12
May
-12
Sep
-12
Jan-
13
May
-13
Sep
-13
Jan-
14
May
-14
Sep
-14
Jan-
15
May
-15
Sep
-15
Jan-
16
May
-16
Sep
-16
Jan-
17
May
-17
Sep
-17
Jan-
18
May
-18
Sep
-18
Jan-
19
May
-19
Global - Overall
Family universe Non-family universe
Source Figures 1 and 2: Credit Suisse research, Thomson Reuters
50
100
150
200
250
300
350
Jan-
06
Aug
-06
Mar
-07
Oct
-07
May
-08
Dec
-08
Jul-0
9
Feb-
10
Sep
-10
Apr
-11
Nov
-11
Jun-
12
Jan-
13
Aug
-13
Mar
-14
Oct
-14
May
-15
Dec
-15
Jul-1
6
Feb-
17
Sep
-17
Apr
-18
Nov
-18
Jun-
19
Price performance by generation, market-weighted, sector-adjusted
1st Generation 2nd Generation 3rd Generation 4th Generation >=5th Generation
The CS Gender 3000 in 2019: The changing face of companies 31
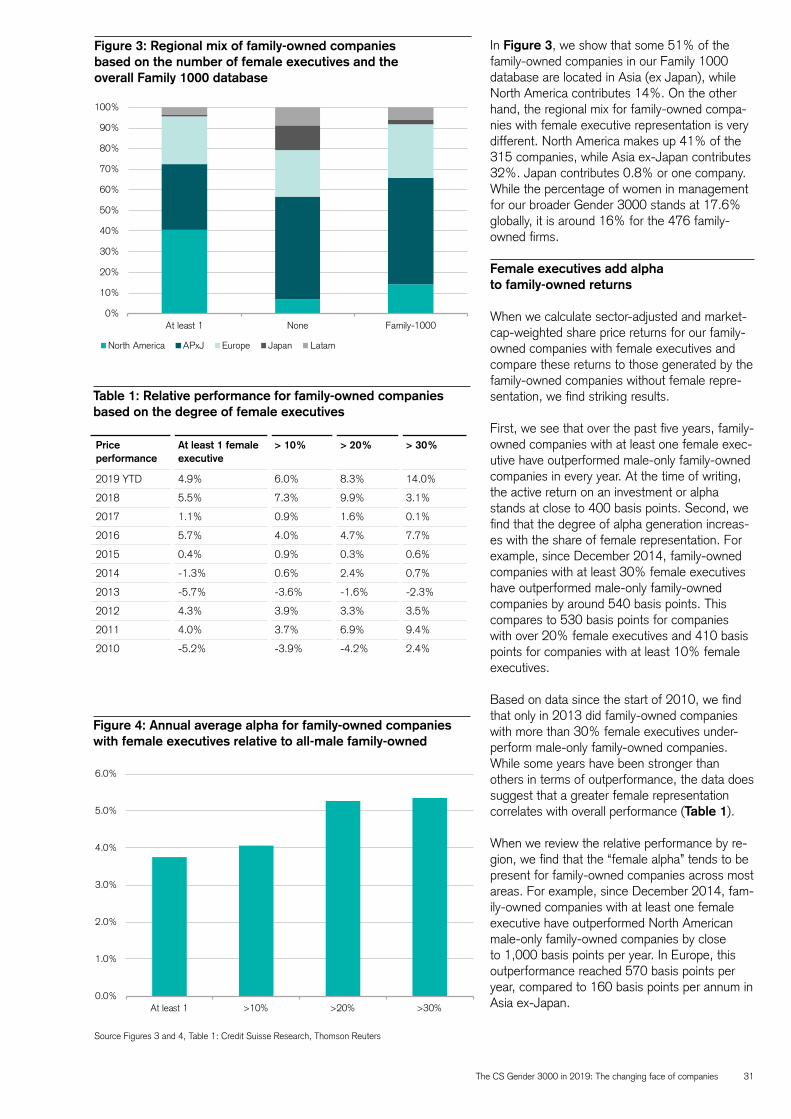
In Figure 3, we show that some 51% of the family-owned companies in our Family 1000 database are located in Asia (ex Japan), while North America contributes 14%. On the other hand, the regional mix for family-owned compa-nies with female executive representation is very different. North America makes up 41% of the 315 companies, while Asia ex-Japan contributes 32%. Japan contributes 0.8% or one company. While the percentage of women in management for our broader Gender 3000 stands at 17.6% globally, it is around 16% for the 476 family- owned firms.
Female executives add alpha to family-owned returns
When we calculate sector-adjusted and market- cap-weighted share price returns for our family- owned companies with female executives and compare these returns to those generated by the family-owned companies without female repre-sentation, we find striking results.
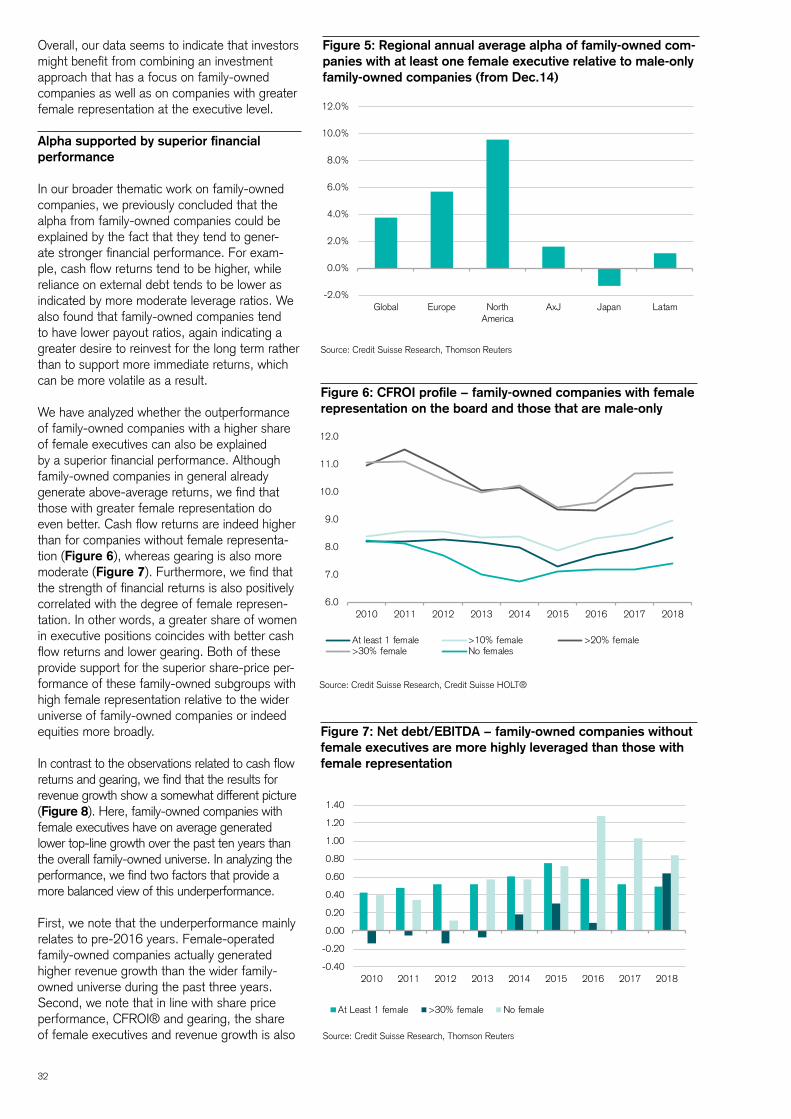
First, we see that over the past five years, family- owned companies with at least one female exec-utive have outperformed male-only family-owned companies in every year. At the time of writing, the active return on an investment or alpha stands at close to 400 basis points. Second, we find that the degree of alpha generation increas-es with the share of female representation. For example, since December 2014, family-owned companies with at least 30% female executives have outperformed male-only family-owned companies by around 540 basis points. This compares to 530 basis points for companies with over 20% female executives and 410 basis points for companies with at least 10% female executives.
Based on data since the start of 2010, we find that only in 2013 did family-owned companies with more than 30% female executives under-perform male-only family-owned companies. While some years have been stronger than others in terms of outperformance, the data does suggest that a greater female representation correlates with overall performance (Table 1).
When we review the relative performance by re-gion, we find that the “female alpha” tends to be present for family-owned companies across most areas. For example, since December 2014, fam-ily-owned companies with at least one female executive have outperformed North American male-only family-owned companies by close to 1,000 basis points per year. In Europe, this outperformance reached 570 basis points per year, compared to 160 basis points per annum in Asia ex-Japan.
Figure 3: Regional mix of family-owned companies based on the number of female executives and the overall Family 1000 database
Source Figures 3 and 4, Table 1: Credit Suisse Research, Thomson Reuters
Table 1: Relative performance for family-owned companies based on the degree of female executives
Figure 4: Annual average alpha for family-owned companies with female executives relative to all-male family-owned
0.0%
1.0%
2.0%
3.0%
4.0%
5.0%
6.0%
At least 1 >10% >20% >30%
Price performance
At least 1 female executive
> 10% > 20% > 30%
2019 YTD 4.9% 6.0% 8.3% 14.0%
2018 5.5% 7.3% 9.9% 3.1%
2017 1.1% 0.9% 1.6% 0.1%
2016 5.7% 4.0% 4.7% 7.7%
2015 0.4% 0.9% 0.3% 0.6%
2014 -1.3% 0.6% 2.4% 0.7%
2013 -5.7% -3.6% -1.6% -2.3%
2012 4.3% 3.9% 3.3% 3.5%
2011 4.0% 3.7% 6.9% 9.4%
2010 -5.2% -3.9% -4.2% 2.4%
0%
10%
20%
30%
40%
50%
60%
70%
80%
90%
100%
At least 1 None Family-1000
North America APxJ Europe Japan Latam
32
Overall, our data seems to indicate that investors might benefit from combining an investment approach that has a focus on family-owned companies as well as on companies with greater female representation at the executive level.
Alpha supported by superior financial performance
In our broader thematic work on family-owned companies, we previously concluded that the alpha from family-owned companies could be explained by the fact that they tend to gener-ate stronger financial performance. For exam-ple, cash flow returns tend to be higher, while reliance on external debt tends to be lower as indicated by more moderate leverage ratios. We also found that family-owned companies tend to have lower payout ratios, again indicating a greater desire to reinvest for the long term rather than to support more immediate returns, which can be more volatile as a result.
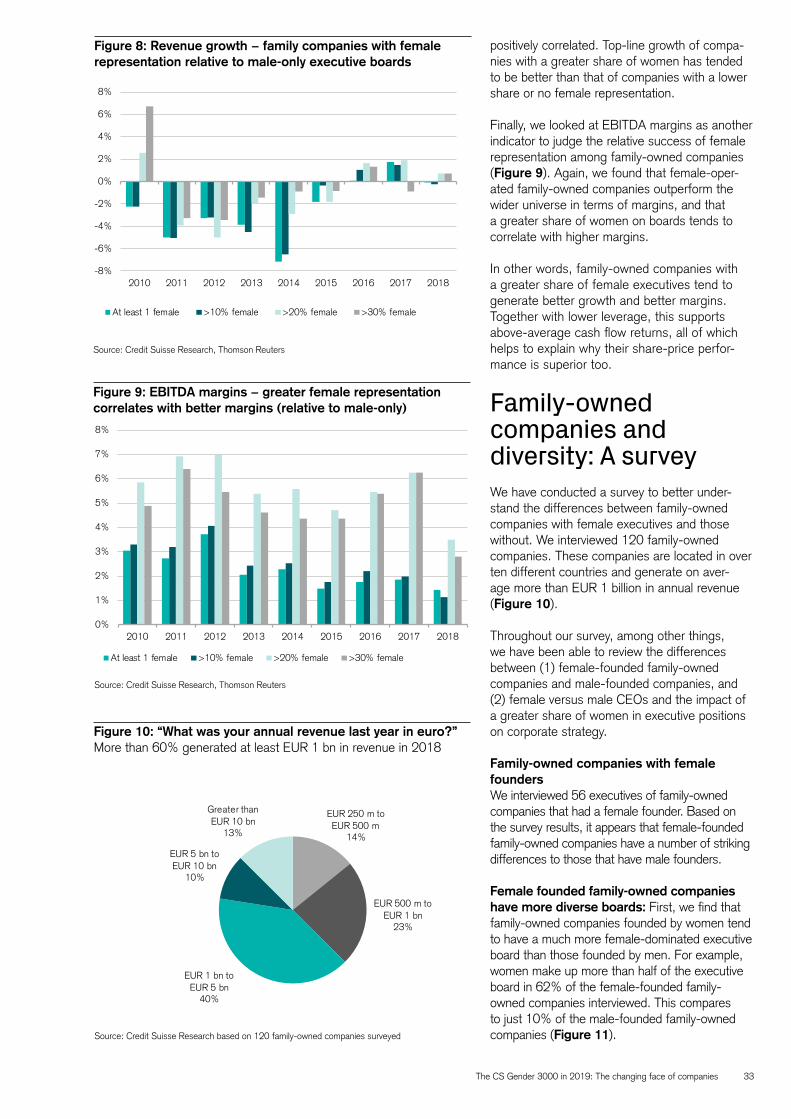
We have analyzed whether the outperformance of family-owned companies with a higher share of female executives can also be explained by a superior financial performance. Although family-owned companies in general already generate above-average returns, we find that those with greater female representation do even better. Cash flow returns are indeed higher than for companies without female representa-tion (Figure 6), whereas gearing is also more moderate (Figure 7). Furthermore, we find that the strength of financial returns is also positively correlated with the degree of female represen-tation. In other words, a greater share of women in executive positions coincides with better cash flow returns and lower gearing. Both of these provide support for the superior share-price per-formance of these family-owned subgroups with high female representation relative to the wider universe of family-owned companies or indeed equities more broadly.
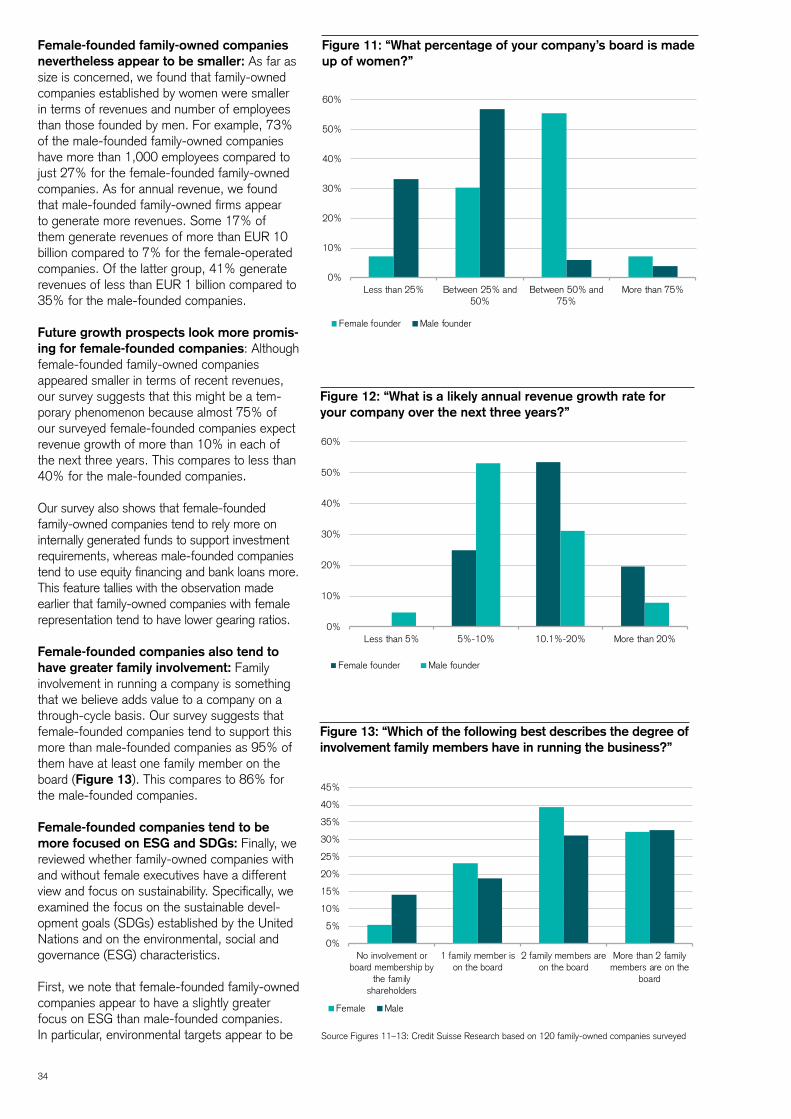
In contrast to the observations related to cash flow returns and gearing, we find that the results for revenue growth show a somewhat different picture (Figure 8). Here, family-owned companies with female executives have on average generated lower top-line growth over the past ten years than the overall family-owned universe. In analyzing the performance, we find two factors that provide a more balanced view of this underperformance.
First, we note that the underperformance mainly relates to pre-2016 years. Female-operated family-owned companies actually generated higher revenue growth than the wider family- owned universe during the past three years. Second, we note that in line with share price performance, CFROI® and gearing, the share of female executives and revenue growth is also
Figure 5: Regional annual average alpha of family-owned com-panies with at least one female executive relative to male-only family-owned companies (from Dec.14)
Source: Credit Suisse Research, Thomson Reuters
Figure 6: CFROI profile − family-owned companies with female representation on the board and those that are male-only
Figure 7: Net debt/EBITDA − family-owned companies without female executives are more highly leveraged than those with female representation
-2.0%
0.0%
2.0%
4.0%
6.0%
8.0%
10.0%
12.0%
Global Europe NorthAmerica
AxJ Japan Latam
-0.40
-0.20
0.00
0.20
0.40
0.60
0.80
1.00
1.20
1.40
2010 2011 2012 2013 2014 2015 2016 2017 2018
At Least 1 female >30% female No female
Source: Credit Suisse Research, Thomson Reuters
Source: Credit Suisse Research, Credit Suisse HOLT®
6.0
7.0
8.0
9.0
10.0
11.0
12.0
2010 2011 2012 2013 2014 2015 2016 2017 2018
At least 1 female >10% female >20% female>30% female No females
The CS Gender 3000 in 2019: The changing face of companies 33
positively correlated. Top-line growth of compa-nies with a greater share of women has tended to be better than that of companies with a lower share or no female representation.
Finally, we looked at EBITDA margins as another indicator to judge the relative success of female representation among family-owned companies (Figure 9). Again, we found that female-oper-ated family-owned companies outperform the wider universe in terms of margins, and that a greater share of women on boards tends to correlate with higher margins.
In other words, family-owned companies with a greater share of female executives tend to generate better growth and better margins. Together with lower leverage, this supports above-average cash flow returns, all of which helps to explain why their share-price perfor-mance is superior too.
Family-owned companies and diversity: A surveyWe have conducted a survey to better under-stand the differences between family-owned companies with female executives and those without. We interviewed 120 family-owned companies. These companies are located in over ten different countries and generate on aver-age more than EUR 1 billion in annual revenue (Figure 10).
Throughout our survey, among other things, we have been able to review the differences between (1) female-founded family-owned companies and male-founded companies, and (2) female versus male CEOs and the impact of a greater share of women in executive positions on corporate strategy.
Family-owned companies with female foundersWe interviewed 56 executives of family-owned companies that had a female founder. Based on the survey results, it appears that female-founded family-owned companies have a number of striking differences to those that have male founders.
Female founded family-owned companies have more diverse boards: First, we find that family-owned companies founded by women tend to have a much more female-dominated executive board than those founded by men. For example, women make up more than half of the executive board in 62% of the female-founded family- owned companies interviewed. This compares to just 10% of the male-founded family-owned companies (Figure 11).
Figure 8: Revenue growth − family companies with female representation relative to male-only executive boards
Figure 9: EBITDA margins − greater female representation correlates with better margins (relative to male-only)
-8%
-6%
-4%
-2%
0%
2%
4%
6%
8%
2010 2011 2012 2013 2014 2015 2016 2017 2018
At least 1 female >10% female >20% female >30% female
0%
1%
2%
3%
4%
5%
6%
7%
8%
2010 2011 2012 2013 2014 2015 2016 2017 2018
At least 1 female >10% female >20% female >30% female
Figure 10: “What was your annual revenue last year in euro?”More than 60% generated at least EUR 1 bn in revenue in 2018
EUR 250 m to EUR 500 m
14%
EUR 500 m to EUR 1 bn
23%
EUR 1 bn to EUR 5 bn
40%
EUR 5 bn to EUR 10 bn
10%
Greater than EUR 10 bn
13%
Source: Credit Suisse Research based on 120 family-owned companies surveyed
Source: Credit Suisse Research, Thomson Reuters
Source: Credit Suisse Research, Thomson Reuters
34
Female-founded family-owned companies nevertheless appear to be smaller: As far as size is concerned, we found that family-owned companies established by women were smaller in terms of revenues and number of employees than those founded by men. For example, 73% of the male-founded family-owned companies have more than 1,000 employees compared to just 27% for the female-founded family-owned companies. As for annual revenue, we found that male-founded family-owned firms appear to generate more revenues. Some 17% of them generate revenues of more than EUR 10 billion compared to 7% for the female-operated companies. Of the latter group, 41% generate revenues of less than EUR 1 billion compared to 35% for the male-founded companies.
Future growth prospects look more promis-ing for female-founded companies: Although female-founded family-owned companies appeared smaller in terms of recent revenues, our survey suggests that this might be a tem-porary phenomenon because almost 75% of our surveyed female-founded companies expect revenue growth of more than 10% in each of the next three years. This compares to less than 40% for the male-founded companies.
Our survey also shows that female-founded family-owned companies tend to rely more on internally generated funds to support investment requirements, whereas male-founded companies tend to use equity financing and bank loans more. This feature tallies with the observation made earlier that family-owned companies with female representation tend to have lower gearing ratios.
Female-founded companies also tend to have greater family involvement: Family involvement in running a company is something that we believe adds value to a company on a through-cycle basis. Our survey suggests that female-founded companies tend to support this more than male-founded companies as 95% of them have at least one family member on the board (Figure 13). This compares to 86% for the male-founded companies.
Female-founded companies tend to be more focused on ESG and SDGs: Finally, we reviewed whether family-owned companies with and without female executives have a different view and focus on sustainability. Specifically, we examined the focus on the sustainable devel-opment goals (SDGs) established by the United Nations and on the environmental, social and governance (ESG) characteristics.
First, we note that female-founded family-owned companies appear to have a slightly greater focus on ESG than male-founded companies. In particular, environmental targets appear to be
Figure 11: “What percentage of your company’s board is made up of women?”
0%
10%
20%
30%
40%
50%
60%
Less than 25% Between 25% and50%
Between 50% and75%
More than 75%
Female founder Male founder
Figure 12: “What is a likely annual revenue growth rate for your company over the next three years?”
Figure 13: “Which of the following best describes the degree of involvement family members have in running the business?”
Source Figures 11–13: Credit Suisse Research based on 120 family-owned companies surveyed
0%
10%
20%
30%
40%
50%
60%
Less than 5% 5%-10% 10.1%-20% More than 20%
Female founder Male founder
0%
5%
10%
15%
20%
25%
30%
35%
40%
45%
No involvement orboard membership by
the familyshareholders
1 family member ison the board
2 family members areon the board
More than 2 familymembers are on the
board
Female Male
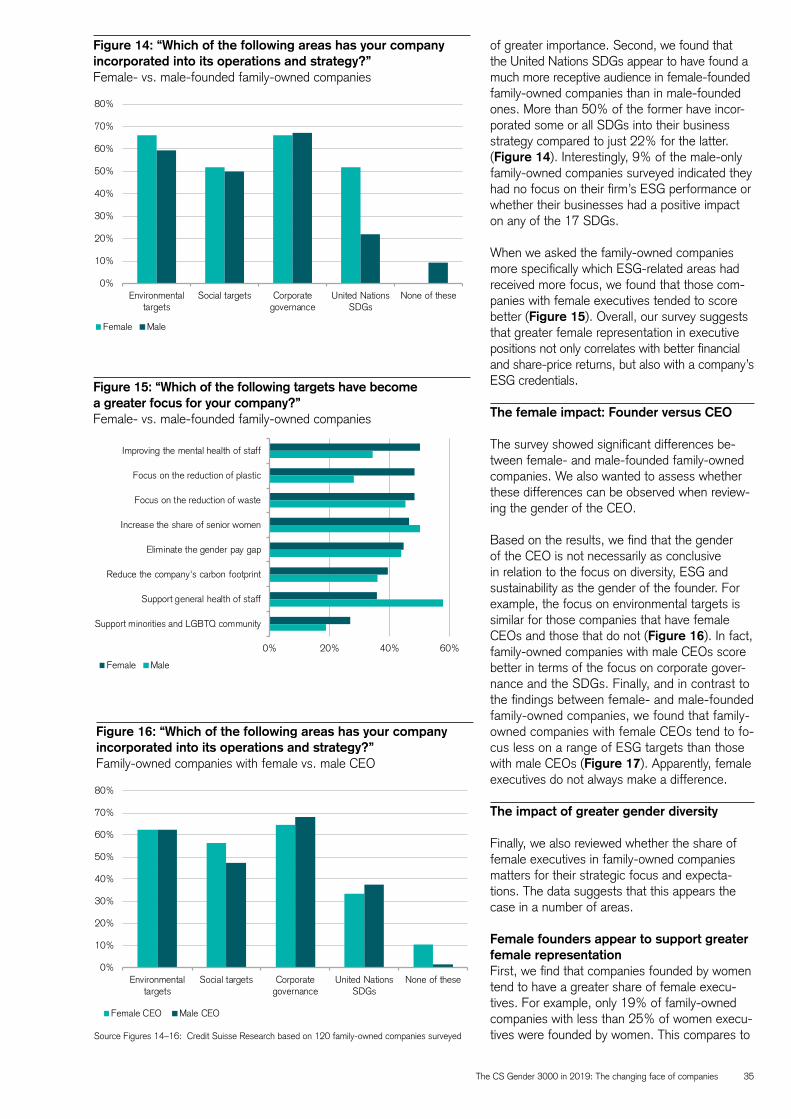
The CS Gender 3000 in 2019: The changing face of companies 35
of greater importance. Second, we found that the United Nations SDGs appear to have found a much more receptive audience in female-founded family-owned companies than in male-founded ones. More than 50% of the former have incor-porated some or all SDGs into their business strategy compared to just 22% for the latter. (Figure 14). Interestingly, 9% of the male-only family-owned companies surveyed indicated they had no focus on their firm’s ESG performance or whether their businesses had a positive impact on any of the 17 SDGs.
When we asked the family-owned companies more specifically which ESG-related areas had received more focus, we found that those com-panies with female executives tended to score better (Figure 15). Overall, our survey suggests that greater female representation in executive positions not only correlates with better financial and share-price returns, but also with a company’s ESG credentials.
The female impact: Founder versus CEO
The survey showed significant differences be-tween female- and male-founded family-owned companies. We also wanted to assess whether these differences can be observed when review-ing the gender of the CEO.
Based on the results, we find that the gender of the CEO is not necessarily as conclusive in relation to the focus on diversity, ESG and sustainability as the gender of the founder. For example, the focus on environmental targets is similar for those companies that have female CEOs and those that do not (Figure 16). In fact, family-owned companies with male CEOs score better in terms of the focus on corporate gover-nance and the SDGs. Finally, and in contrast to the findings between female- and male-founded family-owned companies, we found that family- owned companies with female CEOs tend to fo-cus less on a range of ESG targets than those with male CEOs (Figure 17). Apparently, female executives do not always make a difference.
The impact of greater gender diversity
Finally, we also reviewed whether the share of female executives in family-owned companies matters for their strategic focus and expecta-tions. The data suggests that this appears the case in a number of areas.
Female founders appear to support greater female representationFirst, we find that companies founded by women tend to have a greater share of female execu-tives. For example, only 19% of family-owned companies with less than 25% of women execu-tives were founded by women. This compares to
Figure 14: “Which of the following areas has your company incorporated into its operations and strategy?” Female- vs. male-founded family-owned companies
Figure 15: “Which of the following targets have become a greater focus for your company?” Female- vs. male-founded family-owned companies
0%
10%
20%
30%
40%
50%
60%
70%
80%
Environmentaltargets
Social targets Corporategovernance
United NationsSDGs
None of these
Female Male
0% 20% 40% 60%
Improving the mental health of staff
Focus on the reduction of plastic
Focus on the reduction of waste
Increase the share of senior women
Eliminate the gender pay gap
Reduce the company's carbon footprint
Support general health of staff
Support minorities and LGBTQ community
Female Male
Figure 16: “Which of the following areas has your company incorporated into its operations and strategy?”Family-owned companies with female vs. male CEO
Source Figures 14–16: Credit Suisse Research based on 120 family-owned companies surveyed
0%
10%
20%
30%
40%
50%
60%
70%
80%
Environmentaltargets
Social targets Corporategovernance
United NationsSDGs
None of these
Female CEO Male CEO
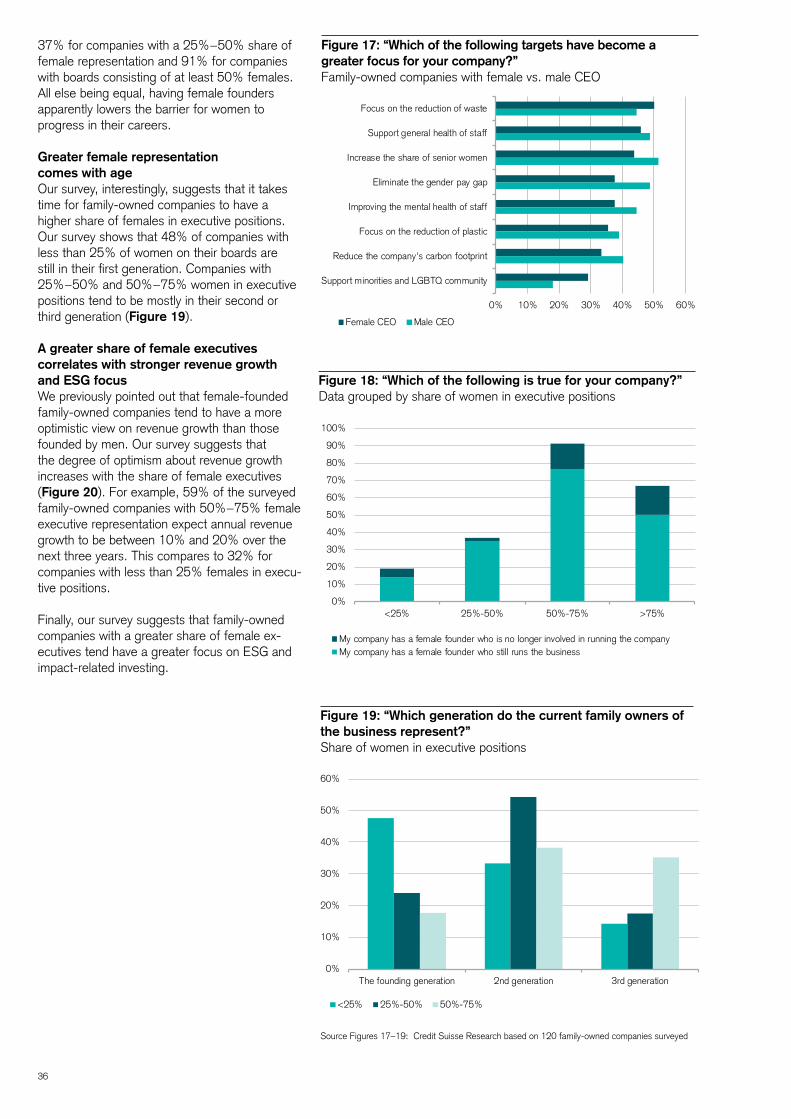
36
37% for companies with a 25%−50% share of female representation and 91% for companies with boards consisting of at least 50% females. All else being equal, having female founders apparently lowers the barrier for women to progress in their careers.
Greater female representation comes with ageOur survey, interestingly, suggests that it takes time for family-owned companies to have a higher share of females in executive positions. Our survey shows that 48% of companies with less than 25% of women on their boards are still in their first generation. Companies with 25%−50% and 50%−75% women in executive positions tend to be mostly in their second or third generation (Figure 19).
A greater share of female executives correlates with stronger revenue growth and ESG focusWe previously pointed out that female-founded family-owned companies tend to have a more optimistic view on revenue growth than those founded by men. Our survey suggests that the degree of optimism about revenue growth increases with the share of female executives (Figure 20). For example, 59% of the surveyed family-owned companies with 50%−75% female executive representation expect annual revenue growth to be between 10% and 20% over the next three years. This compares to 32% for companies with less than 25% females in execu-tive positions.
Finally, our survey suggests that family-owned companies with a greater share of female ex-ecutives tend have a greater focus on ESG and impact-related investing.
Figure 17: “Which of the following targets have become a greater focus for your company?”Family-owned companies with female vs. male CEO
Figure 18: “Which of the following is true for your company?” Data grouped by share of women in executive positions
Figure 19: “Which generation do the current family owners of the business represent?” Share of women in executive positions
0% 10% 20% 30% 40% 50% 60%
Focus on the reduction of waste
Support general health of staff
Increase the share of senior women
Eliminate the gender pay gap
Improving the mental health of staff
Focus on the reduction of plastic
Reduce the company's carbon footprint
Support minorities and LGBTQ community
Female CEO Male CEO
0%
10%
20%
30%
40%
50%
60%
70%
80%
90%
100%
<25% 25%-50% 50%-75% >75%
My company has a female founder who is no longer involved in running the companyMy company has a female founder who still runs the business
0%
10%
20%
30%
40%
50%
60%
The founding generation 2nd generation 3rd generation
<25% 25%-50% 50%-75%
Source Figures 17–19: Credit Suisse Research based on 120 family-owned companies surveyed
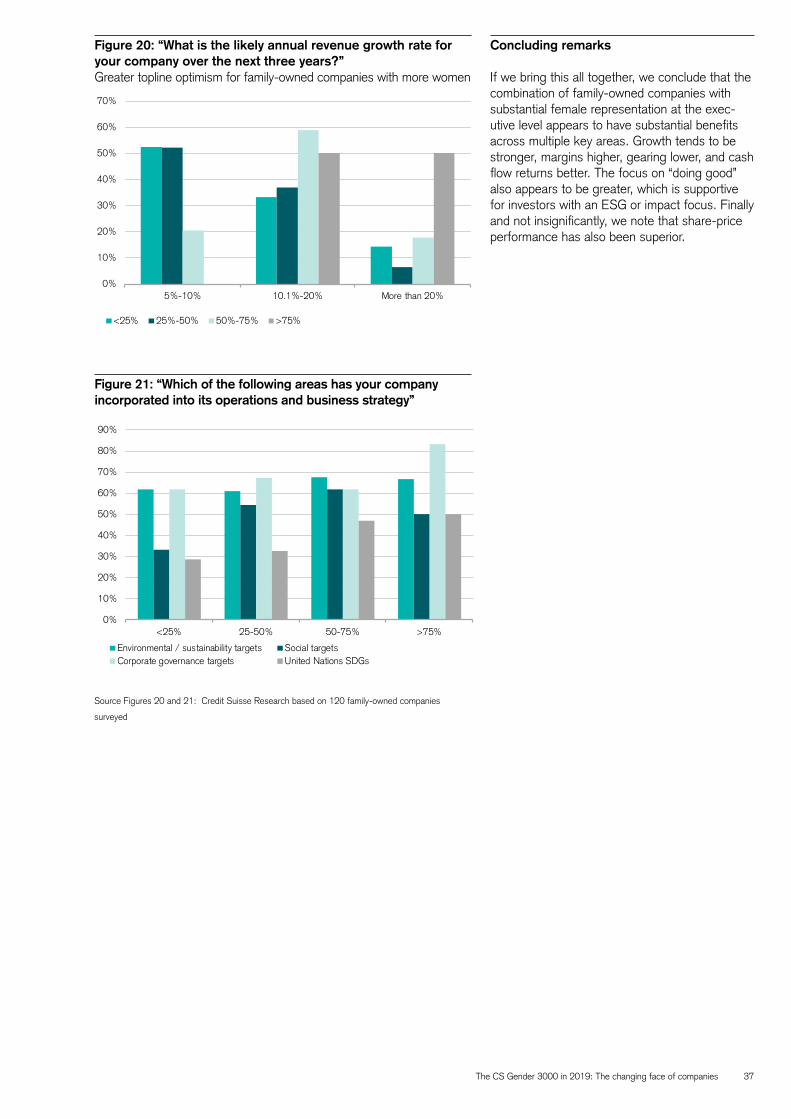
The CS Gender 3000 in 2019: The changing face of companies 37
Concluding remarks
If we bring this all together, we conclude that the combination of family-owned companies with substantial female representation at the exec-utive level appears to have substantial benefits across multiple key areas. Growth tends to be stronger, margins higher, gearing lower, and cash flow returns better. The focus on “doing good” also appears to be greater, which is supportive for investors with an ESG or impact focus. Finally and not insignificantly, we note that share-price performance has also been superior.
Figure 20: “What is the likely annual revenue growth rate for your company over the next three years?”Greater topline optimism for family-owned companies with more women
Figure 21: “Which of the following areas has your company incorporated into its operations and business strategy”
0%
10%
20%
30%
40%
50%
60%
70%
5%-10% 10.1%-20% More than 20%
<25% 25%-50% 50%-75% >75%
0%
10%
20%
30%
40%
50%
60%
70%
80%
90%
<25% 25-50% 50-75% >75%
Environmental / sustainability targets Social targetsCorporate governance targets United Nations SDGs
Source Figures 20 and 21: Credit Suisse Research based on 120 family-owned companies
surveyed

38
The CS Gender 3000 in 2019: The changing face of companies 39
Aligning career and family: A macro perspective
The trend: Higher labor force participation and lower fertility rates
At the beginning of the 20th century, women chose between having a family and pursuing a career. Reconciling both was nearly impossible: societal norms and the important amount of time needed to take care of a child left very little time to focus on a career.
Research by Professor Claudia Goldin (“A Long Road: the quest for career and family,” 2018) studied the evolution of career and family that took place across five cohorts of women since the
Anais Boussie
Many women today want to have both a career and a family, but aligning the two can be challenging as one can easily come at the expense of the other. Research has shown that having children can adversely impact women’s career and financial prospects. As such, lowering the barriers that exist (gender pay gap, time worked, cost of having children, etc.) is crucial to allow women to reconcile having both a career and a family. In our view, these socioeconomic challenges cannot solely be solved at the company/micro level. Public policies must be implemented if govern-ments want to boost fertility rates and female labor force participation.
Source: Credit Suisse, Claudia Goldin (Harvard University)
Table 1: Life patterns have changed throughout time in the USA
Birth year College graduation year Pattern Facts
1878-1897 1900-1920 Family or career50% of women graduates never had children and 30% never married
1898-1923 1920-1945 Job then family Women decided to have job first then family.
1924-1943 1945-1965 Family then job Baby boom period, very low age marriage.
1944-1957 1965-1980 Career then familyMarrying and having children came in later. Some women never had children.
1958-1978 1980-2000 Career and family In today’s cohort women have decided to have both
1900s (Table 1 summarizes her findings). Her work shows that different periods of time implied different priorities. Early 20th century women had to choose between having a family and having a career, while for most of the century, women had both children and a job/career but at different times. Today, Goldin’s research shows graduate women are not choosing a career over a family (or vice versa), they are having both.
Women today no longer expect to only have children and stay at home. It has become “socially normal” and widely accepted for women to work and participate financially in the household.
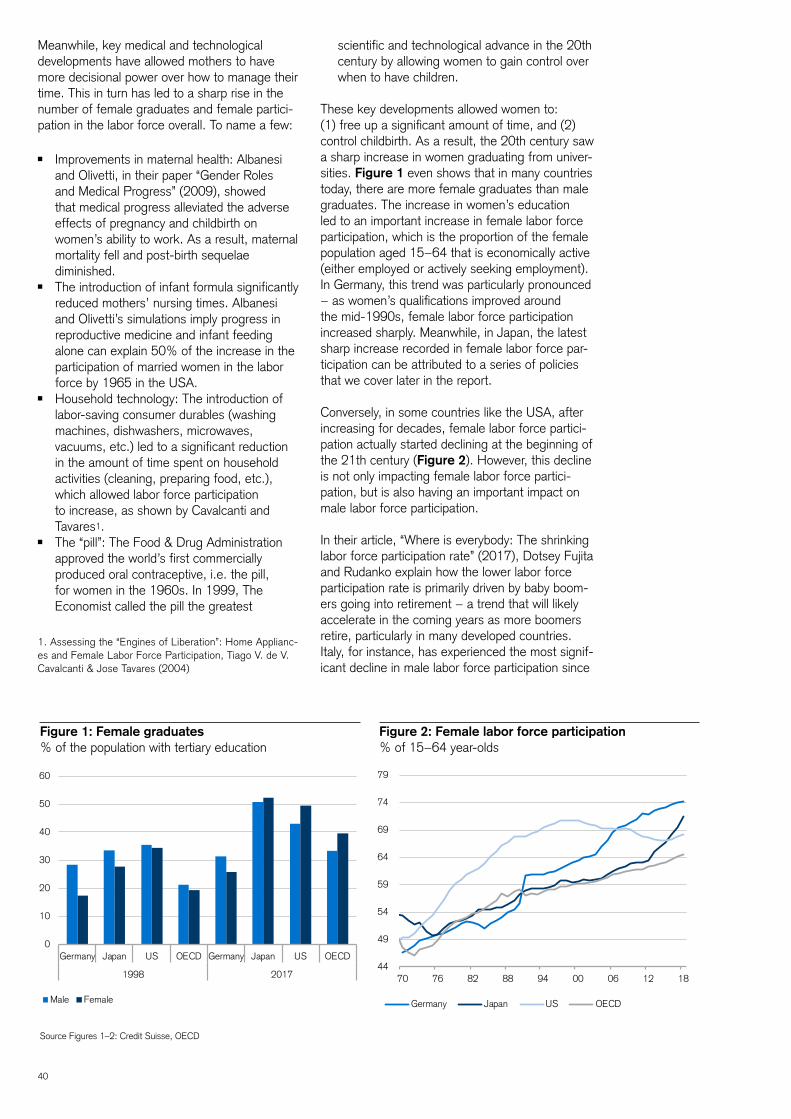
40
Meanwhile, key medical and technological developments have allowed mothers to have more decisional power over how to manage their time. This in turn has led to a sharp rise in the number of female graduates and female partici-pation in the labor force overall. To name a few:
ȹ Improvements in maternal health: Albanesi and Olivetti, in their paper “Gender Roles and Medical Progress” (2009), showed that medical progress alleviated the adverse effects of pregnancy and childbirth on women’s ability to work. As a result, maternal mortality fell and post-birth sequelae diminished.
ȹ The introduction of infant formula significantly reduced mothers’ nursing times. Albanesi and Olivetti’s simulations imply progress in reproductive medicine and infant feeding alone can explain 50% of the increase in the participation of married women in the labor force by 1965 in the USA.
ȹ Household technology: The introduction of labor-saving consumer durables (washing machines, dishwashers, microwaves, vacuums, etc.) led to a significant reduction in the amount of time spent on household activities (cleaning, preparing food, etc.), which allowed labor force participation to increase, as shown by Cavalcanti and Tavares1.
ȹ The “pill”: The Food & Drug Administration approved the world’s first commercially produced oral contraceptive, i.e. the pill, for women in the 1960s. In 1999, The Economist called the pill the greatest
1. Assessing the “Engines of Liberation”: Home Applianc-es and Female Labor Force Participation, Tiago V. de V. Cavalcanti & Jose Tavares (2004)
scientific and technological advance in the 20th century by allowing women to gain control over when to have children.
These key developments allowed women to: (1) free up a significant amount of time, and (2) control childbirth. As a result, the 20th century saw a sharp increase in women graduating from univer-sities. Figure 1 even shows that in many countries today, there are more female graduates than male graduates. The increase in women’s education led to an important increase in female labor force participation, which is the proportion of the female population aged 15−64 that is economically active (either employed or actively seeking employment). In Germany, this trend was particularly pronounced − as women’s qualifications improved around the mid-1990s, female labor force participation increased sharply. Meanwhile, in Japan, the latest sharp increase recorded in female labor force par-ticipation can be attributed to a series of policies that we cover later in the report.
Conversely, in some countries like the USA, after increasing for decades, female labor force partici-pation actually started declining at the beginning of the 21th century (Figure 2). However, this decline is not only impacting female labor force partici-pation, but is also having an important impact on male labor force participation.
In their article, “Where is everybody: The shrinking labor force participation rate” (2017), Dotsey Fujita and Rudanko explain how the lower labor force participation rate is primarily driven by baby boom-ers going into retirement − a trend that will likely accelerate in the coming years as more boomers retire, particularly in many developed countries. Italy, for instance, has experienced the most signif-icant decline in male labor force participation since
Figure 1: Female graduates% of the population with tertiary education
Figure 2: Female labor force participation % of 15−64 year-olds
Source Figures 1–2: Credit Suisse, OECD
0
10
20
30
40
50
60
Germany Japan US OECD Germany Japan US OECD
1998 2017
Male Female
44
49
54
59
64
69
74
79
70 76 82 88 94 00 06 12 18
Germany Japan US OECD
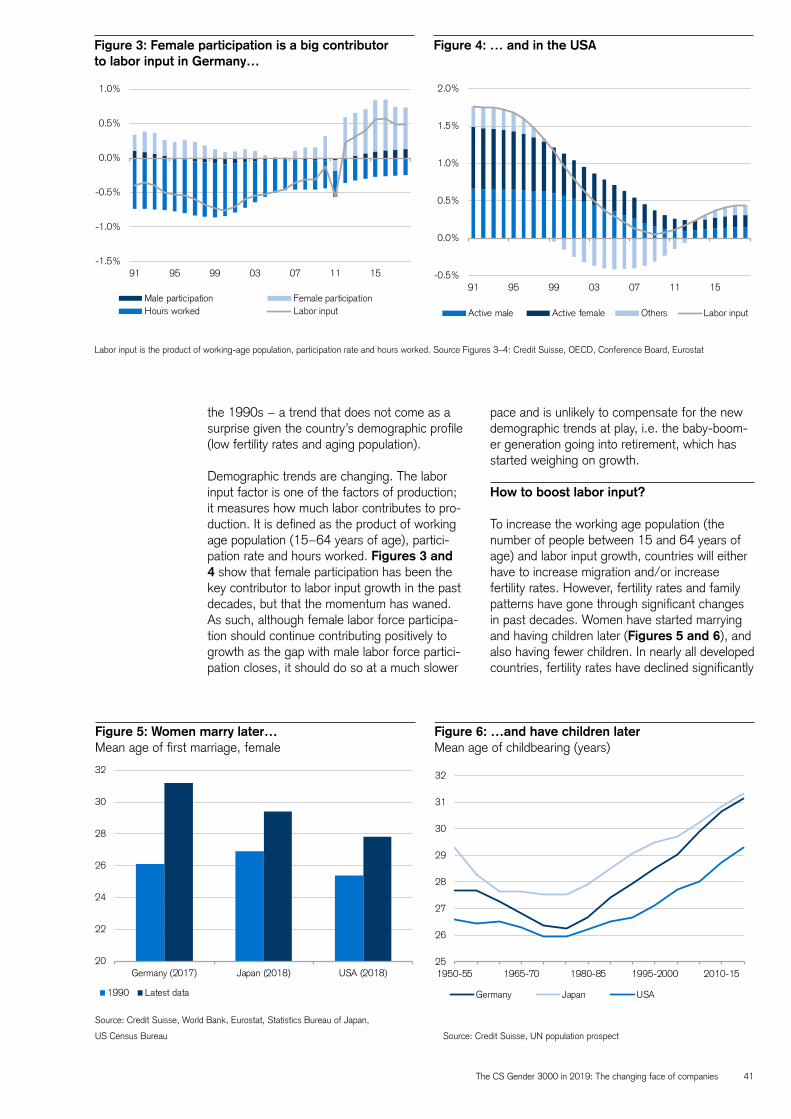
The CS Gender 3000 in 2019: The changing face of companies 41
the 1990s − a trend that does not come as a surprise given the country’s demographic profile (low fertility rates and aging population).
Demographic trends are changing. The labor input factor is one of the factors of production; it measures how much labor contributes to pro-duction. It is defined as the product of working age population (15−64 years of age), partici-pation rate and hours worked. Figures 3 and 4 show that female participation has been the key contributor to labor input growth in the past decades, but that the momentum has waned. As such, although female labor force participa-tion should continue contributing positively to growth as the gap with male labor force partici-pation closes, it should do so at a much slower
Figure 5: Women marry later…Mean age of first marriage, female
Figure 6: …and have children laterMean age of childbearing (years)
Source: Credit Suisse, World Bank, Eurostat, Statistics Bureau of Japan,
US Census Bureau
Figure 3: Female participation is a big contributor to labor input in Germany…
Figure 4: … and in the USA
Labor input is the product of working-age population, participation rate and hours worked. Source Figures 3–4: Credit Suisse, OECD, Conference Board, Eurostat
pace and is unlikely to compensate for the new demographic trends at play, i.e. the baby-boom-er generation going into retirement, which has started weighing on growth.
How to boost labor input?
To increase the working age population (the number of people between 15 and 64 years of age) and labor input growth, countries will either have to increase migration and/or increase fertility rates. However, fertility rates and family patterns have gone through significant changes in past decades. Women have started marrying and having children later (Figures 5 and 6), and also having fewer children. In nearly all developed countries, fertility rates have declined significantly
Source: Credit Suisse, UN population prospect
20
22
24
26
28
30
32
Germany (2017) Japan (2018) USA (2018)
1990 Latest data
25
26
27
28
29
30
31
32
1950-55 1965-70 1980-85 1995-2000 2010-15
Germany Japan USA
-1.5%
-1.0%
-0.5%
0.0%
0.5%
1.0%
91 95 99 03 07 11 15
Male participation Female participationHours worked Labor input
-0.5%
0.0%
0.5%
1.0%
1.5%
2.0%
91 95 99 03 07 11 15
Active male Active female Others Labor input
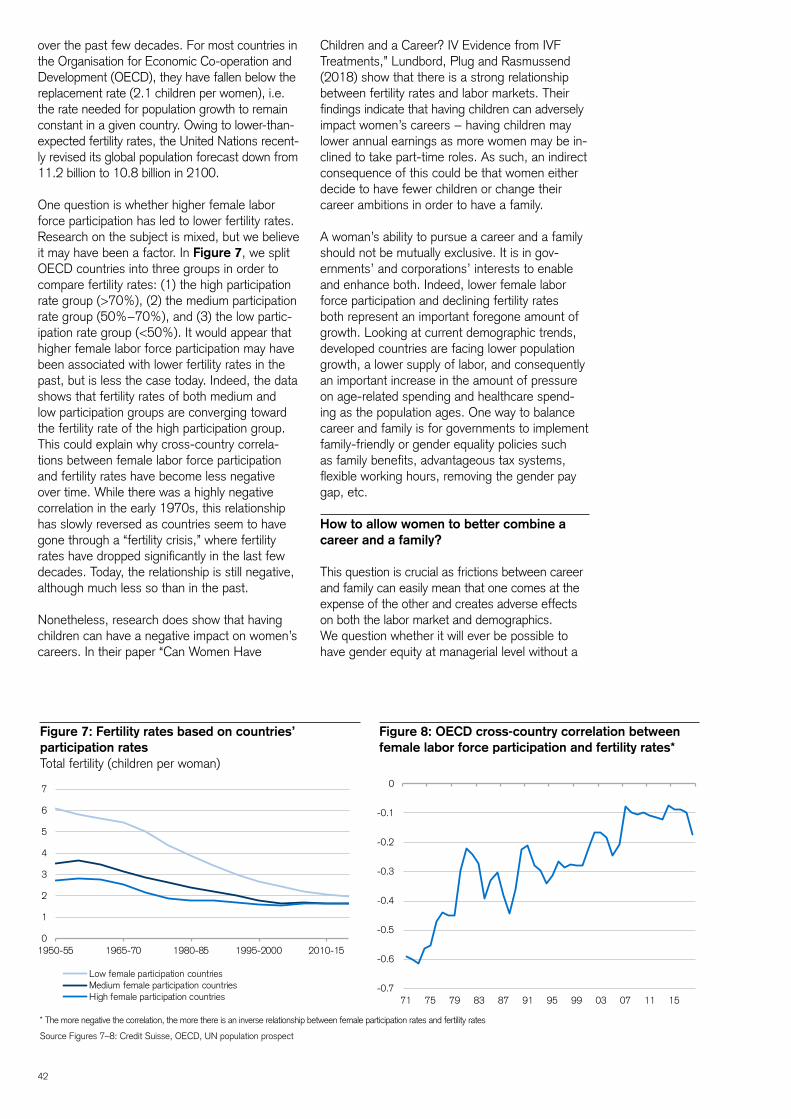
42
over the past few decades. For most countries in the Organisation for Economic Co-operation and Development (OECD), they have fallen below the replacement rate (2.1 children per women), i.e. the rate needed for population growth to remain constant in a given country. Owing to lower-than- expected fertility rates, the United Nations recent-ly revised its global population forecast down from 11.2 billion to 10.8 billion in 2100.
One question is whether higher female labor force participation has led to lower fertility rates. Research on the subject is mixed, but we believe it may have been a factor. In Figure 7, we split OECD countries into three groups in order to compare fertility rates: (1) the high participation rate group (>70%), (2) the medium participation rate group (50%−70%), and (3) the low partic-ipation rate group (<50%). It would appear that higher female labor force participation may have been associated with lower fertility rates in the past, but is less the case today. Indeed, the data shows that fertility rates of both medium and low participation groups are converging toward the fertility rate of the high participation group. This could explain why cross-country correla-tions between female labor force participation and fertility rates have become less negative over time. While there was a highly negative correlation in the early 1970s, this relationship has slowly reversed as countries seem to have gone through a “fertility crisis,” where fertility rates have dropped significantly in the last few decades. Today, the relationship is still negative, although much less so than in the past.
Nonetheless, research does show that having children can have a negative impact on women’s careers. In their paper “Can Women Have
Children and a Career? IV Evidence from IVF Treatments,” Lundbord, Plug and Rasmussend (2018) show that there is a strong relationship between fertility rates and labor markets. Their findings indicate that having children can adversely impact women’s careers − having children may lower annual earnings as more women may be in-clined to take part-time roles. As such, an indirect consequence of this could be that women either decide to have fewer children or change their career ambitions in order to have a family.
A woman’s ability to pursue a career and a family should not be mutually exclusive. It is in gov-ernments’ and corporations’ interests to enable and enhance both. Indeed, lower female labor force participation and declining fertility rates both represent an important foregone amount of growth. Looking at current demographic trends, developed countries are facing lower population growth, a lower supply of labor, and consequently an important increase in the amount of pressure on age-related spending and healthcare spend-ing as the population ages. One way to balance career and family is for governments to implement family-friendly or gender equality policies such as family benefits, advantageous tax systems, flexible working hours, removing the gender pay gap, etc.
How to allow women to better combine a career and a family?
This question is crucial as frictions between career and family can easily mean that one comes at the expense of the other and creates adverse effects on both the labor market and demographics. We question whether it will ever be possible to have gender equity at managerial level without a
Figure 7: Fertility rates based on countries’ participation rates Total fertility (children per woman)
Figure 8: OECD cross-country correlation between female labor force participation and fertility rates*
* The more negative the correlation, the more there is an inverse relationship between female participation rates and fertility rates
Source Figures 7–8: Credit Suisse, OECD, UN population prospect
0
1
2
3
4
5
6
7
1950-55 1965-70 1980-85 1995-2000 2010-15
Low female participation countriesMedium female participation countriesHigh female participation countries
-0.7
-0.6
-0.5
-0.4
-0.3
-0.2
-0.1
0
71 75 79 83 87 91 95 99 03 07 11 15
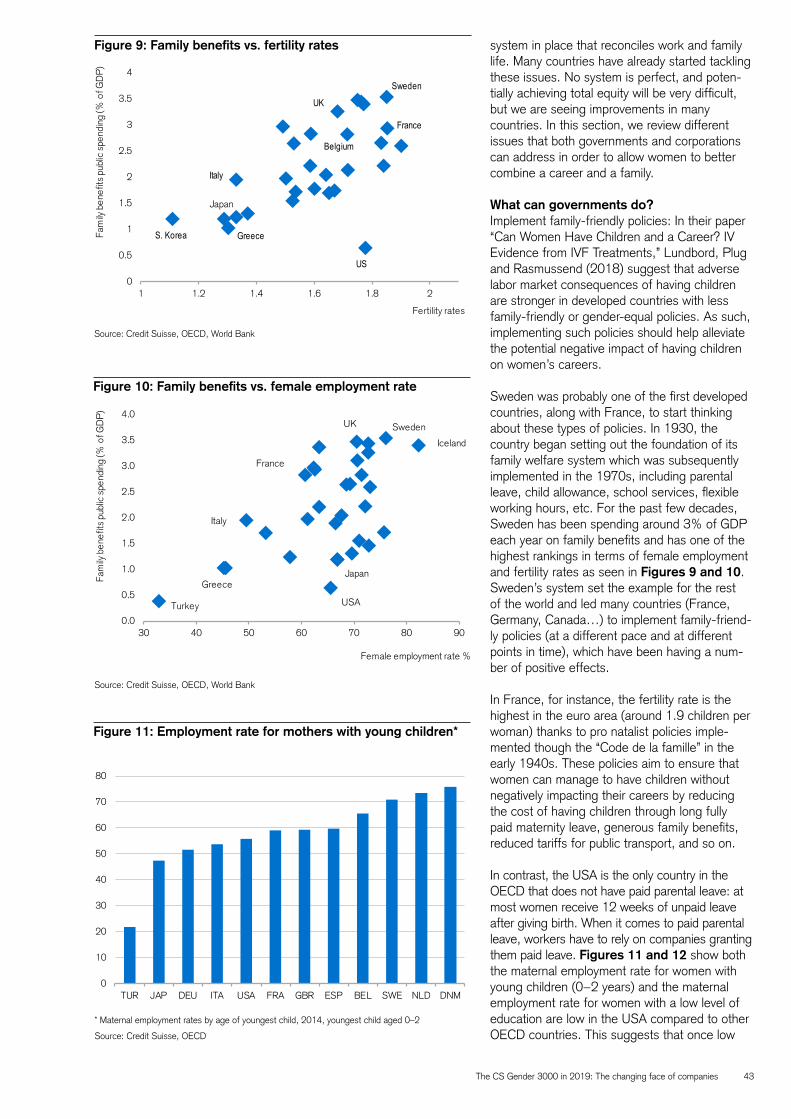
The CS Gender 3000 in 2019: The changing face of companies 43
system in place that reconciles work and family life. Many countries have already started tackling these issues. No system is perfect, and poten-tially achieving total equity will be very difficult, but we are seeing improvements in many countries. In this section, we review different issues that both governments and corporations can address in order to allow women to better combine a career and a family.
What can governments do?Implement family-friendly policies: In their paper “Can Women Have Children and a Career? IV Evidence from IVF Treatments,” Lundbord, Plug and Rasmussend (2018) suggest that adverse labor market consequences of having children are stronger in developed countries with less family-friendly or gender-equal policies. As such, implementing such policies should help alleviate the potential negative impact of having children on women’s careers.
Sweden was probably one of the first developed countries, along with France, to start thinking about these types of policies. In 1930, the country began setting out the foundation of its family welfare system which was subsequently implemented in the 1970s, including parental leave, child allowance, school services, flexible working hours, etc. For the past few decades, Sweden has been spending around 3% of GDP each year on family benefits and has one of the highest rankings in terms of female employment and fertility rates as seen in Figures 9 and 10. Sweden’s system set the example for the rest of the world and led many countries (France, Germany, Canada…) to implement family-friend-ly policies (at a different pace and at different points in time), which have been having a num-ber of positive effects.
In France, for instance, the fertility rate is the highest in the euro area (around 1.9 children per woman) thanks to pro natalist policies imple-mented though the “Code de la famille” in the early 1940s. These policies aim to ensure that women can manage to have children without negatively impacting their careers by reducing the cost of having children through long fully paid maternity leave, generous family benefits, reduced tariffs for public transport, and so on.
In contrast, the USA is the only country in the OECD that does not have paid parental leave: at most women receive 12 weeks of unpaid leave after giving birth. When it comes to paid parental leave, workers have to rely on companies granting them paid leave. Figures 11 and 12 show both the maternal employment rate for women with young children (0−2 years) and the maternal employment rate for women with a low level of education are low in the USA compared to other OECD countries. This suggests that once low
Figure 9: Family benefits vs. fertility rates
Figure 10: Family benefits vs. female employment rate
Source: Credit Suisse, OECD, World Bank
Source: Credit Suisse, OECD, World Bank
Figure 11: Employment rate for mothers with young children*
* Maternal employment rates by age of youngest child, 2014, youngest child aged 0–2
Source: Credit Suisse, OECD
0
10
20
30
40
50
60
70
80
TUR JAP DEU ITA USA FRA GBR ESP BEL SWE NLD DNM
Belgium
S. Korea
UK
France
US
Sweden
Italy
Greece
0
0.5
1
1.5
2
2.5
3
3.5
4
1 1.2 1.4 1.6 1.8 2
Fam
ily b
enef
its p
ublic
spe
ndin
g (%
of G
DP
)
Fertility rates
Japan
Iceland
UK
France
Greece
Italy
USA
Sweden
Turkey
0.0
0.5
1.0
1.5
2.0
2.5
3.0
3.5
4.0
30 40 50 60 70 80 90
Fam
ily b
enef
its p
ublic
spe
ndin
g (%
of G
DP
)
Female employment rate %
Japan
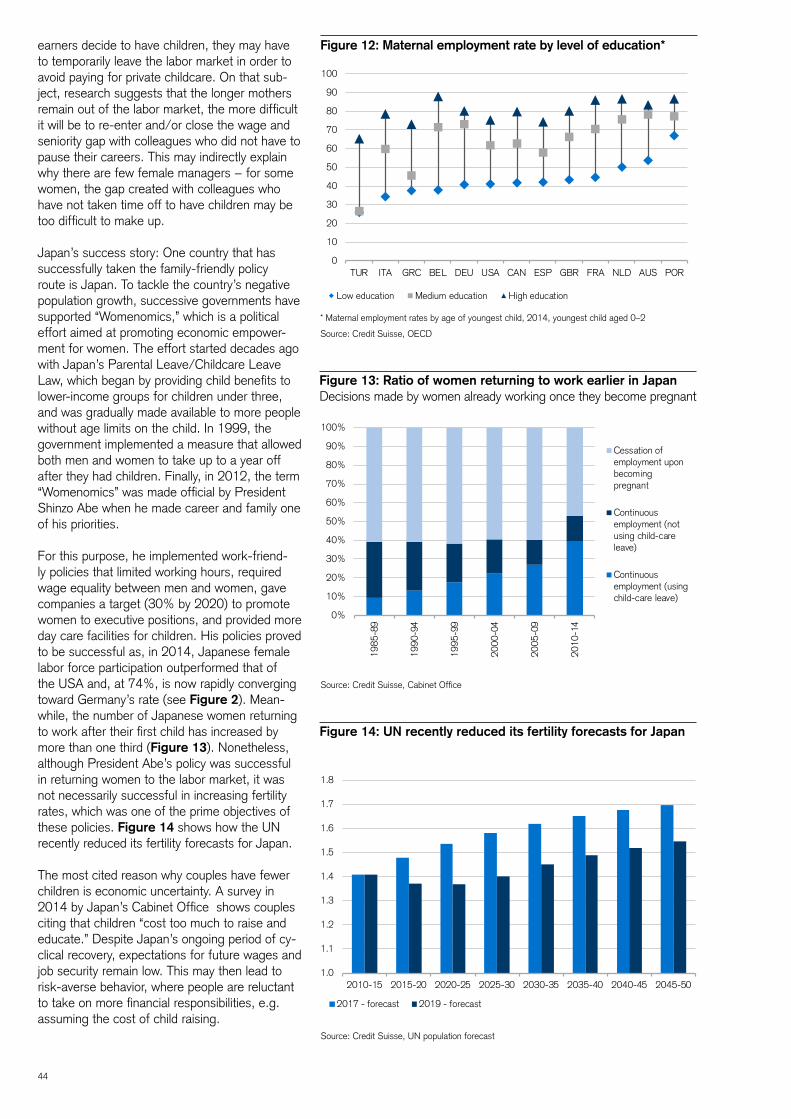
44
earners decide to have children, they may have to temporarily leave the labor market in order to avoid paying for private childcare. On that sub-ject, research suggests that the longer mothers remain out of the labor market, the more difficult it will be to re-enter and/or close the wage and seniority gap with colleagues who did not have to pause their careers. This may indirectly explain why there are few female managers − for some women, the gap created with colleagues who have not taken time off to have children may be too difficult to make up.
Japan’s success story: One country that has successfully taken the family-friendly policy route is Japan. To tackle the country’s negative population growth, successive governments have supported “Womenomics,” which is a political effort aimed at promoting economic empower-ment for women. The effort started decades ago with Japan’s Parental Leave/Childcare Leave Law, which began by providing child benefits to lower-income groups for children under three, and was gradually made available to more people without age limits on the child. In 1999, the government implemented a measure that allowed both men and women to take up to a year off after they had children. Finally, in 2012, the term “Womenomics” was made official by President Shinzo Abe when he made career and family one of his priorities.
For this purpose, he implemented work-friend-ly policies that limited working hours, required wage equality between men and women, gave companies a target (30% by 2020) to promote women to executive positions, and provided more day care facilities for children. His policies proved to be successful as, in 2014, Japanese female labor force participation outperformed that of the USA and, at 74%, is now rapidly converging toward Germany’s rate (see Figure 2). Mean-while, the number of Japanese women returning to work after their first child has increased by more than one third (Figure 13). Nonetheless, although President Abe’s policy was successful in returning women to the labor market, it was not necessarily successful in increasing fertility rates, which was one of the prime objectives of these policies. Figure 14 shows how the UN recently reduced its fertility forecasts for Japan.
The most cited reason why couples have fewer children is economic uncertainty. A survey in 2014 by Japan’s Cabinet Office shows couples citing that children “cost too much to raise and educate.” Despite Japan’s ongoing period of cy-clical recovery, expectations for future wages and job security remain low. This may then lead to risk-averse behavior, where people are reluctant to take on more financial responsibilities, e.g. assuming the cost of child raising.
Figure 12: Maternal employment rate by level of education*
Figure 13: Ratio of women returning to work earlier in JapanDecisions made by women already working once they become pregnant
* Maternal employment rates by age of youngest child, 2014, youngest child aged 0–2
Source: Credit Suisse, OECD
Source: Credit Suisse, Cabinet Office
Figure 14: UN recently reduced its fertility forecasts for Japan
Source: Credit Suisse, UN population forecast
0%
10%
20%
30%
40%
50%
60%
70%
80%
90%
100%
1985
-89
1990
-94
1995
-99
2000
-04
2005
-09
2010
-14
Cessation ofemployment uponbecomingpregnant
Continuousemployment (notusing child-careleave)
Continuousemployment (usingchild-care leave)
1.0
1.1
1.2
1.3
1.4
1.5
1.6
1.7
1.8
2010-15 2015-20 2020-25 2025-30 2030-35 2035-40 2040-45 2045-50
2017 - forecast 2019 - forecast
0
10
20
30
40
50
60
70
80
90
100
TUR ITA GRC BEL DEU USA CAN ESP GBR FRA NLD AUS POR
Low education Medium education High education
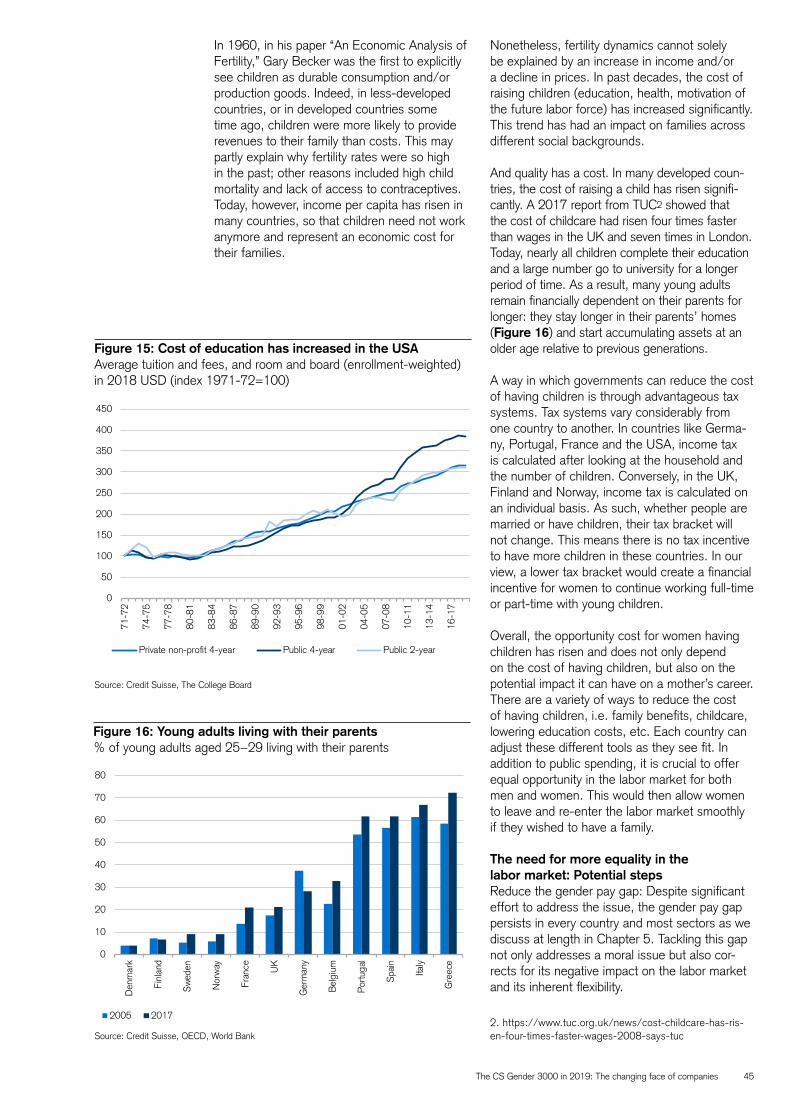
The CS Gender 3000 in 2019: The changing face of companies 45
In 1960, in his paper “An Economic Analysis of Fertility,” Gary Becker was the first to explicitly see children as durable consumption and/or production goods. Indeed, in less-developed countries, or in developed countries some time ago, children were more likely to provide revenues to their family than costs. This may partly explain why fertility rates were so high in the past; other reasons included high child mortality and lack of access to contraceptives. Today, however, income per capita has risen in many countries, so that children need not work anymore and represent an economic cost for their families.
Figure 15: Cost of education has increased in the USAAverage tuition and fees, and room and board (enrollment-weighted) in 2018 USD (index 1971-72=100)
Figure 16: Young adults living with their parents% of young adults aged 25−29 living with their parents
Source: Credit Suisse, The College Board
Source: Credit Suisse, OECD, World Bank
0
10
20
30
40
50
60
70
80
Den
mar
k
Finl
and
Sw
eden
Nor
way
Fran
ce UK
Ger
man
y
Bel
gium
Por
tuga
l
Spa
in
Italy
Gre
ece
2005 2017
Nonetheless, fertility dynamics cannot solely be explained by an increase in income and/or a decline in prices. In past decades, the cost of raising children (education, health, motivation of the future labor force) has increased significantly. This trend has had an impact on families across different social backgrounds.
And quality has a cost. In many developed coun-tries, the cost of raising a child has risen signifi-cantly. A 2017 report from TUC2 showed that the cost of childcare had risen four times faster than wages in the UK and seven times in London. Today, nearly all children complete their education and a large number go to university for a longer period of time. As a result, many young adults remain financially dependent on their parents for longer: they stay longer in their parents’ homes (Figure 16) and start accumulating assets at an older age relative to previous generations.
A way in which governments can reduce the cost of having children is through advantageous tax systems. Tax systems vary considerably from one country to another. In countries like Germa-ny, Portugal, France and the USA, income tax is calculated after looking at the household and the number of children. Conversely, in the UK, Finland and Norway, income tax is calculated on an individual basis. As such, whether people are married or have children, their tax bracket will not change. This means there is no tax incentive to have more children in these countries. In our view, a lower tax bracket would create a financial incentive for women to continue working full-time or part-time with young children.
Overall, the opportunity cost for women having children has risen and does not only depend on the cost of having children, but also on the potential impact it can have on a mother’s career. There are a variety of ways to reduce the cost of having children, i.e. family benefits, childcare, lowering education costs, etc. Each country can adjust these different tools as they see fit. In addition to public spending, it is crucial to offer equal opportunity in the labor market for both men and women. This would then allow women to leave and re-enter the labor market smoothly if they wished to have a family.
The need for more equality in the labor market: Potential stepsReduce the gender pay gap: Despite significant effort to address the issue, the gender pay gap persists in every country and most sectors as we discuss at length in Chapter 5. Tackling this gap not only addresses a moral issue but also cor-rects for its negative impact on the labor market and its inherent flexibility.
2. https://www.tuc.org.uk/news/cost-childcare-has-ris-en-four-times-faster-wages-2008-says-tuc
0
50
100
150
200
250
300
350
400
450
71-7
2
74-7
5
77-7
8
80-8
1
83-8
4
86-8
7
89-9
0
92-9
3
95-9
6
98-9
9
01-0
2
04-0
5
07-0
8
10-1
1
13-1
4
16-1
7
Private non-profit 4-year Public 4-year Public 2-year
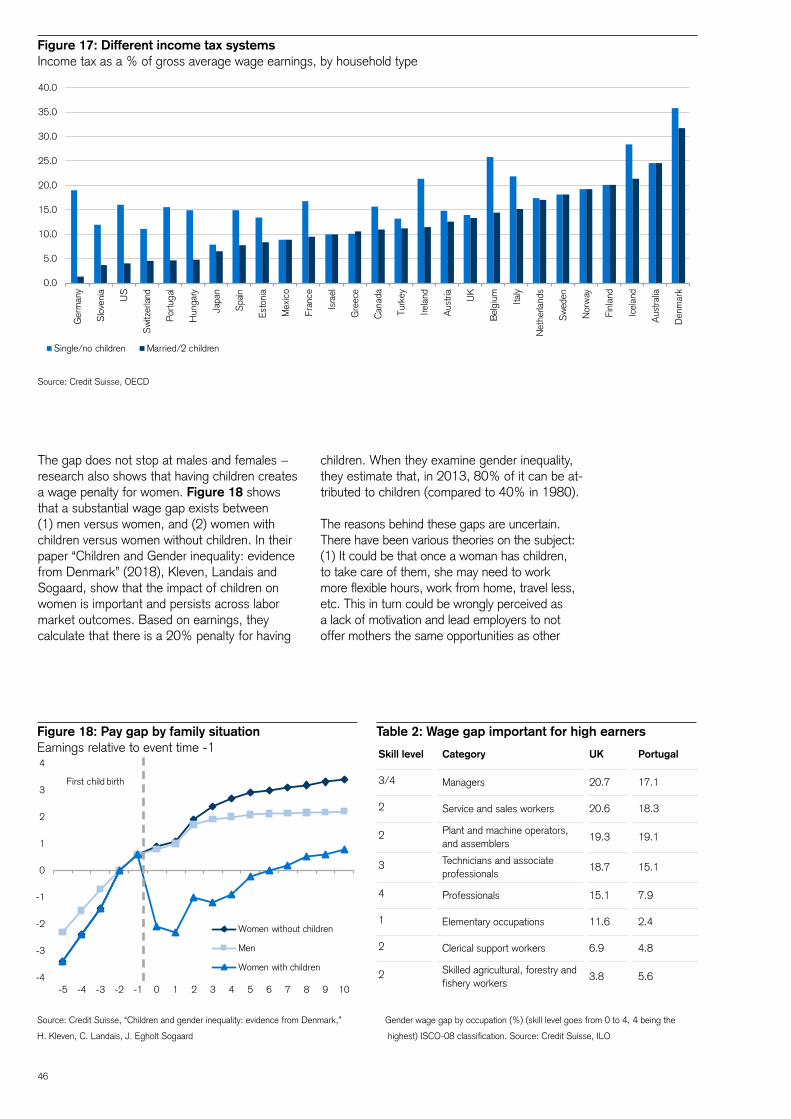
46
-4
-3
-2
-1
0
1
2
3
4
-5 -4 -3 -2 -1 0 1 2 3 4 5 6 7 8 9 10
Women without children
Men
Women with children
First child birth
Figure 17: Different income tax systems Income tax as a % of gross average wage earnings, by household type
Source: Credit Suisse, OECD
The gap does not stop at males and females − research also shows that having children creates a wage penalty for women. Figure 18 shows that a substantial wage gap exists between (1) men versus women, and (2) women with children versus women without children. In their paper “Children and Gender inequality: evidence from Denmark” (2018), Kleven, Landais and Sogaard, show that the impact of children on women is important and persists across labor market outcomes. Based on earnings, they calculate that there is a 20% penalty for having
children. When they examine gender inequality, they estimate that, in 2013, 80% of it can be at-tributed to children (compared to 40% in 1980).
The reasons behind these gaps are uncertain. There have been various theories on the subject: (1) It could be that once a woman has children, to take care of them, she may need to work more flexible hours, work from home, travel less, etc. This in turn could be wrongly perceived as a lack of motivation and lead employers to not offer mothers the same opportunities as other
0.0
5.0
10.0
15.0
20.0
25.0
30.0
35.0
40.0G
erm
any
Slo
veni
a
US
Sw
itzer
land
Por
tuga
l
Hun
gary
Japa
n
Spa
in
Esto
nia
Mex
ico
Fran
ce
Isra
el
Gre
ece
Can
ada
Turk
ey
Irela
nd
Aus
tria
UK
Bel
gium Ita
ly
Net
herla
nds
Sw
eden
Nor
way
Finl
and
Icel
and
Aus
tralia
Den
mar
k
Single/no children Married/2 children
Figure 18: Pay gap by family situationEarnings relative to event time -1
Table 2: Wage gap important for high earners
Source: Credit Suisse, “Children and gender inequality: evidence from Denmark,”
H. Kleven, C. Landais, J. Egholt Sogaard
Gender wage gap by occupation (%) (skill level goes from 0 to 4, 4 being the
highest) ISCO-08 classification. Source: Credit Suisse, ILO
Skill level Category UK Portugal
3/4 Managers 20.7 17.1
2 Service and sales workers 20.6 18.3
2 Plant and machine operators, and assemblers
19.3 19.1
3 Technicians and associate professionals
18.7 15.1
4 Professionals 15.1 7.9
1 Elementary occupations 11.6 2.4
2 Clerical support workers 6.9 4.8
2 Skilled agricultural, forestry and fishery workers
3.8 5.6
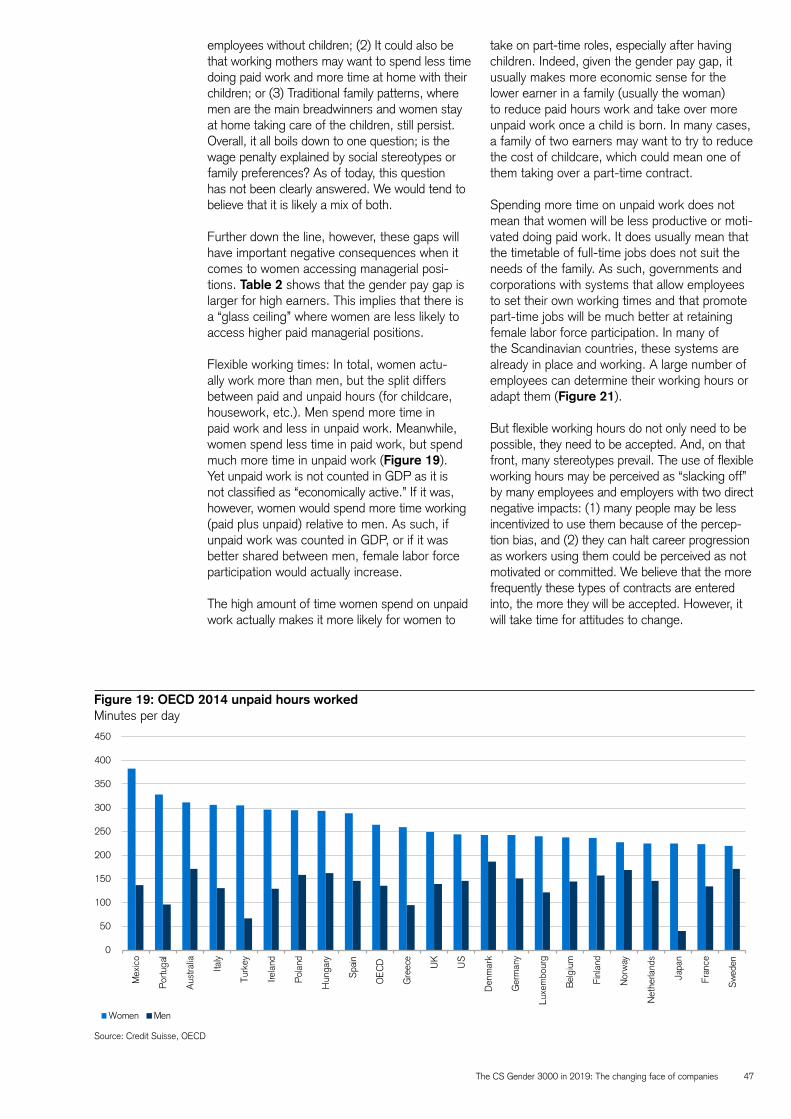
The CS Gender 3000 in 2019: The changing face of companies 47
employees without children; (2) It could also be that working mothers may want to spend less time doing paid work and more time at home with their children; or (3) Traditional family patterns, where men are the main breadwinners and women stay at home taking care of the children, still persist. Overall, it all boils down to one question; is the wage penalty explained by social stereotypes or family preferences? As of today, this question has not been clearly answered. We would tend to believe that it is likely a mix of both.
Further down the line, however, these gaps will have important negative consequences when it comes to women accessing managerial posi-tions. Table 2 shows that the gender pay gap is larger for high earners. This implies that there is a “glass ceiling” where women are less likely to access higher paid managerial positions.
Flexible working times: In total, women actu-ally work more than men, but the split differs between paid and unpaid hours (for childcare, housework, etc.). Men spend more time in paid work and less in unpaid work. Meanwhile, women spend less time in paid work, but spend much more time in unpaid work (Figure 19). Yet unpaid work is not counted in GDP as it is not classified as “economically active.” If it was, however, women would spend more time working (paid plus unpaid) relative to men. As such, if unpaid work was counted in GDP, or if it was better shared between men, female labor force participation would actually increase.
The high amount of time women spend on unpaid work actually makes it more likely for women to
Figure 19: OECD 2014 unpaid hours worked Minutes per day
Source: Credit Suisse, OECD
0
50
100
150
200
250
300
350
400
450
Mex
ico
Por
tuga
l
Aus
tralia
Italy
Turk
ey
Irela
nd
Pol
and
Hun
gary
Spa
in
OE
CD
Gre
ece
UK
US
Den
mar
k
Ger
man
y
Luxe
mbo
urg
Bel
gium
Finl
and
Nor
way
Net
herla
nds
Japa
n
Fran
ce
Sw
eden
Women Men
take on part-time roles, especially after having children. Indeed, given the gender pay gap, it usually makes more economic sense for the lower earner in a family (usually the woman) to reduce paid hours work and take over more unpaid work once a child is born. In many cases, a family of two earners may want to try to reduce the cost of childcare, which could mean one of them taking over a part-time contract.
Spending more time on unpaid work does not mean that women will be less productive or moti-vated doing paid work. It does usually mean that the timetable of full-time jobs does not suit the needs of the family. As such, governments and corporations with systems that allow employees to set their own working times and that promote part-time jobs will be much better at retaining female labor force participation. In many of the Scandinavian countries, these systems are already in place and working. A large number of employees can determine their working hours or adapt them (Figure 21).
But flexible working hours do not only need to be possible, they need to be accepted. And, on that front, many stereotypes prevail. The use of flexible working hours may be perceived as “slacking off” by many employees and employers with two direct negative impacts: (1) many people may be less incentivized to use them because of the percep-tion bias, and (2) they can halt career progression as workers using them could be perceived as not motivated or committed. We believe that the more frequently these types of contracts are entered into, the more they will be accepted. However, it will take time for attitudes to change.
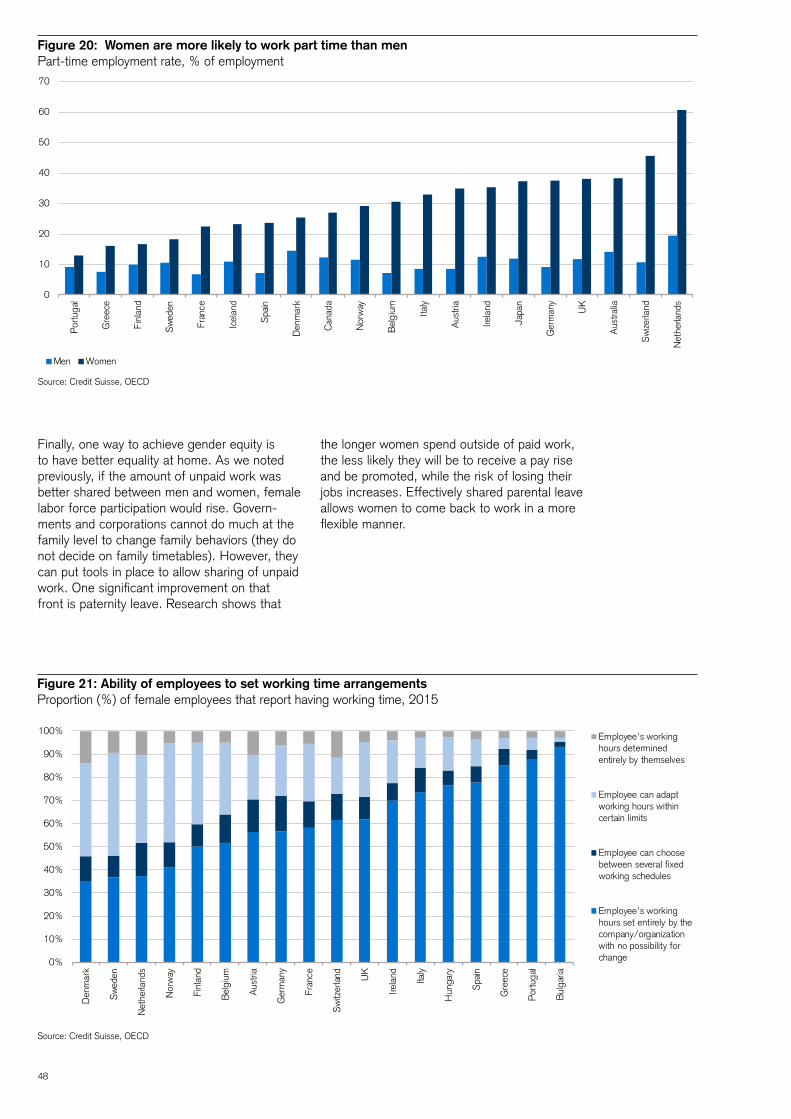
48
Finally, one way to achieve gender equity is to have better equality at home. As we noted previously, if the amount of unpaid work was better shared between men and women, female labor force participation would rise. Govern-ments and corporations cannot do much at the family level to change family behaviors (they do not decide on family timetables). However, they can put tools in place to allow sharing of unpaid work. One significant improvement on that front is paternity leave. Research shows that
the longer women spend outside of paid work, the less likely they will be to receive a pay rise and be promoted, while the risk of losing their jobs increases. Effectively shared parental leave allows women to come back to work in a more flexible manner.
Figure 20: Women are more likely to work part time than men Part-time employment rate, % of employment
Source: Credit Suisse, OECD
Figure 21: Ability of employees to set working time arrangements Proportion (%) of female employees that report having working time, 2015
Source: Credit Suisse, OECD
0
10
20
30
40
50
60
70P
ortu
gal
Gre
ece
Finl
and
Sw
eden
Fran
ce
Icel
and
Spa
in
Den
mar
k
Can
ada
Nor
way
Bel
gium Ita
ly
Aus
tria
Irela
nd
Japa
n
Ger
man
y
UK
Aus
tralia
Sw
izerla
nd
Net
herla
nds
Men Women
0%
10%
20%
30%
40%
50%
60%
70%
80%
90%
100%
Den
mar
k
Sw
eden
Net
herla
nds
Nor
way
Finl
and
Bel
gium
Aus
tria
Ger
man
y
Fran
ce
Sw
itzer
land UK
Irela
nd Italy
Hun
gary
Spa
in
Gre
ece
Por
tuga
l
Bul
garia
Employee's workinghours determinedentirely by themselves
Employee can adaptworking hours withincertain limits
Employee can choosebetween several fixedworking schedules
Employee's workinghours set entirely by thecompany/organizationwith no possibility forchange
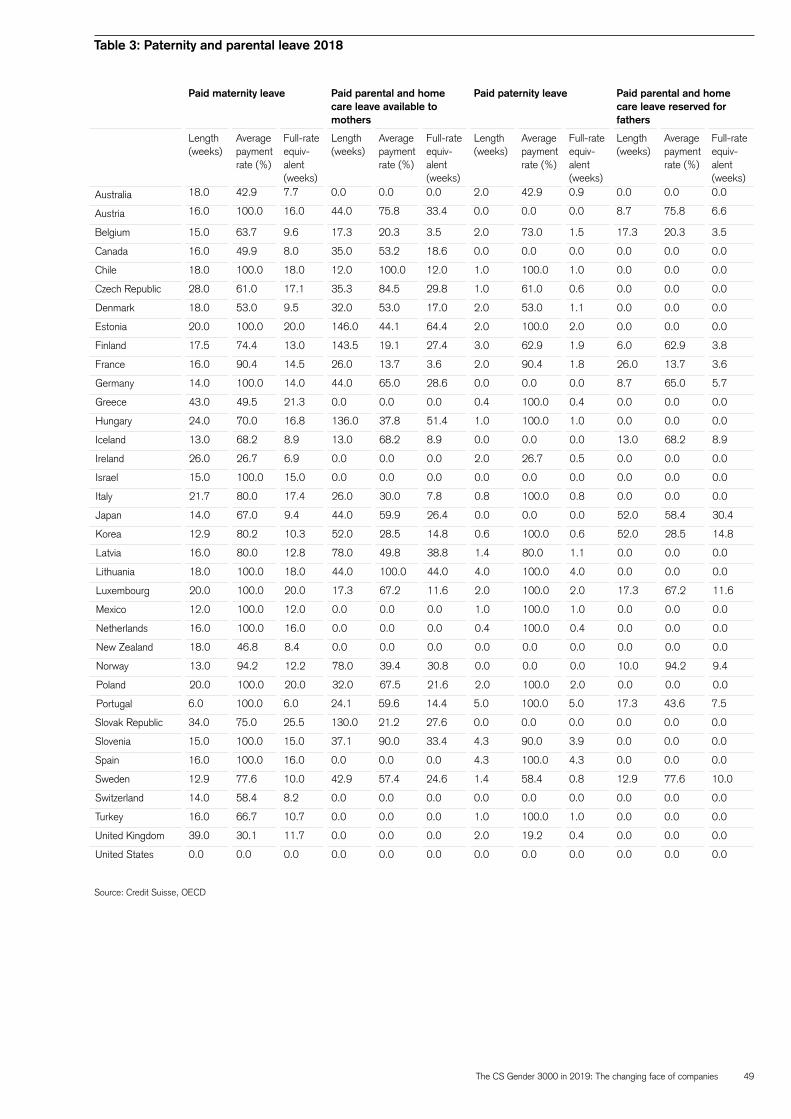
The CS Gender 3000 in 2019: The changing face of companies 49
Paid maternity leave Paid parental and home care leave available to mothers
Paid paternity leave Paid parental and home care leave reserved for fathers
Length (weeks)
Average payment rate (%)
Full-rate equiv-alent (weeks)
Length (weeks)
Average payment rate (%)
Full-rate equiv-alent (weeks)
Length (weeks)
Average payment rate (%)
Full-rate equiv-alent (weeks)
Length (weeks)
Average payment rate (%)
Full-rate equiv-alent (weeks)
Australia 18.0 42.9 7.7 0.0 0.0 0.0 2.0 42.9 0.9 0.0 0.0 0.0
Austria 16.0 100.0 16.0 44.0 75.8 33.4 0.0 0.0 0.0 8.7 75.8 6.6
Belgium 15.0 63.7 9.6 17.3 20.3 3.5 2.0 73.0 1.5 17.3 20.3 3.5
Canada 16.0 49.9 8.0 35.0 53.2 18.6 0.0 0.0 0.0 0.0 0.0 0.0
Chile 18.0 100.0 18.0 12.0 100.0 12.0 1.0 100.0 1.0 0.0 0.0 0.0
Czech Republic 28.0 61.0 17.1 35.3 84.5 29.8 1.0 61.0 0.6 0.0 0.0 0.0
Denmark 18.0 53.0 9.5 32.0 53.0 17.0 2.0 53.0 1.1 0.0 0.0 0.0
Estonia 20.0 100.0 20.0 146.0 44.1 64.4 2.0 100.0 2.0 0.0 0.0 0.0
Finland 17.5 74.4 13.0 143.5 19.1 27.4 3.0 62.9 1.9 6.0 62.9 3.8
France 16.0 90.4 14.5 26.0 13.7 3.6 2.0 90.4 1.8 26.0 13.7 3.6
Germany 14.0 100.0 14.0 44.0 65.0 28.6 0.0 0.0 0.0 8.7 65.0 5.7
Greece 43.0 49.5 21.3 0.0 0.0 0.0 0.4 100.0 0.4 0.0 0.0 0.0
Hungary 24.0 70.0 16.8 136.0 37.8 51.4 1.0 100.0 1.0 0.0 0.0 0.0
Iceland 13.0 68.2 8.9 13.0 68.2 8.9 0.0 0.0 0.0 13.0 68.2 8.9
Ireland 26.0 26.7 6.9 0.0 0.0 0.0 2.0 26.7 0.5 0.0 0.0 0.0
Israel 15.0 100.0 15.0 0.0 0.0 0.0 0.0 0.0 0.0 0.0 0.0 0.0
Italy 21.7 80.0 17.4 26.0 30.0 7.8 0.8 100.0 0.8 0.0 0.0 0.0
Japan 14.0 67.0 9.4 44.0 59.9 26.4 0.0 0.0 0.0 52.0 58.4 30.4
Korea 12.9 80.2 10.3 52.0 28.5 14.8 0.6 100.0 0.6 52.0 28.5 14.8
Latvia 16.0 80.0 12.8 78.0 49.8 38.8 1.4 80.0 1.1 0.0 0.0 0.0
Lithuania 18.0 100.0 18.0 44.0 100.0 44.0 4.0 100.0 4.0 0.0 0.0 0.0
Luxembourg 20.0 100.0 20.0 17.3 67.2 11.6 2.0 100.0 2.0 17.3 67.2 11.6
Mexico 12.0 100.0 12.0 0.0 0.0 0.0 1.0 100.0 1.0 0.0 0.0 0.0
Netherlands 16.0 100.0 16.0 0.0 0.0 0.0 0.4 100.0 0.4 0.0 0.0 0.0
New Zealand 18.0 46.8 8.4 0.0 0.0 0.0 0.0 0.0 0.0 0.0 0.0 0.0
Norway 13.0 94.2 12.2 78.0 39.4 30.8 0.0 0.0 0.0 10.0 94.2 9.4
Poland 20.0 100.0 20.0 32.0 67.5 21.6 2.0 100.0 2.0 0.0 0.0 0.0
Portugal 6.0 100.0 6.0 24.1 59.6 14.4 5.0 100.0 5.0 17.3 43.6 7.5
Slovak Republic 34.0 75.0 25.5 130.0 21.2 27.6 0.0 0.0 0.0 0.0 0.0 0.0
Slovenia 15.0 100.0 15.0 37.1 90.0 33.4 4.3 90.0 3.9 0.0 0.0 0.0
Spain 16.0 100.0 16.0 0.0 0.0 0.0 4.3 100.0 4.3 0.0 0.0 0.0
Sweden 12.9 77.6 10.0 42.9 57.4 24.6 1.4 58.4 0.8 12.9 77.6 10.0
Switzerland 14.0 58.4 8.2 0.0 0.0 0.0 0.0 0.0 0.0 0.0 0.0 0.0
Turkey 16.0 66.7 10.7 0.0 0.0 0.0 1.0 100.0 1.0 0.0 0.0 0.0
United Kingdom 39.0 30.1 11.7 0.0 0.0 0.0 2.0 19.2 0.4 0.0 0.0 0.0
United States 0.0 0.0 0.0 0.0 0.0 0.0 0.0 0.0 0.0 0.0 0.0 0.0
Table 3: Paternity and parental leave 2018
Source: Credit Suisse, OECD

50
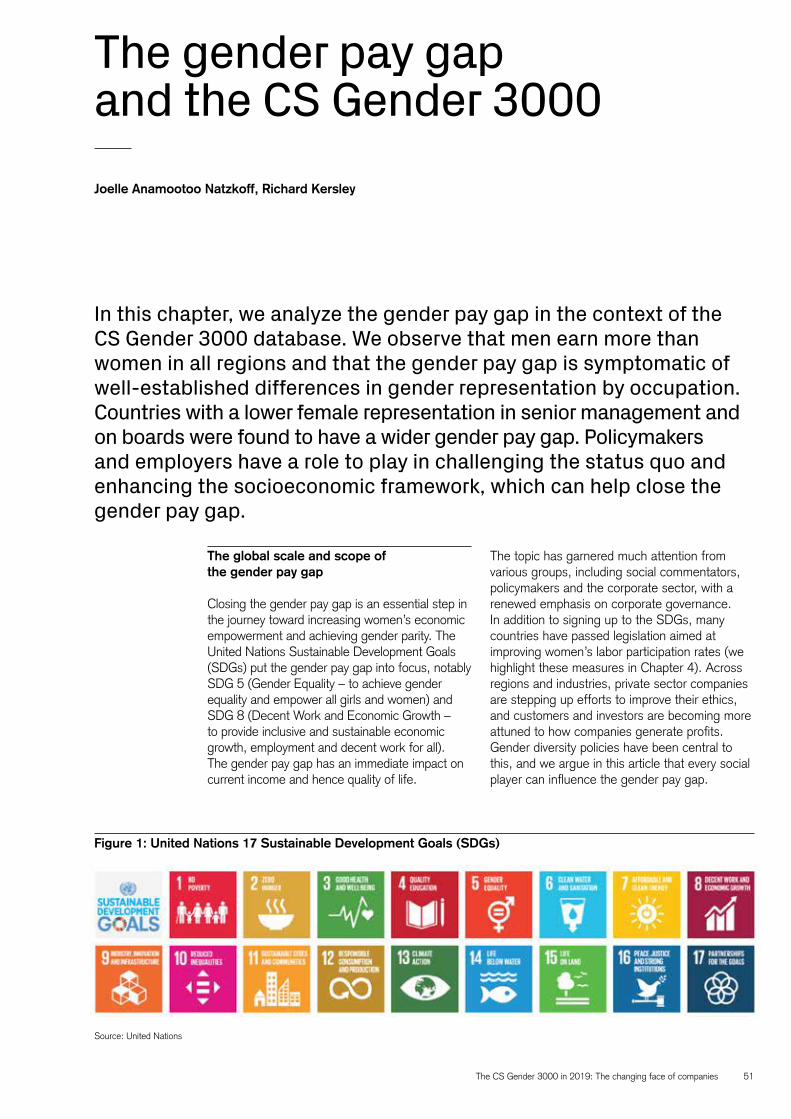
The CS Gender 3000 in 2019: The changing face of companies 51
The gender pay gap and the CS Gender 3000
The global scale and scope of the gender pay gap
Closing the gender pay gap is an essential step in the journey toward increasing women’s economic empowerment and achieving gender parity. The United Nations Sustainable Development Goals (SDGs) put the gender pay gap into focus, notably SDG 5 (Gender Equality – to achieve gender equality and empower all girls and women) and SDG 8 (Decent Work and Economic Growth – to provide inclusive and sustainable economic growth, employment and decent work for all). The gender pay gap has an immediate impact on current income and hence quality of life.
Joelle Anamootoo Natzkoff, Richard Kersley
In this chapter, we analyze the gender pay gap in the context of the CS Gender 3000 database. We observe that men earn more than women in all regions and that the gender pay gap is symptomatic of well-established differences in gender representation by occupation. Countries with a lower female representation in senior management and on boards were found to have a wider gender pay gap. Policymakers and employers have a role to play in challenging the status quo and enhancing the socioeconomic framework, which can help close the gender pay gap.
The topic has garnered much attention from various groups, including social commentators, policymakers and the corporate sector, with a renewed emphasis on corporate governance. In addition to signing up to the SDGs, many countries have passed legislation aimed at improving women’s labor participation rates (we highlight these measures in Chapter 4). Across regions and industries, private sector companies are stepping up efforts to improve their ethics, and customers and investors are becoming more attuned to how companies generate profits. Gender diversity policies have been central to this, and we argue in this article that every social player can influence the gender pay gap.
Figure 1: United Nations 17 Sustainable Development Goals (SDGs)
Source: United Nations
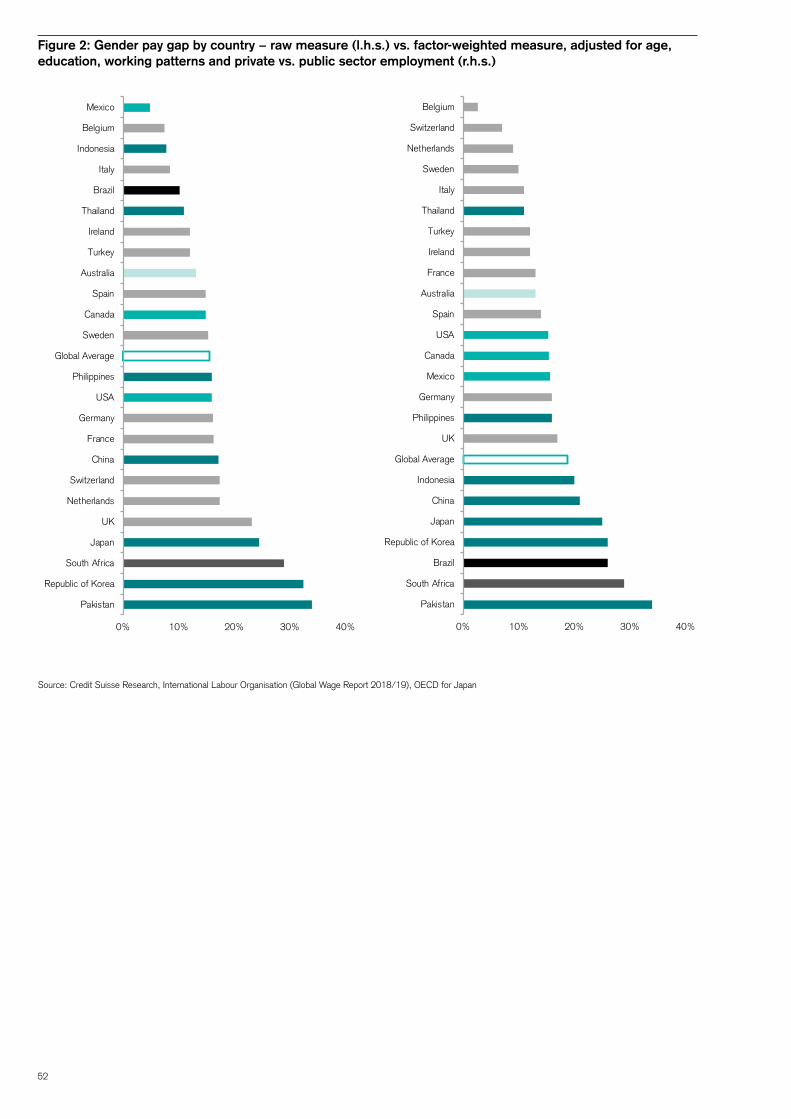
52
Figure 2: Gender pay gap by country − raw measure (l.h.s.) vs. factor-weighted measure, adjusted for age, education, working patterns and private vs. public sector employment (r.h.s.)
Source: Credit Suisse Research, International Labour Organisation (Global Wage Report 2018/19), OECD for Japan
0% 10% 20% 30% 40%
Pakistan
Republic of Korea
South Africa
Japan
UK
Netherlands
Switzerland
China
France
Germany
USA
Philippines
Global Average
Sweden
Canada
Spain
Australia
Turkey
Ireland
Thailand
Brazil
Italy
Indonesia
Belgium
Mexico
0% 10% 20% 30% 40%
Pakistan
South Africa
Brazil
Republic of Korea
Japan
China
Indonesia
Global Average
UK
Philippines
Germany
Mexico
Canada
USA
Spain
Australia
France
Ireland
Turkey
Thailand
Italy
Sweden
Netherlands
Switzerland
Belgium
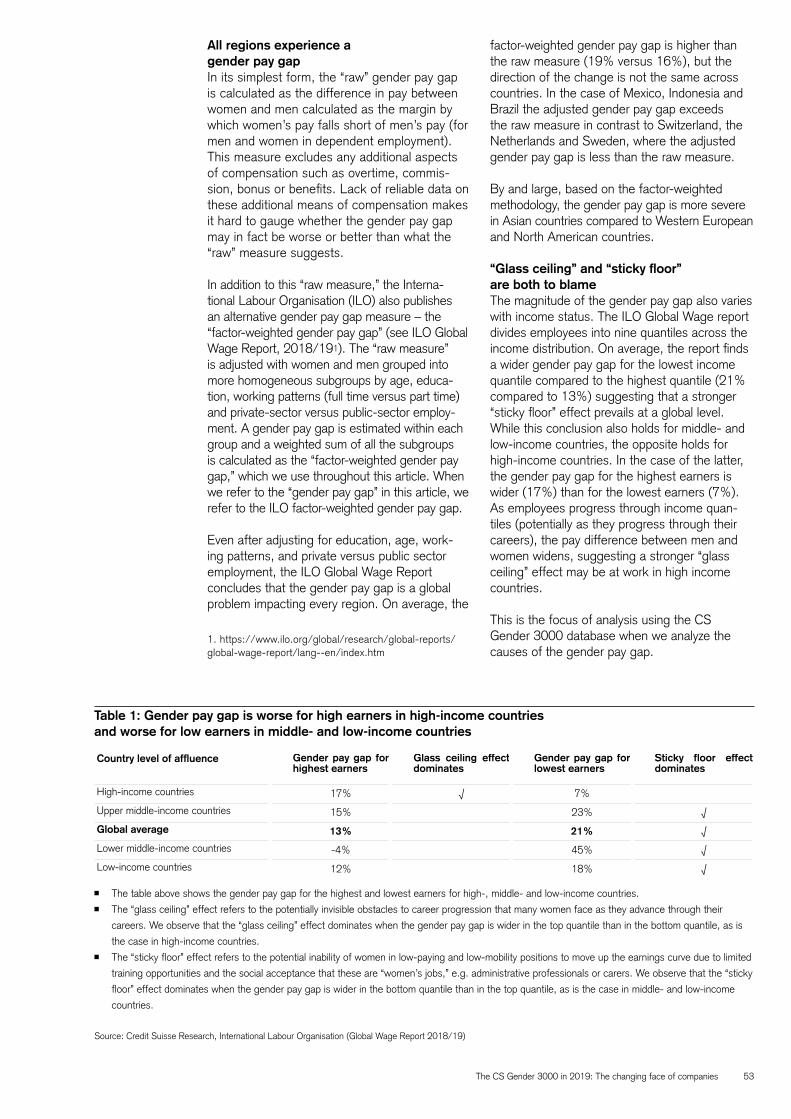
The CS Gender 3000 in 2019: The changing face of companies 53
All regions experience a gender pay gapIn its simplest form, the “raw” gender pay gap is calculated as the difference in pay between women and men calculated as the margin by which women’s pay falls short of men’s pay (for men and women in dependent employment). This measure excludes any additional aspects of compensation such as overtime, commis-sion, bonus or benefits. Lack of reliable data on these additional means of compensation makes it hard to gauge whether the gender pay gap may in fact be worse or better than what the “raw” measure suggests.
In addition to this “raw measure,” the Interna-tional Labour Organisation (ILO) also publishes an alternative gender pay gap measure – the “factor-weighted gender pay gap” (see ILO Global Wage Report, 2018/191). The “raw measure” is adjusted with women and men grouped into more homogeneous subgroups by age, educa-tion, working patterns (full time versus part time) and private-sector versus public-sector employ-ment. A gender pay gap is estimated within each group and a weighted sum of all the subgroups is calculated as the “factor-weighted gender pay gap,” which we use throughout this article. When we refer to the “gender pay gap” in this article, we refer to the ILO factor-weighted gender pay gap.
Even after adjusting for education, age, work-ing patterns, and private versus public sector employment, the ILO Global Wage Report concludes that the gender pay gap is a global problem impacting every region. On average, the
1. https://www.ilo.org/global/research/global-reports/global-wage-report/lang--en/index.htm
factor-weighted gender pay gap is higher than the raw measure (19% versus 16%), but the direction of the change is not the same across countries. In the case of Mexico, Indonesia and Brazil the adjusted gender pay gap exceeds the raw measure in contrast to Switzerland, the Netherlands and Sweden, where the adjusted gender pay gap is less than the raw measure.
By and large, based on the factor-weighted methodology, the gender pay gap is more severe in Asian countries compared to Western European and North American countries.
“Glass ceiling” and “sticky floor” are both to blameThe magnitude of the gender pay gap also varies with income status. The ILO Global Wage report divides employees into nine quantiles across the income distribution. On average, the report finds a wider gender pay gap for the lowest income quantile compared to the highest quantile (21% compared to 13%) suggesting that a stronger “sticky floor” effect prevails at a global level. While this conclusion also holds for middle- and low-income countries, the opposite holds for high-income countries. In the case of the latter, the gender pay gap for the highest earners is wider (17%) than for the lowest earners (7%). As employees progress through income quan-tiles (potentially as they progress through their careers), the pay difference between men and women widens, suggesting a stronger “glass ceiling” effect may be at work in high income countries.
This is the focus of analysis using the CS Gender 3000 database when we analyze the causes of the gender pay gap.
Table 1: Gender pay gap is worse for high earners in high-income countries and worse for low earners in middle- and low-income countries
Source: Credit Suisse Research, International Labour Organisation (Global Wage Report 2018/19)
Country level of affluence Gender pay gap for highest earners
Glass ceiling effect dominates
Gender pay gap for lowest earners
Sticky floor effect dominates
High-income countries 17% √ 7%
Upper middle-income countries 15% 23% √
Global average 13% 21% √
Lower middle-income countries -4% 45% √
Low-income countries 12% 18% √
ȹ The table above shows the gender pay gap for the highest and lowest earners for high-, middle- and low-income countries. ȹ The “glass ceiling” effect refers to the potentially invisible obstacles to career progression that many women face as they advance through their
careers. We observe that the “glass ceiling” effect dominates when the gender pay gap is wider in the top quantile than in the bottom quantile, as is
the case in high-income countries. ȹ The “sticky floor” effect refers to the potential inability of women in low-paying and low-mobility positions to move up the earnings curve due to limited
training opportunities and the social acceptance that these are “women’s jobs,” e.g. administrative professionals or carers. We observe that the “sticky
floor” effect dominates when the gender pay gap is wider in the bottom quantile than in the top quantile, as is the case in middle- and low-income
countries.
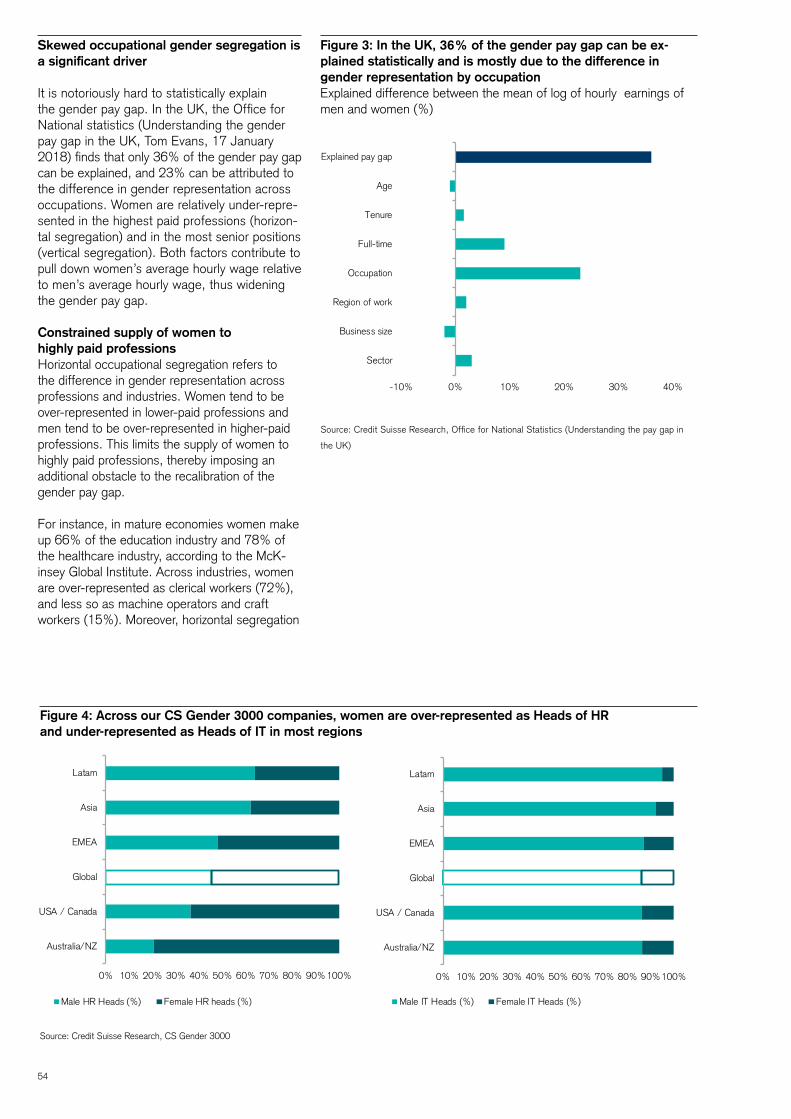
54
Skewed occupational gender segregation is a significant driver
It is notoriously hard to statistically explain the gender pay gap. In the UK, the Office for National statistics (Understanding the gender pay gap in the UK, Tom Evans, 17 January 2018) finds that only 36% of the gender pay gap can be explained, and 23% can be attributed to the difference in gender representation across occupations. Women are relatively under-repre-sented in the highest paid professions (horizon-tal segregation) and in the most senior positions (vertical segregation). Both factors contribute to pull down women’s average hourly wage relative to men’s average hourly wage, thus widening the gender pay gap.
Constrained supply of women to highly paid professionsHorizontal occupational segregation refers to the difference in gender representation across professions and industries. Women tend to be over-represented in lower-paid professions and men tend to be over-represented in higher-paid professions. This limits the supply of women to highly paid professions, thereby imposing an additional obstacle to the recalibration of the gender pay gap.
For instance, in mature economies women make up 66% of the education industry and 78% of the healthcare industry, according to the McK-insey Global Institute. Across industries, women are over-represented as clerical workers (72%), and less so as machine operators and craft workers (15%). Moreover, horizontal segregation
Figure 4: Across our CS Gender 3000 companies, women are over-represented as Heads of HR and under-represented as Heads of IT in most regions
Source: Credit Suisse Research, CS Gender 3000
Figure 3: In the UK, 36% of the gender pay gap can be ex-plained statistically and is mostly due to the difference in gender representation by occupationExplained difference between the mean of log of hourly earnings of men and women (%)
Source: Credit Suisse Research, Office for National Statistics (Understanding the pay gap in
the UK)
-10% 0% 10% 20% 30% 40%
Sector
Business size
Region of work
Occupation
Full-time
Tenure
Age
Explained pay gap
0% 10% 20% 30% 40% 50% 60% 70% 80% 90%100%
Australia/NZ
USA / Canada
Global
EMEA
Asia
Latam
Male HR Heads (%) Female HR heads (%)
0% 10% 20% 30% 40% 50% 60% 70% 80% 90%100%
Australia/NZ
USA / Canada
Global
EMEA
Asia
Latam
Male IT Heads (%) Female IT Heads (%)
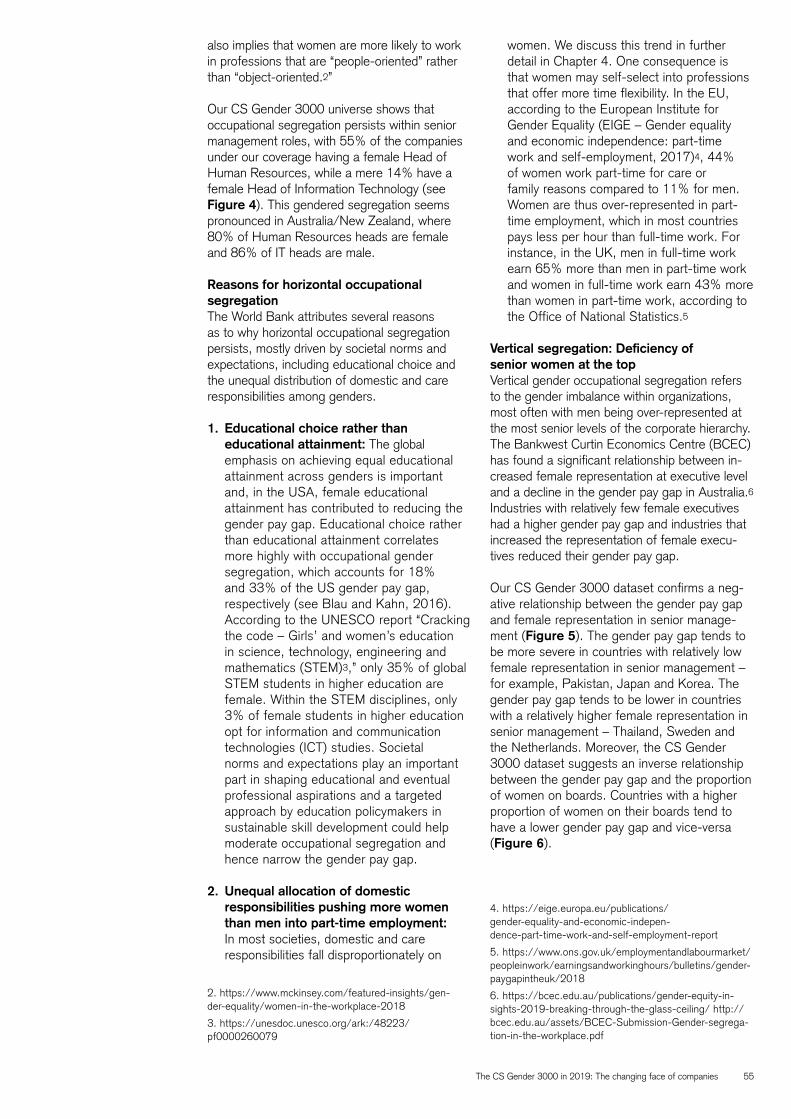
The CS Gender 3000 in 2019: The changing face of companies 55
also implies that women are more likely to work in professions that are “people-oriented” rather than “object-oriented.2”
Our CS Gender 3000 universe shows that occupational segregation persists within senior management roles, with 55% of the companies under our coverage having a female Head of Human Resources, while a mere 14% have a female Head of Information Technology (see Figure 4). This gendered segregation seems pronounced in Australia/New Zealand, where 80% of Human Resources heads are female and 86% of IT heads are male.
Reasons for horizontal occupational segregationThe World Bank attributes several reasons as to why horizontal occupational segregation persists, mostly driven by societal norms and expectations, including educational choice and the unequal distribution of domestic and care responsibilities among genders.
1. Educational choice rather than educational attainment: The global emphasis on achieving equal educational attainment across genders is important and, in the USA, female educational attainment has contributed to reducing the gender pay gap. Educational choice rather than educational attainment correlates more highly with occupational gender segregation, which accounts for 18% and 33% of the US gender pay gap, respectively (see Blau and Kahn, 2016). According to the UNESCO report “Cracking the code – Girls’ and women’s education in science, technology, engineering and mathematics (STEM)3,” only 35% of global STEM students in higher education are female. Within the STEM disciplines, only 3% of female students in higher education opt for information and communication technologies (ICT) studies. Societal norms and expectations play an important part in shaping educational and eventual professional aspirations and a targeted approach by education policymakers in sustainable skill development could help moderate occupational segregation and hence narrow the gender pay gap.
2. Unequal allocation of domestic responsibilities pushing more women than men into part-time employment: In most societies, domestic and care responsibilities fall disproportionately on
2. https://www.mckinsey.com/featured-insights/gen-der-equality/women-in-the-workplace-2018
3. https://unesdoc.unesco.org/ark:/48223/pf0000260079
women. We discuss this trend in further detail in Chapter 4. One consequence is that women may self-select into professions that offer more time flexibility. In the EU, according to the European Institute for Gender Equality (EIGE – Gender equality and economic independence: part-time work and self-employment, 2017)4, 44% of women work part-time for care or family reasons compared to 11% for men. Women are thus over-represented in part-time employment, which in most countries pays less per hour than full-time work. For instance, in the UK, men in full-time work earn 65% more than men in part-time work and women in full-time work earn 43% more than women in part-time work, according to the Office of National Statistics.5
Vertical segregation: Deficiency of senior women at the topVertical gender occupational segregation refers to the gender imbalance within organizations, most often with men being over-represented at the most senior levels of the corporate hierarchy. The Bankwest Curtin Economics Centre (BCEC) has found a significant relationship between in-creased female representation at executive level and a decline in the gender pay gap in Australia.6 Industries with relatively few female executives had a higher gender pay gap and industries that increased the representation of female execu-tives reduced their gender pay gap.
Our CS Gender 3000 dataset confirms a neg-ative relationship between the gender pay gap and female representation in senior manage-ment (Figure 5). The gender pay gap tends to be more severe in countries with relatively low female representation in senior management – for example, Pakistan, Japan and Korea. The gender pay gap tends to be lower in countries with a relatively higher female representation in senior management – Thailand, Sweden and the Netherlands. Moreover, the CS Gender 3000 dataset suggests an inverse relationship between the gender pay gap and the proportion of women on boards. Countries with a higher proportion of women on their boards tend to have a lower gender pay gap and vice-versa (Figure 6).
4. https://eige.europa.eu/publications/gender-equality-and-economic-indepen-dence-part-time-work-and-self-employment-report
5. https://www.ons.gov.uk/employmentandlabourmarket/peopleinwork/earningsandworkinghours/bulletins/gender-paygapintheuk/2018
6. https://bcec.edu.au/publications/gender-equity-in-sights-2019-breaking-through-the-glass-ceiling/ http://bcec.edu.au/assets/BCEC-Submission-Gender-segrega-tion-in-the-workplace.pdf
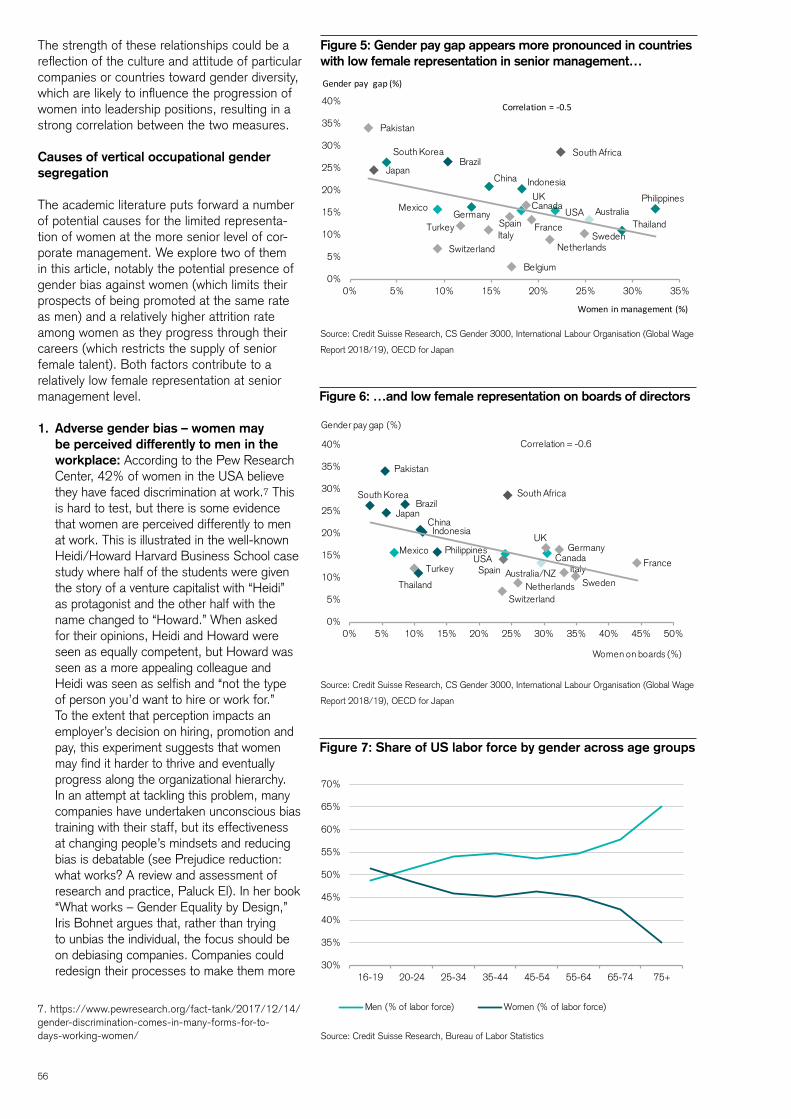
56
The strength of these relationships could be a reflection of the culture and attitude of particular companies or countries toward gender diversity, which are likely to influence the progression of women into leadership positions, resulting in a strong correlation between the two measures.
Causes of vertical occupational gender segregation
The academic literature puts forward a number of potential causes for the limited representa-tion of women at the more senior level of cor-porate management. We explore two of them in this article, notably the potential presence of gender bias against women (which limits their prospects of being promoted at the same rate as men) and a relatively higher attrition rate among women as they progress through their careers (which restricts the supply of senior female talent). Both factors contribute to a relatively low female representation at senior management level.
1. Adverse gender bias – women may be perceived differently to men in the workplace: According to the Pew Research Center, 42% of women in the USA believe they have faced discrimination at work.7 This is hard to test, but there is some evidence that women are perceived differently to men at work. This is illustrated in the well-known Heidi/Howard Harvard Business School case study where half of the students were given the story of a venture capitalist with “Heidi” as protagonist and the other half with the name changed to “Howard.” When asked for their opinions, Heidi and Howard were seen as equally competent, but Howard was seen as a more appealing colleague and Heidi was seen as selfish and “not the type of person you’d want to hire or work for.” To the extent that perception impacts an employer’s decision on hiring, promotion and pay, this experiment suggests that women may find it harder to thrive and eventually progress along the organizational hierarchy. In an attempt at tackling this problem, many companies have undertaken unconscious bias training with their staff, but its effectiveness at changing people’s mindsets and reducing bias is debatable (see Prejudice reduction: what works? A review and assessment of research and practice, Paluck El). In her book “What works – Gender Equality by Design,” Iris Bohnet argues that, rather than trying to unbias the individual, the focus should be on debiasing companies. Companies could redesign their processes to make them more
7. https://www.pewresearch.org/fact-tank/2017/12/14/gender-discrimination-comes-in-many-forms-for-to-days-working-women/
Figure 5: Gender pay gap appears more pronounced in countries with low female representation in senior management…
Figure 6: …and low female representation on boards of directors
Source: Credit Suisse Research, CS Gender 3000, International Labour Organisation (Global Wage
Report 2018/19), OECD for Japan
Source: Credit Suisse Research, CS Gender 3000, International Labour Organisation (Global Wage
Report 2018/19), OECD for Japan
Figure 7: Share of US labor force by gender across age groups
Source: Credit Suisse Research, Bureau of Labor Statistics
Australia
Brazil
Canada
China
France
Indonesia
Italy
Mexico
Netherlands
South Korea
SpainSweden
Switzerland
Turkey
UK
USAPhilippines
Thailand
South Africa
Belgium
Pakistan
Germany
Japan
0%
5%
10%
15%
20%
25%
30%
35%
40%
0% 5% 10% 15% 20% 25% 30% 35%
Correlation = -0.5
Gender pay gap (%)
Women in management (%)
30%
35%
40%
45%
50%
55%
60%
65%
70%
16-19 20-24 25-34 35-44 45-54 55-64 65-74 75+
Men (% of labor force) Women (% of labor force)
Australia/NZ
Brazil
Canada
China
France
Indonesia
Italy
Mexico
Netherlands
South Korea
SpainSweden
Switzerland
Turkey
UK
USAPhilippines
Thailand
South Africa
Pakistan
Germany
Japan
0%
5%
10%
15%
20%
25%
30%
35%
40%
0% 5% 10% 15% 20% 25% 30% 35% 40% 45% 50%
Correlation = -0.6
Gender pay gap (%)
Women on boards (%)
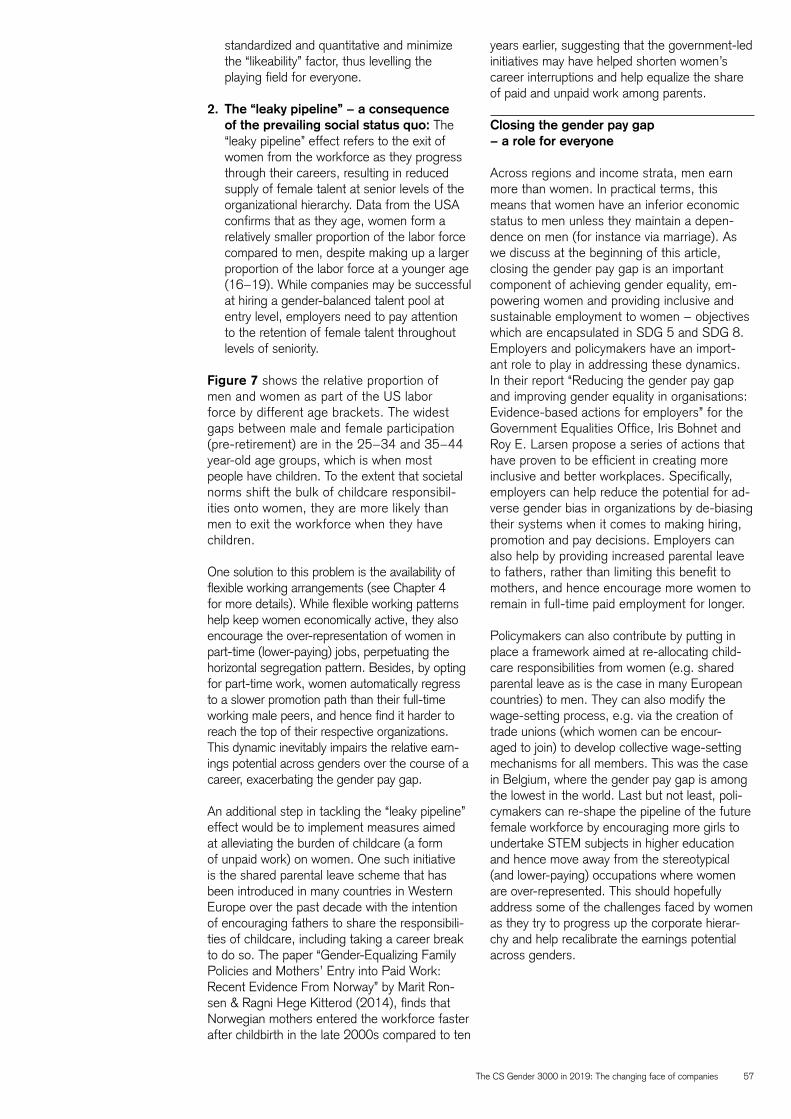
The CS Gender 3000 in 2019: The changing face of companies 57
standardized and quantitative and minimize the “likeability” factor, thus levelling the playing field for everyone.
2. The “leaky pipeline” − a consequence of the prevailing social status quo: The “leaky pipeline” effect refers to the exit of women from the workforce as they progress through their careers, resulting in reduced supply of female talent at senior levels of the organizational hierarchy. Data from the USA confirms that as they age, women form a relatively smaller proportion of the labor force compared to men, despite making up a larger proportion of the labor force at a younger age (16−19). While companies may be successful at hiring a gender-balanced talent pool at entry level, employers need to pay attention to the retention of female talent throughout levels of seniority.
Figure 7 shows the relative proportion of men and women as part of the US labor force by different age brackets. The widest gaps between male and female participation (pre-retirement) are in the 25−34 and 35−44 year-old age groups, which is when most people have children. To the extent that societal norms shift the bulk of childcare responsibil-ities onto women, they are more likely than men to exit the workforce when they have children.
One solution to this problem is the availability of flexible working arrangements (see Chapter 4 for more details). While flexible working patterns help keep women economically active, they also encourage the over-representation of women in part-time (lower-paying) jobs, perpetuating the horizontal segregation pattern. Besides, by opting for part-time work, women automatically regress to a slower promotion path than their full-time working male peers, and hence find it harder to reach the top of their respective organizations. This dynamic inevitably impairs the relative earn-ings potential across genders over the course of a career, exacerbating the gender pay gap.
An additional step in tackling the “leaky pipeline” effect would be to implement measures aimed at alleviating the burden of childcare (a form of unpaid work) on women. One such initiative is the shared parental leave scheme that has been introduced in many countries in Western Europe over the past decade with the intention of encouraging fathers to share the responsibili-ties of childcare, including taking a career break to do so. The paper “Gender-Equalizing Family Policies and Mothers’ Entry into Paid Work: Recent Evidence From Norway” by Marit Ron-sen & Ragni Hege Kitterod (2014), finds that Norwegian mothers entered the workforce faster after childbirth in the late 2000s compared to ten
years earlier, suggesting that the government-led initiatives may have helped shorten women’s career interruptions and help equalize the share of paid and unpaid work among parents.
Closing the gender pay gap − a role for everyone
Across regions and income strata, men earn more than women. In practical terms, this means that women have an inferior economic status to men unless they maintain a depen-dence on men (for instance via marriage). As we discuss at the beginning of this article, closing the gender pay gap is an important component of achieving gender equality, em-powering women and providing inclusive and sustainable employment to women − objectives which are encapsulated in SDG 5 and SDG 8. Employers and policymakers have an import-ant role to play in addressing these dynamics. In their report “Reducing the gender pay gap and improving gender equality in organisations: Evidence-based actions for employers” for the Government Equalities Office, Iris Bohnet and Roy E. Larsen propose a series of actions that have proven to be efficient in creating more inclusive and better workplaces. Specifically, employers can help reduce the potential for ad-verse gender bias in organizations by de-biasing their systems when it comes to making hiring, promotion and pay decisions. Employers can also help by providing increased parental leave to fathers, rather than limiting this benefit to mothers, and hence encourage more women to remain in full-time paid employment for longer.
Policymakers can also contribute by putting in place a framework aimed at re-allocating child-care responsibilities from women (e.g. shared parental leave as is the case in many European countries) to men. They can also modify the wage-setting process, e.g. via the creation of trade unions (which women can be encour-aged to join) to develop collective wage-setting mechanisms for all members. This was the case in Belgium, where the gender pay gap is among the lowest in the world. Last but not least, poli-cymakers can re-shape the pipeline of the future female workforce by encouraging more girls to undertake STEM subjects in higher education and hence move away from the stereotypical (and lower-paying) occupations where women are over-represented. This should hopefully address some of the challenges faced by women as they try to progress up the corporate hierar-chy and help recalibrate the earnings potential across genders.

58
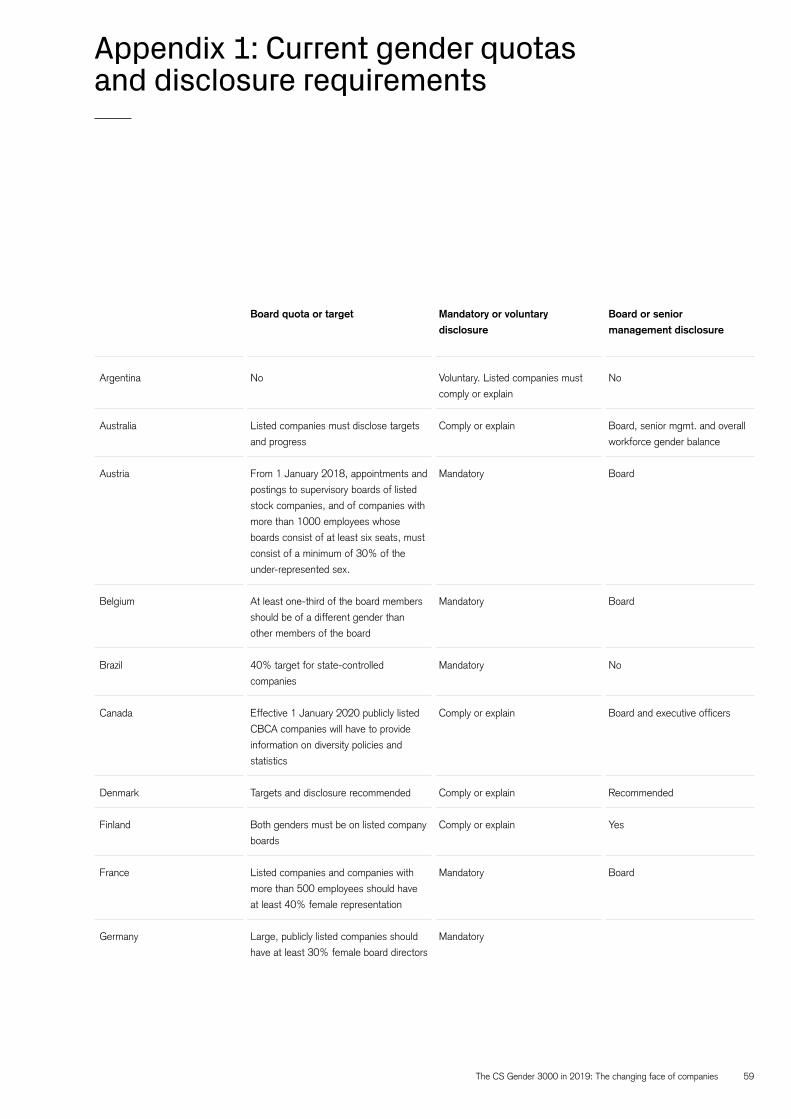
The CS Gender 3000 in 2019: The changing face of companies 59
Appendix 1: Current gender quotas and disclosure requirements
Board quota or target Mandatory or voluntary
disclosure
Board or senior
management disclosure
Argentina No Voluntary. Listed companies must
comply or explain
No
Australia Listed companies must disclose targets
and progress
Comply or explain Board, senior mgmt. and overall
workforce gender balance
Austria From 1 January 2018, appointments and
postings to supervisory boards of listed
stock companies, and of companies with
more than 1000 employees whose
boards consist of at least six seats, must
consist of a minimum of 30% of the
under-represented sex.
Mandatory Board
Belgium At least one-third of the board members
should be of a different gender than
other members of the board
Mandatory Board
Brazil 40% target for state-controlled
companies
Mandatory No
Canada Effective 1 January 2020 publicly listed
CBCA companies will have to provide
information on diversity policies and
statistics
Comply or explain Board and executive officers
Denmark Targets and disclosure recommended Comply or explain Recommended
Finland Both genders must be on listed company
boards
Comply or explain Yes
France Listed companies and companies with
more than 500 employees should have
at least 40% female representation
Mandatory Board
Germany Large, publicly listed companies should
have at least 30% female board directors
Mandatory
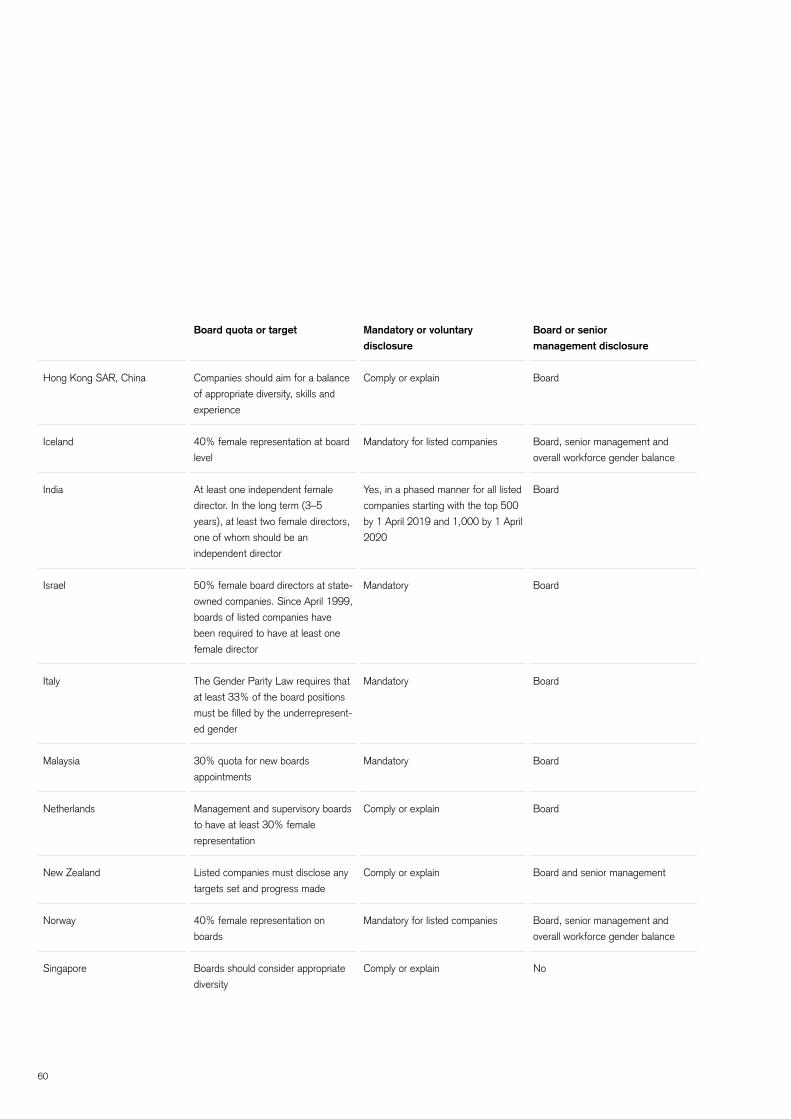
60
Board quota or target Mandatory or voluntary
disclosure
Board or senior
management disclosure
Hong Kong SAR, China Companies should aim for a balance
of appropriate diversity, skills and
experience
Comply or explain Board
Iceland 40% female representation at board
level
Mandatory for listed companies Board, senior management and
overall workforce gender balance
India At least one independent female
director. In the long term (3–5
years), at least two female directors,
one of whom should be an
independent director
Yes, in a phased manner for all listed
companies starting with the top 500
by 1 April 2019 and 1,000 by 1 April
2020
Board
Israel 50% female board directors at state-
owned companies. Since April 1999,
boards of listed companies have
been required to have at least one
female director
Mandatory Board
Italy The Gender Parity Law requires that
at least 33% of the board positions
must be filled by the underrepresent-
ed gender
Mandatory Board
Malaysia 30% quota for new boards
appointments
Mandatory Board
Netherlands Management and supervisory boards
to have at least 30% female
representation
Comply or explain Board
New Zealand Listed companies must disclose any
targets set and progress made
Comply or explain Board and senior management
Norway 40% female representation on
boards
Mandatory for listed companies Board, senior management and
overall workforce gender balance
Singapore Boards should consider appropriate
diversity
Comply or explain No
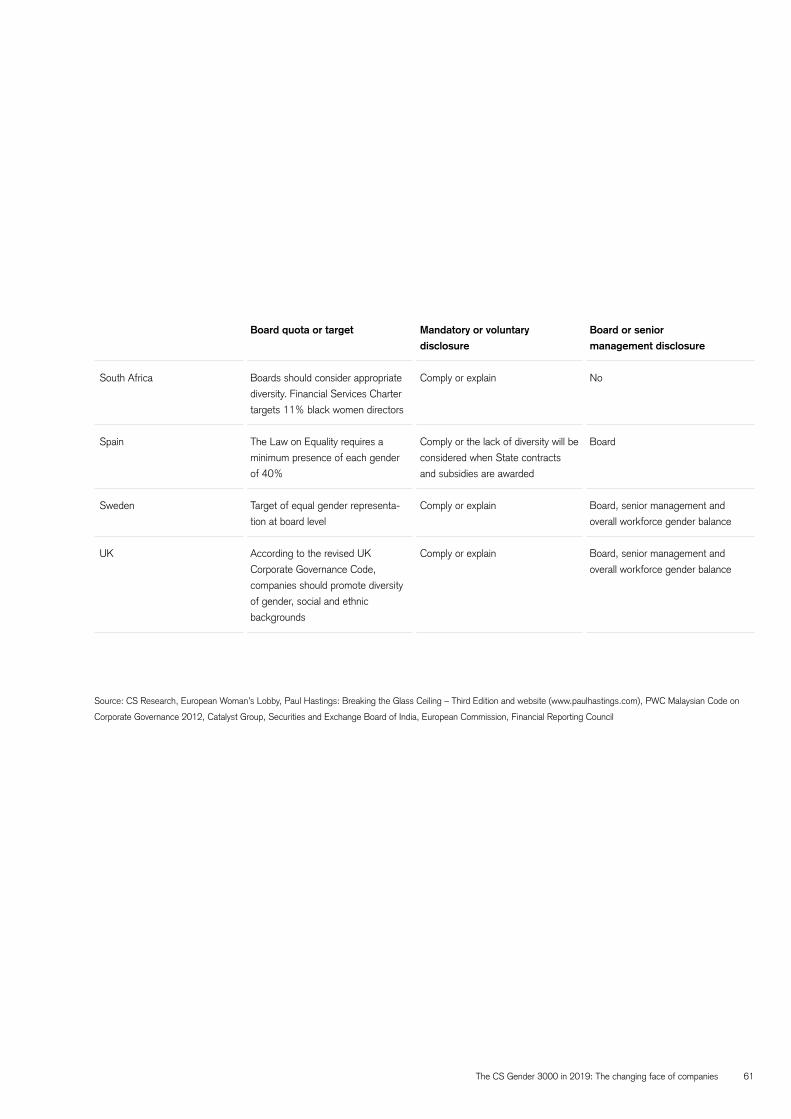
The CS Gender 3000 in 2019: The changing face of companies 61
Source: CS Research, European Woman’s Lobby, Paul Hastings: Breaking the Glass Ceiling – Third Edition and website (www.paulhastings.com), PWC Malaysian Code on
Corporate Governance 2012, Catalyst Group, Securities and Exchange Board of India, European Commission, Financial Reporting Council
Board quota or target Mandatory or voluntary
disclosure
Board or senior
management disclosure
South Africa Boards should consider appropriate
diversity. Financial Services Charter
targets 11% black women directors
Comply or explain No
Spain The Law on Equality requires a
minimum presence of each gender
of 40%
Comply or the lack of diversity will be
considered when State contracts
and subsidies are awarded
Board
Sweden Target of equal gender representa-
tion at board level
Comply or explain Board, senior management and
overall workforce gender balance
UK According to the revised UK
Corporate Governance Code,
companies should promote diversity
of gender, social and ethnic
backgrounds
Comply or explain Board, senior management and
overall workforce gender balance
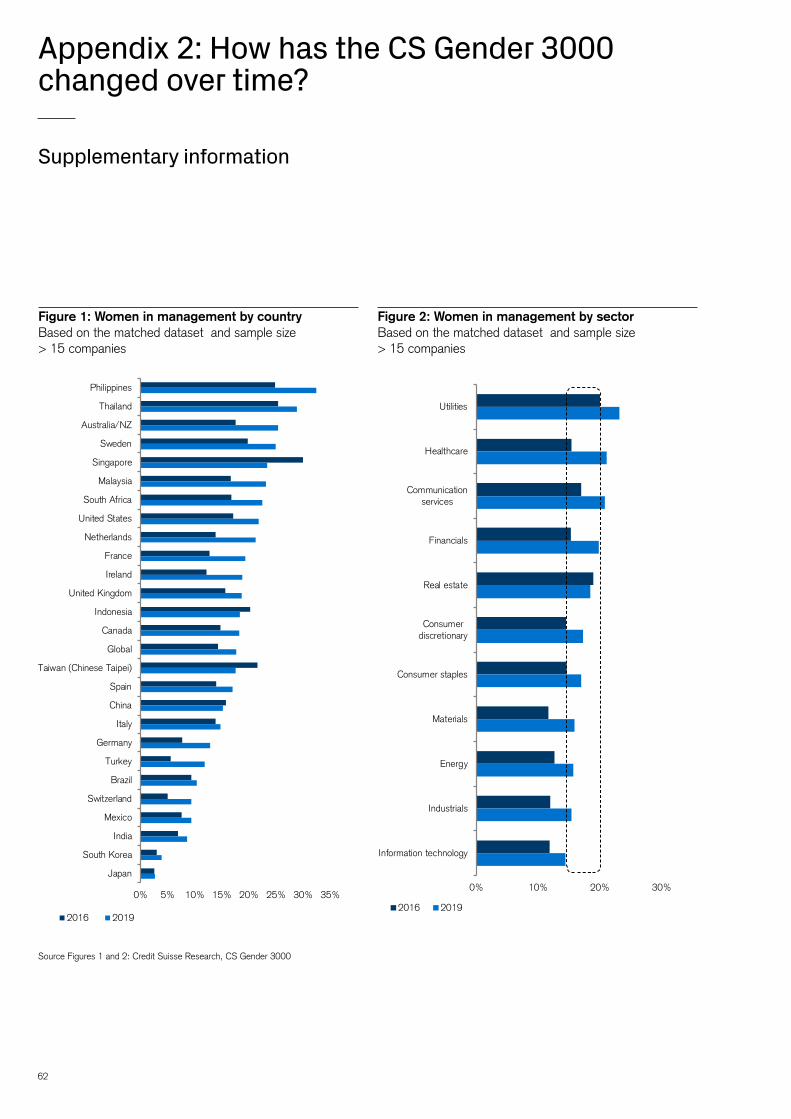
62
Appendix 2: How has the CS Gender 3000 changed over time?
Figure 1: Women in management by countryBased on the matched dataset and sample size > 15 companies
Source Figures 1 and 2: Credit Suisse Research, CS Gender 3000
Figure 2: Women in management by sectorBased on the matched dataset and sample size > 15 companies
0% 10% 20% 30%
Utilities
Healthcare
Communicationservices
Financials
Real estate
Consumerdiscretionary
Consumer staples
Materials
Energy
Industrials
Information technology
2016 2019
Supplementary information
0% 5% 10% 15% 20% 25% 30% 35%
Philippines
Thailand
Australia/NZ
Sweden
Singapore
Malaysia
South Africa
United States
Netherlands
France
Ireland
United Kingdom
Indonesia
Canada
Global
Taiwan (Chinese Taipei)
Spain
China
Italy
Germany
Turkey
Brazil
Switzerland
Mexico
India
South Korea
Japan
2016 2019
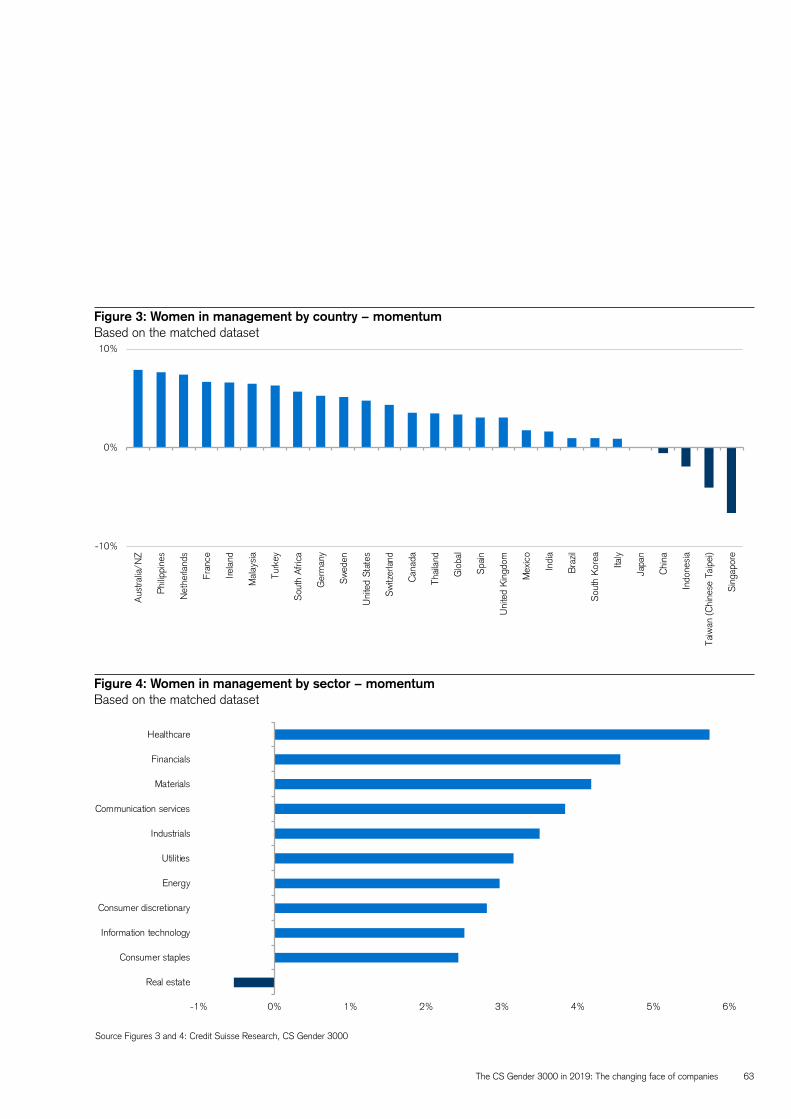
The CS Gender 3000 in 2019: The changing face of companies 63
Figure 3: Women in management by country − momentumBased on the matched dataset
Figure 4: Women in management by sector − momentumBased on the matched dataset
Source Figures 3 and 4: Credit Suisse Research, CS Gender 3000
-1% 0% 1% 2% 3% 4% 5% 6% 7%
Real estate
Consumer staples
Information technology
Consumer discretionary
Energy
Utilities
Industrials
Communication services
Materials
Financials
Healthcare
-10%
0%
10%
Aus
tralia
/NZ
Phi
lippi
nes
Net
herla
nds
Fran
ce
Irela
nd
Mal
aysi
a
Turk
ey
Sou
th A
fric
a
Ger
man
y
Sw
eden
Uni
ted
Stat
es
Sw
itzer
land
Can
ada
Thai
land
Glo
bal
Spa
in
Uni
ted
Kin
gdom
Mex
ico
Indi
a
Bra
zil
Sou
th K
orea
Italy
Japa
n
Chi
na
Indo
nesi
a
Taiw
an (C
hine
se T
aipe
i)
Sin
gapo
re
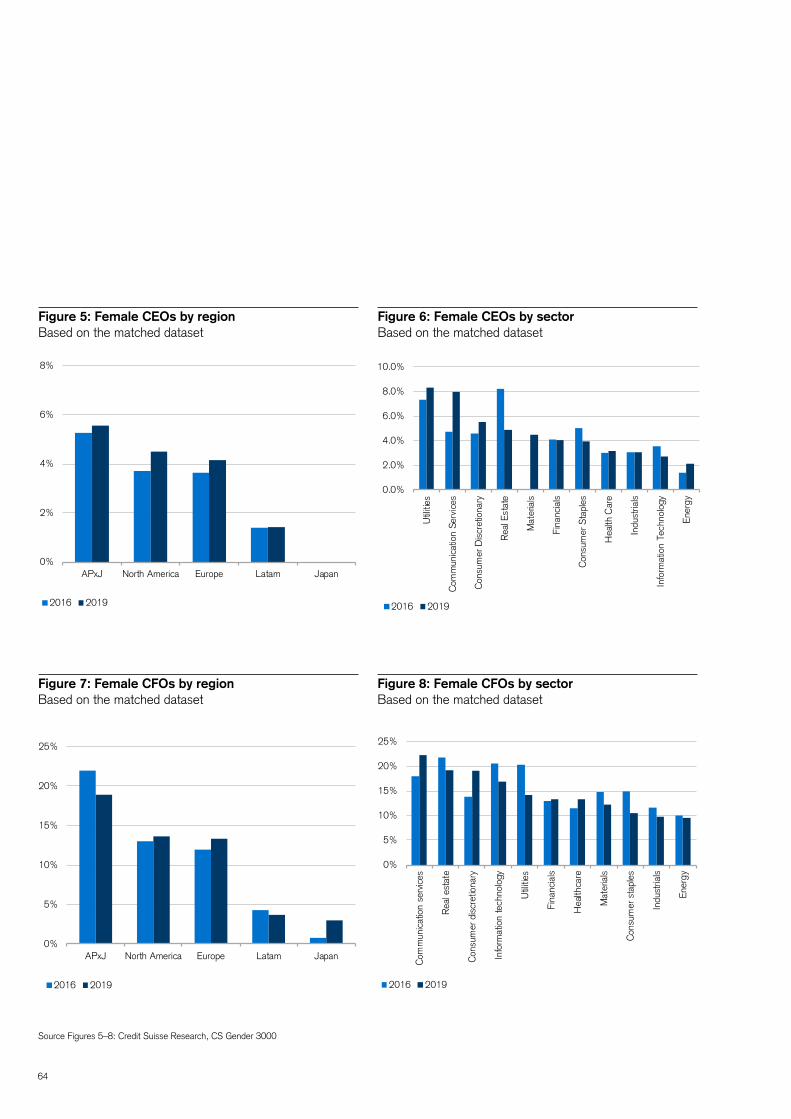
64
Figure 6: Female CEOs by sectorBased on the matched dataset
Figure 8: Female CFOs by sectorBased on the matched dataset
0.0%
2.0%
4.0%
6.0%
8.0%
10.0%
Util
ities
Com
mun
icat
ion
Serv
ices
Con
sum
er D
iscr
etio
nary
Rea
l Est
ate
Mat
eria
ls
Fina
ncia
ls
Con
sum
er S
tapl
es
Hea
lth C
are
Indu
stria
ls
Info
rmat
ion
Tech
nolo
gy
Ener
gy
2016 2019
Figure 5: Female CEOs by regionBased on the matched dataset
Figure 7: Female CFOs by regionBased on the matched dataset
Source Figures 5–8: Credit Suisse Research, CS Gender 3000
0%
2%
4%
6%
8%
APxJ North America Europe Latam Japan
2016 2019
0%
5%
10%
15%
20%
25%
APxJ North America Europe Latam Japan
2016 2019
0%
5%
10%
15%
20%
25%
Com
mun
icat
ion
serv
ices
Rea
l est
ate
Con
sum
er d
iscr
etio
nary
Info
rmat
ion
tech
nolo
gy
Util
ities
Fina
ncia
ls
Hea
lthca
re
Mat
eria
ls
Con
sum
er s
tapl
es
Indu
stria
ls
Ener
gy
2016 2019
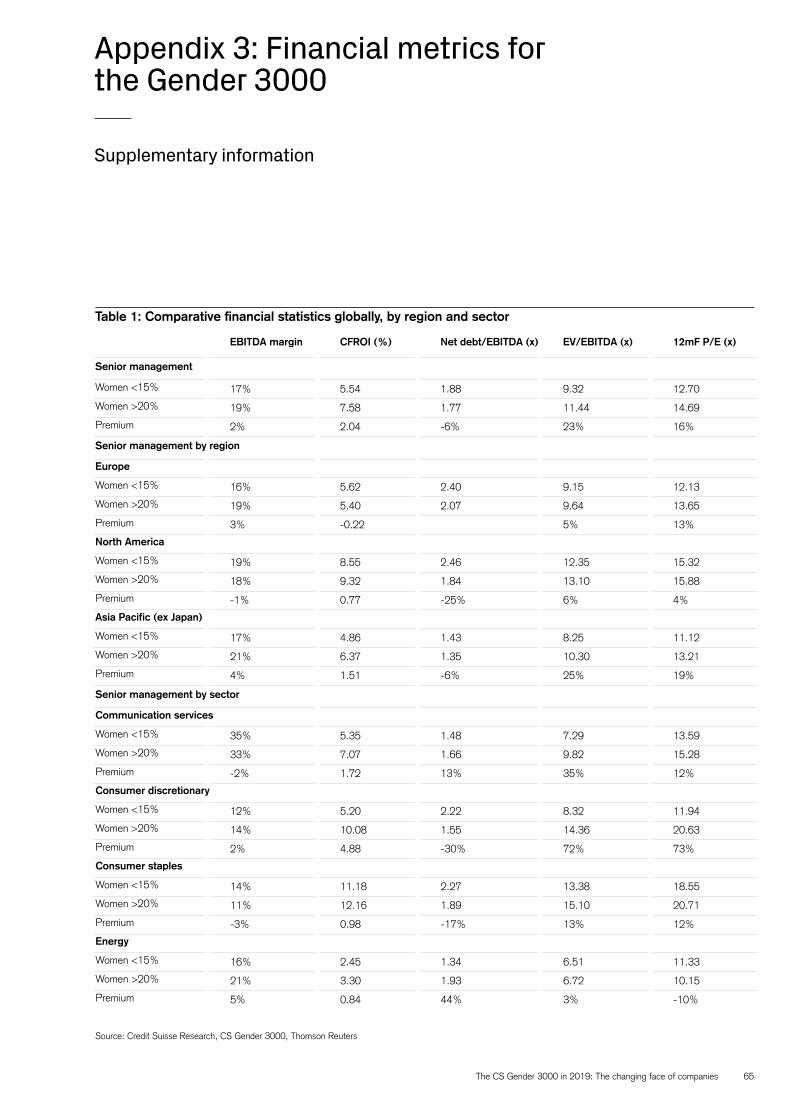
The CS Gender 3000 in 2019: The changing face of companies 65
Table 1: Comparative financial statistics globally, by region and sector
Source: Credit Suisse Research, CS Gender 3000, Thomson Reuters
EBITDA margin CFROI (%) Net debt/EBITDA (x) EV/EBITDA (x) 12mF P/E (x)
Senior management
Women <15% 17% 5.54 1.88 9.32 12.70
Women >20% 19% 7.58 1.77 11.44 14.69
Premium 2% 2.04 -6% 23% 16%
Senior management by region
Europe
Women <15% 16% 5.62 2.40 9.15 12.13
Women >20% 19% 5.40 2.07 9.64 13.65
Premium 3% -0.22 5% 13%
North America
Women <15% 19% 8.55 2.46 12.35 15.32
Women >20% 18% 9.32 1.84 13.10 15.88
Premium -1% 0.77 -25% 6% 4%
Asia Pacific (ex Japan)
Women <15% 17% 4.86 1.43 8.25 11.12
Women >20% 21% 6.37 1.35 10.30 13.21
Premium 4% 1.51 -6% 25% 19%
Senior management by sector
Communication services
Women <15% 35% 5.35 1.48 7.29 13.59
Women >20% 33% 7.07 1.66 9.82 15.28
Premium -2% 1.72 13% 35% 12%
Consumer discretionary
Women <15% 12% 5.20 2.22 8.32 11.94
Women >20% 14% 10.08 1.55 14.36 20.63
Premium 2% 4.88 -30% 72% 73%
Consumer staples
Women <15% 14% 11.18 2.27 13.38 18.55
Women >20% 11% 12.16 1.89 15.10 20.71
Premium -3% 0.98 -17% 13% 12%
Energy
Women <15% 16% 2.45 1.34 6.51 11.33
Women >20% 21% 3.30 1.93 6.72 10.15
Premium 5% 0.84 44% 3% -10%
Appendix 3: Financial metrics for the Gender 3000
Supplementary information
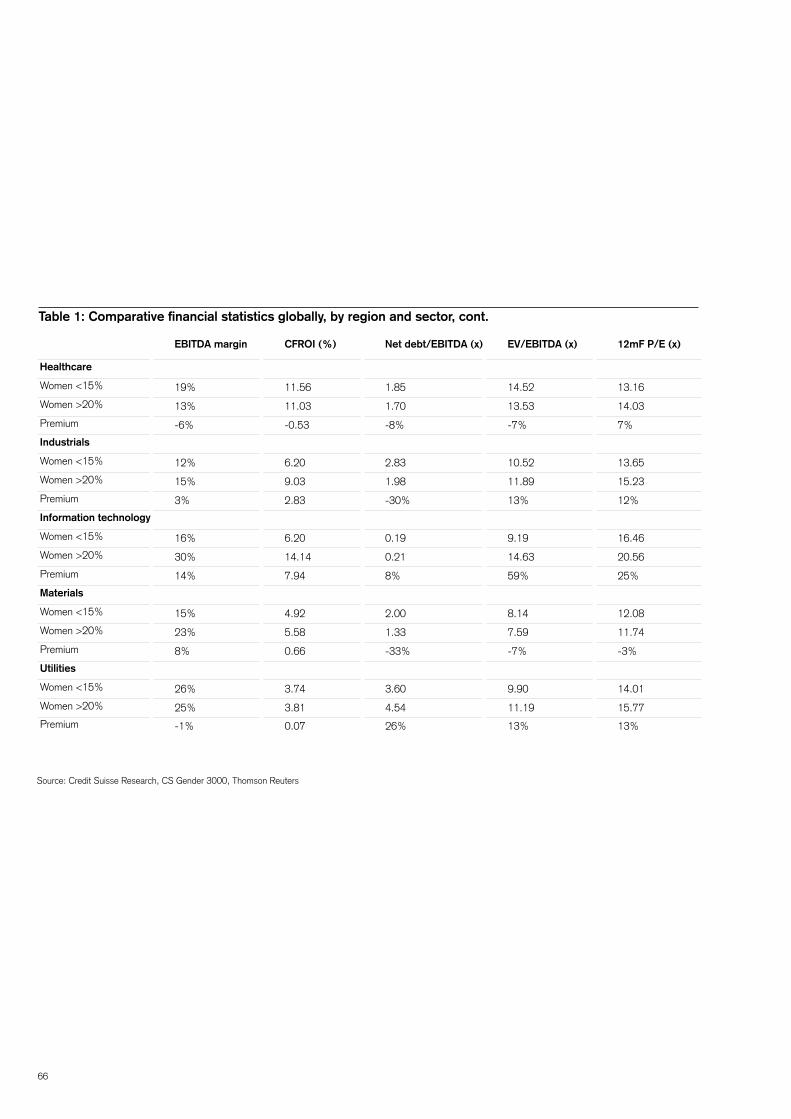
66
EBITDA margin CFROI (%) Net debt/EBITDA (x) EV/EBITDA (x) 12mF P/E (x)
Healthcare
Women <15% 19% 11.56 1.85 14.52 13.16
Women >20% 13% 11.03 1.70 13.53 14.03
Premium -6% -0.53 -8% -7% 7%
Industrials
Women <15% 12% 6.20 2.83 10.52 13.65
Women >20% 15% 9.03 1.98 11.89 15.23
Premium 3% 2.83 -30% 13% 12%
Information technology
Women <15% 16% 6.20 0.19 9.19 16.46
Women >20% 30% 14.14 0.21 14.63 20.56
Premium 14% 7.94 8% 59% 25%
Materials
Women <15% 15% 4.92 2.00 8.14 12.08
Women >20% 23% 5.58 1.33 7.59 11.74
Premium 8% 0.66 -33% -7% -3%
Utilities
Women <15% 26% 3.74 3.60 9.90 14.01
Women >20% 25% 3.81 4.54 11.19 15.77
Premium -1% 0.07 26% 13% 13%
Table 1: Comparative financial statistics globally, by region and sector, cont.
Source: Credit Suisse Research, CS Gender 3000, Thomson Reuters

The CS Gender 3000 in 2019: The changing face of companies 67
68
General disclaimer / important information
This document was produced by Credit Suisse Group AG
and/or its affiliates (“CS”). The opinions expressed in this
document and the referenced articles are those of the
respective authors and not necessarily those of CS. This
document must not be read as independent investment
research. It has been prepared with the greatest of care and
to the best of its knowledge and belief and solely for infor-
mation purposes and for the use of the recipient. It does not
constitute an offer or an invitation by or on behalf of CS to
any person to buy or sell any security or banking service and
does not release the recipient from exercising his/her own
judgement. Nothing in this material constitutes investment,
legal, accounting or tax advice, or a representation that
any investment or strategy is suitable or appropriate to your
individual circumstances, or otherwise constitutes a personal
recommendation to you. The price and value of investments
mentioned and any income that might accrue may fluctuate
and may fall or rise. Any reference to past performance is not
a guide to the future.
The information and analysis contained in this document
have been compiled or arrived at from sources believed to be
reliable but CS does not make any representation as to their
accuracy or completeness and does not accept liability for
any loss arising from the use hereof. A Credit Suisse Group
company may have acted upon the information and analysis
contained in this publication before being made available
to clients of CS. Investments in emerging markets are
speculative and considerably more volatile than investments
in established markets. Some of the main risks are political
risks, economic risks, credit risks, currency risks and market
risks. Investments in foreign currencies are subject to ex-
change rate fluctuations. Any questions about topics raised in
this piece or your investments should be made directly to your
local relationship manager or other advisers. Before entering
into any transaction, you should consider the suitability of the
transaction to your particular circumstances and independent-
ly review (with your professional advisers as necessary) the
specific financial risks as well as legal, regulatory, credit, tax
and accounting consequences. This document may provide
the addresses of, or contain hyperlinks to, websites. Except
to the extent to which the report refers to website material
of CS, CS has not reviewed any such site and takes no
responsibility for the content contained therein. Such address
or hyperlink (including addresses or hyperlinks to CS’s own
website material) is provided solely for your convenience and
information and the content of any such website does not in
any way form part of this document. Accessing such website
or following such link through this report or CS’s website shall
be at your own risk.
This report is issued and distributed in the European Union
(except Germany): by Credit Suisse (UK) Limited and
Credit Suisse Securities (Europe) Limited. Credit Suisse
Securities (Europe) Limited and Credit Suisse (UK) Limited,
both authorized by the Prudential Regulation Authority and
regulated by the Financial Conduct Authority and the Pru-
dential Regulation Authority, are associated but independent
legal entities within Credit Suisse; Germany: Credit Suisse
Securities (Europe) Limited Niederlassung Frankfurt am
Main regulated by the Bundesanstalt fuer Finanzdienstleis-
tungsaufsicht (“BaFin”); United States and Canada: Credit
Suisse Securities (USA) LLC; Switzerland: Credit Suisse
AG authorized and regulated by the Swiss Financial Market
Supervisory Authority (FINMA); Brazil: Banco de Investi-
mentos Credit Suisse (Brasil) S.A or its affiliates; Mexico:
Banco Credit Suisse (México), S.A. (transactions related to
the securities mentioned in this report will only be effected in
compliance with applicable regulation); Japan: by Credit Su-
isse Securities (Japan) Limited, Financial Instruments Firm,
Director-General of Kanto Local Finance Bureau ( Kinsho)
No. 66, a member of Japan Securities Dealers Association,
The Financial Futures Association of Japan, Japan Invest-
ment Advisers Association, Type II Financial Instruments
Firms Association; Hong Kong SAR, China: Credit Suisse
(Hong Kong) Limited; Australia: Credit Suisse Equities
(Australia) Limited; Thailand: Credit Suisse Securities (Thai-
land) Limited, regulated by the Office of the Securities and
Exchange Commission, Thailand, having registered address
at 990 Abdulrahim Place, 27th Floor, Unit 2701, Rama IV
Road, Silom, Bangrak, Bangkok10500, Thailand, Tel. +66
2614 6000; Malaysia: Credit Suisse Securities (Malaysia)
Sdn Bhd, Credit Suisse AG, Singapore Branch; India: Credit
Suisse Securities (India) Private Limited (CIN no.U67120M-
H1996PTC104392) regulated by the Securities and
Exchange Board of India as Research Analyst (registration
no. INH 000001030) and as Stock Broker (registration
no. INB230970637; INF230970637; INB010970631;
INF010970631), having registered address at 9th Floor,
Ceejay House, Dr.A.B. Road, Worli, Mumbai - 18, India, T-
+91-22 6777 3777; South Korea: Credit Suisse Securities
(Europe) Limited, Seoul Branch; Taiwan (Chinese Taipei):
The CS Gender 3000 in 2019: The changing face of companies 69
Credit Suisse AG Taipei Securities Branch; Indonesia: PT
Credit Suisse Securities Indonesia; Philippines: Credit Su-
isse Securities (Philippines) Inc., and elsewhere in the world
by the relevant authorized affiliate of the above.
Additional regional disclaimers Hong Kong SAR, China: Credit Suisse (Hong Kong)
Limited (“CSHK”) is licensed and regulated by the Securities
and Futures Commission of Hong Kong under the laws of
Hong Kong SAR, China, which differ from Australian laws.
CSHKL does not hold an Australian financial services license
(AFSL) and is exempt from the requirement to hold an AFSL
under the Corporations Act 2001 (the Act) under Class
Order 03/1103 published by the ASIC in respect of financial
services provided to Australian wholesale clients (within
the meaning of section 761G of the Act). Research on
Taiwanese securities produced by Credit Suisse AG, Taipei
Securities Branch has been prepared by a registered Senior
Business Person. Malaysia: Research provided to residents
of Malaysia is authorized by the Head of Research for Credit
Suisse Securities (Malaysia) Sdn Bhd, to whom they should
direct any queries on +603 2723 2020. Singapore: This
report has been prepared and issued for distribution in Singa-
pore to institutional investors, accredited investors and expert
investors (each as defined under the Financial Advisers
Regulations) only, and is also distributed by Credit Suisse AG,
Singapore branch to overseas investors (as defined under the
Financial Advisers Regulations). By virtue of your status as
an institutional investor, accredited investor, expert investor or
overseas investor, Credit Suisse AG, Singapore branch is ex-
empted from complying with certain compliance requirements
under the Financial Advisers Act, Chapter 110 of Singapore
(the “FAA”), the Financial Advisers Regulations and the
relevant Notices and Guidelines issued thereunder, in respect
of any financial advisory service which Credit Suisse AG,
Singapore branch may provide to you. UAE: This information
is being distributed by Credit
Suisse AG (DIFC Branch), duly licensed and regulated by the
Dubai Financial Services Authority (“DFSA”). Related financial
services or products are only made available to Professional
Clients or Market Counterparties, as defined by the DFSA,
and are not intended for any other persons. Credit Suisse AG
(DIFC Branch) is located on Level 9 East, The Gate Building,
DIFC, Dubai, United Arab Emirates. UK: The protections
made available by the Financial Conduct Authority and/or the
Prudential Regulation Authority for retail clients do not apply
to investments or services provided by a person outside the
UK, nor will the Financial Services Compensation Scheme
be available if the issuer of the investment fails to meet
its obligations. To the extent communicated in the United
Kingdom (“UK”) or capable of having an effect in the UK, this
document constitutes a financial promotion which has been
approved by Credit Suisse (UK) Limited which is authorized
by the Prudential Regulation Authority and regulated by the
Financial Conduct Authority and the Prudential Regulation
Authority for the conduct of investment business in the
UK. The registered address of Credit Suisse (UK) Limited
is Five Cabot Square, London, E14 4QR. Please note that
the rules under the UK’s Financial Services and Markets Act
2000 relating to the protection of retail clients will not be
applicable to you and that any potential compensation made
available to “eligible claimants” under the UK’s Financial
Services Compensation Scheme will also not be available to
you. Tax treatment depends on the individual circumstanc-
es of each client and may be subject to changes in future.
USA: This material is issued and distributed in the USA by
CSSU, a member of NYSE, FINRA, SIPC and the NFA, and
CSSU accepts responsibility for its contents. Clients should
contact analysts and execute transactions through a Credit
Suisse subsidiary or affiliate in their home jurisdiction unless
governing law permits otherwise. EU: This report has been
produced by subsidiaries and affiliates of Credit Suisse oper-
ating under its Global Markets Division and/or International
Wealth Management Division.
This document may not be reproduced either in whole, or in
part, without the written permission of the authors and Credit
Suisse. It is expressly not intended for persons who, due
to their nationality or place of residence, are not permitted
access to such information under local law.
© 2019 Credit Suisse Group AG and/or its affiliates. All
rights reserved.

70
Also published by the Research Institute
The Future of GDP
May 2018
The Future of Politics
Davos edition
January 2018
Eradicating Extreme Poverty
Davos edition
January 2018
The Swiss Family Business Model
September 2017
The CS Family 1000 in 2018
September 2018
Switzerland: A Financial Market History
June 2017
The CS Gender 3000 in 2019: The changing face of companies 71
AI & The Future of Work
Davos edition
January 2019
Summary Edition
Global Investment Returns Yearbook 2019
February 2019
Assessing Global Debt
Davos edition
January 2019
Emerging Consumer Survey
March 2019
Global Wealth Report
October 2018
Healthcare transformation
June 2019


![Remote Control Manual Curve Tracer CS-3000 Series1].pdf · Remote Control Manual Curve Tracer CS-3000 Series . i Introduction Thank you for purchasing this Iwatsu’s instrument](https://img.pdfslide.us/doc/110x75/60633b3ad981ce04802d3c1f/remote-control-manual-curve-tracer-cs-3000-1pdf-remote-control-manual-curve.jpg)