Embed Size (px)
Citation preview
October 2018: PAYstats Pay and Labour Market StatisticsQuarterly Edition
Paydata Business InsightNational Statistics
Our quarterly round-up brings together trends and opinions on what is happening and what the future holds for:
• Inflation
• Employment
• Earnings
• Pay Settlements• Historic • Predictive
• PAYstats – pay and labour market statistics
October 2018: PAYstats Pay and Labour Market Statistics
• The Consumer Prices Index (CPI) 12-month rate was 2.4% in September 2018, down from 2.7% in August 2018.
• Labour demand growth has remained robust and the labour market is currently tight. The labour market is expected to tighten further in the near term.
• Pay growth has risen over the past year and tightness in the labour market is expected to push up pay growth slightly further in coming years.
• Latest estimates show that average weekly earnings increased by 3.1% excluding bonuses, and by 2.7% including bonuses, compared with a year earlier.
AIMS KEY FINDINGS
If you would like to find our more about any of the information contained in this PAYstats bulletin please contact us via:
+44 (0)1733 391 377 [email protected]
October 2018: PAYstats Pay and Labour Market Statistics 2
BANK OF ENGLAND INFLATION REPORT (AUGUST 2018)CPI inflation and activity have evolved broadly in line with the MPC’s expectations at the time of the May Report. Inflation was 2.4% in June, above the target due to sterling’s past depreciation and higher energy prices. Those external cost pressures are projected to dissipate over the forecast period, though at a slightly slower rate than projected in May following the further fall in the sterling exchange rate over the past three months. GDP growth appears to have recovered in Q2.
UK demand is expected to continue to grow at a modest pace which, given subdued potential supply growth, is likely to be more than sufficient to use up the very limited degree of slack remaining in the economy. Conditioned on a path for Bank Rate that rises to 1.1% over the next three years, a small margin of excess demand is likely to emerge by late 2019 and to build thereafter, raising domestic inflationary pressures. Taken together with diminishing external pressures, CPI inflation is projected to decline towards the target, reaching 2% in the third year of the forecast period.
BANK OF ENGLAND MPC MINUTES (SEPTEMBER 2018) In July, twelve-month CPI inflation had risen slightly to 2.5%. That was 0.1 percentage points lower than projected in the August Inflation Report, however, continuing a series of small downside errors since the beginning of 2018. Although some of the forecast error in July had been accounted for by lower than expected clothing and footwear prices, which were judged to reflect erratic seasonal discounting, other parts of the downside news were expected to persist over coming months.
OFFICE FOR NATIONAL STATISTICS (SEPTEMBER 2018) The Consumer Prices Index including owner occupiers’ housing costs (CPIH) 12-month inflation rate was 2.2% in September 2018, down from 2.4% in August 2018.
The largest downward contribution came from food and non-alcoholic beverages where prices fell between August and September 2018 but rose between the same two months a year ago.
Other large downward contributions came from transport, recreation and culture, and clothing. Partially offsetting upward contributions came from increases to electricity and gas prices.
The Consumer Prices Index (CPI) 12-month rate was 2.4% in September 2018, down from 2.7% in August 2018.
Inflation
CPI inflation is projected to decline towards the target, reaching 2% in the third year of the forecast period.”BANK OF ENGLAND INFLATION REPORTAugust 2018
October 2018: PAYstats Pay and Labour Market Statistics 3
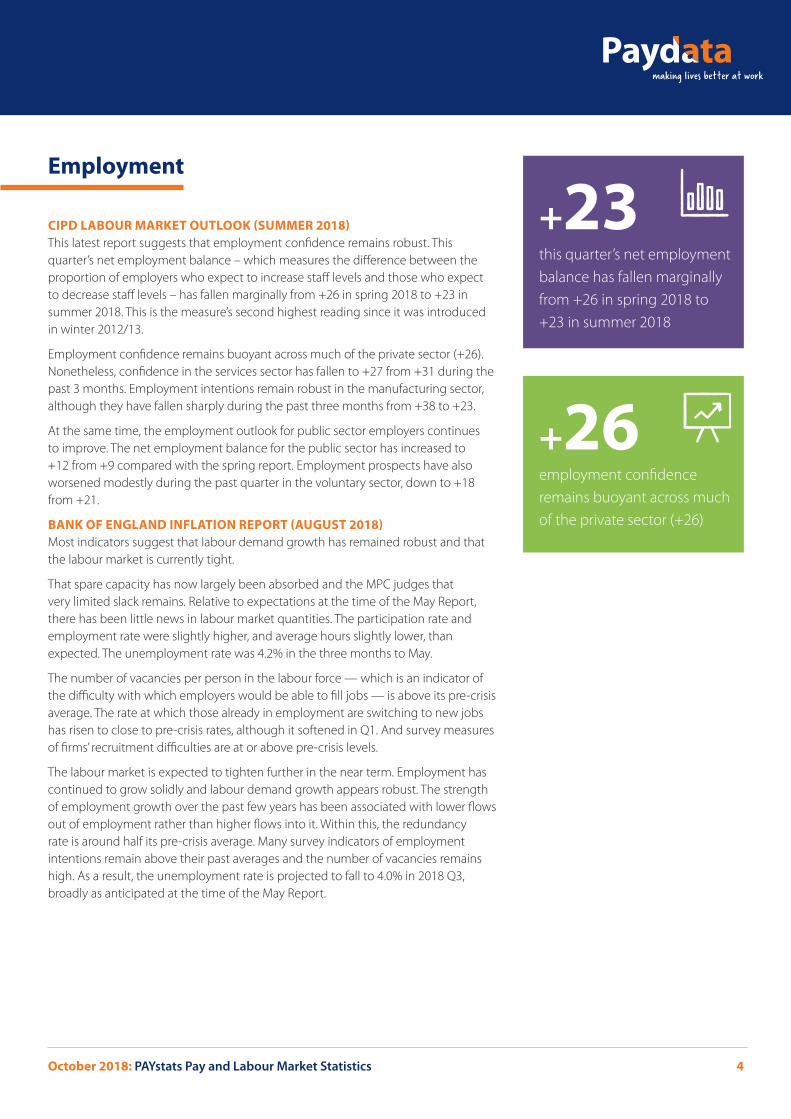
CIPD LABOUR MARKET OUTLOOK (SUMMER 2018)This latest report suggests that employment confidence remains robust. This quarter’s net employment balance – which measures the difference between the proportion of employers who expect to increase staff levels and those who expect to decrease staff levels – has fallen marginally from +26 in spring 2018 to +23 in summer 2018. This is the measure’s second highest reading since it was introduced in winter 2012/13.
Employment confidence remains buoyant across much of the private sector (+26). Nonetheless, confidence in the services sector has fallen to +27 from +31 during the past 3 months. Employment intentions remain robust in the manufacturing sector, although they have fallen sharply during the past three months from +38 to +23.
At the same time, the employment outlook for public sector employers continues to improve. The net employment balance for the public sector has increased to +12 from +9 compared with the spring report. Employment prospects have also worsened modestly during the past quarter in the voluntary sector, down to +18 from +21.
BANK OF ENGLAND INFLATION REPORT (AUGUST 2018)Most indicators suggest that labour demand growth has remained robust and that the labour market is currently tight.
That spare capacity has now largely been absorbed and the MPC judges that very limited slack remains. Relative to expectations at the time of the May Report, there has been little news in labour market quantities. The participation rate and employment rate were slightly higher, and average hours slightly lower, than expected. The unemployment rate was 4.2% in the three months to May.
The number of vacancies per person in the labour force — which is an indicator of the difficulty with which employers would be able to fill jobs — is above its pre-crisis average. The rate at which those already in employment are switching to new jobs has risen to close to pre-crisis rates, although it softened in Q1. And survey measures of firms’ recruitment difficulties are at or above pre-crisis levels.
The labour market is expected to tighten further in the near term. Employment has continued to grow solidly and labour demand growth appears robust. The strength of employment growth over the past few years has been associated with lower flows out of employment rather than higher flows into it. Within this, the redundancy rate is around half its pre-crisis average. Many survey indicators of employment intentions remain above their past averages and the number of vacancies remains high. As a result, the unemployment rate is projected to fall to 4.0% in 2018 Q3, broadly as anticipated at the time of the May Report.
Employment
+23
this quarter’s net employment balance has fallen marginally from +26 in spring 2018 to +23 in summer 2018
+26
employment confidence remains buoyant across much of the private sector (+26)
October 2018: PAYstats Pay and Labour Market Statistics 4
BANK OF ENGLAND MPC MINUTES (SEPTEMBER 2018) The labour market had remained tight and pay growth had risen. Surveys had indicated that recruitment difficulties were widespread across the economy. The unemployment rate had fallen to 4.0% in the three months to July, in line with the August Report forecast. Job-to-job flows had picked up in Q2 after falling slightly in Q1, leaving them close to their pre-crisis average and well above levels seen in recent years. Claimant count data, adjusted for the effects of Universal Credit, had pointed to a further decline in unemployment in the near term. Consistent with that, the vacancy rate had risen again and expectations of hiring from surveys had continued to point to solid labour demand.
MANPOWER EMPLOYMENT OUTLOOK SURVEY (Q4 2018)UK employers report limited hiring intentions for the final quarter of 2018. With 7% of employers expecting to increase staffing levels, 3% anticipating a decrease and 89% forecasting no change, the resulting Net Employment Outlook is +4%. [...] Hiring intentions are unchanged when compared with the previous quarter, and remain relatively stable in comparison with this time one year ago.
Employers in 10 of the 12 regions forecast an increase in staffing levels during the next three months. The strongest labour markets are anticipated in [...] the East Midlands and Yorkshire & the Humber. Employers report cautiously optimistic hiring plans in the North West and the South West [...], the South East and the West Midlands. However, payrolls are forecast to decline in Wales and Northern Ireland [...].
In comparison with this time one year ago, employers report stronger hiring plans in six of the 12 regions, most notably with increases [...] in the East Midlands and Yorkshire & the Humber. However, Outlooks decline in five regions. Decreases [...] are reported in Northern Ireland, Wales and the East.
IHS MARKIT / REC REPORT ON JOBS (OCTOBER 2018 PRESS RELEASE)Permanent staff appointments continued to rise at the end of the third quarter, albeit at a softer pace. Nonetheless, growth remained sharp in the context of historical data. In contrast, temp billings expanded at a slightly quicker pace compared to August.
Recruitment consultants reported continued difficulties regarding the availability of staff for both permanent and temporary roles. September data pointed to a further rise in job vacancies for both permanent and temporary roles. The rate of growth in staff demand was sharp overall, albeit the weakest seen for nearly two years.
[The Recruitment & Employment Confederation] chief executive Neil Carberry says:
“UK businesses are resilient, but they’re struggling to find the people they need to drive growth and opportunity. Recruiters’ specialist skills help to address this, but with Brexit looming a comprehensive mobility deal with the EU will be needed to underpin prosperity. Higher skills investment, driven by a reformed apprenticeship levy, will also be essential.
“An effective approach to post-Brexit immigration must acknowledge that there is unmet need for roles of all sorts - not just those filled by the very highest earners. Keeping deliveries going, patients being treated and goods on the shelves means an open approach to workers from elsewhere. Businesses understand the need for control - but this is not in conflict with openness to those who come to contribute.”
UK businesses are resilient, but they’re struggling to find the people they need to drive growth and opportunity.”NEIL CARBERRY Chief ExecutiveThe Recruitment & Employment Confederation
October 2018: PAYstats Pay and Labour Market Statistics 5
BANK OF ENGLAND INFLATION REPORT (AUGUST 2018)Pay growth has risen over the past year and tightness in the labour market is expected to push up pay growth slightly further in coming years.
A tightening labour market and lower unemployment is typically associated with higher pay growth as it becomes more difficult for firms to recruit and retain staff. Whole-economy regular average weekly earnings growth — which excludes bonuses — rose to 2.7% in the three months to May from 2.0% a year earlier, broadly as anticipated. Wage growth remains subdued relative to its past average, though much of that weakness is likely to reflect lower productivity growth than in the past.
Annual growth in average wages excluding bonuses of 2.7% in the three months to May 2018 was higher than in 2016, when growth was around 2.5%, and higher still than the average of around 1.75% a year during 2010–15. It is projected to remain around 2.75% in the second half of the year, broadly unchanged since the May Report.
BANK OF ENGLAND MPC MINUTES (SEPTEMBER 2018) Annual growth in whole economy average weekly earnings, excluding the volatile bonus component, had been 2.9% in the three months to July. That was a little stronger than had been expected in the August Report. In the private sector, earnings excluding bonuses had grown by 3.0% in the three months to July, which was also slightly higher than expected. The growth rates of measures that included bonuses, which tended to be more volatile, had been somewhat lower, at just over 2.5%. According to the Bank’s settlements database, the distribution of private sector pay settlements so far in 2018 had continued to shift up relative to 2017. The REC pay indices had remained well above their historical averages, and the Agents’ scores for growth in labour costs had strengthened in recent months.
IHS MARKIT / REC REPORT ON JOBS (OCTOBER 2018 PRESS RELEASE) Starting salaries for people placed into permanent jobs increased at the quickest pace since April 2015 during September. Hourly rates of pay for temp staff also rose at a faster pace than in the preceding month.
ONS AVERAGE WEEKLY EARNINGS (OCTOBER 2018)Latest estimates show that average weekly earnings for employees in Great Britain in nominal terms (that is, not adjusted for price inflation) increased by 3.1% excluding bonuses, and by 2.7% including bonuses, compared with a year earlier.
Latest estimates show that average weekly earnings for employees in Great Britain in real terms (that is, adjusted for price inflation) increased by 0.7% excluding bonuses, and by 0.4% including bonuses, compared with a year earlier.
Earnings
Pay growth has risen over the past year and tightness in the labour market is expected to push up pay growth slightly further in coming years.”BANK OF ENGLAND INFLATION REPORTAugust 2018
October 2018: PAYstats Pay and Labour Market Statistics 6
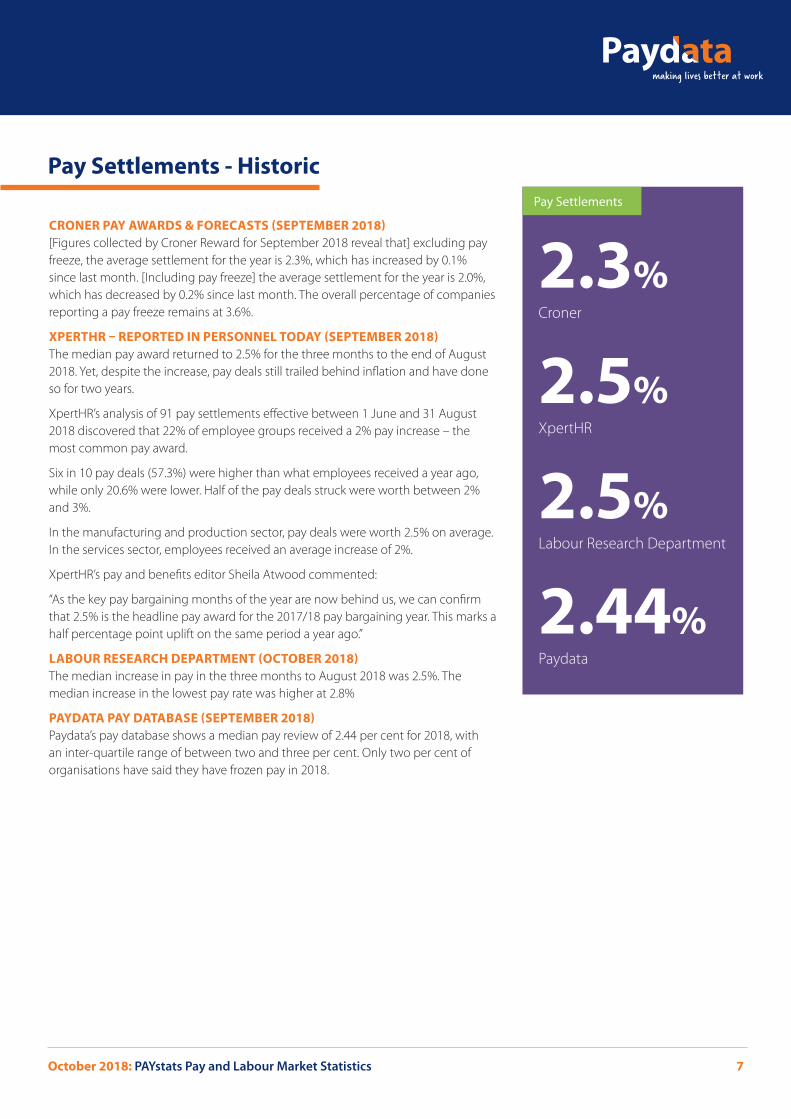
CRONER PAY AWARDS & FORECASTS (SEPTEMBER 2018)[Figures collected by Croner Reward for September 2018 reveal that] excluding pay freeze, the average settlement for the year is 2.3%, which has increased by 0.1% since last month. [Including pay freeze] the average settlement for the year is 2.0%, which has decreased by 0.2% since last month. The overall percentage of companies reporting a pay freeze remains at 3.6%.
XPERTHR – REPORTED IN PERSONNEL TODAY (SEPTEMBER 2018)The median pay award returned to 2.5% for the three months to the end of August 2018. Yet, despite the increase, pay deals still trailed behind inflation and have done so for two years.
XpertHR’s analysis of 91 pay settlements effective between 1 June and 31 August 2018 discovered that 22% of employee groups received a 2% pay increase – the most common pay award.
Six in 10 pay deals (57.3%) were higher than what employees received a year ago, while only 20.6% were lower. Half of the pay deals struck were worth between 2% and 3%.
In the manufacturing and production sector, pay deals were worth 2.5% on average. In the services sector, employees received an average increase of 2%.
XpertHR’s pay and benefits editor Sheila Atwood commented:
“As the key pay bargaining months of the year are now behind us, we can confirm that 2.5% is the headline pay award for the 2017/18 pay bargaining year. This marks a half percentage point uplift on the same period a year ago.”
LABOUR RESEARCH DEPARTMENT (OCTOBER 2018)The median increase in pay in the three months to August 2018 was 2.5%. The median increase in the lowest pay rate was higher at 2.8%
PAYDATA PAY DATABASE (SEPTEMBER 2018)Paydata’s pay database shows a median pay review of 2.44 per cent for 2018, with an inter-quartile range of between two and three per cent. Only two per cent of organisations have said they have frozen pay in 2018.
Pay Settlements - Historic
2.3%
Croner
2.5%
XpertHR
2.5%
Labour Research Department
2.44%
Paydata
Pay Settlements
October 2018: PAYstats Pay and Labour Market Statistics 7
CIPD LABOUR MARKET OUTLOOK (SUMMER 2018)Median basic pay rise expectations in the 12 months to June 2019 are 2%, which is unchanged since the previous report. Meanwhile, mean basic pay rise expectations have ticked up to 2.2% from 2.1%. On the upside, just over half of employers that are currently facing recruitment difficulties report that they are raising starting salaries in response, for at least some roles. Meanwhile, retention pressures are forcing some organisations to raise wages, although many of these are restricted to key staff.
[However] taking all the evidence together, a reduction in labour supply, weak productivity and uncertainty over Brexit all point to sluggish wage growth and continued recruitment difficulties in the year ahead.
CRONER PAY AWARDS & FORECASTS (SEPTEMBER 2018)[Figures collected by Croner Reward for September 2018 reveal that] excluding pay freeze, the average forecast for the next quarter is 2.0%, which has increased by 0.1% since last month. [The] average forecast for the next 12 months is 2.1%, which is the same as last month.
PAYDATA UK REWARD MANAGEMENT SURVEY (AUTUMN 2018)Every year we capture participants’ expectations for future pay review budgets. The survey is still open at the time of writing but preliminary analysis suggests that pay review levels for 2018 and 2019 are expected to be very similar.
In keeping with the positive outlook for business, the most common pay budget for 2018 was up to three per cent based on the data from respondents so far. Initial results show respondents anticipate that they will maintain this level of pay increase for 2019. Our survey explores the key drivers behind this, which potentially includes targeting high performing people, external relativities and core roles. The picture of pay reviews is also being scrutinised throughout the year, with a rise in out of cycle pay increases. Out of cycle pay reviews vary from none being granted to as high as six per cent.
If you would like to take part in the current running of the UK Reward Management Survey, and receive a copy of the participant report, please click here.
Pay Settlements - Predictive
In keeping with the positive outlook for business, the most common pay budget for 2018 was up to three per cent based on the data from respondents so far. Initial results show respondents anticipate that they will maintain this level of pay increase for 2019.”PAYDATA UK REWARD MANAGEMENT SURVEY Autumn 2018
October 2018: PAYstats Pay and Labour Market Statistics 8
Notes: ^ Consumer Prices Index including owner occupiers’ housing costs (CPIH) was re-designated as a National Statistic on 31 July 2017. ^^ RPI has lost its designation as a National Statistic but is still used for some indexing purposes. ONS has ceased publication of RPIJ as of March 2017.
Data source: Adapted from data from the Office for National Statistics licensed under the Open Government Licence v.1.0. Please note the specific definitions for the measures above vary.
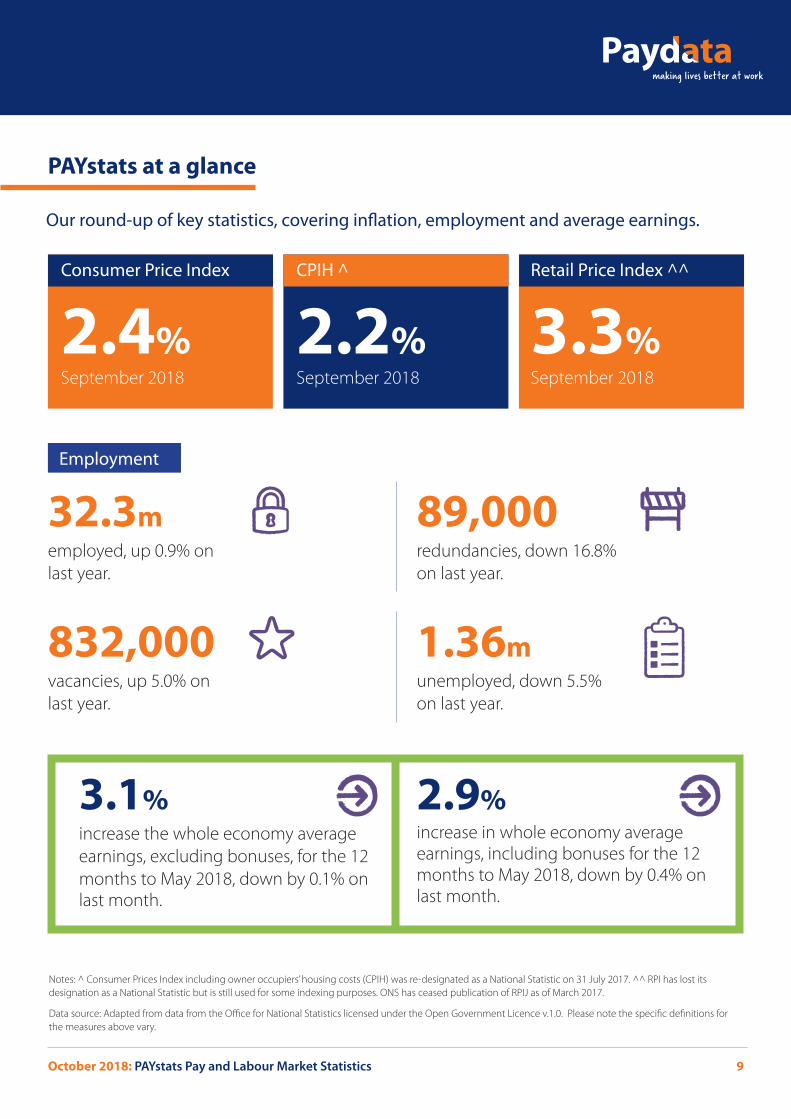
PAYstats at a glance
Our round-up of key statistics, covering inflation, employment and average earnings.
2.4%
September 2018
Consumer Price Index
3.1% increase the whole economy average earnings, excluding bonuses, for the 12 months to May 2018, down by 0.1% on last month.
2.9%
increase in whole economy average earnings, including bonuses for the 12 months to May 2018, down by 0.4% on last month.
32.3m
employed, up 0.9% on last year.
89,000
redundancies, down 16.8% on last year.
Employment
2.2%
September 2018
CPIH ^
3.3%
September 2018
Retail Price Index ^^
832,000vacancies, up 5.0% on last year.
1.36m
unemployed, down 5.5% on last year.
October 2018: PAYstats Pay and Labour Market Statistics 9
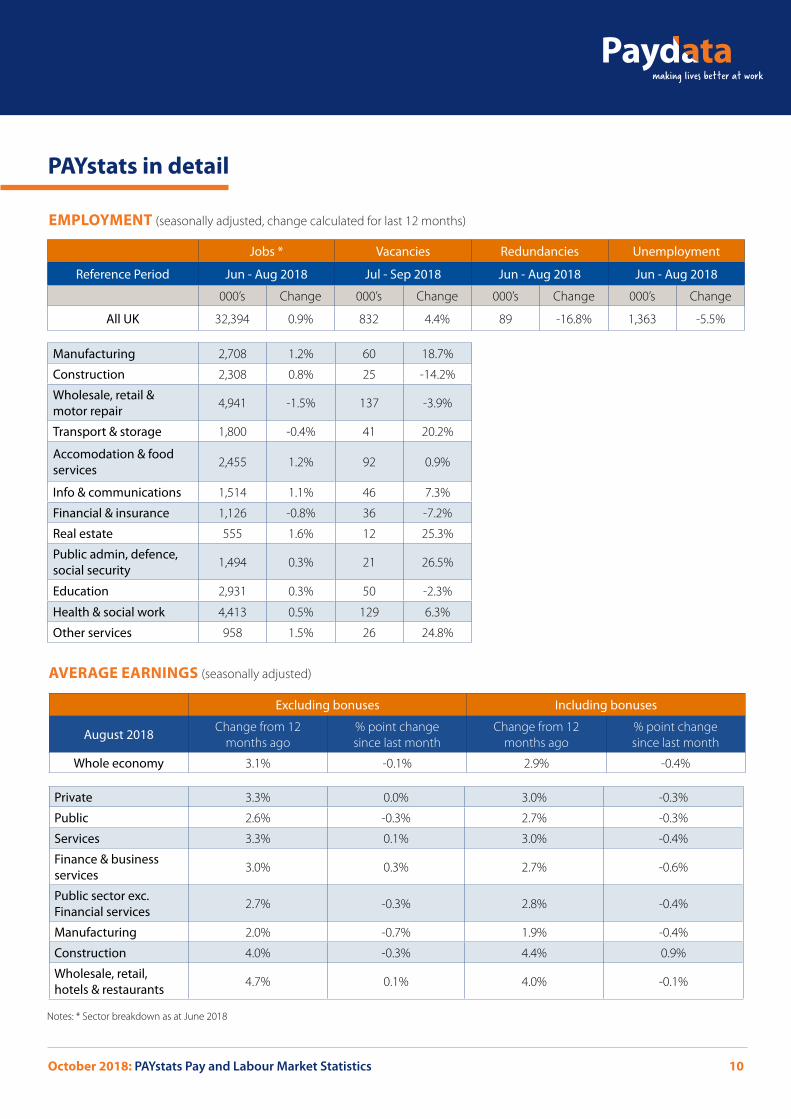
PAYstats in detail
Jobs * Vacancies Redundancies Unemployment
Reference Period Jun - Aug 2018 Jul - Sep 2018 Jun - Aug 2018 Jun - Aug 2018
000’s Change 000’s Change 000’s Change 000’s Change
All UK 32,394 0.9% 832 4.4% 89 -16.8% 1,363 -5.5%
Manufacturing 2,708 1.2% 60 18.7%
Construction 2,308 0.8% 25 -14.2%
Wholesale, retail & motor repair 4,941 -1.5% 137 -3.9%
Transport & storage 1,800 -0.4% 41 20.2%
Accomodation & food services 2,455 1.2% 92 0.9%
Info & communications 1,514 1.1% 46 7.3%
Financial & insurance 1,126 -0.8% 36 -7.2%
Real estate 555 1.6% 12 25.3%
Public admin, defence, social security 1,494 0.3% 21 26.5%
Education 2,931 0.3% 50 -2.3%
Health & social work 4,413 0.5% 129 6.3%
Other services 958 1.5% 26 24.8%
Excluding bonuses Including bonuses
August 2018 Change from 12 months ago
% point change since last month
Change from 12 months ago
% point change since last month
Whole economy 3.1% -0.1% 2.9% -0.4%
Private 3.3% 0.0% 3.0% -0.3%
Public 2.6% -0.3% 2.7% -0.3%
Services 3.3% 0.1% 3.0% -0.4%
Finance & business services 3.0% 0.3% 2.7% -0.6%
Public sector exc. Financial services 2.7% -0.3% 2.8% -0.4%
Manufacturing 2.0% -0.7% 1.9% -0.4%
Construction 4.0% -0.3% 4.4% 0.9%
Wholesale, retail, hotels & restaurants 4.7% 0.1% 4.0% -0.1%
Notes: * Sector breakdown as at June 2018
EMPLOYMENT (seasonally adjusted, change calculated for last 12 months)
AVERAGE EARNINGS (seasonally adjusted)
October 2018: PAYstats Pay and Labour Market Statistics 10
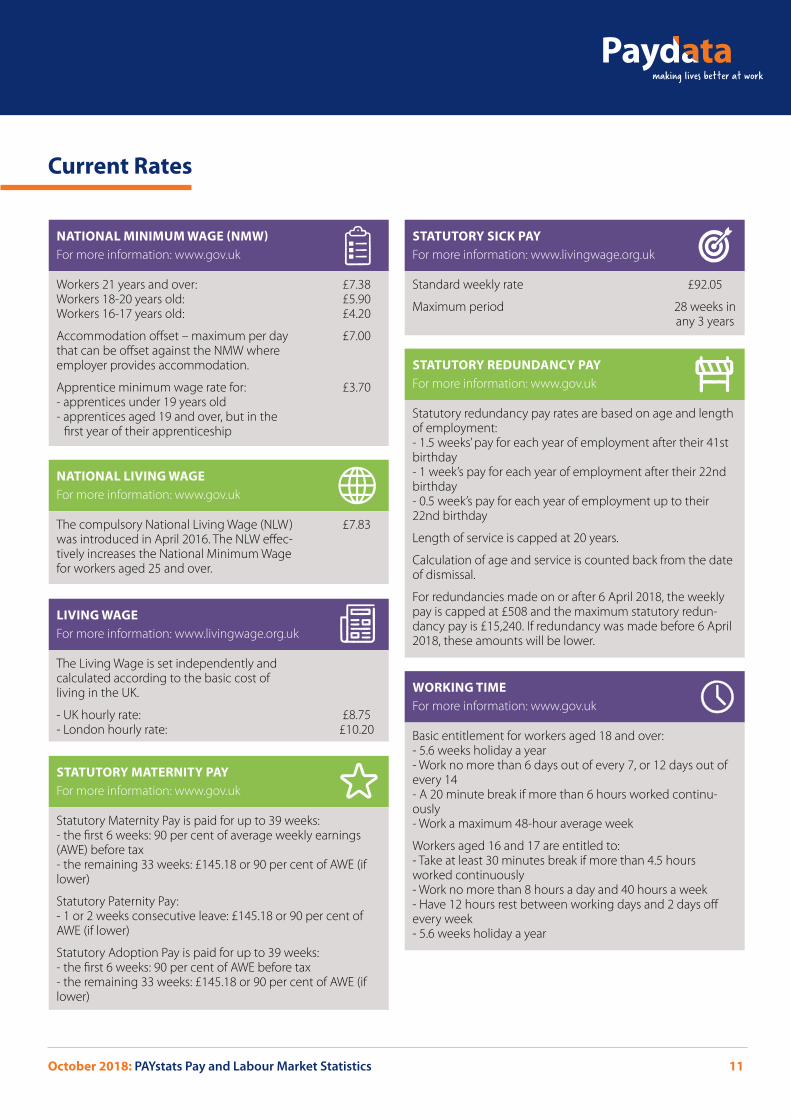
Current Rates
October 2018: PAYstats Pay and Labour Market Statistics 11
Workers 21 years and over:Workers 18-20 years old:Workers 16-17 years old:
Accommodation offset – maximum per day that can be offset against the NMW where employer provides accommodation.
Apprentice minimum wage rate for:- apprentices under 19 years old- apprentices aged 19 and over, but in the
first year of their apprenticeship
NATIONAL MINIMUM WAGE (NMW)For more information: www.gov.uk
£7.38£5.90£4.20
£7.00
£3.70
The compulsory National Living Wage (NLW) was introduced in April 2016. The NLW effec-tively increases the National Minimum Wage for workers aged 25 and over.
NATIONAL LIVING WAGEFor more information: www.gov.uk
£7.83
The Living Wage is set independently and calculated according to the basic cost of living in the UK.
- UK hourly rate:- London hourly rate:
LIVING WAGEFor more information: www.livingwage.org.uk
£8.75£10.20
Statutory Maternity Pay is paid for up to 39 weeks:- the first 6 weeks: 90 per cent of average weekly earnings (AWE) before tax - the remaining 33 weeks: £145.18 or 90 per cent of AWE (if lower)
Statutory Paternity Pay:- 1 or 2 weeks consecutive leave: £145.18 or 90 per cent of AWE (if lower)
Statutory Adoption Pay is paid for up to 39 weeks:- the first 6 weeks: 90 per cent of AWE before tax- the remaining 33 weeks: £145.18 or 90 per cent of AWE (if lower)
STATUTORY MATERNITY PAYFor more information: www.gov.uk
Standard weekly rate
Maximum period
STATUTORY SICK PAYFor more information: www.livingwage.org.uk
£92.05
28 weeks in any 3 years
Statutory redundancy pay rates are based on age and length of employment:- 1.5 weeks’ pay for each year of employment after their 41st birthday- 1 week’s pay for each year of employment after their 22nd birthday- 0.5 week’s pay for each year of employment up to their 22nd birthday
Length of service is capped at 20 years.
Calculation of age and service is counted back from the date of dismissal.
For redundancies made on or after 6 April 2018, the weekly pay is capped at £508 and the maximum statutory redun-dancy pay is £15,240. If redundancy was made before 6 April 2018, these amounts will be lower.
STATUTORY REDUNDANCY PAYFor more information: www.gov.uk
Basic entitlement for workers aged 18 and over:- 5.6 weeks holiday a year- Work no more than 6 days out of every 7, or 12 days out of every 14- A 20 minute break if more than 6 hours worked continu-ously- Work a maximum 48-hour average week
Workers aged 16 and 17 are entitled to:- Take at least 30 minutes break if more than 4.5 hours worked continuously- Work no more than 8 hours a day and 40 hours a week- Have 12 hours rest between working days and 2 days off every week- 5.6 weeks holiday a year
WORKING TIMEFor more information: www.gov.uk

What challenges are you currently facing in managing your annual pay review? Customers tell us they can spend more than 500 hours each year managing their pay review. If you are looking to spend less time and resources managing your pay review, you may have considered investing in pay review software to ease the resources required, but have struggled to get senior management buy-in.
Sound familiar?
We are hosting a free webinar, designed to aid you with the tools you require to help overcome the barriers you face, providing you with everything you need to prepare a business case for implementing pay review software in your business.
Streamlining your pay review process
To reserve your place at this free webinar, simply register here. If you require any further information, contact us on +44 (0)1733 391 377 or via [email protected].
SIGN UP FOR OUR FREE WEBINAR
Preparing a Business Case for Implementing Pay Review Software07 November 20182:00 - 3:00pm Covering the following issues, the webinar will arm you with everything you need to prepare your business case:
Background and insights into common challenges faced
Building a business case - quantifying time and resource savings, whilst considering other factors
Implementation challenges
Practical examples of the advantages of using software

Paydata Ltd 24 Commerce RoadLynch WoodPeterboroughCambridgeshire PE2 6LR
+44(0)1733 391 377
www.paydata.co.uk
© Paydata Limited QPS1018