Embed Size (px)
Citation preview
October 2017
3Q 2017 Results Update
Overall financial update
Update on new digital businesses
Contents
2
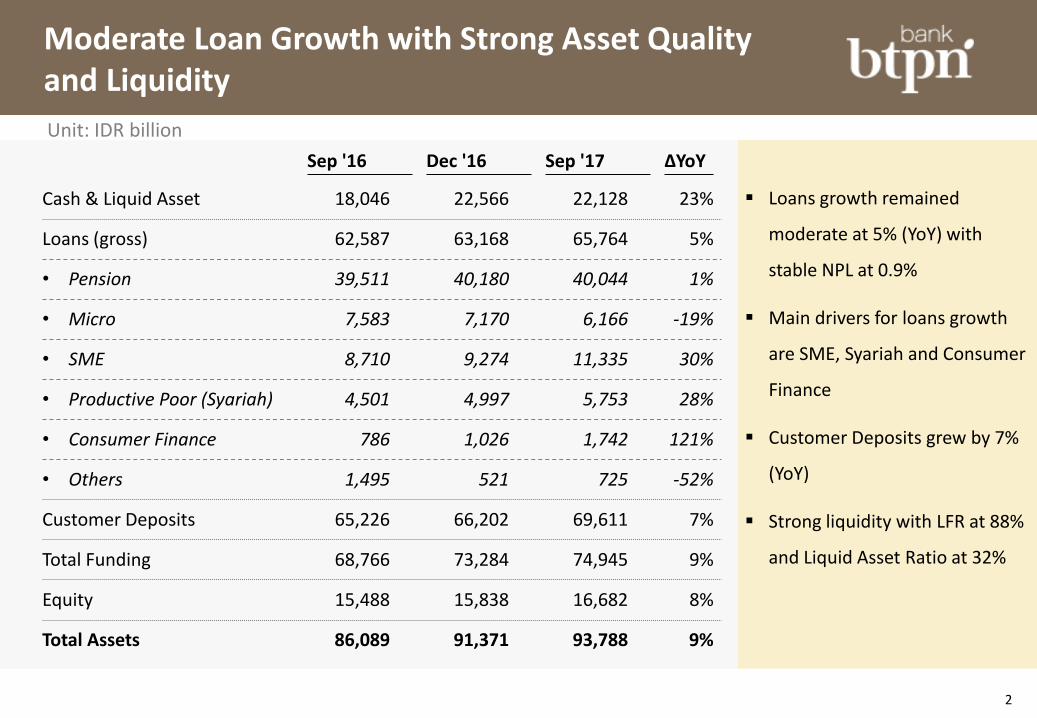
Moderate Loan Growth with Strong Asset Quality and Liquidity
Loans growth remained
moderate at 5% (YoY) with
stable NPL at 0.9%
Main drivers for loans growth
are SME, Syariah and Consumer
Finance
Customer Deposits grew by 7%
(YoY)
Strong liquidity with LFR at 88%
and Liquid Asset Ratio at 32%
Unit: IDR billion
Cash & Liquid Asset
Loans (gross)
• Pension
• Micro
• SME
• Productive Poor (Syariah)
• Consumer Finance
• Others
Customer Deposits
Total Funding
Equity
Total Assets
Sep '16
18,046
62,587
39,511
7,583
8,710
4,501
786
1,495
65,226
68,766
15,488
86,089
Dec '16
22,566
63,168
40,180
7,170
9,274
4,997
1,026
521
66,202
73,284
15,838
91,371
Sep '17
22,128
65,764
40,044
6,166
11,335
5,753
1,742
725
69,611
74,945
16,682
93,788
∆YoY
23%
5%
1%
-19%
30%
28%
121%
-52%
7%
9%
8%
9%

3 1 One time non-recurring restructuring cost (Transformation of Core Businesses)
NPAT Remains Robust Despite New Investment and Restructuring Cost
Operating income
Operating expense
• Business As Usual (incl. MSOP)
• TUR (Productive Poor)
Loan loss provision
NPAT - Core Business
• Jenius & BTPN Wow!
NPAT - Reported
NPAT - BTPN Syariah
• Restructuring costs1
Unit: IDR billion
Net interest income
5,031
2,734
2,037
697
488
1,251
395
935
293
32
1H '17
4,763
2,460
1,351
990
360
255
577
162
432
176
35
3Q '17
2,353
7,491
4,085
3,027
1,057
743
1,828
557
1,367
469
67
9M '17
7,115
6,958
4,000
3,069
931
602
1,661
353
1,399
277
-
9M '16
6,516
9,464
5,373
4,113
1,261
870
2,261
611
1,752
412
-
FY '16
8,854
8%
2%
-1%
14%
23%
10%
58%
-2%
69%
n.a.
9%
∆YoY
Normalized NPAT at IDR 1,828 bio
(10% YoY) while Reported NPAT
(after New Investment &
Restructuring Cost) at IDR 1,367
bio (-2% YoY)
Positive JAW: 8% increase in
Operating Income vs 2% increase
in Operating Expense

4
Key Ratios
Unit: %
9M '16 FY '16 1H '17 3Q '17
NIM 11.9 12.0 11.8 11.5 11.7
Cost to Income 63 63 63 63 63
LDR (end of period) 96 95 96 94 94
Loan to Funding 91 86 85 88 88
Liquid Asset Ratio 28 34 36 32 32
NPL 0.78 0.79 0.89 0.90 0.90
Cost of Credit/Avg. Loan 1.3 1.4 1.5 1.5 1.5
ROA (before tax) 3.2 3.1 3.0 2.8 2.9
ROE 12.7 11.7 11.4 10.4 11.3
ROE - normalized (Core Business) 14.9 15.0 15.4 13.6 14.8
CAR (credit & ops risk) 24.8 25.0 24.0 24.8 24.8
9M '17
NIM remains robust at 11.7%
Ample liquidity as shown by
better liquidity ratios (LDR & Loan
to Funding) supported with high
Liquid Asset Ratio
NPL slightly increased to 0.90%,
but still much below industry
average of 3.05% (Aug ‘17)
Cost of Credit is stable at 1.5%
CAR remains strong at 24.8%
Cost to Income (bank only – BAU) 55 55 54 55 54
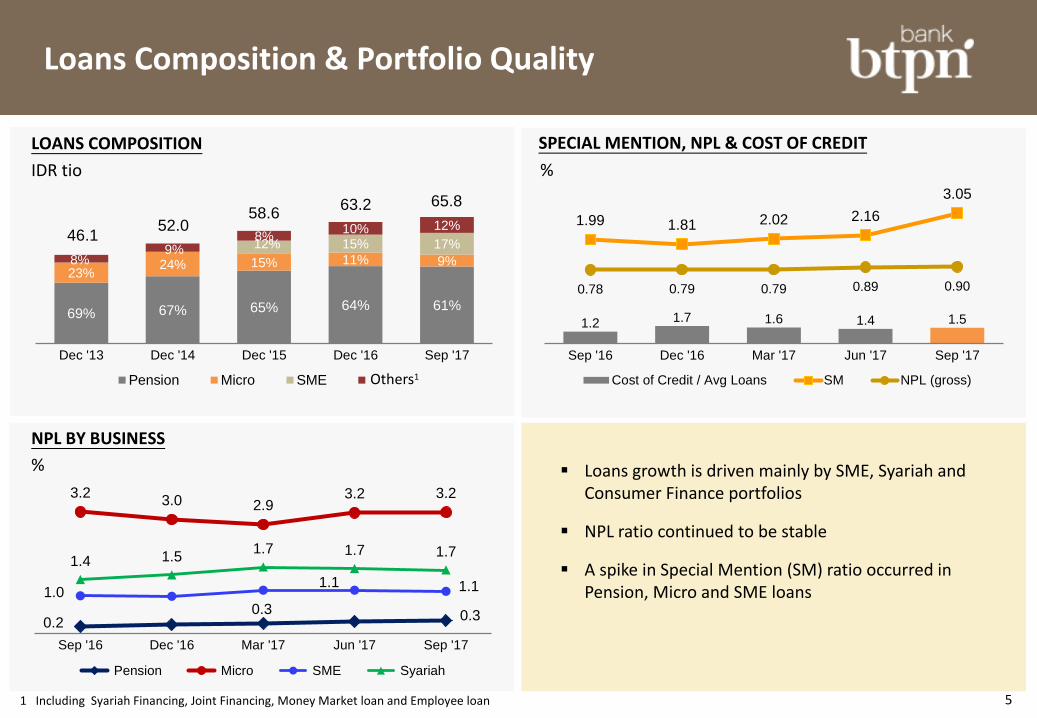
LOANS COMPOSITION
69% 67% 65% 64% 61%
23% 24% 15% 11% 9%
15% 17%
8% 9%
8% 10% 12%
Dec '13 Dec '14 Dec '15 Dec '16 Sep '17
Pension Micro SME Others*
12%
SPECIAL MENTION, NPL & COST OF CREDIT
1.2 1.7 1.6 1.4 1.5
1.99 1.81 2.02 2.16
3.05
0.78 0.79 0.79 0.89 0.90
Sep '16 Dec '16 Mar '17 Jun '17 Sep '17
Cost of Credit / Avg Loans SM NPL (gross)
IDR tio %
46.1 52.0
58.6 63.2 65.8
NPL BY BUSINESS
%
0.2 0.3 0.3
3.2 3.0 2.9
3.2 3.2
1.0 1.1 1.1
1.4 1.5 1.7 1.7 1.7
Sep '16 Dec '16 Mar '17 Jun '17 Sep '17
Pension Micro SME Syariah
Loans growth is driven mainly by SME, Syariah and Consumer Finance portfolios
NPL ratio continued to be stable
A spike in Special Mention (SM) ratio occurred in Pension, Micro and SME loans
Loans Composition & Portfolio Quality
1 Including Syariah Financing, Joint Financing, Money Market loan and Employee loan
Others1
5

FUNDING COMPOSITION CUSTOMER DEPOSIT COMPOSITION
COST OF FUND
Total Funding comprises mainly of Customer Deposits
88% of Customer Deposits is in form of Time Deposits
Cost of Fund remains stable in Q3 ’17 and has decreased by 0.5% on YoY basis
BTPN is issuing new IDR bonds with IDR 1.5 tio in size
95% 90% 93% 88% 93%
5% 10% 7% 12% 7%
Sep '16 Dec '16 Mar '17 Jun '17 Sep '17
Customer Deposits Bonds & Borrowings
IDR tio
68.8 73.3 74.3 78.5 74.9
87% 88% 87% 88% 88%
13% 12% 13% 12% 12%
Sep '16 Dec '16 Mar '17 Jun '17 Sep '17
TD CASA
68.9 69.4 69.6 66.2 65.2
IDR tio
8.4 8.0
6.9 6.5 6.5
6.2 6.0 6.0
Dec'15 Mar'16 Jun'16 Sep'16 Dec'16 Mar'17 Jun'17 Sep'17
-52 bps
%
Funding Composition & Liquidity Reserves
6

BTPN Syariah: 3Q 2017 Financial Results
2,016 2,579 2,691 2,773 2,848
152 175 179 181 182
Dec '15 Dec '16 Mar '17 Jun '17 Sep '17
Customers Centers (Sentra)
IDR billion
Cash & BI 467 474 461 496
SBI & Placement 1,307 1,524 1,419 1,883
Financing (gross) 4,997 5,118 5,770 5,753
Allowance for losses (114) (131) (157) (168)
Deposits & Temporary Syirkah Funds 5,388 5,635 5,959 6,166
Equity 1,593 1,730 1,888 2,066
Total Assets 7,323 7,646 8,096 8,542
Dec '16 Mar '17 Jun '17 Sep '17
7
IDR billion
- Bank's share in profit sharing 1,388 1,929 1,196 663 1,859
- Other operating income 3 5 2 1 3
Operating income 1,391 1,934 1,199 663 1,862
Operating expense 931 1,261 697 360 1,057
Loan loss provision 86 119 109 65 175
NPAT 277 412 293 176 469
9M '16 9M '17FY '16 3Q '171H '17
Cycle 1
34%
Cycle 2
27%
Cycle 3
18%
Cycle 4 & 5 21%
ROA
(before tax)
ROE
(after tax)
Cost to Income
NPF
FDR
CAR
10.7 %
35.6 %
70.0 %
1.7 %
93.0 %
27.3 %
BALANCE SHEET CUSTOMERS, CENTERS, BORROWERS BY CYCLE
IDR billion Thousands
PROFIT & LOSS
IDR billion
Contents
Overall financial update
Update on new digital businesses
Contents

2 new digital businesses have been launched as part of BTPN transformation
BTPN Transformation
New digital businesses
Core businesses transformation
Serves mass market and productive poor with low cost feature-phone based financial services offering
Serves digitally savvy affluent consuming class individuals with a smartphone based digital bank offering
9
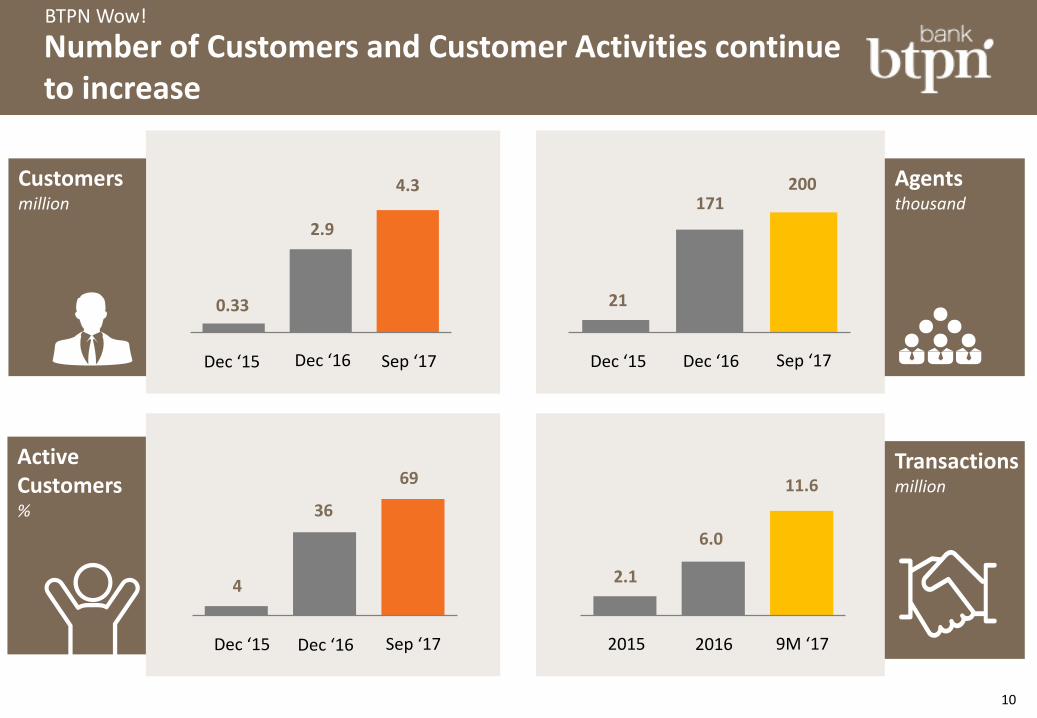
0.33
2.9
4.3
Sep ‘17
21
171 200
Dec ‘16
Customers million
Agents thousand
Dec ‘15 Dec ‘15
10
4
36
69
Sep ‘17
2.1
6.0
11.6
9M ‘17
Active Customers %
Transactions million
Dec ‘15 2015
Number of Customers and Customer Activities continue to increase
BTPN Wow!
Dec ‘16 Sep ‘17
Dec ‘16 2016

11
New Features & Promotion Campaign
BTPN Wow!
Fund transfer service to non- customer cellular phone number through USSD or BTPN Wow! Agent.
Ayo Bayar
Fund transfer between BTPN Wow! accounts initiated by the payee, in turn payer will get SMS notification to transfer the fund.
btpn WOW! new product features btpn WOW! Campaign
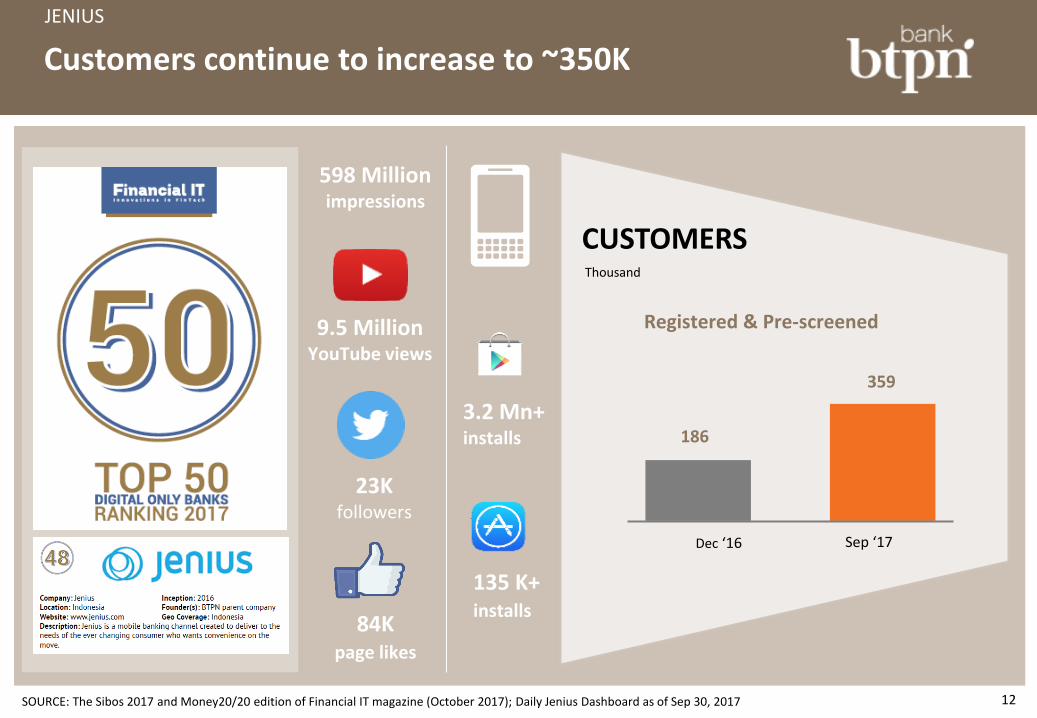
12 SOURCE: The Sibos 2017 and Money20/20 edition of Financial IT magazine (October 2017); Daily Jenius Dashboard as of Sep 30, 2017
84K page likes
9.5 Million YouTube views
23K followers
598 Million impressions
3.2 Mn+ installs
135 K+ installs
CUSTOMERS
186
359
Dec ‘16 Sep ‘17
Thousand
Customers continue to increase to ~350K
Registered & Pre-screened
JENIUS

Continue to offer a growing set of innovative features
JENIUS
13
$Cashtag Send It Pay Me One Touch Dream Saver Card Center
Split bill x-Card Maxi Saver
Lending
TO COME
$Cashtag for e-commerce
NEW
Personal financial management
KYC on Demand Flexi Saver
NEW NEW
TO COME TO COME
Live Chat
NEW
Jenius Pay
NEW

THANK YOU

Appendices

IDR billion
Cash & BI 6,009 6,074 6,756 5,708 -5%
SBI & Placement 12,037 16,493 18,060 16,420 36%
Loans (gross) 62,587 63,168 66,336 65,764 5%
- Pension 39,511 40,180 40,572 40,044 1%
- Micro 7,583 7,170 6,594 6,166 -19%
- SME 8,710 9,274 11,002 11,335 30%
- Productive Poor (Syariah) 4,501 4,997 5,770 5,753 28%
- Consumer Finance 786 1,026 1,707 1,742 121%
- Others 1,495 521 690 725 -52%
Allowance for losses (599) (685) (746) (766) 28%
Customer Deposits 65,226 66,202 69,439 69,611 7%
Borrowings 3,540 7,083 9,027 5,333 51%
Total Funding 68,766 73,284 78,467 74,945 9%
Equity 15,488 15,838 16,233 16,682 8%
Total Assets 86,089 91,371 97,057 93,788 9%
Jun '17 ∆YoYSep '16 Dec '16 Sep '17
i
Balance Sheet – Consolidated
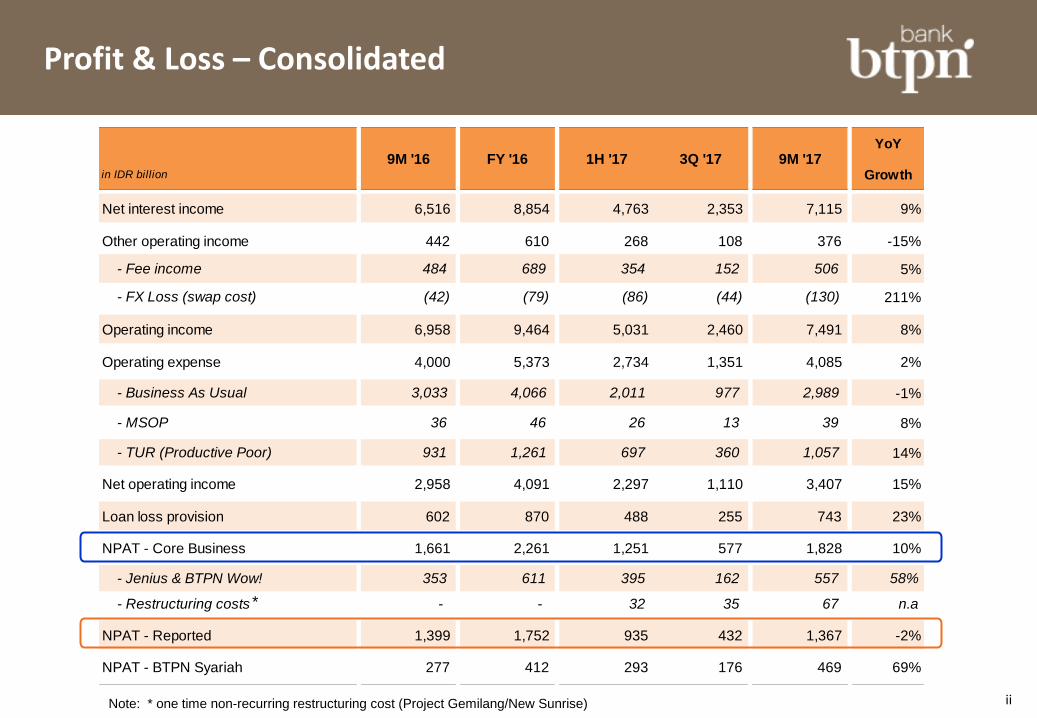
YoY
in IDR billion Growth
Net interest income 6,516 8,854 4,763 2,353 7,115 9%
Other operating income 442 610 268 108 376 -15%
- Fee income 484 689 354 152 506 5%
- FX Loss (swap cost) (42) (79) (86) (44) (130) 211%
Operating income 6,958 9,464 5,031 2,460 7,491 8%
Operating expense 4,000 5,373 2,734 1,351 4,085 2%
- Business As Usual 3,033 4,066 2,011 977 2,989 -1%
- MSOP 36 46 26 13 39 8%
- TUR (Productive Poor) 931 1,261 697 360 1,057 14%
Net operating income 2,958 4,091 2,297 1,110 3,407 15%
Loan loss provision 602 870 488 255 743 23%
NPAT - Core Business 1,661 2,261 1,251 577 1,828 10%
- Jenius & BTPN Wow! 353 611 395 162 557 58%
- Restructuring costs - - 32 35 67 n.a
NPAT - Reported 1,399 1,752 935 432 1,367 -2%
NPAT - BTPN Syariah 277 412 293 176 469 69%
9M '179M '16 FY '16 3Q '171H '17
*
Note: * one time non-recurring restructuring cost (Project Gemilang/New Sunrise) ii
Profit & Loss – Consolidated

%
NIM 11.9 12.0 12.0 11.6 11.5 11.7
Cost to Income 63 63 62 63 63 63
Cost to Income (bank only) 61 63 63 66 66 65
Cost to Income (bank only - BAU) 55 55 52 54 55 54
LDR (end of period) 96 95 94 96 94 94
Loan to Funding 91 86 88 85 88 88
Loan to Funding (incl. Equity) 74 71 72 70 72 72
Liquid Asset Ratio 28 34 32 36 32 32
NPL 0.78 0.79 0.79 0.89 0.90 0.90
Cost of Credit/Avg. Loan 1.3 1.4 1.6 1.4 1.5 1.5
LLP/NPL 123 137 144 127 129 129
ROA (before tax) 3.2 3.1 3.1 2.9 2.8 2.9
ROE 12.7 11.7 12.0 11.4 10.4 11.3
ROE - normalized (Core Business) 14.9 15.0 15.7 15.2 13.6 14.8
CAR (credit & ops risk) 24.8 25.0 23.9 24.0 24.8 24.8
Equity/Assets 18.0 17.3 17.0 16.7 17.8 17.8
1Q '17 2Q '17 9M '17FY '16 3Q '179M '16
iii
Key Ratios – Consolidated

END OF DOCUMENT